
Are AI visibility tools accurate? It is the right thing to ask before you act on one of their scores, and the honest answer is that accuracy is not quite the property they have. An AI search grader gives you a number out of 100 for how visible your brand is inside ChatGPT and its competitors, and the number feels like a measurement. It is not one, in the same way that a traffic estimator is not a measurement. It is the result of a sampling procedure the vendor designed, and once you know how that procedure works you can read the output usefully instead of pasting it into a board pack.
This is not an argument that the tools are worthless. They answer some questions well. It is an argument that the questions they answer are narrower than the reports imply, and that the narrowing happens in a step almost nobody looks at. We use tools in this category and we are not selling one, which is roughly the position this article is written from. Our SEO audit page covers the conventional side of measurement.
What an AI search grader actually is
Strip away the interface and every tool in this category does the same four things. It decides on a set of questions to ask. It sends those questions to one or more language models. It reads the answers and looks for your brand. Then it turns what it found into a score.
That is the whole mechanism, and it is worth holding onto because the marketing language around these products tends to suggest something more like observation. Nothing here is watching what real people ask. There is no panel and no clickstream. The tool is asking questions on your behalf and reporting what came back.
Several are free, which tells you something about their role in the market. HubSpot’s is described on its own page as “a free, one-time check”, with continuous monitoring sold as a separate product. Gushwork’s page says its tool “analyzes your brand’s performance on AI-powered search engines”, and its own progress captions count the stages of a run in seconds rather than in days. A check that finishes while you wait is not a measurement program, it is a sample, and the vendors are reasonably clear about that if you read the page rather than the score.
So the useful question is not whether these tools are accurate in the abstract. It is what each of the four steps does to the number, and step one does the most.
It is worth noticing how new all of this is, because the confidence in the reporting does not match it. The category exists because assistants started answering questions that used to produce a list of links, and the measurement was improvised afterward by companies who mostly sell something else. That is not a criticism of their competence. It is a reason to treat any convention in this space, including the habit of scoring out of 100, as a choice somebody made recently rather than as a settled standard that has been tested against outcomes.
Where the prompts come from, and why that decides your score
This is the finding that matters most and it is stated plainly in the vendors’ own documentation. The prompts are not real user questions. The tool writes them.
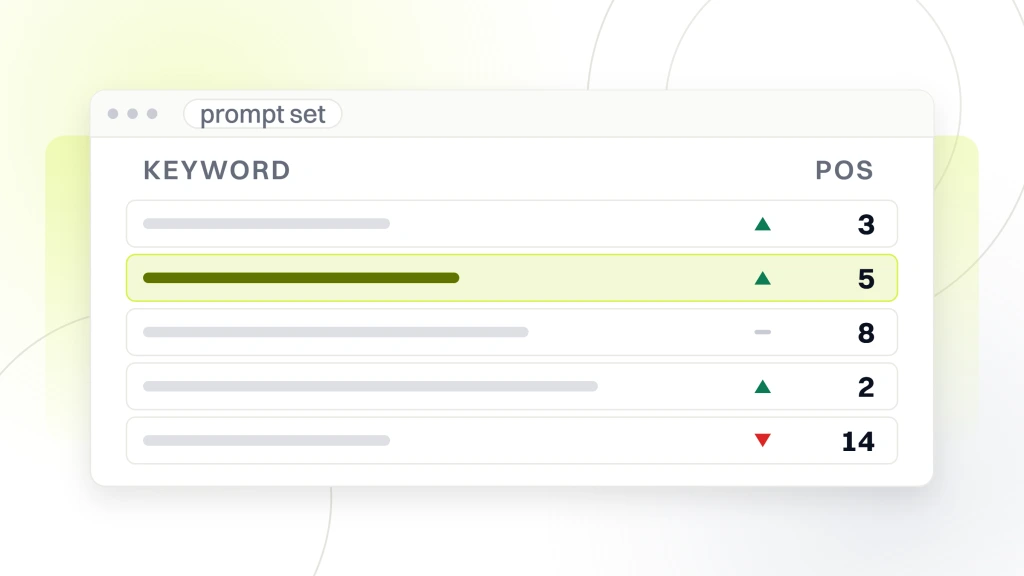
Mangools explains its process without hedging. “Simply enter your brand name or a competitor’s brand, along with a brief description of your niche or product category. Our free tool then generates highly relevant prompts tailored to the information you provide” (mangools.com, AI Search Grader, read 16 September 2026). It then says “The tool tests each prompt across seven different AI models”.
Now look at what the headline metric is built from. Mangools defines visibility as “The percentage of prompts where the brand appears in the TOP20 results”. Read those two statements together and the score resolves to something much more specific than it sounds. It is the percentage of questions the tool invented, based on a category description you typed, in which you were mentioned.
Change the description you typed and the prompts change. Change the prompts and the score changes. That is not a flaw the vendors are hiding, it is an unavoidable property of asking questions rather than observing them, but it does mean the number is a function of the sample rather than a fact about the market. Two agencies grading the same brand on the same day can produce different scores and both be running the tool correctly.
Training data or live answers, which is a different question
The second thing that varies between these tools is what they are actually querying, and it changes what the result means more than the score design does.
HubSpot is explicit about its side of this. Its page says the tool “reveals what ChatGPT, Perplexity, and Gemini say about you based on their training data”. That phrase is doing a lot of work. Training data is a snapshot from a point in the past. A brand that launched recently, rebranded, or published everything it has in the last few months may be close to invisible in it while being perfectly findable in a live answer that retrieves from the web.
The distinction matters because the two things fail in opposite directions. A model answering from training data is describing how you were. A model answering with retrieval is describing what it just found, which is much closer to a search result and much more responsive to anything you change. A tool that mixes them, or does not say which it did, is reporting two different quantities under one label.
So the first question to ask any tool in this category is which of the two it sampled. If the answer is training data, a bad score is not a reason to rewrite your site this quarter, because nothing you publish now can change a snapshot already taken. If the answer is live retrieval, the score becomes far more actionable and also far more volatile.
Why running the same check twice can give two answers
Anyone who has used these tools more than once has noticed this, and it is usually reported as a bug. It is not. It follows from what a language model is.
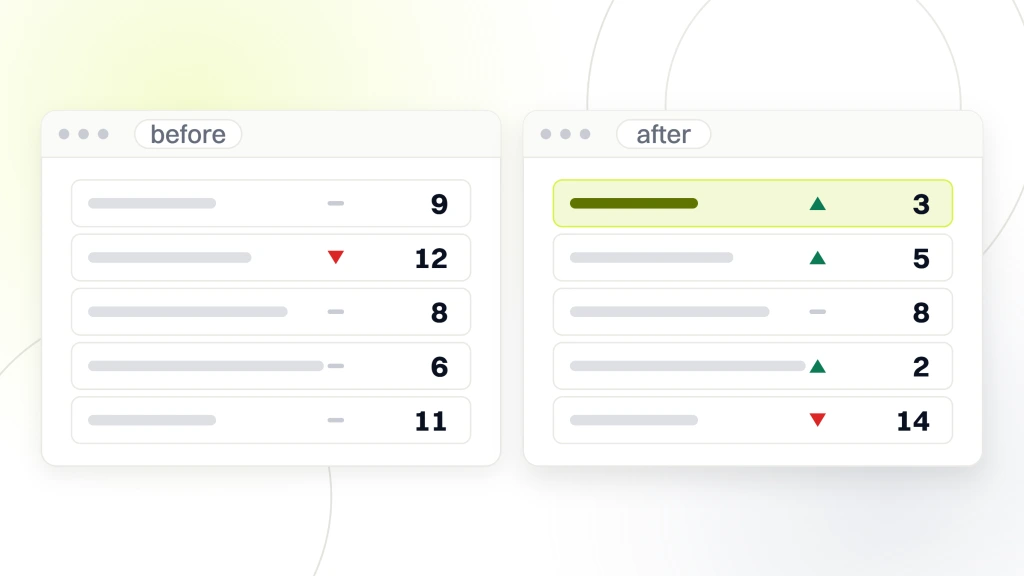
These models do not return a fixed answer to a fixed question the way a database does. The same prompt can produce different wording, different examples and a different list of brands on two runs. Add to that the fact that vendors update models continuously and that any retrieval step is reading a web that changed since yesterday, and run-to-run variation is the expected behavior rather than the exception.
The practical consequence is a rule you can apply immediately. A single reading from one of these tools carries almost no information about a small change. If your score moves from 41 to 46, you have not learned that anything improved. You may simply have sampled a different set of answers to a different set of invented questions.
What does carry information is a large difference, repeated. Being absent from every answer across several runs is a finding. Being present in most of them is a finding. The gap between adjacent numbers is noise wearing a decimal point, and this is the same problem that afflicts every scored tool, which our comparison of website checkers covers on the conventional side.
What the score out of 100 is actually out of
Every one of these tools produces a composite, and composites hide their construction. Two of them publish theirs, which is enough to show how much the design varies.
HubSpot’s page says the tool gives “a detailed AI brand perception analysis across five dimensions”, with each dimension contributing to a total out of 100 and sentiment among them. Mangools builds a different composite, combining visibility and ranking across its models with visibility weighted more heavily. Those are two defensible designs that would return different numbers for the same brand on the same day, because they are measuring different mixtures of different things.
This is the reason a score from one tool cannot be compared with a score from another, and it is worth saying because people do it constantly. A 62 from one product and a 48 from another is not evidence of anything. The two numbers are not denominated in the same unit, and neither vendor claims they are.
Sentiment components deserve particular caution. Judging whether a paragraph about your brand is positive is a harder task than counting whether the brand appeared, and it is being done by the same class of system whose output is being assessed. A visibility count is a relatively crisp thing. A sentiment score is an opinion about an opinion.
The number of models covered varies too, and it quietly changes what the total means. Mangools says it tests each prompt across seven models, while HubSpot’s free check names three. A score averaged over seven systems, some of which almost nobody in your market uses, is a different thing from a score drawn from the two or three your customers actually open. So the question worth asking of any composite is not just how it was weighted but which models it included, and whether that set resembles your audience or simply the set the vendor had access to.
Where are AI visibility tools accurate, and where are they useful
Having spent five sections on the limits, the useful half deserves the same attention, because these tools do answer real questions and the answers are not available any other way.
The first is presence against absence. If you run a reasonable set of category questions and your brand never appears in any answer from any model, that is a real and actionable finding. It does not depend on the exact prompts, the weighting or the sentiment model, because the result is the same whichever way you cut it.
The second is who does appear. The list of competitors an answer engine names when asked about your category is genuinely interesting, particularly when it includes companies you do not consider rivals or omits ones you do. That list is information about how the category is represented, and it is useful regardless of where you sit in it.
The third is what is being said. The written description a model gives of your business is worth reading closely, because it is assembled from what is publicly available about you. If it is wrong in a specific way, that usually points at a real gap in what you have published, and fixing the source is a concrete task rather than an optimization. That is a more useful output than the score, and it is the part most reports bury.
What they cannot tell you, however the report reads
Three things are outside the reach of this entire category, and no amount of improvement to the tools will bring them inside it.
- What real people actually asked. The prompts were invented. Nobody in this category has access to the question logs of the assistants they are querying, so no tool can tell you what your market is really typing.
- How many people saw it. Appearing in an answer to a question the tool wrote says nothing about volume. There is no impression count here, and a percentage of prompts is not a percentage of people.
- Whether any of it produced business. A mention inside a synthesized answer frequently produces no click at all, which means your own analytics may never record that the conversation happened.
That last one is the genuinely hard problem in this area and it is worth being honest that nobody has solved it. The measurement gap is not a tooling failure, it is structural. If the answer is delivered without a visit, the visit is not there to measure.
The partial workarounds are worth knowing precisely because they are partial. Some referrals do arrive with an identifiable source and will show up in your analytics as traffic from an assistant, which gives you a floor rather than a total. Asking new customers how they found you catches some of the rest, with all the unreliability that self-reporting carries. Neither adds up to a measurement, and presenting either as one is how a sensible indicator turns into a number somebody defends in a meeting.
Which is why a grader score should never be presented as a performance metric alongside revenue or sessions. It belongs in the same bracket as an estimated traffic figure, useful for shape and direction and dangerous the moment it is treated as a count. Our piece on website stats checkers works through that distinction in detail on the traffic side, and it is the same distinction here.
How to use one without misleading yourself
A short procedure makes these tools genuinely useful, and it costs nothing beyond attention.
Write down your own prompts before you run anything, and keep the list. If the tool lets you supply them, supply them. If it does not, record the category description you entered, because that description is what generated the questions and it is the only part of the sample you controlled. A run you cannot reproduce is an anecdote.
Run it more than once, on different days, before drawing any conclusion. Three runs will tell you roughly how noisy the measurement is for your brand, which is the number you actually need in order to interpret every future reading. Without it you cannot distinguish movement from variance.
Then record the reading properly. Which tool, which models, which date, which prompts, and whether it queried training data or live retrieval. That is five fields and it is the difference between a number somebody can check next quarter and a number somebody has to take on trust. The same discipline applies to everything else in a document, which our breakdown of an SEO report covers.
Where this sits next to your existing measurement
The temptation is to treat this as a new discipline that replaces the old one. It is better understood as a new and unusually noisy instrument pointed at a question you already had, which is whether people encountering your category encounter you.
Most of what appears to help here is not novel. Being clearly described somewhere a model can read, being mentioned by sources that get cited, and publishing things that answer questions directly are all recognizable as the same work that made you findable before. Our explanation of SEO visibility covers why an index built from that kind of signal behaves the way it does.
Keep the older measurements running, because they are the ones that can be checked. Search Console records what a search engine actually did, and your analytics records what actually happened on your site. A grader score sits beside those as an indicator, not as a replacement, and anyone proposing to swap the checkable numbers for the estimated one has the argument backward.
If you want to compare your position against competitors properly rather than through a composite, that is a benchmarking problem with its own traps, and our guide to benchmarking SEO sets those out. The procedure for the conventional work is in SEO performance step by step.
What we would do first, and what to ask us
Given a brand and an afternoon, we would skip the score entirely on the first pass. Ask three or four models what they say about your business and read the descriptions. Then ask them to recommend providers in your category and write down who gets named. Those two outputs are free, take twenty minutes, and are more useful than any composite.
If the description of your business is wrong, that is the work, and it is usually publishing or correcting something rather than optimizing anything. If you are absent from the recommendation lists entirely, that is a different and larger problem, and it is unlikely to be solved inside a quarter.
What we would not do is buy a monitoring subscription in the first month. Until you know how much your own readings move between runs, a dashboard tracking that number daily will generate a line that looks like performance and is largely variance, and somebody will eventually be asked to explain a dip that never happened. Establish the noise first. The subscription is a reasonable purchase afterward, once you can tell which movements are real.
Now point this at us, because this is a field where agencies sell certainty that does not exist. If anybody offers you guaranteed placement inside an AI answer, ask them what mechanism they are using, because there is no submission process and no advertising slot to buy. If somebody sends you a score, ask which tool, which models, which prompts, and how many runs it is based on. If the answer is one run of a tool’s own prompts, the number is a sample and should be described as one. Ask us the same questions, and hold the answer to the same standard.
The honest summary is that this is early, the instruments are rough, and the work that appears to move it is mostly work you recognize. We do not run AI visibility monitoring and we do not sell a grader, so nothing above is a pitch for one. The prompts-and-descriptions method costs nothing and needs nobody. If you want the conventional side of your site looked at by a person, our free website audit covers that and not this, and the free tiers worth trying first are covered in our comparison of free SEO tools.