
Enterprise SEO metrics earn their place by passing a stated test, and the reason most search scorecards sprawl is that nobody ever wrote the test down. Selection is the work. A large program can measure almost anything, so the list grows every quarter until no one can say what a single number on it would change.
Get the selection wrong and you pay in credibility rather than in reporting hours. A measure that collapses under one skeptical question from a finance lead takes the rest of your numbers down with it, and the measures most likely to collapse are the ones search teams like best. The real cost is not a bad slide. It is being asked for a different kind of evidence next quarter, by somebody who has stopped believing this kind.
Our stake, before any of the argument. We sell enterprise search programs for large sites, so telling you to judge search on pipeline rather than positions argues for exactly what we get hired to do. That same service page names organic sessions as one of three headline figures, and a section below says a sessions number is the weakest of the three unless it is split. Read that as a mark against our page as much as against anybody else’s.
The four questions that decide whether a measure stays
Read the guides that rank for this subject and you will find long inventories, every measure defined and recommended, more than any team could act on. What you will not find, in the ten we opened, is the rule the writer used to pick the list. One page, an executive guide on kurtuhlir.com, does publish a table giving each measure an owner and the decision it supports. An inventory tells you what exists. It cannot tell you what to keep.
So here is the rule this article uses, applied out loud to every measure below, including the ones it fails. Treat a candidate as a claim rather than a number, then ask what weight that claim can hold. Four questions settle almost every argument about metrics for enterprise SEO.
Where did the number come from. Somebody counted it, somebody modeled it, or a vendor scored it on a scale of its own design. The next section takes that apart, because the three classes support very different sentences.
Can it move for reasons that are not you. Seasonality, a paid campaign, a competitor’s outage, a change Google shipped on a Tuesday. What matters is whether that noise is big enough to swamp the signal your team produces.
Is there a lever, and does somebody hold it. A measure with no owner and no control surface is a weather report. Worth knowing, and not a target, because no person can be asked to move it.
Who owns the definition. If a vendor or a platform can redefine your measure without asking, your history is on loan. That has already happened to one measure sitting on most search scorecards.
Counted, modeled or scored, and why that decides the argument
Provenance tells you what kind of sentence a number is allowed to appear in. Run question one across your list and the answers fall into three classes.
Counted means a system recorded an event. Clicks and impressions in Search Console, key events in your analytics property, opportunities in the CRM. These are incomplete in documented ways, but every row corresponds to something that happened. A counted number can carry a commitment, which is why targets belong here and nowhere else.
Modeled means somebody estimated it from inputs, usually a position multiplied by an assumed click curve and an assumed search volume. Visibility indexes, estimated traffic and estimated traffic value live here. Two vendors disagree because their assumptions differ, not because anything changed on your site. A modeled number carries a direction and a comparison, never a forecast anyone will hold you to.
Scored means a vendor compressed a model onto a scale it invented. Moz is unusually direct about what that means for its best known score, stating on its own documentation page that “Domain Authority is not a Google ranking factor”, and that the scale is not linear, so “it’s easier to grow your score from 20 to 30 than it is to grow it from 70 to 80”. A scored number can carry a comparison against a named rival on a stated date. Set a target on one and you have committed your team to moving a third party’s model.
Measures of how often a brand appears in AI answers are modeled or scored, never counted, so the same limits apply. They come from the tools compared in AI tools in an enterprise SEO program.
Why almost no metrics for enterprise SEO come with a published threshold
For the overwhelming majority of search measures nobody publishes a good value, and the people closest to the data decline to.
Moz answers the question about its own score by refusing it, saying there is “no universal “good” or “average” Domain Authority score because it’s a relative metric”. Google does the same in a place you would expect a number. Its crawl budget guidance gives page count bands to help you decide whether the guide applies to you, then says plainly that “The numbers given here are a rough estimate to help you classify your site. These are not exact thresholds.”
Published benchmarks are the most dangerous material here, because they are what a stretched analyst reaches for at eleven at night. Watch how easily that catches careful writers. One article ranking for this term, on digitalsnowstorm.com, read on 18 September 2026, heads a section “A Note on the Benchmarks, Because Most of Them Are Inflated”, traces the popular organic against paid acquisition claims back to “agency blogs citing each other, not primary research”, attributes its channel cost figures to a named source, and then in that same section prints its own healthy and strong ratio bands with nothing attached. That is not dishonesty. It is how thresholds get laundered into common knowledge.
So the threshold is yours to set, which is real work rather than a defeat. Three inputs decide it. Your own history, because ninety days of a measure tells you what a normal week looks like and how far it swings when nobody touches anything. The decision the threshold triggers, since a line nobody crosses into an action is decoration. And the cost of a false alarm against a missed signal, which sets how tight the line sits. A threshold with its reasoning written beside it survives a challenge. A round number never does.
The one exception, and what Google’s own method teaches you
Core Web Vitals is the rare search measure shipping with a published threshold, and the method behind it matters more than the numbers.
Google’s guidance, read on 18 September 2026, documents that “LCP should occur within 2.5 seconds of when the page first starts loading”, that “An INP below or at 200 milliseconds means a page has good responsiveness”, and that pages should hold Cumulative Layout Shift at 0.1 or less. All three are read at the same point in your distribution, since “a good threshold to measure is the 75th percentile of page loads, segmented across mobile and desktop devices”. That detail matters more than the numbers, because a median hides the quarter of your visitors having the worst time.
How those thresholds were chosen is the transferable part. Google set them against two criteria at once, a quality of experience grounded in perception research, and achievability, verified by requiring that at least ten percent of origins in the Chrome User Experience Report already meet the good threshold. Copy that shape for any target you set yourself.
Now run question two. Google states there is “no single signal” for page experience in its ranking systems, and adds that “trying to get a perfect score just for SEO reasons may not be the best use of your time”. So this is a pass or fail gate on a genuine user experience problem, and three green bars predict nothing about next quarter’s revenue. It passes questions one, three and four and is still a poor outcome measure, which is a normal result. Keep it with the technical diagnostics rather than with the outcomes.
Split branded from non-branded before you judge any traffic number
If you change one thing after reading this, change this one. Total organic traffic is the most widely reported measure in search and it fails question two outright, because brand and non-brand respond to completely different forces.
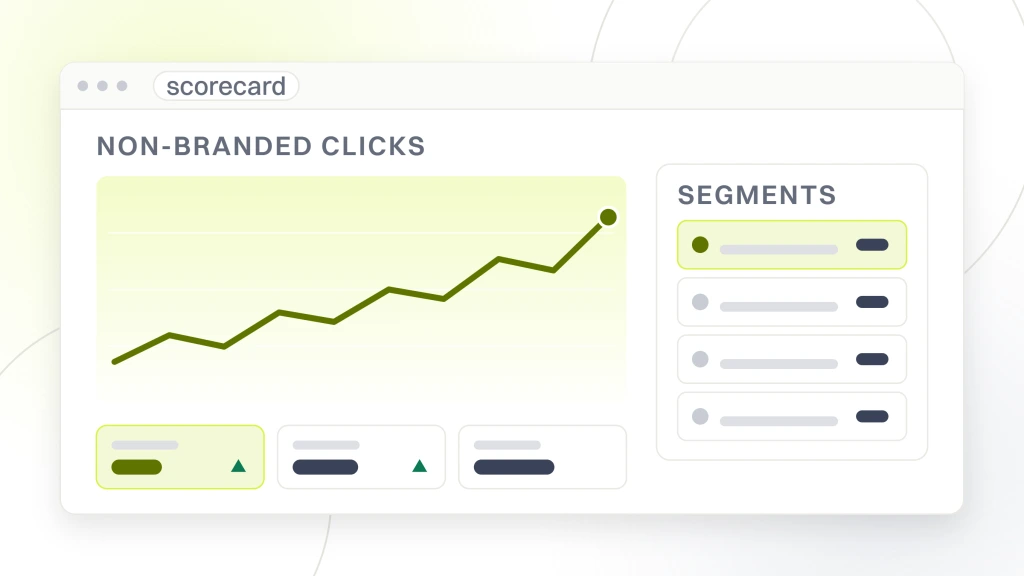
Brand queries move with paid media, public relations, product launches and anything your company spends offline. Non-brand queries move with the work a search team actually does. Report the combined figure and you will claim credit for a television campaign in a good quarter and be blamed for its absence in a bad one. The second is the expensive error, because it is the version that arrives during a budget review.
This is where our own service page is exposed, since it names organic sessions among the three figures leadership sees. Unsplit, that is the weakest of the three. The version worth defending is non-branded organic clicks or sessions, with the branded line beside it rather than deleted, because a brand decline is useful news to somebody else in the building.
Be honest about what the split cannot carry. The boundary is a judgment call, not a fact. Misspellings of your brand, your brand plus a category word, a sub brand you acquired and product names that drifted generic all sit on the line, and where you draw it moves the number by more than most quarterly changes. So publish the term list with the figure, version it like anything else you report, and never compare a period measured under one list against a period measured under another. The instrument producing the underlying query data has limits of its own, which is the subject of how tracked rankings behave at enterprise scale.
What an indexation number can and cannot tell you
Large sites love a coverage ratio, and it is among the easiest measures to misread. Google’s page indexing documentation is blunt about the target most teams set for it, listing “100% coverage” as a common mistake and saying “You should not expect all URLs on your site to be indexed, only the canonical pages”. The same page repeats it in plainer words, “Don’t expect every URL on your site to be indexed”, and warns that “Not indexed is not necessarily bad”.
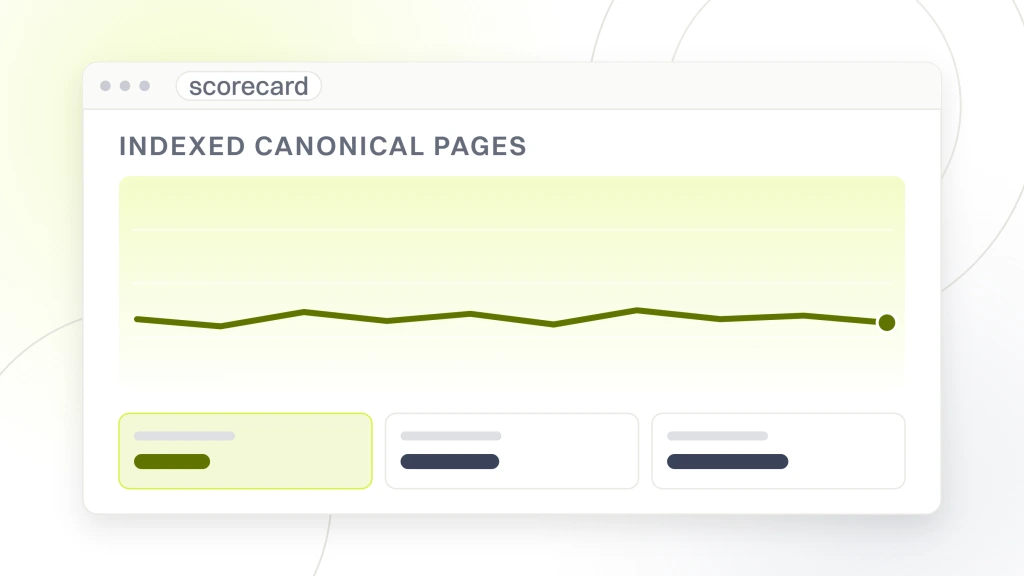
Read in order, that removes the target and leaves a measure behind. A ratio with no correct value cannot be a goal, though it can carry movement once it is split. Indexed pages per template, week over week, tells you a release changed something before anything reaches your traffic numbers. The reason bands underneath are the real metric, since a thousand pages excluded by a canonical tag and a thousand crawled but not indexed are different problems wearing one total.
Crawl statistics deserve the same treatment and a narrower place. Google scopes its crawl budget guidance to sites of a million or more unique pages changing about weekly, sites of ten thousand or more pages changing daily, and sites where a large share of URLs sit in the discovered but not indexed state. If yours is none of those, a crawl chart on your report is decoration.
Engagement metrics changed definition, and your history did not
Bounce rate is the live example of question four, the one about who owns the definition. In Google Analytics 4 both engagement measures hang off a single construct, and Google says so directly, that “Both metrics are defined in terms of engaged sessions”. An engaged session is one that “Lasts longer than 10 seconds”, has a key event, or has two or more page or screen views. Bounce rate is then the inverse, since “The bounce rate is the opposite of the engagement rate”.
Two consequences follow, both of them selection decisions. A ten second timer means a page answering the question in eight seconds counts against you. On a support article, a store locator or a specification page that is exactly backward, and those are the templates where enterprise sites carry the most URLs. And a figure recorded under an older definition is not comparable to one recorded now, so a multi year engagement trend crossing a platform migration is two measures plotted as one line.
Keep engagement rate for what it can carry, which is one template against itself over a short period, ideally either side of a change you made. Drop it as a site wide headline, drop it from any comparison spanning a platform change, and never let it stand in for quality. The general rule matters more than the example. Before keeping any measure, find out when its definition last changed and who can change it again without telling you.
Which measures belong to your team rather than to your search
Some of the most useful numbers in a large program are not search measures at all. Briefs delivered, tickets merged, fixes shipped, days from a written recommendation to a live release, the share of the roadmap that cleared legal and brand sign off. These are countable, they have obvious owners, and they respond inside a single sprint.
They belong to the team. Report them weekly to the people doing the work, and keep them off any surface where money is decided. Whether the team sits in house or at an agency does not move that line, a choice covered in hiring for enterprise SEO. The reason is uncomfortable. Activity measures are the easiest numbers in the program to make look excellent while nothing moves in search, because they measure effort rather than result, and effort is the part you control. Promote one to an outcome and you have asked a budget holder to pay for motion.
One of them deserves promotion, and only one. The count of approved fixes waiting on a release slot, with the date each was approved and the team holding it, names a decision that only somebody senior can unblock. That is not a performance measure, it is a request with evidence attached, and it works because it does not pretend to be a result. The queue it describes is close to the defining condition of the work, which is part of what makes a search program enterprise rather than merely large.
Every measure has a lag, and the lag decides who can read it
A fix ships. A crawl happens. An index update lands. Positions move. Impressions and clicks follow. Then opportunities, then closed revenue, at whatever pace your sales cycle runs. Every step adds delay, and the delays stack rather than overlap.
The selection rule this produces is short. A measure whose response time is longer than your review cycle cannot be your review measure. If you meet monthly and your sales cycle runs two quarters, closed revenue cannot be the monthly number, and forcing it there produces a chart that is noise for five months and a step change in the sixth. Choose the earliest measure in the chain that still moves for reasons you caused, report that monthly, and let revenue land on the quarterly review where it fits.
Then write the expected lag beside the measure when you adopt it, not when somebody questions a flat month. This habit changes the conversation more than any chart, because a flat month against a stated ten week lag is a forecast being met rather than a program failing. Without it every quiet period is an emergency and somebody starts rewriting pages that were working. What a written report should carry alongside each figure is covered in what goes in an SEO report.
Four ways a measure fails the test, and what fails each way
Dropping a measure is harder than adding one, so carry the reason rather than the opinion. These are the enterprise SEO metrics that do not survive the test, sorted by the question each one fails.
- Fails question one, modeled money. Estimated traffic value, produced by multiplying modeled traffic against a modeled cost per click. It looks like money, which is why it reaches a slide, and no transaction sits behind any part of it.
- Fails question two, moves without you. Total organic traffic with brand inside it, and the count of keywords you rank for. The second rises when Google shows you for more things and when somebody adds rows to the tracked set, neither of which is a result.
- Fails question three, nobody holds the lever. Site wide engagement rate or bounce rate. Averaged across every template it cannot be assigned to a person, and whoever it landed on could not change the template mix that produced it.
- Fails question four, the definition is not yours. Any coverage ratio treated as a goal, on Google’s own documented advice, and published page counts promoted from a team measure to an outcome.
A handful of other measures are not failures so much as promotions past the point where anyone can act on them, and where each should sit is adjudicated in enterprise SEO reporting and dashboards. This list is about what leaves the program entirely.
The harder half is political. A measure is usually requested because somebody was burned once and this number was on the screen when they found out. So ask what the figure was used for rather than arguing about its validity, then offer the measure that answers it properly. And keep the retired ones queryable rather than deleting them. A number pulled from a slide but still available on request is a compromise most people accept. A number deleted is a fight you will have every quarter.
How many enterprise SEO metrics a program should actually keep
Fewer than you have. A workable shape is one outcome per business unit, three diagnostics underneath it that explain movement in that outcome, and everything else available on request rather than published. Four numbers per unit sounds thin until you try writing the explanatory sentence for a fifth. That one outcome differs by model, since a store counts revenue where a pipeline business counts qualified opportunities, which is where enterprise ecommerce SEO diverges.
The table below is the artifact worth building for your own enterprise SEO metrics. Not what each measure is, which everybody already knows, but what it is allowed to support and where it breaks.
| Measure | What it can carry | What it cannot carry |
|---|---|---|
| Non-branded organic clicks | A target, a trend, a year over year comparison | Anything at all, once brand terms are mixed back in |
| Organic pipeline or revenue | The budget case, at quarterly pace | A monthly verdict, where the sales cycle is longer |
| Indexed pages by template | Early warning that a release changed something | A coverage goal, since no correct ratio exists |
| Core Web Vitals at the 75th percentile | A published pass or fail on user experience | A prediction about traffic or revenue |
| Estimated traffic value | A rough sense of one page against another | Any sentence containing the word revenue |
| Engagement rate on one template | That template against itself across a change | A quality verdict, or a trend spanning a migration |
| Fixes shipped and fixes blocked | A weekly team view, and one escalation | Evidence that the program is working |
Then give every survivor five attributes before it reaches a recurring surface. A name, a written definition, a named owner, a stated lag, and the decision it feeds. Enterprise SEO KPIs that cannot fill all five are not ready, and the blank field is almost always the last one. You can see how the survivors read once they are attached to real programs in our client case studies.
What we would do first with your enterprise SEO metrics
We would print your scorecard on one page and strike out every number nobody can name a decision for. It needs the people who own the numbers in the room rather than the people who build the charts.
Next we would write one line per survivor naming the owner, the expected lag and what the measure cannot carry. Then we would split brand out of every traffic figure and rebuild twelve months both ways before proposing a single target, because a target set on an unsplit number is a target set on somebody else’s spending. Only then would we set thresholds, from your own history rather than a published benchmark, with the reasoning beside each one.
Start with the strike out and the brand split. Both cost nothing, need no new tooling, and will change what your next review argues about. If you want an outside test of which numbers on your list survive these four questions, our free website audit returns a written report and three ranked fixes at no cost. Whoever owns the list, hold every line on it to the same test. A number that cannot name the decision it changes is not a measure, it is a habit.