Enterprise SEO tracking is the work of deciding which searches you will measure, how often, from which places and on which devices, and then living honestly with everything you chose not to measure. At scale the hard part is never the software. It is the set.
Get the set wrong and you pay twice. You pay a vendor for tens of thousands of rows nobody opens, and you still cannot answer the question leadership actually asks, which is whether last month’s drop was your site or the whole web moving. Meanwhile the forty terms that carry your revenue sit in the same undifferentiated list as a competitor’s brand name somebody added three years ago.
You are entitled to know our stake before the argument starts. We sell enterprise SEO programs, we sell no tracking software and take commission on none of it, so a reader who decides that tracking is a staffing problem rather than a licensing problem might end up hiring us. Our own enterprise page also says “Rankings go in the appendix”, a bias worth knowing while you read a long article about rankings.
What enterprise SEO tracking actually measures
Not your position. There is no such thing as your position, singular. A tracked rank is the result of one query issued from one place, on one device, in one language, at one moment, and Google says so plainly. Its How Search Works page states that “we use information such as your location, past Search history, and Search settings to determine what is most relevant for you in the moment”, and gives the example of someone searching football in Chicago seeing the Chicago Bears while the same search in London returns soccer.
The same page adds that “Our systems can recognize if you have visited the same page multiple times before and bring that page to the top of your Search results”. So the number your executive is looking at is not a fact about your site. It is a reading taken in a context somebody chose.
That is not an argument against tracking. It is an argument about what you are buying, which is a fixed, repeatable context. The value sits in the repeatability, not in the truth of any single row.
There are two families of data underneath every platform, and they are not substitutes. Scraped position data reconstructs a chosen context. First-party performance data records what real searchers saw. Botify puts the difference bluntly in its own guide, noting that “most rank tracking solutions scrape Google search result pages to calculate rank position, rather than use real searcher / real website data”. You need both, for different questions, and confusing them is where most enterprise reporting arguments start.
Why your enterprise SEO tracking keywords list grows until it means nothing
Every enterprise SEO tracking keywords list has the same life cycle. It starts at three hundred terms somebody thought hard about. Then a regional team adds its market, brand adds four competitor names, and a product manager adds a launch term that never had demand. Nobody removes anything, because removing a keyword feels like admitting it does not matter.
Three years later you have forty thousand rows and a weekly email saying average position 18.4. That number describes nothing, and the mechanism is simple. An average across a mixed set is dominated by its largest stratum, which is almost always the cheapest keywords somebody bulk uploaded. When one template fix moves thousands of long tail rows at once and your revenue terms do not move at all, the headline improves and the business does not.
The fix is not a smaller list. It is a layered one, where each layer is reported separately and never averaged with the others. A set that cannot be split by layer cannot be read.
The same drift happens at URL level, because a large site generates near duplicate pages faster than anyone tracks them, and the rules for that live in your CMS and its templates rather than in your tracker.
The multiplication nobody puts in the business case
Keyword counts are quoted as if a keyword were one thing. It is not. What you actually buy is keywords multiplied by locations, multiplied by devices, multiplied by search engines, multiplied by refresh frequency.
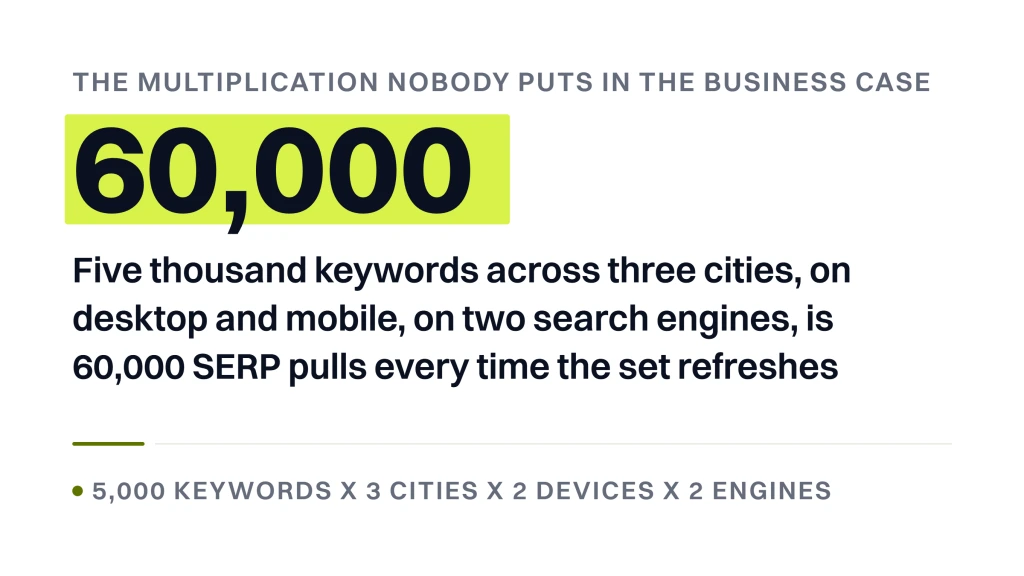
Take a modest looking set. Five thousand keywords across three cities, on desktop and mobile, on two search engines, is 60,000 SERP pulls every time the set refreshes. Refresh that daily for a month and you have asked for 1.8 million pulls. The keyword count on the purchase order said five thousand.
Each multiplier is a product decision somebody is offering you. Nightwatch advertises “107,296 locations” and invites you to “Track from zip codes to entire regions”. seoClarity says its rank tracking is “Available for all search engines in any country, including Google, Bing, Naver, and Yandex”. The catalog is not your constraint. Your constraint is that every option multiplies the same base number.
Botify names the consequence for buyers, observing that “Many rank tracking solutions are pay per keyword, forcing enterprises either to track everything at exorbitantly high costs, or forego tracking some keywords to save on costs”. So decide the multipliers before you argue about the keyword count, because the multipliers set the bill. What the platforms themselves charge, and which ones publish a figure at all, is covered in our piece on enterprise SEO tools and what they cost to run.
How to design a tracked keyword set in four layers
Four layers, four refresh rates, four owners, four separate lines on any report. Nothing is averaged across a layer boundary.
| Layer | What goes in it | Refresh | Coverage |
|---|---|---|---|
| Revenue | Terms attached to a template that earns money, plus your brand | Daily | Census, never sampled |
| Coverage | The full demand set per template and per market | Weekly or monthly | Stratified sample by template |
| Diagnostic | Striking distance, cannibalization watch, post release checks | Opened for a reason, closed when answered | Whatever the question needs |
| Discovery | What you already rank for, pulled from Search Console | Daily pull, monthly review | Never hand picked |
The discovery layer is the one most programs skip, and it is the one that catches what the other three cannot. Botify is right that it is “virtually impossible to predict all the different queries your pages will show up for”, so any set built entirely from human guesses is wrong by construction. Discovery is not a list you write. It is a list you receive.
The revenue layer is usually far smaller than people expect, and the argument about which terms belong in it is the most valuable meeting in the whole tracking project. For a subscription business the layer is shaped by lifecycle stage rather than by volume, which our guide to enterprise SaaS search strategy works through in full.
Tag every keyword with its template
Tag each keyword with the template it targets before you add it, not after. Template is the only tag that lets you explain a movement, because at enterprise scale changes ship at template level and move thousands of rows together.
Should you sample, or track everything
Sample, on the coverage layer, and say so out loud on every report that uses it. Sampling is only dishonest when it is hidden.
The important part is what you stratify by. Most teams sample by search volume, which feels rigorous and is close to useless, because high volume head terms cluster on a handful of templates. A volume weighted sample will watch those three templates closely and miss the four hundred templates where your movement actually happens.
Stratify by template and by market instead. Take a fixed number of keywords from every template family, so a page type with modest volume is represented as clearly as your homepage terms. Then the sample answers the question you will actually be asked, which is not how the site is doing but which part of it moved.
Two rules make sampling safe. Never sample a layer a decision hangs on, which is why the revenue layer is a census. And never compare a sampled average to a previous census, because the difference you see will be the method, not the market. A technical audit at enterprise scale works the same way, which is why our own audit scope is written as every URL rather than a sample.
A sampled average presented without its sample rate is a fabricated number. If the slide says average position 12.1, the footnote has to say from which layer, at what sample rate, and in which location.
Where Search Console stops being enough
Search Console is the best discovery layer available to you, it is first party, and it costs nothing, which is why it belongs in every program alongside the rest of the free SEO tools worth keeping. It also has limits that Google publishes, and enterprise sites hit all of them.
- The API returns top rows, not all rows. Google’s own reference says “The API is bounded by internal limitations of Search Console and does not guarantee to return all data rows but rather top ones”.
- There is a hard daily ceiling. Google documents that the Search Analytics method “exposes a maximum of 50K rows of data per day per search type”, sorted by clicks. A large site ranks for more queries than that.
- Detail costs you data. Ask for page and query together and, in Google’s words, “our system may drop some data in order to be able to calculate results in a reasonable time using a reasonable amount of computing resources”.
- Paging is on you. The rowLimit parameter sets “The maximum number of rows to return”, accepts up to 25,000 and defaults to 1,000, so an unconfigured pull silently hands you a thousand rows and looks complete.
- It lags. Google states that data “is typically available after 2-3 days”, which rules Search Console out as your same day release monitor.
Quota behaves the same way. Google’s limits page warns that “Queries are expensive when you group and/or filter by either page or query string”, with a per site ceiling of 1,200 queries per minute. So the pull you want most, page plus query, is the one that is both throttled and truncated.
Pull one day at a time
Pull Search Console one day at a time rather than by month. Google’s own guidance is that load rises with the date range, so daily pulls stored in your warehouse cost less quota and give you a history longer than the interface keeps.
What enterprise SEO software daily rank tracking is really buying you
Enterprise SEO software daily rank tracking is sold as accuracy. It is not accuracy. It is time resolution, and time resolution is what lets you attribute a movement to a cause.
A weekly refresh tells you a category dropped four positions sometime in the last seven days. That window holds a release, a competitor’s launch, a Google update and a CDN change, so the report starts an argument instead of ending one. A daily series puts the drop on a date, and a date lines up against your deploy log.
Daily across the whole set is also what produces the bill in the section above. The way out is not a slower refresh everywhere, it is a refresh that varies by layer. Ask a vendor whether frequency can be set per keyword group rather than per account. Nozzle sells exactly that, saying it gives you “control over data frequency at the keyword source level”, and that is the feature that makes daily affordable, not the daily itself.
One more thing daily buys you, quietly. A daily series is the only way to measure your own noise floor, and without a noise floor you cannot tell an improvement from a Tuesday.
Did you move, or did the whole web move
This is the question every enterprise program gets wrong first, and public volatility indexes are the usual answer. They are useful and they are widely misread, because each one watches a panel that is not your panel.
MozCast publishes its method in full. “Every 24 hours, we track a hand-picked set of 10,000 keywords (across 20 industry categories and 5 major US cities) and analyze page one of Google organic results, comparing it to the previous day”, with “an uneventful day being about 70” degrees. It has been running since 2012, which makes its history the most valuable thing about it.
Keyword.com runs a different design, a daily reading from 0 to 100 drawn across millions of keywords its customers already track, banded so that “Normal (below 50) is typical day-to-day movement” and “Very high (75+) signals major turbulence”. It argues against the fixed panel approach directly, saying “Most volatility trackers watch a small, fixed sample of generic keywords”.
Both claims are reasonable and neither index is about you. Ten thousand hand picked keywords in five US cities will not notice a shift confined to industrial part numbers in Germany. Treat these as weather stations, then build your own reading from your revenue layer. Take the median absolute position change across it, day over day, and plot ninety days. That median is your noise floor.
After that the diagnosis is mechanical. Your median jumps while the public indexes stay calm, so it is you, and you look at your deploys. Your median jumps with them, so you wait for it to settle before anybody rewrites a page.
Use the median, not the mean
Use the median absolute change rather than the mean when you build your volatility baseline. A handful of keywords falling out of the top 100 will drag a mean into a false alarm every single week.
Why enterprise keyword rankings hide cannibalization
Enterprise keyword rankings have a structural blind spot, and it is written into the definition of the metric almost everyone reports. Google’s Search Console documentation defines average position as “The average position of the topmost result from your site”.
Read that again with two competing pages in mind. If your category page ranks fourth for a query and a stray blog post ranks twenty eighth for it, your reported position is four. The second URL is not a problem in the data, it is absent from it. The same help page confirms the aggregation behind that, noting that “if two results from the same site appear for one query, they count as a single impression in the chart total”.
Seeing the overlap means grouping by query and page at the same time, which is precisely the combination Google flags as most expensive and most likely to drop rows. So the measurement you need for cannibalization is the hardest one to get, on the free data source, at exactly the scale where cannibalization is most likely.
Third party trackers do not rescue you either, because many store one ranking URL per keyword. That shows a swap, where the URL changed between checks, but not a co-occurrence, where two of your URLs sit in the same results page. Botify tells buyers to check for this, advising that you “make sure you’ll have the ability to not only see what position you’re ranking in, but which of your URLs rank for each keyword”.
The practical routine is short. Once a month, pull a single day grouped by query and page, count distinct pages per query, and read every query returning more than one page inside the top thirty. Sort by clicks, not by count, and fix the top twenty.
Local and device are separate sets, not filters you apply later
Teams usually track nationally and promise to slice by location later. Later never produces a usable number, because a national position for a locally intended query is an average of results that no individual searcher ever saw.
Google states the mechanism itself. “Our systems can also recognize many queries have a local intent”, it says, so a search for pizza returns nearby businesses that deliver. Once a query behaves that way, there is no national result to average. Vendors store the data on the same logic, and Nozzle is explicit that “You can set a city/state/country and language preference at the keyword source level”. Location is a property of the tracked row, not a report filter.
Device splits the same way, with one useful asymmetry. Search Console gives you desktop, mobile and tablet as a dimension at no extra cost, while a scraped tracker usually bills mobile and desktop as two tracked keywords. So diagnose the device gap for free first, then pay to track only the terms where the gap is real.
The test is the noise floor you built two sections ago. Split a candidate group by device for one week. If the median gap between devices is smaller than your day to day noise, you are paying to track one keyword twice. Keep the split only where the gap clears the noise, and write the decision down.
What rank tracking for enterprise SEO cannot tell your CFO
Rank tracking for enterprise SEO produces a leading indicator, and every step after it loses information. Position predicts impressions imperfectly, impressions predict clicks imperfectly, and clicks predict revenue least well of all. Three lossy steps is why a rank chart never survives a finance review.
Worse, position can improve while clicks fall. A feature appears above the results, the page below it keeps its organic slot, and the click through rate drops without any ranking change to explain it. If your only instrument is a scraped position, that month looks like a win.
The correction is cheap. Search Console returns clicks, impressions, click through rate and position on the same row, so never report a position movement without the impression and click movement beside it. A position that moves while impressions sit still is a measurement artifact, not a result.
How that gets assembled into something a board reads is the subject of our guide to enterprise SEO reporting and dashboards, and you can see how we lay results out in our client case studies. That is why our enterprise page puts rankings in the appendix, and why the demotion is not an argument against tracking them. A ranking is a weak report and a strong instrument. Demote it on the slide, keep it on the bench.
Who is allowed to add a keyword
Almost nobody writes this down, and it is the one change that keeps a tracked set usable past its first year. Tracking is a governed asset, like a chart of accounts, and it decays the same way when anyone can append to it.
Three intake rules are enough. A keyword enters only with a named owner, the template it maps to, and the layer it belongs in. Anything without all three is refused, including terms requested by people senior to you, because an unowned keyword is a row that will never be acted on.
Then run a removal pass every quarter. Drop anything in the coverage layer with no impressions in ninety days, and anything whose owner has left. Expect an argument the first time, which is the point. A set nobody has argued about is a set nobody reads.
Agencies carry this problem multiplied by their client count, which is why SEO enterprise software for agency keyword tracking has to separate data by permission and not only by project. Grouping also decides whether share of voice means anything, since Keyword.com’s own description is that you “Group keywords into clusters and measure your share of voice across topics”. That figure is only as honest as the cluster underneath it, so version control the cluster definition like anything else you report.
What we would do first with your enterprise SEO tracking setup
We would not shop. We would export the existing tracked set to a spreadsheet and add two columns, owner and template, then count how many rows can be filled in. Whatever that fraction turns out to be, it tells you more about the state of the search function than any audit deck.
Next we would build the revenue layer by hand, in one session, with the people who own the revenue rather than the people who own the tool. Then we would leave the tracking alone for thirty days and measure the noise floor, because changing the instrument and the program together makes the next quarter unreadable.
Only then would we cut. Our bias is on the record, since our enterprise page says we work in your stack with “whatever crawl and rank platform you already license”, and we publish no enterprise prices. If you want the crawl behind the keywords checked at the same time, the enterprise SEO audit checklist covers what a full pass has to include.
Start with the revenue layer, get an owner and a template against every row in it, and measure your noise floor before you change anything else. Everything in this article is downstream of those three moves. If you would rather have someone else do the first pass, our SEO audit reads the site the keywords are measuring and comes back with ranked fixes and the team that owns each one.