
Enterprise SEO analytics is the work of turning search data from many properties and many teams into one set of numbers your executives will act on. It is not a bigger version of a monthly SEO report. The hard part is not picking metrics. It is the plumbing underneath them, and what that plumbing silently drops on the way to the slide.
Get this wrong and you do not just lose reporting time. You lose arguments. Finance opens a dashboard that says organic contributed a fraction of what your screen says, somebody escalates, and the next budget conversation starts from the number you cannot defend. At scale that gap is almost never dishonesty. It is two systems answering two different questions, and nobody wrote down which one the board was reading.
Know where we stand before the rest of this. We sell enterprise SEO programs, and every one of them ships a written monthly report and a live dashboard, so this article argues for work we are paid to do. It also describes how to build the same thing in house, and says plainly where the in house version is better, because on reporting it usually is.
What enterprise SEO analytics has to do that a monthly report cannot
Almost everything written about search reporting assumes one site, one analytics property, and one person deciding what goes in the document. We covered that version in what goes in an SEO report, and the live screen version in what belongs on an SEO report dashboard. If you run one site, those two answer your question and this one will overcomplicate it.
Four things change once the organization gets large enough to need a search program built for scale, and each one breaks a reporting habit that worked fine before.
- The data is split across properties. Search data sits in several Search Console properties and behavior data in several analytics properties, and neither boundary matches how the business is organized into brands and regions.
- There is more than one reader. A board member, a program lead, a regional marketing manager and a technical SEO need the same underlying data shaped four ways, on four refresh rates.
- You are not the system of record. Somebody else owns the official revenue number. Your organic figure has to reconcile to theirs or it gets discounted, however correct it is.
- History matters and it expires. Executives ask year over year questions, and several of the platforms underneath you are quietly deleting the data those questions need.
So the reporting layer at this size is less about choosing what to show and more about surviving a finance analyst pulling on it line by line. Which numbers deserve the board’s attention is a separate argument.
The four data sources an enterprise reporting stack actually runs on
Analytics for enterprise SEO comes from four places, and they have very different reliability, cost and latency. Naming them separately matters because enterprise SEO analytics fails at the seam between two sources far more often than it fails inside any one of them.
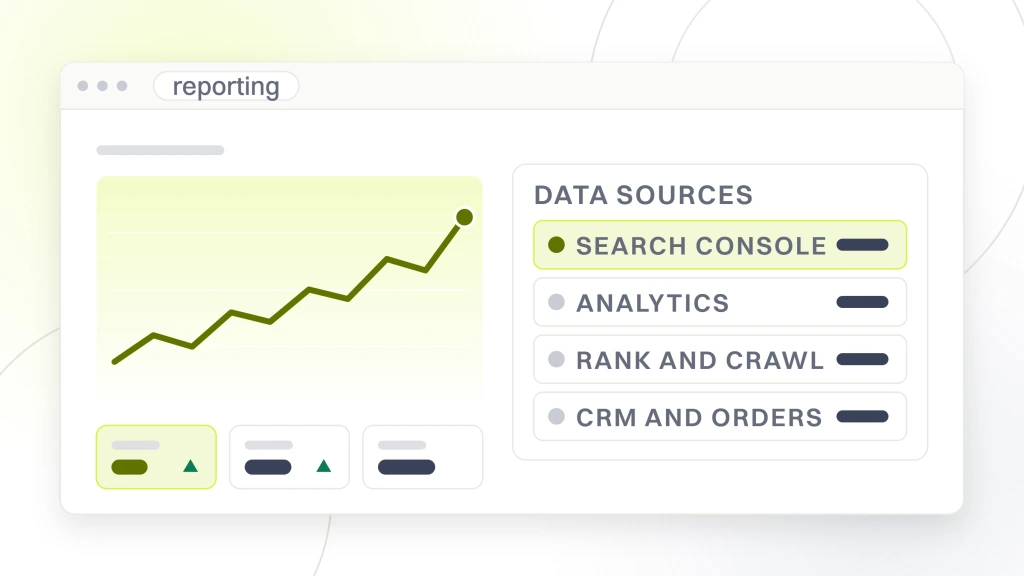
Search Console is the only first party record of what happened in Google’s results, and its interface is not the ceiling people assume. Google’s Search Analytics API documents a rowLimit with a valid range of 1 to 25,000 and a default of 1,000, with a startRow offset for paging beyond that. Above the API sits the bulk data export, which writes to storage you control on a schedule. That matters here for one reason. It is the only one of the three that accumulates a record you own, which is what everything below about expiring history depends on.
Product analytics is the only record of what those visitors then did. It is also where most of the silent data loss happens, which the section after next covers.
Third party rank and crawl data is the only view of results you did not appear in. It is modeled rather than measured, it disagrees between vendors, and it belongs in a program view rather than an executive one. How it behaves once you are tracking tens of thousands of terms is covered in keyword tracking at enterprise scale.
Your own business systems are the CRM, the order system and the finance warehouse. This is the source that makes the exercise worth doing, and the one search teams most often leave out because access takes a quarter and three meetings. Start them now, and ask what your forms write onto a lead record, because that field is what carries organic identity into the CRM.
Why the Search Console and analytics join breaks, and what to key on
The request is easy to state and hard to build. Show queries and clicks next to sessions, leads and revenue, for the same page, on the same day. Four things get in the way, and three are documented limits rather than bugs in your build.
The native link is strictly one to one. Google’s documentation for connecting Search Console to Analytics states that “You can link a web data stream to only one Search Console property”, that “You can link a Search Console property to only one web data stream”, and that “A Google Analytics property can have only one data stream linked to a Search Console property”. If nine brand properties in Search Console feed one analytics property, the integration serves one of them and the other eight need the API or the BigQuery export. The same page notes that the Search Console report collection is unpublished by default, which is why so many teams believe the link failed when it worked.
The clocks disagree. Search Console data becomes available in Analytics 48 hours after collection, per the same page, so a same day comparison is comparing something to nothing. The Search Analytics API documents the dates in its freshness metadata in the America/Los_Angeles time zone, your analytics property uses whatever zone it was configured with, and your finance warehouse uses a third. All three can be right and still refuse to line up.
The history windows differ. Google states that Search Console keeps data for the last 16 months and that reports in Analytics therefore include a maximum of 16 months. Any board chart reaching back further comes from data you stored yourself before the window closed, which nobody thinks about until the first request for a three year trend.
The join key is dirty. A URL is not one string. Trailing slash, protocol, host prefix, tracking parameters, uppercase path segments and localized variants all produce rows that look identical to a human and do not match in SQL. This is where enterprise joins actually fail, and it is entirely yours to fix.
What your analytics platform drops before the number reaches your dashboard
Three documented mechanisms remove data between collection and reporting, and all three bite harder the larger your site is, which is why they belong in a piece about enterprise SEO analytics rather than a general reporting guide.
High cardinality gets condensed into one row. Google’s documentation explains that when a table exceeds its row limit, Analytics surfaces only the most common dimension values and groups the rest under an “(other)” row. Its own worked example is blunt. “if the row limit for the table supporting the Pages and screens report is 100k, but the property has 150k unique pages, then Analytics will sort the rows from most to least common and then group together the last 50k rows under the (other) row”. The same page guides that “Any dimension with more than 500 values should be considered a high-cardinality dimension”, and warns that secondary dimensions, filters and comparisons make condensing more likely. A long tail content program can be working while most of its pages are invisible.
Thresholds withhold rows entirely. Google applies data thresholds to demographic data and to search query information so individual users cannot be identified, and states plainly that they are “system defined. You can’t adjust them”. Small segments, narrow date ranges and regional cuts are the shapes that trip it, which is a problem when a regional manager wants one market for one week.
Retention shrinks as you grow. Standard properties can set event data retention to 2 or 14 months, with longer options on the paid tier. The catch sits in the same documentation. “Large and XL properties are limited to 2 months”, and “When a standard property becomes Large or a 360 property becomes XL, the event-level data retention setting is automatically reduced to 2 months and event-level data older than 2 months becomes inaccessible and is permanently deleted”. Read that in order. Success raises your event volume, volume reclassifies the property, and reclassification deletes the history your year over year chart needed. Google does note that this governs explorations and funnel reports rather than standard aggregated ones, so the headline trend survives and the analysis explaining it does not. That is a warehouse argument, which is why the next thing most enterprise teams build is a copy of their own data.
Attribution decides whether organic looks like a channel or a rounding error
If one section of this article reaches your executives, make it this one. The largest gap between what search contributes and what it is credited with is a configuration choice made once, in a system you may not own.
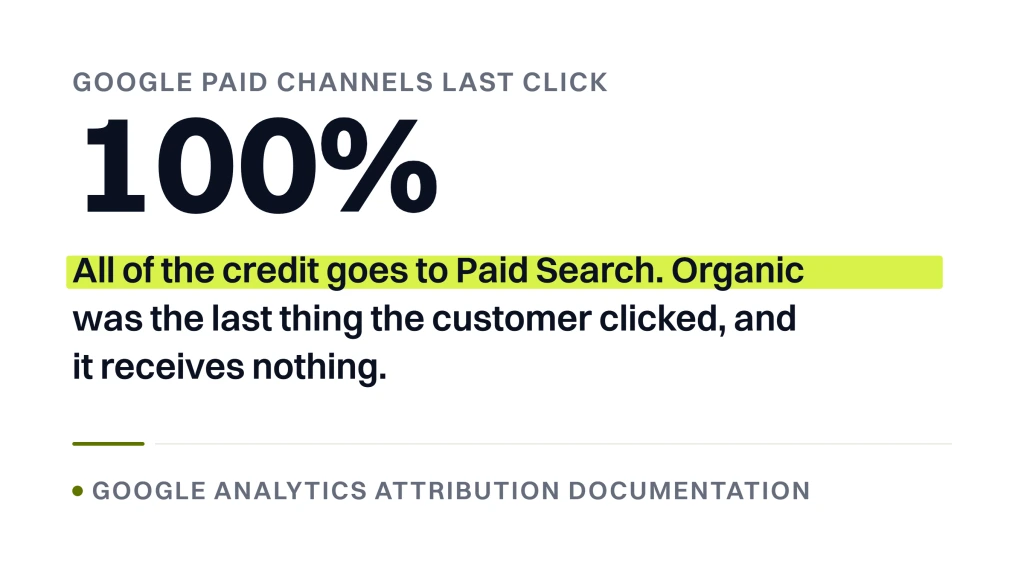
Google Analytics offers three attribution models in its attribution reports, described as data-driven attribution, paid and organic last click, and Google paid channels last click. The third is where organic disappears. Google’s own documented example of that model reads “Display > Social > Paid Search > Organic Search” resolving to “100% to Paid Search”. Organic was the last thing the customer clicked and it receives nothing, because that model “Attributes 100% of the key event value to the last Google Ads channel that the customer clicked through before converting”.
Under paid and organic last click, the same path resolves to “100% to Organic Search”. Same customer, same journey, opposite conclusion, one dropdown apart. Google also notes that paid and organic last click and last non-direct click “are two names for the same attribution model”, worth knowing when your paid team calls it one thing and your BI team the other.
Two further mechanics belong on the slide before anyone argues about totals. Google states that all of its attribution models “exclude direct visits from receiving attribution credit, unless the path to key event consists entirely of direct visits”, so direct is less a rival channel than a bucket that gets redistributed. And under data-driven attribution, “Conversions can be reattributed for up to 7 days after the conversion”, so a figure you screenshot on a Monday can legitimately differ a week later.
None of this makes attribution useless. It makes an unlabeled attribution number indefensible. Name the model on the chart every time and the argument moves from whose number is right to which question you are answering. Which metrics then belong in front of the board is covered in the enterprise SEO metrics worth reporting.
How to layer an enterprise SEO dashboard by who is reading it
One screen cannot serve a board member and a technical SEO. One needs four numbers and a sentence, the other needs ten thousand rows and a filter, and satisfying both produces a screen too dense to skim and too shallow to work in. That is the most common fault in an enterprise SEO dashboard, and layering is the part of enterprise SEO analytics that costs nothing and fixes the most.
Build an SEO dashboard for enterprise teams as three layers over one data model, not as three separate builds. Same warehouse, same definitions, different grain and different refresh.
| Layer | Reader | The question it answers | Grain |
|---|---|---|---|
| Executive | Board, CFO, CMO | Is organic growing, is it worth the investment, what changed | Business unit and quarter |
| Program | SEO lead, channel owners | Which markets, templates and initiatives are moving and which stalled | Template, market and month |
| Practitioner | Technical SEO, content, regional teams | What is broken, where, and who owns the fix | URL and day |
The discipline that makes this work is that a number only appears on a higher layer if it derives from the layer below. When an executive asks why the quarterly figure moved, you drill rather than rebuild. Build the layers independently and that question costs a week of reconciliation, after which everyone quietly stops asking it.
Give every layer a named owner. Not a team, a person. Enterprise SEO management and analytics fails more often on unowned screens than on wrong ones, because a dashboard nobody owns is a dashboard nobody corrects.
What belongs on the executive view, and what never does
Executives who do not care about rankings are being consistent, not dismissive. Nothing else in their pack is an intermediate measure, so a slide of positions reads as a channel asking to be judged by its own private scoreboard.
Four things earn the space on that view.
- Outcome, in the unit the business uses. Pipeline, revenue, qualified leads or bookings, attributed under a named model, next to the same figure a year earlier.
- Direction with a cause attached. Not the delta, the reason. A migration, a seasonal peak, a ranking loss on one template, a competitor launch. A number with no cause invites the room to invent one.
- What is blocked and who is blocking it. The decision only that executive can unblock, named with the team holding it and the cost of waiting.
- One risk line. The thing that could take the number down next quarter, stated before it happens rather than explained afterward.
What never belongs there is easier to list. Average position across all keywords, domain authority scores from any vendor, crawl error counts, impressions with no click context, and any chart whose y axis is a tool’s proprietary index. None are useless. All are program level diagnostics promoted past the point where anyone can act on them.
Where enterprise SEO reporting software helps, and where it stops
Every enterprise search platform sells reporting, most sell it well, and for the program layer they are usually the fastest route to something usable, because the crawl data, rank data and workflow already live inside them.
Two limits decide whether the platform can also carry your executive layer. The first is whether your revenue data can get in. If pipeline lives in a CRM the platform cannot read, the executive view gets assembled somewhere else however good the vendor’s charts are. The second is refresh rate, the specification nobody checks before signing. In Looker Studio, Google documents that its marketing and measurement connectors, naming Google Ads, Google Analytics, Campaign Manager 360, Search Console and YouTube Analytics among others, “refresh every 12 hours” and that “That rate can’t be changed”. A screen advertised as live is often half a day old, which is fine until somebody makes a same day decision on it.
The pattern that holds up is to let the platform own the program layer, let your warehouse own the executive layer, and never let both claim the same number. Google’s bulk export documentation adds one detail that decides your build order. Exporting several Search Console properties into one cloud project requires a different dataset name for each, and history preceding your setup has to come from the API or the reports. There is no backfill. Your own record starts the day you turn the export on.
How often enterprise SEO reporting should land, and why monthly is the wrong default
Monthly is a billing cycle, not a decision cycle. It became the default because retainers are monthly, and at enterprise scale it is wrong in both directions. Far too slow for anything breaking, far too fast for anything strategic.
Set the cadence from the decision each audience actually makes.
- Daily, automated, unread unless it fires. Anomaly alerts on indexation, traffic by template and key event volume. A threshold, not a report.
- Weekly, program layer, self serve. The screen the SEO lead and channel owners open themselves. No document, no meeting, no formatting time.
- Monthly, written, one page. What shipped, what moved, what is blocked. The writing is the value, because prose forces a causal claim that a chart lets you avoid.
- Quarterly, with budget holders. Outcome against forecast, the reallocation you want, and what you would stop doing.
Two constraints above should set those dates rather than surfacing inside a meeting. Search Console data arrives in Analytics 48 hours after collection, so a report cut on the first of the month is short. And conversions can be reattributed for up to seven days under data-driven attribution, so a figure quoted three days after month end will not match the same query two weeks later. Cut on a fixed lag and say so on the slide.
Enterprise SEO management and analytics across many teams and properties
Everything above assumes one reporting stack. The actual enterprise condition is five, built by different teams in different years, each convinced it holds the real numbers. Consolidating them is a governance job in an analytics costume.
Start with a register rather than a dashboard. One document listing every Search Console property, every analytics property, every data stream, the brand or market it covers, who administers it, and which surface it feeds. Most organizations find during this exercise that two properties overlap, one market has none, and a domain nobody claims is still collecting data.
Then look hard at what aggregation your tier permits, because the constraints are specific. Google’s roll-up properties, which combine data from multiple source properties into one, are available only to Analytics 360 accounts linked to a Google Marketing Platform organization with an active 360 order. The documentation adds that “A roll-up property can have a maximum of 200 source properties”, that one “cannot be a source for another roll-up property”, that they “do not inherit custom dimensions and metrics from their source properties”, and that they “do not inherit users from source properties”. So 300 market properties cannot roll into one, a heavy investment in custom dimensions gets rebuilt, and careful regional permissions get configured twice.
What you can segment is also decided upstream, in how your properties and URLs are structured. If regional teams cannot be split out because every market shares one path pattern, that is a platform decision showing up as a reporting complaint, which is one reason the CMS you run an enterprise site on matters more than its feature list suggests. The same holds where documentation, marketing and app sit on different hosts, a structure covered in our walkthrough of a winning enterprise SaaS SEO strategy.
Last, write the definitions down. One page naming what counts as organic, which attribution model is official, what a qualified lead is, which time zone sets the day boundary, and who owns each number. It is the least interesting artifact in the program and the one that ends the most arguments.
The reconciliation you run before anyone else finds two numbers
Your organic figure and the company’s official figure will differ. That is arithmetic, not failure, given everything above about thresholds, condensed rows, attribution models and time zones. The failure is somebody else finding the difference first, in a meeting, with no explanation available.
So run the comparison yourself on a schedule. Take your organic outcome number and the system of record’s number for the same period, put them side by side, and write one line explaining each source of difference. Attribution model, lag, thresholded rows, offline conversions the web stack never sees, returns and cancellations that finance nets out and you do not.
Do this three months running and two things happen. The gap stops growing, because you find the structural causes instead of rediscovering them. And the reconciliation note becomes the thing finance trusts, because you brought them the discrepancy rather than waiting to be shown it. A stack that explains its own variance beats one that reports a tidier number, which is what we look for when reviewing how a program was measured across our client case studies.
What we would do first with your enterprise SEO analytics stack
We would not start with the dashboard. We would start by asking which decision is being made badly, or not at all, because reporting has not supported it. Budget allocation across markets, a platform investment, a headcount case, a stop or continue call on a content program. One sentence, one decision, one named person who makes it.
Then we would work backward. What number would change that person’s mind, what grain does it need, what does it reconcile against, and which limits above stand in the way. That usually produces a far smaller build than the one originally scoped.
If you want an outside read on what your search data can prove today, our free website audit comes back as a written report with three ranked fixes at no cost. Whether you then build the reporting layer in house or hand it to an agency, build it around the decision first. Enterprise SEO analytics earns its budget by changing a decision, and everything else on the screen is decoration.