
An SEO ranker is a tool that crawls your site, tests it against a list of rules, and hands you a number out of a hundred. The number looks like a verdict. It is closer to an opinion, computed from rules one vendor picked and weighted the way that vendor decided, and two of them will grade the same page differently without either being wrong.
Getting this wrong costs you a quarter. You take a 62, spend six weeks pushing it to 85, and nothing happens to your traffic or your leads, because most of what moved the number was never what was holding the site back. Meanwhile the one finding that actually mattered was worth a fraction of a point. That is not a rare outcome, it is the ordinary arithmetic of how these numbers are built, and it is what the rest of this article takes apart. Our SEO audit work starts from the same place.
Redefine Web sells SEO audits, so we compete for attention with every free tool described here and we have a commercial interest in you finding the score wanting. Read the argument with that in view, and test it against a report you have actually been sent rather than taking our word for any of it.
What an SEO ranker actually scores
The phrase covers two different products and people use it for both. Some are rank checkers, which report where a page sits in search results for a term. Others are graders, which crawl your pages and score them against rules. The first reports a position that Google decided. The second reports a grade that a software vendor decided, and only the second is what this article is about.
That distinction matters enough that we wrote it up separately. If you want the full separation of a Google position from a score out of a hundred from a vendor authority metric, our explainer on what an SEO ranking actually is does that job. This article starts where that one finishes, and takes only the score.
One thing worth settling immediately. Google does not issue a score. There is no official number, no grade, nothing in Search Console that reads out of a hundred. Every score you have ever seen for your site was invented by the company showing it to you, which is not an accusation, it is just the fact that makes the rest of this readable.
How the number is actually computed
Almost no vendor publishes its method, which is why the one that does is worth reading closely. Siteimprove’s help documentation, read 16 September 2026 and last modified 31 July 2026, sets out how its SEO Score is built, and the structure is representative of the category.
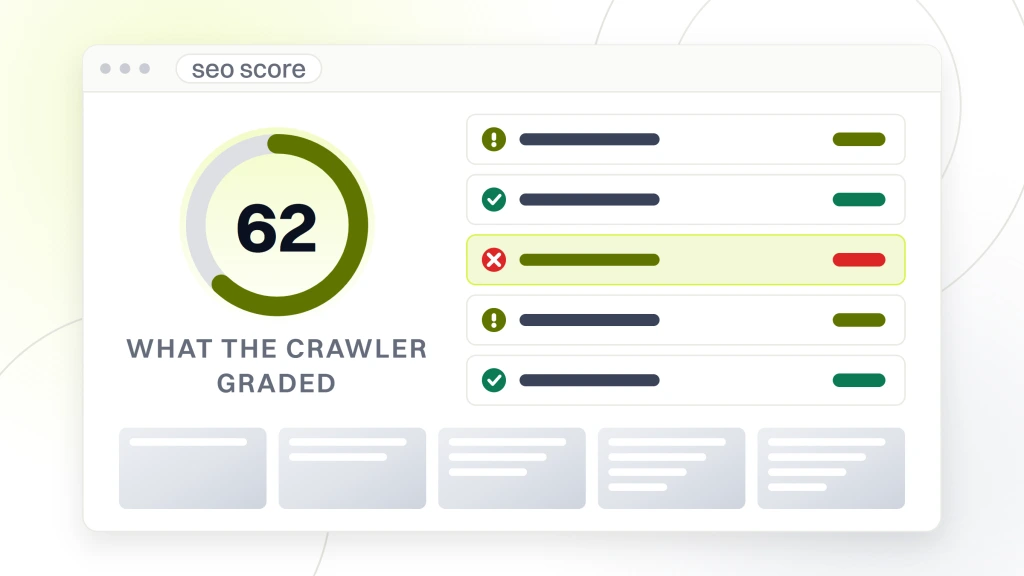
It states that the score “is determined by its performance in four subcategories”, which it names as Technical, Content, User Experience and Mobile, and that “individual checks with different weightings are aggregated to provide a score for each of the subcategories”. The four categories do not count equally. The documentation marks Technical as a high weighting priority, Content and Mobile as medium, and User Experience as low.
Read those weightings again, because they are a set of opinions rather than measurements. Deciding that technical matters most and user experience matters least is a defensible view, and a different vendor could take the opposite position from exactly the same crawl data and publish a different grade for your site without either of them having made a mistake. The weighting is the product.
Then comes the sentence that explains more than anything else on the page. Some checks, it says, “are scored solely on whether an element is absent or present”, giving the example of whether a site has a sitemap, “while other checks are scored on percentage completed”, giving the example of the percentage of pages with no 404 error.
So a score is a weighted average of two incompatible kinds of test. Some are yes or no about the whole site. Some are proportions across every page crawled. Both get flattened into one number, and the flattening is where the meaning leaks out.
Why a binary check can outweigh a thousand broken pages
Work the arithmetic through and something uncomfortable falls out. A yes or no check is worth its full weight the moment you satisfy it, no matter how small the underlying job. Add a sitemap, a file that takes a plugin ten seconds to generate, and you collect the entire weight of that check. A percentage check gives you credit in proportion, so fixing forty of a thousand broken pages collects four percent of that check’s weight.
The consequence is that the cheapest possible actions move the number hardest, and the expensive, genuinely valuable work barely registers. This is not a flaw somebody forgot to fix. It is what happens whenever you average binary and proportional tests together, and you can see both kinds sitting in any findings list you have been sent.
It also runs the other way, which is the part that catches people. One page carrying a noindex tag by mistake can remove your most valuable page from search entirely, and in a site wide percentage check that is one page in a thousand. That is a tenth of one percent of one check, and once that check is weighted inside its category and the category is weighted inside the total, it will not reach the second decimal place. Your score barely twitches. The business consequence is total. Notice what the formula has no term for. It counts how many pages carry a fault, and how much the vendor decided that class of fault matters. Nothing in it can know that this particular page is the one your revenue arrives through. A number built this way cannot represent severity, only prevalence, and those two things come apart exactly where the money is.
Why two checkers grade the same page differently is a subject of its own, and our comparison of free SEO tools works through it rather than us repeating it here.
Why your score cannot track progress over time
Vendors actively encourage you to watch the line. Semrush’s own guide, read 16 September 2026, tells readers that with its Site Audit “you can track your SEO score progress over time” and offers a progress tab to do it. It is the natural thing to want. It is also the one use a score is least suited to, for three reasons that have nothing to do with your site getting better or worse.
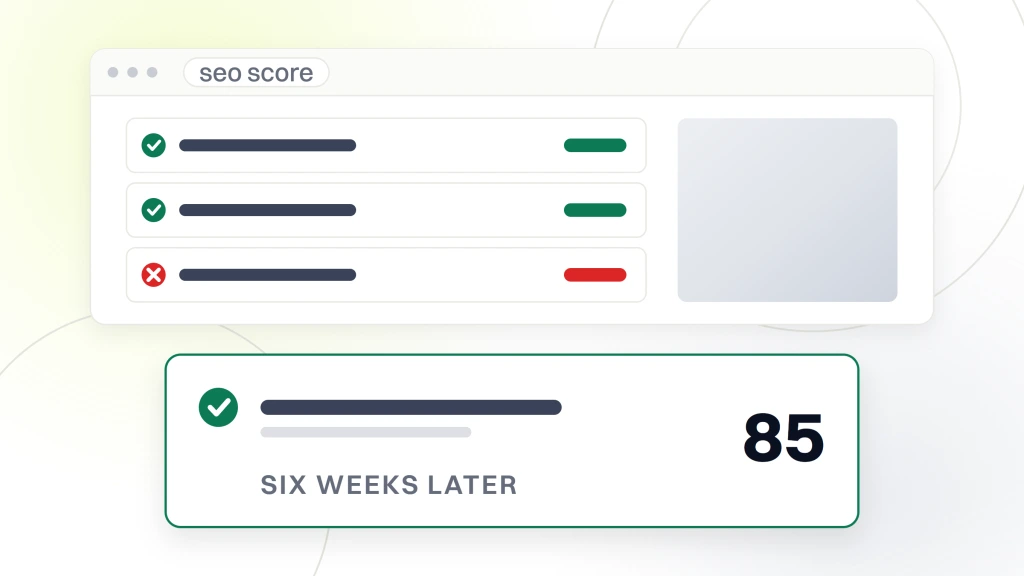
- The page set changes underneath you. Publish thirty new pages and the crawler finds thirty new sets of findings. A site that just did a quarter of good content work can score lower than it did before the work started, because the denominator grew.
- The rule set changes underneath you. Vendors add and retire checks continuously and do not version the score for you. A drop can mean your site changed, or it can mean the vendor started testing something new in a release note nobody read.
- The crawl depth changes underneath you. Free tiers cap how many pages they will read, and the cap decides which pages are in the average. Crawl 100 pages of a 5,000 page site and you have sampled, not measured, and next month’s sample may not be the same pages.
A time series is only meaningful when the thing being measured and the way of measuring it both hold still. Neither does here. Track the underlying findings if you want a trend, the count of pages blocked from indexing or the count of broken links on commercial pages, because those are countable things that mean the same thing in March as they did in January.
When a score out of 100 should change what you do next
Almost never, and the exceptions are narrow enough to list. If your situation is not one of these three, the score is interesting rather than actionable, and the list of findings underneath it is where the value was all along.
| Situation | Why the number earns its place | What to do with it |
|---|---|---|
| A sharp drop right after a deploy | Same tool, same rules, same site, days apart. The only variable that changed is your code | Treat it as a smoke alarm. Read the diff in findings, not the number |
| One category score collapses while the rest hold | Category scores isolate a fault in a way the headline number cannot | Go straight to that category’s findings and ignore the total |
| A pre-launch gate against one fixed tool | Agreed in advance, on a rule set nobody is allowed to change mid-project | Use it as a contractual checklist, never as evidence of quality |
Notice what all three have in common. The score is useful only when everything except your site is held constant, and only as a pointer to the findings underneath. The moment you compare across tools, across sites or across long stretches of time, you are comparing things that were never on the same scale.
Two published figures show how unlike the scales are. SEOmator states on its free audit page that “the median site we audit scores 71 out of 100” and that “only about 7% earn an A”, from audits it says it ran between January and July 2026. Semrush’s guide states that “a good Site Health SEO score is anything above 80”. Those are two vendors, two different metrics and two different populations, read on the same day. They cannot be held against each other, and the fact that it is tempting to try is the whole problem with treating either as your SEO score.
What the score is silently not grading
A grader reads markup. It does not read your market, and the gap is most of what decides whether search works for you.
- Competition. Nothing in the rule set knows who else wants the same terms. A perfect page in a market owned by three national brands still loses, and the score will not warn you.
- Intent. No check asks whether the phrase you optimized for is typed by buyers or by students. A page can be flawless and aimed at nobody who spends money.
- Whether the page persuades. Clarity of pricing, credibility of proof, whether the form asks for too much too early. None of it is gradable by crawler and all of it decides revenue.
- Deliberate choices. A noindex on a thank you page is correct and gets flagged. A short page can be exactly the right length. The tool cannot tell a decision from a mistake, so it reports both as faults.
Speed is a special case worth naming, because graders fold a performance figure into the total and most of them do it from a simulated load rather than from what your visitors experienced. That distinction is large enough to mislead on its own, and our breakdown of how to analyze a website sets out where those two kinds of speed data separate, and which one a grader is actually using.
Why free scorers exist and who pays for them
Nobody builds a crawler, licenses the infrastructure and gives the results away out of generosity. A free scorer is a lead capture instrument, and understanding that tells you how to read the output rather than whether to trust it.
The design incentive is straightforward. A score that comes back perfect ends the conversation, so free scorers rarely return one. A score that comes back catastrophic reads as broken or insulting, so they rarely return that either. The comfortable landing zone is a middling number with a long list of fixable-looking items, which is exactly what most of them produce, and it is also what a genuinely average site deserves. Both explanations fit the same output, which is why you cannot tell them apart from the number alone.
There is a cheap test for any of them. Run the scorer against a site you already believe is excellent, a large publisher or a competitor you rate highly. If that site comes back in roughly the same middling band as everybody else, the tool is not discriminating between good and bad websites at all. It is describing the distance between any real site and a rule set that nothing in production could fully satisfy.
Our own free audit is a written report with ranked fixes rather than a number out of a hundred, and that buys it no exemption here, because it is a lead capture instrument too and you should read it as one. The honest way to use any of these, ours included, is to ignore the headline and read the findings list as a set of leads to check yourself. If a scorer will not show you the underlying items without an email address, that tells you which half of the product was the point.
The numbers that do measure something
Here is the turn. A score is computed from a crawl, which is a snapshot of your markup. Analytics is a record of what people actually did. One is an opinion about your site, the other is evidence about your business, and only the second can tell you whether anything you changed worked.
| Number | Where it comes from | What it can actually settle |
|---|---|---|
| Impressions and clicks by query | Search Console, first party, your own property | Whether search engines show your pages, and for what people typed |
| Average position | Search Console | Where real searchers saw you, rather than where a tool’s simulated search saw you |
| Organic sessions and conversions | Your analytics, segmented to organic | Whether the visits arrived and whether they did anything |
| Indexed page count | Search Console coverage reporting | Whether the pages you published can appear at all |
| Traffic estimates for any site | Third party tools, modeled from sampled data | Rough comparison only. These are estimates, and vendors disagree by large margins |
The last row is worth dwelling on because it gets misused constantly. A traffic estimator does not see another company’s analytics. It models traffic from sampled ranking data and its own assumptions about click rates, so it is useful for saying one competitor is much larger than another and useless for saying anybody gets a specific number of visits. Never put an estimated figure for a competitor in a document where it will be read as measurement.
How to read your own analytics without fooling yourself
First party data is better evidence than any score, and it is still easy to misread. Four traps account for most of it, and all four are avoidable once you know the shape.
- Brand traffic hiding in the organic line. People searching your company name were coming anyway. Filter branded queries out before you judge whether search work is producing anything new.
- Sessions read as success. Traffic that does not convert is a cost. Always carry a conversion or a lead count beside the sessions line, or the chart will flatter work that earned nothing.
- Seasonality mistaken for a trend. Compare against the same period last year rather than last month wherever you have the history, because most businesses have a shape to their year.
- Clicks and visibility drifting apart. An answer assembled by an AI system can cite you without sending a session, so impressions can hold or rise while clicks fall. Read both lines or you will conclude the wrong thing.
That last one is changing fastest and it is where most reporting is still wrong. If you want the longer treatment of how being seen and being clicked have come apart, our explainer on SEO visibility covers what the gap looks like and how to report it honestly.
What to watch instead, in order
Replace the score with five things. They take about the same time to read, they are free, and unlike a grade they mean the same thing every month.
- Pages that cannot be indexed. A count, from Search Console. This is the only number on the list where a single item can be an emergency.
- Non-branded clicks. Search Console, brand queries filtered out, read as a trend across quarters rather than weeks.
- Leads or sales from organic. Your analytics, segmented. The only line on this list your finance team would recognize.
- Position for the terms you sell on. A small set you chose deliberately, not the hundreds a tool offers to track.
- Findings on commercial pages only. The audit list filtered to the pages that make money, which is usually a handful of URLs.
None of the five is a grade, and that is the point. Each one is a count or a currency amount, so it can be argued with, checked by somebody else and acted on. Four of the five come from tools you already have and did not pay for. That ordering is also roughly how search work itself should be sequenced, and if you want the wider view of how the pieces fit together, our explainer on SEO search lays out the whole picture.
What we would do first
Run whichever scorer you like, then do one thing before you read the number. Scroll past it to the findings list and mark every item that would stop a page appearing in search at all. Blocked from indexing, a canonical pointing at the wrong page, a redirect loop, a certificate error. That short list is worth more than the grade and it is usually four or five items out of a hundred.
Then open Search Console and write down two numbers, non-branded clicks for the last quarter and the count of pages that are not indexed. Those are your actual baseline. Whatever you fix next, you will be able to say whether it worked, which is something no movement in a score will ever tell you.
And treat any score you are shown by somebody selling to you as the beginning of a conversation rather than a finding. Ask which rules produced it, how many pages were crawled, and what the number would have been if they had crawled the whole site. If those questions are awkward, you have learned more than the number told you. If you would rather skip the grade and have somebody sort the findings against your business, that is what our website design and SEO package is built around.