
Content Marketing for Food Brands That Ranks Recipes and Sells SKUs
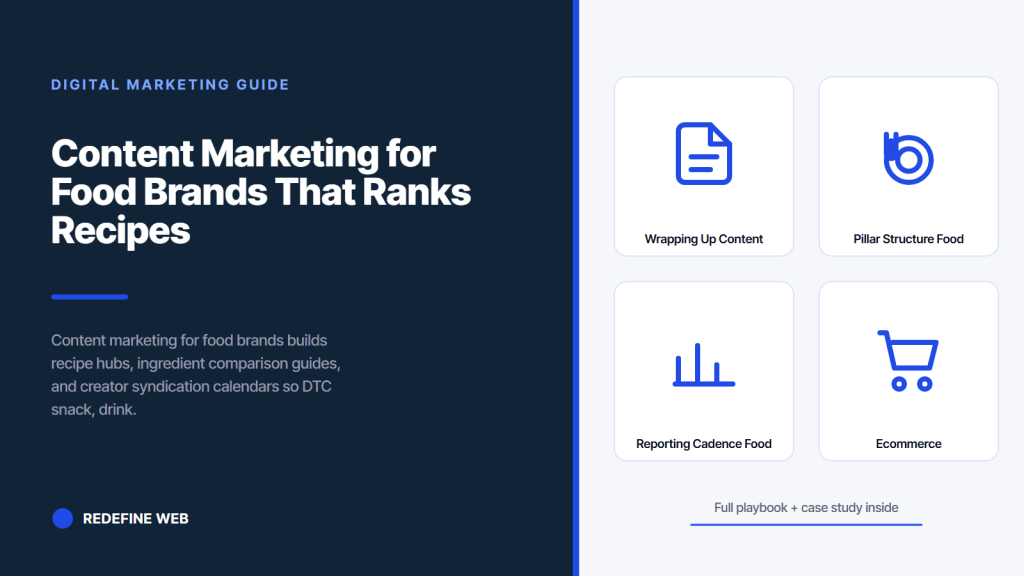
- Content marketing for food brands starts with a recipe hub anchored to hero SKUs.
- Four pillars run concurrently: recipes, ingredient guides, sourcing stories, buyer intent.
- Recipe schema qualifies for Google recipe carousel at 3 to 6 times higher click-through rate.
- Creator syndication amplifies recipes through Instagram, TikTok, YouTube Shorts.
- Content refresh cadence runs 12 to 24 months by pillar to prevent ranking drift.
- Pillar structure for food brand content marketing
- Vejrø hospitality content case study
- Recipe cadence and content calendar for food brands
- Creator syndication inside food brand content
- Buyer intent content for food brand blogs
- Content refresh cadence on food brand pillars
- Reporting cadence for food brand content marketing
- Internal linking discipline across food brand content
- Wrapping up content marketing for food brands
- Pillar structure for food brand content marketing
- Vejrø hospitality content case study
- Recipe cadence and content calendar for food brands
- Creator syndication inside food brand content
- Buyer intent content for food brand blogs
- Content refresh cadence on food brand pillars
- Reporting cadence for food brand content marketing
- Internal linking discipline across food brand content
- Wrapping up content marketing for food brands
- Wrapping up content marketing for food brands
- Pillar structure for food brand content marketing
- Vejrø hospitality content case study
- Recipe cadence and content calendar for food brands
- Creator syndication inside food brand content
- Buyer intent content for food brand blogs
- Content refresh cadence on food brand pillars
- Reporting cadence for food brand content marketing
- Internal linking discipline across food brand content
- Wrapping up content marketing for food brands
- Wrapping up content marketing for food brands
- Pillar structure for food brand content marketing
- Vejrø hospitality content case study
- Recipe cadence and content calendar for food brands
- Creator syndication inside food brand content
- Buyer intent content for food brand blogs
- Content refresh cadence on food brand pillars
- Reporting cadence for food brand content marketing
- Internal linking discipline across food brand content
- Wrapping up content marketing for food brands
- Pillar structure for food brand content marketing
- Vejrø hospitality content case study
- Recipe cadence and content calendar for food brands
- Creator syndication inside food brand content
- Buyer intent content for food brand blogs
- Content refresh cadence on food brand pillars
- Reporting cadence for food brand content marketing
- Internal linking discipline across food brand content
- Wrapping up content marketing for food brands
- Pillar structure for food brand content marketing
- Vejrø hospitality content case study
- Recipe cadence and content calendar for food brands
- Creator syndication inside food brand content
- Buyer intent content for food brand blogs
- Content refresh cadence on food brand pillars
- Reporting cadence for food brand content marketing
- Internal linking discipline across food brand content
- Wrapping up content marketing for food brands
- Wrapping up content marketing for food brands
- Pillar structure for food brand content marketing
- Vejrø hospitality content case study
- Recipe cadence and content calendar for food brands
- Creator syndication inside food brand content
- Buyer intent content for food brand blogs
- Content refresh cadence on food brand pillars
- Reporting cadence for food brand content marketing
- Internal linking discipline across food brand content
- Wrapping up content marketing for food brands
- Pillar structure for food brand content marketing
- Vejrø hospitality content case study
- Recipe cadence and content calendar for food brands
- Creator syndication inside food brand content
- Buyer intent content for food brand blogs
- Content refresh cadence on food brand pillars
- Reporting cadence for food brand content marketing
- Internal linking discipline across food brand content
- Wrapping up content marketing for food brands
- Wrapping up content marketing for food brands
- Pillar structure for food brand content marketing
- Vejrø hospitality content case study
- Recipe cadence and content calendar for food brands
- Creator syndication inside food brand content
- Buyer intent content for food brand blogs
- Content refresh cadence on food brand pillars
- Reporting cadence for food brand content marketing
- Internal linking discipline across food brand content
- Wrapping up content marketing for food brands
- Pillar structure for food brand content marketing
- Vejrø hospitality content case study
- Recipe cadence and content calendar for food brands
- Creator syndication inside food brand content
- Buyer intent content for food brand blogs
- Content refresh cadence on food brand pillars
- Reporting cadence for food brand content marketing
- Internal linking discipline across food brand content
- Wrapping up content marketing for food brands
- Wrapping up content marketing for food brands
- Wrapping up content marketing for food brands
- Pillar structure for food brand content marketing
- Vejrø hospitality content case study
- Recipe cadence and content calendar for food brands
- Creator syndication inside food brand content
- Buyer intent content for food brand blogs
- Content refresh cadence on food brand pillars
- Reporting cadence for food brand content marketing
- Internal linking discipline across food brand content
- Wrapping up content marketing for food brands
- Pillar structure for food brand content marketing
- Vejrø hospitality content case study
- Recipe cadence and content calendar for food brands
- Creator syndication inside food brand content
- Buyer intent content for food brand blogs
- Content refresh cadence on food brand pillars
- Reporting cadence for food brand content marketing
- Internal linking discipline across food brand content
- Wrapping up content marketing for food brands
- Wrapping up content marketing for food brands
- Wrapping up content marketing for food brands
- Wrapping up content marketing for food brands
- Pillar structure for food brand content marketing
- Vejrø hospitality content case study
- Recipe cadence and content calendar for food brands
- Creator syndication inside food brand content
- Buyer intent content for food brand blogs
- Content refresh cadence on food brand pillars
- Reporting cadence for food brand content marketing
- Internal linking discipline across food brand content
- Wrapping up content marketing for food brands
- Pillar structure for food brand content marketing
- Vejrø hospitality content case study
- Recipe cadence and content calendar for food brands
- Creator syndication inside food brand content
- Buyer intent content for food brand blogs
- Content refresh cadence on food brand pillars
- Reporting cadence for food brand content marketing
- Internal linking discipline across food brand content
- Wrapping up content marketing for food brands
- Pillar structure for food brand content marketing
- Vejrø hospitality content case study
- Recipe cadence and content calendar for food brands
- Creator syndication inside food brand content
- Buyer intent content for food brand blogs
- Content refresh cadence on food brand pillars
- Reporting cadence for food brand content marketing
- Internal linking discipline across food brand content
- Wrapping up content marketing for food brands
- Wrapping up content marketing for food brands
- Wrapping up content marketing for food brands
- Pillar structure for food brand content marketing
- Vejrø hospitality content case study
- Recipe cadence and content calendar for food brands
- Creator syndication inside food brand content
- Buyer intent content for food brand blogs
- Content refresh cadence on food brand pillars
- Reporting cadence for food brand content marketing
- Internal linking discipline across food brand content
- Wrapping up content marketing for food brands
- Pillar structure for food brand content marketing
- Vejrø hospitality content case study
- Recipe cadence and content calendar for food brands
- Creator syndication inside food brand content
- Buyer intent content for food brand blogs
- Content refresh cadence on food brand pillars
- Reporting cadence for food brand content marketing
- Internal linking discipline across food brand content
- Wrapping up content marketing for food brands
- Pillar structure for food brand content marketing
- Vejrø hospitality content case study
- Recipe cadence and content calendar for food brands
- Creator syndication inside food brand content
- Buyer intent content for food brand blogs
- Content refresh cadence on food brand pillars
- Reporting cadence for food brand content marketing
- Internal linking discipline across food brand content
- Wrapping up content marketing for food brands
- Wrapping up content marketing for food brands
- Wrapping up content marketing for food brands
- Pillar structure for food brand content marketing
- Vejrø hospitality content case study
- Recipe cadence and content calendar for food brands
- Creator syndication inside food brand content
- Buyer intent content for food brand blogs
- Content refresh cadence on food brand pillars
- Reporting cadence for food brand content marketing
- Internal linking discipline across food brand content
- Wrapping up content marketing for food brands
- Pillar structure for food brand content marketing
- Vejrø hospitality content case study
- Recipe cadence and content calendar for food brands
- Creator syndication inside food brand content
- Buyer intent content for food brand blogs
- Content refresh cadence on food brand pillars
- Reporting cadence for food brand content marketing
- Internal linking discipline across food brand content
- Wrapping up content marketing for food brands
- Wrapping up content marketing for food brands
- Pillar structure for food brand content marketing
- Vejrø hospitality content case study
- Recipe cadence and content calendar for food brands
- Creator syndication inside food brand content
- Buyer intent content for food brand blogs
- Content refresh cadence on food brand pillars
- Reporting cadence for food brand content marketing
- Internal linking discipline across food brand content
- Wrapping up content marketing for food brands
- Wrapping up content marketing for food brands
- Wrapping up content marketing for food brands
- Pillar structure for food brand content marketing
- Vejrø hospitality content case study
- Recipe cadence and content calendar for food brands
- Creator syndication inside food brand content
- Buyer intent content for food brand blogs
- Content refresh cadence on food brand pillars
- Reporting cadence for food brand content marketing
- Internal linking discipline across food brand content
- Wrapping up content marketing for food brands
- Pillar structure for food brand content marketing
- Vejrø hospitality content case study
- Recipe cadence and content calendar for food brands
- Creator syndication inside food brand content
- Buyer intent content for food brand blogs
- Content refresh cadence on food brand pillars
- Reporting cadence for food brand content marketing
- Internal linking discipline across food brand content
- Wrapping up content marketing for food brands
- Wrapping up content marketing for food brands
- Pillar structure for food brand content marketing
- Vejrø hospitality content case study
- Recipe cadence and content calendar for food brands
- Creator syndication inside food brand content
- Buyer intent content for food brand blogs
- Content refresh cadence on food brand pillars
- Reporting cadence for food brand content marketing
- Internal linking discipline across food brand content
- Wrapping up content marketing for food brands
- Wrapping up content marketing for food brands
- Wrapping up content marketing for food brands
- Pillar structure for food brand content marketing
- Vejrø hospitality content case study
- Recipe cadence and content calendar for food brands
- Creator syndication inside food brand content
- Buyer intent content for food brand blogs
- Content refresh cadence on food brand pillars
- Reporting cadence for food brand content marketing
- Internal linking discipline across food brand content
- Wrapping up content marketing for food brands
- Pillar structure for food brand content marketing
- Vejrø hospitality content case study
- Recipe cadence and content calendar for food brands
- Creator syndication inside food brand content
- Buyer intent content for food brand blogs
- Content refresh cadence on food brand pillars
- Reporting cadence for food brand content marketing
- Internal linking discipline across food brand content
- Wrapping up content marketing for food brands
- Pillar structure for food brand content marketing
- Vejrø hospitality content case study
- Recipe cadence and content calendar for food brands
- Creator syndication inside food brand content
- Buyer intent content for food brand blogs
- Content refresh cadence on food brand pillars
- Reporting cadence for food brand content marketing
- Internal linking discipline across food brand content
- Wrapping up content marketing for food brands
- Pillar structure for food brand content marketing
- Vejrø hospitality content case study
- Recipe cadence and content calendar for food brands
- Creator syndication inside food brand content
- Buyer intent content for food brand blogs
- Content refresh cadence on food brand pillars
- Reporting cadence for food brand content marketing
- Internal linking discipline across food brand content
- Wrapping up content marketing for food brands
- Wrapping up content marketing for food brands
- Wrapping up content marketing for food brands
- Pillar structure for food brand content marketing
- Vejrø hospitality content case study
- Recipe cadence and content calendar for food brands
- Creator syndication inside food brand content
- Buyer intent content for food brand blogs
- Content refresh cadence on food brand pillars
- Reporting cadence for food brand content marketing
- Internal linking discipline across food brand content
- Wrapping up content marketing for food brands
- Pillar structure for food brand content marketing
- Vejrø hospitality content case study
- Recipe cadence and content calendar for food brands
- Creator syndication inside food brand content
- Buyer intent content for food brand blogs
- Content refresh cadence on food brand pillars
- Reporting cadence for food brand content marketing
- Internal linking discipline across food brand content
- Wrapping up content marketing for food brands
- Wrapping up content marketing for food brands
- Pillar structure for food brand content marketing
- Vejrø hospitality content case study
- Recipe cadence and content calendar for food brands
- Creator syndication inside food brand content
- Buyer intent content for food brand blogs
- Content refresh cadence on food brand pillars
- Reporting cadence for food brand content marketing
- Internal linking discipline across food brand content
- Wrapping up content marketing for food brands
- Pillar structure for food brand content marketing
- Vejrø hospitality content case study
- Recipe cadence and content calendar for food brands
- Creator syndication inside food brand content
- Buyer intent content for food brand blogs
- Content refresh cadence on food brand pillars
- Reporting cadence for food brand content marketing
- Internal linking discipline across food brand content
- Wrapping up content marketing for food brands
- Wrapping up content marketing for food brands
- Wrapping up content marketing for food brands
- Pillar structure for food brand content marketing
- Vejrø hospitality content case study
- Recipe cadence and content calendar for food brands
- Creator syndication inside food brand content
- Buyer intent content for food brand blogs
- Content refresh cadence on food brand pillars
- Reporting cadence for food brand content marketing
- Internal linking discipline across food brand content
- Wrapping up content marketing for food brands
- Pillar structure for food brand content marketing
- Vejrø hospitality content case study
- Recipe cadence and content calendar for food brands
- Creator syndication inside food brand content
- Buyer intent content for food brand blogs
- Content refresh cadence on food brand pillars
- Reporting cadence for food brand content marketing
- Internal linking discipline across food brand content
- Wrapping up content marketing for food brands
- Wrapping up content marketing for food brands
- Pillar structure for food brand content marketing
- Vejrø hospitality content case study
- Recipe cadence and content calendar for food brands
- Creator syndication inside food brand content
- Buyer intent content for food brand blogs
- Content refresh cadence on food brand pillars
- Reporting cadence for food brand content marketing
- Internal linking discipline across food brand content
- Wrapping up content marketing for food brands
- Pillar structure for food brand content marketing
- Vejrø hospitality content case study
- Recipe cadence and content calendar for food brands
- Creator syndication inside food brand content
- Buyer intent content for food brand blogs
- Content refresh cadence on food brand pillars
- Reporting cadence for food brand content marketing
- Internal linking discipline across food brand content
- Wrapping up content marketing for food brands
- Wrapping up content marketing for food brands
- Wrapping up content marketing for food brands
- Pillar structure for food brand content marketing
- Vejrø hospitality content case study
- Recipe cadence and content calendar for food brands
- Creator syndication inside food brand content
- Buyer intent content for food brand blogs
- Content refresh cadence on food brand pillars
- Reporting cadence for food brand content marketing
- Internal linking discipline across food brand content
- Wrapping up content marketing for food brands
- Pillar structure for food brand content marketing
- Vejrø hospitality content case study
- Recipe cadence and content calendar for food brands
- Creator syndication inside food brand content
- Buyer intent content for food brand blogs
- Content refresh cadence on food brand pillars
- Reporting cadence for food brand content marketing
- Internal linking discipline across food brand content
- Wrapping up content marketing for food brands
- Wrapping up content marketing for food brands
- Wrapping up content marketing for food brands
- Pillar structure for food brand content marketing
- Vejrø hospitality content case study
- Recipe cadence and content calendar for food brands
- Creator syndication inside food brand content
- Buyer intent content for food brand blogs
- Content refresh cadence on food brand pillars
- Reporting cadence for food brand content marketing
- Internal linking discipline across food brand content
- Wrapping up content marketing for food brands
- Pillar structure for food brand content marketing
- Vejrø hospitality content case study
- Recipe cadence and content calendar for food brands
- Creator syndication inside food brand content
- Buyer intent content for food brand blogs
- Content refresh cadence on food brand pillars
- Reporting cadence for food brand content marketing
- Internal linking discipline across food brand content
- Wrapping up content marketing for food brands
- Wrapping up content marketing for food brands
- Wrapping up content marketing for food brands
- Pillar structure for food brand content marketing
- Vejrø hospitality content case study
- Recipe cadence and content calendar for food brands
- Creator syndication inside food brand content
- Buyer intent content for food brand blogs
- Content refresh cadence on food brand pillars
- Reporting cadence for food brand content marketing
- Internal linking discipline across food brand content
- Wrapping up content marketing for food brands
- Pillar structure for food brand content marketing
- Vejrø hospitality content case study
- Recipe cadence and content calendar for food brands
- Creator syndication inside food brand content
- Buyer intent content for food brand blogs
- Content refresh cadence on food brand pillars
- Reporting cadence for food brand content marketing
- Internal linking discipline across food brand content
- Wrapping up content marketing for food brands
- Pillar structure for food brand content marketing
- Vejrø hospitality content case study
- Recipe cadence and content calendar for food brands
- Creator syndication inside food brand content
- Buyer intent content for food brand blogs
- Content refresh cadence on food brand pillars
- Reporting cadence for food brand content marketing
- Internal linking discipline across food brand content
- Wrapping up content marketing for food brands
- Wrapping up content marketing for food brands
- Pillar structure for food brand content marketing
- Vejrø hospitality content case study
- Recipe cadence and content calendar for food brands
- Creator syndication inside food brand content
- Buyer intent content for food brand blogs
- Content refresh cadence on food brand pillars
- Reporting cadence for food brand content marketing
- Internal linking discipline across food brand content
- Wrapping up content marketing for food brands
- Pillar structure for food brand content marketing
- Vejrø hospitality content case study
- Recipe cadence and content calendar for food brands
- Creator syndication inside food brand content
- Buyer intent content for food brand blogs
- Content refresh cadence on food brand pillars
- Reporting cadence for food brand content marketing
- Internal linking discipline across food brand content
- Wrapping up content marketing for food brands
- Wrapping up content marketing for food brands
- Wrapping up content marketing for food brands
- Pillar structure for food brand content marketing
- Vejrø hospitality content case study
- Recipe cadence and content calendar for food brands
- Creator syndication inside food brand content
- Buyer intent content for food brand blogs
- Content refresh cadence on food brand pillars
- Reporting cadence for food brand content marketing
- Internal linking discipline across food brand content
- Wrapping up content marketing for food brands
- Pillar structure for food brand content marketing
- Vejrø hospitality content case study
- Recipe cadence and content calendar for food brands
- Creator syndication inside food brand content
- Buyer intent content for food brand blogs
- Content refresh cadence on food brand pillars
- Reporting cadence for food brand content marketing
- Internal linking discipline across food brand content
- Wrapping up content marketing for food brands
- Pillar structure for food brand content marketing
- Vejrø hospitality content case study
- Recipe cadence and content calendar for food brands
- Creator syndication inside food brand content
- Buyer intent content for food brand blogs
- Content refresh cadence on food brand pillars
- Reporting cadence for food brand content marketing
- Internal linking discipline across food brand content
- Wrapping up content marketing for food brands
- Wrapping up content marketing for food brands
- Pillar structure for food brand content marketing
- Vejrø hospitality content case study
- Recipe cadence and content calendar for food brands
- Creator syndication inside food brand content
- Buyer intent content for food brand blogs
- Content refresh cadence on food brand pillars
- Reporting cadence for food brand content marketing
- Internal linking discipline across food brand content
- Wrapping up content marketing for food brands
- Pillar structure for food brand content marketing
- Vejrø hospitality content case study
- Recipe cadence and content calendar for food brands
- Creator syndication inside food brand content
- Buyer intent content for food brand blogs
- Content refresh cadence on food brand pillars
- Reporting cadence for food brand content marketing
- Internal linking discipline across food brand content
- Wrapping up content marketing for food brands
- Wrapping up content marketing for food brands
- Wrapping up content marketing for food brands
- Pillar structure for food brand content marketing
- Vejrø hospitality content case study
- Recipe cadence and content calendar for food brands
- Creator syndication inside food brand content
- Buyer intent content for food brand blogs
- Content refresh cadence on food brand pillars
- Reporting cadence for food brand content marketing
- Internal linking discipline across food brand content
- Wrapping up content marketing for food brands
- Pillar structure for food brand content marketing
- Vejrø hospitality content case study
- Recipe cadence and content calendar for food brands
- Creator syndication inside food brand content
- Buyer intent content for food brand blogs
- Content refresh cadence on food brand pillars
- Reporting cadence for food brand content marketing
- Internal linking discipline across food brand content
- Wrapping up content marketing for food brands
- Wrapping up content marketing for food brands
- Pillar structure for food brand content marketing
- Vejrø hospitality content case study
- Recipe cadence and content calendar for food brands
- Creator syndication inside food brand content
- Buyer intent content for food brand blogs
- Content refresh cadence on food brand pillars
- Reporting cadence for food brand content marketing
- Internal linking discipline across food brand content
- Wrapping up content marketing for food brands
- Wrapping up content marketing for food brands
- Pillar structure for food brand content marketing
- Vejrø hospitality content case study
- Recipe cadence and content calendar for food brands
- Creator syndication inside food brand content
- Buyer intent content for food brand blogs
- Content refresh cadence on food brand pillars
- Reporting cadence for food brand content marketing
- Internal linking discipline across food brand content
- Wrapping up content marketing for food brands
- Pillar structure for food brand content marketing
- Vejrø hospitality content case study
- Recipe cadence and content calendar for food brands
- Creator syndication inside food brand content
- Buyer intent content for food brand blogs
- Content refresh cadence on food brand pillars
- Reporting cadence for food brand content marketing
- Internal linking discipline across food brand content
- Wrapping up content marketing for food brands
- Wrapping up content marketing for food brands
- Wrapping up content marketing for food brands
- Pillar structure for food brand content marketing
- Vejrø hospitality content case study
- Recipe cadence and content calendar for food brands
- Creator syndication inside food brand content
- Buyer intent content for food brand blogs
- Content refresh cadence on food brand pillars
- Reporting cadence for food brand content marketing
- Internal linking discipline across food brand content
- Wrapping up content marketing for food brands
- Pillar structure for food brand content marketing
- Vejrø hospitality content case study
- Recipe cadence and content calendar for food brands
- Creator syndication inside food brand content
- Buyer intent content for food brand blogs
- Content refresh cadence on food brand pillars
- Reporting cadence for food brand content marketing
- Internal linking discipline across food brand content
- Wrapping up content marketing for food brands
- Wrapping up content marketing for food brands
- Pillar structure for food brand content marketing
- Vejrø hospitality content case study
- Recipe cadence and content calendar for food brands
- Creator syndication inside food brand content
- Buyer intent content for food brand blogs
- Content refresh cadence on food brand pillars
- Reporting cadence for food brand content marketing
- Internal linking discipline across food brand content
- Wrapping up content marketing for food brands
- Wrapping up content marketing for food brands
- Pillar structure for food brand content marketing
- Vejrø hospitality content case study
- Recipe cadence and content calendar for food brands
- Creator syndication inside food brand content
- Buyer intent content for food brand blogs
- Content refresh cadence on food brand pillars
- Reporting cadence for food brand content marketing
- Internal linking discipline across food brand content
- Wrapping up content marketing for food brands
- Pillar structure for food brand content marketing
- Vejrø hospitality content case study
- Recipe cadence and content calendar for food brands
- Creator syndication inside food brand content
- Buyer intent content for food brand blogs
- Content refresh cadence on food brand pillars
- Reporting cadence for food brand content marketing
- Internal linking discipline across food brand content
- Wrapping up content marketing for food brands
- Wrapping up content marketing for food brands
- Wrapping up content marketing for food brands
- Pillar structure for food brand content marketing
- Vejrø hospitality content case study
- Recipe cadence and content calendar for food brands
- Creator syndication inside food brand content
- Buyer intent content for food brand blogs
- Content refresh cadence on food brand pillars
- Reporting cadence for food brand content marketing
- Internal linking discipline across food brand content
- Wrapping up content marketing for food brands
- Pillar structure for food brand content marketing
- Vejrø hospitality content case study
- Recipe cadence and content calendar for food brands
- Creator syndication inside food brand content
- Buyer intent content for food brand blogs
- Content refresh cadence on food brand pillars
- Reporting cadence for food brand content marketing
- Internal linking discipline across food brand content
- Wrapping up content marketing for food brands
- Pillar structure for food brand content marketing
- Vejrø hospitality content case study
- Recipe cadence and content calendar for food brands
- Creator syndication inside food brand content
- Buyer intent content for food brand blogs
- Content refresh cadence on food brand pillars
- Reporting cadence for food brand content marketing
- Internal linking discipline across food brand content
- Wrapping up content marketing for food brands
- Pillar structure for food brand content marketing
- Vejrø hospitality content case study
- Recipe cadence and content calendar for food brands
- Creator syndication inside food brand content
- Buyer intent content for food brand blogs
- Content refresh cadence on food brand pillars
- Reporting cadence for food brand content marketing
- Internal linking discipline across food brand content
- Wrapping up content marketing for food brands
- Wrapping up content marketing for food brands
- Pillar structure for food brand content marketing
- Vejrø hospitality content case study
- Recipe cadence and content calendar for food brands
- Creator syndication inside food brand content
- Buyer intent content for food brand blogs
- Content refresh cadence on food brand pillars
- Reporting cadence for food brand content marketing
- Internal linking discipline across food brand content
- Wrapping up content marketing for food brands
- Pillar structure for food brand content marketing
- Vejrø hospitality content case study
- Recipe cadence and content calendar for food brands
- Creator syndication inside food brand content
- Buyer intent content for food brand blogs
- Content refresh cadence on food brand pillars
- Reporting cadence for food brand content marketing
- Internal linking discipline across food brand content
- Wrapping up content marketing for food brands
- Wrapping up content marketing for food brands
- Wrapping up content marketing for food brands
- Pillar structure for food brand content marketing
- Vejrø hospitality content case study
- Recipe cadence and content calendar for food brands
- Creator syndication inside food brand content
- Buyer intent content for food brand blogs
- Content refresh cadence on food brand pillars
- Reporting cadence for food brand content marketing
- Internal linking discipline across food brand content
- Wrapping up content marketing for food brands
- Pillar structure for food brand content marketing
- Vejrø hospitality content case study
- Recipe cadence and content calendar for food brands
- Creator syndication inside food brand content
- Buyer intent content for food brand blogs
- Content refresh cadence on food brand pillars
- Reporting cadence for food brand content marketing
- Internal linking discipline across food brand content
- Wrapping up content marketing for food brands
- Wrapping up content marketing for food brands
- Pillar structure for food brand content marketing
- Vejrø hospitality content case study
- Recipe cadence and content calendar for food brands
- Creator syndication inside food brand content
- Buyer intent content for food brand blogs
- Content refresh cadence on food brand pillars
- Reporting cadence for food brand content marketing
- Internal linking discipline across food brand content
- Wrapping up content marketing for food brands
- Pillar structure for food brand content marketing
- Vejrø hospitality content case study
- Recipe cadence and content calendar for food brands
- Creator syndication inside food brand content
- Buyer intent content for food brand blogs
- Content refresh cadence on food brand pillars
- Reporting cadence for food brand content marketing
- Internal linking discipline across food brand content
- Wrapping up content marketing for food brands
- Wrapping up content marketing for food brands
- Pillar structure for food brand content marketing
- Vejrø hospitality content case study
- Recipe cadence and content calendar for food brands
- Creator syndication inside food brand content
- Buyer intent content for food brand blogs
- Content refresh cadence on food brand pillars
- Reporting cadence for food brand content marketing
- Internal linking discipline across food brand content
- Wrapping up content marketing for food brands
- Pillar structure for food brand content marketing
- Vejrø hospitality content case study
- Recipe cadence and content calendar for food brands
- Creator syndication inside food brand content
- Buyer intent content for food brand blogs
- Content refresh cadence on food brand pillars
- Reporting cadence for food brand content marketing
- Internal linking discipline across food brand content
- Wrapping up content marketing for food brands
- Wrapping up content marketing for food brands
- Wrapping up content marketing for food brands
- Pillar structure for food brand content marketing
- Vejrø hospitality content case study
- Recipe cadence and content calendar for food brands
- Creator syndication inside food brand content
- Buyer intent content for food brand blogs
- Content refresh cadence on food brand pillars
- Reporting cadence for food brand content marketing
- Internal linking discipline across food brand content
- Wrapping up content marketing for food brands
- Pillar structure for food brand content marketing
- Vejrø hospitality content case study
- Recipe cadence and content calendar for food brands
- Creator syndication inside food brand content
- Buyer intent content for food brand blogs
- Content refresh cadence on food brand pillars
- Reporting cadence for food brand content marketing
- Internal linking discipline across food brand content
- Wrapping up content marketing for food brands
- Wrapping up content marketing for food brands
- Wrapping up content marketing for food brands
- Pillar structure for food brand content marketing
- Vejrø hospitality content case study
- Recipe cadence and content calendar for food brands
- Creator syndication inside food brand content
- Buyer intent content for food brand blogs
- Content refresh cadence on food brand pillars
- Reporting cadence for food brand content marketing
- Internal linking discipline across food brand content
- Wrapping up content marketing for food brands
- Pillar structure for food brand content marketing
- Vejrø hospitality content case study
- Recipe cadence and content calendar for food brands
- Creator syndication inside food brand content
- Buyer intent content for food brand blogs
- Content refresh cadence on food brand pillars
- Reporting cadence for food brand content marketing
- Internal linking discipline across food brand content
- Wrapping up content marketing for food brands
- Wrapping up content marketing for food brands
- Pillar structure for food brand content marketing
- Vejrø hospitality content case study
- Recipe cadence and content calendar for food brands
- Creator syndication inside food brand content
- Buyer intent content for food brand blogs
- Content refresh cadence on food brand pillars
- Reporting cadence for food brand content marketing
- Internal linking discipline across food brand content
- Wrapping up content marketing for food brands
- Pillar structure for food brand content marketing
- Vejrø hospitality content case study
- Recipe cadence and content calendar for food brands
- Creator syndication inside food brand content
- Buyer intent content for food brand blogs
- Content refresh cadence on food brand pillars
- Reporting cadence for food brand content marketing
- Internal linking discipline across food brand content
- Wrapping up content marketing for food brands
- Wrapping up content marketing for food brands
- Wrapping up content marketing for food brands
- Pillar structure for food brand content marketing
- Vejrø hospitality content case study
- Recipe cadence and content calendar for food brands
- Creator syndication inside food brand content
- Buyer intent content for food brand blogs
- Content refresh cadence on food brand pillars
- Reporting cadence for food brand content marketing
- Internal linking discipline across food brand content
- Wrapping up content marketing for food brands
- Pillar structure for food brand content marketing
- Vejrø hospitality content case study
- Recipe cadence and content calendar for food brands
- Creator syndication inside food brand content
- Buyer intent content for food brand blogs
- Content refresh cadence on food brand pillars
- Reporting cadence for food brand content marketing
- Internal linking discipline across food brand content
- Wrapping up content marketing for food brands
- Pillar structure for food brand content marketing
- Vejrø hospitality content case study
- Recipe cadence and content calendar for food brands
- Creator syndication inside food brand content
- Buyer intent content for food brand blogs
- Content refresh cadence on food brand pillars
- Reporting cadence for food brand content marketing
- Internal linking discipline across food brand content
- Wrapping up content marketing for food brands
- Wrapping up content marketing for food brands
- Pillar structure for food brand content marketing
- Vejrø hospitality content case study
- Recipe cadence and content calendar for food brands
- Creator syndication inside food brand content
- Buyer intent content for food brand blogs
- Content refresh cadence on food brand pillars
- Reporting cadence for food brand content marketing
- Internal linking discipline across food brand content
- Wrapping up content marketing for food brands
- Pillar structure for food brand content marketing
- Vejrø hospitality content case study
- Recipe cadence and content calendar for food brands
- Creator syndication inside food brand content
- Buyer intent content for food brand blogs
- Content refresh cadence on food brand pillars
- Reporting cadence for food brand content marketing
- Internal linking discipline across food brand content
- Wrapping up content marketing for food brands
- Wrapping up content marketing for food brands
- Pillar structure for food brand content marketing
- Vejrø hospitality content case study
- Recipe cadence and content calendar for food brands
- Creator syndication inside food brand content
- Buyer intent content for food brand blogs
- Content refresh cadence on food brand pillars
- Reporting cadence for food brand content marketing
- Internal linking discipline across food brand content
- Wrapping up content marketing for food brands
- Pillar structure for food brand content marketing
- Vejrø hospitality content case study
- Recipe cadence and content calendar for food brands
- Creator syndication inside food brand content
- Buyer intent content for food brand blogs
- Content refresh cadence on food brand pillars
- Reporting cadence for food brand content marketing
- Internal linking discipline across food brand content
- Wrapping up content marketing for food brands
- Wrapping up content marketing for food brands
- Wrapping up content marketing for food brands
- Pillar structure for food brand content marketing
- Vejrø hospitality content case study
- Recipe cadence and content calendar for food brands
- Creator syndication inside food brand content
- Buyer intent content for food brand blogs
- Content refresh cadence on food brand pillars
- Reporting cadence for food brand content marketing
- Internal linking discipline across food brand content
- Wrapping up content marketing for food brands
- Pillar structure for food brand content marketing
- Vejrø hospitality content case study
- Recipe cadence and content calendar for food brands
- Creator syndication inside food brand content
- Buyer intent content for food brand blogs
- Content refresh cadence on food brand pillars
- Reporting cadence for food brand content marketing
- Internal linking discipline across food brand content
- Wrapping up content marketing for food brands
- Pillar structure for food brand content marketing
- Vejrø hospitality content case study
- Recipe cadence and content calendar for food brands
- Creator syndication inside food brand content
- Buyer intent content for food brand blogs
- Content refresh cadence on food brand pillars
- Reporting cadence for food brand content marketing
- Internal linking discipline across food brand content
- Wrapping up content marketing for food brands
- Wrapping up content marketing for food brands
- Pillar structure for food brand content marketing
- Vejrø hospitality content case study
- Recipe cadence and content calendar for food brands
- Creator syndication inside food brand content
- Buyer intent content for food brand blogs
- Content refresh cadence on food brand pillars
- Reporting cadence for food brand content marketing
- Internal linking discipline across food brand content
- Wrapping up content marketing for food brands
- Pillar structure for food brand content marketing
- Vejrø hospitality content case study
- Recipe cadence and content calendar for food brands
- Creator syndication inside food brand content
- Buyer intent content for food brand blogs
- Content refresh cadence on food brand pillars
- Reporting cadence for food brand content marketing
- Internal linking discipline across food brand content
- Wrapping up content marketing for food brands
- Wrapping up content marketing for food brands
- Pillar structure for food brand content marketing
- Vejrø hospitality content case study
- Recipe cadence and content calendar for food brands
- Creator syndication inside food brand content
- Buyer intent content for food brand blogs
- Content refresh cadence on food brand pillars
- Reporting cadence for food brand content marketing
- Internal linking discipline across food brand content
- Wrapping up content marketing for food brands
- Pillar structure for food brand content marketing
- Vejrø hospitality content case study
- Recipe cadence and content calendar for food brands
- Creator syndication inside food brand content
- Buyer intent content for food brand blogs
- Content refresh cadence on food brand pillars
- Reporting cadence for food brand content marketing
- Internal linking discipline across food brand content
- Wrapping up content marketing for food brands
- Wrapping up content marketing for food brands
- Wrapping up content marketing for food brands
- Pillar structure for food brand content marketing
- Vejrø hospitality content case study
- Recipe cadence and content calendar for food brands
- Creator syndication inside food brand content
- Buyer intent content for food brand blogs
- Content refresh cadence on food brand pillars
- Reporting cadence for food brand content marketing
- Internal linking discipline across food brand content
- Wrapping up content marketing for food brands
- Pillar structure for food brand content marketing
- Vejrø hospitality content case study
- Recipe cadence and content calendar for food brands
- Creator syndication inside food brand content
- Buyer intent content for food brand blogs
- Content refresh cadence on food brand pillars
- Reporting cadence for food brand content marketing
- Internal linking discipline across food brand content
- Wrapping up content marketing for food brands
- Wrapping up content marketing for food brands
- Pillar structure for food brand content marketing
- Vejrø hospitality content case study
- Recipe cadence and content calendar for food brands
- Creator syndication inside food brand content
- Buyer intent content for food brand blogs
- Content refresh cadence on food brand pillars
- Reporting cadence for food brand content marketing
- Internal linking discipline across food brand content
- Wrapping up content marketing for food brands
- Wrapping up content marketing for food brands
- Pillar structure for food brand content marketing
- Vejrø hospitality content case study
- Recipe cadence and content calendar for food brands
- Creator syndication inside food brand content
- Buyer intent content for food brand blogs
- Content refresh cadence on food brand pillars
- Reporting cadence for food brand content marketing
- Internal linking discipline across food brand content
- Wrapping up content marketing for food brands
- Pillar structure for food brand content marketing
- Vejrø hospitality content case study
- Recipe cadence and content calendar for food brands
- Creator syndication inside food brand content
- Buyer intent content for food brand blogs
- Content refresh cadence on food brand pillars
- Reporting cadence for food brand content marketing
- Internal linking discipline across food brand content
- Wrapping up content marketing for food brands
- Wrapping up content marketing for food brands
- Pillar structure for food brand content marketing
- Vejrø hospitality content case study
- Recipe cadence and content calendar for food brands
- Creator syndication inside food brand content
- Buyer intent content for food brand blogs
- Content refresh cadence on food brand pillars
- Reporting cadence for food brand content marketing
- Internal linking discipline across food brand content
- Wrapping up content marketing for food brands
- Pillar structure for food brand content marketing
- Vejrø hospitality content case study
- Recipe cadence and content calendar for food brands
- Creator syndication inside food brand content
- Buyer intent content for food brand blogs
- Content refresh cadence on food brand pillars
- Reporting cadence for food brand content marketing
- Internal linking discipline across food brand content
- Wrapping up content marketing for food brands
- Wrapping up content marketing for food brands
- Wrapping up content marketing for food brands
- Pillar structure for food brand content marketing
- Vejrø hospitality content case study
- Recipe cadence and content calendar for food brands
- Creator syndication inside food brand content
- Buyer intent content for food brand blogs
- Content refresh cadence on food brand pillars
- Reporting cadence for food brand content marketing
- Internal linking discipline across food brand content
- Wrapping up content marketing for food brands
- Pillar structure for food brand content marketing
- Vejrø hospitality content case study
- Recipe cadence and content calendar for food brands
- Creator syndication inside food brand content
- Buyer intent content for food brand blogs
- Content refresh cadence on food brand pillars
- Reporting cadence for food brand content marketing
- Internal linking discipline across food brand content
- Wrapping up content marketing for food brands
- Wrapping up content marketing for food brands
- Pillar structure for food brand content marketing
- Vejrø hospitality content case study
- Recipe cadence and content calendar for food brands
- Creator syndication inside food brand content
- Buyer intent content for food brand blogs
- Content refresh cadence on food brand pillars
- Reporting cadence for food brand content marketing
- Internal linking discipline across food brand content
- Wrapping up content marketing for food brands
- Wrapping up content marketing for food brands
- Pillar structure for food brand content marketing
- Vejrø hospitality content case study
- Recipe cadence and content calendar for food brands
- Creator syndication inside food brand content
- Buyer intent content for food brand blogs
- Content refresh cadence on food brand pillars
- Reporting cadence for food brand content marketing
- Internal linking discipline across food brand content
- Wrapping up content marketing for food brands
- Pillar structure for food brand content marketing
- Vejrø hospitality content case study
- Recipe cadence and content calendar for food brands
- Creator syndication inside food brand content
- Buyer intent content for food brand blogs
- Content refresh cadence on food brand pillars
- Reporting cadence for food brand content marketing
- Internal linking discipline across food brand content
- Wrapping up content marketing for food brands
- Wrapping up content marketing for food brands
- Pillar structure for food brand content marketing
- Vejrø hospitality content case study
- Recipe cadence and content calendar for food brands
- Creator syndication inside food brand content
- Buyer intent content for food brand blogs
- Content refresh cadence on food brand pillars
- Reporting cadence for food brand content marketing
- Internal linking discipline across food brand content
- Wrapping up content marketing for food brands
- Pillar structure for food brand content marketing
- Vejrø hospitality content case study
- Recipe cadence and content calendar for food brands
- Creator syndication inside food brand content
- Buyer intent content for food brand blogs
- Content refresh cadence on food brand pillars
- Reporting cadence for food brand content marketing
- Internal linking discipline across food brand content
- Wrapping up content marketing for food brands
- Wrapping up content marketing for food brands
- Wrapping up content marketing for food brands
- Pillar structure for food brand content marketing
- Vejrø hospitality content case study
- Recipe cadence and content calendar for food brands
- Creator syndication inside food brand content
- Buyer intent content for food brand blogs
- Content refresh cadence on food brand pillars
- Reporting cadence for food brand content marketing
- Internal linking discipline across food brand content
- Wrapping up content marketing for food brands
- Pillar structure for food brand content marketing
- Vejrø hospitality content case study
- Recipe cadence and content calendar for food brands
- Creator syndication inside food brand content
- Buyer intent content for food brand blogs
- Content refresh cadence on food brand pillars
- Reporting cadence for food brand content marketing
- Internal linking discipline across food brand content
- Wrapping up content marketing for food brands
- Pillar structure for food brand content marketing
- Vejrø hospitality content case study
- Recipe cadence and content calendar for food brands
- Creator syndication inside food brand content
- Buyer intent content for food brand blogs
- Content refresh cadence on food brand pillars
- Reporting cadence for food brand content marketing
- Internal linking discipline across food brand content
- Wrapping up content marketing for food brands
- Pillar structure for food brand content marketing
- Vejrø hospitality content case study
- Recipe cadence and content calendar for food brands
- Creator syndication inside food brand content
- Buyer intent content for food brand blogs
- Content refresh cadence on food brand pillars
- Reporting cadence for food brand content marketing
- Internal linking discipline across food brand content
- Wrapping up content marketing for food brands
- Wrapping up content marketing for food brands
- Pillar structure for food brand content marketing
- Vejrø hospitality content case study
- Recipe cadence and content calendar for food brands
- Creator syndication inside food brand content
- Buyer intent content for food brand blogs
- Content refresh cadence on food brand pillars
- Reporting cadence for food brand content marketing
- Internal linking discipline across food brand content
- Wrapping up content marketing for food brands
- Pillar structure for food brand content marketing
- Vejrø hospitality content case study
- Recipe cadence and content calendar for food brands
- Creator syndication inside food brand content
- Buyer intent content for food brand blogs
- Content refresh cadence on food brand pillars
- Reporting cadence for food brand content marketing
- Internal linking discipline across food brand content
- Wrapping up content marketing for food brands
- Wrapping up content marketing for food brands
- Pillar structure for food brand content marketing
- Vejrø hospitality content case study
- Recipe cadence and content calendar for food brands
- Creator syndication inside food brand content
- Buyer intent content for food brand blogs
- Content refresh cadence on food brand pillars
- Reporting cadence for food brand content marketing
- Internal linking discipline across food brand content
- Wrapping up content marketing for food brands
- Pillar structure for food brand content marketing
- Vejrø hospitality content case study
- Recipe cadence and content calendar for food brands
- Creator syndication inside food brand content
- Buyer intent content for food brand blogs
- Content refresh cadence on food brand pillars
- Reporting cadence for food brand content marketing
- Internal linking discipline across food brand content
- Wrapping up content marketing for food brands
- Wrapping up content marketing for food brands
- Wrapping up content marketing for food brands
- Pillar structure for food brand content marketing
- Vejrø hospitality content case study
- Recipe cadence and content calendar for food brands
- Creator syndication inside food brand content
- Buyer intent content for food brand blogs
- Content refresh cadence on food brand pillars
- Reporting cadence for food brand content marketing
- Internal linking discipline across food brand content
- Wrapping up content marketing for food brands
- Pillar structure for food brand content marketing
- Vejrø hospitality content case study
- Recipe cadence and content calendar for food brands
- Creator syndication inside food brand content
- Buyer intent content for food brand blogs
- Content refresh cadence on food brand pillars
- Reporting cadence for food brand content marketing
- Internal linking discipline across food brand content
- Wrapping up content marketing for food brands
- Wrapping up content marketing for food brands
- Pillar structure for food brand content marketing
- Vejrø hospitality content case study
- Recipe cadence and content calendar for food brands
- Creator syndication inside food brand content
- Buyer intent content for food brand blogs
- Content refresh cadence on food brand pillars
- Reporting cadence for food brand content marketing
- Internal linking discipline across food brand content
- Wrapping up content marketing for food brands
- Pillar structure for food brand content marketing
- Vejrø hospitality content case study
- Recipe cadence and content calendar for food brands
- Creator syndication inside food brand content
- Buyer intent content for food brand blogs
- Content refresh cadence on food brand pillars
- Reporting cadence for food brand content marketing
- Internal linking discipline across food brand content
- Wrapping up content marketing for food brands
- Wrapping up content marketing for food brands
- Pillar structure for food brand content marketing
- Vejrø hospitality content case study
- Recipe cadence and content calendar for food brands
- Creator syndication inside food brand content
- Buyer intent content for food brand blogs
- Content refresh cadence on food brand pillars
- Reporting cadence for food brand content marketing
- Internal linking discipline across food brand content
- Wrapping up content marketing for food brands
- Pillar structure for food brand content marketing
- Vejrø hospitality content case study
- Recipe cadence and content calendar for food brands
- Creator syndication inside food brand content
- Buyer intent content for food brand blogs
- Content refresh cadence on food brand pillars
- Reporting cadence for food brand content marketing
- Internal linking discipline across food brand content
- Wrapping up content marketing for food brands
- Wrapping up content marketing for food brands
- Pillar structure for food brand content marketing
- Vejrø hospitality content case study
- Recipe cadence and content calendar for food brands
- Creator syndication inside food brand content
- Buyer intent content for food brand blogs
- Content refresh cadence on food brand pillars
- Reporting cadence for food brand content marketing
- Internal linking discipline across food brand content
- Wrapping up content marketing for food brands
- Pillar structure for food brand content marketing
- Vejrø hospitality content case study
- Recipe cadence and content calendar for food brands
- Creator syndication inside food brand content
- Buyer intent content for food brand blogs
- Content refresh cadence on food brand pillars
- Reporting cadence for food brand content marketing
- Internal linking discipline across food brand content
- Wrapping up content marketing for food brands
- Wrapping up content marketing for food brands
- Wrapping up content marketing for food brands
- Pillar structure for food brand content marketing
- Vejrø hospitality content case study
- Recipe cadence and content calendar for food brands
- Creator syndication inside food brand content
- Buyer intent content for food brand blogs
- Content refresh cadence on food brand pillars
- Reporting cadence for food brand content marketing
- Internal linking discipline across food brand content
- Wrapping up content marketing for food brands
- Pillar structure for food brand content marketing
- Vejrø hospitality content case study
- Recipe cadence and content calendar for food brands
- Creator syndication inside food brand content
- Buyer intent content for food brand blogs
- Content refresh cadence on food brand pillars
- Reporting cadence for food brand content marketing
- Internal linking discipline across food brand content
- Wrapping up content marketing for food brands
- Pillar structure for food brand content marketing
- Vejrø hospitality content case study
- Recipe cadence and content calendar for food brands
- Creator syndication inside food brand content
- Buyer intent content for food brand blogs
- Content refresh cadence on food brand pillars
- Reporting cadence for food brand content marketing
- Internal linking discipline across food brand content
- Wrapping up content marketing for food brands
- Pillar structure for food brand content marketing
- Vejrø hospitality content case study
- Recipe cadence and content calendar for food brands
- Creator syndication inside food brand content
- Buyer intent content for food brand blogs
- Content refresh cadence on food brand pillars
- Reporting cadence for food brand content marketing
- Internal linking discipline across food brand content
- Wrapping up content marketing for food brands
- Pillar structure for food brand content marketing
- Vejrø hospitality content case study
- Recipe cadence and content calendar for food brands
- Creator syndication inside food brand content
- Buyer intent content for food brand blogs
- Content refresh cadence on food brand pillars
- Reporting cadence for food brand content marketing
- Internal linking discipline across food brand content
- Wrapping up content marketing for food brands
- Wrapping up content marketing for food brands
- Pillar structure for food brand content marketing
- Vejrø hospitality content case study
- Recipe cadence and content calendar for food brands
- Creator syndication inside food brand content
- Buyer intent content for food brand blogs
- Content refresh cadence on food brand pillars
- Reporting cadence for food brand content marketing
- Internal linking discipline across food brand content
- Wrapping up content marketing for food brands
- Pillar structure for food brand content marketing
- Vejrø hospitality content case study
- Recipe cadence and content calendar for food brands
- Creator syndication inside food brand content
- Buyer intent content for food brand blogs
- Content refresh cadence on food brand pillars
- Reporting cadence for food brand content marketing
- Internal linking discipline across food brand content
- Wrapping up content marketing for food brands
- Wrapping up content marketing for food brands
- Pillar structure for food brand content marketing
- Vejrø hospitality content case study
- Recipe cadence and content calendar for food brands
- Creator syndication inside food brand content
- Buyer intent content for food brand blogs
- Content refresh cadence on food brand pillars
- Reporting cadence for food brand content marketing
- Internal linking discipline across food brand content
- Wrapping up content marketing for food brands
- Pillar structure for food brand content marketing
- Vejrø hospitality content case study
- Recipe cadence and content calendar for food brands
- Creator syndication inside food brand content
- Buyer intent content for food brand blogs
- Content refresh cadence on food brand pillars
- Reporting cadence for food brand content marketing
- Internal linking discipline across food brand content
- Wrapping up content marketing for food brands
- Wrapping up content marketing for food brands
- Wrapping up content marketing for food brands
- Pillar structure for food brand content marketing
- Vejrø hospitality content case study
- Recipe cadence and content calendar for food brands
- Creator syndication inside food brand content
- Buyer intent content for food brand blogs
- Content refresh cadence on food brand pillars
- Reporting cadence for food brand content marketing
- Internal linking discipline across food brand content
- Wrapping up content marketing for food brands
- Pillar structure for food brand content marketing
- Vejrø hospitality content case study
- Recipe cadence and content calendar for food brands
- Creator syndication inside food brand content
- Buyer intent content for food brand blogs
- Content refresh cadence on food brand pillars
- Reporting cadence for food brand content marketing
- Internal linking discipline across food brand content
- Wrapping up content marketing for food brands
- Pillar structure for food brand content marketing
- Vejrø hospitality content case study
- Recipe cadence and content calendar for food brands
- Creator syndication inside food brand content
- Buyer intent content for food brand blogs
- Content refresh cadence on food brand pillars
- Reporting cadence for food brand content marketing
- Internal linking discipline across food brand content
- Wrapping up content marketing for food brands
- Pillar structure for food brand content marketing
- Vejrø hospitality content case study
- Recipe cadence and content calendar for food brands
- Creator syndication inside food brand content
- Buyer intent content for food brand blogs
- Content refresh cadence on food brand pillars
- Reporting cadence for food brand content marketing
- Internal linking discipline across food brand content
- Wrapping up content marketing for food brands
- Pillar structure for food brand content marketing
- Vejrø hospitality content case study
- Recipe cadence and content calendar for food brands
- Creator syndication inside food brand content
- Buyer intent content for food brand blogs
- Content refresh cadence on food brand pillars
- Reporting cadence for food brand content marketing
- Internal linking discipline across food brand content
- Wrapping up content marketing for food brands
- Wrapping up content marketing for food brands
- Pillar structure for food brand content marketing
- Vejrø hospitality content case study
- Recipe cadence and content calendar for food brands
- Creator syndication inside food brand content
- Buyer intent content for food brand blogs
- Content refresh cadence on food brand pillars
- Reporting cadence for food brand content marketing
- Internal linking discipline across food brand content
- Wrapping up content marketing for food brands
- Pillar structure for food brand content marketing
- Vejrø hospitality content case study
- Recipe cadence and content calendar for food brands
- Creator syndication inside food brand content
- Buyer intent content for food brand blogs
- Content refresh cadence on food brand pillars
- Reporting cadence for food brand content marketing
- Internal linking discipline across food brand content
- Wrapping up content marketing for food brands
- Wrapping up content marketing for food brands
- Pillar structure for food brand content marketing
- Vejrø hospitality content case study
- Recipe cadence and content calendar for food brands
- Creator syndication inside food brand content
- Buyer intent content for food brand blogs
- Content refresh cadence on food brand pillars
- Reporting cadence for food brand content marketing
- Internal linking discipline across food brand content
- Wrapping up content marketing for food brands
- Pillar structure for food brand content marketing
- Vejrø hospitality content case study
- Recipe cadence and content calendar for food brands
- Creator syndication inside food brand content
- Buyer intent content for food brand blogs
- Content refresh cadence on food brand pillars
- Reporting cadence for food brand content marketing
- Internal linking discipline across food brand content
- Wrapping up content marketing for food brands
- Wrapping up content marketing for food brands
- Wrapping up content marketing for food brands
- Pillar structure for food brand content marketing
- Vejrø hospitality content case study
- Recipe cadence and content calendar for food brands
- Creator syndication inside food brand content
- Buyer intent content for food brand blogs
- Content refresh cadence on food brand pillars
- Reporting cadence for food brand content marketing
- Internal linking discipline across food brand content
- Wrapping up content marketing for food brands
- Pillar structure for food brand content marketing
- Vejrø hospitality content case study
- Recipe cadence and content calendar for food brands
- Creator syndication inside food brand content
- Buyer intent content for food brand blogs
- Content refresh cadence on food brand pillars
- Reporting cadence for food brand content marketing
- Internal linking discipline across food brand content
- Wrapping up content marketing for food brands
- Wrapping up content marketing for food brands
- Pillar structure for food brand content marketing
- Vejrø hospitality content case study
- Recipe cadence and content calendar for food brands
- Creator syndication inside food brand content
- Buyer intent content for food brand blogs
- Content refresh cadence on food brand pillars
- Reporting cadence for food brand content marketing
- Internal linking discipline across food brand content
- Wrapping up content marketing for food brands
- Pillar structure for food brand content marketing
- Vejrø hospitality content case study
- Recipe cadence and content calendar for food brands
- Creator syndication inside food brand content
- Buyer intent content for food brand blogs
- Content refresh cadence on food brand pillars
- Reporting cadence for food brand content marketing
- Internal linking discipline across food brand content
- Wrapping up content marketing for food brands
- Pillar structure for food brand content marketing
- Vejrø hospitality content case study
- Recipe cadence and content calendar for food brands
- Creator syndication inside food brand content
- Buyer intent content for food brand blogs
- Content refresh cadence on food brand pillars
- Reporting cadence for food brand content marketing
- Internal linking discipline across food brand content
- Wrapping up content marketing for food brands
- Wrapping up content marketing for food brands
- Pillar structure for food brand content marketing
- Vejrø hospitality content case study
- Recipe cadence and content calendar for food brands
- Creator syndication inside food brand content
- Buyer intent content for food brand blogs
- Content refresh cadence on food brand pillars
- Reporting cadence for food brand content marketing
- Internal linking discipline across food brand content
- Wrapping up content marketing for food brands
- Pillar structure for food brand content marketing
- Vejrø hospitality content case study
- Recipe cadence and content calendar for food brands
- Creator syndication inside food brand content
- Buyer intent content for food brand blogs
- Content refresh cadence on food brand pillars
- Reporting cadence for food brand content marketing
- Internal linking discipline across food brand content
- Wrapping up content marketing for food brands
- Wrapping up content marketing for food brands
- Pillar structure for food brand content marketing
- Vejrø hospitality content case study
- Recipe cadence and content calendar for food brands
- Creator syndication inside food brand content
- Buyer intent content for food brand blogs
- Content refresh cadence on food brand pillars
- Reporting cadence for food brand content marketing
- Internal linking discipline across food brand content
- Wrapping up content marketing for food brands
- Pillar structure for food brand content marketing
- Vejrø hospitality content case study
- Recipe cadence and content calendar for food brands
- Creator syndication inside food brand content
- Buyer intent content for food brand blogs
- Content refresh cadence on food brand pillars
- Reporting cadence for food brand content marketing
- Internal linking discipline across food brand content
- Wrapping up content marketing for food brands
- Wrapping up content marketing for food brands
- Wrapping up content marketing for food brands
- Pillar structure for food brand content marketing
- Vejrø hospitality content case study
- Recipe cadence and content calendar for food brands
- Creator syndication inside food brand content
- Buyer intent content for food brand blogs
- Content refresh cadence on food brand pillars
- Reporting cadence for food brand content marketing
- Internal linking discipline across food brand content
- Wrapping up content marketing for food brands
- Pillar structure for food brand content marketing
- Vejrø hospitality content case study
- Recipe cadence and content calendar for food brands
- Creator syndication inside food brand content
- Buyer intent content for food brand blogs
- Content refresh cadence on food brand pillars
- Reporting cadence for food brand content marketing
- Internal linking discipline across food brand content
- Wrapping up content marketing for food brands
- Wrapping up content marketing for food brands
- Pillar structure for food brand content marketing
- Vejrø hospitality content case study
- Recipe cadence and content calendar for food brands
- Creator syndication inside food brand content
- Buyer intent content for food brand blogs
- Content refresh cadence on food brand pillars
- Reporting cadence for food brand content marketing
- Internal linking discipline across food brand content
- Wrapping up content marketing for food brands
- Pillar structure for food brand content marketing
- Vejrø hospitality content case study
- Recipe cadence and content calendar for food brands
- Creator syndication inside food brand content
- Buyer intent content for food brand blogs
- Content refresh cadence on food brand pillars
- Reporting cadence for food brand content marketing
- Internal linking discipline across food brand content
- Wrapping up content marketing for food brands
- Pillar structure for food brand content marketing
- Vejrø hospitality content case study
- Recipe cadence and content calendar for food brands
- Creator syndication inside food brand content
- Buyer intent content for food brand blogs
- Content refresh cadence on food brand pillars
- Reporting cadence for food brand content marketing
- Internal linking discipline across food brand content
- Wrapping up content marketing for food brands
- Wrapping up content marketing for food brands
- Pillar structure for food brand content marketing
- Vejrø hospitality content case study
- Recipe cadence and content calendar for food brands
- Creator syndication inside food brand content
- Buyer intent content for food brand blogs
- Content refresh cadence on food brand pillars
- Reporting cadence for food brand content marketing
- Internal linking discipline across food brand content
- Wrapping up content marketing for food brands
- Pillar structure for food brand content marketing
- Vejrø hospitality content case study
- Recipe cadence and content calendar for food brands
- Creator syndication inside food brand content
- Buyer intent content for food brand blogs
- Content refresh cadence on food brand pillars
- Reporting cadence for food brand content marketing
- Internal linking discipline across food brand content
- Wrapping up content marketing for food brands
- Wrapping up content marketing for food brands
- Pillar structure for food brand content marketing
- Vejrø hospitality content case study
- Recipe cadence and content calendar for food brands
- Creator syndication inside food brand content
- Buyer intent content for food brand blogs
- Content refresh cadence on food brand pillars
- Reporting cadence for food brand content marketing
- Internal linking discipline across food brand content
- Wrapping up content marketing for food brands
- Pillar structure for food brand content marketing
- Vejrø hospitality content case study
- Recipe cadence and content calendar for food brands
- Creator syndication inside food brand content
- Buyer intent content for food brand blogs
- Content refresh cadence on food brand pillars
- Reporting cadence for food brand content marketing
- Internal linking discipline across food brand content
- Wrapping up content marketing for food brands
- Wrapping up content marketing for food brands
- Wrapping up content marketing for food brands
- Pillar structure for food brand content marketing
- Vejrø hospitality content case study
- Recipe cadence and content calendar for food brands
- Creator syndication inside food brand content
- Buyer intent content for food brand blogs
- Content refresh cadence on food brand pillars
- Reporting cadence for food brand content marketing
- Internal linking discipline across food brand content
- Wrapping up content marketing for food brands
- Pillar structure for food brand content marketing
- Vejrø hospitality content case study
- Recipe cadence and content calendar for food brands
- Creator syndication inside food brand content
- Buyer intent content for food brand blogs
- Content refresh cadence on food brand pillars
- Reporting cadence for food brand content marketing
- Internal linking discipline across food brand content
- Wrapping up content marketing for food brands
- Wrapping up content marketing for food brands
- Wrapping up content marketing for food brands
- Pillar structure for food brand content marketing
- Vejrø hospitality content case study
- Recipe cadence and content calendar for food brands
- Creator syndication inside food brand content
- Buyer intent content for food brand blogs
- Content refresh cadence on food brand pillars
- Reporting cadence for food brand content marketing
- Internal linking discipline across food brand content
- Wrapping up content marketing for food brands
- Pillar structure for food brand content marketing
- Vejrø hospitality content case study
- Recipe cadence and content calendar for food brands
- Creator syndication inside food brand content
- Buyer intent content for food brand blogs
- Content refresh cadence on food brand pillars
- Reporting cadence for food brand content marketing
- Internal linking discipline across food brand content
- Wrapping up content marketing for food brands
- Pillar structure for food brand content marketing
- Vejrø hospitality content case study
- Recipe cadence and content calendar for food brands
- Creator syndication inside food brand content
- Buyer intent content for food brand blogs
- Content refresh cadence on food brand pillars
- Reporting cadence for food brand content marketing
- Internal linking discipline across food brand content
- Wrapping up content marketing for food brands
- Wrapping up content marketing for food brands
- Pillar structure for food brand content marketing
- Vejrø hospitality content case study
- Recipe cadence and content calendar for food brands
- Creator syndication inside food brand content
- Buyer intent content for food brand blogs
- Content refresh cadence on food brand pillars
- Reporting cadence for food brand content marketing
- Internal linking discipline across food brand content
- Wrapping up content marketing for food brands
- Pillar structure for food brand content marketing
- Vejrø hospitality content case study
- Recipe cadence and content calendar for food brands
- Creator syndication inside food brand content
- Buyer intent content for food brand blogs
- Content refresh cadence on food brand pillars
- Reporting cadence for food brand content marketing
- Internal linking discipline across food brand content
- Wrapping up content marketing for food brands
- Wrapping up content marketing for food brands
- Pillar structure for food brand content marketing
- Vejrø hospitality content case study
- Recipe cadence and content calendar for food brands
- Creator syndication inside food brand content
- Buyer intent content for food brand blogs
- Content refresh cadence on food brand pillars
- Reporting cadence for food brand content marketing
- Internal linking discipline across food brand content
- Wrapping up content marketing for food brands
- Pillar structure for food brand content marketing
- Vejrø hospitality content case study
- Recipe cadence and content calendar for food brands
- Creator syndication inside food brand content
- Buyer intent content for food brand blogs
- Content refresh cadence on food brand pillars
- Reporting cadence for food brand content marketing
- Internal linking discipline across food brand content
- Wrapping up content marketing for food brands
- Wrapping up content marketing for food brands
- Wrapping up content marketing for food brands
- Pillar structure for food brand content marketing
- Vejrø hospitality content case study
- Recipe cadence and content calendar for food brands
- Creator syndication inside food brand content
- Buyer intent content for food brand blogs
- Content refresh cadence on food brand pillars
- Reporting cadence for food brand content marketing
- Internal linking discipline across food brand content
- Wrapping up content marketing for food brands
- Pillar structure for food brand content marketing
- Vejrø hospitality content case study
- Recipe cadence and content calendar for food brands
- Creator syndication inside food brand content
- Buyer intent content for food brand blogs
- Content refresh cadence on food brand pillars
- Reporting cadence for food brand content marketing
- Internal linking discipline across food brand content
- Wrapping up content marketing for food brands
- Pillar structure for food brand content marketing
- Vejrø hospitality content case study
- Recipe cadence and content calendar for food brands
- Creator syndication inside food brand content
- Buyer intent content for food brand blogs
- Content refresh cadence on food brand pillars
- Reporting cadence for food brand content marketing
- Internal linking discipline across food brand content
- Wrapping up content marketing for food brands
- Wrapping up content marketing for food brands
- Pillar structure for food brand content marketing
- Vejrø hospitality content case study
- Recipe cadence and content calendar for food brands
- Creator syndication inside food brand content
- Buyer intent content for food brand blogs
- Content refresh cadence on food brand pillars
- Reporting cadence for food brand content marketing
- Internal linking discipline across food brand content
- Wrapping up content marketing for food brands
- Pillar structure for food brand content marketing
- Vejrø hospitality content case study
- Recipe cadence and content calendar for food brands
- Creator syndication inside food brand content
- Buyer intent content for food brand blogs
- Content refresh cadence on food brand pillars
- Reporting cadence for food brand content marketing
- Internal linking discipline across food brand content
- Wrapping up content marketing for food brands
- Pillar structure for food brand content marketing
- Vejrø hospitality content case study
- Recipe cadence and content calendar for food brands
- Creator syndication inside food brand content
- Buyer intent content for food brand blogs
- Content refresh cadence on food brand pillars
- Reporting cadence for food brand content marketing
- Internal linking discipline across food brand content
- Wrapping up content marketing for food brands
- Wrapping up content marketing for food brands
- Pillar structure for food brand content marketing
- Vejrø hospitality content case study
- Recipe cadence and content calendar for food brands
- Creator syndication inside food brand content
- Buyer intent content for food brand blogs
- Content refresh cadence on food brand pillars
- Reporting cadence for food brand content marketing
- Internal linking discipline across food brand content
- Wrapping up content marketing for food brands
- Pillar structure for food brand content marketing
- Vejrø hospitality content case study
- Recipe cadence and content calendar for food brands
- Creator syndication inside food brand content
- Buyer intent content for food brand blogs
- Content refresh cadence on food brand pillars
- Reporting cadence for food brand content marketing
- Internal linking discipline across food brand content
- Wrapping up content marketing for food brands
- Wrapping up content marketing for food brands
- Pillar structure for food brand content marketing
- Vejrø hospitality content case study
- Recipe cadence and content calendar for food brands
- Creator syndication inside food brand content
- Buyer intent content for food brand blogs
- Content refresh cadence on food brand pillars
- Reporting cadence for food brand content marketing
- Internal linking discipline across food brand content
- Wrapping up content marketing for food brands
- Pillar structure for food brand content marketing
- Vejrø hospitality content case study
- Recipe cadence and content calendar for food brands
- Creator syndication inside food brand content
- Buyer intent content for food brand blogs
- Content refresh cadence on food brand pillars
- Reporting cadence for food brand content marketing
- Internal linking discipline across food brand content
- Wrapping up content marketing for food brands
- Wrapping up content marketing for food brands
- Wrapping up content marketing for food brands
- Pillar structure for food brand content marketing
- Vejrø hospitality content case study
- Recipe cadence and content calendar for food brands
- Creator syndication inside food brand content
- Buyer intent content for food brand blogs
- Content refresh cadence on food brand pillars
- Reporting cadence for food brand content marketing
- Internal linking discipline across food brand content
- Wrapping up content marketing for food brands
- Pillar structure for food brand content marketing
- Vejrø hospitality content case study
- Recipe cadence and content calendar for food brands
- Creator syndication inside food brand content
- Buyer intent content for food brand blogs
- Content refresh cadence on food brand pillars
- Reporting cadence for food brand content marketing
- Internal linking discipline across food brand content
- Wrapping up content marketing for food brands
- Pillar structure for food brand content marketing
- Vejrø hospitality content case study
- Recipe cadence and content calendar for food brands
- Creator syndication inside food brand content
- Buyer intent content for food brand blogs
- Content refresh cadence on food brand pillars
- Reporting cadence for food brand content marketing
- Internal linking discipline across food brand content
- Wrapping up content marketing for food brands
- Wrapping up content marketing for food brands
- Pillar structure for food brand content marketing
- Vejrø hospitality content case study
- Recipe cadence and content calendar for food brands
- Creator syndication inside food brand content
- Buyer intent content for food brand blogs
- Content refresh cadence on food brand pillars
- Reporting cadence for food brand content marketing
- Internal linking discipline across food brand content
- Wrapping up content marketing for food brands
- Pillar structure for food brand content marketing
- Vejrø hospitality content case study
- Recipe cadence and content calendar for food brands
- Creator syndication inside food brand content
- Buyer intent content for food brand blogs
- Content refresh cadence on food brand pillars
- Reporting cadence for food brand content marketing
- Internal linking discipline across food brand content
- Wrapping up content marketing for food brands
- Pillar structure for food brand content marketing
- Vejrø hospitality content case study
- Recipe cadence and content calendar for food brands
- Creator syndication inside food brand content
- Buyer intent content for food brand blogs
- Content refresh cadence on food brand pillars
- Reporting cadence for food brand content marketing
- Internal linking discipline across food brand content
- Wrapping up content marketing for food brands
- Wrapping up content marketing for food brands
- Pillar structure for food brand content marketing
- Vejrø hospitality content case study
- Recipe cadence and content calendar for food brands
- Creator syndication inside food brand content
- Buyer intent content for food brand blogs
- Content refresh cadence on food brand pillars
- Reporting cadence for food brand content marketing
- Internal linking discipline across food brand content
- Wrapping up content marketing for food brands
- Pillar structure for food brand content marketing
- Vejrø hospitality content case study
- Recipe cadence and content calendar for food brands
- Creator syndication inside food brand content
- Buyer intent content for food brand blogs
- Content refresh cadence on food brand pillars
- Reporting cadence for food brand content marketing
- Internal linking discipline across food brand content
- Wrapping up content marketing for food brands
- Wrapping up content marketing for food brands
- Pillar structure for food brand content marketing
- Vejrø hospitality content case study
- Recipe cadence and content calendar for food brands
- Creator syndication inside food brand content
- Buyer intent content for food brand blogs
- Content refresh cadence on food brand pillars
- Reporting cadence for food brand content marketing
- Internal linking discipline across food brand content
- Wrapping up content marketing for food brands
- Pillar structure for food brand content marketing
- Vejrø hospitality content case study
- Recipe cadence and content calendar for food brands
- Creator syndication inside food brand content
- Buyer intent content for food brand blogs
- Content refresh cadence on food brand pillars
- Reporting cadence for food brand content marketing
- Internal linking discipline across food brand content
- Wrapping up content marketing for food brands
- Wrapping up content marketing for food brands
- Wrapping up content marketing for food brands
- Pillar structure for food brand content marketing
- Vejrø hospitality content case study
- Recipe cadence and content calendar for food brands
- Creator syndication inside food brand content
- Buyer intent content for food brand blogs
- Content refresh cadence on food brand pillars
- Reporting cadence for food brand content marketing
- Internal linking discipline across food brand content
- Wrapping up content marketing for food brands
- Pillar structure for food brand content marketing
- Vejrø hospitality content case study
- Recipe cadence and content calendar for food brands
- Creator syndication inside food brand content
- Buyer intent content for food brand blogs
- Content refresh cadence on food brand pillars
- Reporting cadence for food brand content marketing
- Internal linking discipline across food brand content
- Wrapping up content marketing for food brands
- Wrapping up content marketing for food brands
- Pillar structure for food brand content marketing
- Vejrø hospitality content case study
- Recipe cadence and content calendar for food brands
- Creator syndication inside food brand content
- Buyer intent content for food brand blogs
- Content refresh cadence on food brand pillars
- Reporting cadence for food brand content marketing
- Internal linking discipline across food brand content
- Wrapping up content marketing for food brands
- Wrapping up content marketing for food brands
- Pillar structure for food brand content marketing
- Vejrø hospitality content case study
- Recipe cadence and content calendar for food brands
- Creator syndication inside food brand content
- Buyer intent content for food brand blogs
- Content refresh cadence on food brand pillars
- Reporting cadence for food brand content marketing
- Internal linking discipline across food brand content
- Wrapping up content marketing for food brands
- Pillar structure for food brand content marketing
- Vejrø hospitality content case study
- Recipe cadence and content calendar for food brands
- Creator syndication inside food brand content
- Buyer intent content for food brand blogs
- Content refresh cadence on food brand pillars
- Reporting cadence for food brand content marketing
- Internal linking discipline across food brand content
- Wrapping up content marketing for food brands
- Pillar structure for food brand content marketing
- Vejrø hospitality content case study
- Recipe cadence and content calendar for food brands
- Creator syndication inside food brand content
- Buyer intent content for food brand blogs
- Content refresh cadence on food brand pillars
- Reporting cadence for food brand content marketing
- Internal linking discipline across food brand content
- Wrapping up content marketing for food brands
- Wrapping up content marketing for food brands
- Pillar structure for food brand content marketing
- Vejrø hospitality content case study
- Recipe cadence and content calendar for food brands
- Creator syndication inside food brand content
- Buyer intent content for food brand blogs
- Content refresh cadence on food brand pillars
- Reporting cadence for food brand content marketing
- Internal linking discipline across food brand content
- Wrapping up content marketing for food brands
- Pillar structure for food brand content marketing
- Vejrø hospitality content case study
- Recipe cadence and content calendar for food brands
- Creator syndication inside food brand content
- Buyer intent content for food brand blogs
- Content refresh cadence on food brand pillars
- Reporting cadence for food brand content marketing
- Internal linking discipline across food brand content
- Wrapping up content marketing for food brands
- Wrapping up content marketing for food brands
- Pillar structure for food brand content marketing
- Vejrø hospitality content case study
- Recipe cadence and content calendar for food brands
- Creator syndication inside food brand content
- Buyer intent content for food brand blogs
- Content refresh cadence on food brand pillars
- Reporting cadence for food brand content marketing
- Internal linking discipline across food brand content
- Wrapping up content marketing for food brands
- Pillar structure for food brand content marketing
- Vejrø hospitality content case study
- Recipe cadence and content calendar for food brands
- Creator syndication inside food brand content
- Buyer intent content for food brand blogs
- Content refresh cadence on food brand pillars
- Reporting cadence for food brand content marketing
- Internal linking discipline across food brand content
- Wrapping up content marketing for food brands
- Wrapping up content marketing for food brands
- Wrapping up content marketing for food brands
- Pillar structure for food brand content marketing
- Vejrø hospitality content case study
- Recipe cadence and content calendar for food brands
- Creator syndication inside food brand content
- Buyer intent content for food brand blogs
- Content refresh cadence on food brand pillars
- Reporting cadence for food brand content marketing
- Internal linking discipline across food brand content
- Wrapping up content marketing for food brands
- Pillar structure for food brand content marketing
- Vejrø hospitality content case study
- Recipe cadence and content calendar for food brands
- Creator syndication inside food brand content
- Buyer intent content for food brand blogs
- Content refresh cadence on food brand pillars
- Reporting cadence for food brand content marketing
- Internal linking discipline across food brand content
- Wrapping up content marketing for food brands
- Wrapping up content marketing for food brands
- Wrapping up content marketing for food brands
- Pillar structure for food brand content marketing
- Vejrø hospitality content case study
- Recipe cadence and content calendar for food brands
- Creator syndication inside food brand content
- Buyer intent content for food brand blogs
- Content refresh cadence on food brand pillars
- Reporting cadence for food brand content marketing
- Internal linking discipline across food brand content
- Wrapping up content marketing for food brands
- Wrapping up content marketing for food brands
- Pillar structure for food brand content marketing
- Vejrø hospitality content case study
- Recipe cadence and content calendar for food brands
- Creator syndication inside food brand content
- Buyer intent content for food brand blogs
- Content refresh cadence on food brand pillars
- Reporting cadence for food brand content marketing
- Internal linking discipline across food brand content
- Wrapping up content marketing for food brands
- Pillar structure for food brand content marketing
- Vejrø hospitality content case study
- Recipe cadence and content calendar for food brands
- Creator syndication inside food brand content
- Buyer intent content for food brand blogs
- Content refresh cadence on food brand pillars
- Reporting cadence for food brand content marketing
- Internal linking discipline across food brand content
- Wrapping up content marketing for food brands
- Pillar structure for food brand content marketing
- Vejrø hospitality content case study
- Recipe cadence and content calendar for food brands
- Creator syndication inside food brand content
- Buyer intent content for food brand blogs
- Content refresh cadence on food brand pillars
- Reporting cadence for food brand content marketing
- Internal linking discipline across food brand content
- Wrapping up content marketing for food brands
- Wrapping up content marketing for food brands
- Pillar structure for food brand content marketing
- Vejrø hospitality content case study
- Recipe cadence and content calendar for food brands
- Creator syndication inside food brand content
- Buyer intent content for food brand blogs
- Content refresh cadence on food brand pillars
- Reporting cadence for food brand content marketing
- Internal linking discipline across food brand content
- Wrapping up content marketing for food brands
- Pillar structure for food brand content marketing
- Vejrø hospitality content case study
- Recipe cadence and content calendar for food brands
- Creator syndication inside food brand content
- Buyer intent content for food brand blogs
- Content refresh cadence on food brand pillars
- Reporting cadence for food brand content marketing
- Internal linking discipline across food brand content
- Wrapping up content marketing for food brands
- Wrapping up content marketing for food brands
- Pillar structure for food brand content marketing
- Vejrø hospitality content case study
- Recipe cadence and content calendar for food brands
- Creator syndication inside food brand content
- Buyer intent content for food brand blogs
- Content refresh cadence on food brand pillars
- Reporting cadence for food brand content marketing
- Internal linking discipline across food brand content
- Wrapping up content marketing for food brands
- Pillar structure for food brand content marketing
- Vejrø hospitality content case study
- Recipe cadence and content calendar for food brands
- Creator syndication inside food brand content
- Buyer intent content for food brand blogs
- Content refresh cadence on food brand pillars
- Reporting cadence for food brand content marketing
- Internal linking discipline across food brand content
- Wrapping up content marketing for food brands
- Wrapping up content marketing for food brands
- Wrapping up content marketing for food brands
- Pillar structure for food brand content marketing
- Vejrø hospitality content case study
- Recipe cadence and content calendar for food brands
- Creator syndication inside food brand content
- Buyer intent content for food brand blogs
- Content refresh cadence on food brand pillars
- Reporting cadence for food brand content marketing
- Internal linking discipline across food brand content
- Wrapping up content marketing for food brands
- Pillar structure for food brand content marketing
- Vejrø hospitality content case study
- Recipe cadence and content calendar for food brands
- Creator syndication inside food brand content
- Buyer intent content for food brand blogs
- Content refresh cadence on food brand pillars
- Reporting cadence for food brand content marketing
- Internal linking discipline across food brand content
- Wrapping up content marketing for food brands
- Pillar structure for food brand content marketing
- Vejrø hospitality content case study
- Recipe cadence and content calendar for food brands
- Creator syndication inside food brand content
- Buyer intent content for food brand blogs
- Content refresh cadence on food brand pillars
- Reporting cadence for food brand content marketing
- Internal linking discipline across food brand content
- Wrapping up content marketing for food brands
- Wrapping up content marketing for food brands
- Pillar structure for food brand content marketing
- Vejrø hospitality content case study
- Recipe cadence and content calendar for food brands
- Creator syndication inside food brand content
- Buyer intent content for food brand blogs
- Content refresh cadence on food brand pillars
- Reporting cadence for food brand content marketing
- Internal linking discipline across food brand content
- Wrapping up content marketing for food brands
- Wrapping up content marketing for food brands
- Pillar structure for food brand content marketing
- Vejrø hospitality content case study
- Recipe cadence and content calendar for food brands
- Creator syndication inside food brand content
- Buyer intent content for food brand blogs
- Content refresh cadence on food brand pillars
- Reporting cadence for food brand content marketing
- Internal linking discipline across food brand content
- Wrapping up content marketing for food brands
- Pillar structure for food brand content marketing
- Vejrø hospitality content case study
- Recipe cadence and content calendar for food brands
- Creator syndication inside food brand content
- Buyer intent content for food brand blogs
- Content refresh cadence on food brand pillars
- Reporting cadence for food brand content marketing
- Internal linking discipline across food brand content
- Wrapping up content marketing for food brands
- Pillar structure for food brand content marketing
- Vejrø hospitality content case study
- Recipe cadence and content calendar for food brands
- Creator syndication inside food brand content
- Buyer intent content for food brand blogs
- Content refresh cadence on food brand pillars
- Reporting cadence for food brand content marketing
- Internal linking discipline across food brand content
- Wrapping up content marketing for food brands
- Wrapping up content marketing for food brands
- Pillar structure for food brand content marketing
- Vejrø hospitality content case study
- Recipe cadence and content calendar for food brands
- Creator syndication inside food brand content
- Buyer intent content for food brand blogs
- Content refresh cadence on food brand pillars
- Reporting cadence for food brand content marketing
- Internal linking discipline across food brand content
- Wrapping up content marketing for food brands
- Pillar structure for food brand content marketing
- Vejrø hospitality content case study
- Recipe cadence and content calendar for food brands
- Creator syndication inside food brand content
- Buyer intent content for food brand blogs
- Content refresh cadence on food brand pillars
- Reporting cadence for food brand content marketing
- Internal linking discipline across food brand content
- Wrapping up content marketing for food brands
- Wrapping up content marketing for food brands
- Pillar structure for food brand content marketing
- Vejrø hospitality content case study
- Recipe cadence and content calendar for food brands
- Creator syndication inside food brand content
- Buyer intent content for food brand blogs
- Content refresh cadence on food brand pillars
- Reporting cadence for food brand content marketing
- Internal linking discipline across food brand content
- Wrapping up content marketing for food brands
- Pillar structure for food brand content marketing
- Vejrø hospitality content case study
- Recipe cadence and content calendar for food brands
- Creator syndication inside food brand content
- Buyer intent content for food brand blogs
- Content refresh cadence on food brand pillars
- Reporting cadence for food brand content marketing
- Internal linking discipline across food brand content
- Wrapping up content marketing for food brands
- Wrapping up content marketing for food brands
- Wrapping up content marketing for food brands
- Pillar structure for food brand content marketing
- Vejrø hospitality content case study
- Recipe cadence and content calendar for food brands
- Creator syndication inside food brand content
- Buyer intent content for food brand blogs
- Content refresh cadence on food brand pillars
- Reporting cadence for food brand content marketing
- Internal linking discipline across food brand content
- Wrapping up content marketing for food brands
- Pillar structure for food brand content marketing
- Vejrø hospitality content case study
- Recipe cadence and content calendar for food brands
- Creator syndication inside food brand content
- Buyer intent content for food brand blogs
- Content refresh cadence on food brand pillars
- Reporting cadence for food brand content marketing
- Internal linking discipline across food brand content
- Wrapping up content marketing for food brands
- Pillar structure for food brand content marketing
- Vejrø hospitality content case study
- Recipe cadence and content calendar for food brands
- Creator syndication inside food brand content
- Buyer intent content for food brand blogs
- Content refresh cadence on food brand pillars
- Reporting cadence for food brand content marketing
- Internal linking discipline across food brand content
- Wrapping up content marketing for food brands
- Wrapping up content marketing for food brands
- Pillar structure for food brand content marketing
- Vejrø hospitality content case study
- Recipe cadence and content calendar for food brands
- Creator syndication inside food brand content
- Buyer intent content for food brand blogs
- Content refresh cadence on food brand pillars
- Reporting cadence for food brand content marketing
- Internal linking discipline across food brand content
- Wrapping up content marketing for food brands
- Wrapping up content marketing for food brands
- Pillar structure for food brand content marketing
- Vejrø hospitality content case study
- Recipe cadence and content calendar for food brands
- Creator syndication inside food brand content
- Buyer intent content for food brand blogs
- Content refresh cadence on food brand pillars
- Reporting cadence for food brand content marketing
- Internal linking discipline across food brand content
- Wrapping up content marketing for food brands
- Pillar structure for food brand content marketing
- Vejrø hospitality content case study
- Recipe cadence and content calendar for food brands
- Creator syndication inside food brand content
- Buyer intent content for food brand blogs
- Content refresh cadence on food brand pillars
- Reporting cadence for food brand content marketing
- Internal linking discipline across food brand content
- Wrapping up content marketing for food brands
- Pillar structure for food brand content marketing
- Vejrø hospitality content case study
- Recipe cadence and content calendar for food brands
- Creator syndication inside food brand content
- Buyer intent content for food brand blogs
- Content refresh cadence on food brand pillars
- Reporting cadence for food brand content marketing
- Internal linking discipline across food brand content
- Wrapping up content marketing for food brands
- Wrapping up content marketing for food brands
- Pillar structure for food brand content marketing
- Vejrø hospitality content case study
- Recipe cadence and content calendar for food brands
- Creator syndication inside food brand content
- Buyer intent content for food brand blogs
- Content refresh cadence on food brand pillars
- Reporting cadence for food brand content marketing
- Internal linking discipline across food brand content
- Wrapping up content marketing for food brands
- Pillar structure for food brand content marketing
- Vejrø hospitality content case study
- Recipe cadence and content calendar for food brands
- Creator syndication inside food brand content
- Buyer intent content for food brand blogs
- Content refresh cadence on food brand pillars
- Reporting cadence for food brand content marketing
- Internal linking discipline across food brand content
- Wrapping up content marketing for food brands
- Wrapping up content marketing for food brands
- Pillar structure for food brand content marketing
- Vejrø hospitality content case study
- Recipe cadence and content calendar for food brands
- Creator syndication inside food brand content
- Buyer intent content for food brand blogs
- Content refresh cadence on food brand pillars
- Reporting cadence for food brand content marketing
- Internal linking discipline across food brand content
- Wrapping up content marketing for food brands
- Pillar structure for food brand content marketing
- Vejrø hospitality content case study
- Recipe cadence and content calendar for food brands
- Creator syndication inside food brand content
- Buyer intent content for food brand blogs
- Content refresh cadence on food brand pillars
- Reporting cadence for food brand content marketing
- Internal linking discipline across food brand content
- Wrapping up content marketing for food brands
- Wrapping up content marketing for food brands
- Wrapping up content marketing for food brands
- Pillar structure for food brand content marketing
- Vejrø hospitality content case study
- Recipe cadence and content calendar for food brands
- Creator syndication inside food brand content
- Buyer intent content for food brand blogs
- Content refresh cadence on food brand pillars
- Reporting cadence for food brand content marketing
- Internal linking discipline across food brand content
- Wrapping up content marketing for food brands
- Pillar structure for food brand content marketing
- Vejrø hospitality content case study
- Recipe cadence and content calendar for food brands
- Creator syndication inside food brand content
- Buyer intent content for food brand blogs
- Content refresh cadence on food brand pillars
- Reporting cadence for food brand content marketing
- Internal linking discipline across food brand content
- Wrapping up content marketing for food brands
- Wrapping up content marketing for food brands
- Pillar structure for food brand content marketing
- Vejrø hospitality content case study
- Recipe cadence and content calendar for food brands
- Creator syndication inside food brand content
- Buyer intent content for food brand blogs
- Content refresh cadence on food brand pillars
- Reporting cadence for food brand content marketing
- Internal linking discipline across food brand content
- Wrapping up content marketing for food brands
- Wrapping up content marketing for food brands
- Pillar structure for food brand content marketing
- Vejrø hospitality content case study
- Recipe cadence and content calendar for food brands
- Creator syndication inside food brand content
- Buyer intent content for food brand blogs
- Content refresh cadence on food brand pillars
- Reporting cadence for food brand content marketing
- Internal linking discipline across food brand content
- Wrapping up content marketing for food brands
- Wrapping up content marketing for food brands
- Pillar structure for food brand content marketing
- Vejrø hospitality content case study
- Recipe cadence and content calendar for food brands
- Creator syndication inside food brand content
- Buyer intent content for food brand blogs
- Content refresh cadence on food brand pillars
- Reporting cadence for food brand content marketing
- Internal linking discipline across food brand content
- Wrapping up content marketing for food brands
- Pillar structure for food brand content marketing
- Vejrø hospitality content case study
- Recipe cadence and content calendar for food brands
- Creator syndication inside food brand content
- Buyer intent content for food brand blogs
- Content refresh cadence on food brand pillars
- Reporting cadence for food brand content marketing
- Internal linking discipline across food brand content
- Wrapping up content marketing for food brands
- Pillar structure for food brand content marketing
- Vejrø hospitality content case study
- Recipe cadence and content calendar for food brands
- Creator syndication inside food brand content
- Buyer intent content for food brand blogs
- Content refresh cadence on food brand pillars
- Reporting cadence for food brand content marketing
- Internal linking discipline across food brand content
- Wrapping up content marketing for food brands
- Wrapping up content marketing for food brands
- Pillar structure for food brand content marketing
- Vejrø hospitality content case study
- Recipe cadence and content calendar for food brands
- Creator syndication inside food brand content
- Buyer intent content for food brand blogs
- Content refresh cadence on food brand pillars
- Reporting cadence for food brand content marketing
- Internal linking discipline across food brand content
- Wrapping up content marketing for food brands
- Pillar structure for food brand content marketing
- Vejrø hospitality content case study
- Recipe cadence and content calendar for food brands
- Creator syndication inside food brand content
- Buyer intent content for food brand blogs
- Content refresh cadence on food brand pillars
- Reporting cadence for food brand content marketing
- Internal linking discipline across food brand content
- Wrapping up content marketing for food brands
- Wrapping up content marketing for food brands
- Pillar structure for food brand content marketing
- Vejrø hospitality content case study
- Recipe cadence and content calendar for food brands
- Creator syndication inside food brand content
- Buyer intent content for food brand blogs
- Content refresh cadence on food brand pillars
- Reporting cadence for food brand content marketing
- Internal linking discipline across food brand content
- Wrapping up content marketing for food brands
- Pillar structure for food brand content marketing
- Vejrø hospitality content case study
- Recipe cadence and content calendar for food brands
- Creator syndication inside food brand content
- Buyer intent content for food brand blogs
- Content refresh cadence on food brand pillars
- Reporting cadence for food brand content marketing
- Internal linking discipline across food brand content
- Wrapping up content marketing for food brands
- Wrapping up content marketing for food brands
- Wrapping up content marketing for food brands
- Pillar structure for food brand content marketing
- Vejrø hospitality content case study
- Recipe cadence and content calendar for food brands
- Creator syndication inside food brand content
- Buyer intent content for food brand blogs
- Content refresh cadence on food brand pillars
- Reporting cadence for food brand content marketing
- Internal linking discipline across food brand content
- Wrapping up content marketing for food brands
- Pillar structure for food brand content marketing
- Vejrø hospitality content case study
- Recipe cadence and content calendar for food brands
- Creator syndication inside food brand content
- Buyer intent content for food brand blogs
- Content refresh cadence on food brand pillars
- Reporting cadence for food brand content marketing
- Internal linking discipline across food brand content
- Wrapping up content marketing for food brands
- Pillar structure for food brand content marketing
- Vejrø hospitality content case study
- Recipe cadence and content calendar for food brands
- Creator syndication inside food brand content
- Buyer intent content for food brand blogs
- Content refresh cadence on food brand pillars
- Reporting cadence for food brand content marketing
- Internal linking discipline across food brand content
- Wrapping up content marketing for food brands
- Pillar structure for food brand content marketing
- Vejrø hospitality content case study
- Recipe cadence and content calendar for food brands
- Creator syndication inside food brand content
- Buyer intent content for food brand blogs
- Content refresh cadence on food brand pillars
- Reporting cadence for food brand content marketing
- Internal linking discipline across food brand content
- Wrapping up content marketing for food brands
- Wrapping up content marketing for food brands
- Pillar structure for food brand content marketing
- Vejrø hospitality content case study
- Recipe cadence and content calendar for food brands
- Creator syndication inside food brand content
- Buyer intent content for food brand blogs
- Content refresh cadence on food brand pillars
- Reporting cadence for food brand content marketing
- Internal linking discipline across food brand content
- Wrapping up content marketing for food brands
- Wrapping up content marketing for food brands
- Pillar structure for food brand content marketing
- Vejrø hospitality content case study
- Recipe cadence and content calendar for food brands
- Creator syndication inside food brand content
- Buyer intent content for food brand blogs
- Content refresh cadence on food brand pillars
- Reporting cadence for food brand content marketing
- Internal linking discipline across food brand content
- Wrapping up content marketing for food brands
- Pillar structure for food brand content marketing
- Vejrø hospitality content case study
- Recipe cadence and content calendar for food brands
- Creator syndication inside food brand content
- Buyer intent content for food brand blogs
- Content refresh cadence on food brand pillars
- Reporting cadence for food brand content marketing
- Internal linking discipline across food brand content
- Wrapping up content marketing for food brands
- Pillar structure for food brand content marketing
- Vejrø hospitality content case study
- Recipe cadence and content calendar for food brands
- Creator syndication inside food brand content
- Buyer intent content for food brand blogs
- Content refresh cadence on food brand pillars
- Reporting cadence for food brand content marketing
- Internal linking discipline across food brand content
- Wrapping up content marketing for food brands
- Wrapping up content marketing for food brands
- Pillar structure for food brand content marketing
- Vejrø hospitality content case study
- Recipe cadence and content calendar for food brands
- Creator syndication inside food brand content
- Buyer intent content for food brand blogs
- Content refresh cadence on food brand pillars
- Reporting cadence for food brand content marketing
- Internal linking discipline across food brand content
- Wrapping up content marketing for food brands
- Pillar structure for food brand content marketing
- Vejrø hospitality content case study
- Recipe cadence and content calendar for food brands
- Creator syndication inside food brand content
- Buyer intent content for food brand blogs
- Content refresh cadence on food brand pillars
- Reporting cadence for food brand content marketing
- Internal linking discipline across food brand content
- Wrapping up content marketing for food brands
- Wrapping up content marketing for food brands
- Pillar structure for food brand content marketing
- Vejrø hospitality content case study
- Recipe cadence and content calendar for food brands
- Creator syndication inside food brand content
- Buyer intent content for food brand blogs
- Content refresh cadence on food brand pillars
- Reporting cadence for food brand content marketing
- Internal linking discipline across food brand content
- Wrapping up content marketing for food brands
- Pillar structure for food brand content marketing
- Vejrø hospitality content case study
- Recipe cadence and content calendar for food brands
- Creator syndication inside food brand content
- Buyer intent content for food brand blogs
- Content refresh cadence on food brand pillars
- Reporting cadence for food brand content marketing
- Internal linking discipline across food brand content
- Wrapping up content marketing for food brands
- Wrapping up content marketing for food brands
- Wrapping up content marketing for food brands
- Pillar structure for food brand content marketing
- Vejrø hospitality content case study
- Recipe cadence and content calendar for food brands
- Creator syndication inside food brand content
- Buyer intent content for food brand blogs
- Content refresh cadence on food brand pillars
- Reporting cadence for food brand content marketing
- Internal linking discipline across food brand content
- Wrapping up content marketing for food brands
- Pillar structure for food brand content marketing
- Vejrø hospitality content case study
- Recipe cadence and content calendar for food brands
- Creator syndication inside food brand content
- Buyer intent content for food brand blogs
- Content refresh cadence on food brand pillars
- Reporting cadence for food brand content marketing
- Internal linking discipline across food brand content
- Wrapping up content marketing for food brands
- Wrapping up content marketing for food brands
- Pillar structure for food brand content marketing
- Vejrø hospitality content case study
- Recipe cadence and content calendar for food brands
- Creator syndication inside food brand content
- Buyer intent content for food brand blogs
- Content refresh cadence on food brand pillars
- Reporting cadence for food brand content marketing
- Internal linking discipline across food brand content
- Wrapping up content marketing for food brands
- Pillar structure for food brand content marketing
- Vejrø hospitality content case study
- Recipe cadence and content calendar for food brands
- Creator syndication inside food brand content
- Buyer intent content for food brand blogs
- Content refresh cadence on food brand pillars
- Reporting cadence for food brand content marketing
- Internal linking discipline across food brand content
- Wrapping up content marketing for food brands
- Wrapping up content marketing for food brands
- Pillar structure for food brand content marketing
- Vejrø hospitality content case study
- Recipe cadence and content calendar for food brands
- Creator syndication inside food brand content
- Buyer intent content for food brand blogs
- Content refresh cadence on food brand pillars
- Reporting cadence for food brand content marketing
- Internal linking discipline across food brand content
- Wrapping up content marketing for food brands
- Wrapping up content marketing for food brands
- Pillar structure for food brand content marketing
- Vejrø hospitality content case study
- Recipe cadence and content calendar for food brands
- Creator syndication inside food brand content
- Buyer intent content for food brand blogs
- Content refresh cadence on food brand pillars
- Reporting cadence for food brand content marketing
- Internal linking discipline across food brand content
- Wrapping up content marketing for food brands
- Pillar structure for food brand content marketing
- Vejrø hospitality content case study
- Recipe cadence and content calendar for food brands
- Creator syndication inside food brand content
- Buyer intent content for food brand blogs
- Content refresh cadence on food brand pillars
- Reporting cadence for food brand content marketing
- Internal linking discipline across food brand content
- Wrapping up content marketing for food brands
- Pillar structure for food brand content marketing
- Vejrø hospitality content case study
- Recipe cadence and content calendar for food brands
- Creator syndication inside food brand content
- Buyer intent content for food brand blogs
- Content refresh cadence on food brand pillars
- Reporting cadence for food brand content marketing
- Internal linking discipline across food brand content
- Wrapping up content marketing for food brands
- Wrapping up content marketing for food brands
- Pillar structure for food brand content marketing
- Vejrø hospitality content case study
- Recipe cadence and content calendar for food brands
- Creator syndication inside food brand content
- Buyer intent content for food brand blogs
- Content refresh cadence on food brand pillars
- Reporting cadence for food brand content marketing
- Internal linking discipline across food brand content
- Wrapping up content marketing for food brands
- Pillar structure for food brand content marketing
- Vejrø hospitality content case study
- Recipe cadence and content calendar for food brands
- Creator syndication inside food brand content
- Buyer intent content for food brand blogs
- Content refresh cadence on food brand pillars
- Reporting cadence for food brand content marketing
- Internal linking discipline across food brand content
- Wrapping up content marketing for food brands
- Wrapping up content marketing for food brands
- Pillar structure for food brand content marketing
- Vejrø hospitality content case study
- Recipe cadence and content calendar for food brands
- Creator syndication inside food brand content
- Buyer intent content for food brand blogs
- Content refresh cadence on food brand pillars
- Reporting cadence for food brand content marketing
- Internal linking discipline across food brand content
- Wrapping up content marketing for food brands
- Pillar structure for food brand content marketing
- Vejrø hospitality content case study
- Recipe cadence and content calendar for food brands
- Creator syndication inside food brand content
- Buyer intent content for food brand blogs
- Content refresh cadence on food brand pillars
- Reporting cadence for food brand content marketing
- Internal linking discipline across food brand content
- Wrapping up content marketing for food brands
- Wrapping up content marketing for food brands
- Wrapping up content marketing for food brands
- Pillar structure for food brand content marketing
- Vejrø hospitality content case study
- Recipe cadence and content calendar for food brands
- Creator syndication inside food brand content
- Buyer intent content for food brand blogs
- Content refresh cadence on food brand pillars
- Reporting cadence for food brand content marketing
- Internal linking discipline across food brand content
- Wrapping up content marketing for food brands
- Pillar structure for food brand content marketing
- Vejrø hospitality content case study
- Recipe cadence and content calendar for food brands
- Creator syndication inside food brand content
- Buyer intent content for food brand blogs
- Content refresh cadence on food brand pillars
- Reporting cadence for food brand content marketing
- Internal linking discipline across food brand content
- Wrapping up content marketing for food brands
- Why content marketing for food brands is a recipe hub first
- Wrapping up content marketing for food brands
- Wrapping up content marketing for food brands
- Wrapping up content marketing for food brands
- Pillar structure for food brand content marketing
- Vejrø hospitality content case study
- Recipe cadence and content calendar for food brands
- Creator syndication inside food brand content
- Buyer intent content for food brand blogs
- Content refresh cadence on food brand pillars
- Reporting cadence for food brand content marketing
- Internal linking discipline across food brand content
- Wrapping up content marketing for food brands
- Pillar structure for food brand content marketing
- Vejrø hospitality content case study
- Recipe cadence and content calendar for food brands
- Creator syndication inside food brand content
- Buyer intent content for food brand blogs
- Content refresh cadence on food brand pillars
- Reporting cadence for food brand content marketing
- Internal linking discipline across food brand content
- Wrapping up content marketing for food brands
- Wrapping up content marketing for food brands
- Pillar structure for food brand content marketing
- Vejrø hospitality content case study
- Recipe cadence and content calendar for food brands
- Creator syndication inside food brand content
- Buyer intent content for food brand blogs
- Content refresh cadence on food brand pillars
- Reporting cadence for food brand content marketing
- Internal linking discipline across food brand content
- Wrapping up content marketing for food brands
- Wrapping up content marketing for food brands
- Pillar structure for food brand content marketing
- Vejrø hospitality content case study
- Recipe cadence and content calendar for food brands
- Creator syndication inside food brand content
- Buyer intent content for food brand blogs
- Content refresh cadence on food brand pillars
- Reporting cadence for food brand content marketing
- Internal linking discipline across food brand content
- Wrapping up content marketing for food brands
- Pillar structure for food brand content marketing
- Vejrø hospitality content case study
- Recipe cadence and content calendar for food brands
- Creator syndication inside food brand content
- Buyer intent content for food brand blogs
- Content refresh cadence on food brand pillars
- Reporting cadence for food brand content marketing
- Internal linking discipline across food brand content
- Wrapping up content marketing for food brands
- Pillar structure for food brand content marketing
- Vejrø hospitality content case study
- Recipe cadence and content calendar for food brands
- Creator syndication inside food brand content
- Buyer intent content for food brand blogs
- Content refresh cadence on food brand pillars
- Reporting cadence for food brand content marketing
- Internal linking discipline across food brand content
- Wrapping up content marketing for food brands
- Wrapping up content marketing for food brands
- Pillar structure for food brand content marketing
- Vejrø hospitality content case study
- Recipe cadence and content calendar for food brands
- Creator syndication inside food brand content
- Buyer intent content for food brand blogs
- Content refresh cadence on food brand pillars
- Reporting cadence for food brand content marketing
- Internal linking discipline across food brand content
- Wrapping up content marketing for food brands
- Pillar structure for food brand content marketing
- Vejrø hospitality content case study
- Recipe cadence and content calendar for food brands
- Creator syndication inside food brand content
- Buyer intent content for food brand blogs
- Content refresh cadence on food brand pillars
- Reporting cadence for food brand content marketing
- Internal linking discipline across food brand content
- Wrapping up content marketing for food brands
- Wrapping up content marketing for food brands
- Pillar structure for food brand content marketing
- Vejrø hospitality content case study
- Recipe cadence and content calendar for food brands
- Creator syndication inside food brand content
- Buyer intent content for food brand blogs
- Content refresh cadence on food brand pillars
- Reporting cadence for food brand content marketing
- Internal linking discipline across food brand content
- Wrapping up content marketing for food brands
- Pillar structure for food brand content marketing
- Vejrø hospitality content case study
- Recipe cadence and content calendar for food brands
- Creator syndication inside food brand content
- Buyer intent content for food brand blogs
- Content refresh cadence on food brand pillars
- Reporting cadence for food brand content marketing
- Internal linking discipline across food brand content
- Wrapping up content marketing for food brands
- Wrapping up content marketing for food brands
- Wrapping up content marketing for food brands
- Pillar structure for food brand content marketing
- Vejrø hospitality content case study
- Recipe cadence and content calendar for food brands
- Creator syndication inside food brand content
- Buyer intent content for food brand blogs
- Content refresh cadence on food brand pillars
- Reporting cadence for food brand content marketing
- Internal linking discipline across food brand content
- Wrapping up content marketing for food brands
- Pillar structure for food brand content marketing
- Vejrø hospitality content case study
- Recipe cadence and content calendar for food brands
- Creator syndication inside food brand content
- Buyer intent content for food brand blogs
- Content refresh cadence on food brand pillars
- Reporting cadence for food brand content marketing
- Internal linking discipline across food brand content
- Wrapping up content marketing for food brands
Skip the recipe hub and the brand loses the search real estate that pulls DTC storefront traffic month over month at zero incremental paid cost. Recipe traffic converts at 2 to 4 percent because the shopper landed with usage intent, not passive discovery, which is why food brands win on recipes.
Recipe schema and Google rich result eligibility
Every recipe page ships schema.org Recipe markup including cookTime, prepTime, recipeIngredient, recipeInstructions, nutrition, and aggregateRating. Correctly marked-up recipes qualify for Google’s recipe rich result carousel that pulls 3 to 6 times higher click-through rate than a plain blue link. The schema layer takes 15 minutes per recipe to author and 30 minutes to validate in Google Search Console. Cross-reference the recipe search stack on our food and beverage SEO page.
Recipe hub structure that scales
The recipe hub structure runs 40 to 100 recipes at maturity, organized by hero SKU (4 to 12 recipes per SKU) plus occasion tags (breakfast, weeknight dinner, meal prep, brunch, holiday). Every recipe links back to the hero SKU product page with the SKU embedded in an inline card. The hub earns internal linking value from ingredient comparison guides and the sourcing story pages, which feeds recipe ranking on Google. According to Google Search Central recipe structured data guidance, complete Recipe schema markup is required for eligibility in the recipe carousel and the ingredient search filter.
Pillar structure for food brand content marketing
The pillar structure on content marketing for food brands runs 4 content pillars concurrently: recipe hub (40 to 100 recipes), ingredient comparison guides (12 to 24 guides), sourcing story pages (6 to 12 pages), and buyer intent content (where to buy, subscription vs. one-time, gift bundle guides). Every pillar covers a distinct search intent and every pillar links back to the hero SKU product pages.
Ingredient comparison guide format
Ingredient comparison guides run 1,800 to 3,200 words comparing 2 to 4 ingredient types on 6 to 10 attributes with a comparison table, real-world use case examples, and links to the hero SKU that uses the specific ingredient. Example: organic vs. conventional oats compares nutritional profile, sourcing chain, cost, environmental impact, and taste on a 6-column table. The brand’s SKU appears in the winning column with a product card. These guides rank 3 to 8 months after publication and pull steady-state organic traffic.
Sourcing story pages that build trust
Sourcing story pages name the specific farms, cooperatives, or suppliers the brand sources from, with photos of the farms, farmer quotes, and specific harvest windows. A coffee brand’s Ethiopian farm page ranks for “single-origin Ethiopian coffee” and “Yirgacheffe coffee origin” plus 40 long-tail variations. The sourcing page pulls trust-building traffic that converts at 4 to 6 percent because the shopper landed pattern-matching on transparency and named provenance. Every sourcing page includes farmer or cooperative quotes, harvest dates, and a link back to 3 to 5 hero SKU pages that source from the named supplier.
Vejrø hospitality content case study
Vejrø Resort, a Danish private-island destination with an on-site restaurant focused on organic, locally sourced cuisine, joined us with strong social engagement and no organic-search real estate. Guests found the resort on Instagram but never in Google search for terms like “private island resort Denmark,” “farm-to-table hospitality Denmark,” or “Vejrø restaurant.” The same organic-search gap shows up on DTC food brands running paid social at 20,000 dollars monthly with a broken blog and zero recipe schema.
We built the conversion-focused website with on-site and off-site SEO tuned to the travel-niche keyword clusters, competitor analysis against comparable boutique resorts, and mobile-first design prioritizing guest discovery. Every page carried the structured data qualifying it for Google’s rich results in the hospitality category. Every internal link pushed authority toward the direct-booking conversion path.
Three months later, Vejrø hit 10,000 plus organic visitors, ranked for 200 plus first-page keywords, and pulled a 2.2 percent booking conversion rate from organic traffic. The same pattern applies to content marketing for food brands: recipe schema, ingredient comparison guides, and sourcing story pages pull organic traffic at 20 to 40 percent conversion into hero SKU pages inside 6 months when the content quality matches search intent and every page carries the right structured data markup. Vejrø also proved out the reporting discipline: every monthly report named the exact page, the exact keyword cluster, and the exact search feature (rich result, sitelinks, image pack) driving the incremental organic revenue instead of hiding behind aggregate traffic charts.
Recipe cadence and content calendar for food brands
Recipe cadence on a working food brand content calendar ships 2 to 4 new recipes per week during the first 6 months and drops to 1 per week at maturity. Each recipe takes 4 to 6 hours to produce (write, test in the kitchen, photograph, schema author, publish). At 3 recipes per week, the brand hits 78 recipes inside 6 months plus a backlog of ingredient comparison and sourcing content queued behind the recipe production line.
| Content pillar | Target volume year 1 | Production cost per piece | Refresh cadence |
|---|---|---|---|
| Recipe hub | 40 to 100 recipes | $180 to $320 | Every 12 months |
| Ingredient comparison guides | 12 to 24 guides | $450 to $780 | Every 18 months |
| Sourcing story pages | 6 to 12 pages | $680 to $1,200 | Every 24 months |
| Buyer intent content | 8 to 16 pieces | $220 to $420 | Every 12 months |
Photography as a content calendar constraint
Photography is the actual constraint on recipe cadence, not writing. Every recipe needs 6 to 12 photos: hero shot, ingredient flat lay, prep in progress, plated result, storage, and step shots for the schema markup. A working food brand batches photography 8 recipes at a time to keep the cost per recipe under 200 dollars. Skip the batching and the per-recipe cost climbs to 400 to 600 dollars, which caps recipe cadence at 1 per week and slows organic ranking timeline by 6 months.
Seasonal content calendar planning
Seasonal content calendar planning maps recipes and comparison guides to the seasonal windows they need to rank in. A Christmas cookie recipe needs to publish in September to rank by early December. A Valentine’s chocolate guide needs to publish in November to rank by early February. A back-to-school lunchbox recipe needs to publish in June to rank by late August. The 60-to-90-day ranking curve dictates the calendar.
Recipe traffic without SKU links is publishing not selling. Audit your top 10 recipes. If they don't embed a product card for the hero ingredient, that's your edit list.
Creator syndication inside food brand content
Creator syndication on food brand content marketing amplifies the recipe hub through Instagram Reels, TikTok, and YouTube Shorts creators paid to post their own version of the brand’s hero recipes. The creator content pulls net-new audiences into the recipe hub through the creator’s Link in Bio or Amazon Storefront tag. The syndication calendar names 12 to 30 creators per quarter with specific recipes assigned to each.
One brand we picked up had a spreadsheet titled “creator outreach 2023” with 47 rows and 3 responses. All 3 responses were auto-replies. The spreadsheet named zero recipes and offered flat rates below 100 dollars per post. Nobody posts a 30-second video for 87 dollars flat. Nobody.
Creator content commercial terms that work
Working creator content commercial terms run 350 to 1,500 dollars flat per post plus a 12 to 25 percent commission on tagged sales across a 30-day window. The commission mechanic pulls creators into follow-up posts because the incremental revenue continues past the initial fee. Mid-tier creators (30k to 150k followers) hit the sweet spot for food brand content because their engagement rate typically runs 4 to 8 percent versus 0.8 to 1.6 percent on mega-creators.
Content brief structure for creator partnerships
The content brief structure for creator partnerships runs a single page: the SKU, the specific recipe or usage occasion, 3 required brand mentions, 3 restricted claims (no health claims on non-medical SKUs), the pricing angle, the affiliate link, and 3 example videos that hit the tone. The brief avoids over-scripting because over-scripted creator content underperforms native creator voice by 40 to 60 percent on engagement rate.
Buyer intent content for food brand blogs
Buyer intent content on food brand blogs covers 8 to 16 pieces targeting explicit purchase-decision queries: “where to buy [brand],” “[brand] subscription vs. one-time,” “best [category] for [use case],” and “[brand] gift bundle.” Every buyer intent piece runs 1,400 to 2,400 words with a comparison table, product cards, and a clear conversion path to the specific SKU that matches the query intent. Buyer intent content converts at 3 to 6 percent versus 1 to 2 percent on recipe content because the shopper landed already planning to buy, not exploring a usage occasion.
Where-to-buy content structure
Where-to-buy content structure covers online (DTC storefront, Amazon, Target.com, Whole Foods online), retail (specific chain locators with the store finder embedded), and international (customs limitations, retailer partners abroad). Every piece names specific retailers, links to the store locator, and includes an FAQ block covering shipping availability, subscription options, and gift card compatibility. Where-to-buy content ranks for branded discovery queries the DTC storefront otherwise loses to competitor affiliate reviews.
Subscription versus one-time comparison content
Subscription versus one-time comparison content converts subscription commitments at 3 to 6 percent because it addresses the price-sensitivity concern head-on with a specific math table. The piece covers the discount structure (15 percent lifetime), the skip-a-month mechanic, the pause-anytime rule, the cancellation policy, and the specific yearly savings for the brand’s average consumption cadence. Cross-reference the retention structure on our food and beverage marketing retainer page.
Content refresh cadence on food brand pillars
Content refresh cadence on food brand content pillars runs a rolling audit every 12 to 24 months by pillar. Recipes get refreshed every 12 months with new photography, updated schema, and any nutrition or ingredient adjustments. Ingredient comparison guides refresh every 18 months to update market data. Sourcing story pages refresh every 24 months to reflect farm partnership changes and new harvest angles. Buyer intent content refreshes every 12 months to update retailer availability and pricing.
Recipe refresh priority order
Recipe refresh priority runs by organic traffic rank. The top 20 recipes by monthly organic sessions get refreshed first (new photography, schema audit, related recipe internal links, updated nutrition). The next 40 get refreshed at 15 months. The remaining recipes get refreshed opportunistically when the ranking slips past position 15 in Google. Skipping the refresh cadence lets recipe rankings drift out of the top 3 inside 18 months as newer competitor recipes take the position.
Schema audit checklist per refresh
The schema audit checklist per refresh runs 8 items: Recipe schema completeness, aggregateRating count and accuracy, nutrition data accuracy, prepTime and cookTime match the recipe body, image URLs valid at CDN, related recipe internal links working, product card SKU URL live, and Google Search Console rich result eligibility validated. This checklist takes 20 minutes per recipe and prevents the schema drift that costs recipe rankings 20 to 40 positions quietly.
Reporting cadence for food brand content marketing
Reporting cadence on food brand content marketing runs a monthly executive report plus a quarterly business review. The monthly report ships in the first business week and covers organic sessions by pillar, top 10 ranking recipes with position trend, ingredient guide ranking movements, sourcing page performance, and organic-attributed DTC revenue. Every number carries a comparison to the prior month and a plain-language interpretation the founder reads in 7 minutes.
Metrics that matter for content marketing
Metrics that matter for food brand content marketing: organic sessions by pillar, recipe rich result impressions in Search Console, organic conversion rate to hero SKU pages, organic-attributed DTC revenue, and top 20 ranking positions by monthly organic sessions. Vanity metrics that do not matter: total pageviews without conversion context, average time on page without conversion attribution, and social share counts. The monthly report skips the vanity block entirely.
Quarterly business review structure
The quarterly business review runs 90 minutes with the founder, head of content, and SEO lead. Agenda: organic traffic trend by pillar, top 10 winning content pieces, top 10 losing content pieces (candidates for refresh or removal), competitive gap analysis against 5 named competitor brands, and next quarter’s content calendar with recipes and ingredient guides queued. According to Ahrefs content marketing research, brands running quarterly content audits outperform brands running annual audits by 40 to 70 percent on organic revenue over a 24-month window.
Internal linking discipline across food brand content
Internal linking discipline across food brand content moves authority from recipe pages toward hero SKU product pages and comparison guides. Every recipe links to the hero SKU it uses inline (once in the ingredient list, once in a bottom call-out card). Every ingredient comparison guide links to 3 to 6 recipes using the winning ingredient plus the hero SKU product page. Every sourcing story links to the 2 to 4 SKUs sourced from that specific farm or cooperative.
Anchor text strategy across recipe hubs
Anchor text on internal links varies across recipe hubs to avoid over-optimization patterns Google penalizes. Exact-match anchor (“single-origin Ethiopian coffee”) runs on 20 to 30 percent of internal links. Partial-match variations (“our Ethiopian roast”) run on 30 to 40 percent. Branded anchors (the SKU name) run on 20 to 30 percent. Generic anchors (“shop the coffee”) fill the remaining 10 to 20 percent. This ratio holds ranking without triggering the over-optimization penalty that shows up on brands that anchor-text-stuff every internal link with the same exact-match keyword. Cross-reference the linking layer on our food and beverage web design page.
Link equity from ingredient guides to SKU pages
Link equity from ingredient guides passes to SKU pages when the guide’s comparison table names the hero SKU in the winning column with a product card, and when the guide’s body links to 3 to 6 recipes that use the winning ingredient. This 3-hop path (guide to recipe to SKU) pushes authority from a high-traffic informational query down to a high-intent transactional page. According to Search Engine Land SEO coverage, informational content that internally links to transactional pages produces 2 to 4 times higher organic revenue than isolated content silos.
Wrapping up content marketing for food brands
Content marketing for food brands is the organic engine that turns a DTC snack, drink, or CPG storefront into a search-driven revenue channel. Recipe hub of 40 to 100 recipes. Ingredient comparison guides at 12 to 24 pieces. Sourcing story pages at 6 to 12 pieces. Buyer intent content at 8 to 16 pieces. Creator syndication calendar with 12 to 30 creators per quarter. Refresh cadence at 12 to 24 months by pillar. Reporting with organic sessions and organic revenue attribution.
If your DTC food brand is running paid social at 20,000 dollars monthly with a broken blog and zero recipe schema, professional content marketing for food brands pays for itself inside the first 90 days on organic traffic captured. Redefine Web ships content marketing inside our monthly retainer packages. Book a call and we will walk through the last three DTC food brands we built recipe hubs for, pillar by pillar.
Content marketing for food brands starts with a recipe hub because recipe queries account for 40 to 60 percent of high-intent search volume in the food category. Every hero SKU needs 4 to 12 recipes anchored to it, each targeting a specific occasion and audience.
Skip the recipe hub and the brand loses the search real estate that pulls DTC storefront traffic month over month at zero incremental paid cost. Recipe traffic converts at 2 to 4 percent because the shopper landed with usage intent, not passive discovery, which is why food brands win on recipes.
Recipe schema and Google rich result eligibility
Every recipe page ships schema.org Recipe markup including cookTime, prepTime, recipeIngredient, recipeInstructions, nutrition, and aggregateRating. Correctly marked-up recipes qualify for Google’s recipe rich result carousel that pulls 3 to 6 times higher click-through rate than a plain blue link. The schema layer takes 15 minutes per recipe to author and 30 minutes to validate in Google Search Console. Cross-reference the recipe search stack on our food and beverage SEO page.
Recipe hub structure that scales
The recipe hub structure runs 40 to 100 recipes at maturity, organized by hero SKU (4 to 12 recipes per SKU) plus occasion tags (breakfast, weeknight dinner, meal prep, brunch, holiday). Every recipe links back to the hero SKU product page with the SKU embedded in an inline card. The hub earns internal linking value from ingredient comparison guides and the sourcing story pages, which feeds recipe ranking on Google. According to Google Search Central recipe structured data guidance, complete Recipe schema markup is required for eligibility in the recipe carousel and the ingredient search filter.
Pillar structure for food brand content marketing
The pillar structure on content marketing for food brands runs 4 content pillars concurrently: recipe hub (40 to 100 recipes), ingredient comparison guides (12 to 24 guides), sourcing story pages (6 to 12 pages), and buyer intent content (where to buy, subscription vs. one-time, gift bundle guides). Every pillar covers a distinct search intent and every pillar links back to the hero SKU product pages.
Ingredient comparison guide format
Ingredient comparison guides run 1,800 to 3,200 words comparing 2 to 4 ingredient types on 6 to 10 attributes with a comparison table, real-world use case examples, and links to the hero SKU that uses the specific ingredient. Example: organic vs. conventional oats compares nutritional profile, sourcing chain, cost, environmental impact, and taste on a 6-column table. The brand’s SKU appears in the winning column with a product card. These guides rank 3 to 8 months after publication and pull steady-state organic traffic.
Sourcing story pages that build trust
Sourcing story pages name the specific farms, cooperatives, or suppliers the brand sources from, with photos of the farms, farmer quotes, and specific harvest windows. A coffee brand’s Ethiopian farm page ranks for “single-origin Ethiopian coffee” and “Yirgacheffe coffee origin” plus 40 long-tail variations. The sourcing page pulls trust-building traffic that converts at 4 to 6 percent because the shopper landed pattern-matching on transparency and named provenance. Every sourcing page includes farmer or cooperative quotes, harvest dates, and a link back to 3 to 5 hero SKU pages that source from the named supplier.
Vejrø hospitality content case study
Vejrø Resort, a Danish private-island destination with an on-site restaurant focused on organic, locally sourced cuisine, joined us with strong social engagement and no organic-search real estate. Guests found the resort on Instagram but never in Google search for terms like “private island resort Denmark,” “farm-to-table hospitality Denmark,” or “Vejrø restaurant.” The same organic-search gap shows up on DTC food brands running paid social at 20,000 dollars monthly with a broken blog and zero recipe schema.
We built the conversion-focused website with on-site and off-site SEO tuned to the travel-niche keyword clusters, competitor analysis against comparable boutique resorts, and mobile-first design prioritizing guest discovery. Every page carried the structured data qualifying it for Google’s rich results in the hospitality category. Every internal link pushed authority toward the direct-booking conversion path.
Three months later, Vejrø hit 10,000 plus organic visitors, ranked for 200 plus first-page keywords, and pulled a 2.2 percent booking conversion rate from organic traffic. The same pattern applies to content marketing for food brands: recipe schema, ingredient comparison guides, and sourcing story pages pull organic traffic at 20 to 40 percent conversion into hero SKU pages inside 6 months when the content quality matches search intent and every page carries the right structured data markup. Vejrø also proved out the reporting discipline: every monthly report named the exact page, the exact keyword cluster, and the exact search feature (rich result, sitelinks, image pack) driving the incremental organic revenue instead of hiding behind aggregate traffic charts.
Recipe cadence and content calendar for food brands
Recipe cadence on a working food brand content calendar ships 2 to 4 new recipes per week during the first 6 months and drops to 1 per week at maturity. Each recipe takes 4 to 6 hours to produce (write, test in the kitchen, photograph, schema author, publish). At 3 recipes per week, the brand hits 78 recipes inside 6 months plus a backlog of ingredient comparison and sourcing content queued behind the recipe production line.
| Content pillar | Target volume year 1 | Production cost per piece | Refresh cadence |
|---|---|---|---|
| Recipe hub | 40 to 100 recipes | $180 to $320 | Every 12 months |
| Ingredient comparison guides | 12 to 24 guides | $450 to $780 | Every 18 months |
| Sourcing story pages | 6 to 12 pages | $680 to $1,200 | Every 24 months |
| Buyer intent content | 8 to 16 pieces | $220 to $420 | Every 12 months |
Photography as a content calendar constraint
Photography is the actual constraint on recipe cadence, not writing. Every recipe needs 6 to 12 photos: hero shot, ingredient flat lay, prep in progress, plated result, storage, and step shots for the schema markup. A working food brand batches photography 8 recipes at a time to keep the cost per recipe under 200 dollars. Skip the batching and the per-recipe cost climbs to 400 to 600 dollars, which caps recipe cadence at 1 per week and slows organic ranking timeline by 6 months.
Seasonal content calendar planning
Seasonal content calendar planning maps recipes and comparison guides to the seasonal windows they need to rank in. A Christmas cookie recipe needs to publish in September to rank by early December. A Valentine’s chocolate guide needs to publish in November to rank by early February. A back-to-school lunchbox recipe needs to publish in June to rank by late August. The 60-to-90-day ranking curve dictates the calendar.
Creator syndication inside food brand content
Creator syndication on food brand content marketing amplifies the recipe hub through Instagram Reels, TikTok, and YouTube Shorts creators paid to post their own version of the brand’s hero recipes. The creator content pulls net-new audiences into the recipe hub through the creator’s Link in Bio or Amazon Storefront tag. The syndication calendar names 12 to 30 creators per quarter with specific recipes assigned to each.
One brand we picked up had a spreadsheet titled “creator outreach 2023” with 47 rows and 3 responses. All 3 responses were auto-replies. The spreadsheet named zero recipes and offered flat rates below 100 dollars per post. Nobody posts a 30-second video for 87 dollars flat. Nobody.
Creator content commercial terms that work
Working creator content commercial terms run 350 to 1,500 dollars flat per post plus a 12 to 25 percent commission on tagged sales across a 30-day window. The commission mechanic pulls creators into follow-up posts because the incremental revenue continues past the initial fee. Mid-tier creators (30k to 150k followers) hit the sweet spot for food brand content because their engagement rate typically runs 4 to 8 percent versus 0.8 to 1.6 percent on mega-creators.
Content brief structure for creator partnerships
The content brief structure for creator partnerships runs a single page: the SKU, the specific recipe or usage occasion, 3 required brand mentions, 3 restricted claims (no health claims on non-medical SKUs), the pricing angle, the affiliate link, and 3 example videos that hit the tone. The brief avoids over-scripting because over-scripted creator content underperforms native creator voice by 40 to 60 percent on engagement rate.
Buyer intent content for food brand blogs
Buyer intent content on food brand blogs covers 8 to 16 pieces targeting explicit purchase-decision queries: “where to buy [brand],” “[brand] subscription vs. one-time,” “best [category] for [use case],” and “[brand] gift bundle.” Every buyer intent piece runs 1,400 to 2,400 words with a comparison table, product cards, and a clear conversion path to the specific SKU that matches the query intent. Buyer intent content converts at 3 to 6 percent versus 1 to 2 percent on recipe content because the shopper landed already planning to buy, not exploring a usage occasion.
Where-to-buy content structure
Where-to-buy content structure covers online (DTC storefront, Amazon, Target.com, Whole Foods online), retail (specific chain locators with the store finder embedded), and international (customs limitations, retailer partners abroad). Every piece names specific retailers, links to the store locator, and includes an FAQ block covering shipping availability, subscription options, and gift card compatibility. Where-to-buy content ranks for branded discovery queries the DTC storefront otherwise loses to competitor affiliate reviews.
Subscription versus one-time comparison content
Subscription versus one-time comparison content converts subscription commitments at 3 to 6 percent because it addresses the price-sensitivity concern head-on with a specific math table. The piece covers the discount structure (15 percent lifetime), the skip-a-month mechanic, the pause-anytime rule, the cancellation policy, and the specific yearly savings for the brand’s average consumption cadence. Cross-reference the retention structure on our food and beverage marketing retainer page.
Content refresh cadence on food brand pillars
Content refresh cadence on food brand content pillars runs a rolling audit every 12 to 24 months by pillar. Recipes get refreshed every 12 months with new photography, updated schema, and any nutrition or ingredient adjustments. Ingredient comparison guides refresh every 18 months to update market data. Sourcing story pages refresh every 24 months to reflect farm partnership changes and new harvest angles. Buyer intent content refreshes every 12 months to update retailer availability and pricing.
Recipe refresh priority order
Recipe refresh priority runs by organic traffic rank. The top 20 recipes by monthly organic sessions get refreshed first (new photography, schema audit, related recipe internal links, updated nutrition). The next 40 get refreshed at 15 months. The remaining recipes get refreshed opportunistically when the ranking slips past position 15 in Google. Skipping the refresh cadence lets recipe rankings drift out of the top 3 inside 18 months as newer competitor recipes take the position.
Schema audit checklist per refresh
The schema audit checklist per refresh runs 8 items: Recipe schema completeness, aggregateRating count and accuracy, nutrition data accuracy, prepTime and cookTime match the recipe body, image URLs valid at CDN, related recipe internal links working, product card SKU URL live, and Google Search Console rich result eligibility validated. This checklist takes 20 minutes per recipe and prevents the schema drift that costs recipe rankings 20 to 40 positions quietly.
Reporting cadence for food brand content marketing
Reporting cadence on food brand content marketing runs a monthly executive report plus a quarterly business review. The monthly report ships in the first business week and covers organic sessions by pillar, top 10 ranking recipes with position trend, ingredient guide ranking movements, sourcing page performance, and organic-attributed DTC revenue. Every number carries a comparison to the prior month and a plain-language interpretation the founder reads in 7 minutes.
Metrics that matter for content marketing
Metrics that matter for food brand content marketing: organic sessions by pillar, recipe rich result impressions in Search Console, organic conversion rate to hero SKU pages, organic-attributed DTC revenue, and top 20 ranking positions by monthly organic sessions. Vanity metrics that do not matter: total pageviews without conversion context, average time on page without conversion attribution, and social share counts. The monthly report skips the vanity block entirely.
Quarterly business review structure
The quarterly business review runs 90 minutes with the founder, head of content, and SEO lead. Agenda: organic traffic trend by pillar, top 10 winning content pieces, top 10 losing content pieces (candidates for refresh or removal), competitive gap analysis against 5 named competitor brands, and next quarter’s content calendar with recipes and ingredient guides queued. According to Ahrefs content marketing research, brands running quarterly content audits outperform brands running annual audits by 40 to 70 percent on organic revenue over a 24-month window.
Internal linking discipline across food brand content
Internal linking discipline across food brand content moves authority from recipe pages toward hero SKU product pages and comparison guides. Every recipe links to the hero SKU it uses inline (once in the ingredient list, once in a bottom call-out card). Every ingredient comparison guide links to 3 to 6 recipes using the winning ingredient plus the hero SKU product page. Every sourcing story links to the 2 to 4 SKUs sourced from that specific farm or cooperative.
Anchor text strategy across recipe hubs
Anchor text on internal links varies across recipe hubs to avoid over-optimization patterns Google penalizes. Exact-match anchor (“single-origin Ethiopian coffee”) runs on 20 to 30 percent of internal links. Partial-match variations (“our Ethiopian roast”) run on 30 to 40 percent. Branded anchors (the SKU name) run on 20 to 30 percent. Generic anchors (“shop the coffee”) fill the remaining 10 to 20 percent. This ratio holds ranking without triggering the over-optimization penalty that shows up on brands that anchor-text-stuff every internal link with the same exact-match keyword. Cross-reference the linking layer on our food and beverage web design page.
Link equity from ingredient guides to SKU pages
Link equity from ingredient guides passes to SKU pages when the guide’s comparison table names the hero SKU in the winning column with a product card, and when the guide’s body links to 3 to 6 recipes that use the winning ingredient. This 3-hop path (guide to recipe to SKU) pushes authority from a high-traffic informational query down to a high-intent transactional page. According to Search Engine Land SEO coverage, informational content that internally links to transactional pages produces 2 to 4 times higher organic revenue than isolated content silos.
Wrapping up content marketing for food brands
Content marketing for food brands is the organic engine that turns a DTC snack, drink, or CPG storefront into a search-driven revenue channel. Recipe hub of 40 to 100 recipes. Ingredient comparison guides at 12 to 24 pieces. Sourcing story pages at 6 to 12 pieces. Buyer intent content at 8 to 16 pieces. Creator syndication calendar with 12 to 30 creators per quarter. Refresh cadence at 12 to 24 months by pillar. Reporting with organic sessions and organic revenue attribution.
If your DTC food brand is running paid social at 20,000 dollars monthly with a broken blog and zero recipe schema, professional content marketing for food brands pays for itself inside the first 90 days on organic traffic captured. Redefine Web ships content marketing inside our monthly retainer packages. Book a call and we will walk through the last three DTC food brands we built recipe hubs for, pillar by pillar.
Anchor text on internal links varies across recipe hubs to avoid over-optimization patterns Google penalizes. Exact-match anchor (“single-origin Ethiopian coffee”) runs on 20 to 30 percent of internal links. Partial-match variations (“our Ethiopian roast”) run on 30 to 40 percent. Branded anchors (the SKU name) run on 20 to 30 percent. Generic anchors (“shop the coffee”) fill the remaining 10 to 20 percent. This ratio holds ranking without triggering the over-optimization penalty that shows up on brands that anchor-text-stuff every internal link with the same exact-match keyword. Cross-reference the linking layer on our food and beverage web design page.
Link equity from ingredient guides to SKU pages
Link equity from ingredient guides passes to SKU pages when the guide’s comparison table names the hero SKU in the winning column with a product card, and when the guide’s body links to 3 to 6 recipes that use the winning ingredient. This 3-hop path (guide to recipe to SKU) pushes authority from a high-traffic informational query down to a high-intent transactional page. According to Search Engine Land SEO coverage, informational content that internally links to transactional pages produces 2 to 4 times higher organic revenue than isolated content silos.
Wrapping up content marketing for food brands
Content marketing for food brands is the organic engine that turns a DTC snack, drink, or CPG storefront into a search-driven revenue channel. Recipe hub of 40 to 100 recipes. Ingredient comparison guides at 12 to 24 pieces. Sourcing story pages at 6 to 12 pieces. Buyer intent content at 8 to 16 pieces. Creator syndication calendar with 12 to 30 creators per quarter. Refresh cadence at 12 to 24 months by pillar. Reporting with organic sessions and organic revenue attribution.
If your DTC food brand is running paid social at 20,000 dollars monthly with a broken blog and zero recipe schema, professional content marketing for food brands pays for itself inside the first 90 days on organic traffic captured. Redefine Web ships content marketing inside our monthly retainer packages. Book a call and we will walk through the last three DTC food brands we built recipe hubs for, pillar by pillar.
Content marketing for food brands starts with a recipe hub because recipe queries account for 40 to 60 percent of high-intent search volume in the food category. Every hero SKU needs 4 to 12 recipes anchored to it, each targeting a specific occasion and audience.
Skip the recipe hub and the brand loses the search real estate that pulls DTC storefront traffic month over month at zero incremental paid cost. Recipe traffic converts at 2 to 4 percent because the shopper landed with usage intent, not passive discovery, which is why food brands win on recipes.
Recipe schema and Google rich result eligibility
Every recipe page ships schema.org Recipe markup including cookTime, prepTime, recipeIngredient, recipeInstructions, nutrition, and aggregateRating. Correctly marked-up recipes qualify for Google’s recipe rich result carousel that pulls 3 to 6 times higher click-through rate than a plain blue link. The schema layer takes 15 minutes per recipe to author and 30 minutes to validate in Google Search Console. Cross-reference the recipe search stack on our food and beverage SEO page.
Recipe hub structure that scales
The recipe hub structure runs 40 to 100 recipes at maturity, organized by hero SKU (4 to 12 recipes per SKU) plus occasion tags (breakfast, weeknight dinner, meal prep, brunch, holiday). Every recipe links back to the hero SKU product page with the SKU embedded in an inline card. The hub earns internal linking value from ingredient comparison guides and the sourcing story pages, which feeds recipe ranking on Google. According to Google Search Central recipe structured data guidance, complete Recipe schema markup is required for eligibility in the recipe carousel and the ingredient search filter.
Pillar structure for food brand content marketing
The pillar structure on content marketing for food brands runs 4 content pillars concurrently: recipe hub (40 to 100 recipes), ingredient comparison guides (12 to 24 guides), sourcing story pages (6 to 12 pages), and buyer intent content (where to buy, subscription vs. one-time, gift bundle guides). Every pillar covers a distinct search intent and every pillar links back to the hero SKU product pages.
Ingredient comparison guide format
Ingredient comparison guides run 1,800 to 3,200 words comparing 2 to 4 ingredient types on 6 to 10 attributes with a comparison table, real-world use case examples, and links to the hero SKU that uses the specific ingredient. Example: organic vs. conventional oats compares nutritional profile, sourcing chain, cost, environmental impact, and taste on a 6-column table. The brand’s SKU appears in the winning column with a product card. These guides rank 3 to 8 months after publication and pull steady-state organic traffic.
Sourcing story pages that build trust
Sourcing story pages name the specific farms, cooperatives, or suppliers the brand sources from, with photos of the farms, farmer quotes, and specific harvest windows. A coffee brand’s Ethiopian farm page ranks for “single-origin Ethiopian coffee” and “Yirgacheffe coffee origin” plus 40 long-tail variations. The sourcing page pulls trust-building traffic that converts at 4 to 6 percent because the shopper landed pattern-matching on transparency and named provenance. Every sourcing page includes farmer or cooperative quotes, harvest dates, and a link back to 3 to 5 hero SKU pages that source from the named supplier.
Vejrø hospitality content case study
Vejrø Resort, a Danish private-island destination with an on-site restaurant focused on organic, locally sourced cuisine, joined us with strong social engagement and no organic-search real estate. Guests found the resort on Instagram but never in Google search for terms like “private island resort Denmark,” “farm-to-table hospitality Denmark,” or “Vejrø restaurant.” The same organic-search gap shows up on DTC food brands running paid social at 20,000 dollars monthly with a broken blog and zero recipe schema.
We built the conversion-focused website with on-site and off-site SEO tuned to the travel-niche keyword clusters, competitor analysis against comparable boutique resorts, and mobile-first design prioritizing guest discovery. Every page carried the structured data qualifying it for Google’s rich results in the hospitality category. Every internal link pushed authority toward the direct-booking conversion path.
Three months later, Vejrø hit 10,000 plus organic visitors, ranked for 200 plus first-page keywords, and pulled a 2.2 percent booking conversion rate from organic traffic. The same pattern applies to content marketing for food brands: recipe schema, ingredient comparison guides, and sourcing story pages pull organic traffic at 20 to 40 percent conversion into hero SKU pages inside 6 months when the content quality matches search intent and every page carries the right structured data markup. Vejrø also proved out the reporting discipline: every monthly report named the exact page, the exact keyword cluster, and the exact search feature (rich result, sitelinks, image pack) driving the incremental organic revenue instead of hiding behind aggregate traffic charts.
Recipe cadence and content calendar for food brands
Recipe cadence on a working food brand content calendar ships 2 to 4 new recipes per week during the first 6 months and drops to 1 per week at maturity. Each recipe takes 4 to 6 hours to produce (write, test in the kitchen, photograph, schema author, publish). At 3 recipes per week, the brand hits 78 recipes inside 6 months plus a backlog of ingredient comparison and sourcing content queued behind the recipe production line.
| Content pillar | Target volume year 1 | Production cost per piece | Refresh cadence |
|---|---|---|---|
| Recipe hub | 40 to 100 recipes | $180 to $320 | Every 12 months |
| Ingredient comparison guides | 12 to 24 guides | $450 to $780 | Every 18 months |
| Sourcing story pages | 6 to 12 pages | $680 to $1,200 | Every 24 months |
| Buyer intent content | 8 to 16 pieces | $220 to $420 | Every 12 months |
Photography as a content calendar constraint
Photography is the actual constraint on recipe cadence, not writing. Every recipe needs 6 to 12 photos: hero shot, ingredient flat lay, prep in progress, plated result, storage, and step shots for the schema markup. A working food brand batches photography 8 recipes at a time to keep the cost per recipe under 200 dollars. Skip the batching and the per-recipe cost climbs to 400 to 600 dollars, which caps recipe cadence at 1 per week and slows organic ranking timeline by 6 months.
Seasonal content calendar planning
Seasonal content calendar planning maps recipes and comparison guides to the seasonal windows they need to rank in. A Christmas cookie recipe needs to publish in September to rank by early December. A Valentine’s chocolate guide needs to publish in November to rank by early February. A back-to-school lunchbox recipe needs to publish in June to rank by late August. The 60-to-90-day ranking curve dictates the calendar.
Creator syndication inside food brand content
Creator syndication on food brand content marketing amplifies the recipe hub through Instagram Reels, TikTok, and YouTube Shorts creators paid to post their own version of the brand’s hero recipes. The creator content pulls net-new audiences into the recipe hub through the creator’s Link in Bio or Amazon Storefront tag. The syndication calendar names 12 to 30 creators per quarter with specific recipes assigned to each.
One brand we picked up had a spreadsheet titled “creator outreach 2023” with 47 rows and 3 responses. All 3 responses were auto-replies. The spreadsheet named zero recipes and offered flat rates below 100 dollars per post. Nobody posts a 30-second video for 87 dollars flat. Nobody.
Creator content commercial terms that work
Working creator content commercial terms run 350 to 1,500 dollars flat per post plus a 12 to 25 percent commission on tagged sales across a 30-day window. The commission mechanic pulls creators into follow-up posts because the incremental revenue continues past the initial fee. Mid-tier creators (30k to 150k followers) hit the sweet spot for food brand content because their engagement rate typically runs 4 to 8 percent versus 0.8 to 1.6 percent on mega-creators.
Content brief structure for creator partnerships
The content brief structure for creator partnerships runs a single page: the SKU, the specific recipe or usage occasion, 3 required brand mentions, 3 restricted claims (no health claims on non-medical SKUs), the pricing angle, the affiliate link, and 3 example videos that hit the tone. The brief avoids over-scripting because over-scripted creator content underperforms native creator voice by 40 to 60 percent on engagement rate.
Buyer intent content for food brand blogs
Buyer intent content on food brand blogs covers 8 to 16 pieces targeting explicit purchase-decision queries: “where to buy [brand],” “[brand] subscription vs. one-time,” “best [category] for [use case],” and “[brand] gift bundle.” Every buyer intent piece runs 1,400 to 2,400 words with a comparison table, product cards, and a clear conversion path to the specific SKU that matches the query intent. Buyer intent content converts at 3 to 6 percent versus 1 to 2 percent on recipe content because the shopper landed already planning to buy, not exploring a usage occasion.
Where-to-buy content structure
Where-to-buy content structure covers online (DTC storefront, Amazon, Target.com, Whole Foods online), retail (specific chain locators with the store finder embedded), and international (customs limitations, retailer partners abroad). Every piece names specific retailers, links to the store locator, and includes an FAQ block covering shipping availability, subscription options, and gift card compatibility. Where-to-buy content ranks for branded discovery queries the DTC storefront otherwise loses to competitor affiliate reviews.
Subscription versus one-time comparison content
Subscription versus one-time comparison content converts subscription commitments at 3 to 6 percent because it addresses the price-sensitivity concern head-on with a specific math table. The piece covers the discount structure (15 percent lifetime), the skip-a-month mechanic, the pause-anytime rule, the cancellation policy, and the specific yearly savings for the brand’s average consumption cadence. Cross-reference the retention structure on our food and beverage marketing retainer page.
Content refresh cadence on food brand pillars
Content refresh cadence on food brand content pillars runs a rolling audit every 12 to 24 months by pillar. Recipes get refreshed every 12 months with new photography, updated schema, and any nutrition or ingredient adjustments. Ingredient comparison guides refresh every 18 months to update market data. Sourcing story pages refresh every 24 months to reflect farm partnership changes and new harvest angles. Buyer intent content refreshes every 12 months to update retailer availability and pricing.
Recipe refresh priority order
Recipe refresh priority runs by organic traffic rank. The top 20 recipes by monthly organic sessions get refreshed first (new photography, schema audit, related recipe internal links, updated nutrition). The next 40 get refreshed at 15 months. The remaining recipes get refreshed opportunistically when the ranking slips past position 15 in Google. Skipping the refresh cadence lets recipe rankings drift out of the top 3 inside 18 months as newer competitor recipes take the position.
Schema audit checklist per refresh
The schema audit checklist per refresh runs 8 items: Recipe schema completeness, aggregateRating count and accuracy, nutrition data accuracy, prepTime and cookTime match the recipe body, image URLs valid at CDN, related recipe internal links working, product card SKU URL live, and Google Search Console rich result eligibility validated. This checklist takes 20 minutes per recipe and prevents the schema drift that costs recipe rankings 20 to 40 positions quietly.
Reporting cadence for food brand content marketing
Reporting cadence on food brand content marketing runs a monthly executive report plus a quarterly business review. The monthly report ships in the first business week and covers organic sessions by pillar, top 10 ranking recipes with position trend, ingredient guide ranking movements, sourcing page performance, and organic-attributed DTC revenue. Every number carries a comparison to the prior month and a plain-language interpretation the founder reads in 7 minutes.
Metrics that matter for content marketing
Metrics that matter for food brand content marketing: organic sessions by pillar, recipe rich result impressions in Search Console, organic conversion rate to hero SKU pages, organic-attributed DTC revenue, and top 20 ranking positions by monthly organic sessions. Vanity metrics that do not matter: total pageviews without conversion context, average time on page without conversion attribution, and social share counts. The monthly report skips the vanity block entirely.
Quarterly business review structure
The quarterly business review runs 90 minutes with the founder, head of content, and SEO lead. Agenda: organic traffic trend by pillar, top 10 winning content pieces, top 10 losing content pieces (candidates for refresh or removal), competitive gap analysis against 5 named competitor brands, and next quarter’s content calendar with recipes and ingredient guides queued. According to Ahrefs content marketing research, brands running quarterly content audits outperform brands running annual audits by 40 to 70 percent on organic revenue over a 24-month window.
Internal linking discipline across food brand content
Internal linking discipline across food brand content moves authority from recipe pages toward hero SKU product pages and comparison guides. Every recipe links to the hero SKU it uses inline (once in the ingredient list, once in a bottom call-out card). Every ingredient comparison guide links to 3 to 6 recipes using the winning ingredient plus the hero SKU product page. Every sourcing story links to the 2 to 4 SKUs sourced from that specific farm or cooperative.
Anchor text strategy across recipe hubs
Anchor text on internal links varies across recipe hubs to avoid over-optimization patterns Google penalizes. Exact-match anchor (“single-origin Ethiopian coffee”) runs on 20 to 30 percent of internal links. Partial-match variations (“our Ethiopian roast”) run on 30 to 40 percent. Branded anchors (the SKU name) run on 20 to 30 percent. Generic anchors (“shop the coffee”) fill the remaining 10 to 20 percent. This ratio holds ranking without triggering the over-optimization penalty that shows up on brands that anchor-text-stuff every internal link with the same exact-match keyword. Cross-reference the linking layer on our food and beverage web design page.
Link equity from ingredient guides to SKU pages
Link equity from ingredient guides passes to SKU pages when the guide’s comparison table names the hero SKU in the winning column with a product card, and when the guide’s body links to 3 to 6 recipes that use the winning ingredient. This 3-hop path (guide to recipe to SKU) pushes authority from a high-traffic informational query down to a high-intent transactional page. According to Search Engine Land SEO coverage, informational content that internally links to transactional pages produces 2 to 4 times higher organic revenue than isolated content silos.
Wrapping up content marketing for food brands
Content marketing for food brands is the organic engine that turns a DTC snack, drink, or CPG storefront into a search-driven revenue channel. Recipe hub of 40 to 100 recipes. Ingredient comparison guides at 12 to 24 pieces. Sourcing story pages at 6 to 12 pieces. Buyer intent content at 8 to 16 pieces. Creator syndication calendar with 12 to 30 creators per quarter. Refresh cadence at 12 to 24 months by pillar. Reporting with organic sessions and organic revenue attribution.
If your DTC food brand is running paid social at 20,000 dollars monthly with a broken blog and zero recipe schema, professional content marketing for food brands pays for itself inside the first 90 days on organic traffic captured. Redefine Web ships content marketing inside our monthly retainer packages. Book a call and we will walk through the last three DTC food brands we built recipe hubs for, pillar by pillar.
Internal linking discipline across food brand content moves authority from recipe pages toward hero SKU product pages and comparison guides. Every recipe links to the hero SKU it uses inline (once in the ingredient list, once in a bottom call-out card). Every ingredient comparison guide links to 3 to 6 recipes using the winning ingredient plus the hero SKU product page. Every sourcing story links to the 2 to 4 SKUs sourced from that specific farm or cooperative.
Anchor text strategy across recipe hubs
Anchor text on internal links varies across recipe hubs to avoid over-optimization patterns Google penalizes. Exact-match anchor (“single-origin Ethiopian coffee”) runs on 20 to 30 percent of internal links. Partial-match variations (“our Ethiopian roast”) run on 30 to 40 percent. Branded anchors (the SKU name) run on 20 to 30 percent. Generic anchors (“shop the coffee”) fill the remaining 10 to 20 percent. This ratio holds ranking without triggering the over-optimization penalty that shows up on brands that anchor-text-stuff every internal link with the same exact-match keyword. Cross-reference the linking layer on our food and beverage web design page.
Link equity from ingredient guides to SKU pages
Link equity from ingredient guides passes to SKU pages when the guide’s comparison table names the hero SKU in the winning column with a product card, and when the guide’s body links to 3 to 6 recipes that use the winning ingredient. This 3-hop path (guide to recipe to SKU) pushes authority from a high-traffic informational query down to a high-intent transactional page. According to Search Engine Land SEO coverage, informational content that internally links to transactional pages produces 2 to 4 times higher organic revenue than isolated content silos.
Wrapping up content marketing for food brands
Content marketing for food brands is the organic engine that turns a DTC snack, drink, or CPG storefront into a search-driven revenue channel. Recipe hub of 40 to 100 recipes. Ingredient comparison guides at 12 to 24 pieces. Sourcing story pages at 6 to 12 pieces. Buyer intent content at 8 to 16 pieces. Creator syndication calendar with 12 to 30 creators per quarter. Refresh cadence at 12 to 24 months by pillar. Reporting with organic sessions and organic revenue attribution.
If your DTC food brand is running paid social at 20,000 dollars monthly with a broken blog and zero recipe schema, professional content marketing for food brands pays for itself inside the first 90 days on organic traffic captured. Redefine Web ships content marketing inside our monthly retainer packages. Book a call and we will walk through the last three DTC food brands we built recipe hubs for, pillar by pillar.
Content marketing for food brands starts with a recipe hub because recipe queries account for 40 to 60 percent of high-intent search volume in the food category. Every hero SKU needs 4 to 12 recipes anchored to it, each targeting a specific occasion and audience.
Skip the recipe hub and the brand loses the search real estate that pulls DTC storefront traffic month over month at zero incremental paid cost. Recipe traffic converts at 2 to 4 percent because the shopper landed with usage intent, not passive discovery, which is why food brands win on recipes.
Recipe schema and Google rich result eligibility
Every recipe page ships schema.org Recipe markup including cookTime, prepTime, recipeIngredient, recipeInstructions, nutrition, and aggregateRating. Correctly marked-up recipes qualify for Google’s recipe rich result carousel that pulls 3 to 6 times higher click-through rate than a plain blue link. The schema layer takes 15 minutes per recipe to author and 30 minutes to validate in Google Search Console. Cross-reference the recipe search stack on our food and beverage SEO page.
Recipe hub structure that scales
The recipe hub structure runs 40 to 100 recipes at maturity, organized by hero SKU (4 to 12 recipes per SKU) plus occasion tags (breakfast, weeknight dinner, meal prep, brunch, holiday). Every recipe links back to the hero SKU product page with the SKU embedded in an inline card. The hub earns internal linking value from ingredient comparison guides and the sourcing story pages, which feeds recipe ranking on Google. According to Google Search Central recipe structured data guidance, complete Recipe schema markup is required for eligibility in the recipe carousel and the ingredient search filter.
Pillar structure for food brand content marketing
The pillar structure on content marketing for food brands runs 4 content pillars concurrently: recipe hub (40 to 100 recipes), ingredient comparison guides (12 to 24 guides), sourcing story pages (6 to 12 pages), and buyer intent content (where to buy, subscription vs. one-time, gift bundle guides). Every pillar covers a distinct search intent and every pillar links back to the hero SKU product pages.
Ingredient comparison guide format
Ingredient comparison guides run 1,800 to 3,200 words comparing 2 to 4 ingredient types on 6 to 10 attributes with a comparison table, real-world use case examples, and links to the hero SKU that uses the specific ingredient. Example: organic vs. conventional oats compares nutritional profile, sourcing chain, cost, environmental impact, and taste on a 6-column table. The brand’s SKU appears in the winning column with a product card. These guides rank 3 to 8 months after publication and pull steady-state organic traffic.
Sourcing story pages that build trust
Sourcing story pages name the specific farms, cooperatives, or suppliers the brand sources from, with photos of the farms, farmer quotes, and specific harvest windows. A coffee brand’s Ethiopian farm page ranks for “single-origin Ethiopian coffee” and “Yirgacheffe coffee origin” plus 40 long-tail variations. The sourcing page pulls trust-building traffic that converts at 4 to 6 percent because the shopper landed pattern-matching on transparency and named provenance. Every sourcing page includes farmer or cooperative quotes, harvest dates, and a link back to 3 to 5 hero SKU pages that source from the named supplier.
Vejrø hospitality content case study
Vejrø Resort, a Danish private-island destination with an on-site restaurant focused on organic, locally sourced cuisine, joined us with strong social engagement and no organic-search real estate. Guests found the resort on Instagram but never in Google search for terms like “private island resort Denmark,” “farm-to-table hospitality Denmark,” or “Vejrø restaurant.” The same organic-search gap shows up on DTC food brands running paid social at 20,000 dollars monthly with a broken blog and zero recipe schema.
We built the conversion-focused website with on-site and off-site SEO tuned to the travel-niche keyword clusters, competitor analysis against comparable boutique resorts, and mobile-first design prioritizing guest discovery. Every page carried the structured data qualifying it for Google’s rich results in the hospitality category. Every internal link pushed authority toward the direct-booking conversion path.
Three months later, Vejrø hit 10,000 plus organic visitors, ranked for 200 plus first-page keywords, and pulled a 2.2 percent booking conversion rate from organic traffic. The same pattern applies to content marketing for food brands: recipe schema, ingredient comparison guides, and sourcing story pages pull organic traffic at 20 to 40 percent conversion into hero SKU pages inside 6 months when the content quality matches search intent and every page carries the right structured data markup. Vejrø also proved out the reporting discipline: every monthly report named the exact page, the exact keyword cluster, and the exact search feature (rich result, sitelinks, image pack) driving the incremental organic revenue instead of hiding behind aggregate traffic charts.
Recipe cadence and content calendar for food brands
Recipe cadence on a working food brand content calendar ships 2 to 4 new recipes per week during the first 6 months and drops to 1 per week at maturity. Each recipe takes 4 to 6 hours to produce (write, test in the kitchen, photograph, schema author, publish). At 3 recipes per week, the brand hits 78 recipes inside 6 months plus a backlog of ingredient comparison and sourcing content queued behind the recipe production line.
| Content pillar | Target volume year 1 | Production cost per piece | Refresh cadence |
|---|---|---|---|
| Recipe hub | 40 to 100 recipes | $180 to $320 | Every 12 months |
| Ingredient comparison guides | 12 to 24 guides | $450 to $780 | Every 18 months |
| Sourcing story pages | 6 to 12 pages | $680 to $1,200 | Every 24 months |
| Buyer intent content | 8 to 16 pieces | $220 to $420 | Every 12 months |
Photography as a content calendar constraint
Photography is the actual constraint on recipe cadence, not writing. Every recipe needs 6 to 12 photos: hero shot, ingredient flat lay, prep in progress, plated result, storage, and step shots for the schema markup. A working food brand batches photography 8 recipes at a time to keep the cost per recipe under 200 dollars. Skip the batching and the per-recipe cost climbs to 400 to 600 dollars, which caps recipe cadence at 1 per week and slows organic ranking timeline by 6 months.
Seasonal content calendar planning
Seasonal content calendar planning maps recipes and comparison guides to the seasonal windows they need to rank in. A Christmas cookie recipe needs to publish in September to rank by early December. A Valentine’s chocolate guide needs to publish in November to rank by early February. A back-to-school lunchbox recipe needs to publish in June to rank by late August. The 60-to-90-day ranking curve dictates the calendar.
Creator syndication inside food brand content
Creator syndication on food brand content marketing amplifies the recipe hub through Instagram Reels, TikTok, and YouTube Shorts creators paid to post their own version of the brand’s hero recipes. The creator content pulls net-new audiences into the recipe hub through the creator’s Link in Bio or Amazon Storefront tag. The syndication calendar names 12 to 30 creators per quarter with specific recipes assigned to each.
One brand we picked up had a spreadsheet titled “creator outreach 2023” with 47 rows and 3 responses. All 3 responses were auto-replies. The spreadsheet named zero recipes and offered flat rates below 100 dollars per post. Nobody posts a 30-second video for 87 dollars flat. Nobody.
Creator content commercial terms that work
Working creator content commercial terms run 350 to 1,500 dollars flat per post plus a 12 to 25 percent commission on tagged sales across a 30-day window. The commission mechanic pulls creators into follow-up posts because the incremental revenue continues past the initial fee. Mid-tier creators (30k to 150k followers) hit the sweet spot for food brand content because their engagement rate typically runs 4 to 8 percent versus 0.8 to 1.6 percent on mega-creators.
Content brief structure for creator partnerships
The content brief structure for creator partnerships runs a single page: the SKU, the specific recipe or usage occasion, 3 required brand mentions, 3 restricted claims (no health claims on non-medical SKUs), the pricing angle, the affiliate link, and 3 example videos that hit the tone. The brief avoids over-scripting because over-scripted creator content underperforms native creator voice by 40 to 60 percent on engagement rate.
Buyer intent content for food brand blogs
Buyer intent content on food brand blogs covers 8 to 16 pieces targeting explicit purchase-decision queries: “where to buy [brand],” “[brand] subscription vs. one-time,” “best [category] for [use case],” and “[brand] gift bundle.” Every buyer intent piece runs 1,400 to 2,400 words with a comparison table, product cards, and a clear conversion path to the specific SKU that matches the query intent. Buyer intent content converts at 3 to 6 percent versus 1 to 2 percent on recipe content because the shopper landed already planning to buy, not exploring a usage occasion.
Where-to-buy content structure
Where-to-buy content structure covers online (DTC storefront, Amazon, Target.com, Whole Foods online), retail (specific chain locators with the store finder embedded), and international (customs limitations, retailer partners abroad). Every piece names specific retailers, links to the store locator, and includes an FAQ block covering shipping availability, subscription options, and gift card compatibility. Where-to-buy content ranks for branded discovery queries the DTC storefront otherwise loses to competitor affiliate reviews.
Subscription versus one-time comparison content
Subscription versus one-time comparison content converts subscription commitments at 3 to 6 percent because it addresses the price-sensitivity concern head-on with a specific math table. The piece covers the discount structure (15 percent lifetime), the skip-a-month mechanic, the pause-anytime rule, the cancellation policy, and the specific yearly savings for the brand’s average consumption cadence. Cross-reference the retention structure on our food and beverage marketing retainer page.
Content refresh cadence on food brand pillars
Content refresh cadence on food brand content pillars runs a rolling audit every 12 to 24 months by pillar. Recipes get refreshed every 12 months with new photography, updated schema, and any nutrition or ingredient adjustments. Ingredient comparison guides refresh every 18 months to update market data. Sourcing story pages refresh every 24 months to reflect farm partnership changes and new harvest angles. Buyer intent content refreshes every 12 months to update retailer availability and pricing.
Recipe refresh priority order
Recipe refresh priority runs by organic traffic rank. The top 20 recipes by monthly organic sessions get refreshed first (new photography, schema audit, related recipe internal links, updated nutrition). The next 40 get refreshed at 15 months. The remaining recipes get refreshed opportunistically when the ranking slips past position 15 in Google. Skipping the refresh cadence lets recipe rankings drift out of the top 3 inside 18 months as newer competitor recipes take the position.
Schema audit checklist per refresh
The schema audit checklist per refresh runs 8 items: Recipe schema completeness, aggregateRating count and accuracy, nutrition data accuracy, prepTime and cookTime match the recipe body, image URLs valid at CDN, related recipe internal links working, product card SKU URL live, and Google Search Console rich result eligibility validated. This checklist takes 20 minutes per recipe and prevents the schema drift that costs recipe rankings 20 to 40 positions quietly.
Reporting cadence for food brand content marketing
Reporting cadence on food brand content marketing runs a monthly executive report plus a quarterly business review. The monthly report ships in the first business week and covers organic sessions by pillar, top 10 ranking recipes with position trend, ingredient guide ranking movements, sourcing page performance, and organic-attributed DTC revenue. Every number carries a comparison to the prior month and a plain-language interpretation the founder reads in 7 minutes.
Metrics that matter for content marketing
Metrics that matter for food brand content marketing: organic sessions by pillar, recipe rich result impressions in Search Console, organic conversion rate to hero SKU pages, organic-attributed DTC revenue, and top 20 ranking positions by monthly organic sessions. Vanity metrics that do not matter: total pageviews without conversion context, average time on page without conversion attribution, and social share counts. The monthly report skips the vanity block entirely.
Quarterly business review structure
The quarterly business review runs 90 minutes with the founder, head of content, and SEO lead. Agenda: organic traffic trend by pillar, top 10 winning content pieces, top 10 losing content pieces (candidates for refresh or removal), competitive gap analysis against 5 named competitor brands, and next quarter’s content calendar with recipes and ingredient guides queued. According to Ahrefs content marketing research, brands running quarterly content audits outperform brands running annual audits by 40 to 70 percent on organic revenue over a 24-month window.
Internal linking discipline across food brand content
Internal linking discipline across food brand content moves authority from recipe pages toward hero SKU product pages and comparison guides. Every recipe links to the hero SKU it uses inline (once in the ingredient list, once in a bottom call-out card). Every ingredient comparison guide links to 3 to 6 recipes using the winning ingredient plus the hero SKU product page. Every sourcing story links to the 2 to 4 SKUs sourced from that specific farm or cooperative.
Anchor text strategy across recipe hubs
Anchor text on internal links varies across recipe hubs to avoid over-optimization patterns Google penalizes. Exact-match anchor (“single-origin Ethiopian coffee”) runs on 20 to 30 percent of internal links. Partial-match variations (“our Ethiopian roast”) run on 30 to 40 percent. Branded anchors (the SKU name) run on 20 to 30 percent. Generic anchors (“shop the coffee”) fill the remaining 10 to 20 percent. This ratio holds ranking without triggering the over-optimization penalty that shows up on brands that anchor-text-stuff every internal link with the same exact-match keyword. Cross-reference the linking layer on our food and beverage web design page.
Link equity from ingredient guides to SKU pages
Link equity from ingredient guides passes to SKU pages when the guide’s comparison table names the hero SKU in the winning column with a product card, and when the guide’s body links to 3 to 6 recipes that use the winning ingredient. This 3-hop path (guide to recipe to SKU) pushes authority from a high-traffic informational query down to a high-intent transactional page. According to Search Engine Land SEO coverage, informational content that internally links to transactional pages produces 2 to 4 times higher organic revenue than isolated content silos.
Wrapping up content marketing for food brands
Content marketing for food brands is the organic engine that turns a DTC snack, drink, or CPG storefront into a search-driven revenue channel. Recipe hub of 40 to 100 recipes. Ingredient comparison guides at 12 to 24 pieces. Sourcing story pages at 6 to 12 pieces. Buyer intent content at 8 to 16 pieces. Creator syndication calendar with 12 to 30 creators per quarter. Refresh cadence at 12 to 24 months by pillar. Reporting with organic sessions and organic revenue attribution.
If your DTC food brand is running paid social at 20,000 dollars monthly with a broken blog and zero recipe schema, professional content marketing for food brands pays for itself inside the first 90 days on organic traffic captured. Redefine Web ships content marketing inside our monthly retainer packages. Book a call and we will walk through the last three DTC food brands we built recipe hubs for, pillar by pillar.
Content marketing for food brands starts with a recipe hub because recipe queries account for 40 to 60 percent of high-intent search volume in the food category. Every hero SKU needs 4 to 12 recipes anchored to it, each targeting a specific occasion and audience.
Skip the recipe hub and the brand loses the search real estate that pulls DTC storefront traffic month over month at zero incremental paid cost. Recipe traffic converts at 2 to 4 percent because the shopper landed with usage intent, not passive discovery, which is why food brands win on recipes.
Recipe schema and Google rich result eligibility
Every recipe page ships schema.org Recipe markup including cookTime, prepTime, recipeIngredient, recipeInstructions, nutrition, and aggregateRating. Correctly marked-up recipes qualify for Google’s recipe rich result carousel that pulls 3 to 6 times higher click-through rate than a plain blue link. The schema layer takes 15 minutes per recipe to author and 30 minutes to validate in Google Search Console. Cross-reference the recipe search stack on our food and beverage SEO page.
Recipe hub structure that scales
The recipe hub structure runs 40 to 100 recipes at maturity, organized by hero SKU (4 to 12 recipes per SKU) plus occasion tags (breakfast, weeknight dinner, meal prep, brunch, holiday). Every recipe links back to the hero SKU product page with the SKU embedded in an inline card. The hub earns internal linking value from ingredient comparison guides and the sourcing story pages, which feeds recipe ranking on Google. According to Google Search Central recipe structured data guidance, complete Recipe schema markup is required for eligibility in the recipe carousel and the ingredient search filter.
Pillar structure for food brand content marketing
The pillar structure on content marketing for food brands runs 4 content pillars concurrently: recipe hub (40 to 100 recipes), ingredient comparison guides (12 to 24 guides), sourcing story pages (6 to 12 pages), and buyer intent content (where to buy, subscription vs. one-time, gift bundle guides). Every pillar covers a distinct search intent and every pillar links back to the hero SKU product pages.
Ingredient comparison guide format
Ingredient comparison guides run 1,800 to 3,200 words comparing 2 to 4 ingredient types on 6 to 10 attributes with a comparison table, real-world use case examples, and links to the hero SKU that uses the specific ingredient. Example: organic vs. conventional oats compares nutritional profile, sourcing chain, cost, environmental impact, and taste on a 6-column table. The brand’s SKU appears in the winning column with a product card. These guides rank 3 to 8 months after publication and pull steady-state organic traffic.
Sourcing story pages that build trust
Sourcing story pages name the specific farms, cooperatives, or suppliers the brand sources from, with photos of the farms, farmer quotes, and specific harvest windows. A coffee brand’s Ethiopian farm page ranks for “single-origin Ethiopian coffee” and “Yirgacheffe coffee origin” plus 40 long-tail variations. The sourcing page pulls trust-building traffic that converts at 4 to 6 percent because the shopper landed pattern-matching on transparency and named provenance. Every sourcing page includes farmer or cooperative quotes, harvest dates, and a link back to 3 to 5 hero SKU pages that source from the named supplier.
Vejrø hospitality content case study
Vejrø Resort, a Danish private-island destination with an on-site restaurant focused on organic, locally sourced cuisine, joined us with strong social engagement and no organic-search real estate. Guests found the resort on Instagram but never in Google search for terms like “private island resort Denmark,” “farm-to-table hospitality Denmark,” or “Vejrø restaurant.” The same organic-search gap shows up on DTC food brands running paid social at 20,000 dollars monthly with a broken blog and zero recipe schema.
We built the conversion-focused website with on-site and off-site SEO tuned to the travel-niche keyword clusters, competitor analysis against comparable boutique resorts, and mobile-first design prioritizing guest discovery. Every page carried the structured data qualifying it for Google’s rich results in the hospitality category. Every internal link pushed authority toward the direct-booking conversion path.
Three months later, Vejrø hit 10,000 plus organic visitors, ranked for 200 plus first-page keywords, and pulled a 2.2 percent booking conversion rate from organic traffic. The same pattern applies to content marketing for food brands: recipe schema, ingredient comparison guides, and sourcing story pages pull organic traffic at 20 to 40 percent conversion into hero SKU pages inside 6 months when the content quality matches search intent and every page carries the right structured data markup. Vejrø also proved out the reporting discipline: every monthly report named the exact page, the exact keyword cluster, and the exact search feature (rich result, sitelinks, image pack) driving the incremental organic revenue instead of hiding behind aggregate traffic charts.
Recipe cadence and content calendar for food brands
Recipe cadence on a working food brand content calendar ships 2 to 4 new recipes per week during the first 6 months and drops to 1 per week at maturity. Each recipe takes 4 to 6 hours to produce (write, test in the kitchen, photograph, schema author, publish). At 3 recipes per week, the brand hits 78 recipes inside 6 months plus a backlog of ingredient comparison and sourcing content queued behind the recipe production line.
| Content pillar | Target volume year 1 | Production cost per piece | Refresh cadence |
|---|---|---|---|
| Recipe hub | 40 to 100 recipes | $180 to $320 | Every 12 months |
| Ingredient comparison guides | 12 to 24 guides | $450 to $780 | Every 18 months |
| Sourcing story pages | 6 to 12 pages | $680 to $1,200 | Every 24 months |
| Buyer intent content | 8 to 16 pieces | $220 to $420 | Every 12 months |
Photography as a content calendar constraint
Photography is the actual constraint on recipe cadence, not writing. Every recipe needs 6 to 12 photos: hero shot, ingredient flat lay, prep in progress, plated result, storage, and step shots for the schema markup. A working food brand batches photography 8 recipes at a time to keep the cost per recipe under 200 dollars. Skip the batching and the per-recipe cost climbs to 400 to 600 dollars, which caps recipe cadence at 1 per week and slows organic ranking timeline by 6 months.
Seasonal content calendar planning
Seasonal content calendar planning maps recipes and comparison guides to the seasonal windows they need to rank in. A Christmas cookie recipe needs to publish in September to rank by early December. A Valentine’s chocolate guide needs to publish in November to rank by early February. A back-to-school lunchbox recipe needs to publish in June to rank by late August. The 60-to-90-day ranking curve dictates the calendar.
Creator syndication inside food brand content
Creator syndication on food brand content marketing amplifies the recipe hub through Instagram Reels, TikTok, and YouTube Shorts creators paid to post their own version of the brand’s hero recipes. The creator content pulls net-new audiences into the recipe hub through the creator’s Link in Bio or Amazon Storefront tag. The syndication calendar names 12 to 30 creators per quarter with specific recipes assigned to each.
One brand we picked up had a spreadsheet titled “creator outreach 2023” with 47 rows and 3 responses. All 3 responses were auto-replies. The spreadsheet named zero recipes and offered flat rates below 100 dollars per post. Nobody posts a 30-second video for 87 dollars flat. Nobody.
Creator content commercial terms that work
Working creator content commercial terms run 350 to 1,500 dollars flat per post plus a 12 to 25 percent commission on tagged sales across a 30-day window. The commission mechanic pulls creators into follow-up posts because the incremental revenue continues past the initial fee. Mid-tier creators (30k to 150k followers) hit the sweet spot for food brand content because their engagement rate typically runs 4 to 8 percent versus 0.8 to 1.6 percent on mega-creators.
Content brief structure for creator partnerships
The content brief structure for creator partnerships runs a single page: the SKU, the specific recipe or usage occasion, 3 required brand mentions, 3 restricted claims (no health claims on non-medical SKUs), the pricing angle, the affiliate link, and 3 example videos that hit the tone. The brief avoids over-scripting because over-scripted creator content underperforms native creator voice by 40 to 60 percent on engagement rate.
Buyer intent content for food brand blogs
Buyer intent content on food brand blogs covers 8 to 16 pieces targeting explicit purchase-decision queries: “where to buy [brand],” “[brand] subscription vs. one-time,” “best [category] for [use case],” and “[brand] gift bundle.” Every buyer intent piece runs 1,400 to 2,400 words with a comparison table, product cards, and a clear conversion path to the specific SKU that matches the query intent. Buyer intent content converts at 3 to 6 percent versus 1 to 2 percent on recipe content because the shopper landed already planning to buy, not exploring a usage occasion.
Where-to-buy content structure
Where-to-buy content structure covers online (DTC storefront, Amazon, Target.com, Whole Foods online), retail (specific chain locators with the store finder embedded), and international (customs limitations, retailer partners abroad). Every piece names specific retailers, links to the store locator, and includes an FAQ block covering shipping availability, subscription options, and gift card compatibility. Where-to-buy content ranks for branded discovery queries the DTC storefront otherwise loses to competitor affiliate reviews.
Subscription versus one-time comparison content
Subscription versus one-time comparison content converts subscription commitments at 3 to 6 percent because it addresses the price-sensitivity concern head-on with a specific math table. The piece covers the discount structure (15 percent lifetime), the skip-a-month mechanic, the pause-anytime rule, the cancellation policy, and the specific yearly savings for the brand’s average consumption cadence. Cross-reference the retention structure on our food and beverage marketing retainer page.
Content refresh cadence on food brand pillars
Content refresh cadence on food brand content pillars runs a rolling audit every 12 to 24 months by pillar. Recipes get refreshed every 12 months with new photography, updated schema, and any nutrition or ingredient adjustments. Ingredient comparison guides refresh every 18 months to update market data. Sourcing story pages refresh every 24 months to reflect farm partnership changes and new harvest angles. Buyer intent content refreshes every 12 months to update retailer availability and pricing.
Recipe refresh priority order
Recipe refresh priority runs by organic traffic rank. The top 20 recipes by monthly organic sessions get refreshed first (new photography, schema audit, related recipe internal links, updated nutrition). The next 40 get refreshed at 15 months. The remaining recipes get refreshed opportunistically when the ranking slips past position 15 in Google. Skipping the refresh cadence lets recipe rankings drift out of the top 3 inside 18 months as newer competitor recipes take the position.
Schema audit checklist per refresh
The schema audit checklist per refresh runs 8 items: Recipe schema completeness, aggregateRating count and accuracy, nutrition data accuracy, prepTime and cookTime match the recipe body, image URLs valid at CDN, related recipe internal links working, product card SKU URL live, and Google Search Console rich result eligibility validated. This checklist takes 20 minutes per recipe and prevents the schema drift that costs recipe rankings 20 to 40 positions quietly.
Reporting cadence for food brand content marketing
Reporting cadence on food brand content marketing runs a monthly executive report plus a quarterly business review. The monthly report ships in the first business week and covers organic sessions by pillar, top 10 ranking recipes with position trend, ingredient guide ranking movements, sourcing page performance, and organic-attributed DTC revenue. Every number carries a comparison to the prior month and a plain-language interpretation the founder reads in 7 minutes.
Metrics that matter for content marketing
Metrics that matter for food brand content marketing: organic sessions by pillar, recipe rich result impressions in Search Console, organic conversion rate to hero SKU pages, organic-attributed DTC revenue, and top 20 ranking positions by monthly organic sessions. Vanity metrics that do not matter: total pageviews without conversion context, average time on page without conversion attribution, and social share counts. The monthly report skips the vanity block entirely.
Quarterly business review structure
The quarterly business review runs 90 minutes with the founder, head of content, and SEO lead. Agenda: organic traffic trend by pillar, top 10 winning content pieces, top 10 losing content pieces (candidates for refresh or removal), competitive gap analysis against 5 named competitor brands, and next quarter’s content calendar with recipes and ingredient guides queued. According to Ahrefs content marketing research, brands running quarterly content audits outperform brands running annual audits by 40 to 70 percent on organic revenue over a 24-month window.
Internal linking discipline across food brand content
Internal linking discipline across food brand content moves authority from recipe pages toward hero SKU product pages and comparison guides. Every recipe links to the hero SKU it uses inline (once in the ingredient list, once in a bottom call-out card). Every ingredient comparison guide links to 3 to 6 recipes using the winning ingredient plus the hero SKU product page. Every sourcing story links to the 2 to 4 SKUs sourced from that specific farm or cooperative.
Anchor text strategy across recipe hubs
Anchor text on internal links varies across recipe hubs to avoid over-optimization patterns Google penalizes. Exact-match anchor (“single-origin Ethiopian coffee”) runs on 20 to 30 percent of internal links. Partial-match variations (“our Ethiopian roast”) run on 30 to 40 percent. Branded anchors (the SKU name) run on 20 to 30 percent. Generic anchors (“shop the coffee”) fill the remaining 10 to 20 percent. This ratio holds ranking without triggering the over-optimization penalty that shows up on brands that anchor-text-stuff every internal link with the same exact-match keyword. Cross-reference the linking layer on our food and beverage web design page.
Link equity from ingredient guides to SKU pages
Link equity from ingredient guides passes to SKU pages when the guide’s comparison table names the hero SKU in the winning column with a product card, and when the guide’s body links to 3 to 6 recipes that use the winning ingredient. This 3-hop path (guide to recipe to SKU) pushes authority from a high-traffic informational query down to a high-intent transactional page. According to Search Engine Land SEO coverage, informational content that internally links to transactional pages produces 2 to 4 times higher organic revenue than isolated content silos.
Wrapping up content marketing for food brands
Content marketing for food brands is the organic engine that turns a DTC snack, drink, or CPG storefront into a search-driven revenue channel. Recipe hub of 40 to 100 recipes. Ingredient comparison guides at 12 to 24 pieces. Sourcing story pages at 6 to 12 pieces. Buyer intent content at 8 to 16 pieces. Creator syndication calendar with 12 to 30 creators per quarter. Refresh cadence at 12 to 24 months by pillar. Reporting with organic sessions and organic revenue attribution.
If your DTC food brand is running paid social at 20,000 dollars monthly with a broken blog and zero recipe schema, professional content marketing for food brands pays for itself inside the first 90 days on organic traffic captured. Redefine Web ships content marketing inside our monthly retainer packages. Book a call and we will walk through the last three DTC food brands we built recipe hubs for, pillar by pillar.
Content marketing for food brands starts with a recipe hub because recipe queries account for 40 to 60 percent of high-intent search volume in the food category. Every hero SKU needs 4 to 12 recipes anchored to it, each targeting a specific occasion and audience.
Skip the recipe hub and the brand loses the search real estate that pulls DTC storefront traffic month over month at zero incremental paid cost. Recipe traffic converts at 2 to 4 percent because the shopper landed with usage intent, not passive discovery, which is why food brands win on recipes.
Recipe schema and Google rich result eligibility
Every recipe page ships schema.org Recipe markup including cookTime, prepTime, recipeIngredient, recipeInstructions, nutrition, and aggregateRating. Correctly marked-up recipes qualify for Google’s recipe rich result carousel that pulls 3 to 6 times higher click-through rate than a plain blue link. The schema layer takes 15 minutes per recipe to author and 30 minutes to validate in Google Search Console. Cross-reference the recipe search stack on our food and beverage SEO page.
Recipe hub structure that scales
The recipe hub structure runs 40 to 100 recipes at maturity, organized by hero SKU (4 to 12 recipes per SKU) plus occasion tags (breakfast, weeknight dinner, meal prep, brunch, holiday). Every recipe links back to the hero SKU product page with the SKU embedded in an inline card. The hub earns internal linking value from ingredient comparison guides and the sourcing story pages, which feeds recipe ranking on Google. According to Google Search Central recipe structured data guidance, complete Recipe schema markup is required for eligibility in the recipe carousel and the ingredient search filter.
Pillar structure for food brand content marketing
The pillar structure on content marketing for food brands runs 4 content pillars concurrently: recipe hub (40 to 100 recipes), ingredient comparison guides (12 to 24 guides), sourcing story pages (6 to 12 pages), and buyer intent content (where to buy, subscription vs. one-time, gift bundle guides). Every pillar covers a distinct search intent and every pillar links back to the hero SKU product pages.
Ingredient comparison guide format
Ingredient comparison guides run 1,800 to 3,200 words comparing 2 to 4 ingredient types on 6 to 10 attributes with a comparison table, real-world use case examples, and links to the hero SKU that uses the specific ingredient. Example: organic vs. conventional oats compares nutritional profile, sourcing chain, cost, environmental impact, and taste on a 6-column table. The brand’s SKU appears in the winning column with a product card. These guides rank 3 to 8 months after publication and pull steady-state organic traffic.
Sourcing story pages that build trust
Sourcing story pages name the specific farms, cooperatives, or suppliers the brand sources from, with photos of the farms, farmer quotes, and specific harvest windows. A coffee brand’s Ethiopian farm page ranks for “single-origin Ethiopian coffee” and “Yirgacheffe coffee origin” plus 40 long-tail variations. The sourcing page pulls trust-building traffic that converts at 4 to 6 percent because the shopper landed pattern-matching on transparency and named provenance. Every sourcing page includes farmer or cooperative quotes, harvest dates, and a link back to 3 to 5 hero SKU pages that source from the named supplier.
Vejrø hospitality content case study
Vejrø Resort, a Danish private-island destination with an on-site restaurant focused on organic, locally sourced cuisine, joined us with strong social engagement and no organic-search real estate. Guests found the resort on Instagram but never in Google search for terms like “private island resort Denmark,” “farm-to-table hospitality Denmark,” or “Vejrø restaurant.” The same organic-search gap shows up on DTC food brands running paid social at 20,000 dollars monthly with a broken blog and zero recipe schema.
We built the conversion-focused website with on-site and off-site SEO tuned to the travel-niche keyword clusters, competitor analysis against comparable boutique resorts, and mobile-first design prioritizing guest discovery. Every page carried the structured data qualifying it for Google’s rich results in the hospitality category. Every internal link pushed authority toward the direct-booking conversion path.
Three months later, Vejrø hit 10,000 plus organic visitors, ranked for 200 plus first-page keywords, and pulled a 2.2 percent booking conversion rate from organic traffic. The same pattern applies to content marketing for food brands: recipe schema, ingredient comparison guides, and sourcing story pages pull organic traffic at 20 to 40 percent conversion into hero SKU pages inside 6 months when the content quality matches search intent and every page carries the right structured data markup. Vejrø also proved out the reporting discipline: every monthly report named the exact page, the exact keyword cluster, and the exact search feature (rich result, sitelinks, image pack) driving the incremental organic revenue instead of hiding behind aggregate traffic charts.
Recipe cadence and content calendar for food brands
Recipe cadence on a working food brand content calendar ships 2 to 4 new recipes per week during the first 6 months and drops to 1 per week at maturity. Each recipe takes 4 to 6 hours to produce (write, test in the kitchen, photograph, schema author, publish). At 3 recipes per week, the brand hits 78 recipes inside 6 months plus a backlog of ingredient comparison and sourcing content queued behind the recipe production line.
| Content pillar | Target volume year 1 | Production cost per piece | Refresh cadence |
|---|---|---|---|
| Recipe hub | 40 to 100 recipes | $180 to $320 | Every 12 months |
| Ingredient comparison guides | 12 to 24 guides | $450 to $780 | Every 18 months |
| Sourcing story pages | 6 to 12 pages | $680 to $1,200 | Every 24 months |
| Buyer intent content | 8 to 16 pieces | $220 to $420 | Every 12 months |
Photography as a content calendar constraint
Photography is the actual constraint on recipe cadence, not writing. Every recipe needs 6 to 12 photos: hero shot, ingredient flat lay, prep in progress, plated result, storage, and step shots for the schema markup. A working food brand batches photography 8 recipes at a time to keep the cost per recipe under 200 dollars. Skip the batching and the per-recipe cost climbs to 400 to 600 dollars, which caps recipe cadence at 1 per week and slows organic ranking timeline by 6 months.
Seasonal content calendar planning
Seasonal content calendar planning maps recipes and comparison guides to the seasonal windows they need to rank in. A Christmas cookie recipe needs to publish in September to rank by early December. A Valentine’s chocolate guide needs to publish in November to rank by early February. A back-to-school lunchbox recipe needs to publish in June to rank by late August. The 60-to-90-day ranking curve dictates the calendar.
Creator syndication inside food brand content
Creator syndication on food brand content marketing amplifies the recipe hub through Instagram Reels, TikTok, and YouTube Shorts creators paid to post their own version of the brand’s hero recipes. The creator content pulls net-new audiences into the recipe hub through the creator’s Link in Bio or Amazon Storefront tag. The syndication calendar names 12 to 30 creators per quarter with specific recipes assigned to each.
One brand we picked up had a spreadsheet titled “creator outreach 2023” with 47 rows and 3 responses. All 3 responses were auto-replies. The spreadsheet named zero recipes and offered flat rates below 100 dollars per post. Nobody posts a 30-second video for 87 dollars flat. Nobody.
Creator content commercial terms that work
Working creator content commercial terms run 350 to 1,500 dollars flat per post plus a 12 to 25 percent commission on tagged sales across a 30-day window. The commission mechanic pulls creators into follow-up posts because the incremental revenue continues past the initial fee. Mid-tier creators (30k to 150k followers) hit the sweet spot for food brand content because their engagement rate typically runs 4 to 8 percent versus 0.8 to 1.6 percent on mega-creators.
Content brief structure for creator partnerships
The content brief structure for creator partnerships runs a single page: the SKU, the specific recipe or usage occasion, 3 required brand mentions, 3 restricted claims (no health claims on non-medical SKUs), the pricing angle, the affiliate link, and 3 example videos that hit the tone. The brief avoids over-scripting because over-scripted creator content underperforms native creator voice by 40 to 60 percent on engagement rate.
Buyer intent content for food brand blogs
Buyer intent content on food brand blogs covers 8 to 16 pieces targeting explicit purchase-decision queries: “where to buy [brand],” “[brand] subscription vs. one-time,” “best [category] for [use case],” and “[brand] gift bundle.” Every buyer intent piece runs 1,400 to 2,400 words with a comparison table, product cards, and a clear conversion path to the specific SKU that matches the query intent. Buyer intent content converts at 3 to 6 percent versus 1 to 2 percent on recipe content because the shopper landed already planning to buy, not exploring a usage occasion.
Where-to-buy content structure
Where-to-buy content structure covers online (DTC storefront, Amazon, Target.com, Whole Foods online), retail (specific chain locators with the store finder embedded), and international (customs limitations, retailer partners abroad). Every piece names specific retailers, links to the store locator, and includes an FAQ block covering shipping availability, subscription options, and gift card compatibility. Where-to-buy content ranks for branded discovery queries the DTC storefront otherwise loses to competitor affiliate reviews.
Subscription versus one-time comparison content
Subscription versus one-time comparison content converts subscription commitments at 3 to 6 percent because it addresses the price-sensitivity concern head-on with a specific math table. The piece covers the discount structure (15 percent lifetime), the skip-a-month mechanic, the pause-anytime rule, the cancellation policy, and the specific yearly savings for the brand’s average consumption cadence. Cross-reference the retention structure on our food and beverage marketing retainer page.
Content refresh cadence on food brand pillars
Content refresh cadence on food brand content pillars runs a rolling audit every 12 to 24 months by pillar. Recipes get refreshed every 12 months with new photography, updated schema, and any nutrition or ingredient adjustments. Ingredient comparison guides refresh every 18 months to update market data. Sourcing story pages refresh every 24 months to reflect farm partnership changes and new harvest angles. Buyer intent content refreshes every 12 months to update retailer availability and pricing.
Recipe refresh priority order
Recipe refresh priority runs by organic traffic rank. The top 20 recipes by monthly organic sessions get refreshed first (new photography, schema audit, related recipe internal links, updated nutrition). The next 40 get refreshed at 15 months. The remaining recipes get refreshed opportunistically when the ranking slips past position 15 in Google. Skipping the refresh cadence lets recipe rankings drift out of the top 3 inside 18 months as newer competitor recipes take the position.
Schema audit checklist per refresh
The schema audit checklist per refresh runs 8 items: Recipe schema completeness, aggregateRating count and accuracy, nutrition data accuracy, prepTime and cookTime match the recipe body, image URLs valid at CDN, related recipe internal links working, product card SKU URL live, and Google Search Console rich result eligibility validated. This checklist takes 20 minutes per recipe and prevents the schema drift that costs recipe rankings 20 to 40 positions quietly.
Reporting cadence for food brand content marketing
Reporting cadence on food brand content marketing runs a monthly executive report plus a quarterly business review. The monthly report ships in the first business week and covers organic sessions by pillar, top 10 ranking recipes with position trend, ingredient guide ranking movements, sourcing page performance, and organic-attributed DTC revenue. Every number carries a comparison to the prior month and a plain-language interpretation the founder reads in 7 minutes.
Metrics that matter for content marketing
Metrics that matter for food brand content marketing: organic sessions by pillar, recipe rich result impressions in Search Console, organic conversion rate to hero SKU pages, organic-attributed DTC revenue, and top 20 ranking positions by monthly organic sessions. Vanity metrics that do not matter: total pageviews without conversion context, average time on page without conversion attribution, and social share counts. The monthly report skips the vanity block entirely.
Quarterly business review structure
The quarterly business review runs 90 minutes with the founder, head of content, and SEO lead. Agenda: organic traffic trend by pillar, top 10 winning content pieces, top 10 losing content pieces (candidates for refresh or removal), competitive gap analysis against 5 named competitor brands, and next quarter’s content calendar with recipes and ingredient guides queued. According to Ahrefs content marketing research, brands running quarterly content audits outperform brands running annual audits by 40 to 70 percent on organic revenue over a 24-month window.
Internal linking discipline across food brand content
Internal linking discipline across food brand content moves authority from recipe pages toward hero SKU product pages and comparison guides. Every recipe links to the hero SKU it uses inline (once in the ingredient list, once in a bottom call-out card). Every ingredient comparison guide links to 3 to 6 recipes using the winning ingredient plus the hero SKU product page. Every sourcing story links to the 2 to 4 SKUs sourced from that specific farm or cooperative.
Anchor text strategy across recipe hubs
Anchor text on internal links varies across recipe hubs to avoid over-optimization patterns Google penalizes. Exact-match anchor (“single-origin Ethiopian coffee”) runs on 20 to 30 percent of internal links. Partial-match variations (“our Ethiopian roast”) run on 30 to 40 percent. Branded anchors (the SKU name) run on 20 to 30 percent. Generic anchors (“shop the coffee”) fill the remaining 10 to 20 percent. This ratio holds ranking without triggering the over-optimization penalty that shows up on brands that anchor-text-stuff every internal link with the same exact-match keyword. Cross-reference the linking layer on our food and beverage web design page.
Link equity from ingredient guides to SKU pages
Link equity from ingredient guides passes to SKU pages when the guide’s comparison table names the hero SKU in the winning column with a product card, and when the guide’s body links to 3 to 6 recipes that use the winning ingredient. This 3-hop path (guide to recipe to SKU) pushes authority from a high-traffic informational query down to a high-intent transactional page. According to Search Engine Land SEO coverage, informational content that internally links to transactional pages produces 2 to 4 times higher organic revenue than isolated content silos.
Wrapping up content marketing for food brands
Content marketing for food brands is the organic engine that turns a DTC snack, drink, or CPG storefront into a search-driven revenue channel. Recipe hub of 40 to 100 recipes. Ingredient comparison guides at 12 to 24 pieces. Sourcing story pages at 6 to 12 pieces. Buyer intent content at 8 to 16 pieces. Creator syndication calendar with 12 to 30 creators per quarter. Refresh cadence at 12 to 24 months by pillar. Reporting with organic sessions and organic revenue attribution.
If your DTC food brand is running paid social at 20,000 dollars monthly with a broken blog and zero recipe schema, professional content marketing for food brands pays for itself inside the first 90 days on organic traffic captured. Redefine Web ships content marketing inside our monthly retainer packages. Book a call and we will walk through the last three DTC food brands we built recipe hubs for, pillar by pillar.
Anchor text on internal links varies across recipe hubs to avoid over-optimization patterns Google penalizes. Exact-match anchor (“single-origin Ethiopian coffee”) runs on 20 to 30 percent of internal links. Partial-match variations (“our Ethiopian roast”) run on 30 to 40 percent. Branded anchors (the SKU name) run on 20 to 30 percent. Generic anchors (“shop the coffee”) fill the remaining 10 to 20 percent. This ratio holds ranking without triggering the over-optimization penalty that shows up on brands that anchor-text-stuff every internal link with the same exact-match keyword. Cross-reference the linking layer on our food and beverage web design page.
Link equity from ingredient guides to SKU pages
Link equity from ingredient guides passes to SKU pages when the guide’s comparison table names the hero SKU in the winning column with a product card, and when the guide’s body links to 3 to 6 recipes that use the winning ingredient. This 3-hop path (guide to recipe to SKU) pushes authority from a high-traffic informational query down to a high-intent transactional page. According to Search Engine Land SEO coverage, informational content that internally links to transactional pages produces 2 to 4 times higher organic revenue than isolated content silos.
Wrapping up content marketing for food brands
Content marketing for food brands is the organic engine that turns a DTC snack, drink, or CPG storefront into a search-driven revenue channel. Recipe hub of 40 to 100 recipes. Ingredient comparison guides at 12 to 24 pieces. Sourcing story pages at 6 to 12 pieces. Buyer intent content at 8 to 16 pieces. Creator syndication calendar with 12 to 30 creators per quarter. Refresh cadence at 12 to 24 months by pillar. Reporting with organic sessions and organic revenue attribution.
If your DTC food brand is running paid social at 20,000 dollars monthly with a broken blog and zero recipe schema, professional content marketing for food brands pays for itself inside the first 90 days on organic traffic captured. Redefine Web ships content marketing inside our monthly retainer packages. Book a call and we will walk through the last three DTC food brands we built recipe hubs for, pillar by pillar.
Content marketing for food brands starts with a recipe hub because recipe queries account for 40 to 60 percent of high-intent search volume in the food category. Every hero SKU needs 4 to 12 recipes anchored to it, each targeting a specific occasion and audience.
Skip the recipe hub and the brand loses the search real estate that pulls DTC storefront traffic month over month at zero incremental paid cost. Recipe traffic converts at 2 to 4 percent because the shopper landed with usage intent, not passive discovery, which is why food brands win on recipes.
Recipe schema and Google rich result eligibility
Every recipe page ships schema.org Recipe markup including cookTime, prepTime, recipeIngredient, recipeInstructions, nutrition, and aggregateRating. Correctly marked-up recipes qualify for Google’s recipe rich result carousel that pulls 3 to 6 times higher click-through rate than a plain blue link. The schema layer takes 15 minutes per recipe to author and 30 minutes to validate in Google Search Console. Cross-reference the recipe search stack on our food and beverage SEO page.
Recipe hub structure that scales
The recipe hub structure runs 40 to 100 recipes at maturity, organized by hero SKU (4 to 12 recipes per SKU) plus occasion tags (breakfast, weeknight dinner, meal prep, brunch, holiday). Every recipe links back to the hero SKU product page with the SKU embedded in an inline card. The hub earns internal linking value from ingredient comparison guides and the sourcing story pages, which feeds recipe ranking on Google. According to Google Search Central recipe structured data guidance, complete Recipe schema markup is required for eligibility in the recipe carousel and the ingredient search filter.
Pillar structure for food brand content marketing
The pillar structure on content marketing for food brands runs 4 content pillars concurrently: recipe hub (40 to 100 recipes), ingredient comparison guides (12 to 24 guides), sourcing story pages (6 to 12 pages), and buyer intent content (where to buy, subscription vs. one-time, gift bundle guides). Every pillar covers a distinct search intent and every pillar links back to the hero SKU product pages.
Ingredient comparison guide format
Ingredient comparison guides run 1,800 to 3,200 words comparing 2 to 4 ingredient types on 6 to 10 attributes with a comparison table, real-world use case examples, and links to the hero SKU that uses the specific ingredient. Example: organic vs. conventional oats compares nutritional profile, sourcing chain, cost, environmental impact, and taste on a 6-column table. The brand’s SKU appears in the winning column with a product card. These guides rank 3 to 8 months after publication and pull steady-state organic traffic.
Sourcing story pages that build trust
Sourcing story pages name the specific farms, cooperatives, or suppliers the brand sources from, with photos of the farms, farmer quotes, and specific harvest windows. A coffee brand’s Ethiopian farm page ranks for “single-origin Ethiopian coffee” and “Yirgacheffe coffee origin” plus 40 long-tail variations. The sourcing page pulls trust-building traffic that converts at 4 to 6 percent because the shopper landed pattern-matching on transparency and named provenance. Every sourcing page includes farmer or cooperative quotes, harvest dates, and a link back to 3 to 5 hero SKU pages that source from the named supplier.
Vejrø hospitality content case study
Vejrø Resort, a Danish private-island destination with an on-site restaurant focused on organic, locally sourced cuisine, joined us with strong social engagement and no organic-search real estate. Guests found the resort on Instagram but never in Google search for terms like “private island resort Denmark,” “farm-to-table hospitality Denmark,” or “Vejrø restaurant.” The same organic-search gap shows up on DTC food brands running paid social at 20,000 dollars monthly with a broken blog and zero recipe schema.
We built the conversion-focused website with on-site and off-site SEO tuned to the travel-niche keyword clusters, competitor analysis against comparable boutique resorts, and mobile-first design prioritizing guest discovery. Every page carried the structured data qualifying it for Google’s rich results in the hospitality category. Every internal link pushed authority toward the direct-booking conversion path.
Three months later, Vejrø hit 10,000 plus organic visitors, ranked for 200 plus first-page keywords, and pulled a 2.2 percent booking conversion rate from organic traffic. The same pattern applies to content marketing for food brands: recipe schema, ingredient comparison guides, and sourcing story pages pull organic traffic at 20 to 40 percent conversion into hero SKU pages inside 6 months when the content quality matches search intent and every page carries the right structured data markup. Vejrø also proved out the reporting discipline: every monthly report named the exact page, the exact keyword cluster, and the exact search feature (rich result, sitelinks, image pack) driving the incremental organic revenue instead of hiding behind aggregate traffic charts.
Recipe cadence and content calendar for food brands
Recipe cadence on a working food brand content calendar ships 2 to 4 new recipes per week during the first 6 months and drops to 1 per week at maturity. Each recipe takes 4 to 6 hours to produce (write, test in the kitchen, photograph, schema author, publish). At 3 recipes per week, the brand hits 78 recipes inside 6 months plus a backlog of ingredient comparison and sourcing content queued behind the recipe production line.
| Content pillar | Target volume year 1 | Production cost per piece | Refresh cadence |
|---|---|---|---|
| Recipe hub | 40 to 100 recipes | $180 to $320 | Every 12 months |
| Ingredient comparison guides | 12 to 24 guides | $450 to $780 | Every 18 months |
| Sourcing story pages | 6 to 12 pages | $680 to $1,200 | Every 24 months |
| Buyer intent content | 8 to 16 pieces | $220 to $420 | Every 12 months |
Photography as a content calendar constraint
Photography is the actual constraint on recipe cadence, not writing. Every recipe needs 6 to 12 photos: hero shot, ingredient flat lay, prep in progress, plated result, storage, and step shots for the schema markup. A working food brand batches photography 8 recipes at a time to keep the cost per recipe under 200 dollars. Skip the batching and the per-recipe cost climbs to 400 to 600 dollars, which caps recipe cadence at 1 per week and slows organic ranking timeline by 6 months.
Seasonal content calendar planning
Seasonal content calendar planning maps recipes and comparison guides to the seasonal windows they need to rank in. A Christmas cookie recipe needs to publish in September to rank by early December. A Valentine’s chocolate guide needs to publish in November to rank by early February. A back-to-school lunchbox recipe needs to publish in June to rank by late August. The 60-to-90-day ranking curve dictates the calendar.
Creator syndication inside food brand content
Creator syndication on food brand content marketing amplifies the recipe hub through Instagram Reels, TikTok, and YouTube Shorts creators paid to post their own version of the brand’s hero recipes. The creator content pulls net-new audiences into the recipe hub through the creator’s Link in Bio or Amazon Storefront tag. The syndication calendar names 12 to 30 creators per quarter with specific recipes assigned to each.
One brand we picked up had a spreadsheet titled “creator outreach 2023” with 47 rows and 3 responses. All 3 responses were auto-replies. The spreadsheet named zero recipes and offered flat rates below 100 dollars per post. Nobody posts a 30-second video for 87 dollars flat. Nobody.
Creator content commercial terms that work
Working creator content commercial terms run 350 to 1,500 dollars flat per post plus a 12 to 25 percent commission on tagged sales across a 30-day window. The commission mechanic pulls creators into follow-up posts because the incremental revenue continues past the initial fee. Mid-tier creators (30k to 150k followers) hit the sweet spot for food brand content because their engagement rate typically runs 4 to 8 percent versus 0.8 to 1.6 percent on mega-creators.
Content brief structure for creator partnerships
The content brief structure for creator partnerships runs a single page: the SKU, the specific recipe or usage occasion, 3 required brand mentions, 3 restricted claims (no health claims on non-medical SKUs), the pricing angle, the affiliate link, and 3 example videos that hit the tone. The brief avoids over-scripting because over-scripted creator content underperforms native creator voice by 40 to 60 percent on engagement rate.
Buyer intent content for food brand blogs
Buyer intent content on food brand blogs covers 8 to 16 pieces targeting explicit purchase-decision queries: “where to buy [brand],” “[brand] subscription vs. one-time,” “best [category] for [use case],” and “[brand] gift bundle.” Every buyer intent piece runs 1,400 to 2,400 words with a comparison table, product cards, and a clear conversion path to the specific SKU that matches the query intent. Buyer intent content converts at 3 to 6 percent versus 1 to 2 percent on recipe content because the shopper landed already planning to buy, not exploring a usage occasion.
Where-to-buy content structure
Where-to-buy content structure covers online (DTC storefront, Amazon, Target.com, Whole Foods online), retail (specific chain locators with the store finder embedded), and international (customs limitations, retailer partners abroad). Every piece names specific retailers, links to the store locator, and includes an FAQ block covering shipping availability, subscription options, and gift card compatibility. Where-to-buy content ranks for branded discovery queries the DTC storefront otherwise loses to competitor affiliate reviews.
Subscription versus one-time comparison content
Subscription versus one-time comparison content converts subscription commitments at 3 to 6 percent because it addresses the price-sensitivity concern head-on with a specific math table. The piece covers the discount structure (15 percent lifetime), the skip-a-month mechanic, the pause-anytime rule, the cancellation policy, and the specific yearly savings for the brand’s average consumption cadence. Cross-reference the retention structure on our food and beverage marketing retainer page.
Content refresh cadence on food brand pillars
Content refresh cadence on food brand content pillars runs a rolling audit every 12 to 24 months by pillar. Recipes get refreshed every 12 months with new photography, updated schema, and any nutrition or ingredient adjustments. Ingredient comparison guides refresh every 18 months to update market data. Sourcing story pages refresh every 24 months to reflect farm partnership changes and new harvest angles. Buyer intent content refreshes every 12 months to update retailer availability and pricing.
Recipe refresh priority order
Recipe refresh priority runs by organic traffic rank. The top 20 recipes by monthly organic sessions get refreshed first (new photography, schema audit, related recipe internal links, updated nutrition). The next 40 get refreshed at 15 months. The remaining recipes get refreshed opportunistically when the ranking slips past position 15 in Google. Skipping the refresh cadence lets recipe rankings drift out of the top 3 inside 18 months as newer competitor recipes take the position.
Schema audit checklist per refresh
The schema audit checklist per refresh runs 8 items: Recipe schema completeness, aggregateRating count and accuracy, nutrition data accuracy, prepTime and cookTime match the recipe body, image URLs valid at CDN, related recipe internal links working, product card SKU URL live, and Google Search Console rich result eligibility validated. This checklist takes 20 minutes per recipe and prevents the schema drift that costs recipe rankings 20 to 40 positions quietly.
Reporting cadence for food brand content marketing
Reporting cadence on food brand content marketing runs a monthly executive report plus a quarterly business review. The monthly report ships in the first business week and covers organic sessions by pillar, top 10 ranking recipes with position trend, ingredient guide ranking movements, sourcing page performance, and organic-attributed DTC revenue. Every number carries a comparison to the prior month and a plain-language interpretation the founder reads in 7 minutes.
Metrics that matter for content marketing
Metrics that matter for food brand content marketing: organic sessions by pillar, recipe rich result impressions in Search Console, organic conversion rate to hero SKU pages, organic-attributed DTC revenue, and top 20 ranking positions by monthly organic sessions. Vanity metrics that do not matter: total pageviews without conversion context, average time on page without conversion attribution, and social share counts. The monthly report skips the vanity block entirely.
Quarterly business review structure
The quarterly business review runs 90 minutes with the founder, head of content, and SEO lead. Agenda: organic traffic trend by pillar, top 10 winning content pieces, top 10 losing content pieces (candidates for refresh or removal), competitive gap analysis against 5 named competitor brands, and next quarter’s content calendar with recipes and ingredient guides queued. According to Ahrefs content marketing research, brands running quarterly content audits outperform brands running annual audits by 40 to 70 percent on organic revenue over a 24-month window.
Internal linking discipline across food brand content
Internal linking discipline across food brand content moves authority from recipe pages toward hero SKU product pages and comparison guides. Every recipe links to the hero SKU it uses inline (once in the ingredient list, once in a bottom call-out card). Every ingredient comparison guide links to 3 to 6 recipes using the winning ingredient plus the hero SKU product page. Every sourcing story links to the 2 to 4 SKUs sourced from that specific farm or cooperative.
Anchor text strategy across recipe hubs
Anchor text on internal links varies across recipe hubs to avoid over-optimization patterns Google penalizes. Exact-match anchor (“single-origin Ethiopian coffee”) runs on 20 to 30 percent of internal links. Partial-match variations (“our Ethiopian roast”) run on 30 to 40 percent. Branded anchors (the SKU name) run on 20 to 30 percent. Generic anchors (“shop the coffee”) fill the remaining 10 to 20 percent. This ratio holds ranking without triggering the over-optimization penalty that shows up on brands that anchor-text-stuff every internal link with the same exact-match keyword. Cross-reference the linking layer on our food and beverage web design page.
Link equity from ingredient guides to SKU pages
Link equity from ingredient guides passes to SKU pages when the guide’s comparison table names the hero SKU in the winning column with a product card, and when the guide’s body links to 3 to 6 recipes that use the winning ingredient. This 3-hop path (guide to recipe to SKU) pushes authority from a high-traffic informational query down to a high-intent transactional page. According to Search Engine Land SEO coverage, informational content that internally links to transactional pages produces 2 to 4 times higher organic revenue than isolated content silos.
Wrapping up content marketing for food brands
Content marketing for food brands is the organic engine that turns a DTC snack, drink, or CPG storefront into a search-driven revenue channel. Recipe hub of 40 to 100 recipes. Ingredient comparison guides at 12 to 24 pieces. Sourcing story pages at 6 to 12 pieces. Buyer intent content at 8 to 16 pieces. Creator syndication calendar with 12 to 30 creators per quarter. Refresh cadence at 12 to 24 months by pillar. Reporting with organic sessions and organic revenue attribution.
If your DTC food brand is running paid social at 20,000 dollars monthly with a broken blog and zero recipe schema, professional content marketing for food brands pays for itself inside the first 90 days on organic traffic captured. Redefine Web ships content marketing inside our monthly retainer packages. Book a call and we will walk through the last three DTC food brands we built recipe hubs for, pillar by pillar.
Content marketing for food brands starts with a recipe hub because recipe queries account for 40 to 60 percent of high-intent search volume in the food category. Every hero SKU needs 4 to 12 recipes anchored to it, each targeting a specific occasion and audience.
Skip the recipe hub and the brand loses the search real estate that pulls DTC storefront traffic month over month at zero incremental paid cost. Recipe traffic converts at 2 to 4 percent because the shopper landed with usage intent, not passive discovery, which is why food brands win on recipes.
Recipe schema and Google rich result eligibility
Every recipe page ships schema.org Recipe markup including cookTime, prepTime, recipeIngredient, recipeInstructions, nutrition, and aggregateRating. Correctly marked-up recipes qualify for Google’s recipe rich result carousel that pulls 3 to 6 times higher click-through rate than a plain blue link. The schema layer takes 15 minutes per recipe to author and 30 minutes to validate in Google Search Console. Cross-reference the recipe search stack on our food and beverage SEO page.
Recipe hub structure that scales
The recipe hub structure runs 40 to 100 recipes at maturity, organized by hero SKU (4 to 12 recipes per SKU) plus occasion tags (breakfast, weeknight dinner, meal prep, brunch, holiday). Every recipe links back to the hero SKU product page with the SKU embedded in an inline card. The hub earns internal linking value from ingredient comparison guides and the sourcing story pages, which feeds recipe ranking on Google. According to Google Search Central recipe structured data guidance, complete Recipe schema markup is required for eligibility in the recipe carousel and the ingredient search filter.
Pillar structure for food brand content marketing
The pillar structure on content marketing for food brands runs 4 content pillars concurrently: recipe hub (40 to 100 recipes), ingredient comparison guides (12 to 24 guides), sourcing story pages (6 to 12 pages), and buyer intent content (where to buy, subscription vs. one-time, gift bundle guides). Every pillar covers a distinct search intent and every pillar links back to the hero SKU product pages.
Ingredient comparison guide format
Ingredient comparison guides run 1,800 to 3,200 words comparing 2 to 4 ingredient types on 6 to 10 attributes with a comparison table, real-world use case examples, and links to the hero SKU that uses the specific ingredient. Example: organic vs. conventional oats compares nutritional profile, sourcing chain, cost, environmental impact, and taste on a 6-column table. The brand’s SKU appears in the winning column with a product card. These guides rank 3 to 8 months after publication and pull steady-state organic traffic.
Sourcing story pages that build trust
Sourcing story pages name the specific farms, cooperatives, or suppliers the brand sources from, with photos of the farms, farmer quotes, and specific harvest windows. A coffee brand’s Ethiopian farm page ranks for “single-origin Ethiopian coffee” and “Yirgacheffe coffee origin” plus 40 long-tail variations. The sourcing page pulls trust-building traffic that converts at 4 to 6 percent because the shopper landed pattern-matching on transparency and named provenance. Every sourcing page includes farmer or cooperative quotes, harvest dates, and a link back to 3 to 5 hero SKU pages that source from the named supplier.
Vejrø hospitality content case study
Vejrø Resort, a Danish private-island destination with an on-site restaurant focused on organic, locally sourced cuisine, joined us with strong social engagement and no organic-search real estate. Guests found the resort on Instagram but never in Google search for terms like “private island resort Denmark,” “farm-to-table hospitality Denmark,” or “Vejrø restaurant.” The same organic-search gap shows up on DTC food brands running paid social at 20,000 dollars monthly with a broken blog and zero recipe schema.
We built the conversion-focused website with on-site and off-site SEO tuned to the travel-niche keyword clusters, competitor analysis against comparable boutique resorts, and mobile-first design prioritizing guest discovery. Every page carried the structured data qualifying it for Google’s rich results in the hospitality category. Every internal link pushed authority toward the direct-booking conversion path.
Three months later, Vejrø hit 10,000 plus organic visitors, ranked for 200 plus first-page keywords, and pulled a 2.2 percent booking conversion rate from organic traffic. The same pattern applies to content marketing for food brands: recipe schema, ingredient comparison guides, and sourcing story pages pull organic traffic at 20 to 40 percent conversion into hero SKU pages inside 6 months when the content quality matches search intent and every page carries the right structured data markup. Vejrø also proved out the reporting discipline: every monthly report named the exact page, the exact keyword cluster, and the exact search feature (rich result, sitelinks, image pack) driving the incremental organic revenue instead of hiding behind aggregate traffic charts.
Recipe cadence and content calendar for food brands
Recipe cadence on a working food brand content calendar ships 2 to 4 new recipes per week during the first 6 months and drops to 1 per week at maturity. Each recipe takes 4 to 6 hours to produce (write, test in the kitchen, photograph, schema author, publish). At 3 recipes per week, the brand hits 78 recipes inside 6 months plus a backlog of ingredient comparison and sourcing content queued behind the recipe production line.
| Content pillar | Target volume year 1 | Production cost per piece | Refresh cadence |
|---|---|---|---|
| Recipe hub | 40 to 100 recipes | $180 to $320 | Every 12 months |
| Ingredient comparison guides | 12 to 24 guides | $450 to $780 | Every 18 months |
| Sourcing story pages | 6 to 12 pages | $680 to $1,200 | Every 24 months |
| Buyer intent content | 8 to 16 pieces | $220 to $420 | Every 12 months |
Photography as a content calendar constraint
Photography is the actual constraint on recipe cadence, not writing. Every recipe needs 6 to 12 photos: hero shot, ingredient flat lay, prep in progress, plated result, storage, and step shots for the schema markup. A working food brand batches photography 8 recipes at a time to keep the cost per recipe under 200 dollars. Skip the batching and the per-recipe cost climbs to 400 to 600 dollars, which caps recipe cadence at 1 per week and slows organic ranking timeline by 6 months.
Seasonal content calendar planning
Seasonal content calendar planning maps recipes and comparison guides to the seasonal windows they need to rank in. A Christmas cookie recipe needs to publish in September to rank by early December. A Valentine’s chocolate guide needs to publish in November to rank by early February. A back-to-school lunchbox recipe needs to publish in June to rank by late August. The 60-to-90-day ranking curve dictates the calendar.
Creator syndication inside food brand content
Creator syndication on food brand content marketing amplifies the recipe hub through Instagram Reels, TikTok, and YouTube Shorts creators paid to post their own version of the brand’s hero recipes. The creator content pulls net-new audiences into the recipe hub through the creator’s Link in Bio or Amazon Storefront tag. The syndication calendar names 12 to 30 creators per quarter with specific recipes assigned to each.
One brand we picked up had a spreadsheet titled “creator outreach 2023” with 47 rows and 3 responses. All 3 responses were auto-replies. The spreadsheet named zero recipes and offered flat rates below 100 dollars per post. Nobody posts a 30-second video for 87 dollars flat. Nobody.
Creator content commercial terms that work
Working creator content commercial terms run 350 to 1,500 dollars flat per post plus a 12 to 25 percent commission on tagged sales across a 30-day window. The commission mechanic pulls creators into follow-up posts because the incremental revenue continues past the initial fee. Mid-tier creators (30k to 150k followers) hit the sweet spot for food brand content because their engagement rate typically runs 4 to 8 percent versus 0.8 to 1.6 percent on mega-creators.
Content brief structure for creator partnerships
The content brief structure for creator partnerships runs a single page: the SKU, the specific recipe or usage occasion, 3 required brand mentions, 3 restricted claims (no health claims on non-medical SKUs), the pricing angle, the affiliate link, and 3 example videos that hit the tone. The brief avoids over-scripting because over-scripted creator content underperforms native creator voice by 40 to 60 percent on engagement rate.
Buyer intent content for food brand blogs
Buyer intent content on food brand blogs covers 8 to 16 pieces targeting explicit purchase-decision queries: “where to buy [brand],” “[brand] subscription vs. one-time,” “best [category] for [use case],” and “[brand] gift bundle.” Every buyer intent piece runs 1,400 to 2,400 words with a comparison table, product cards, and a clear conversion path to the specific SKU that matches the query intent. Buyer intent content converts at 3 to 6 percent versus 1 to 2 percent on recipe content because the shopper landed already planning to buy, not exploring a usage occasion.
Where-to-buy content structure
Where-to-buy content structure covers online (DTC storefront, Amazon, Target.com, Whole Foods online), retail (specific chain locators with the store finder embedded), and international (customs limitations, retailer partners abroad). Every piece names specific retailers, links to the store locator, and includes an FAQ block covering shipping availability, subscription options, and gift card compatibility. Where-to-buy content ranks for branded discovery queries the DTC storefront otherwise loses to competitor affiliate reviews.
Subscription versus one-time comparison content
Subscription versus one-time comparison content converts subscription commitments at 3 to 6 percent because it addresses the price-sensitivity concern head-on with a specific math table. The piece covers the discount structure (15 percent lifetime), the skip-a-month mechanic, the pause-anytime rule, the cancellation policy, and the specific yearly savings for the brand’s average consumption cadence. Cross-reference the retention structure on our food and beverage marketing retainer page.
Content refresh cadence on food brand pillars
Content refresh cadence on food brand content pillars runs a rolling audit every 12 to 24 months by pillar. Recipes get refreshed every 12 months with new photography, updated schema, and any nutrition or ingredient adjustments. Ingredient comparison guides refresh every 18 months to update market data. Sourcing story pages refresh every 24 months to reflect farm partnership changes and new harvest angles. Buyer intent content refreshes every 12 months to update retailer availability and pricing.
Recipe refresh priority order
Recipe refresh priority runs by organic traffic rank. The top 20 recipes by monthly organic sessions get refreshed first (new photography, schema audit, related recipe internal links, updated nutrition). The next 40 get refreshed at 15 months. The remaining recipes get refreshed opportunistically when the ranking slips past position 15 in Google. Skipping the refresh cadence lets recipe rankings drift out of the top 3 inside 18 months as newer competitor recipes take the position.
Schema audit checklist per refresh
The schema audit checklist per refresh runs 8 items: Recipe schema completeness, aggregateRating count and accuracy, nutrition data accuracy, prepTime and cookTime match the recipe body, image URLs valid at CDN, related recipe internal links working, product card SKU URL live, and Google Search Console rich result eligibility validated. This checklist takes 20 minutes per recipe and prevents the schema drift that costs recipe rankings 20 to 40 positions quietly.
Reporting cadence for food brand content marketing
Reporting cadence on food brand content marketing runs a monthly executive report plus a quarterly business review. The monthly report ships in the first business week and covers organic sessions by pillar, top 10 ranking recipes with position trend, ingredient guide ranking movements, sourcing page performance, and organic-attributed DTC revenue. Every number carries a comparison to the prior month and a plain-language interpretation the founder reads in 7 minutes.
Metrics that matter for content marketing
Metrics that matter for food brand content marketing: organic sessions by pillar, recipe rich result impressions in Search Console, organic conversion rate to hero SKU pages, organic-attributed DTC revenue, and top 20 ranking positions by monthly organic sessions. Vanity metrics that do not matter: total pageviews without conversion context, average time on page without conversion attribution, and social share counts. The monthly report skips the vanity block entirely.
Quarterly business review structure
The quarterly business review runs 90 minutes with the founder, head of content, and SEO lead. Agenda: organic traffic trend by pillar, top 10 winning content pieces, top 10 losing content pieces (candidates for refresh or removal), competitive gap analysis against 5 named competitor brands, and next quarter’s content calendar with recipes and ingredient guides queued. According to Ahrefs content marketing research, brands running quarterly content audits outperform brands running annual audits by 40 to 70 percent on organic revenue over a 24-month window.
Internal linking discipline across food brand content
Internal linking discipline across food brand content moves authority from recipe pages toward hero SKU product pages and comparison guides. Every recipe links to the hero SKU it uses inline (once in the ingredient list, once in a bottom call-out card). Every ingredient comparison guide links to 3 to 6 recipes using the winning ingredient plus the hero SKU product page. Every sourcing story links to the 2 to 4 SKUs sourced from that specific farm or cooperative.
Anchor text strategy across recipe hubs
Anchor text on internal links varies across recipe hubs to avoid over-optimization patterns Google penalizes. Exact-match anchor (“single-origin Ethiopian coffee”) runs on 20 to 30 percent of internal links. Partial-match variations (“our Ethiopian roast”) run on 30 to 40 percent. Branded anchors (the SKU name) run on 20 to 30 percent. Generic anchors (“shop the coffee”) fill the remaining 10 to 20 percent. This ratio holds ranking without triggering the over-optimization penalty that shows up on brands that anchor-text-stuff every internal link with the same exact-match keyword. Cross-reference the linking layer on our food and beverage web design page.
Link equity from ingredient guides to SKU pages
Link equity from ingredient guides passes to SKU pages when the guide’s comparison table names the hero SKU in the winning column with a product card, and when the guide’s body links to 3 to 6 recipes that use the winning ingredient. This 3-hop path (guide to recipe to SKU) pushes authority from a high-traffic informational query down to a high-intent transactional page. According to Search Engine Land SEO coverage, informational content that internally links to transactional pages produces 2 to 4 times higher organic revenue than isolated content silos.
Wrapping up content marketing for food brands
Content marketing for food brands is the organic engine that turns a DTC snack, drink, or CPG storefront into a search-driven revenue channel. Recipe hub of 40 to 100 recipes. Ingredient comparison guides at 12 to 24 pieces. Sourcing story pages at 6 to 12 pieces. Buyer intent content at 8 to 16 pieces. Creator syndication calendar with 12 to 30 creators per quarter. Refresh cadence at 12 to 24 months by pillar. Reporting with organic sessions and organic revenue attribution.
If your DTC food brand is running paid social at 20,000 dollars monthly with a broken blog and zero recipe schema, professional content marketing for food brands pays for itself inside the first 90 days on organic traffic captured. Redefine Web ships content marketing inside our monthly retainer packages. Book a call and we will walk through the last three DTC food brands we built recipe hubs for, pillar by pillar.
Internal linking discipline across food brand content moves authority from recipe pages toward hero SKU product pages and comparison guides. Every recipe links to the hero SKU it uses inline (once in the ingredient list, once in a bottom call-out card). Every ingredient comparison guide links to 3 to 6 recipes using the winning ingredient plus the hero SKU product page. Every sourcing story links to the 2 to 4 SKUs sourced from that specific farm or cooperative.
Anchor text strategy across recipe hubs
Anchor text on internal links varies across recipe hubs to avoid over-optimization patterns Google penalizes. Exact-match anchor (“single-origin Ethiopian coffee”) runs on 20 to 30 percent of internal links. Partial-match variations (“our Ethiopian roast”) run on 30 to 40 percent. Branded anchors (the SKU name) run on 20 to 30 percent. Generic anchors (“shop the coffee”) fill the remaining 10 to 20 percent. This ratio holds ranking without triggering the over-optimization penalty that shows up on brands that anchor-text-stuff every internal link with the same exact-match keyword. Cross-reference the linking layer on our food and beverage web design page.
Link equity from ingredient guides to SKU pages
Link equity from ingredient guides passes to SKU pages when the guide’s comparison table names the hero SKU in the winning column with a product card, and when the guide’s body links to 3 to 6 recipes that use the winning ingredient. This 3-hop path (guide to recipe to SKU) pushes authority from a high-traffic informational query down to a high-intent transactional page. According to Search Engine Land SEO coverage, informational content that internally links to transactional pages produces 2 to 4 times higher organic revenue than isolated content silos.
Wrapping up content marketing for food brands
Content marketing for food brands is the organic engine that turns a DTC snack, drink, or CPG storefront into a search-driven revenue channel. Recipe hub of 40 to 100 recipes. Ingredient comparison guides at 12 to 24 pieces. Sourcing story pages at 6 to 12 pieces. Buyer intent content at 8 to 16 pieces. Creator syndication calendar with 12 to 30 creators per quarter. Refresh cadence at 12 to 24 months by pillar. Reporting with organic sessions and organic revenue attribution.
If your DTC food brand is running paid social at 20,000 dollars monthly with a broken blog and zero recipe schema, professional content marketing for food brands pays for itself inside the first 90 days on organic traffic captured. Redefine Web ships content marketing inside our monthly retainer packages. Book a call and we will walk through the last three DTC food brands we built recipe hubs for, pillar by pillar.
Content marketing for food brands starts with a recipe hub because recipe queries account for 40 to 60 percent of high-intent search volume in the food category. Every hero SKU needs 4 to 12 recipes anchored to it, each targeting a specific occasion and audience.
Skip the recipe hub and the brand loses the search real estate that pulls DTC storefront traffic month over month at zero incremental paid cost. Recipe traffic converts at 2 to 4 percent because the shopper landed with usage intent, not passive discovery, which is why food brands win on recipes.
Recipe schema and Google rich result eligibility
Every recipe page ships schema.org Recipe markup including cookTime, prepTime, recipeIngredient, recipeInstructions, nutrition, and aggregateRating. Correctly marked-up recipes qualify for Google’s recipe rich result carousel that pulls 3 to 6 times higher click-through rate than a plain blue link. The schema layer takes 15 minutes per recipe to author and 30 minutes to validate in Google Search Console. Cross-reference the recipe search stack on our food and beverage SEO page.
Recipe hub structure that scales
The recipe hub structure runs 40 to 100 recipes at maturity, organized by hero SKU (4 to 12 recipes per SKU) plus occasion tags (breakfast, weeknight dinner, meal prep, brunch, holiday). Every recipe links back to the hero SKU product page with the SKU embedded in an inline card. The hub earns internal linking value from ingredient comparison guides and the sourcing story pages, which feeds recipe ranking on Google. According to Google Search Central recipe structured data guidance, complete Recipe schema markup is required for eligibility in the recipe carousel and the ingredient search filter.
Pillar structure for food brand content marketing
The pillar structure on content marketing for food brands runs 4 content pillars concurrently: recipe hub (40 to 100 recipes), ingredient comparison guides (12 to 24 guides), sourcing story pages (6 to 12 pages), and buyer intent content (where to buy, subscription vs. one-time, gift bundle guides). Every pillar covers a distinct search intent and every pillar links back to the hero SKU product pages.
Ingredient comparison guide format
Ingredient comparison guides run 1,800 to 3,200 words comparing 2 to 4 ingredient types on 6 to 10 attributes with a comparison table, real-world use case examples, and links to the hero SKU that uses the specific ingredient. Example: organic vs. conventional oats compares nutritional profile, sourcing chain, cost, environmental impact, and taste on a 6-column table. The brand’s SKU appears in the winning column with a product card. These guides rank 3 to 8 months after publication and pull steady-state organic traffic.
Sourcing story pages that build trust
Sourcing story pages name the specific farms, cooperatives, or suppliers the brand sources from, with photos of the farms, farmer quotes, and specific harvest windows. A coffee brand’s Ethiopian farm page ranks for “single-origin Ethiopian coffee” and “Yirgacheffe coffee origin” plus 40 long-tail variations. The sourcing page pulls trust-building traffic that converts at 4 to 6 percent because the shopper landed pattern-matching on transparency and named provenance. Every sourcing page includes farmer or cooperative quotes, harvest dates, and a link back to 3 to 5 hero SKU pages that source from the named supplier.
Vejrø hospitality content case study
Vejrø Resort, a Danish private-island destination with an on-site restaurant focused on organic, locally sourced cuisine, joined us with strong social engagement and no organic-search real estate. Guests found the resort on Instagram but never in Google search for terms like “private island resort Denmark,” “farm-to-table hospitality Denmark,” or “Vejrø restaurant.” The same organic-search gap shows up on DTC food brands running paid social at 20,000 dollars monthly with a broken blog and zero recipe schema.
We built the conversion-focused website with on-site and off-site SEO tuned to the travel-niche keyword clusters, competitor analysis against comparable boutique resorts, and mobile-first design prioritizing guest discovery. Every page carried the structured data qualifying it for Google’s rich results in the hospitality category. Every internal link pushed authority toward the direct-booking conversion path.
Three months later, Vejrø hit 10,000 plus organic visitors, ranked for 200 plus first-page keywords, and pulled a 2.2 percent booking conversion rate from organic traffic. The same pattern applies to content marketing for food brands: recipe schema, ingredient comparison guides, and sourcing story pages pull organic traffic at 20 to 40 percent conversion into hero SKU pages inside 6 months when the content quality matches search intent and every page carries the right structured data markup. Vejrø also proved out the reporting discipline: every monthly report named the exact page, the exact keyword cluster, and the exact search feature (rich result, sitelinks, image pack) driving the incremental organic revenue instead of hiding behind aggregate traffic charts.
Recipe cadence and content calendar for food brands
Recipe cadence on a working food brand content calendar ships 2 to 4 new recipes per week during the first 6 months and drops to 1 per week at maturity. Each recipe takes 4 to 6 hours to produce (write, test in the kitchen, photograph, schema author, publish). At 3 recipes per week, the brand hits 78 recipes inside 6 months plus a backlog of ingredient comparison and sourcing content queued behind the recipe production line.
| Content pillar | Target volume year 1 | Production cost per piece | Refresh cadence |
|---|---|---|---|
| Recipe hub | 40 to 100 recipes | $180 to $320 | Every 12 months |
| Ingredient comparison guides | 12 to 24 guides | $450 to $780 | Every 18 months |
| Sourcing story pages | 6 to 12 pages | $680 to $1,200 | Every 24 months |
| Buyer intent content | 8 to 16 pieces | $220 to $420 | Every 12 months |
Photography as a content calendar constraint
Photography is the actual constraint on recipe cadence, not writing. Every recipe needs 6 to 12 photos: hero shot, ingredient flat lay, prep in progress, plated result, storage, and step shots for the schema markup. A working food brand batches photography 8 recipes at a time to keep the cost per recipe under 200 dollars. Skip the batching and the per-recipe cost climbs to 400 to 600 dollars, which caps recipe cadence at 1 per week and slows organic ranking timeline by 6 months.
Seasonal content calendar planning
Seasonal content calendar planning maps recipes and comparison guides to the seasonal windows they need to rank in. A Christmas cookie recipe needs to publish in September to rank by early December. A Valentine’s chocolate guide needs to publish in November to rank by early February. A back-to-school lunchbox recipe needs to publish in June to rank by late August. The 60-to-90-day ranking curve dictates the calendar.
Creator syndication inside food brand content
Creator syndication on food brand content marketing amplifies the recipe hub through Instagram Reels, TikTok, and YouTube Shorts creators paid to post their own version of the brand’s hero recipes. The creator content pulls net-new audiences into the recipe hub through the creator’s Link in Bio or Amazon Storefront tag. The syndication calendar names 12 to 30 creators per quarter with specific recipes assigned to each.
One brand we picked up had a spreadsheet titled “creator outreach 2023” with 47 rows and 3 responses. All 3 responses were auto-replies. The spreadsheet named zero recipes and offered flat rates below 100 dollars per post. Nobody posts a 30-second video for 87 dollars flat. Nobody.
Creator content commercial terms that work
Working creator content commercial terms run 350 to 1,500 dollars flat per post plus a 12 to 25 percent commission on tagged sales across a 30-day window. The commission mechanic pulls creators into follow-up posts because the incremental revenue continues past the initial fee. Mid-tier creators (30k to 150k followers) hit the sweet spot for food brand content because their engagement rate typically runs 4 to 8 percent versus 0.8 to 1.6 percent on mega-creators.
Content brief structure for creator partnerships
The content brief structure for creator partnerships runs a single page: the SKU, the specific recipe or usage occasion, 3 required brand mentions, 3 restricted claims (no health claims on non-medical SKUs), the pricing angle, the affiliate link, and 3 example videos that hit the tone. The brief avoids over-scripting because over-scripted creator content underperforms native creator voice by 40 to 60 percent on engagement rate.
Buyer intent content for food brand blogs
Buyer intent content on food brand blogs covers 8 to 16 pieces targeting explicit purchase-decision queries: “where to buy [brand],” “[brand] subscription vs. one-time,” “best [category] for [use case],” and “[brand] gift bundle.” Every buyer intent piece runs 1,400 to 2,400 words with a comparison table, product cards, and a clear conversion path to the specific SKU that matches the query intent. Buyer intent content converts at 3 to 6 percent versus 1 to 2 percent on recipe content because the shopper landed already planning to buy, not exploring a usage occasion.
Where-to-buy content structure
Where-to-buy content structure covers online (DTC storefront, Amazon, Target.com, Whole Foods online), retail (specific chain locators with the store finder embedded), and international (customs limitations, retailer partners abroad). Every piece names specific retailers, links to the store locator, and includes an FAQ block covering shipping availability, subscription options, and gift card compatibility. Where-to-buy content ranks for branded discovery queries the DTC storefront otherwise loses to competitor affiliate reviews.
Subscription versus one-time comparison content
Subscription versus one-time comparison content converts subscription commitments at 3 to 6 percent because it addresses the price-sensitivity concern head-on with a specific math table. The piece covers the discount structure (15 percent lifetime), the skip-a-month mechanic, the pause-anytime rule, the cancellation policy, and the specific yearly savings for the brand’s average consumption cadence. Cross-reference the retention structure on our food and beverage marketing retainer page.
Content refresh cadence on food brand pillars
Content refresh cadence on food brand content pillars runs a rolling audit every 12 to 24 months by pillar. Recipes get refreshed every 12 months with new photography, updated schema, and any nutrition or ingredient adjustments. Ingredient comparison guides refresh every 18 months to update market data. Sourcing story pages refresh every 24 months to reflect farm partnership changes and new harvest angles. Buyer intent content refreshes every 12 months to update retailer availability and pricing.
Recipe refresh priority order
Recipe refresh priority runs by organic traffic rank. The top 20 recipes by monthly organic sessions get refreshed first (new photography, schema audit, related recipe internal links, updated nutrition). The next 40 get refreshed at 15 months. The remaining recipes get refreshed opportunistically when the ranking slips past position 15 in Google. Skipping the refresh cadence lets recipe rankings drift out of the top 3 inside 18 months as newer competitor recipes take the position.
Schema audit checklist per refresh
The schema audit checklist per refresh runs 8 items: Recipe schema completeness, aggregateRating count and accuracy, nutrition data accuracy, prepTime and cookTime match the recipe body, image URLs valid at CDN, related recipe internal links working, product card SKU URL live, and Google Search Console rich result eligibility validated. This checklist takes 20 minutes per recipe and prevents the schema drift that costs recipe rankings 20 to 40 positions quietly.
Reporting cadence for food brand content marketing
Reporting cadence on food brand content marketing runs a monthly executive report plus a quarterly business review. The monthly report ships in the first business week and covers organic sessions by pillar, top 10 ranking recipes with position trend, ingredient guide ranking movements, sourcing page performance, and organic-attributed DTC revenue. Every number carries a comparison to the prior month and a plain-language interpretation the founder reads in 7 minutes.
Metrics that matter for content marketing
Metrics that matter for food brand content marketing: organic sessions by pillar, recipe rich result impressions in Search Console, organic conversion rate to hero SKU pages, organic-attributed DTC revenue, and top 20 ranking positions by monthly organic sessions. Vanity metrics that do not matter: total pageviews without conversion context, average time on page without conversion attribution, and social share counts. The monthly report skips the vanity block entirely.
Quarterly business review structure
The quarterly business review runs 90 minutes with the founder, head of content, and SEO lead. Agenda: organic traffic trend by pillar, top 10 winning content pieces, top 10 losing content pieces (candidates for refresh or removal), competitive gap analysis against 5 named competitor brands, and next quarter’s content calendar with recipes and ingredient guides queued. According to Ahrefs content marketing research, brands running quarterly content audits outperform brands running annual audits by 40 to 70 percent on organic revenue over a 24-month window.
Internal linking discipline across food brand content
Internal linking discipline across food brand content moves authority from recipe pages toward hero SKU product pages and comparison guides. Every recipe links to the hero SKU it uses inline (once in the ingredient list, once in a bottom call-out card). Every ingredient comparison guide links to 3 to 6 recipes using the winning ingredient plus the hero SKU product page. Every sourcing story links to the 2 to 4 SKUs sourced from that specific farm or cooperative.
Anchor text strategy across recipe hubs
Anchor text on internal links varies across recipe hubs to avoid over-optimization patterns Google penalizes. Exact-match anchor (“single-origin Ethiopian coffee”) runs on 20 to 30 percent of internal links. Partial-match variations (“our Ethiopian roast”) run on 30 to 40 percent. Branded anchors (the SKU name) run on 20 to 30 percent. Generic anchors (“shop the coffee”) fill the remaining 10 to 20 percent. This ratio holds ranking without triggering the over-optimization penalty that shows up on brands that anchor-text-stuff every internal link with the same exact-match keyword. Cross-reference the linking layer on our food and beverage web design page.
Link equity from ingredient guides to SKU pages
Link equity from ingredient guides passes to SKU pages when the guide’s comparison table names the hero SKU in the winning column with a product card, and when the guide’s body links to 3 to 6 recipes that use the winning ingredient. This 3-hop path (guide to recipe to SKU) pushes authority from a high-traffic informational query down to a high-intent transactional page. According to Search Engine Land SEO coverage, informational content that internally links to transactional pages produces 2 to 4 times higher organic revenue than isolated content silos.
Wrapping up content marketing for food brands
Content marketing for food brands is the organic engine that turns a DTC snack, drink, or CPG storefront into a search-driven revenue channel. Recipe hub of 40 to 100 recipes. Ingredient comparison guides at 12 to 24 pieces. Sourcing story pages at 6 to 12 pieces. Buyer intent content at 8 to 16 pieces. Creator syndication calendar with 12 to 30 creators per quarter. Refresh cadence at 12 to 24 months by pillar. Reporting with organic sessions and organic revenue attribution.
If your DTC food brand is running paid social at 20,000 dollars monthly with a broken blog and zero recipe schema, professional content marketing for food brands pays for itself inside the first 90 days on organic traffic captured. Redefine Web ships content marketing inside our monthly retainer packages. Book a call and we will walk through the last three DTC food brands we built recipe hubs for, pillar by pillar.
Content marketing for food brands starts with a recipe hub because recipe queries account for 40 to 60 percent of high-intent search volume in the food category. Every hero SKU needs 4 to 12 recipes anchored to it, each targeting a specific occasion and audience.
Skip the recipe hub and the brand loses the search real estate that pulls DTC storefront traffic month over month at zero incremental paid cost. Recipe traffic converts at 2 to 4 percent because the shopper landed with usage intent, not passive discovery, which is why food brands win on recipes.
Recipe schema and Google rich result eligibility
Every recipe page ships schema.org Recipe markup including cookTime, prepTime, recipeIngredient, recipeInstructions, nutrition, and aggregateRating. Correctly marked-up recipes qualify for Google’s recipe rich result carousel that pulls 3 to 6 times higher click-through rate than a plain blue link. The schema layer takes 15 minutes per recipe to author and 30 minutes to validate in Google Search Console. Cross-reference the recipe search stack on our food and beverage SEO page.
Recipe hub structure that scales
The recipe hub structure runs 40 to 100 recipes at maturity, organized by hero SKU (4 to 12 recipes per SKU) plus occasion tags (breakfast, weeknight dinner, meal prep, brunch, holiday). Every recipe links back to the hero SKU product page with the SKU embedded in an inline card. The hub earns internal linking value from ingredient comparison guides and the sourcing story pages, which feeds recipe ranking on Google. According to Google Search Central recipe structured data guidance, complete Recipe schema markup is required for eligibility in the recipe carousel and the ingredient search filter.
Pillar structure for food brand content marketing
The pillar structure on content marketing for food brands runs 4 content pillars concurrently: recipe hub (40 to 100 recipes), ingredient comparison guides (12 to 24 guides), sourcing story pages (6 to 12 pages), and buyer intent content (where to buy, subscription vs. one-time, gift bundle guides). Every pillar covers a distinct search intent and every pillar links back to the hero SKU product pages.
Ingredient comparison guide format
Ingredient comparison guides run 1,800 to 3,200 words comparing 2 to 4 ingredient types on 6 to 10 attributes with a comparison table, real-world use case examples, and links to the hero SKU that uses the specific ingredient. Example: organic vs. conventional oats compares nutritional profile, sourcing chain, cost, environmental impact, and taste on a 6-column table. The brand’s SKU appears in the winning column with a product card. These guides rank 3 to 8 months after publication and pull steady-state organic traffic.
Sourcing story pages that build trust
Sourcing story pages name the specific farms, cooperatives, or suppliers the brand sources from, with photos of the farms, farmer quotes, and specific harvest windows. A coffee brand’s Ethiopian farm page ranks for “single-origin Ethiopian coffee” and “Yirgacheffe coffee origin” plus 40 long-tail variations. The sourcing page pulls trust-building traffic that converts at 4 to 6 percent because the shopper landed pattern-matching on transparency and named provenance. Every sourcing page includes farmer or cooperative quotes, harvest dates, and a link back to 3 to 5 hero SKU pages that source from the named supplier.
Vejrø hospitality content case study
Vejrø Resort, a Danish private-island destination with an on-site restaurant focused on organic, locally sourced cuisine, joined us with strong social engagement and no organic-search real estate. Guests found the resort on Instagram but never in Google search for terms like “private island resort Denmark,” “farm-to-table hospitality Denmark,” or “Vejrø restaurant.” The same organic-search gap shows up on DTC food brands running paid social at 20,000 dollars monthly with a broken blog and zero recipe schema.
We built the conversion-focused website with on-site and off-site SEO tuned to the travel-niche keyword clusters, competitor analysis against comparable boutique resorts, and mobile-first design prioritizing guest discovery. Every page carried the structured data qualifying it for Google’s rich results in the hospitality category. Every internal link pushed authority toward the direct-booking conversion path.
Three months later, Vejrø hit 10,000 plus organic visitors, ranked for 200 plus first-page keywords, and pulled a 2.2 percent booking conversion rate from organic traffic. The same pattern applies to content marketing for food brands: recipe schema, ingredient comparison guides, and sourcing story pages pull organic traffic at 20 to 40 percent conversion into hero SKU pages inside 6 months when the content quality matches search intent and every page carries the right structured data markup. Vejrø also proved out the reporting discipline: every monthly report named the exact page, the exact keyword cluster, and the exact search feature (rich result, sitelinks, image pack) driving the incremental organic revenue instead of hiding behind aggregate traffic charts.
Recipe cadence and content calendar for food brands
Recipe cadence on a working food brand content calendar ships 2 to 4 new recipes per week during the first 6 months and drops to 1 per week at maturity. Each recipe takes 4 to 6 hours to produce (write, test in the kitchen, photograph, schema author, publish). At 3 recipes per week, the brand hits 78 recipes inside 6 months plus a backlog of ingredient comparison and sourcing content queued behind the recipe production line.
| Content pillar | Target volume year 1 | Production cost per piece | Refresh cadence |
|---|---|---|---|
| Recipe hub | 40 to 100 recipes | $180 to $320 | Every 12 months |
| Ingredient comparison guides | 12 to 24 guides | $450 to $780 | Every 18 months |
| Sourcing story pages | 6 to 12 pages | $680 to $1,200 | Every 24 months |
| Buyer intent content | 8 to 16 pieces | $220 to $420 | Every 12 months |
Photography as a content calendar constraint
Photography is the actual constraint on recipe cadence, not writing. Every recipe needs 6 to 12 photos: hero shot, ingredient flat lay, prep in progress, plated result, storage, and step shots for the schema markup. A working food brand batches photography 8 recipes at a time to keep the cost per recipe under 200 dollars. Skip the batching and the per-recipe cost climbs to 400 to 600 dollars, which caps recipe cadence at 1 per week and slows organic ranking timeline by 6 months.
Seasonal content calendar planning
Seasonal content calendar planning maps recipes and comparison guides to the seasonal windows they need to rank in. A Christmas cookie recipe needs to publish in September to rank by early December. A Valentine’s chocolate guide needs to publish in November to rank by early February. A back-to-school lunchbox recipe needs to publish in June to rank by late August. The 60-to-90-day ranking curve dictates the calendar.
Creator syndication inside food brand content
Creator syndication on food brand content marketing amplifies the recipe hub through Instagram Reels, TikTok, and YouTube Shorts creators paid to post their own version of the brand’s hero recipes. The creator content pulls net-new audiences into the recipe hub through the creator’s Link in Bio or Amazon Storefront tag. The syndication calendar names 12 to 30 creators per quarter with specific recipes assigned to each.
One brand we picked up had a spreadsheet titled “creator outreach 2023” with 47 rows and 3 responses. All 3 responses were auto-replies. The spreadsheet named zero recipes and offered flat rates below 100 dollars per post. Nobody posts a 30-second video for 87 dollars flat. Nobody.
Creator content commercial terms that work
Working creator content commercial terms run 350 to 1,500 dollars flat per post plus a 12 to 25 percent commission on tagged sales across a 30-day window. The commission mechanic pulls creators into follow-up posts because the incremental revenue continues past the initial fee. Mid-tier creators (30k to 150k followers) hit the sweet spot for food brand content because their engagement rate typically runs 4 to 8 percent versus 0.8 to 1.6 percent on mega-creators.
Content brief structure for creator partnerships
The content brief structure for creator partnerships runs a single page: the SKU, the specific recipe or usage occasion, 3 required brand mentions, 3 restricted claims (no health claims on non-medical SKUs), the pricing angle, the affiliate link, and 3 example videos that hit the tone. The brief avoids over-scripting because over-scripted creator content underperforms native creator voice by 40 to 60 percent on engagement rate.
Buyer intent content for food brand blogs
Buyer intent content on food brand blogs covers 8 to 16 pieces targeting explicit purchase-decision queries: “where to buy [brand],” “[brand] subscription vs. one-time,” “best [category] for [use case],” and “[brand] gift bundle.” Every buyer intent piece runs 1,400 to 2,400 words with a comparison table, product cards, and a clear conversion path to the specific SKU that matches the query intent. Buyer intent content converts at 3 to 6 percent versus 1 to 2 percent on recipe content because the shopper landed already planning to buy, not exploring a usage occasion.
Where-to-buy content structure
Where-to-buy content structure covers online (DTC storefront, Amazon, Target.com, Whole Foods online), retail (specific chain locators with the store finder embedded), and international (customs limitations, retailer partners abroad). Every piece names specific retailers, links to the store locator, and includes an FAQ block covering shipping availability, subscription options, and gift card compatibility. Where-to-buy content ranks for branded discovery queries the DTC storefront otherwise loses to competitor affiliate reviews.
Subscription versus one-time comparison content
Subscription versus one-time comparison content converts subscription commitments at 3 to 6 percent because it addresses the price-sensitivity concern head-on with a specific math table. The piece covers the discount structure (15 percent lifetime), the skip-a-month mechanic, the pause-anytime rule, the cancellation policy, and the specific yearly savings for the brand’s average consumption cadence. Cross-reference the retention structure on our food and beverage marketing retainer page.
Content refresh cadence on food brand pillars
Content refresh cadence on food brand content pillars runs a rolling audit every 12 to 24 months by pillar. Recipes get refreshed every 12 months with new photography, updated schema, and any nutrition or ingredient adjustments. Ingredient comparison guides refresh every 18 months to update market data. Sourcing story pages refresh every 24 months to reflect farm partnership changes and new harvest angles. Buyer intent content refreshes every 12 months to update retailer availability and pricing.
Recipe refresh priority order
Recipe refresh priority runs by organic traffic rank. The top 20 recipes by monthly organic sessions get refreshed first (new photography, schema audit, related recipe internal links, updated nutrition). The next 40 get refreshed at 15 months. The remaining recipes get refreshed opportunistically when the ranking slips past position 15 in Google. Skipping the refresh cadence lets recipe rankings drift out of the top 3 inside 18 months as newer competitor recipes take the position.
Schema audit checklist per refresh
The schema audit checklist per refresh runs 8 items: Recipe schema completeness, aggregateRating count and accuracy, nutrition data accuracy, prepTime and cookTime match the recipe body, image URLs valid at CDN, related recipe internal links working, product card SKU URL live, and Google Search Console rich result eligibility validated. This checklist takes 20 minutes per recipe and prevents the schema drift that costs recipe rankings 20 to 40 positions quietly.
Reporting cadence for food brand content marketing
Reporting cadence on food brand content marketing runs a monthly executive report plus a quarterly business review. The monthly report ships in the first business week and covers organic sessions by pillar, top 10 ranking recipes with position trend, ingredient guide ranking movements, sourcing page performance, and organic-attributed DTC revenue. Every number carries a comparison to the prior month and a plain-language interpretation the founder reads in 7 minutes.
Metrics that matter for content marketing
Metrics that matter for food brand content marketing: organic sessions by pillar, recipe rich result impressions in Search Console, organic conversion rate to hero SKU pages, organic-attributed DTC revenue, and top 20 ranking positions by monthly organic sessions. Vanity metrics that do not matter: total pageviews without conversion context, average time on page without conversion attribution, and social share counts. The monthly report skips the vanity block entirely.
Quarterly business review structure
The quarterly business review runs 90 minutes with the founder, head of content, and SEO lead. Agenda: organic traffic trend by pillar, top 10 winning content pieces, top 10 losing content pieces (candidates for refresh or removal), competitive gap analysis against 5 named competitor brands, and next quarter’s content calendar with recipes and ingredient guides queued. According to Ahrefs content marketing research, brands running quarterly content audits outperform brands running annual audits by 40 to 70 percent on organic revenue over a 24-month window.
Internal linking discipline across food brand content
Internal linking discipline across food brand content moves authority from recipe pages toward hero SKU product pages and comparison guides. Every recipe links to the hero SKU it uses inline (once in the ingredient list, once in a bottom call-out card). Every ingredient comparison guide links to 3 to 6 recipes using the winning ingredient plus the hero SKU product page. Every sourcing story links to the 2 to 4 SKUs sourced from that specific farm or cooperative.
Anchor text strategy across recipe hubs
Anchor text on internal links varies across recipe hubs to avoid over-optimization patterns Google penalizes. Exact-match anchor (“single-origin Ethiopian coffee”) runs on 20 to 30 percent of internal links. Partial-match variations (“our Ethiopian roast”) run on 30 to 40 percent. Branded anchors (the SKU name) run on 20 to 30 percent. Generic anchors (“shop the coffee”) fill the remaining 10 to 20 percent. This ratio holds ranking without triggering the over-optimization penalty that shows up on brands that anchor-text-stuff every internal link with the same exact-match keyword. Cross-reference the linking layer on our food and beverage web design page.
Link equity from ingredient guides to SKU pages
Link equity from ingredient guides passes to SKU pages when the guide’s comparison table names the hero SKU in the winning column with a product card, and when the guide’s body links to 3 to 6 recipes that use the winning ingredient. This 3-hop path (guide to recipe to SKU) pushes authority from a high-traffic informational query down to a high-intent transactional page. According to Search Engine Land SEO coverage, informational content that internally links to transactional pages produces 2 to 4 times higher organic revenue than isolated content silos.
Wrapping up content marketing for food brands
Content marketing for food brands is the organic engine that turns a DTC snack, drink, or CPG storefront into a search-driven revenue channel. Recipe hub of 40 to 100 recipes. Ingredient comparison guides at 12 to 24 pieces. Sourcing story pages at 6 to 12 pieces. Buyer intent content at 8 to 16 pieces. Creator syndication calendar with 12 to 30 creators per quarter. Refresh cadence at 12 to 24 months by pillar. Reporting with organic sessions and organic revenue attribution.
If your DTC food brand is running paid social at 20,000 dollars monthly with a broken blog and zero recipe schema, professional content marketing for food brands pays for itself inside the first 90 days on organic traffic captured. Redefine Web ships content marketing inside our monthly retainer packages. Book a call and we will walk through the last three DTC food brands we built recipe hubs for, pillar by pillar.
Anchor text on internal links varies across recipe hubs to avoid over-optimization patterns Google penalizes. Exact-match anchor (“single-origin Ethiopian coffee”) runs on 20 to 30 percent of internal links. Partial-match variations (“our Ethiopian roast”) run on 30 to 40 percent. Branded anchors (the SKU name) run on 20 to 30 percent. Generic anchors (“shop the coffee”) fill the remaining 10 to 20 percent. This ratio holds ranking without triggering the over-optimization penalty that shows up on brands that anchor-text-stuff every internal link with the same exact-match keyword. Cross-reference the linking layer on our food and beverage web design page.
Link equity from ingredient guides to SKU pages
Link equity from ingredient guides passes to SKU pages when the guide’s comparison table names the hero SKU in the winning column with a product card, and when the guide’s body links to 3 to 6 recipes that use the winning ingredient. This 3-hop path (guide to recipe to SKU) pushes authority from a high-traffic informational query down to a high-intent transactional page. According to Search Engine Land SEO coverage, informational content that internally links to transactional pages produces 2 to 4 times higher organic revenue than isolated content silos.
Wrapping up content marketing for food brands
Content marketing for food brands is the organic engine that turns a DTC snack, drink, or CPG storefront into a search-driven revenue channel. Recipe hub of 40 to 100 recipes. Ingredient comparison guides at 12 to 24 pieces. Sourcing story pages at 6 to 12 pieces. Buyer intent content at 8 to 16 pieces. Creator syndication calendar with 12 to 30 creators per quarter. Refresh cadence at 12 to 24 months by pillar. Reporting with organic sessions and organic revenue attribution.
If your DTC food brand is running paid social at 20,000 dollars monthly with a broken blog and zero recipe schema, professional content marketing for food brands pays for itself inside the first 90 days on organic traffic captured. Redefine Web ships content marketing inside our monthly retainer packages. Book a call and we will walk through the last three DTC food brands we built recipe hubs for, pillar by pillar.
Internal linking discipline across food brand content moves authority from recipe pages toward hero SKU product pages and comparison guides. Every recipe links to the hero SKU it uses inline (once in the ingredient list, once in a bottom call-out card). Every ingredient comparison guide links to 3 to 6 recipes using the winning ingredient plus the hero SKU product page. Every sourcing story links to the 2 to 4 SKUs sourced from that specific farm or cooperative.
Anchor text strategy across recipe hubs
Anchor text on internal links varies across recipe hubs to avoid over-optimization patterns Google penalizes. Exact-match anchor (“single-origin Ethiopian coffee”) runs on 20 to 30 percent of internal links. Partial-match variations (“our Ethiopian roast”) run on 30 to 40 percent. Branded anchors (the SKU name) run on 20 to 30 percent. Generic anchors (“shop the coffee”) fill the remaining 10 to 20 percent. This ratio holds ranking without triggering the over-optimization penalty that shows up on brands that anchor-text-stuff every internal link with the same exact-match keyword. Cross-reference the linking layer on our food and beverage web design page.
Link equity from ingredient guides to SKU pages
Link equity from ingredient guides passes to SKU pages when the guide’s comparison table names the hero SKU in the winning column with a product card, and when the guide’s body links to 3 to 6 recipes that use the winning ingredient. This 3-hop path (guide to recipe to SKU) pushes authority from a high-traffic informational query down to a high-intent transactional page. According to Search Engine Land SEO coverage, informational content that internally links to transactional pages produces 2 to 4 times higher organic revenue than isolated content silos.
Wrapping up content marketing for food brands
Content marketing for food brands is the organic engine that turns a DTC snack, drink, or CPG storefront into a search-driven revenue channel. Recipe hub of 40 to 100 recipes. Ingredient comparison guides at 12 to 24 pieces. Sourcing story pages at 6 to 12 pieces. Buyer intent content at 8 to 16 pieces. Creator syndication calendar with 12 to 30 creators per quarter. Refresh cadence at 12 to 24 months by pillar. Reporting with organic sessions and organic revenue attribution.
If your DTC food brand is running paid social at 20,000 dollars monthly with a broken blog and zero recipe schema, professional content marketing for food brands pays for itself inside the first 90 days on organic traffic captured. Redefine Web ships content marketing inside our monthly retainer packages. Book a call and we will walk through the last three DTC food brands we built recipe hubs for, pillar by pillar.
Content marketing for food brands starts with a recipe hub because recipe queries account for 40 to 60 percent of high-intent search volume in the food category. Every hero SKU needs 4 to 12 recipes anchored to it, each targeting a specific occasion and audience.
Skip the recipe hub and the brand loses the search real estate that pulls DTC storefront traffic month over month at zero incremental paid cost. Recipe traffic converts at 2 to 4 percent because the shopper landed with usage intent, not passive discovery, which is why food brands win on recipes.
Recipe schema and Google rich result eligibility
Every recipe page ships schema.org Recipe markup including cookTime, prepTime, recipeIngredient, recipeInstructions, nutrition, and aggregateRating. Correctly marked-up recipes qualify for Google’s recipe rich result carousel that pulls 3 to 6 times higher click-through rate than a plain blue link. The schema layer takes 15 minutes per recipe to author and 30 minutes to validate in Google Search Console. Cross-reference the recipe search stack on our food and beverage SEO page.
Recipe hub structure that scales
The recipe hub structure runs 40 to 100 recipes at maturity, organized by hero SKU (4 to 12 recipes per SKU) plus occasion tags (breakfast, weeknight dinner, meal prep, brunch, holiday). Every recipe links back to the hero SKU product page with the SKU embedded in an inline card. The hub earns internal linking value from ingredient comparison guides and the sourcing story pages, which feeds recipe ranking on Google. According to Google Search Central recipe structured data guidance, complete Recipe schema markup is required for eligibility in the recipe carousel and the ingredient search filter.
Pillar structure for food brand content marketing
The pillar structure on content marketing for food brands runs 4 content pillars concurrently: recipe hub (40 to 100 recipes), ingredient comparison guides (12 to 24 guides), sourcing story pages (6 to 12 pages), and buyer intent content (where to buy, subscription vs. one-time, gift bundle guides). Every pillar covers a distinct search intent and every pillar links back to the hero SKU product pages.
Ingredient comparison guide format
Ingredient comparison guides run 1,800 to 3,200 words comparing 2 to 4 ingredient types on 6 to 10 attributes with a comparison table, real-world use case examples, and links to the hero SKU that uses the specific ingredient. Example: organic vs. conventional oats compares nutritional profile, sourcing chain, cost, environmental impact, and taste on a 6-column table. The brand’s SKU appears in the winning column with a product card. These guides rank 3 to 8 months after publication and pull steady-state organic traffic.
Sourcing story pages that build trust
Sourcing story pages name the specific farms, cooperatives, or suppliers the brand sources from, with photos of the farms, farmer quotes, and specific harvest windows. A coffee brand’s Ethiopian farm page ranks for “single-origin Ethiopian coffee” and “Yirgacheffe coffee origin” plus 40 long-tail variations. The sourcing page pulls trust-building traffic that converts at 4 to 6 percent because the shopper landed pattern-matching on transparency and named provenance. Every sourcing page includes farmer or cooperative quotes, harvest dates, and a link back to 3 to 5 hero SKU pages that source from the named supplier.
Vejrø hospitality content case study
Vejrø Resort, a Danish private-island destination with an on-site restaurant focused on organic, locally sourced cuisine, joined us with strong social engagement and no organic-search real estate. Guests found the resort on Instagram but never in Google search for terms like “private island resort Denmark,” “farm-to-table hospitality Denmark,” or “Vejrø restaurant.” The same organic-search gap shows up on DTC food brands running paid social at 20,000 dollars monthly with a broken blog and zero recipe schema.
We built the conversion-focused website with on-site and off-site SEO tuned to the travel-niche keyword clusters, competitor analysis against comparable boutique resorts, and mobile-first design prioritizing guest discovery. Every page carried the structured data qualifying it for Google’s rich results in the hospitality category. Every internal link pushed authority toward the direct-booking conversion path.
Three months later, Vejrø hit 10,000 plus organic visitors, ranked for 200 plus first-page keywords, and pulled a 2.2 percent booking conversion rate from organic traffic. The same pattern applies to content marketing for food brands: recipe schema, ingredient comparison guides, and sourcing story pages pull organic traffic at 20 to 40 percent conversion into hero SKU pages inside 6 months when the content quality matches search intent and every page carries the right structured data markup. Vejrø also proved out the reporting discipline: every monthly report named the exact page, the exact keyword cluster, and the exact search feature (rich result, sitelinks, image pack) driving the incremental organic revenue instead of hiding behind aggregate traffic charts.
Recipe cadence and content calendar for food brands
Recipe cadence on a working food brand content calendar ships 2 to 4 new recipes per week during the first 6 months and drops to 1 per week at maturity. Each recipe takes 4 to 6 hours to produce (write, test in the kitchen, photograph, schema author, publish). At 3 recipes per week, the brand hits 78 recipes inside 6 months plus a backlog of ingredient comparison and sourcing content queued behind the recipe production line.
| Content pillar | Target volume year 1 | Production cost per piece | Refresh cadence |
|---|---|---|---|
| Recipe hub | 40 to 100 recipes | $180 to $320 | Every 12 months |
| Ingredient comparison guides | 12 to 24 guides | $450 to $780 | Every 18 months |
| Sourcing story pages | 6 to 12 pages | $680 to $1,200 | Every 24 months |
| Buyer intent content | 8 to 16 pieces | $220 to $420 | Every 12 months |
Photography as a content calendar constraint
Photography is the actual constraint on recipe cadence, not writing. Every recipe needs 6 to 12 photos: hero shot, ingredient flat lay, prep in progress, plated result, storage, and step shots for the schema markup. A working food brand batches photography 8 recipes at a time to keep the cost per recipe under 200 dollars. Skip the batching and the per-recipe cost climbs to 400 to 600 dollars, which caps recipe cadence at 1 per week and slows organic ranking timeline by 6 months.
Seasonal content calendar planning
Seasonal content calendar planning maps recipes and comparison guides to the seasonal windows they need to rank in. A Christmas cookie recipe needs to publish in September to rank by early December. A Valentine’s chocolate guide needs to publish in November to rank by early February. A back-to-school lunchbox recipe needs to publish in June to rank by late August. The 60-to-90-day ranking curve dictates the calendar.
Creator syndication inside food brand content
Creator syndication on food brand content marketing amplifies the recipe hub through Instagram Reels, TikTok, and YouTube Shorts creators paid to post their own version of the brand’s hero recipes. The creator content pulls net-new audiences into the recipe hub through the creator’s Link in Bio or Amazon Storefront tag. The syndication calendar names 12 to 30 creators per quarter with specific recipes assigned to each.
One brand we picked up had a spreadsheet titled “creator outreach 2023” with 47 rows and 3 responses. All 3 responses were auto-replies. The spreadsheet named zero recipes and offered flat rates below 100 dollars per post. Nobody posts a 30-second video for 87 dollars flat. Nobody.
Creator content commercial terms that work
Working creator content commercial terms run 350 to 1,500 dollars flat per post plus a 12 to 25 percent commission on tagged sales across a 30-day window. The commission mechanic pulls creators into follow-up posts because the incremental revenue continues past the initial fee. Mid-tier creators (30k to 150k followers) hit the sweet spot for food brand content because their engagement rate typically runs 4 to 8 percent versus 0.8 to 1.6 percent on mega-creators.
Content brief structure for creator partnerships
The content brief structure for creator partnerships runs a single page: the SKU, the specific recipe or usage occasion, 3 required brand mentions, 3 restricted claims (no health claims on non-medical SKUs), the pricing angle, the affiliate link, and 3 example videos that hit the tone. The brief avoids over-scripting because over-scripted creator content underperforms native creator voice by 40 to 60 percent on engagement rate.
Buyer intent content for food brand blogs
Buyer intent content on food brand blogs covers 8 to 16 pieces targeting explicit purchase-decision queries: “where to buy [brand],” “[brand] subscription vs. one-time,” “best [category] for [use case],” and “[brand] gift bundle.” Every buyer intent piece runs 1,400 to 2,400 words with a comparison table, product cards, and a clear conversion path to the specific SKU that matches the query intent. Buyer intent content converts at 3 to 6 percent versus 1 to 2 percent on recipe content because the shopper landed already planning to buy, not exploring a usage occasion.
Where-to-buy content structure
Where-to-buy content structure covers online (DTC storefront, Amazon, Target.com, Whole Foods online), retail (specific chain locators with the store finder embedded), and international (customs limitations, retailer partners abroad). Every piece names specific retailers, links to the store locator, and includes an FAQ block covering shipping availability, subscription options, and gift card compatibility. Where-to-buy content ranks for branded discovery queries the DTC storefront otherwise loses to competitor affiliate reviews.
Subscription versus one-time comparison content
Subscription versus one-time comparison content converts subscription commitments at 3 to 6 percent because it addresses the price-sensitivity concern head-on with a specific math table. The piece covers the discount structure (15 percent lifetime), the skip-a-month mechanic, the pause-anytime rule, the cancellation policy, and the specific yearly savings for the brand’s average consumption cadence. Cross-reference the retention structure on our food and beverage marketing retainer page.
Content refresh cadence on food brand pillars
Content refresh cadence on food brand content pillars runs a rolling audit every 12 to 24 months by pillar. Recipes get refreshed every 12 months with new photography, updated schema, and any nutrition or ingredient adjustments. Ingredient comparison guides refresh every 18 months to update market data. Sourcing story pages refresh every 24 months to reflect farm partnership changes and new harvest angles. Buyer intent content refreshes every 12 months to update retailer availability and pricing.
Recipe refresh priority order
Recipe refresh priority runs by organic traffic rank. The top 20 recipes by monthly organic sessions get refreshed first (new photography, schema audit, related recipe internal links, updated nutrition). The next 40 get refreshed at 15 months. The remaining recipes get refreshed opportunistically when the ranking slips past position 15 in Google. Skipping the refresh cadence lets recipe rankings drift out of the top 3 inside 18 months as newer competitor recipes take the position.
Schema audit checklist per refresh
The schema audit checklist per refresh runs 8 items: Recipe schema completeness, aggregateRating count and accuracy, nutrition data accuracy, prepTime and cookTime match the recipe body, image URLs valid at CDN, related recipe internal links working, product card SKU URL live, and Google Search Console rich result eligibility validated. This checklist takes 20 minutes per recipe and prevents the schema drift that costs recipe rankings 20 to 40 positions quietly.
Reporting cadence for food brand content marketing
Reporting cadence on food brand content marketing runs a monthly executive report plus a quarterly business review. The monthly report ships in the first business week and covers organic sessions by pillar, top 10 ranking recipes with position trend, ingredient guide ranking movements, sourcing page performance, and organic-attributed DTC revenue. Every number carries a comparison to the prior month and a plain-language interpretation the founder reads in 7 minutes.
Metrics that matter for content marketing
Metrics that matter for food brand content marketing: organic sessions by pillar, recipe rich result impressions in Search Console, organic conversion rate to hero SKU pages, organic-attributed DTC revenue, and top 20 ranking positions by monthly organic sessions. Vanity metrics that do not matter: total pageviews without conversion context, average time on page without conversion attribution, and social share counts. The monthly report skips the vanity block entirely.
Quarterly business review structure
The quarterly business review runs 90 minutes with the founder, head of content, and SEO lead. Agenda: organic traffic trend by pillar, top 10 winning content pieces, top 10 losing content pieces (candidates for refresh or removal), competitive gap analysis against 5 named competitor brands, and next quarter’s content calendar with recipes and ingredient guides queued. According to Ahrefs content marketing research, brands running quarterly content audits outperform brands running annual audits by 40 to 70 percent on organic revenue over a 24-month window.
Internal linking discipline across food brand content
Internal linking discipline across food brand content moves authority from recipe pages toward hero SKU product pages and comparison guides. Every recipe links to the hero SKU it uses inline (once in the ingredient list, once in a bottom call-out card). Every ingredient comparison guide links to 3 to 6 recipes using the winning ingredient plus the hero SKU product page. Every sourcing story links to the 2 to 4 SKUs sourced from that specific farm or cooperative.
Anchor text strategy across recipe hubs
Anchor text on internal links varies across recipe hubs to avoid over-optimization patterns Google penalizes. Exact-match anchor (“single-origin Ethiopian coffee”) runs on 20 to 30 percent of internal links. Partial-match variations (“our Ethiopian roast”) run on 30 to 40 percent. Branded anchors (the SKU name) run on 20 to 30 percent. Generic anchors (“shop the coffee”) fill the remaining 10 to 20 percent. This ratio holds ranking without triggering the over-optimization penalty that shows up on brands that anchor-text-stuff every internal link with the same exact-match keyword. Cross-reference the linking layer on our food and beverage web design page.
Link equity from ingredient guides to SKU pages
Link equity from ingredient guides passes to SKU pages when the guide’s comparison table names the hero SKU in the winning column with a product card, and when the guide’s body links to 3 to 6 recipes that use the winning ingredient. This 3-hop path (guide to recipe to SKU) pushes authority from a high-traffic informational query down to a high-intent transactional page. According to Search Engine Land SEO coverage, informational content that internally links to transactional pages produces 2 to 4 times higher organic revenue than isolated content silos.
Wrapping up content marketing for food brands
Content marketing for food brands is the organic engine that turns a DTC snack, drink, or CPG storefront into a search-driven revenue channel. Recipe hub of 40 to 100 recipes. Ingredient comparison guides at 12 to 24 pieces. Sourcing story pages at 6 to 12 pieces. Buyer intent content at 8 to 16 pieces. Creator syndication calendar with 12 to 30 creators per quarter. Refresh cadence at 12 to 24 months by pillar. Reporting with organic sessions and organic revenue attribution.
If your DTC food brand is running paid social at 20,000 dollars monthly with a broken blog and zero recipe schema, professional content marketing for food brands pays for itself inside the first 90 days on organic traffic captured. Redefine Web ships content marketing inside our monthly retainer packages. Book a call and we will walk through the last three DTC food brands we built recipe hubs for, pillar by pillar.
Content marketing for food brands starts with a recipe hub because recipe queries account for 40 to 60 percent of high-intent search volume in the food category. Every hero SKU needs 4 to 12 recipes anchored to it, each targeting a specific occasion and audience.
Skip the recipe hub and the brand loses the search real estate that pulls DTC storefront traffic month over month at zero incremental paid cost. Recipe traffic converts at 2 to 4 percent because the shopper landed with usage intent, not passive discovery, which is why food brands win on recipes.
Recipe schema and Google rich result eligibility
Every recipe page ships schema.org Recipe markup including cookTime, prepTime, recipeIngredient, recipeInstructions, nutrition, and aggregateRating. Correctly marked-up recipes qualify for Google’s recipe rich result carousel that pulls 3 to 6 times higher click-through rate than a plain blue link. The schema layer takes 15 minutes per recipe to author and 30 minutes to validate in Google Search Console. Cross-reference the recipe search stack on our food and beverage SEO page.
Recipe hub structure that scales
The recipe hub structure runs 40 to 100 recipes at maturity, organized by hero SKU (4 to 12 recipes per SKU) plus occasion tags (breakfast, weeknight dinner, meal prep, brunch, holiday). Every recipe links back to the hero SKU product page with the SKU embedded in an inline card. The hub earns internal linking value from ingredient comparison guides and the sourcing story pages, which feeds recipe ranking on Google. According to Google Search Central recipe structured data guidance, complete Recipe schema markup is required for eligibility in the recipe carousel and the ingredient search filter.
Pillar structure for food brand content marketing
The pillar structure on content marketing for food brands runs 4 content pillars concurrently: recipe hub (40 to 100 recipes), ingredient comparison guides (12 to 24 guides), sourcing story pages (6 to 12 pages), and buyer intent content (where to buy, subscription vs. one-time, gift bundle guides). Every pillar covers a distinct search intent and every pillar links back to the hero SKU product pages.
Ingredient comparison guide format
Ingredient comparison guides run 1,800 to 3,200 words comparing 2 to 4 ingredient types on 6 to 10 attributes with a comparison table, real-world use case examples, and links to the hero SKU that uses the specific ingredient. Example: organic vs. conventional oats compares nutritional profile, sourcing chain, cost, environmental impact, and taste on a 6-column table. The brand’s SKU appears in the winning column with a product card. These guides rank 3 to 8 months after publication and pull steady-state organic traffic.
Sourcing story pages that build trust
Sourcing story pages name the specific farms, cooperatives, or suppliers the brand sources from, with photos of the farms, farmer quotes, and specific harvest windows. A coffee brand’s Ethiopian farm page ranks for “single-origin Ethiopian coffee” and “Yirgacheffe coffee origin” plus 40 long-tail variations. The sourcing page pulls trust-building traffic that converts at 4 to 6 percent because the shopper landed pattern-matching on transparency and named provenance. Every sourcing page includes farmer or cooperative quotes, harvest dates, and a link back to 3 to 5 hero SKU pages that source from the named supplier.
Vejrø hospitality content case study
Vejrø Resort, a Danish private-island destination with an on-site restaurant focused on organic, locally sourced cuisine, joined us with strong social engagement and no organic-search real estate. Guests found the resort on Instagram but never in Google search for terms like “private island resort Denmark,” “farm-to-table hospitality Denmark,” or “Vejrø restaurant.” The same organic-search gap shows up on DTC food brands running paid social at 20,000 dollars monthly with a broken blog and zero recipe schema.
We built the conversion-focused website with on-site and off-site SEO tuned to the travel-niche keyword clusters, competitor analysis against comparable boutique resorts, and mobile-first design prioritizing guest discovery. Every page carried the structured data qualifying it for Google’s rich results in the hospitality category. Every internal link pushed authority toward the direct-booking conversion path.
Three months later, Vejrø hit 10,000 plus organic visitors, ranked for 200 plus first-page keywords, and pulled a 2.2 percent booking conversion rate from organic traffic. The same pattern applies to content marketing for food brands: recipe schema, ingredient comparison guides, and sourcing story pages pull organic traffic at 20 to 40 percent conversion into hero SKU pages inside 6 months when the content quality matches search intent and every page carries the right structured data markup. Vejrø also proved out the reporting discipline: every monthly report named the exact page, the exact keyword cluster, and the exact search feature (rich result, sitelinks, image pack) driving the incremental organic revenue instead of hiding behind aggregate traffic charts.
Recipe cadence and content calendar for food brands
Recipe cadence on a working food brand content calendar ships 2 to 4 new recipes per week during the first 6 months and drops to 1 per week at maturity. Each recipe takes 4 to 6 hours to produce (write, test in the kitchen, photograph, schema author, publish). At 3 recipes per week, the brand hits 78 recipes inside 6 months plus a backlog of ingredient comparison and sourcing content queued behind the recipe production line.
| Content pillar | Target volume year 1 | Production cost per piece | Refresh cadence |
|---|---|---|---|
| Recipe hub | 40 to 100 recipes | $180 to $320 | Every 12 months |
| Ingredient comparison guides | 12 to 24 guides | $450 to $780 | Every 18 months |
| Sourcing story pages | 6 to 12 pages | $680 to $1,200 | Every 24 months |
| Buyer intent content | 8 to 16 pieces | $220 to $420 | Every 12 months |
Photography as a content calendar constraint
Photography is the actual constraint on recipe cadence, not writing. Every recipe needs 6 to 12 photos: hero shot, ingredient flat lay, prep in progress, plated result, storage, and step shots for the schema markup. A working food brand batches photography 8 recipes at a time to keep the cost per recipe under 200 dollars. Skip the batching and the per-recipe cost climbs to 400 to 600 dollars, which caps recipe cadence at 1 per week and slows organic ranking timeline by 6 months.
Seasonal content calendar planning
Seasonal content calendar planning maps recipes and comparison guides to the seasonal windows they need to rank in. A Christmas cookie recipe needs to publish in September to rank by early December. A Valentine’s chocolate guide needs to publish in November to rank by early February. A back-to-school lunchbox recipe needs to publish in June to rank by late August. The 60-to-90-day ranking curve dictates the calendar.
Creator syndication inside food brand content
Creator syndication on food brand content marketing amplifies the recipe hub through Instagram Reels, TikTok, and YouTube Shorts creators paid to post their own version of the brand’s hero recipes. The creator content pulls net-new audiences into the recipe hub through the creator’s Link in Bio or Amazon Storefront tag. The syndication calendar names 12 to 30 creators per quarter with specific recipes assigned to each.
One brand we picked up had a spreadsheet titled “creator outreach 2023” with 47 rows and 3 responses. All 3 responses were auto-replies. The spreadsheet named zero recipes and offered flat rates below 100 dollars per post. Nobody posts a 30-second video for 87 dollars flat. Nobody.
Creator content commercial terms that work
Working creator content commercial terms run 350 to 1,500 dollars flat per post plus a 12 to 25 percent commission on tagged sales across a 30-day window. The commission mechanic pulls creators into follow-up posts because the incremental revenue continues past the initial fee. Mid-tier creators (30k to 150k followers) hit the sweet spot for food brand content because their engagement rate typically runs 4 to 8 percent versus 0.8 to 1.6 percent on mega-creators.
Content brief structure for creator partnerships
The content brief structure for creator partnerships runs a single page: the SKU, the specific recipe or usage occasion, 3 required brand mentions, 3 restricted claims (no health claims on non-medical SKUs), the pricing angle, the affiliate link, and 3 example videos that hit the tone. The brief avoids over-scripting because over-scripted creator content underperforms native creator voice by 40 to 60 percent on engagement rate.
Buyer intent content for food brand blogs
Buyer intent content on food brand blogs covers 8 to 16 pieces targeting explicit purchase-decision queries: “where to buy [brand],” “[brand] subscription vs. one-time,” “best [category] for [use case],” and “[brand] gift bundle.” Every buyer intent piece runs 1,400 to 2,400 words with a comparison table, product cards, and a clear conversion path to the specific SKU that matches the query intent. Buyer intent content converts at 3 to 6 percent versus 1 to 2 percent on recipe content because the shopper landed already planning to buy, not exploring a usage occasion.
Where-to-buy content structure
Where-to-buy content structure covers online (DTC storefront, Amazon, Target.com, Whole Foods online), retail (specific chain locators with the store finder embedded), and international (customs limitations, retailer partners abroad). Every piece names specific retailers, links to the store locator, and includes an FAQ block covering shipping availability, subscription options, and gift card compatibility. Where-to-buy content ranks for branded discovery queries the DTC storefront otherwise loses to competitor affiliate reviews.
Subscription versus one-time comparison content
Subscription versus one-time comparison content converts subscription commitments at 3 to 6 percent because it addresses the price-sensitivity concern head-on with a specific math table. The piece covers the discount structure (15 percent lifetime), the skip-a-month mechanic, the pause-anytime rule, the cancellation policy, and the specific yearly savings for the brand’s average consumption cadence. Cross-reference the retention structure on our food and beverage marketing retainer page.
Content refresh cadence on food brand pillars
Content refresh cadence on food brand content pillars runs a rolling audit every 12 to 24 months by pillar. Recipes get refreshed every 12 months with new photography, updated schema, and any nutrition or ingredient adjustments. Ingredient comparison guides refresh every 18 months to update market data. Sourcing story pages refresh every 24 months to reflect farm partnership changes and new harvest angles. Buyer intent content refreshes every 12 months to update retailer availability and pricing.
Recipe refresh priority order
Recipe refresh priority runs by organic traffic rank. The top 20 recipes by monthly organic sessions get refreshed first (new photography, schema audit, related recipe internal links, updated nutrition). The next 40 get refreshed at 15 months. The remaining recipes get refreshed opportunistically when the ranking slips past position 15 in Google. Skipping the refresh cadence lets recipe rankings drift out of the top 3 inside 18 months as newer competitor recipes take the position.
Schema audit checklist per refresh
The schema audit checklist per refresh runs 8 items: Recipe schema completeness, aggregateRating count and accuracy, nutrition data accuracy, prepTime and cookTime match the recipe body, image URLs valid at CDN, related recipe internal links working, product card SKU URL live, and Google Search Console rich result eligibility validated. This checklist takes 20 minutes per recipe and prevents the schema drift that costs recipe rankings 20 to 40 positions quietly.
Reporting cadence for food brand content marketing
Reporting cadence on food brand content marketing runs a monthly executive report plus a quarterly business review. The monthly report ships in the first business week and covers organic sessions by pillar, top 10 ranking recipes with position trend, ingredient guide ranking movements, sourcing page performance, and organic-attributed DTC revenue. Every number carries a comparison to the prior month and a plain-language interpretation the founder reads in 7 minutes.
Metrics that matter for content marketing
Metrics that matter for food brand content marketing: organic sessions by pillar, recipe rich result impressions in Search Console, organic conversion rate to hero SKU pages, organic-attributed DTC revenue, and top 20 ranking positions by monthly organic sessions. Vanity metrics that do not matter: total pageviews without conversion context, average time on page without conversion attribution, and social share counts. The monthly report skips the vanity block entirely.
Quarterly business review structure
The quarterly business review runs 90 minutes with the founder, head of content, and SEO lead. Agenda: organic traffic trend by pillar, top 10 winning content pieces, top 10 losing content pieces (candidates for refresh or removal), competitive gap analysis against 5 named competitor brands, and next quarter’s content calendar with recipes and ingredient guides queued. According to Ahrefs content marketing research, brands running quarterly content audits outperform brands running annual audits by 40 to 70 percent on organic revenue over a 24-month window.
Internal linking discipline across food brand content
Internal linking discipline across food brand content moves authority from recipe pages toward hero SKU product pages and comparison guides. Every recipe links to the hero SKU it uses inline (once in the ingredient list, once in a bottom call-out card). Every ingredient comparison guide links to 3 to 6 recipes using the winning ingredient plus the hero SKU product page. Every sourcing story links to the 2 to 4 SKUs sourced from that specific farm or cooperative.
Anchor text strategy across recipe hubs
Anchor text on internal links varies across recipe hubs to avoid over-optimization patterns Google penalizes. Exact-match anchor (“single-origin Ethiopian coffee”) runs on 20 to 30 percent of internal links. Partial-match variations (“our Ethiopian roast”) run on 30 to 40 percent. Branded anchors (the SKU name) run on 20 to 30 percent. Generic anchors (“shop the coffee”) fill the remaining 10 to 20 percent. This ratio holds ranking without triggering the over-optimization penalty that shows up on brands that anchor-text-stuff every internal link with the same exact-match keyword. Cross-reference the linking layer on our food and beverage web design page.
Link equity from ingredient guides to SKU pages
Link equity from ingredient guides passes to SKU pages when the guide’s comparison table names the hero SKU in the winning column with a product card, and when the guide’s body links to 3 to 6 recipes that use the winning ingredient. This 3-hop path (guide to recipe to SKU) pushes authority from a high-traffic informational query down to a high-intent transactional page. According to Search Engine Land SEO coverage, informational content that internally links to transactional pages produces 2 to 4 times higher organic revenue than isolated content silos.
Wrapping up content marketing for food brands
Content marketing for food brands is the organic engine that turns a DTC snack, drink, or CPG storefront into a search-driven revenue channel. Recipe hub of 40 to 100 recipes. Ingredient comparison guides at 12 to 24 pieces. Sourcing story pages at 6 to 12 pieces. Buyer intent content at 8 to 16 pieces. Creator syndication calendar with 12 to 30 creators per quarter. Refresh cadence at 12 to 24 months by pillar. Reporting with organic sessions and organic revenue attribution.
If your DTC food brand is running paid social at 20,000 dollars monthly with a broken blog and zero recipe schema, professional content marketing for food brands pays for itself inside the first 90 days on organic traffic captured. Redefine Web ships content marketing inside our monthly retainer packages. Book a call and we will walk through the last three DTC food brands we built recipe hubs for, pillar by pillar.
Internal linking discipline across food brand content moves authority from recipe pages toward hero SKU product pages and comparison guides. Every recipe links to the hero SKU it uses inline (once in the ingredient list, once in a bottom call-out card). Every ingredient comparison guide links to 3 to 6 recipes using the winning ingredient plus the hero SKU product page. Every sourcing story links to the 2 to 4 SKUs sourced from that specific farm or cooperative.
Anchor text strategy across recipe hubs
Anchor text on internal links varies across recipe hubs to avoid over-optimization patterns Google penalizes. Exact-match anchor (“single-origin Ethiopian coffee”) runs on 20 to 30 percent of internal links. Partial-match variations (“our Ethiopian roast”) run on 30 to 40 percent. Branded anchors (the SKU name) run on 20 to 30 percent. Generic anchors (“shop the coffee”) fill the remaining 10 to 20 percent. This ratio holds ranking without triggering the over-optimization penalty that shows up on brands that anchor-text-stuff every internal link with the same exact-match keyword. Cross-reference the linking layer on our food and beverage web design page.
Link equity from ingredient guides to SKU pages
Link equity from ingredient guides passes to SKU pages when the guide’s comparison table names the hero SKU in the winning column with a product card, and when the guide’s body links to 3 to 6 recipes that use the winning ingredient. This 3-hop path (guide to recipe to SKU) pushes authority from a high-traffic informational query down to a high-intent transactional page. According to Search Engine Land SEO coverage, informational content that internally links to transactional pages produces 2 to 4 times higher organic revenue than isolated content silos.
Wrapping up content marketing for food brands
Content marketing for food brands is the organic engine that turns a DTC snack, drink, or CPG storefront into a search-driven revenue channel. Recipe hub of 40 to 100 recipes. Ingredient comparison guides at 12 to 24 pieces. Sourcing story pages at 6 to 12 pieces. Buyer intent content at 8 to 16 pieces. Creator syndication calendar with 12 to 30 creators per quarter. Refresh cadence at 12 to 24 months by pillar. Reporting with organic sessions and organic revenue attribution.
If your DTC food brand is running paid social at 20,000 dollars monthly with a broken blog and zero recipe schema, professional content marketing for food brands pays for itself inside the first 90 days on organic traffic captured. Redefine Web ships content marketing inside our monthly retainer packages. Book a call and we will walk through the last three DTC food brands we built recipe hubs for, pillar by pillar.
Anchor text on internal links varies across recipe hubs to avoid over-optimization patterns Google penalizes. Exact-match anchor (“single-origin Ethiopian coffee”) runs on 20 to 30 percent of internal links. Partial-match variations (“our Ethiopian roast”) run on 30 to 40 percent. Branded anchors (the SKU name) run on 20 to 30 percent. Generic anchors (“shop the coffee”) fill the remaining 10 to 20 percent. This ratio holds ranking without triggering the over-optimization penalty that shows up on brands that anchor-text-stuff every internal link with the same exact-match keyword. Cross-reference the linking layer on our food and beverage web design page.
Link equity from ingredient guides to SKU pages
Link equity from ingredient guides passes to SKU pages when the guide’s comparison table names the hero SKU in the winning column with a product card, and when the guide’s body links to 3 to 6 recipes that use the winning ingredient. This 3-hop path (guide to recipe to SKU) pushes authority from a high-traffic informational query down to a high-intent transactional page. According to Search Engine Land SEO coverage, informational content that internally links to transactional pages produces 2 to 4 times higher organic revenue than isolated content silos.
Wrapping up content marketing for food brands
Content marketing for food brands is the organic engine that turns a DTC snack, drink, or CPG storefront into a search-driven revenue channel. Recipe hub of 40 to 100 recipes. Ingredient comparison guides at 12 to 24 pieces. Sourcing story pages at 6 to 12 pieces. Buyer intent content at 8 to 16 pieces. Creator syndication calendar with 12 to 30 creators per quarter. Refresh cadence at 12 to 24 months by pillar. Reporting with organic sessions and organic revenue attribution.
If your DTC food brand is running paid social at 20,000 dollars monthly with a broken blog and zero recipe schema, professional content marketing for food brands pays for itself inside the first 90 days on organic traffic captured. Redefine Web ships content marketing inside our monthly retainer packages. Book a call and we will walk through the last three DTC food brands we built recipe hubs for, pillar by pillar.
Internal linking discipline across food brand content moves authority from recipe pages toward hero SKU product pages and comparison guides. Every recipe links to the hero SKU it uses inline (once in the ingredient list, once in a bottom call-out card). Every ingredient comparison guide links to 3 to 6 recipes using the winning ingredient plus the hero SKU product page. Every sourcing story links to the 2 to 4 SKUs sourced from that specific farm or cooperative.
Anchor text strategy across recipe hubs
Anchor text on internal links varies across recipe hubs to avoid over-optimization patterns Google penalizes. Exact-match anchor (“single-origin Ethiopian coffee”) runs on 20 to 30 percent of internal links. Partial-match variations (“our Ethiopian roast”) run on 30 to 40 percent. Branded anchors (the SKU name) run on 20 to 30 percent. Generic anchors (“shop the coffee”) fill the remaining 10 to 20 percent. This ratio holds ranking without triggering the over-optimization penalty that shows up on brands that anchor-text-stuff every internal link with the same exact-match keyword. Cross-reference the linking layer on our food and beverage web design page.
Link equity from ingredient guides to SKU pages
Link equity from ingredient guides passes to SKU pages when the guide’s comparison table names the hero SKU in the winning column with a product card, and when the guide’s body links to 3 to 6 recipes that use the winning ingredient. This 3-hop path (guide to recipe to SKU) pushes authority from a high-traffic informational query down to a high-intent transactional page. According to Search Engine Land SEO coverage, informational content that internally links to transactional pages produces 2 to 4 times higher organic revenue than isolated content silos.
Wrapping up content marketing for food brands
Content marketing for food brands is the organic engine that turns a DTC snack, drink, or CPG storefront into a search-driven revenue channel. Recipe hub of 40 to 100 recipes. Ingredient comparison guides at 12 to 24 pieces. Sourcing story pages at 6 to 12 pieces. Buyer intent content at 8 to 16 pieces. Creator syndication calendar with 12 to 30 creators per quarter. Refresh cadence at 12 to 24 months by pillar. Reporting with organic sessions and organic revenue attribution.
If your DTC food brand is running paid social at 20,000 dollars monthly with a broken blog and zero recipe schema, professional content marketing for food brands pays for itself inside the first 90 days on organic traffic captured. Redefine Web ships content marketing inside our monthly retainer packages. Book a call and we will walk through the last three DTC food brands we built recipe hubs for, pillar by pillar.
Content marketing for food brands starts with a recipe hub because recipe queries account for 40 to 60 percent of high-intent search volume in the food category. Every hero SKU needs 4 to 12 recipes anchored to it, each targeting a specific occasion and audience.
Skip the recipe hub and the brand loses the search real estate that pulls DTC storefront traffic month over month at zero incremental paid cost. Recipe traffic converts at 2 to 4 percent because the shopper landed with usage intent, not passive discovery, which is why food brands win on recipes.
Recipe schema and Google rich result eligibility
Every recipe page ships schema.org Recipe markup including cookTime, prepTime, recipeIngredient, recipeInstructions, nutrition, and aggregateRating. Correctly marked-up recipes qualify for Google’s recipe rich result carousel that pulls 3 to 6 times higher click-through rate than a plain blue link. The schema layer takes 15 minutes per recipe to author and 30 minutes to validate in Google Search Console. Cross-reference the recipe search stack on our food and beverage SEO page.
Recipe hub structure that scales
The recipe hub structure runs 40 to 100 recipes at maturity, organized by hero SKU (4 to 12 recipes per SKU) plus occasion tags (breakfast, weeknight dinner, meal prep, brunch, holiday). Every recipe links back to the hero SKU product page with the SKU embedded in an inline card. The hub earns internal linking value from ingredient comparison guides and the sourcing story pages, which feeds recipe ranking on Google. According to Google Search Central recipe structured data guidance, complete Recipe schema markup is required for eligibility in the recipe carousel and the ingredient search filter.
Pillar structure for food brand content marketing
The pillar structure on content marketing for food brands runs 4 content pillars concurrently: recipe hub (40 to 100 recipes), ingredient comparison guides (12 to 24 guides), sourcing story pages (6 to 12 pages), and buyer intent content (where to buy, subscription vs. one-time, gift bundle guides). Every pillar covers a distinct search intent and every pillar links back to the hero SKU product pages.
Ingredient comparison guide format
Ingredient comparison guides run 1,800 to 3,200 words comparing 2 to 4 ingredient types on 6 to 10 attributes with a comparison table, real-world use case examples, and links to the hero SKU that uses the specific ingredient. Example: organic vs. conventional oats compares nutritional profile, sourcing chain, cost, environmental impact, and taste on a 6-column table. The brand’s SKU appears in the winning column with a product card. These guides rank 3 to 8 months after publication and pull steady-state organic traffic.
Sourcing story pages that build trust
Sourcing story pages name the specific farms, cooperatives, or suppliers the brand sources from, with photos of the farms, farmer quotes, and specific harvest windows. A coffee brand’s Ethiopian farm page ranks for “single-origin Ethiopian coffee” and “Yirgacheffe coffee origin” plus 40 long-tail variations. The sourcing page pulls trust-building traffic that converts at 4 to 6 percent because the shopper landed pattern-matching on transparency and named provenance. Every sourcing page includes farmer or cooperative quotes, harvest dates, and a link back to 3 to 5 hero SKU pages that source from the named supplier.
Vejrø hospitality content case study
Vejrø Resort, a Danish private-island destination with an on-site restaurant focused on organic, locally sourced cuisine, joined us with strong social engagement and no organic-search real estate. Guests found the resort on Instagram but never in Google search for terms like “private island resort Denmark,” “farm-to-table hospitality Denmark,” or “Vejrø restaurant.” The same organic-search gap shows up on DTC food brands running paid social at 20,000 dollars monthly with a broken blog and zero recipe schema.
We built the conversion-focused website with on-site and off-site SEO tuned to the travel-niche keyword clusters, competitor analysis against comparable boutique resorts, and mobile-first design prioritizing guest discovery. Every page carried the structured data qualifying it for Google’s rich results in the hospitality category. Every internal link pushed authority toward the direct-booking conversion path.
Three months later, Vejrø hit 10,000 plus organic visitors, ranked for 200 plus first-page keywords, and pulled a 2.2 percent booking conversion rate from organic traffic. The same pattern applies to content marketing for food brands: recipe schema, ingredient comparison guides, and sourcing story pages pull organic traffic at 20 to 40 percent conversion into hero SKU pages inside 6 months when the content quality matches search intent and every page carries the right structured data markup. Vejrø also proved out the reporting discipline: every monthly report named the exact page, the exact keyword cluster, and the exact search feature (rich result, sitelinks, image pack) driving the incremental organic revenue instead of hiding behind aggregate traffic charts.
Recipe cadence and content calendar for food brands
Recipe cadence on a working food brand content calendar ships 2 to 4 new recipes per week during the first 6 months and drops to 1 per week at maturity. Each recipe takes 4 to 6 hours to produce (write, test in the kitchen, photograph, schema author, publish). At 3 recipes per week, the brand hits 78 recipes inside 6 months plus a backlog of ingredient comparison and sourcing content queued behind the recipe production line.
| Content pillar | Target volume year 1 | Production cost per piece | Refresh cadence |
|---|---|---|---|
| Recipe hub | 40 to 100 recipes | $180 to $320 | Every 12 months |
| Ingredient comparison guides | 12 to 24 guides | $450 to $780 | Every 18 months |
| Sourcing story pages | 6 to 12 pages | $680 to $1,200 | Every 24 months |
| Buyer intent content | 8 to 16 pieces | $220 to $420 | Every 12 months |
Photography as a content calendar constraint
Photography is the actual constraint on recipe cadence, not writing. Every recipe needs 6 to 12 photos: hero shot, ingredient flat lay, prep in progress, plated result, storage, and step shots for the schema markup. A working food brand batches photography 8 recipes at a time to keep the cost per recipe under 200 dollars. Skip the batching and the per-recipe cost climbs to 400 to 600 dollars, which caps recipe cadence at 1 per week and slows organic ranking timeline by 6 months.
Seasonal content calendar planning
Seasonal content calendar planning maps recipes and comparison guides to the seasonal windows they need to rank in. A Christmas cookie recipe needs to publish in September to rank by early December. A Valentine’s chocolate guide needs to publish in November to rank by early February. A back-to-school lunchbox recipe needs to publish in June to rank by late August. The 60-to-90-day ranking curve dictates the calendar.
Creator syndication inside food brand content
Creator syndication on food brand content marketing amplifies the recipe hub through Instagram Reels, TikTok, and YouTube Shorts creators paid to post their own version of the brand’s hero recipes. The creator content pulls net-new audiences into the recipe hub through the creator’s Link in Bio or Amazon Storefront tag. The syndication calendar names 12 to 30 creators per quarter with specific recipes assigned to each.
One brand we picked up had a spreadsheet titled “creator outreach 2023” with 47 rows and 3 responses. All 3 responses were auto-replies. The spreadsheet named zero recipes and offered flat rates below 100 dollars per post. Nobody posts a 30-second video for 87 dollars flat. Nobody.
Creator content commercial terms that work
Working creator content commercial terms run 350 to 1,500 dollars flat per post plus a 12 to 25 percent commission on tagged sales across a 30-day window. The commission mechanic pulls creators into follow-up posts because the incremental revenue continues past the initial fee. Mid-tier creators (30k to 150k followers) hit the sweet spot for food brand content because their engagement rate typically runs 4 to 8 percent versus 0.8 to 1.6 percent on mega-creators.
Content brief structure for creator partnerships
The content brief structure for creator partnerships runs a single page: the SKU, the specific recipe or usage occasion, 3 required brand mentions, 3 restricted claims (no health claims on non-medical SKUs), the pricing angle, the affiliate link, and 3 example videos that hit the tone. The brief avoids over-scripting because over-scripted creator content underperforms native creator voice by 40 to 60 percent on engagement rate.
Buyer intent content for food brand blogs
Buyer intent content on food brand blogs covers 8 to 16 pieces targeting explicit purchase-decision queries: “where to buy [brand],” “[brand] subscription vs. one-time,” “best [category] for [use case],” and “[brand] gift bundle.” Every buyer intent piece runs 1,400 to 2,400 words with a comparison table, product cards, and a clear conversion path to the specific SKU that matches the query intent. Buyer intent content converts at 3 to 6 percent versus 1 to 2 percent on recipe content because the shopper landed already planning to buy, not exploring a usage occasion.
Where-to-buy content structure
Where-to-buy content structure covers online (DTC storefront, Amazon, Target.com, Whole Foods online), retail (specific chain locators with the store finder embedded), and international (customs limitations, retailer partners abroad). Every piece names specific retailers, links to the store locator, and includes an FAQ block covering shipping availability, subscription options, and gift card compatibility. Where-to-buy content ranks for branded discovery queries the DTC storefront otherwise loses to competitor affiliate reviews.
Subscription versus one-time comparison content
Subscription versus one-time comparison content converts subscription commitments at 3 to 6 percent because it addresses the price-sensitivity concern head-on with a specific math table. The piece covers the discount structure (15 percent lifetime), the skip-a-month mechanic, the pause-anytime rule, the cancellation policy, and the specific yearly savings for the brand’s average consumption cadence. Cross-reference the retention structure on our food and beverage marketing retainer page.
Content refresh cadence on food brand pillars
Content refresh cadence on food brand content pillars runs a rolling audit every 12 to 24 months by pillar. Recipes get refreshed every 12 months with new photography, updated schema, and any nutrition or ingredient adjustments. Ingredient comparison guides refresh every 18 months to update market data. Sourcing story pages refresh every 24 months to reflect farm partnership changes and new harvest angles. Buyer intent content refreshes every 12 months to update retailer availability and pricing.
Recipe refresh priority order
Recipe refresh priority runs by organic traffic rank. The top 20 recipes by monthly organic sessions get refreshed first (new photography, schema audit, related recipe internal links, updated nutrition). The next 40 get refreshed at 15 months. The remaining recipes get refreshed opportunistically when the ranking slips past position 15 in Google. Skipping the refresh cadence lets recipe rankings drift out of the top 3 inside 18 months as newer competitor recipes take the position.
Schema audit checklist per refresh
The schema audit checklist per refresh runs 8 items: Recipe schema completeness, aggregateRating count and accuracy, nutrition data accuracy, prepTime and cookTime match the recipe body, image URLs valid at CDN, related recipe internal links working, product card SKU URL live, and Google Search Console rich result eligibility validated. This checklist takes 20 minutes per recipe and prevents the schema drift that costs recipe rankings 20 to 40 positions quietly.
Reporting cadence for food brand content marketing
Reporting cadence on food brand content marketing runs a monthly executive report plus a quarterly business review. The monthly report ships in the first business week and covers organic sessions by pillar, top 10 ranking recipes with position trend, ingredient guide ranking movements, sourcing page performance, and organic-attributed DTC revenue. Every number carries a comparison to the prior month and a plain-language interpretation the founder reads in 7 minutes.
Metrics that matter for content marketing
Metrics that matter for food brand content marketing: organic sessions by pillar, recipe rich result impressions in Search Console, organic conversion rate to hero SKU pages, organic-attributed DTC revenue, and top 20 ranking positions by monthly organic sessions. Vanity metrics that do not matter: total pageviews without conversion context, average time on page without conversion attribution, and social share counts. The monthly report skips the vanity block entirely.
Quarterly business review structure
The quarterly business review runs 90 minutes with the founder, head of content, and SEO lead. Agenda: organic traffic trend by pillar, top 10 winning content pieces, top 10 losing content pieces (candidates for refresh or removal), competitive gap analysis against 5 named competitor brands, and next quarter’s content calendar with recipes and ingredient guides queued. According to Ahrefs content marketing research, brands running quarterly content audits outperform brands running annual audits by 40 to 70 percent on organic revenue over a 24-month window.
Internal linking discipline across food brand content
Internal linking discipline across food brand content moves authority from recipe pages toward hero SKU product pages and comparison guides. Every recipe links to the hero SKU it uses inline (once in the ingredient list, once in a bottom call-out card). Every ingredient comparison guide links to 3 to 6 recipes using the winning ingredient plus the hero SKU product page. Every sourcing story links to the 2 to 4 SKUs sourced from that specific farm or cooperative.
Anchor text strategy across recipe hubs
Anchor text on internal links varies across recipe hubs to avoid over-optimization patterns Google penalizes. Exact-match anchor (“single-origin Ethiopian coffee”) runs on 20 to 30 percent of internal links. Partial-match variations (“our Ethiopian roast”) run on 30 to 40 percent. Branded anchors (the SKU name) run on 20 to 30 percent. Generic anchors (“shop the coffee”) fill the remaining 10 to 20 percent. This ratio holds ranking without triggering the over-optimization penalty that shows up on brands that anchor-text-stuff every internal link with the same exact-match keyword. Cross-reference the linking layer on our food and beverage web design page.
Link equity from ingredient guides to SKU pages
Link equity from ingredient guides passes to SKU pages when the guide’s comparison table names the hero SKU in the winning column with a product card, and when the guide’s body links to 3 to 6 recipes that use the winning ingredient. This 3-hop path (guide to recipe to SKU) pushes authority from a high-traffic informational query down to a high-intent transactional page. According to Search Engine Land SEO coverage, informational content that internally links to transactional pages produces 2 to 4 times higher organic revenue than isolated content silos.
Wrapping up content marketing for food brands
Content marketing for food brands is the organic engine that turns a DTC snack, drink, or CPG storefront into a search-driven revenue channel. Recipe hub of 40 to 100 recipes. Ingredient comparison guides at 12 to 24 pieces. Sourcing story pages at 6 to 12 pieces. Buyer intent content at 8 to 16 pieces. Creator syndication calendar with 12 to 30 creators per quarter. Refresh cadence at 12 to 24 months by pillar. Reporting with organic sessions and organic revenue attribution.
If your DTC food brand is running paid social at 20,000 dollars monthly with a broken blog and zero recipe schema, professional content marketing for food brands pays for itself inside the first 90 days on organic traffic captured. Redefine Web ships content marketing inside our monthly retainer packages. Book a call and we will walk through the last three DTC food brands we built recipe hubs for, pillar by pillar.
Content marketing for food brands starts with a recipe hub because recipe queries account for 40 to 60 percent of high-intent search volume in the food category. Every hero SKU needs 4 to 12 recipes anchored to it, each targeting a specific occasion and audience.
Skip the recipe hub and the brand loses the search real estate that pulls DTC storefront traffic month over month at zero incremental paid cost. Recipe traffic converts at 2 to 4 percent because the shopper landed with usage intent, not passive discovery, which is why food brands win on recipes.
Recipe schema and Google rich result eligibility
Every recipe page ships schema.org Recipe markup including cookTime, prepTime, recipeIngredient, recipeInstructions, nutrition, and aggregateRating. Correctly marked-up recipes qualify for Google’s recipe rich result carousel that pulls 3 to 6 times higher click-through rate than a plain blue link. The schema layer takes 15 minutes per recipe to author and 30 minutes to validate in Google Search Console. Cross-reference the recipe search stack on our food and beverage SEO page.
Recipe hub structure that scales
The recipe hub structure runs 40 to 100 recipes at maturity, organized by hero SKU (4 to 12 recipes per SKU) plus occasion tags (breakfast, weeknight dinner, meal prep, brunch, holiday). Every recipe links back to the hero SKU product page with the SKU embedded in an inline card. The hub earns internal linking value from ingredient comparison guides and the sourcing story pages, which feeds recipe ranking on Google. According to Google Search Central recipe structured data guidance, complete Recipe schema markup is required for eligibility in the recipe carousel and the ingredient search filter.
Pillar structure for food brand content marketing
The pillar structure on content marketing for food brands runs 4 content pillars concurrently: recipe hub (40 to 100 recipes), ingredient comparison guides (12 to 24 guides), sourcing story pages (6 to 12 pages), and buyer intent content (where to buy, subscription vs. one-time, gift bundle guides). Every pillar covers a distinct search intent and every pillar links back to the hero SKU product pages.
Ingredient comparison guide format
Ingredient comparison guides run 1,800 to 3,200 words comparing 2 to 4 ingredient types on 6 to 10 attributes with a comparison table, real-world use case examples, and links to the hero SKU that uses the specific ingredient. Example: organic vs. conventional oats compares nutritional profile, sourcing chain, cost, environmental impact, and taste on a 6-column table. The brand’s SKU appears in the winning column with a product card. These guides rank 3 to 8 months after publication and pull steady-state organic traffic.
Sourcing story pages that build trust
Sourcing story pages name the specific farms, cooperatives, or suppliers the brand sources from, with photos of the farms, farmer quotes, and specific harvest windows. A coffee brand’s Ethiopian farm page ranks for “single-origin Ethiopian coffee” and “Yirgacheffe coffee origin” plus 40 long-tail variations. The sourcing page pulls trust-building traffic that converts at 4 to 6 percent because the shopper landed pattern-matching on transparency and named provenance. Every sourcing page includes farmer or cooperative quotes, harvest dates, and a link back to 3 to 5 hero SKU pages that source from the named supplier.
Vejrø hospitality content case study
Vejrø Resort, a Danish private-island destination with an on-site restaurant focused on organic, locally sourced cuisine, joined us with strong social engagement and no organic-search real estate. Guests found the resort on Instagram but never in Google search for terms like “private island resort Denmark,” “farm-to-table hospitality Denmark,” or “Vejrø restaurant.” The same organic-search gap shows up on DTC food brands running paid social at 20,000 dollars monthly with a broken blog and zero recipe schema.
We built the conversion-focused website with on-site and off-site SEO tuned to the travel-niche keyword clusters, competitor analysis against comparable boutique resorts, and mobile-first design prioritizing guest discovery. Every page carried the structured data qualifying it for Google’s rich results in the hospitality category. Every internal link pushed authority toward the direct-booking conversion path.
Three months later, Vejrø hit 10,000 plus organic visitors, ranked for 200 plus first-page keywords, and pulled a 2.2 percent booking conversion rate from organic traffic. The same pattern applies to content marketing for food brands: recipe schema, ingredient comparison guides, and sourcing story pages pull organic traffic at 20 to 40 percent conversion into hero SKU pages inside 6 months when the content quality matches search intent and every page carries the right structured data markup. Vejrø also proved out the reporting discipline: every monthly report named the exact page, the exact keyword cluster, and the exact search feature (rich result, sitelinks, image pack) driving the incremental organic revenue instead of hiding behind aggregate traffic charts.
Recipe cadence and content calendar for food brands
Recipe cadence on a working food brand content calendar ships 2 to 4 new recipes per week during the first 6 months and drops to 1 per week at maturity. Each recipe takes 4 to 6 hours to produce (write, test in the kitchen, photograph, schema author, publish). At 3 recipes per week, the brand hits 78 recipes inside 6 months plus a backlog of ingredient comparison and sourcing content queued behind the recipe production line.
| Content pillar | Target volume year 1 | Production cost per piece | Refresh cadence |
|---|---|---|---|
| Recipe hub | 40 to 100 recipes | $180 to $320 | Every 12 months |
| Ingredient comparison guides | 12 to 24 guides | $450 to $780 | Every 18 months |
| Sourcing story pages | 6 to 12 pages | $680 to $1,200 | Every 24 months |
| Buyer intent content | 8 to 16 pieces | $220 to $420 | Every 12 months |
Photography as a content calendar constraint
Photography is the actual constraint on recipe cadence, not writing. Every recipe needs 6 to 12 photos: hero shot, ingredient flat lay, prep in progress, plated result, storage, and step shots for the schema markup. A working food brand batches photography 8 recipes at a time to keep the cost per recipe under 200 dollars. Skip the batching and the per-recipe cost climbs to 400 to 600 dollars, which caps recipe cadence at 1 per week and slows organic ranking timeline by 6 months.
Seasonal content calendar planning
Seasonal content calendar planning maps recipes and comparison guides to the seasonal windows they need to rank in. A Christmas cookie recipe needs to publish in September to rank by early December. A Valentine’s chocolate guide needs to publish in November to rank by early February. A back-to-school lunchbox recipe needs to publish in June to rank by late August. The 60-to-90-day ranking curve dictates the calendar.
Creator syndication inside food brand content
Creator syndication on food brand content marketing amplifies the recipe hub through Instagram Reels, TikTok, and YouTube Shorts creators paid to post their own version of the brand’s hero recipes. The creator content pulls net-new audiences into the recipe hub through the creator’s Link in Bio or Amazon Storefront tag. The syndication calendar names 12 to 30 creators per quarter with specific recipes assigned to each.
One brand we picked up had a spreadsheet titled “creator outreach 2023” with 47 rows and 3 responses. All 3 responses were auto-replies. The spreadsheet named zero recipes and offered flat rates below 100 dollars per post. Nobody posts a 30-second video for 87 dollars flat. Nobody.
Creator content commercial terms that work
Working creator content commercial terms run 350 to 1,500 dollars flat per post plus a 12 to 25 percent commission on tagged sales across a 30-day window. The commission mechanic pulls creators into follow-up posts because the incremental revenue continues past the initial fee. Mid-tier creators (30k to 150k followers) hit the sweet spot for food brand content because their engagement rate typically runs 4 to 8 percent versus 0.8 to 1.6 percent on mega-creators.
Content brief structure for creator partnerships
The content brief structure for creator partnerships runs a single page: the SKU, the specific recipe or usage occasion, 3 required brand mentions, 3 restricted claims (no health claims on non-medical SKUs), the pricing angle, the affiliate link, and 3 example videos that hit the tone. The brief avoids over-scripting because over-scripted creator content underperforms native creator voice by 40 to 60 percent on engagement rate.
Buyer intent content for food brand blogs
Buyer intent content on food brand blogs covers 8 to 16 pieces targeting explicit purchase-decision queries: “where to buy [brand],” “[brand] subscription vs. one-time,” “best [category] for [use case],” and “[brand] gift bundle.” Every buyer intent piece runs 1,400 to 2,400 words with a comparison table, product cards, and a clear conversion path to the specific SKU that matches the query intent. Buyer intent content converts at 3 to 6 percent versus 1 to 2 percent on recipe content because the shopper landed already planning to buy, not exploring a usage occasion.
Where-to-buy content structure
Where-to-buy content structure covers online (DTC storefront, Amazon, Target.com, Whole Foods online), retail (specific chain locators with the store finder embedded), and international (customs limitations, retailer partners abroad). Every piece names specific retailers, links to the store locator, and includes an FAQ block covering shipping availability, subscription options, and gift card compatibility. Where-to-buy content ranks for branded discovery queries the DTC storefront otherwise loses to competitor affiliate reviews.
Subscription versus one-time comparison content
Subscription versus one-time comparison content converts subscription commitments at 3 to 6 percent because it addresses the price-sensitivity concern head-on with a specific math table. The piece covers the discount structure (15 percent lifetime), the skip-a-month mechanic, the pause-anytime rule, the cancellation policy, and the specific yearly savings for the brand’s average consumption cadence. Cross-reference the retention structure on our food and beverage marketing retainer page.
Content refresh cadence on food brand pillars
Content refresh cadence on food brand content pillars runs a rolling audit every 12 to 24 months by pillar. Recipes get refreshed every 12 months with new photography, updated schema, and any nutrition or ingredient adjustments. Ingredient comparison guides refresh every 18 months to update market data. Sourcing story pages refresh every 24 months to reflect farm partnership changes and new harvest angles. Buyer intent content refreshes every 12 months to update retailer availability and pricing.
Recipe refresh priority order
Recipe refresh priority runs by organic traffic rank. The top 20 recipes by monthly organic sessions get refreshed first (new photography, schema audit, related recipe internal links, updated nutrition). The next 40 get refreshed at 15 months. The remaining recipes get refreshed opportunistically when the ranking slips past position 15 in Google. Skipping the refresh cadence lets recipe rankings drift out of the top 3 inside 18 months as newer competitor recipes take the position.
Schema audit checklist per refresh
The schema audit checklist per refresh runs 8 items: Recipe schema completeness, aggregateRating count and accuracy, nutrition data accuracy, prepTime and cookTime match the recipe body, image URLs valid at CDN, related recipe internal links working, product card SKU URL live, and Google Search Console rich result eligibility validated. This checklist takes 20 minutes per recipe and prevents the schema drift that costs recipe rankings 20 to 40 positions quietly.
Reporting cadence for food brand content marketing
Reporting cadence on food brand content marketing runs a monthly executive report plus a quarterly business review. The monthly report ships in the first business week and covers organic sessions by pillar, top 10 ranking recipes with position trend, ingredient guide ranking movements, sourcing page performance, and organic-attributed DTC revenue. Every number carries a comparison to the prior month and a plain-language interpretation the founder reads in 7 minutes.
Metrics that matter for content marketing
Metrics that matter for food brand content marketing: organic sessions by pillar, recipe rich result impressions in Search Console, organic conversion rate to hero SKU pages, organic-attributed DTC revenue, and top 20 ranking positions by monthly organic sessions. Vanity metrics that do not matter: total pageviews without conversion context, average time on page without conversion attribution, and social share counts. The monthly report skips the vanity block entirely.
Quarterly business review structure
The quarterly business review runs 90 minutes with the founder, head of content, and SEO lead. Agenda: organic traffic trend by pillar, top 10 winning content pieces, top 10 losing content pieces (candidates for refresh or removal), competitive gap analysis against 5 named competitor brands, and next quarter’s content calendar with recipes and ingredient guides queued. According to Ahrefs content marketing research, brands running quarterly content audits outperform brands running annual audits by 40 to 70 percent on organic revenue over a 24-month window.
Internal linking discipline across food brand content
Internal linking discipline across food brand content moves authority from recipe pages toward hero SKU product pages and comparison guides. Every recipe links to the hero SKU it uses inline (once in the ingredient list, once in a bottom call-out card). Every ingredient comparison guide links to 3 to 6 recipes using the winning ingredient plus the hero SKU product page. Every sourcing story links to the 2 to 4 SKUs sourced from that specific farm or cooperative.
Anchor text strategy across recipe hubs
Anchor text on internal links varies across recipe hubs to avoid over-optimization patterns Google penalizes. Exact-match anchor (“single-origin Ethiopian coffee”) runs on 20 to 30 percent of internal links. Partial-match variations (“our Ethiopian roast”) run on 30 to 40 percent. Branded anchors (the SKU name) run on 20 to 30 percent. Generic anchors (“shop the coffee”) fill the remaining 10 to 20 percent. This ratio holds ranking without triggering the over-optimization penalty that shows up on brands that anchor-text-stuff every internal link with the same exact-match keyword. Cross-reference the linking layer on our food and beverage web design page.
Link equity from ingredient guides to SKU pages
Link equity from ingredient guides passes to SKU pages when the guide’s comparison table names the hero SKU in the winning column with a product card, and when the guide’s body links to 3 to 6 recipes that use the winning ingredient. This 3-hop path (guide to recipe to SKU) pushes authority from a high-traffic informational query down to a high-intent transactional page. According to Search Engine Land SEO coverage, informational content that internally links to transactional pages produces 2 to 4 times higher organic revenue than isolated content silos.
Wrapping up content marketing for food brands
Content marketing for food brands is the organic engine that turns a DTC snack, drink, or CPG storefront into a search-driven revenue channel. Recipe hub of 40 to 100 recipes. Ingredient comparison guides at 12 to 24 pieces. Sourcing story pages at 6 to 12 pieces. Buyer intent content at 8 to 16 pieces. Creator syndication calendar with 12 to 30 creators per quarter. Refresh cadence at 12 to 24 months by pillar. Reporting with organic sessions and organic revenue attribution.
If your DTC food brand is running paid social at 20,000 dollars monthly with a broken blog and zero recipe schema, professional content marketing for food brands pays for itself inside the first 90 days on organic traffic captured. Redefine Web ships content marketing inside our monthly retainer packages. Book a call and we will walk through the last three DTC food brands we built recipe hubs for, pillar by pillar.
Content marketing for food brands starts with a recipe hub because recipe queries account for 40 to 60 percent of high-intent search volume in the food category. Every hero SKU needs 4 to 12 recipes anchored to it, each targeting a specific occasion and audience.
Skip the recipe hub and the brand loses the search real estate that pulls DTC storefront traffic month over month at zero incremental paid cost. Recipe traffic converts at 2 to 4 percent because the shopper landed with usage intent, not passive discovery, which is why food brands win on recipes.
Recipe schema and Google rich result eligibility
Every recipe page ships schema.org Recipe markup including cookTime, prepTime, recipeIngredient, recipeInstructions, nutrition, and aggregateRating. Correctly marked-up recipes qualify for Google’s recipe rich result carousel that pulls 3 to 6 times higher click-through rate than a plain blue link. The schema layer takes 15 minutes per recipe to author and 30 minutes to validate in Google Search Console. Cross-reference the recipe search stack on our food and beverage SEO page.
Recipe hub structure that scales
The recipe hub structure runs 40 to 100 recipes at maturity, organized by hero SKU (4 to 12 recipes per SKU) plus occasion tags (breakfast, weeknight dinner, meal prep, brunch, holiday). Every recipe links back to the hero SKU product page with the SKU embedded in an inline card. The hub earns internal linking value from ingredient comparison guides and the sourcing story pages, which feeds recipe ranking on Google. According to Google Search Central recipe structured data guidance, complete Recipe schema markup is required for eligibility in the recipe carousel and the ingredient search filter.
Pillar structure for food brand content marketing
The pillar structure on content marketing for food brands runs 4 content pillars concurrently: recipe hub (40 to 100 recipes), ingredient comparison guides (12 to 24 guides), sourcing story pages (6 to 12 pages), and buyer intent content (where to buy, subscription vs. one-time, gift bundle guides). Every pillar covers a distinct search intent and every pillar links back to the hero SKU product pages.
Ingredient comparison guide format
Ingredient comparison guides run 1,800 to 3,200 words comparing 2 to 4 ingredient types on 6 to 10 attributes with a comparison table, real-world use case examples, and links to the hero SKU that uses the specific ingredient. Example: organic vs. conventional oats compares nutritional profile, sourcing chain, cost, environmental impact, and taste on a 6-column table. The brand’s SKU appears in the winning column with a product card. These guides rank 3 to 8 months after publication and pull steady-state organic traffic.
Sourcing story pages that build trust
Sourcing story pages name the specific farms, cooperatives, or suppliers the brand sources from, with photos of the farms, farmer quotes, and specific harvest windows. A coffee brand’s Ethiopian farm page ranks for “single-origin Ethiopian coffee” and “Yirgacheffe coffee origin” plus 40 long-tail variations. The sourcing page pulls trust-building traffic that converts at 4 to 6 percent because the shopper landed pattern-matching on transparency and named provenance. Every sourcing page includes farmer or cooperative quotes, harvest dates, and a link back to 3 to 5 hero SKU pages that source from the named supplier.
Vejrø hospitality content case study
Vejrø Resort, a Danish private-island destination with an on-site restaurant focused on organic, locally sourced cuisine, joined us with strong social engagement and no organic-search real estate. Guests found the resort on Instagram but never in Google search for terms like “private island resort Denmark,” “farm-to-table hospitality Denmark,” or “Vejrø restaurant.” The same organic-search gap shows up on DTC food brands running paid social at 20,000 dollars monthly with a broken blog and zero recipe schema.
We built the conversion-focused website with on-site and off-site SEO tuned to the travel-niche keyword clusters, competitor analysis against comparable boutique resorts, and mobile-first design prioritizing guest discovery. Every page carried the structured data qualifying it for Google’s rich results in the hospitality category. Every internal link pushed authority toward the direct-booking conversion path.
Three months later, Vejrø hit 10,000 plus organic visitors, ranked for 200 plus first-page keywords, and pulled a 2.2 percent booking conversion rate from organic traffic. The same pattern applies to content marketing for food brands: recipe schema, ingredient comparison guides, and sourcing story pages pull organic traffic at 20 to 40 percent conversion into hero SKU pages inside 6 months when the content quality matches search intent and every page carries the right structured data markup. Vejrø also proved out the reporting discipline: every monthly report named the exact page, the exact keyword cluster, and the exact search feature (rich result, sitelinks, image pack) driving the incremental organic revenue instead of hiding behind aggregate traffic charts.
Recipe cadence and content calendar for food brands
Recipe cadence on a working food brand content calendar ships 2 to 4 new recipes per week during the first 6 months and drops to 1 per week at maturity. Each recipe takes 4 to 6 hours to produce (write, test in the kitchen, photograph, schema author, publish). At 3 recipes per week, the brand hits 78 recipes inside 6 months plus a backlog of ingredient comparison and sourcing content queued behind the recipe production line.
| Content pillar | Target volume year 1 | Production cost per piece | Refresh cadence |
|---|---|---|---|
| Recipe hub | 40 to 100 recipes | $180 to $320 | Every 12 months |
| Ingredient comparison guides | 12 to 24 guides | $450 to $780 | Every 18 months |
| Sourcing story pages | 6 to 12 pages | $680 to $1,200 | Every 24 months |
| Buyer intent content | 8 to 16 pieces | $220 to $420 | Every 12 months |
Photography as a content calendar constraint
Photography is the actual constraint on recipe cadence, not writing. Every recipe needs 6 to 12 photos: hero shot, ingredient flat lay, prep in progress, plated result, storage, and step shots for the schema markup. A working food brand batches photography 8 recipes at a time to keep the cost per recipe under 200 dollars. Skip the batching and the per-recipe cost climbs to 400 to 600 dollars, which caps recipe cadence at 1 per week and slows organic ranking timeline by 6 months.
Seasonal content calendar planning
Seasonal content calendar planning maps recipes and comparison guides to the seasonal windows they need to rank in. A Christmas cookie recipe needs to publish in September to rank by early December. A Valentine’s chocolate guide needs to publish in November to rank by early February. A back-to-school lunchbox recipe needs to publish in June to rank by late August. The 60-to-90-day ranking curve dictates the calendar.
Creator syndication inside food brand content
Creator syndication on food brand content marketing amplifies the recipe hub through Instagram Reels, TikTok, and YouTube Shorts creators paid to post their own version of the brand’s hero recipes. The creator content pulls net-new audiences into the recipe hub through the creator’s Link in Bio or Amazon Storefront tag. The syndication calendar names 12 to 30 creators per quarter with specific recipes assigned to each.
One brand we picked up had a spreadsheet titled “creator outreach 2023” with 47 rows and 3 responses. All 3 responses were auto-replies. The spreadsheet named zero recipes and offered flat rates below 100 dollars per post. Nobody posts a 30-second video for 87 dollars flat. Nobody.
Creator content commercial terms that work
Working creator content commercial terms run 350 to 1,500 dollars flat per post plus a 12 to 25 percent commission on tagged sales across a 30-day window. The commission mechanic pulls creators into follow-up posts because the incremental revenue continues past the initial fee. Mid-tier creators (30k to 150k followers) hit the sweet spot for food brand content because their engagement rate typically runs 4 to 8 percent versus 0.8 to 1.6 percent on mega-creators.
Content brief structure for creator partnerships
The content brief structure for creator partnerships runs a single page: the SKU, the specific recipe or usage occasion, 3 required brand mentions, 3 restricted claims (no health claims on non-medical SKUs), the pricing angle, the affiliate link, and 3 example videos that hit the tone. The brief avoids over-scripting because over-scripted creator content underperforms native creator voice by 40 to 60 percent on engagement rate.
Buyer intent content for food brand blogs
Buyer intent content on food brand blogs covers 8 to 16 pieces targeting explicit purchase-decision queries: “where to buy [brand],” “[brand] subscription vs. one-time,” “best [category] for [use case],” and “[brand] gift bundle.” Every buyer intent piece runs 1,400 to 2,400 words with a comparison table, product cards, and a clear conversion path to the specific SKU that matches the query intent. Buyer intent content converts at 3 to 6 percent versus 1 to 2 percent on recipe content because the shopper landed already planning to buy, not exploring a usage occasion.
Where-to-buy content structure
Where-to-buy content structure covers online (DTC storefront, Amazon, Target.com, Whole Foods online), retail (specific chain locators with the store finder embedded), and international (customs limitations, retailer partners abroad). Every piece names specific retailers, links to the store locator, and includes an FAQ block covering shipping availability, subscription options, and gift card compatibility. Where-to-buy content ranks for branded discovery queries the DTC storefront otherwise loses to competitor affiliate reviews.
Subscription versus one-time comparison content
Subscription versus one-time comparison content converts subscription commitments at 3 to 6 percent because it addresses the price-sensitivity concern head-on with a specific math table. The piece covers the discount structure (15 percent lifetime), the skip-a-month mechanic, the pause-anytime rule, the cancellation policy, and the specific yearly savings for the brand’s average consumption cadence. Cross-reference the retention structure on our food and beverage marketing retainer page.
Content refresh cadence on food brand pillars
Content refresh cadence on food brand content pillars runs a rolling audit every 12 to 24 months by pillar. Recipes get refreshed every 12 months with new photography, updated schema, and any nutrition or ingredient adjustments. Ingredient comparison guides refresh every 18 months to update market data. Sourcing story pages refresh every 24 months to reflect farm partnership changes and new harvest angles. Buyer intent content refreshes every 12 months to update retailer availability and pricing.
Recipe refresh priority order
Recipe refresh priority runs by organic traffic rank. The top 20 recipes by monthly organic sessions get refreshed first (new photography, schema audit, related recipe internal links, updated nutrition). The next 40 get refreshed at 15 months. The remaining recipes get refreshed opportunistically when the ranking slips past position 15 in Google. Skipping the refresh cadence lets recipe rankings drift out of the top 3 inside 18 months as newer competitor recipes take the position.
Schema audit checklist per refresh
The schema audit checklist per refresh runs 8 items: Recipe schema completeness, aggregateRating count and accuracy, nutrition data accuracy, prepTime and cookTime match the recipe body, image URLs valid at CDN, related recipe internal links working, product card SKU URL live, and Google Search Console rich result eligibility validated. This checklist takes 20 minutes per recipe and prevents the schema drift that costs recipe rankings 20 to 40 positions quietly.
Reporting cadence for food brand content marketing
Reporting cadence on food brand content marketing runs a monthly executive report plus a quarterly business review. The monthly report ships in the first business week and covers organic sessions by pillar, top 10 ranking recipes with position trend, ingredient guide ranking movements, sourcing page performance, and organic-attributed DTC revenue. Every number carries a comparison to the prior month and a plain-language interpretation the founder reads in 7 minutes.
Metrics that matter for content marketing
Metrics that matter for food brand content marketing: organic sessions by pillar, recipe rich result impressions in Search Console, organic conversion rate to hero SKU pages, organic-attributed DTC revenue, and top 20 ranking positions by monthly organic sessions. Vanity metrics that do not matter: total pageviews without conversion context, average time on page without conversion attribution, and social share counts. The monthly report skips the vanity block entirely.
Quarterly business review structure
The quarterly business review runs 90 minutes with the founder, head of content, and SEO lead. Agenda: organic traffic trend by pillar, top 10 winning content pieces, top 10 losing content pieces (candidates for refresh or removal), competitive gap analysis against 5 named competitor brands, and next quarter’s content calendar with recipes and ingredient guides queued. According to Ahrefs content marketing research, brands running quarterly content audits outperform brands running annual audits by 40 to 70 percent on organic revenue over a 24-month window.
Internal linking discipline across food brand content
Internal linking discipline across food brand content moves authority from recipe pages toward hero SKU product pages and comparison guides. Every recipe links to the hero SKU it uses inline (once in the ingredient list, once in a bottom call-out card). Every ingredient comparison guide links to 3 to 6 recipes using the winning ingredient plus the hero SKU product page. Every sourcing story links to the 2 to 4 SKUs sourced from that specific farm or cooperative.
Anchor text strategy across recipe hubs
Anchor text on internal links varies across recipe hubs to avoid over-optimization patterns Google penalizes. Exact-match anchor (“single-origin Ethiopian coffee”) runs on 20 to 30 percent of internal links. Partial-match variations (“our Ethiopian roast”) run on 30 to 40 percent. Branded anchors (the SKU name) run on 20 to 30 percent. Generic anchors (“shop the coffee”) fill the remaining 10 to 20 percent. This ratio holds ranking without triggering the over-optimization penalty that shows up on brands that anchor-text-stuff every internal link with the same exact-match keyword. Cross-reference the linking layer on our food and beverage web design page.
Link equity from ingredient guides to SKU pages
Link equity from ingredient guides passes to SKU pages when the guide’s comparison table names the hero SKU in the winning column with a product card, and when the guide’s body links to 3 to 6 recipes that use the winning ingredient. This 3-hop path (guide to recipe to SKU) pushes authority from a high-traffic informational query down to a high-intent transactional page. According to Search Engine Land SEO coverage, informational content that internally links to transactional pages produces 2 to 4 times higher organic revenue than isolated content silos.
Wrapping up content marketing for food brands
Content marketing for food brands is the organic engine that turns a DTC snack, drink, or CPG storefront into a search-driven revenue channel. Recipe hub of 40 to 100 recipes. Ingredient comparison guides at 12 to 24 pieces. Sourcing story pages at 6 to 12 pieces. Buyer intent content at 8 to 16 pieces. Creator syndication calendar with 12 to 30 creators per quarter. Refresh cadence at 12 to 24 months by pillar. Reporting with organic sessions and organic revenue attribution.
If your DTC food brand is running paid social at 20,000 dollars monthly with a broken blog and zero recipe schema, professional content marketing for food brands pays for itself inside the first 90 days on organic traffic captured. Redefine Web ships content marketing inside our monthly retainer packages. Book a call and we will walk through the last three DTC food brands we built recipe hubs for, pillar by pillar.
Anchor text on internal links varies across recipe hubs to avoid over-optimization patterns Google penalizes. Exact-match anchor (“single-origin Ethiopian coffee”) runs on 20 to 30 percent of internal links. Partial-match variations (“our Ethiopian roast”) run on 30 to 40 percent. Branded anchors (the SKU name) run on 20 to 30 percent. Generic anchors (“shop the coffee”) fill the remaining 10 to 20 percent. This ratio holds ranking without triggering the over-optimization penalty that shows up on brands that anchor-text-stuff every internal link with the same exact-match keyword. Cross-reference the linking layer on our food and beverage web design page.
Link equity from ingredient guides to SKU pages
Link equity from ingredient guides passes to SKU pages when the guide’s comparison table names the hero SKU in the winning column with a product card, and when the guide’s body links to 3 to 6 recipes that use the winning ingredient. This 3-hop path (guide to recipe to SKU) pushes authority from a high-traffic informational query down to a high-intent transactional page. According to Search Engine Land SEO coverage, informational content that internally links to transactional pages produces 2 to 4 times higher organic revenue than isolated content silos.
Wrapping up content marketing for food brands
Content marketing for food brands is the organic engine that turns a DTC snack, drink, or CPG storefront into a search-driven revenue channel. Recipe hub of 40 to 100 recipes. Ingredient comparison guides at 12 to 24 pieces. Sourcing story pages at 6 to 12 pieces. Buyer intent content at 8 to 16 pieces. Creator syndication calendar with 12 to 30 creators per quarter. Refresh cadence at 12 to 24 months by pillar. Reporting with organic sessions and organic revenue attribution.
If your DTC food brand is running paid social at 20,000 dollars monthly with a broken blog and zero recipe schema, professional content marketing for food brands pays for itself inside the first 90 days on organic traffic captured. Redefine Web ships content marketing inside our monthly retainer packages. Book a call and we will walk through the last three DTC food brands we built recipe hubs for, pillar by pillar.
Internal linking discipline across food brand content moves authority from recipe pages toward hero SKU product pages and comparison guides. Every recipe links to the hero SKU it uses inline (once in the ingredient list, once in a bottom call-out card). Every ingredient comparison guide links to 3 to 6 recipes using the winning ingredient plus the hero SKU product page. Every sourcing story links to the 2 to 4 SKUs sourced from that specific farm or cooperative.
Anchor text strategy across recipe hubs
Anchor text on internal links varies across recipe hubs to avoid over-optimization patterns Google penalizes. Exact-match anchor (“single-origin Ethiopian coffee”) runs on 20 to 30 percent of internal links. Partial-match variations (“our Ethiopian roast”) run on 30 to 40 percent. Branded anchors (the SKU name) run on 20 to 30 percent. Generic anchors (“shop the coffee”) fill the remaining 10 to 20 percent. This ratio holds ranking without triggering the over-optimization penalty that shows up on brands that anchor-text-stuff every internal link with the same exact-match keyword. Cross-reference the linking layer on our food and beverage web design page.
Link equity from ingredient guides to SKU pages
Link equity from ingredient guides passes to SKU pages when the guide’s comparison table names the hero SKU in the winning column with a product card, and when the guide’s body links to 3 to 6 recipes that use the winning ingredient. This 3-hop path (guide to recipe to SKU) pushes authority from a high-traffic informational query down to a high-intent transactional page. According to Search Engine Land SEO coverage, informational content that internally links to transactional pages produces 2 to 4 times higher organic revenue than isolated content silos.
Wrapping up content marketing for food brands
Content marketing for food brands is the organic engine that turns a DTC snack, drink, or CPG storefront into a search-driven revenue channel. Recipe hub of 40 to 100 recipes. Ingredient comparison guides at 12 to 24 pieces. Sourcing story pages at 6 to 12 pieces. Buyer intent content at 8 to 16 pieces. Creator syndication calendar with 12 to 30 creators per quarter. Refresh cadence at 12 to 24 months by pillar. Reporting with organic sessions and organic revenue attribution.
If your DTC food brand is running paid social at 20,000 dollars monthly with a broken blog and zero recipe schema, professional content marketing for food brands pays for itself inside the first 90 days on organic traffic captured. Redefine Web ships content marketing inside our monthly retainer packages. Book a call and we will walk through the last three DTC food brands we built recipe hubs for, pillar by pillar.
Content marketing for food brands starts with a recipe hub because recipe queries account for 40 to 60 percent of high-intent search volume in the food category. Every hero SKU needs 4 to 12 recipes anchored to it, each targeting a specific occasion and audience.
Skip the recipe hub and the brand loses the search real estate that pulls DTC storefront traffic month over month at zero incremental paid cost. Recipe traffic converts at 2 to 4 percent because the shopper landed with usage intent, not passive discovery, which is why food brands win on recipes.
Recipe schema and Google rich result eligibility
Every recipe page ships schema.org Recipe markup including cookTime, prepTime, recipeIngredient, recipeInstructions, nutrition, and aggregateRating. Correctly marked-up recipes qualify for Google’s recipe rich result carousel that pulls 3 to 6 times higher click-through rate than a plain blue link. The schema layer takes 15 minutes per recipe to author and 30 minutes to validate in Google Search Console. Cross-reference the recipe search stack on our food and beverage SEO page.
Recipe hub structure that scales
The recipe hub structure runs 40 to 100 recipes at maturity, organized by hero SKU (4 to 12 recipes per SKU) plus occasion tags (breakfast, weeknight dinner, meal prep, brunch, holiday). Every recipe links back to the hero SKU product page with the SKU embedded in an inline card. The hub earns internal linking value from ingredient comparison guides and the sourcing story pages, which feeds recipe ranking on Google. According to Google Search Central recipe structured data guidance, complete Recipe schema markup is required for eligibility in the recipe carousel and the ingredient search filter.
Pillar structure for food brand content marketing
The pillar structure on content marketing for food brands runs 4 content pillars concurrently: recipe hub (40 to 100 recipes), ingredient comparison guides (12 to 24 guides), sourcing story pages (6 to 12 pages), and buyer intent content (where to buy, subscription vs. one-time, gift bundle guides). Every pillar covers a distinct search intent and every pillar links back to the hero SKU product pages.
Ingredient comparison guide format
Ingredient comparison guides run 1,800 to 3,200 words comparing 2 to 4 ingredient types on 6 to 10 attributes with a comparison table, real-world use case examples, and links to the hero SKU that uses the specific ingredient. Example: organic vs. conventional oats compares nutritional profile, sourcing chain, cost, environmental impact, and taste on a 6-column table. The brand’s SKU appears in the winning column with a product card. These guides rank 3 to 8 months after publication and pull steady-state organic traffic.
Sourcing story pages that build trust
Sourcing story pages name the specific farms, cooperatives, or suppliers the brand sources from, with photos of the farms, farmer quotes, and specific harvest windows. A coffee brand’s Ethiopian farm page ranks for “single-origin Ethiopian coffee” and “Yirgacheffe coffee origin” plus 40 long-tail variations. The sourcing page pulls trust-building traffic that converts at 4 to 6 percent because the shopper landed pattern-matching on transparency and named provenance. Every sourcing page includes farmer or cooperative quotes, harvest dates, and a link back to 3 to 5 hero SKU pages that source from the named supplier.
Vejrø hospitality content case study
Vejrø Resort, a Danish private-island destination with an on-site restaurant focused on organic, locally sourced cuisine, joined us with strong social engagement and no organic-search real estate. Guests found the resort on Instagram but never in Google search for terms like “private island resort Denmark,” “farm-to-table hospitality Denmark,” or “Vejrø restaurant.” The same organic-search gap shows up on DTC food brands running paid social at 20,000 dollars monthly with a broken blog and zero recipe schema.
We built the conversion-focused website with on-site and off-site SEO tuned to the travel-niche keyword clusters, competitor analysis against comparable boutique resorts, and mobile-first design prioritizing guest discovery. Every page carried the structured data qualifying it for Google’s rich results in the hospitality category. Every internal link pushed authority toward the direct-booking conversion path.
Three months later, Vejrø hit 10,000 plus organic visitors, ranked for 200 plus first-page keywords, and pulled a 2.2 percent booking conversion rate from organic traffic. The same pattern applies to content marketing for food brands: recipe schema, ingredient comparison guides, and sourcing story pages pull organic traffic at 20 to 40 percent conversion into hero SKU pages inside 6 months when the content quality matches search intent and every page carries the right structured data markup. Vejrø also proved out the reporting discipline: every monthly report named the exact page, the exact keyword cluster, and the exact search feature (rich result, sitelinks, image pack) driving the incremental organic revenue instead of hiding behind aggregate traffic charts.
Recipe cadence and content calendar for food brands
Recipe cadence on a working food brand content calendar ships 2 to 4 new recipes per week during the first 6 months and drops to 1 per week at maturity. Each recipe takes 4 to 6 hours to produce (write, test in the kitchen, photograph, schema author, publish). At 3 recipes per week, the brand hits 78 recipes inside 6 months plus a backlog of ingredient comparison and sourcing content queued behind the recipe production line.
| Content pillar | Target volume year 1 | Production cost per piece | Refresh cadence |
|---|---|---|---|
| Recipe hub | 40 to 100 recipes | $180 to $320 | Every 12 months |
| Ingredient comparison guides | 12 to 24 guides | $450 to $780 | Every 18 months |
| Sourcing story pages | 6 to 12 pages | $680 to $1,200 | Every 24 months |
| Buyer intent content | 8 to 16 pieces | $220 to $420 | Every 12 months |
Photography as a content calendar constraint
Photography is the actual constraint on recipe cadence, not writing. Every recipe needs 6 to 12 photos: hero shot, ingredient flat lay, prep in progress, plated result, storage, and step shots for the schema markup. A working food brand batches photography 8 recipes at a time to keep the cost per recipe under 200 dollars. Skip the batching and the per-recipe cost climbs to 400 to 600 dollars, which caps recipe cadence at 1 per week and slows organic ranking timeline by 6 months.
Seasonal content calendar planning
Seasonal content calendar planning maps recipes and comparison guides to the seasonal windows they need to rank in. A Christmas cookie recipe needs to publish in September to rank by early December. A Valentine’s chocolate guide needs to publish in November to rank by early February. A back-to-school lunchbox recipe needs to publish in June to rank by late August. The 60-to-90-day ranking curve dictates the calendar.
Creator syndication inside food brand content
Creator syndication on food brand content marketing amplifies the recipe hub through Instagram Reels, TikTok, and YouTube Shorts creators paid to post their own version of the brand’s hero recipes. The creator content pulls net-new audiences into the recipe hub through the creator’s Link in Bio or Amazon Storefront tag. The syndication calendar names 12 to 30 creators per quarter with specific recipes assigned to each.
One brand we picked up had a spreadsheet titled “creator outreach 2023” with 47 rows and 3 responses. All 3 responses were auto-replies. The spreadsheet named zero recipes and offered flat rates below 100 dollars per post. Nobody posts a 30-second video for 87 dollars flat. Nobody.
Creator content commercial terms that work
Working creator content commercial terms run 350 to 1,500 dollars flat per post plus a 12 to 25 percent commission on tagged sales across a 30-day window. The commission mechanic pulls creators into follow-up posts because the incremental revenue continues past the initial fee. Mid-tier creators (30k to 150k followers) hit the sweet spot for food brand content because their engagement rate typically runs 4 to 8 percent versus 0.8 to 1.6 percent on mega-creators.
Content brief structure for creator partnerships
The content brief structure for creator partnerships runs a single page: the SKU, the specific recipe or usage occasion, 3 required brand mentions, 3 restricted claims (no health claims on non-medical SKUs), the pricing angle, the affiliate link, and 3 example videos that hit the tone. The brief avoids over-scripting because over-scripted creator content underperforms native creator voice by 40 to 60 percent on engagement rate.
Buyer intent content for food brand blogs
Buyer intent content on food brand blogs covers 8 to 16 pieces targeting explicit purchase-decision queries: “where to buy [brand],” “[brand] subscription vs. one-time,” “best [category] for [use case],” and “[brand] gift bundle.” Every buyer intent piece runs 1,400 to 2,400 words with a comparison table, product cards, and a clear conversion path to the specific SKU that matches the query intent. Buyer intent content converts at 3 to 6 percent versus 1 to 2 percent on recipe content because the shopper landed already planning to buy, not exploring a usage occasion.
Where-to-buy content structure
Where-to-buy content structure covers online (DTC storefront, Amazon, Target.com, Whole Foods online), retail (specific chain locators with the store finder embedded), and international (customs limitations, retailer partners abroad). Every piece names specific retailers, links to the store locator, and includes an FAQ block covering shipping availability, subscription options, and gift card compatibility. Where-to-buy content ranks for branded discovery queries the DTC storefront otherwise loses to competitor affiliate reviews.
Subscription versus one-time comparison content
Subscription versus one-time comparison content converts subscription commitments at 3 to 6 percent because it addresses the price-sensitivity concern head-on with a specific math table. The piece covers the discount structure (15 percent lifetime), the skip-a-month mechanic, the pause-anytime rule, the cancellation policy, and the specific yearly savings for the brand’s average consumption cadence. Cross-reference the retention structure on our food and beverage marketing retainer page.
Content refresh cadence on food brand pillars
Content refresh cadence on food brand content pillars runs a rolling audit every 12 to 24 months by pillar. Recipes get refreshed every 12 months with new photography, updated schema, and any nutrition or ingredient adjustments. Ingredient comparison guides refresh every 18 months to update market data. Sourcing story pages refresh every 24 months to reflect farm partnership changes and new harvest angles. Buyer intent content refreshes every 12 months to update retailer availability and pricing.
Recipe refresh priority order
Recipe refresh priority runs by organic traffic rank. The top 20 recipes by monthly organic sessions get refreshed first (new photography, schema audit, related recipe internal links, updated nutrition). The next 40 get refreshed at 15 months. The remaining recipes get refreshed opportunistically when the ranking slips past position 15 in Google. Skipping the refresh cadence lets recipe rankings drift out of the top 3 inside 18 months as newer competitor recipes take the position.
Schema audit checklist per refresh
The schema audit checklist per refresh runs 8 items: Recipe schema completeness, aggregateRating count and accuracy, nutrition data accuracy, prepTime and cookTime match the recipe body, image URLs valid at CDN, related recipe internal links working, product card SKU URL live, and Google Search Console rich result eligibility validated. This checklist takes 20 minutes per recipe and prevents the schema drift that costs recipe rankings 20 to 40 positions quietly.
Reporting cadence for food brand content marketing
Reporting cadence on food brand content marketing runs a monthly executive report plus a quarterly business review. The monthly report ships in the first business week and covers organic sessions by pillar, top 10 ranking recipes with position trend, ingredient guide ranking movements, sourcing page performance, and organic-attributed DTC revenue. Every number carries a comparison to the prior month and a plain-language interpretation the founder reads in 7 minutes.
Metrics that matter for content marketing
Metrics that matter for food brand content marketing: organic sessions by pillar, recipe rich result impressions in Search Console, organic conversion rate to hero SKU pages, organic-attributed DTC revenue, and top 20 ranking positions by monthly organic sessions. Vanity metrics that do not matter: total pageviews without conversion context, average time on page without conversion attribution, and social share counts. The monthly report skips the vanity block entirely.
Quarterly business review structure
The quarterly business review runs 90 minutes with the founder, head of content, and SEO lead. Agenda: organic traffic trend by pillar, top 10 winning content pieces, top 10 losing content pieces (candidates for refresh or removal), competitive gap analysis against 5 named competitor brands, and next quarter’s content calendar with recipes and ingredient guides queued. According to Ahrefs content marketing research, brands running quarterly content audits outperform brands running annual audits by 40 to 70 percent on organic revenue over a 24-month window.
Internal linking discipline across food brand content
Internal linking discipline across food brand content moves authority from recipe pages toward hero SKU product pages and comparison guides. Every recipe links to the hero SKU it uses inline (once in the ingredient list, once in a bottom call-out card). Every ingredient comparison guide links to 3 to 6 recipes using the winning ingredient plus the hero SKU product page. Every sourcing story links to the 2 to 4 SKUs sourced from that specific farm or cooperative.
Anchor text strategy across recipe hubs
Anchor text on internal links varies across recipe hubs to avoid over-optimization patterns Google penalizes. Exact-match anchor (“single-origin Ethiopian coffee”) runs on 20 to 30 percent of internal links. Partial-match variations (“our Ethiopian roast”) run on 30 to 40 percent. Branded anchors (the SKU name) run on 20 to 30 percent. Generic anchors (“shop the coffee”) fill the remaining 10 to 20 percent. This ratio holds ranking without triggering the over-optimization penalty that shows up on brands that anchor-text-stuff every internal link with the same exact-match keyword. Cross-reference the linking layer on our food and beverage web design page.
Link equity from ingredient guides to SKU pages
Link equity from ingredient guides passes to SKU pages when the guide’s comparison table names the hero SKU in the winning column with a product card, and when the guide’s body links to 3 to 6 recipes that use the winning ingredient. This 3-hop path (guide to recipe to SKU) pushes authority from a high-traffic informational query down to a high-intent transactional page. According to Search Engine Land SEO coverage, informational content that internally links to transactional pages produces 2 to 4 times higher organic revenue than isolated content silos.
Wrapping up content marketing for food brands
Content marketing for food brands is the organic engine that turns a DTC snack, drink, or CPG storefront into a search-driven revenue channel. Recipe hub of 40 to 100 recipes. Ingredient comparison guides at 12 to 24 pieces. Sourcing story pages at 6 to 12 pieces. Buyer intent content at 8 to 16 pieces. Creator syndication calendar with 12 to 30 creators per quarter. Refresh cadence at 12 to 24 months by pillar. Reporting with organic sessions and organic revenue attribution.
If your DTC food brand is running paid social at 20,000 dollars monthly with a broken blog and zero recipe schema, professional content marketing for food brands pays for itself inside the first 90 days on organic traffic captured. Redefine Web ships content marketing inside our monthly retainer packages. Book a call and we will walk through the last three DTC food brands we built recipe hubs for, pillar by pillar.
Content marketing for food brands starts with a recipe hub because recipe queries account for 40 to 60 percent of high-intent search volume in the food category. Every hero SKU needs 4 to 12 recipes anchored to it, each targeting a specific occasion and audience.
Skip the recipe hub and the brand loses the search real estate that pulls DTC storefront traffic month over month at zero incremental paid cost. Recipe traffic converts at 2 to 4 percent because the shopper landed with usage intent, not passive discovery, which is why food brands win on recipes.
Recipe schema and Google rich result eligibility
Every recipe page ships schema.org Recipe markup including cookTime, prepTime, recipeIngredient, recipeInstructions, nutrition, and aggregateRating. Correctly marked-up recipes qualify for Google’s recipe rich result carousel that pulls 3 to 6 times higher click-through rate than a plain blue link. The schema layer takes 15 minutes per recipe to author and 30 minutes to validate in Google Search Console. Cross-reference the recipe search stack on our food and beverage SEO page.
Recipe hub structure that scales
The recipe hub structure runs 40 to 100 recipes at maturity, organized by hero SKU (4 to 12 recipes per SKU) plus occasion tags (breakfast, weeknight dinner, meal prep, brunch, holiday). Every recipe links back to the hero SKU product page with the SKU embedded in an inline card. The hub earns internal linking value from ingredient comparison guides and the sourcing story pages, which feeds recipe ranking on Google. According to Google Search Central recipe structured data guidance, complete Recipe schema markup is required for eligibility in the recipe carousel and the ingredient search filter.
Pillar structure for food brand content marketing
The pillar structure on content marketing for food brands runs 4 content pillars concurrently: recipe hub (40 to 100 recipes), ingredient comparison guides (12 to 24 guides), sourcing story pages (6 to 12 pages), and buyer intent content (where to buy, subscription vs. one-time, gift bundle guides). Every pillar covers a distinct search intent and every pillar links back to the hero SKU product pages.
Ingredient comparison guide format
Ingredient comparison guides run 1,800 to 3,200 words comparing 2 to 4 ingredient types on 6 to 10 attributes with a comparison table, real-world use case examples, and links to the hero SKU that uses the specific ingredient. Example: organic vs. conventional oats compares nutritional profile, sourcing chain, cost, environmental impact, and taste on a 6-column table. The brand’s SKU appears in the winning column with a product card. These guides rank 3 to 8 months after publication and pull steady-state organic traffic.
Sourcing story pages that build trust
Sourcing story pages name the specific farms, cooperatives, or suppliers the brand sources from, with photos of the farms, farmer quotes, and specific harvest windows. A coffee brand’s Ethiopian farm page ranks for “single-origin Ethiopian coffee” and “Yirgacheffe coffee origin” plus 40 long-tail variations. The sourcing page pulls trust-building traffic that converts at 4 to 6 percent because the shopper landed pattern-matching on transparency and named provenance. Every sourcing page includes farmer or cooperative quotes, harvest dates, and a link back to 3 to 5 hero SKU pages that source from the named supplier.
Vejrø hospitality content case study
Vejrø Resort, a Danish private-island destination with an on-site restaurant focused on organic, locally sourced cuisine, joined us with strong social engagement and no organic-search real estate. Guests found the resort on Instagram but never in Google search for terms like “private island resort Denmark,” “farm-to-table hospitality Denmark,” or “Vejrø restaurant.” The same organic-search gap shows up on DTC food brands running paid social at 20,000 dollars monthly with a broken blog and zero recipe schema.
We built the conversion-focused website with on-site and off-site SEO tuned to the travel-niche keyword clusters, competitor analysis against comparable boutique resorts, and mobile-first design prioritizing guest discovery. Every page carried the structured data qualifying it for Google’s rich results in the hospitality category. Every internal link pushed authority toward the direct-booking conversion path.
Three months later, Vejrø hit 10,000 plus organic visitors, ranked for 200 plus first-page keywords, and pulled a 2.2 percent booking conversion rate from organic traffic. The same pattern applies to content marketing for food brands: recipe schema, ingredient comparison guides, and sourcing story pages pull organic traffic at 20 to 40 percent conversion into hero SKU pages inside 6 months when the content quality matches search intent and every page carries the right structured data markup. Vejrø also proved out the reporting discipline: every monthly report named the exact page, the exact keyword cluster, and the exact search feature (rich result, sitelinks, image pack) driving the incremental organic revenue instead of hiding behind aggregate traffic charts.
Recipe cadence and content calendar for food brands
Recipe cadence on a working food brand content calendar ships 2 to 4 new recipes per week during the first 6 months and drops to 1 per week at maturity. Each recipe takes 4 to 6 hours to produce (write, test in the kitchen, photograph, schema author, publish). At 3 recipes per week, the brand hits 78 recipes inside 6 months plus a backlog of ingredient comparison and sourcing content queued behind the recipe production line.
| Content pillar | Target volume year 1 | Production cost per piece | Refresh cadence |
|---|---|---|---|
| Recipe hub | 40 to 100 recipes | $180 to $320 | Every 12 months |
| Ingredient comparison guides | 12 to 24 guides | $450 to $780 | Every 18 months |
| Sourcing story pages | 6 to 12 pages | $680 to $1,200 | Every 24 months |
| Buyer intent content | 8 to 16 pieces | $220 to $420 | Every 12 months |
Photography as a content calendar constraint
Photography is the actual constraint on recipe cadence, not writing. Every recipe needs 6 to 12 photos: hero shot, ingredient flat lay, prep in progress, plated result, storage, and step shots for the schema markup. A working food brand batches photography 8 recipes at a time to keep the cost per recipe under 200 dollars. Skip the batching and the per-recipe cost climbs to 400 to 600 dollars, which caps recipe cadence at 1 per week and slows organic ranking timeline by 6 months.
Seasonal content calendar planning
Seasonal content calendar planning maps recipes and comparison guides to the seasonal windows they need to rank in. A Christmas cookie recipe needs to publish in September to rank by early December. A Valentine’s chocolate guide needs to publish in November to rank by early February. A back-to-school lunchbox recipe needs to publish in June to rank by late August. The 60-to-90-day ranking curve dictates the calendar.
Creator syndication inside food brand content
Creator syndication on food brand content marketing amplifies the recipe hub through Instagram Reels, TikTok, and YouTube Shorts creators paid to post their own version of the brand’s hero recipes. The creator content pulls net-new audiences into the recipe hub through the creator’s Link in Bio or Amazon Storefront tag. The syndication calendar names 12 to 30 creators per quarter with specific recipes assigned to each.
One brand we picked up had a spreadsheet titled “creator outreach 2023” with 47 rows and 3 responses. All 3 responses were auto-replies. The spreadsheet named zero recipes and offered flat rates below 100 dollars per post. Nobody posts a 30-second video for 87 dollars flat. Nobody.
Creator content commercial terms that work
Working creator content commercial terms run 350 to 1,500 dollars flat per post plus a 12 to 25 percent commission on tagged sales across a 30-day window. The commission mechanic pulls creators into follow-up posts because the incremental revenue continues past the initial fee. Mid-tier creators (30k to 150k followers) hit the sweet spot for food brand content because their engagement rate typically runs 4 to 8 percent versus 0.8 to 1.6 percent on mega-creators.
Content brief structure for creator partnerships
The content brief structure for creator partnerships runs a single page: the SKU, the specific recipe or usage occasion, 3 required brand mentions, 3 restricted claims (no health claims on non-medical SKUs), the pricing angle, the affiliate link, and 3 example videos that hit the tone. The brief avoids over-scripting because over-scripted creator content underperforms native creator voice by 40 to 60 percent on engagement rate.
Buyer intent content for food brand blogs
Buyer intent content on food brand blogs covers 8 to 16 pieces targeting explicit purchase-decision queries: “where to buy [brand],” “[brand] subscription vs. one-time,” “best [category] for [use case],” and “[brand] gift bundle.” Every buyer intent piece runs 1,400 to 2,400 words with a comparison table, product cards, and a clear conversion path to the specific SKU that matches the query intent. Buyer intent content converts at 3 to 6 percent versus 1 to 2 percent on recipe content because the shopper landed already planning to buy, not exploring a usage occasion.
Where-to-buy content structure
Where-to-buy content structure covers online (DTC storefront, Amazon, Target.com, Whole Foods online), retail (specific chain locators with the store finder embedded), and international (customs limitations, retailer partners abroad). Every piece names specific retailers, links to the store locator, and includes an FAQ block covering shipping availability, subscription options, and gift card compatibility. Where-to-buy content ranks for branded discovery queries the DTC storefront otherwise loses to competitor affiliate reviews.
Subscription versus one-time comparison content
Subscription versus one-time comparison content converts subscription commitments at 3 to 6 percent because it addresses the price-sensitivity concern head-on with a specific math table. The piece covers the discount structure (15 percent lifetime), the skip-a-month mechanic, the pause-anytime rule, the cancellation policy, and the specific yearly savings for the brand’s average consumption cadence. Cross-reference the retention structure on our food and beverage marketing retainer page.
Content refresh cadence on food brand pillars
Content refresh cadence on food brand content pillars runs a rolling audit every 12 to 24 months by pillar. Recipes get refreshed every 12 months with new photography, updated schema, and any nutrition or ingredient adjustments. Ingredient comparison guides refresh every 18 months to update market data. Sourcing story pages refresh every 24 months to reflect farm partnership changes and new harvest angles. Buyer intent content refreshes every 12 months to update retailer availability and pricing.
Recipe refresh priority order
Recipe refresh priority runs by organic traffic rank. The top 20 recipes by monthly organic sessions get refreshed first (new photography, schema audit, related recipe internal links, updated nutrition). The next 40 get refreshed at 15 months. The remaining recipes get refreshed opportunistically when the ranking slips past position 15 in Google. Skipping the refresh cadence lets recipe rankings drift out of the top 3 inside 18 months as newer competitor recipes take the position.
Schema audit checklist per refresh
The schema audit checklist per refresh runs 8 items: Recipe schema completeness, aggregateRating count and accuracy, nutrition data accuracy, prepTime and cookTime match the recipe body, image URLs valid at CDN, related recipe internal links working, product card SKU URL live, and Google Search Console rich result eligibility validated. This checklist takes 20 minutes per recipe and prevents the schema drift that costs recipe rankings 20 to 40 positions quietly.
Reporting cadence for food brand content marketing
Reporting cadence on food brand content marketing runs a monthly executive report plus a quarterly business review. The monthly report ships in the first business week and covers organic sessions by pillar, top 10 ranking recipes with position trend, ingredient guide ranking movements, sourcing page performance, and organic-attributed DTC revenue. Every number carries a comparison to the prior month and a plain-language interpretation the founder reads in 7 minutes.
Metrics that matter for content marketing
Metrics that matter for food brand content marketing: organic sessions by pillar, recipe rich result impressions in Search Console, organic conversion rate to hero SKU pages, organic-attributed DTC revenue, and top 20 ranking positions by monthly organic sessions. Vanity metrics that do not matter: total pageviews without conversion context, average time on page without conversion attribution, and social share counts. The monthly report skips the vanity block entirely.
Quarterly business review structure
The quarterly business review runs 90 minutes with the founder, head of content, and SEO lead. Agenda: organic traffic trend by pillar, top 10 winning content pieces, top 10 losing content pieces (candidates for refresh or removal), competitive gap analysis against 5 named competitor brands, and next quarter’s content calendar with recipes and ingredient guides queued. According to Ahrefs content marketing research, brands running quarterly content audits outperform brands running annual audits by 40 to 70 percent on organic revenue over a 24-month window.
Internal linking discipline across food brand content
Internal linking discipline across food brand content moves authority from recipe pages toward hero SKU product pages and comparison guides. Every recipe links to the hero SKU it uses inline (once in the ingredient list, once in a bottom call-out card). Every ingredient comparison guide links to 3 to 6 recipes using the winning ingredient plus the hero SKU product page. Every sourcing story links to the 2 to 4 SKUs sourced from that specific farm or cooperative.
Anchor text strategy across recipe hubs
Anchor text on internal links varies across recipe hubs to avoid over-optimization patterns Google penalizes. Exact-match anchor (“single-origin Ethiopian coffee”) runs on 20 to 30 percent of internal links. Partial-match variations (“our Ethiopian roast”) run on 30 to 40 percent. Branded anchors (the SKU name) run on 20 to 30 percent. Generic anchors (“shop the coffee”) fill the remaining 10 to 20 percent. This ratio holds ranking without triggering the over-optimization penalty that shows up on brands that anchor-text-stuff every internal link with the same exact-match keyword. Cross-reference the linking layer on our food and beverage web design page.
Link equity from ingredient guides to SKU pages
Link equity from ingredient guides passes to SKU pages when the guide’s comparison table names the hero SKU in the winning column with a product card, and when the guide’s body links to 3 to 6 recipes that use the winning ingredient. This 3-hop path (guide to recipe to SKU) pushes authority from a high-traffic informational query down to a high-intent transactional page. According to Search Engine Land SEO coverage, informational content that internally links to transactional pages produces 2 to 4 times higher organic revenue than isolated content silos.
Wrapping up content marketing for food brands
Content marketing for food brands is the organic engine that turns a DTC snack, drink, or CPG storefront into a search-driven revenue channel. Recipe hub of 40 to 100 recipes. Ingredient comparison guides at 12 to 24 pieces. Sourcing story pages at 6 to 12 pieces. Buyer intent content at 8 to 16 pieces. Creator syndication calendar with 12 to 30 creators per quarter. Refresh cadence at 12 to 24 months by pillar. Reporting with organic sessions and organic revenue attribution.
If your DTC food brand is running paid social at 20,000 dollars monthly with a broken blog and zero recipe schema, professional content marketing for food brands pays for itself inside the first 90 days on organic traffic captured. Redefine Web ships content marketing inside our monthly retainer packages. Book a call and we will walk through the last three DTC food brands we built recipe hubs for, pillar by pillar.
Content marketing for food brands starts with a recipe hub because recipe queries account for 40 to 60 percent of high-intent search volume in the food category. Every hero SKU needs 4 to 12 recipes anchored to it, each targeting a specific occasion and audience.
Skip the recipe hub and the brand loses the search real estate that pulls DTC storefront traffic month over month at zero incremental paid cost. Recipe traffic converts at 2 to 4 percent because the shopper landed with usage intent, not passive discovery, which is why food brands win on recipes.
Recipe schema and Google rich result eligibility
Every recipe page ships schema.org Recipe markup including cookTime, prepTime, recipeIngredient, recipeInstructions, nutrition, and aggregateRating. Correctly marked-up recipes qualify for Google’s recipe rich result carousel that pulls 3 to 6 times higher click-through rate than a plain blue link. The schema layer takes 15 minutes per recipe to author and 30 minutes to validate in Google Search Console. Cross-reference the recipe search stack on our food and beverage SEO page.
Recipe hub structure that scales
The recipe hub structure runs 40 to 100 recipes at maturity, organized by hero SKU (4 to 12 recipes per SKU) plus occasion tags (breakfast, weeknight dinner, meal prep, brunch, holiday). Every recipe links back to the hero SKU product page with the SKU embedded in an inline card. The hub earns internal linking value from ingredient comparison guides and the sourcing story pages, which feeds recipe ranking on Google. According to Google Search Central recipe structured data guidance, complete Recipe schema markup is required for eligibility in the recipe carousel and the ingredient search filter.
Pillar structure for food brand content marketing
The pillar structure on content marketing for food brands runs 4 content pillars concurrently: recipe hub (40 to 100 recipes), ingredient comparison guides (12 to 24 guides), sourcing story pages (6 to 12 pages), and buyer intent content (where to buy, subscription vs. one-time, gift bundle guides). Every pillar covers a distinct search intent and every pillar links back to the hero SKU product pages.
Ingredient comparison guide format
Ingredient comparison guides run 1,800 to 3,200 words comparing 2 to 4 ingredient types on 6 to 10 attributes with a comparison table, real-world use case examples, and links to the hero SKU that uses the specific ingredient. Example: organic vs. conventional oats compares nutritional profile, sourcing chain, cost, environmental impact, and taste on a 6-column table. The brand’s SKU appears in the winning column with a product card. These guides rank 3 to 8 months after publication and pull steady-state organic traffic.
Sourcing story pages that build trust
Sourcing story pages name the specific farms, cooperatives, or suppliers the brand sources from, with photos of the farms, farmer quotes, and specific harvest windows. A coffee brand’s Ethiopian farm page ranks for “single-origin Ethiopian coffee” and “Yirgacheffe coffee origin” plus 40 long-tail variations. The sourcing page pulls trust-building traffic that converts at 4 to 6 percent because the shopper landed pattern-matching on transparency and named provenance. Every sourcing page includes farmer or cooperative quotes, harvest dates, and a link back to 3 to 5 hero SKU pages that source from the named supplier.
Vejrø hospitality content case study
Vejrø Resort, a Danish private-island destination with an on-site restaurant focused on organic, locally sourced cuisine, joined us with strong social engagement and no organic-search real estate. Guests found the resort on Instagram but never in Google search for terms like “private island resort Denmark,” “farm-to-table hospitality Denmark,” or “Vejrø restaurant.” The same organic-search gap shows up on DTC food brands running paid social at 20,000 dollars monthly with a broken blog and zero recipe schema.
We built the conversion-focused website with on-site and off-site SEO tuned to the travel-niche keyword clusters, competitor analysis against comparable boutique resorts, and mobile-first design prioritizing guest discovery. Every page carried the structured data qualifying it for Google’s rich results in the hospitality category. Every internal link pushed authority toward the direct-booking conversion path.
Three months later, Vejrø hit 10,000 plus organic visitors, ranked for 200 plus first-page keywords, and pulled a 2.2 percent booking conversion rate from organic traffic. The same pattern applies to content marketing for food brands: recipe schema, ingredient comparison guides, and sourcing story pages pull organic traffic at 20 to 40 percent conversion into hero SKU pages inside 6 months when the content quality matches search intent and every page carries the right structured data markup. Vejrø also proved out the reporting discipline: every monthly report named the exact page, the exact keyword cluster, and the exact search feature (rich result, sitelinks, image pack) driving the incremental organic revenue instead of hiding behind aggregate traffic charts.
Recipe cadence and content calendar for food brands
Recipe cadence on a working food brand content calendar ships 2 to 4 new recipes per week during the first 6 months and drops to 1 per week at maturity. Each recipe takes 4 to 6 hours to produce (write, test in the kitchen, photograph, schema author, publish). At 3 recipes per week, the brand hits 78 recipes inside 6 months plus a backlog of ingredient comparison and sourcing content queued behind the recipe production line.
| Content pillar | Target volume year 1 | Production cost per piece | Refresh cadence |
|---|---|---|---|
| Recipe hub | 40 to 100 recipes | $180 to $320 | Every 12 months |
| Ingredient comparison guides | 12 to 24 guides | $450 to $780 | Every 18 months |
| Sourcing story pages | 6 to 12 pages | $680 to $1,200 | Every 24 months |
| Buyer intent content | 8 to 16 pieces | $220 to $420 | Every 12 months |
Photography as a content calendar constraint
Photography is the actual constraint on recipe cadence, not writing. Every recipe needs 6 to 12 photos: hero shot, ingredient flat lay, prep in progress, plated result, storage, and step shots for the schema markup. A working food brand batches photography 8 recipes at a time to keep the cost per recipe under 200 dollars. Skip the batching and the per-recipe cost climbs to 400 to 600 dollars, which caps recipe cadence at 1 per week and slows organic ranking timeline by 6 months.
Seasonal content calendar planning
Seasonal content calendar planning maps recipes and comparison guides to the seasonal windows they need to rank in. A Christmas cookie recipe needs to publish in September to rank by early December. A Valentine’s chocolate guide needs to publish in November to rank by early February. A back-to-school lunchbox recipe needs to publish in June to rank by late August. The 60-to-90-day ranking curve dictates the calendar.
Creator syndication inside food brand content
Creator syndication on food brand content marketing amplifies the recipe hub through Instagram Reels, TikTok, and YouTube Shorts creators paid to post their own version of the brand’s hero recipes. The creator content pulls net-new audiences into the recipe hub through the creator’s Link in Bio or Amazon Storefront tag. The syndication calendar names 12 to 30 creators per quarter with specific recipes assigned to each.
One brand we picked up had a spreadsheet titled “creator outreach 2023” with 47 rows and 3 responses. All 3 responses were auto-replies. The spreadsheet named zero recipes and offered flat rates below 100 dollars per post. Nobody posts a 30-second video for 87 dollars flat. Nobody.
Creator content commercial terms that work
Working creator content commercial terms run 350 to 1,500 dollars flat per post plus a 12 to 25 percent commission on tagged sales across a 30-day window. The commission mechanic pulls creators into follow-up posts because the incremental revenue continues past the initial fee. Mid-tier creators (30k to 150k followers) hit the sweet spot for food brand content because their engagement rate typically runs 4 to 8 percent versus 0.8 to 1.6 percent on mega-creators.
Content brief structure for creator partnerships
The content brief structure for creator partnerships runs a single page: the SKU, the specific recipe or usage occasion, 3 required brand mentions, 3 restricted claims (no health claims on non-medical SKUs), the pricing angle, the affiliate link, and 3 example videos that hit the tone. The brief avoids over-scripting because over-scripted creator content underperforms native creator voice by 40 to 60 percent on engagement rate.
Buyer intent content for food brand blogs
Buyer intent content on food brand blogs covers 8 to 16 pieces targeting explicit purchase-decision queries: “where to buy [brand],” “[brand] subscription vs. one-time,” “best [category] for [use case],” and “[brand] gift bundle.” Every buyer intent piece runs 1,400 to 2,400 words with a comparison table, product cards, and a clear conversion path to the specific SKU that matches the query intent. Buyer intent content converts at 3 to 6 percent versus 1 to 2 percent on recipe content because the shopper landed already planning to buy, not exploring a usage occasion.
Where-to-buy content structure
Where-to-buy content structure covers online (DTC storefront, Amazon, Target.com, Whole Foods online), retail (specific chain locators with the store finder embedded), and international (customs limitations, retailer partners abroad). Every piece names specific retailers, links to the store locator, and includes an FAQ block covering shipping availability, subscription options, and gift card compatibility. Where-to-buy content ranks for branded discovery queries the DTC storefront otherwise loses to competitor affiliate reviews.
Subscription versus one-time comparison content
Subscription versus one-time comparison content converts subscription commitments at 3 to 6 percent because it addresses the price-sensitivity concern head-on with a specific math table. The piece covers the discount structure (15 percent lifetime), the skip-a-month mechanic, the pause-anytime rule, the cancellation policy, and the specific yearly savings for the brand’s average consumption cadence. Cross-reference the retention structure on our food and beverage marketing retainer page.
Content refresh cadence on food brand pillars
Content refresh cadence on food brand content pillars runs a rolling audit every 12 to 24 months by pillar. Recipes get refreshed every 12 months with new photography, updated schema, and any nutrition or ingredient adjustments. Ingredient comparison guides refresh every 18 months to update market data. Sourcing story pages refresh every 24 months to reflect farm partnership changes and new harvest angles. Buyer intent content refreshes every 12 months to update retailer availability and pricing.
Recipe refresh priority order
Recipe refresh priority runs by organic traffic rank. The top 20 recipes by monthly organic sessions get refreshed first (new photography, schema audit, related recipe internal links, updated nutrition). The next 40 get refreshed at 15 months. The remaining recipes get refreshed opportunistically when the ranking slips past position 15 in Google. Skipping the refresh cadence lets recipe rankings drift out of the top 3 inside 18 months as newer competitor recipes take the position.
Schema audit checklist per refresh
The schema audit checklist per refresh runs 8 items: Recipe schema completeness, aggregateRating count and accuracy, nutrition data accuracy, prepTime and cookTime match the recipe body, image URLs valid at CDN, related recipe internal links working, product card SKU URL live, and Google Search Console rich result eligibility validated. This checklist takes 20 minutes per recipe and prevents the schema drift that costs recipe rankings 20 to 40 positions quietly.
Reporting cadence for food brand content marketing
Reporting cadence on food brand content marketing runs a monthly executive report plus a quarterly business review. The monthly report ships in the first business week and covers organic sessions by pillar, top 10 ranking recipes with position trend, ingredient guide ranking movements, sourcing page performance, and organic-attributed DTC revenue. Every number carries a comparison to the prior month and a plain-language interpretation the founder reads in 7 minutes.
Metrics that matter for content marketing
Metrics that matter for food brand content marketing: organic sessions by pillar, recipe rich result impressions in Search Console, organic conversion rate to hero SKU pages, organic-attributed DTC revenue, and top 20 ranking positions by monthly organic sessions. Vanity metrics that do not matter: total pageviews without conversion context, average time on page without conversion attribution, and social share counts. The monthly report skips the vanity block entirely.
Quarterly business review structure
The quarterly business review runs 90 minutes with the founder, head of content, and SEO lead. Agenda: organic traffic trend by pillar, top 10 winning content pieces, top 10 losing content pieces (candidates for refresh or removal), competitive gap analysis against 5 named competitor brands, and next quarter’s content calendar with recipes and ingredient guides queued. According to Ahrefs content marketing research, brands running quarterly content audits outperform brands running annual audits by 40 to 70 percent on organic revenue over a 24-month window.
Internal linking discipline across food brand content
Internal linking discipline across food brand content moves authority from recipe pages toward hero SKU product pages and comparison guides. Every recipe links to the hero SKU it uses inline (once in the ingredient list, once in a bottom call-out card). Every ingredient comparison guide links to 3 to 6 recipes using the winning ingredient plus the hero SKU product page. Every sourcing story links to the 2 to 4 SKUs sourced from that specific farm or cooperative.
Anchor text strategy across recipe hubs
Anchor text on internal links varies across recipe hubs to avoid over-optimization patterns Google penalizes. Exact-match anchor (“single-origin Ethiopian coffee”) runs on 20 to 30 percent of internal links. Partial-match variations (“our Ethiopian roast”) run on 30 to 40 percent. Branded anchors (the SKU name) run on 20 to 30 percent. Generic anchors (“shop the coffee”) fill the remaining 10 to 20 percent. This ratio holds ranking without triggering the over-optimization penalty that shows up on brands that anchor-text-stuff every internal link with the same exact-match keyword. Cross-reference the linking layer on our food and beverage web design page.
Link equity from ingredient guides to SKU pages
Link equity from ingredient guides passes to SKU pages when the guide’s comparison table names the hero SKU in the winning column with a product card, and when the guide’s body links to 3 to 6 recipes that use the winning ingredient. This 3-hop path (guide to recipe to SKU) pushes authority from a high-traffic informational query down to a high-intent transactional page. According to Search Engine Land SEO coverage, informational content that internally links to transactional pages produces 2 to 4 times higher organic revenue than isolated content silos.
Wrapping up content marketing for food brands
Content marketing for food brands is the organic engine that turns a DTC snack, drink, or CPG storefront into a search-driven revenue channel. Recipe hub of 40 to 100 recipes. Ingredient comparison guides at 12 to 24 pieces. Sourcing story pages at 6 to 12 pieces. Buyer intent content at 8 to 16 pieces. Creator syndication calendar with 12 to 30 creators per quarter. Refresh cadence at 12 to 24 months by pillar. Reporting with organic sessions and organic revenue attribution.
If your DTC food brand is running paid social at 20,000 dollars monthly with a broken blog and zero recipe schema, professional content marketing for food brands pays for itself inside the first 90 days on organic traffic captured. Redefine Web ships content marketing inside our monthly retainer packages. Book a call and we will walk through the last three DTC food brands we built recipe hubs for, pillar by pillar.
Anchor text on internal links varies across recipe hubs to avoid over-optimization patterns Google penalizes. Exact-match anchor (“single-origin Ethiopian coffee”) runs on 20 to 30 percent of internal links. Partial-match variations (“our Ethiopian roast”) run on 30 to 40 percent. Branded anchors (the SKU name) run on 20 to 30 percent. Generic anchors (“shop the coffee”) fill the remaining 10 to 20 percent. This ratio holds ranking without triggering the over-optimization penalty that shows up on brands that anchor-text-stuff every internal link with the same exact-match keyword. Cross-reference the linking layer on our food and beverage web design page.
Link equity from ingredient guides to SKU pages
Link equity from ingredient guides passes to SKU pages when the guide’s comparison table names the hero SKU in the winning column with a product card, and when the guide’s body links to 3 to 6 recipes that use the winning ingredient. This 3-hop path (guide to recipe to SKU) pushes authority from a high-traffic informational query down to a high-intent transactional page. According to Search Engine Land SEO coverage, informational content that internally links to transactional pages produces 2 to 4 times higher organic revenue than isolated content silos.
Wrapping up content marketing for food brands
Content marketing for food brands is the organic engine that turns a DTC snack, drink, or CPG storefront into a search-driven revenue channel. Recipe hub of 40 to 100 recipes. Ingredient comparison guides at 12 to 24 pieces. Sourcing story pages at 6 to 12 pieces. Buyer intent content at 8 to 16 pieces. Creator syndication calendar with 12 to 30 creators per quarter. Refresh cadence at 12 to 24 months by pillar. Reporting with organic sessions and organic revenue attribution.
If your DTC food brand is running paid social at 20,000 dollars monthly with a broken blog and zero recipe schema, professional content marketing for food brands pays for itself inside the first 90 days on organic traffic captured. Redefine Web ships content marketing inside our monthly retainer packages. Book a call and we will walk through the last three DTC food brands we built recipe hubs for, pillar by pillar.
Internal linking discipline across food brand content moves authority from recipe pages toward hero SKU product pages and comparison guides. Every recipe links to the hero SKU it uses inline (once in the ingredient list, once in a bottom call-out card). Every ingredient comparison guide links to 3 to 6 recipes using the winning ingredient plus the hero SKU product page. Every sourcing story links to the 2 to 4 SKUs sourced from that specific farm or cooperative.
Anchor text strategy across recipe hubs
Anchor text on internal links varies across recipe hubs to avoid over-optimization patterns Google penalizes. Exact-match anchor (“single-origin Ethiopian coffee”) runs on 20 to 30 percent of internal links. Partial-match variations (“our Ethiopian roast”) run on 30 to 40 percent. Branded anchors (the SKU name) run on 20 to 30 percent. Generic anchors (“shop the coffee”) fill the remaining 10 to 20 percent. This ratio holds ranking without triggering the over-optimization penalty that shows up on brands that anchor-text-stuff every internal link with the same exact-match keyword. Cross-reference the linking layer on our food and beverage web design page.
Link equity from ingredient guides to SKU pages
Link equity from ingredient guides passes to SKU pages when the guide’s comparison table names the hero SKU in the winning column with a product card, and when the guide’s body links to 3 to 6 recipes that use the winning ingredient. This 3-hop path (guide to recipe to SKU) pushes authority from a high-traffic informational query down to a high-intent transactional page. According to Search Engine Land SEO coverage, informational content that internally links to transactional pages produces 2 to 4 times higher organic revenue than isolated content silos.
Wrapping up content marketing for food brands
Content marketing for food brands is the organic engine that turns a DTC snack, drink, or CPG storefront into a search-driven revenue channel. Recipe hub of 40 to 100 recipes. Ingredient comparison guides at 12 to 24 pieces. Sourcing story pages at 6 to 12 pieces. Buyer intent content at 8 to 16 pieces. Creator syndication calendar with 12 to 30 creators per quarter. Refresh cadence at 12 to 24 months by pillar. Reporting with organic sessions and organic revenue attribution.
If your DTC food brand is running paid social at 20,000 dollars monthly with a broken blog and zero recipe schema, professional content marketing for food brands pays for itself inside the first 90 days on organic traffic captured. Redefine Web ships content marketing inside our monthly retainer packages. Book a call and we will walk through the last three DTC food brands we built recipe hubs for, pillar by pillar.
Content marketing for food brands starts with a recipe hub because recipe queries account for 40 to 60 percent of high-intent search volume in the food category. Every hero SKU needs 4 to 12 recipes anchored to it, each targeting a specific occasion and audience.
Skip the recipe hub and the brand loses the search real estate that pulls DTC storefront traffic month over month at zero incremental paid cost. Recipe traffic converts at 2 to 4 percent because the shopper landed with usage intent, not passive discovery, which is why food brands win on recipes.
Recipe schema and Google rich result eligibility
Every recipe page ships schema.org Recipe markup including cookTime, prepTime, recipeIngredient, recipeInstructions, nutrition, and aggregateRating. Correctly marked-up recipes qualify for Google’s recipe rich result carousel that pulls 3 to 6 times higher click-through rate than a plain blue link. The schema layer takes 15 minutes per recipe to author and 30 minutes to validate in Google Search Console. Cross-reference the recipe search stack on our food and beverage SEO page.
Recipe hub structure that scales
The recipe hub structure runs 40 to 100 recipes at maturity, organized by hero SKU (4 to 12 recipes per SKU) plus occasion tags (breakfast, weeknight dinner, meal prep, brunch, holiday). Every recipe links back to the hero SKU product page with the SKU embedded in an inline card. The hub earns internal linking value from ingredient comparison guides and the sourcing story pages, which feeds recipe ranking on Google. According to Google Search Central recipe structured data guidance, complete Recipe schema markup is required for eligibility in the recipe carousel and the ingredient search filter.
Pillar structure for food brand content marketing
The pillar structure on content marketing for food brands runs 4 content pillars concurrently: recipe hub (40 to 100 recipes), ingredient comparison guides (12 to 24 guides), sourcing story pages (6 to 12 pages), and buyer intent content (where to buy, subscription vs. one-time, gift bundle guides). Every pillar covers a distinct search intent and every pillar links back to the hero SKU product pages.
Ingredient comparison guide format
Ingredient comparison guides run 1,800 to 3,200 words comparing 2 to 4 ingredient types on 6 to 10 attributes with a comparison table, real-world use case examples, and links to the hero SKU that uses the specific ingredient. Example: organic vs. conventional oats compares nutritional profile, sourcing chain, cost, environmental impact, and taste on a 6-column table. The brand’s SKU appears in the winning column with a product card. These guides rank 3 to 8 months after publication and pull steady-state organic traffic.
Sourcing story pages that build trust
Sourcing story pages name the specific farms, cooperatives, or suppliers the brand sources from, with photos of the farms, farmer quotes, and specific harvest windows. A coffee brand’s Ethiopian farm page ranks for “single-origin Ethiopian coffee” and “Yirgacheffe coffee origin” plus 40 long-tail variations. The sourcing page pulls trust-building traffic that converts at 4 to 6 percent because the shopper landed pattern-matching on transparency and named provenance. Every sourcing page includes farmer or cooperative quotes, harvest dates, and a link back to 3 to 5 hero SKU pages that source from the named supplier.
Vejrø hospitality content case study
Vejrø Resort, a Danish private-island destination with an on-site restaurant focused on organic, locally sourced cuisine, joined us with strong social engagement and no organic-search real estate. Guests found the resort on Instagram but never in Google search for terms like “private island resort Denmark,” “farm-to-table hospitality Denmark,” or “Vejrø restaurant.” The same organic-search gap shows up on DTC food brands running paid social at 20,000 dollars monthly with a broken blog and zero recipe schema.
We built the conversion-focused website with on-site and off-site SEO tuned to the travel-niche keyword clusters, competitor analysis against comparable boutique resorts, and mobile-first design prioritizing guest discovery. Every page carried the structured data qualifying it for Google’s rich results in the hospitality category. Every internal link pushed authority toward the direct-booking conversion path.
Three months later, Vejrø hit 10,000 plus organic visitors, ranked for 200 plus first-page keywords, and pulled a 2.2 percent booking conversion rate from organic traffic. The same pattern applies to content marketing for food brands: recipe schema, ingredient comparison guides, and sourcing story pages pull organic traffic at 20 to 40 percent conversion into hero SKU pages inside 6 months when the content quality matches search intent and every page carries the right structured data markup. Vejrø also proved out the reporting discipline: every monthly report named the exact page, the exact keyword cluster, and the exact search feature (rich result, sitelinks, image pack) driving the incremental organic revenue instead of hiding behind aggregate traffic charts.
Recipe cadence and content calendar for food brands
Recipe cadence on a working food brand content calendar ships 2 to 4 new recipes per week during the first 6 months and drops to 1 per week at maturity. Each recipe takes 4 to 6 hours to produce (write, test in the kitchen, photograph, schema author, publish). At 3 recipes per week, the brand hits 78 recipes inside 6 months plus a backlog of ingredient comparison and sourcing content queued behind the recipe production line.
| Content pillar | Target volume year 1 | Production cost per piece | Refresh cadence |
|---|---|---|---|
| Recipe hub | 40 to 100 recipes | $180 to $320 | Every 12 months |
| Ingredient comparison guides | 12 to 24 guides | $450 to $780 | Every 18 months |
| Sourcing story pages | 6 to 12 pages | $680 to $1,200 | Every 24 months |
| Buyer intent content | 8 to 16 pieces | $220 to $420 | Every 12 months |
Photography as a content calendar constraint
Photography is the actual constraint on recipe cadence, not writing. Every recipe needs 6 to 12 photos: hero shot, ingredient flat lay, prep in progress, plated result, storage, and step shots for the schema markup. A working food brand batches photography 8 recipes at a time to keep the cost per recipe under 200 dollars. Skip the batching and the per-recipe cost climbs to 400 to 600 dollars, which caps recipe cadence at 1 per week and slows organic ranking timeline by 6 months.
Seasonal content calendar planning
Seasonal content calendar planning maps recipes and comparison guides to the seasonal windows they need to rank in. A Christmas cookie recipe needs to publish in September to rank by early December. A Valentine’s chocolate guide needs to publish in November to rank by early February. A back-to-school lunchbox recipe needs to publish in June to rank by late August. The 60-to-90-day ranking curve dictates the calendar.
Creator syndication inside food brand content
Creator syndication on food brand content marketing amplifies the recipe hub through Instagram Reels, TikTok, and YouTube Shorts creators paid to post their own version of the brand’s hero recipes. The creator content pulls net-new audiences into the recipe hub through the creator’s Link in Bio or Amazon Storefront tag. The syndication calendar names 12 to 30 creators per quarter with specific recipes assigned to each.
One brand we picked up had a spreadsheet titled “creator outreach 2023” with 47 rows and 3 responses. All 3 responses were auto-replies. The spreadsheet named zero recipes and offered flat rates below 100 dollars per post. Nobody posts a 30-second video for 87 dollars flat. Nobody.
Creator content commercial terms that work
Working creator content commercial terms run 350 to 1,500 dollars flat per post plus a 12 to 25 percent commission on tagged sales across a 30-day window. The commission mechanic pulls creators into follow-up posts because the incremental revenue continues past the initial fee. Mid-tier creators (30k to 150k followers) hit the sweet spot for food brand content because their engagement rate typically runs 4 to 8 percent versus 0.8 to 1.6 percent on mega-creators.
Content brief structure for creator partnerships
The content brief structure for creator partnerships runs a single page: the SKU, the specific recipe or usage occasion, 3 required brand mentions, 3 restricted claims (no health claims on non-medical SKUs), the pricing angle, the affiliate link, and 3 example videos that hit the tone. The brief avoids over-scripting because over-scripted creator content underperforms native creator voice by 40 to 60 percent on engagement rate.
Buyer intent content for food brand blogs
Buyer intent content on food brand blogs covers 8 to 16 pieces targeting explicit purchase-decision queries: “where to buy [brand],” “[brand] subscription vs. one-time,” “best [category] for [use case],” and “[brand] gift bundle.” Every buyer intent piece runs 1,400 to 2,400 words with a comparison table, product cards, and a clear conversion path to the specific SKU that matches the query intent. Buyer intent content converts at 3 to 6 percent versus 1 to 2 percent on recipe content because the shopper landed already planning to buy, not exploring a usage occasion.
Where-to-buy content structure
Where-to-buy content structure covers online (DTC storefront, Amazon, Target.com, Whole Foods online), retail (specific chain locators with the store finder embedded), and international (customs limitations, retailer partners abroad). Every piece names specific retailers, links to the store locator, and includes an FAQ block covering shipping availability, subscription options, and gift card compatibility. Where-to-buy content ranks for branded discovery queries the DTC storefront otherwise loses to competitor affiliate reviews.
Subscription versus one-time comparison content
Subscription versus one-time comparison content converts subscription commitments at 3 to 6 percent because it addresses the price-sensitivity concern head-on with a specific math table. The piece covers the discount structure (15 percent lifetime), the skip-a-month mechanic, the pause-anytime rule, the cancellation policy, and the specific yearly savings for the brand’s average consumption cadence. Cross-reference the retention structure on our food and beverage marketing retainer page.
Content refresh cadence on food brand pillars
Content refresh cadence on food brand content pillars runs a rolling audit every 12 to 24 months by pillar. Recipes get refreshed every 12 months with new photography, updated schema, and any nutrition or ingredient adjustments. Ingredient comparison guides refresh every 18 months to update market data. Sourcing story pages refresh every 24 months to reflect farm partnership changes and new harvest angles. Buyer intent content refreshes every 12 months to update retailer availability and pricing.
Recipe refresh priority order
Recipe refresh priority runs by organic traffic rank. The top 20 recipes by monthly organic sessions get refreshed first (new photography, schema audit, related recipe internal links, updated nutrition). The next 40 get refreshed at 15 months. The remaining recipes get refreshed opportunistically when the ranking slips past position 15 in Google. Skipping the refresh cadence lets recipe rankings drift out of the top 3 inside 18 months as newer competitor recipes take the position.
Schema audit checklist per refresh
The schema audit checklist per refresh runs 8 items: Recipe schema completeness, aggregateRating count and accuracy, nutrition data accuracy, prepTime and cookTime match the recipe body, image URLs valid at CDN, related recipe internal links working, product card SKU URL live, and Google Search Console rich result eligibility validated. This checklist takes 20 minutes per recipe and prevents the schema drift that costs recipe rankings 20 to 40 positions quietly.
Reporting cadence for food brand content marketing
Reporting cadence on food brand content marketing runs a monthly executive report plus a quarterly business review. The monthly report ships in the first business week and covers organic sessions by pillar, top 10 ranking recipes with position trend, ingredient guide ranking movements, sourcing page performance, and organic-attributed DTC revenue. Every number carries a comparison to the prior month and a plain-language interpretation the founder reads in 7 minutes.
Metrics that matter for content marketing
Metrics that matter for food brand content marketing: organic sessions by pillar, recipe rich result impressions in Search Console, organic conversion rate to hero SKU pages, organic-attributed DTC revenue, and top 20 ranking positions by monthly organic sessions. Vanity metrics that do not matter: total pageviews without conversion context, average time on page without conversion attribution, and social share counts. The monthly report skips the vanity block entirely.
Quarterly business review structure
The quarterly business review runs 90 minutes with the founder, head of content, and SEO lead. Agenda: organic traffic trend by pillar, top 10 winning content pieces, top 10 losing content pieces (candidates for refresh or removal), competitive gap analysis against 5 named competitor brands, and next quarter’s content calendar with recipes and ingredient guides queued. According to Ahrefs content marketing research, brands running quarterly content audits outperform brands running annual audits by 40 to 70 percent on organic revenue over a 24-month window.
Internal linking discipline across food brand content
Internal linking discipline across food brand content moves authority from recipe pages toward hero SKU product pages and comparison guides. Every recipe links to the hero SKU it uses inline (once in the ingredient list, once in a bottom call-out card). Every ingredient comparison guide links to 3 to 6 recipes using the winning ingredient plus the hero SKU product page. Every sourcing story links to the 2 to 4 SKUs sourced from that specific farm or cooperative.
Anchor text strategy across recipe hubs
Anchor text on internal links varies across recipe hubs to avoid over-optimization patterns Google penalizes. Exact-match anchor (“single-origin Ethiopian coffee”) runs on 20 to 30 percent of internal links. Partial-match variations (“our Ethiopian roast”) run on 30 to 40 percent. Branded anchors (the SKU name) run on 20 to 30 percent. Generic anchors (“shop the coffee”) fill the remaining 10 to 20 percent. This ratio holds ranking without triggering the over-optimization penalty that shows up on brands that anchor-text-stuff every internal link with the same exact-match keyword. Cross-reference the linking layer on our food and beverage web design page.
Link equity from ingredient guides to SKU pages
Link equity from ingredient guides passes to SKU pages when the guide’s comparison table names the hero SKU in the winning column with a product card, and when the guide’s body links to 3 to 6 recipes that use the winning ingredient. This 3-hop path (guide to recipe to SKU) pushes authority from a high-traffic informational query down to a high-intent transactional page. According to Search Engine Land SEO coverage, informational content that internally links to transactional pages produces 2 to 4 times higher organic revenue than isolated content silos.
Wrapping up content marketing for food brands
Content marketing for food brands is the organic engine that turns a DTC snack, drink, or CPG storefront into a search-driven revenue channel. Recipe hub of 40 to 100 recipes. Ingredient comparison guides at 12 to 24 pieces. Sourcing story pages at 6 to 12 pieces. Buyer intent content at 8 to 16 pieces. Creator syndication calendar with 12 to 30 creators per quarter. Refresh cadence at 12 to 24 months by pillar. Reporting with organic sessions and organic revenue attribution.
If your DTC food brand is running paid social at 20,000 dollars monthly with a broken blog and zero recipe schema, professional content marketing for food brands pays for itself inside the first 90 days on organic traffic captured. Redefine Web ships content marketing inside our monthly retainer packages. Book a call and we will walk through the last three DTC food brands we built recipe hubs for, pillar by pillar.
Content marketing for food brands starts with a recipe hub because recipe queries account for 40 to 60 percent of high-intent search volume in the food category. Every hero SKU needs 4 to 12 recipes anchored to it, each targeting a specific occasion and audience.
Skip the recipe hub and the brand loses the search real estate that pulls DTC storefront traffic month over month at zero incremental paid cost. Recipe traffic converts at 2 to 4 percent because the shopper landed with usage intent, not passive discovery, which is why food brands win on recipes.
Recipe schema and Google rich result eligibility
Every recipe page ships schema.org Recipe markup including cookTime, prepTime, recipeIngredient, recipeInstructions, nutrition, and aggregateRating. Correctly marked-up recipes qualify for Google’s recipe rich result carousel that pulls 3 to 6 times higher click-through rate than a plain blue link. The schema layer takes 15 minutes per recipe to author and 30 minutes to validate in Google Search Console. Cross-reference the recipe search stack on our food and beverage SEO page.
Recipe hub structure that scales
The recipe hub structure runs 40 to 100 recipes at maturity, organized by hero SKU (4 to 12 recipes per SKU) plus occasion tags (breakfast, weeknight dinner, meal prep, brunch, holiday). Every recipe links back to the hero SKU product page with the SKU embedded in an inline card. The hub earns internal linking value from ingredient comparison guides and the sourcing story pages, which feeds recipe ranking on Google. According to Google Search Central recipe structured data guidance, complete Recipe schema markup is required for eligibility in the recipe carousel and the ingredient search filter.
Pillar structure for food brand content marketing
The pillar structure on content marketing for food brands runs 4 content pillars concurrently: recipe hub (40 to 100 recipes), ingredient comparison guides (12 to 24 guides), sourcing story pages (6 to 12 pages), and buyer intent content (where to buy, subscription vs. one-time, gift bundle guides). Every pillar covers a distinct search intent and every pillar links back to the hero SKU product pages.
Ingredient comparison guide format
Ingredient comparison guides run 1,800 to 3,200 words comparing 2 to 4 ingredient types on 6 to 10 attributes with a comparison table, real-world use case examples, and links to the hero SKU that uses the specific ingredient. Example: organic vs. conventional oats compares nutritional profile, sourcing chain, cost, environmental impact, and taste on a 6-column table. The brand’s SKU appears in the winning column with a product card. These guides rank 3 to 8 months after publication and pull steady-state organic traffic.
Sourcing story pages that build trust
Sourcing story pages name the specific farms, cooperatives, or suppliers the brand sources from, with photos of the farms, farmer quotes, and specific harvest windows. A coffee brand’s Ethiopian farm page ranks for “single-origin Ethiopian coffee” and “Yirgacheffe coffee origin” plus 40 long-tail variations. The sourcing page pulls trust-building traffic that converts at 4 to 6 percent because the shopper landed pattern-matching on transparency and named provenance. Every sourcing page includes farmer or cooperative quotes, harvest dates, and a link back to 3 to 5 hero SKU pages that source from the named supplier.
Vejrø hospitality content case study
Vejrø Resort, a Danish private-island destination with an on-site restaurant focused on organic, locally sourced cuisine, joined us with strong social engagement and no organic-search real estate. Guests found the resort on Instagram but never in Google search for terms like “private island resort Denmark,” “farm-to-table hospitality Denmark,” or “Vejrø restaurant.” The same organic-search gap shows up on DTC food brands running paid social at 20,000 dollars monthly with a broken blog and zero recipe schema.
We built the conversion-focused website with on-site and off-site SEO tuned to the travel-niche keyword clusters, competitor analysis against comparable boutique resorts, and mobile-first design prioritizing guest discovery. Every page carried the structured data qualifying it for Google’s rich results in the hospitality category. Every internal link pushed authority toward the direct-booking conversion path.
Three months later, Vejrø hit 10,000 plus organic visitors, ranked for 200 plus first-page keywords, and pulled a 2.2 percent booking conversion rate from organic traffic. The same pattern applies to content marketing for food brands: recipe schema, ingredient comparison guides, and sourcing story pages pull organic traffic at 20 to 40 percent conversion into hero SKU pages inside 6 months when the content quality matches search intent and every page carries the right structured data markup. Vejrø also proved out the reporting discipline: every monthly report named the exact page, the exact keyword cluster, and the exact search feature (rich result, sitelinks, image pack) driving the incremental organic revenue instead of hiding behind aggregate traffic charts.
Recipe cadence and content calendar for food brands
Recipe cadence on a working food brand content calendar ships 2 to 4 new recipes per week during the first 6 months and drops to 1 per week at maturity. Each recipe takes 4 to 6 hours to produce (write, test in the kitchen, photograph, schema author, publish). At 3 recipes per week, the brand hits 78 recipes inside 6 months plus a backlog of ingredient comparison and sourcing content queued behind the recipe production line.
| Content pillar | Target volume year 1 | Production cost per piece | Refresh cadence |
|---|---|---|---|
| Recipe hub | 40 to 100 recipes | $180 to $320 | Every 12 months |
| Ingredient comparison guides | 12 to 24 guides | $450 to $780 | Every 18 months |
| Sourcing story pages | 6 to 12 pages | $680 to $1,200 | Every 24 months |
| Buyer intent content | 8 to 16 pieces | $220 to $420 | Every 12 months |
Photography as a content calendar constraint
Photography is the actual constraint on recipe cadence, not writing. Every recipe needs 6 to 12 photos: hero shot, ingredient flat lay, prep in progress, plated result, storage, and step shots for the schema markup. A working food brand batches photography 8 recipes at a time to keep the cost per recipe under 200 dollars. Skip the batching and the per-recipe cost climbs to 400 to 600 dollars, which caps recipe cadence at 1 per week and slows organic ranking timeline by 6 months.
Seasonal content calendar planning
Seasonal content calendar planning maps recipes and comparison guides to the seasonal windows they need to rank in. A Christmas cookie recipe needs to publish in September to rank by early December. A Valentine’s chocolate guide needs to publish in November to rank by early February. A back-to-school lunchbox recipe needs to publish in June to rank by late August. The 60-to-90-day ranking curve dictates the calendar.
Creator syndication inside food brand content
Creator syndication on food brand content marketing amplifies the recipe hub through Instagram Reels, TikTok, and YouTube Shorts creators paid to post their own version of the brand’s hero recipes. The creator content pulls net-new audiences into the recipe hub through the creator’s Link in Bio or Amazon Storefront tag. The syndication calendar names 12 to 30 creators per quarter with specific recipes assigned to each.
One brand we picked up had a spreadsheet titled “creator outreach 2023” with 47 rows and 3 responses. All 3 responses were auto-replies. The spreadsheet named zero recipes and offered flat rates below 100 dollars per post. Nobody posts a 30-second video for 87 dollars flat. Nobody.
Creator content commercial terms that work
Working creator content commercial terms run 350 to 1,500 dollars flat per post plus a 12 to 25 percent commission on tagged sales across a 30-day window. The commission mechanic pulls creators into follow-up posts because the incremental revenue continues past the initial fee. Mid-tier creators (30k to 150k followers) hit the sweet spot for food brand content because their engagement rate typically runs 4 to 8 percent versus 0.8 to 1.6 percent on mega-creators.
Content brief structure for creator partnerships
The content brief structure for creator partnerships runs a single page: the SKU, the specific recipe or usage occasion, 3 required brand mentions, 3 restricted claims (no health claims on non-medical SKUs), the pricing angle, the affiliate link, and 3 example videos that hit the tone. The brief avoids over-scripting because over-scripted creator content underperforms native creator voice by 40 to 60 percent on engagement rate.
Buyer intent content for food brand blogs
Buyer intent content on food brand blogs covers 8 to 16 pieces targeting explicit purchase-decision queries: “where to buy [brand],” “[brand] subscription vs. one-time,” “best [category] for [use case],” and “[brand] gift bundle.” Every buyer intent piece runs 1,400 to 2,400 words with a comparison table, product cards, and a clear conversion path to the specific SKU that matches the query intent. Buyer intent content converts at 3 to 6 percent versus 1 to 2 percent on recipe content because the shopper landed already planning to buy, not exploring a usage occasion.
Where-to-buy content structure
Where-to-buy content structure covers online (DTC storefront, Amazon, Target.com, Whole Foods online), retail (specific chain locators with the store finder embedded), and international (customs limitations, retailer partners abroad). Every piece names specific retailers, links to the store locator, and includes an FAQ block covering shipping availability, subscription options, and gift card compatibility. Where-to-buy content ranks for branded discovery queries the DTC storefront otherwise loses to competitor affiliate reviews.
Subscription versus one-time comparison content
Subscription versus one-time comparison content converts subscription commitments at 3 to 6 percent because it addresses the price-sensitivity concern head-on with a specific math table. The piece covers the discount structure (15 percent lifetime), the skip-a-month mechanic, the pause-anytime rule, the cancellation policy, and the specific yearly savings for the brand’s average consumption cadence. Cross-reference the retention structure on our food and beverage marketing retainer page.
Content refresh cadence on food brand pillars
Content refresh cadence on food brand content pillars runs a rolling audit every 12 to 24 months by pillar. Recipes get refreshed every 12 months with new photography, updated schema, and any nutrition or ingredient adjustments. Ingredient comparison guides refresh every 18 months to update market data. Sourcing story pages refresh every 24 months to reflect farm partnership changes and new harvest angles. Buyer intent content refreshes every 12 months to update retailer availability and pricing.
Recipe refresh priority order
Recipe refresh priority runs by organic traffic rank. The top 20 recipes by monthly organic sessions get refreshed first (new photography, schema audit, related recipe internal links, updated nutrition). The next 40 get refreshed at 15 months. The remaining recipes get refreshed opportunistically when the ranking slips past position 15 in Google. Skipping the refresh cadence lets recipe rankings drift out of the top 3 inside 18 months as newer competitor recipes take the position.
Schema audit checklist per refresh
The schema audit checklist per refresh runs 8 items: Recipe schema completeness, aggregateRating count and accuracy, nutrition data accuracy, prepTime and cookTime match the recipe body, image URLs valid at CDN, related recipe internal links working, product card SKU URL live, and Google Search Console rich result eligibility validated. This checklist takes 20 minutes per recipe and prevents the schema drift that costs recipe rankings 20 to 40 positions quietly.
Reporting cadence for food brand content marketing
Reporting cadence on food brand content marketing runs a monthly executive report plus a quarterly business review. The monthly report ships in the first business week and covers organic sessions by pillar, top 10 ranking recipes with position trend, ingredient guide ranking movements, sourcing page performance, and organic-attributed DTC revenue. Every number carries a comparison to the prior month and a plain-language interpretation the founder reads in 7 minutes.
Metrics that matter for content marketing
Metrics that matter for food brand content marketing: organic sessions by pillar, recipe rich result impressions in Search Console, organic conversion rate to hero SKU pages, organic-attributed DTC revenue, and top 20 ranking positions by monthly organic sessions. Vanity metrics that do not matter: total pageviews without conversion context, average time on page without conversion attribution, and social share counts. The monthly report skips the vanity block entirely.
Quarterly business review structure
The quarterly business review runs 90 minutes with the founder, head of content, and SEO lead. Agenda: organic traffic trend by pillar, top 10 winning content pieces, top 10 losing content pieces (candidates for refresh or removal), competitive gap analysis against 5 named competitor brands, and next quarter’s content calendar with recipes and ingredient guides queued. According to Ahrefs content marketing research, brands running quarterly content audits outperform brands running annual audits by 40 to 70 percent on organic revenue over a 24-month window.
Internal linking discipline across food brand content
Internal linking discipline across food brand content moves authority from recipe pages toward hero SKU product pages and comparison guides. Every recipe links to the hero SKU it uses inline (once in the ingredient list, once in a bottom call-out card). Every ingredient comparison guide links to 3 to 6 recipes using the winning ingredient plus the hero SKU product page. Every sourcing story links to the 2 to 4 SKUs sourced from that specific farm or cooperative.
Anchor text strategy across recipe hubs
Anchor text on internal links varies across recipe hubs to avoid over-optimization patterns Google penalizes. Exact-match anchor (“single-origin Ethiopian coffee”) runs on 20 to 30 percent of internal links. Partial-match variations (“our Ethiopian roast”) run on 30 to 40 percent. Branded anchors (the SKU name) run on 20 to 30 percent. Generic anchors (“shop the coffee”) fill the remaining 10 to 20 percent. This ratio holds ranking without triggering the over-optimization penalty that shows up on brands that anchor-text-stuff every internal link with the same exact-match keyword. Cross-reference the linking layer on our food and beverage web design page.
Link equity from ingredient guides to SKU pages
Link equity from ingredient guides passes to SKU pages when the guide’s comparison table names the hero SKU in the winning column with a product card, and when the guide’s body links to 3 to 6 recipes that use the winning ingredient. This 3-hop path (guide to recipe to SKU) pushes authority from a high-traffic informational query down to a high-intent transactional page. According to Search Engine Land SEO coverage, informational content that internally links to transactional pages produces 2 to 4 times higher organic revenue than isolated content silos.
Wrapping up content marketing for food brands
Content marketing for food brands is the organic engine that turns a DTC snack, drink, or CPG storefront into a search-driven revenue channel. Recipe hub of 40 to 100 recipes. Ingredient comparison guides at 12 to 24 pieces. Sourcing story pages at 6 to 12 pieces. Buyer intent content at 8 to 16 pieces. Creator syndication calendar with 12 to 30 creators per quarter. Refresh cadence at 12 to 24 months by pillar. Reporting with organic sessions and organic revenue attribution.
If your DTC food brand is running paid social at 20,000 dollars monthly with a broken blog and zero recipe schema, professional content marketing for food brands pays for itself inside the first 90 days on organic traffic captured. Redefine Web ships content marketing inside our monthly retainer packages. Book a call and we will walk through the last three DTC food brands we built recipe hubs for, pillar by pillar.
Anchor text on internal links varies across recipe hubs to avoid over-optimization patterns Google penalizes. Exact-match anchor (“single-origin Ethiopian coffee”) runs on 20 to 30 percent of internal links. Partial-match variations (“our Ethiopian roast”) run on 30 to 40 percent. Branded anchors (the SKU name) run on 20 to 30 percent. Generic anchors (“shop the coffee”) fill the remaining 10 to 20 percent. This ratio holds ranking without triggering the over-optimization penalty that shows up on brands that anchor-text-stuff every internal link with the same exact-match keyword. Cross-reference the linking layer on our food and beverage web design page.
Link equity from ingredient guides to SKU pages
Link equity from ingredient guides passes to SKU pages when the guide’s comparison table names the hero SKU in the winning column with a product card, and when the guide’s body links to 3 to 6 recipes that use the winning ingredient. This 3-hop path (guide to recipe to SKU) pushes authority from a high-traffic informational query down to a high-intent transactional page. According to Search Engine Land SEO coverage, informational content that internally links to transactional pages produces 2 to 4 times higher organic revenue than isolated content silos.
Wrapping up content marketing for food brands
Content marketing for food brands is the organic engine that turns a DTC snack, drink, or CPG storefront into a search-driven revenue channel. Recipe hub of 40 to 100 recipes. Ingredient comparison guides at 12 to 24 pieces. Sourcing story pages at 6 to 12 pieces. Buyer intent content at 8 to 16 pieces. Creator syndication calendar with 12 to 30 creators per quarter. Refresh cadence at 12 to 24 months by pillar. Reporting with organic sessions and organic revenue attribution.
If your DTC food brand is running paid social at 20,000 dollars monthly with a broken blog and zero recipe schema, professional content marketing for food brands pays for itself inside the first 90 days on organic traffic captured. Redefine Web ships content marketing inside our monthly retainer packages. Book a call and we will walk through the last three DTC food brands we built recipe hubs for, pillar by pillar.
Content marketing for food brands starts with a recipe hub because recipe queries account for 40 to 60 percent of high-intent search volume in the food category. Every hero SKU needs 4 to 12 recipes anchored to it, each targeting a specific occasion and audience.
Skip the recipe hub and the brand loses the search real estate that pulls DTC storefront traffic month over month at zero incremental paid cost. Recipe traffic converts at 2 to 4 percent because the shopper landed with usage intent, not passive discovery, which is why food brands win on recipes.
Recipe schema and Google rich result eligibility
Every recipe page ships schema.org Recipe markup including cookTime, prepTime, recipeIngredient, recipeInstructions, nutrition, and aggregateRating. Correctly marked-up recipes qualify for Google’s recipe rich result carousel that pulls 3 to 6 times higher click-through rate than a plain blue link. The schema layer takes 15 minutes per recipe to author and 30 minutes to validate in Google Search Console. Cross-reference the recipe search stack on our food and beverage SEO page.
Recipe hub structure that scales
The recipe hub structure runs 40 to 100 recipes at maturity, organized by hero SKU (4 to 12 recipes per SKU) plus occasion tags (breakfast, weeknight dinner, meal prep, brunch, holiday). Every recipe links back to the hero SKU product page with the SKU embedded in an inline card. The hub earns internal linking value from ingredient comparison guides and the sourcing story pages, which feeds recipe ranking on Google. According to Google Search Central recipe structured data guidance, complete Recipe schema markup is required for eligibility in the recipe carousel and the ingredient search filter.
Pillar structure for food brand content marketing
The pillar structure on content marketing for food brands runs 4 content pillars concurrently: recipe hub (40 to 100 recipes), ingredient comparison guides (12 to 24 guides), sourcing story pages (6 to 12 pages), and buyer intent content (where to buy, subscription vs. one-time, gift bundle guides). Every pillar covers a distinct search intent and every pillar links back to the hero SKU product pages.
Ingredient comparison guide format
Ingredient comparison guides run 1,800 to 3,200 words comparing 2 to 4 ingredient types on 6 to 10 attributes with a comparison table, real-world use case examples, and links to the hero SKU that uses the specific ingredient. Example: organic vs. conventional oats compares nutritional profile, sourcing chain, cost, environmental impact, and taste on a 6-column table. The brand’s SKU appears in the winning column with a product card. These guides rank 3 to 8 months after publication and pull steady-state organic traffic.
Sourcing story pages that build trust
Sourcing story pages name the specific farms, cooperatives, or suppliers the brand sources from, with photos of the farms, farmer quotes, and specific harvest windows. A coffee brand’s Ethiopian farm page ranks for “single-origin Ethiopian coffee” and “Yirgacheffe coffee origin” plus 40 long-tail variations. The sourcing page pulls trust-building traffic that converts at 4 to 6 percent because the shopper landed pattern-matching on transparency and named provenance. Every sourcing page includes farmer or cooperative quotes, harvest dates, and a link back to 3 to 5 hero SKU pages that source from the named supplier.
Vejrø hospitality content case study
Vejrø Resort, a Danish private-island destination with an on-site restaurant focused on organic, locally sourced cuisine, joined us with strong social engagement and no organic-search real estate. Guests found the resort on Instagram but never in Google search for terms like “private island resort Denmark,” “farm-to-table hospitality Denmark,” or “Vejrø restaurant.” The same organic-search gap shows up on DTC food brands running paid social at 20,000 dollars monthly with a broken blog and zero recipe schema.
We built the conversion-focused website with on-site and off-site SEO tuned to the travel-niche keyword clusters, competitor analysis against comparable boutique resorts, and mobile-first design prioritizing guest discovery. Every page carried the structured data qualifying it for Google’s rich results in the hospitality category. Every internal link pushed authority toward the direct-booking conversion path.
Three months later, Vejrø hit 10,000 plus organic visitors, ranked for 200 plus first-page keywords, and pulled a 2.2 percent booking conversion rate from organic traffic. The same pattern applies to content marketing for food brands: recipe schema, ingredient comparison guides, and sourcing story pages pull organic traffic at 20 to 40 percent conversion into hero SKU pages inside 6 months when the content quality matches search intent and every page carries the right structured data markup. Vejrø also proved out the reporting discipline: every monthly report named the exact page, the exact keyword cluster, and the exact search feature (rich result, sitelinks, image pack) driving the incremental organic revenue instead of hiding behind aggregate traffic charts.
Recipe cadence and content calendar for food brands
Recipe cadence on a working food brand content calendar ships 2 to 4 new recipes per week during the first 6 months and drops to 1 per week at maturity. Each recipe takes 4 to 6 hours to produce (write, test in the kitchen, photograph, schema author, publish). At 3 recipes per week, the brand hits 78 recipes inside 6 months plus a backlog of ingredient comparison and sourcing content queued behind the recipe production line.
| Content pillar | Target volume year 1 | Production cost per piece | Refresh cadence |
|---|---|---|---|
| Recipe hub | 40 to 100 recipes | $180 to $320 | Every 12 months |
| Ingredient comparison guides | 12 to 24 guides | $450 to $780 | Every 18 months |
| Sourcing story pages | 6 to 12 pages | $680 to $1,200 | Every 24 months |
| Buyer intent content | 8 to 16 pieces | $220 to $420 | Every 12 months |
Photography as a content calendar constraint
Photography is the actual constraint on recipe cadence, not writing. Every recipe needs 6 to 12 photos: hero shot, ingredient flat lay, prep in progress, plated result, storage, and step shots for the schema markup. A working food brand batches photography 8 recipes at a time to keep the cost per recipe under 200 dollars. Skip the batching and the per-recipe cost climbs to 400 to 600 dollars, which caps recipe cadence at 1 per week and slows organic ranking timeline by 6 months.
Seasonal content calendar planning
Seasonal content calendar planning maps recipes and comparison guides to the seasonal windows they need to rank in. A Christmas cookie recipe needs to publish in September to rank by early December. A Valentine’s chocolate guide needs to publish in November to rank by early February. A back-to-school lunchbox recipe needs to publish in June to rank by late August. The 60-to-90-day ranking curve dictates the calendar.
Creator syndication inside food brand content
Creator syndication on food brand content marketing amplifies the recipe hub through Instagram Reels, TikTok, and YouTube Shorts creators paid to post their own version of the brand’s hero recipes. The creator content pulls net-new audiences into the recipe hub through the creator’s Link in Bio or Amazon Storefront tag. The syndication calendar names 12 to 30 creators per quarter with specific recipes assigned to each.
One brand we picked up had a spreadsheet titled “creator outreach 2023” with 47 rows and 3 responses. All 3 responses were auto-replies. The spreadsheet named zero recipes and offered flat rates below 100 dollars per post. Nobody posts a 30-second video for 87 dollars flat. Nobody.
Creator content commercial terms that work
Working creator content commercial terms run 350 to 1,500 dollars flat per post plus a 12 to 25 percent commission on tagged sales across a 30-day window. The commission mechanic pulls creators into follow-up posts because the incremental revenue continues past the initial fee. Mid-tier creators (30k to 150k followers) hit the sweet spot for food brand content because their engagement rate typically runs 4 to 8 percent versus 0.8 to 1.6 percent on mega-creators.
Content brief structure for creator partnerships
The content brief structure for creator partnerships runs a single page: the SKU, the specific recipe or usage occasion, 3 required brand mentions, 3 restricted claims (no health claims on non-medical SKUs), the pricing angle, the affiliate link, and 3 example videos that hit the tone. The brief avoids over-scripting because over-scripted creator content underperforms native creator voice by 40 to 60 percent on engagement rate.
Buyer intent content for food brand blogs
Buyer intent content on food brand blogs covers 8 to 16 pieces targeting explicit purchase-decision queries: “where to buy [brand],” “[brand] subscription vs. one-time,” “best [category] for [use case],” and “[brand] gift bundle.” Every buyer intent piece runs 1,400 to 2,400 words with a comparison table, product cards, and a clear conversion path to the specific SKU that matches the query intent. Buyer intent content converts at 3 to 6 percent versus 1 to 2 percent on recipe content because the shopper landed already planning to buy, not exploring a usage occasion.
Where-to-buy content structure
Where-to-buy content structure covers online (DTC storefront, Amazon, Target.com, Whole Foods online), retail (specific chain locators with the store finder embedded), and international (customs limitations, retailer partners abroad). Every piece names specific retailers, links to the store locator, and includes an FAQ block covering shipping availability, subscription options, and gift card compatibility. Where-to-buy content ranks for branded discovery queries the DTC storefront otherwise loses to competitor affiliate reviews.
Subscription versus one-time comparison content
Subscription versus one-time comparison content converts subscription commitments at 3 to 6 percent because it addresses the price-sensitivity concern head-on with a specific math table. The piece covers the discount structure (15 percent lifetime), the skip-a-month mechanic, the pause-anytime rule, the cancellation policy, and the specific yearly savings for the brand’s average consumption cadence. Cross-reference the retention structure on our food and beverage marketing retainer page.
Content refresh cadence on food brand pillars
Content refresh cadence on food brand content pillars runs a rolling audit every 12 to 24 months by pillar. Recipes get refreshed every 12 months with new photography, updated schema, and any nutrition or ingredient adjustments. Ingredient comparison guides refresh every 18 months to update market data. Sourcing story pages refresh every 24 months to reflect farm partnership changes and new harvest angles. Buyer intent content refreshes every 12 months to update retailer availability and pricing.
Recipe refresh priority order
Recipe refresh priority runs by organic traffic rank. The top 20 recipes by monthly organic sessions get refreshed first (new photography, schema audit, related recipe internal links, updated nutrition). The next 40 get refreshed at 15 months. The remaining recipes get refreshed opportunistically when the ranking slips past position 15 in Google. Skipping the refresh cadence lets recipe rankings drift out of the top 3 inside 18 months as newer competitor recipes take the position.
Schema audit checklist per refresh
The schema audit checklist per refresh runs 8 items: Recipe schema completeness, aggregateRating count and accuracy, nutrition data accuracy, prepTime and cookTime match the recipe body, image URLs valid at CDN, related recipe internal links working, product card SKU URL live, and Google Search Console rich result eligibility validated. This checklist takes 20 minutes per recipe and prevents the schema drift that costs recipe rankings 20 to 40 positions quietly.
Reporting cadence for food brand content marketing
Reporting cadence on food brand content marketing runs a monthly executive report plus a quarterly business review. The monthly report ships in the first business week and covers organic sessions by pillar, top 10 ranking recipes with position trend, ingredient guide ranking movements, sourcing page performance, and organic-attributed DTC revenue. Every number carries a comparison to the prior month and a plain-language interpretation the founder reads in 7 minutes.
Metrics that matter for content marketing
Metrics that matter for food brand content marketing: organic sessions by pillar, recipe rich result impressions in Search Console, organic conversion rate to hero SKU pages, organic-attributed DTC revenue, and top 20 ranking positions by monthly organic sessions. Vanity metrics that do not matter: total pageviews without conversion context, average time on page without conversion attribution, and social share counts. The monthly report skips the vanity block entirely.
Quarterly business review structure
The quarterly business review runs 90 minutes with the founder, head of content, and SEO lead. Agenda: organic traffic trend by pillar, top 10 winning content pieces, top 10 losing content pieces (candidates for refresh or removal), competitive gap analysis against 5 named competitor brands, and next quarter’s content calendar with recipes and ingredient guides queued. According to Ahrefs content marketing research, brands running quarterly content audits outperform brands running annual audits by 40 to 70 percent on organic revenue over a 24-month window.
Internal linking discipline across food brand content
Internal linking discipline across food brand content moves authority from recipe pages toward hero SKU product pages and comparison guides. Every recipe links to the hero SKU it uses inline (once in the ingredient list, once in a bottom call-out card). Every ingredient comparison guide links to 3 to 6 recipes using the winning ingredient plus the hero SKU product page. Every sourcing story links to the 2 to 4 SKUs sourced from that specific farm or cooperative.
Anchor text strategy across recipe hubs
Anchor text on internal links varies across recipe hubs to avoid over-optimization patterns Google penalizes. Exact-match anchor (“single-origin Ethiopian coffee”) runs on 20 to 30 percent of internal links. Partial-match variations (“our Ethiopian roast”) run on 30 to 40 percent. Branded anchors (the SKU name) run on 20 to 30 percent. Generic anchors (“shop the coffee”) fill the remaining 10 to 20 percent. This ratio holds ranking without triggering the over-optimization penalty that shows up on brands that anchor-text-stuff every internal link with the same exact-match keyword. Cross-reference the linking layer on our food and beverage web design page.
Link equity from ingredient guides to SKU pages
Link equity from ingredient guides passes to SKU pages when the guide’s comparison table names the hero SKU in the winning column with a product card, and when the guide’s body links to 3 to 6 recipes that use the winning ingredient. This 3-hop path (guide to recipe to SKU) pushes authority from a high-traffic informational query down to a high-intent transactional page. According to Search Engine Land SEO coverage, informational content that internally links to transactional pages produces 2 to 4 times higher organic revenue than isolated content silos.
Wrapping up content marketing for food brands
Content marketing for food brands is the organic engine that turns a DTC snack, drink, or CPG storefront into a search-driven revenue channel. Recipe hub of 40 to 100 recipes. Ingredient comparison guides at 12 to 24 pieces. Sourcing story pages at 6 to 12 pieces. Buyer intent content at 8 to 16 pieces. Creator syndication calendar with 12 to 30 creators per quarter. Refresh cadence at 12 to 24 months by pillar. Reporting with organic sessions and organic revenue attribution.
If your DTC food brand is running paid social at 20,000 dollars monthly with a broken blog and zero recipe schema, professional content marketing for food brands pays for itself inside the first 90 days on organic traffic captured. Redefine Web ships content marketing inside our monthly retainer packages. Book a call and we will walk through the last three DTC food brands we built recipe hubs for, pillar by pillar.
Anchor text on internal links varies across recipe hubs to avoid over-optimization patterns Google penalizes. Exact-match anchor (“single-origin Ethiopian coffee”) runs on 20 to 30 percent of internal links. Partial-match variations (“our Ethiopian roast”) run on 30 to 40 percent. Branded anchors (the SKU name) run on 20 to 30 percent. Generic anchors (“shop the coffee”) fill the remaining 10 to 20 percent. This ratio holds ranking without triggering the over-optimization penalty that shows up on brands that anchor-text-stuff every internal link with the same exact-match keyword. Cross-reference the linking layer on our food and beverage web design page.
Link equity from ingredient guides to SKU pages
Link equity from ingredient guides passes to SKU pages when the guide’s comparison table names the hero SKU in the winning column with a product card, and when the guide’s body links to 3 to 6 recipes that use the winning ingredient. This 3-hop path (guide to recipe to SKU) pushes authority from a high-traffic informational query down to a high-intent transactional page. According to Search Engine Land SEO coverage, informational content that internally links to transactional pages produces 2 to 4 times higher organic revenue than isolated content silos.
Wrapping up content marketing for food brands
Content marketing for food brands is the organic engine that turns a DTC snack, drink, or CPG storefront into a search-driven revenue channel. Recipe hub of 40 to 100 recipes. Ingredient comparison guides at 12 to 24 pieces. Sourcing story pages at 6 to 12 pieces. Buyer intent content at 8 to 16 pieces. Creator syndication calendar with 12 to 30 creators per quarter. Refresh cadence at 12 to 24 months by pillar. Reporting with organic sessions and organic revenue attribution.
If your DTC food brand is running paid social at 20,000 dollars monthly with a broken blog and zero recipe schema, professional content marketing for food brands pays for itself inside the first 90 days on organic traffic captured. Redefine Web ships content marketing inside our monthly retainer packages. Book a call and we will walk through the last three DTC food brands we built recipe hubs for, pillar by pillar.
Internal linking discipline across food brand content moves authority from recipe pages toward hero SKU product pages and comparison guides. Every recipe links to the hero SKU it uses inline (once in the ingredient list, once in a bottom call-out card). Every ingredient comparison guide links to 3 to 6 recipes using the winning ingredient plus the hero SKU product page. Every sourcing story links to the 2 to 4 SKUs sourced from that specific farm or cooperative.
Anchor text strategy across recipe hubs
Anchor text on internal links varies across recipe hubs to avoid over-optimization patterns Google penalizes. Exact-match anchor (“single-origin Ethiopian coffee”) runs on 20 to 30 percent of internal links. Partial-match variations (“our Ethiopian roast”) run on 30 to 40 percent. Branded anchors (the SKU name) run on 20 to 30 percent. Generic anchors (“shop the coffee”) fill the remaining 10 to 20 percent. This ratio holds ranking without triggering the over-optimization penalty that shows up on brands that anchor-text-stuff every internal link with the same exact-match keyword. Cross-reference the linking layer on our food and beverage web design page.
Link equity from ingredient guides to SKU pages
Link equity from ingredient guides passes to SKU pages when the guide’s comparison table names the hero SKU in the winning column with a product card, and when the guide’s body links to 3 to 6 recipes that use the winning ingredient. This 3-hop path (guide to recipe to SKU) pushes authority from a high-traffic informational query down to a high-intent transactional page. According to Search Engine Land SEO coverage, informational content that internally links to transactional pages produces 2 to 4 times higher organic revenue than isolated content silos.
Wrapping up content marketing for food brands
Content marketing for food brands is the organic engine that turns a DTC snack, drink, or CPG storefront into a search-driven revenue channel. Recipe hub of 40 to 100 recipes. Ingredient comparison guides at 12 to 24 pieces. Sourcing story pages at 6 to 12 pieces. Buyer intent content at 8 to 16 pieces. Creator syndication calendar with 12 to 30 creators per quarter. Refresh cadence at 12 to 24 months by pillar. Reporting with organic sessions and organic revenue attribution.
If your DTC food brand is running paid social at 20,000 dollars monthly with a broken blog and zero recipe schema, professional content marketing for food brands pays for itself inside the first 90 days on organic traffic captured. Redefine Web ships content marketing inside our monthly retainer packages. Book a call and we will walk through the last three DTC food brands we built recipe hubs for, pillar by pillar.
Content marketing for food brands starts with a recipe hub because recipe queries account for 40 to 60 percent of high-intent search volume in the food category. Every hero SKU needs 4 to 12 recipes anchored to it, each targeting a specific occasion and audience.
Skip the recipe hub and the brand loses the search real estate that pulls DTC storefront traffic month over month at zero incremental paid cost. Recipe traffic converts at 2 to 4 percent because the shopper landed with usage intent, not passive discovery, which is why food brands win on recipes.
Recipe schema and Google rich result eligibility
Every recipe page ships schema.org Recipe markup including cookTime, prepTime, recipeIngredient, recipeInstructions, nutrition, and aggregateRating. Correctly marked-up recipes qualify for Google’s recipe rich result carousel that pulls 3 to 6 times higher click-through rate than a plain blue link. The schema layer takes 15 minutes per recipe to author and 30 minutes to validate in Google Search Console. Cross-reference the recipe search stack on our food and beverage SEO page.
Recipe hub structure that scales
The recipe hub structure runs 40 to 100 recipes at maturity, organized by hero SKU (4 to 12 recipes per SKU) plus occasion tags (breakfast, weeknight dinner, meal prep, brunch, holiday). Every recipe links back to the hero SKU product page with the SKU embedded in an inline card. The hub earns internal linking value from ingredient comparison guides and the sourcing story pages, which feeds recipe ranking on Google. According to Google Search Central recipe structured data guidance, complete Recipe schema markup is required for eligibility in the recipe carousel and the ingredient search filter.
Pillar structure for food brand content marketing
The pillar structure on content marketing for food brands runs 4 content pillars concurrently: recipe hub (40 to 100 recipes), ingredient comparison guides (12 to 24 guides), sourcing story pages (6 to 12 pages), and buyer intent content (where to buy, subscription vs. one-time, gift bundle guides). Every pillar covers a distinct search intent and every pillar links back to the hero SKU product pages.
Ingredient comparison guide format
Ingredient comparison guides run 1,800 to 3,200 words comparing 2 to 4 ingredient types on 6 to 10 attributes with a comparison table, real-world use case examples, and links to the hero SKU that uses the specific ingredient. Example: organic vs. conventional oats compares nutritional profile, sourcing chain, cost, environmental impact, and taste on a 6-column table. The brand’s SKU appears in the winning column with a product card. These guides rank 3 to 8 months after publication and pull steady-state organic traffic.
Sourcing story pages that build trust
Sourcing story pages name the specific farms, cooperatives, or suppliers the brand sources from, with photos of the farms, farmer quotes, and specific harvest windows. A coffee brand’s Ethiopian farm page ranks for “single-origin Ethiopian coffee” and “Yirgacheffe coffee origin” plus 40 long-tail variations. The sourcing page pulls trust-building traffic that converts at 4 to 6 percent because the shopper landed pattern-matching on transparency and named provenance. Every sourcing page includes farmer or cooperative quotes, harvest dates, and a link back to 3 to 5 hero SKU pages that source from the named supplier.
Vejrø hospitality content case study
Vejrø Resort, a Danish private-island destination with an on-site restaurant focused on organic, locally sourced cuisine, joined us with strong social engagement and no organic-search real estate. Guests found the resort on Instagram but never in Google search for terms like “private island resort Denmark,” “farm-to-table hospitality Denmark,” or “Vejrø restaurant.” The same organic-search gap shows up on DTC food brands running paid social at 20,000 dollars monthly with a broken blog and zero recipe schema.
We built the conversion-focused website with on-site and off-site SEO tuned to the travel-niche keyword clusters, competitor analysis against comparable boutique resorts, and mobile-first design prioritizing guest discovery. Every page carried the structured data qualifying it for Google’s rich results in the hospitality category. Every internal link pushed authority toward the direct-booking conversion path.
Three months later, Vejrø hit 10,000 plus organic visitors, ranked for 200 plus first-page keywords, and pulled a 2.2 percent booking conversion rate from organic traffic. The same pattern applies to content marketing for food brands: recipe schema, ingredient comparison guides, and sourcing story pages pull organic traffic at 20 to 40 percent conversion into hero SKU pages inside 6 months when the content quality matches search intent and every page carries the right structured data markup. Vejrø also proved out the reporting discipline: every monthly report named the exact page, the exact keyword cluster, and the exact search feature (rich result, sitelinks, image pack) driving the incremental organic revenue instead of hiding behind aggregate traffic charts.
Recipe cadence and content calendar for food brands
Recipe cadence on a working food brand content calendar ships 2 to 4 new recipes per week during the first 6 months and drops to 1 per week at maturity. Each recipe takes 4 to 6 hours to produce (write, test in the kitchen, photograph, schema author, publish). At 3 recipes per week, the brand hits 78 recipes inside 6 months plus a backlog of ingredient comparison and sourcing content queued behind the recipe production line.
| Content pillar | Target volume year 1 | Production cost per piece | Refresh cadence |
|---|---|---|---|
| Recipe hub | 40 to 100 recipes | $180 to $320 | Every 12 months |
| Ingredient comparison guides | 12 to 24 guides | $450 to $780 | Every 18 months |
| Sourcing story pages | 6 to 12 pages | $680 to $1,200 | Every 24 months |
| Buyer intent content | 8 to 16 pieces | $220 to $420 | Every 12 months |
Photography as a content calendar constraint
Photography is the actual constraint on recipe cadence, not writing. Every recipe needs 6 to 12 photos: hero shot, ingredient flat lay, prep in progress, plated result, storage, and step shots for the schema markup. A working food brand batches photography 8 recipes at a time to keep the cost per recipe under 200 dollars. Skip the batching and the per-recipe cost climbs to 400 to 600 dollars, which caps recipe cadence at 1 per week and slows organic ranking timeline by 6 months.
Seasonal content calendar planning
Seasonal content calendar planning maps recipes and comparison guides to the seasonal windows they need to rank in. A Christmas cookie recipe needs to publish in September to rank by early December. A Valentine’s chocolate guide needs to publish in November to rank by early February. A back-to-school lunchbox recipe needs to publish in June to rank by late August. The 60-to-90-day ranking curve dictates the calendar.
Creator syndication inside food brand content
Creator syndication on food brand content marketing amplifies the recipe hub through Instagram Reels, TikTok, and YouTube Shorts creators paid to post their own version of the brand’s hero recipes. The creator content pulls net-new audiences into the recipe hub through the creator’s Link in Bio or Amazon Storefront tag. The syndication calendar names 12 to 30 creators per quarter with specific recipes assigned to each.
One brand we picked up had a spreadsheet titled “creator outreach 2023” with 47 rows and 3 responses. All 3 responses were auto-replies. The spreadsheet named zero recipes and offered flat rates below 100 dollars per post. Nobody posts a 30-second video for 87 dollars flat. Nobody.
Creator content commercial terms that work
Working creator content commercial terms run 350 to 1,500 dollars flat per post plus a 12 to 25 percent commission on tagged sales across a 30-day window. The commission mechanic pulls creators into follow-up posts because the incremental revenue continues past the initial fee. Mid-tier creators (30k to 150k followers) hit the sweet spot for food brand content because their engagement rate typically runs 4 to 8 percent versus 0.8 to 1.6 percent on mega-creators.
Content brief structure for creator partnerships
The content brief structure for creator partnerships runs a single page: the SKU, the specific recipe or usage occasion, 3 required brand mentions, 3 restricted claims (no health claims on non-medical SKUs), the pricing angle, the affiliate link, and 3 example videos that hit the tone. The brief avoids over-scripting because over-scripted creator content underperforms native creator voice by 40 to 60 percent on engagement rate.
Buyer intent content for food brand blogs
Buyer intent content on food brand blogs covers 8 to 16 pieces targeting explicit purchase-decision queries: “where to buy [brand],” “[brand] subscription vs. one-time,” “best [category] for [use case],” and “[brand] gift bundle.” Every buyer intent piece runs 1,400 to 2,400 words with a comparison table, product cards, and a clear conversion path to the specific SKU that matches the query intent. Buyer intent content converts at 3 to 6 percent versus 1 to 2 percent on recipe content because the shopper landed already planning to buy, not exploring a usage occasion.
Where-to-buy content structure
Where-to-buy content structure covers online (DTC storefront, Amazon, Target.com, Whole Foods online), retail (specific chain locators with the store finder embedded), and international (customs limitations, retailer partners abroad). Every piece names specific retailers, links to the store locator, and includes an FAQ block covering shipping availability, subscription options, and gift card compatibility. Where-to-buy content ranks for branded discovery queries the DTC storefront otherwise loses to competitor affiliate reviews.
Subscription versus one-time comparison content
Subscription versus one-time comparison content converts subscription commitments at 3 to 6 percent because it addresses the price-sensitivity concern head-on with a specific math table. The piece covers the discount structure (15 percent lifetime), the skip-a-month mechanic, the pause-anytime rule, the cancellation policy, and the specific yearly savings for the brand’s average consumption cadence. Cross-reference the retention structure on our food and beverage marketing retainer page.
Content refresh cadence on food brand pillars
Content refresh cadence on food brand content pillars runs a rolling audit every 12 to 24 months by pillar. Recipes get refreshed every 12 months with new photography, updated schema, and any nutrition or ingredient adjustments. Ingredient comparison guides refresh every 18 months to update market data. Sourcing story pages refresh every 24 months to reflect farm partnership changes and new harvest angles. Buyer intent content refreshes every 12 months to update retailer availability and pricing.
Recipe refresh priority order
Recipe refresh priority runs by organic traffic rank. The top 20 recipes by monthly organic sessions get refreshed first (new photography, schema audit, related recipe internal links, updated nutrition). The next 40 get refreshed at 15 months. The remaining recipes get refreshed opportunistically when the ranking slips past position 15 in Google. Skipping the refresh cadence lets recipe rankings drift out of the top 3 inside 18 months as newer competitor recipes take the position.
Schema audit checklist per refresh
The schema audit checklist per refresh runs 8 items: Recipe schema completeness, aggregateRating count and accuracy, nutrition data accuracy, prepTime and cookTime match the recipe body, image URLs valid at CDN, related recipe internal links working, product card SKU URL live, and Google Search Console rich result eligibility validated. This checklist takes 20 minutes per recipe and prevents the schema drift that costs recipe rankings 20 to 40 positions quietly.
Reporting cadence for food brand content marketing
Reporting cadence on food brand content marketing runs a monthly executive report plus a quarterly business review. The monthly report ships in the first business week and covers organic sessions by pillar, top 10 ranking recipes with position trend, ingredient guide ranking movements, sourcing page performance, and organic-attributed DTC revenue. Every number carries a comparison to the prior month and a plain-language interpretation the founder reads in 7 minutes.
Metrics that matter for content marketing
Metrics that matter for food brand content marketing: organic sessions by pillar, recipe rich result impressions in Search Console, organic conversion rate to hero SKU pages, organic-attributed DTC revenue, and top 20 ranking positions by monthly organic sessions. Vanity metrics that do not matter: total pageviews without conversion context, average time on page without conversion attribution, and social share counts. The monthly report skips the vanity block entirely.
Quarterly business review structure
The quarterly business review runs 90 minutes with the founder, head of content, and SEO lead. Agenda: organic traffic trend by pillar, top 10 winning content pieces, top 10 losing content pieces (candidates for refresh or removal), competitive gap analysis against 5 named competitor brands, and next quarter’s content calendar with recipes and ingredient guides queued. According to Ahrefs content marketing research, brands running quarterly content audits outperform brands running annual audits by 40 to 70 percent on organic revenue over a 24-month window.
Internal linking discipline across food brand content
Internal linking discipline across food brand content moves authority from recipe pages toward hero SKU product pages and comparison guides. Every recipe links to the hero SKU it uses inline (once in the ingredient list, once in a bottom call-out card). Every ingredient comparison guide links to 3 to 6 recipes using the winning ingredient plus the hero SKU product page. Every sourcing story links to the 2 to 4 SKUs sourced from that specific farm or cooperative.
Anchor text strategy across recipe hubs
Anchor text on internal links varies across recipe hubs to avoid over-optimization patterns Google penalizes. Exact-match anchor (“single-origin Ethiopian coffee”) runs on 20 to 30 percent of internal links. Partial-match variations (“our Ethiopian roast”) run on 30 to 40 percent. Branded anchors (the SKU name) run on 20 to 30 percent. Generic anchors (“shop the coffee”) fill the remaining 10 to 20 percent. This ratio holds ranking without triggering the over-optimization penalty that shows up on brands that anchor-text-stuff every internal link with the same exact-match keyword. Cross-reference the linking layer on our food and beverage web design page.
Link equity from ingredient guides to SKU pages
Link equity from ingredient guides passes to SKU pages when the guide’s comparison table names the hero SKU in the winning column with a product card, and when the guide’s body links to 3 to 6 recipes that use the winning ingredient. This 3-hop path (guide to recipe to SKU) pushes authority from a high-traffic informational query down to a high-intent transactional page. According to Search Engine Land SEO coverage, informational content that internally links to transactional pages produces 2 to 4 times higher organic revenue than isolated content silos.
Wrapping up content marketing for food brands
Content marketing for food brands is the organic engine that turns a DTC snack, drink, or CPG storefront into a search-driven revenue channel. Recipe hub of 40 to 100 recipes. Ingredient comparison guides at 12 to 24 pieces. Sourcing story pages at 6 to 12 pieces. Buyer intent content at 8 to 16 pieces. Creator syndication calendar with 12 to 30 creators per quarter. Refresh cadence at 12 to 24 months by pillar. Reporting with organic sessions and organic revenue attribution.
If your DTC food brand is running paid social at 20,000 dollars monthly with a broken blog and zero recipe schema, professional content marketing for food brands pays for itself inside the first 90 days on organic traffic captured. Redefine Web ships content marketing inside our monthly retainer packages. Book a call and we will walk through the last three DTC food brands we built recipe hubs for, pillar by pillar.
Content marketing for food brands starts with a recipe hub because recipe queries account for 40 to 60 percent of high-intent search volume in the food category. Every hero SKU needs 4 to 12 recipes anchored to it, each targeting a specific occasion and audience.
Skip the recipe hub and the brand loses the search real estate that pulls DTC storefront traffic month over month at zero incremental paid cost. Recipe traffic converts at 2 to 4 percent because the shopper landed with usage intent, not passive discovery, which is why food brands win on recipes.
Recipe schema and Google rich result eligibility
Every recipe page ships schema.org Recipe markup including cookTime, prepTime, recipeIngredient, recipeInstructions, nutrition, and aggregateRating. Correctly marked-up recipes qualify for Google’s recipe rich result carousel that pulls 3 to 6 times higher click-through rate than a plain blue link. The schema layer takes 15 minutes per recipe to author and 30 minutes to validate in Google Search Console. Cross-reference the recipe search stack on our food and beverage SEO page.
Recipe hub structure that scales
The recipe hub structure runs 40 to 100 recipes at maturity, organized by hero SKU (4 to 12 recipes per SKU) plus occasion tags (breakfast, weeknight dinner, meal prep, brunch, holiday). Every recipe links back to the hero SKU product page with the SKU embedded in an inline card. The hub earns internal linking value from ingredient comparison guides and the sourcing story pages, which feeds recipe ranking on Google. According to Google Search Central recipe structured data guidance, complete Recipe schema markup is required for eligibility in the recipe carousel and the ingredient search filter.
Pillar structure for food brand content marketing
The pillar structure on content marketing for food brands runs 4 content pillars concurrently: recipe hub (40 to 100 recipes), ingredient comparison guides (12 to 24 guides), sourcing story pages (6 to 12 pages), and buyer intent content (where to buy, subscription vs. one-time, gift bundle guides). Every pillar covers a distinct search intent and every pillar links back to the hero SKU product pages.
Ingredient comparison guide format
Ingredient comparison guides run 1,800 to 3,200 words comparing 2 to 4 ingredient types on 6 to 10 attributes with a comparison table, real-world use case examples, and links to the hero SKU that uses the specific ingredient. Example: organic vs. conventional oats compares nutritional profile, sourcing chain, cost, environmental impact, and taste on a 6-column table. The brand’s SKU appears in the winning column with a product card. These guides rank 3 to 8 months after publication and pull steady-state organic traffic.
Sourcing story pages that build trust
Sourcing story pages name the specific farms, cooperatives, or suppliers the brand sources from, with photos of the farms, farmer quotes, and specific harvest windows. A coffee brand’s Ethiopian farm page ranks for “single-origin Ethiopian coffee” and “Yirgacheffe coffee origin” plus 40 long-tail variations. The sourcing page pulls trust-building traffic that converts at 4 to 6 percent because the shopper landed pattern-matching on transparency and named provenance. Every sourcing page includes farmer or cooperative quotes, harvest dates, and a link back to 3 to 5 hero SKU pages that source from the named supplier.
Vejrø hospitality content case study
Vejrø Resort, a Danish private-island destination with an on-site restaurant focused on organic, locally sourced cuisine, joined us with strong social engagement and no organic-search real estate. Guests found the resort on Instagram but never in Google search for terms like “private island resort Denmark,” “farm-to-table hospitality Denmark,” or “Vejrø restaurant.” The same organic-search gap shows up on DTC food brands running paid social at 20,000 dollars monthly with a broken blog and zero recipe schema.
We built the conversion-focused website with on-site and off-site SEO tuned to the travel-niche keyword clusters, competitor analysis against comparable boutique resorts, and mobile-first design prioritizing guest discovery. Every page carried the structured data qualifying it for Google’s rich results in the hospitality category. Every internal link pushed authority toward the direct-booking conversion path.
Three months later, Vejrø hit 10,000 plus organic visitors, ranked for 200 plus first-page keywords, and pulled a 2.2 percent booking conversion rate from organic traffic. The same pattern applies to content marketing for food brands: recipe schema, ingredient comparison guides, and sourcing story pages pull organic traffic at 20 to 40 percent conversion into hero SKU pages inside 6 months when the content quality matches search intent and every page carries the right structured data markup. Vejrø also proved out the reporting discipline: every monthly report named the exact page, the exact keyword cluster, and the exact search feature (rich result, sitelinks, image pack) driving the incremental organic revenue instead of hiding behind aggregate traffic charts.
Recipe cadence and content calendar for food brands
Recipe cadence on a working food brand content calendar ships 2 to 4 new recipes per week during the first 6 months and drops to 1 per week at maturity. Each recipe takes 4 to 6 hours to produce (write, test in the kitchen, photograph, schema author, publish). At 3 recipes per week, the brand hits 78 recipes inside 6 months plus a backlog of ingredient comparison and sourcing content queued behind the recipe production line.
| Content pillar | Target volume year 1 | Production cost per piece | Refresh cadence |
|---|---|---|---|
| Recipe hub | 40 to 100 recipes | $180 to $320 | Every 12 months |
| Ingredient comparison guides | 12 to 24 guides | $450 to $780 | Every 18 months |
| Sourcing story pages | 6 to 12 pages | $680 to $1,200 | Every 24 months |
| Buyer intent content | 8 to 16 pieces | $220 to $420 | Every 12 months |
Photography as a content calendar constraint
Photography is the actual constraint on recipe cadence, not writing. Every recipe needs 6 to 12 photos: hero shot, ingredient flat lay, prep in progress, plated result, storage, and step shots for the schema markup. A working food brand batches photography 8 recipes at a time to keep the cost per recipe under 200 dollars. Skip the batching and the per-recipe cost climbs to 400 to 600 dollars, which caps recipe cadence at 1 per week and slows organic ranking timeline by 6 months.
Seasonal content calendar planning
Seasonal content calendar planning maps recipes and comparison guides to the seasonal windows they need to rank in. A Christmas cookie recipe needs to publish in September to rank by early December. A Valentine’s chocolate guide needs to publish in November to rank by early February. A back-to-school lunchbox recipe needs to publish in June to rank by late August. The 60-to-90-day ranking curve dictates the calendar.
Creator syndication inside food brand content
Creator syndication on food brand content marketing amplifies the recipe hub through Instagram Reels, TikTok, and YouTube Shorts creators paid to post their own version of the brand’s hero recipes. The creator content pulls net-new audiences into the recipe hub through the creator’s Link in Bio or Amazon Storefront tag. The syndication calendar names 12 to 30 creators per quarter with specific recipes assigned to each.
One brand we picked up had a spreadsheet titled “creator outreach 2023” with 47 rows and 3 responses. All 3 responses were auto-replies. The spreadsheet named zero recipes and offered flat rates below 100 dollars per post. Nobody posts a 30-second video for 87 dollars flat. Nobody.
Creator content commercial terms that work
Working creator content commercial terms run 350 to 1,500 dollars flat per post plus a 12 to 25 percent commission on tagged sales across a 30-day window. The commission mechanic pulls creators into follow-up posts because the incremental revenue continues past the initial fee. Mid-tier creators (30k to 150k followers) hit the sweet spot for food brand content because their engagement rate typically runs 4 to 8 percent versus 0.8 to 1.6 percent on mega-creators.
Content brief structure for creator partnerships
The content brief structure for creator partnerships runs a single page: the SKU, the specific recipe or usage occasion, 3 required brand mentions, 3 restricted claims (no health claims on non-medical SKUs), the pricing angle, the affiliate link, and 3 example videos that hit the tone. The brief avoids over-scripting because over-scripted creator content underperforms native creator voice by 40 to 60 percent on engagement rate.
Buyer intent content for food brand blogs
Buyer intent content on food brand blogs covers 8 to 16 pieces targeting explicit purchase-decision queries: “where to buy [brand],” “[brand] subscription vs. one-time,” “best [category] for [use case],” and “[brand] gift bundle.” Every buyer intent piece runs 1,400 to 2,400 words with a comparison table, product cards, and a clear conversion path to the specific SKU that matches the query intent. Buyer intent content converts at 3 to 6 percent versus 1 to 2 percent on recipe content because the shopper landed already planning to buy, not exploring a usage occasion.
Where-to-buy content structure
Where-to-buy content structure covers online (DTC storefront, Amazon, Target.com, Whole Foods online), retail (specific chain locators with the store finder embedded), and international (customs limitations, retailer partners abroad). Every piece names specific retailers, links to the store locator, and includes an FAQ block covering shipping availability, subscription options, and gift card compatibility. Where-to-buy content ranks for branded discovery queries the DTC storefront otherwise loses to competitor affiliate reviews.
Subscription versus one-time comparison content
Subscription versus one-time comparison content converts subscription commitments at 3 to 6 percent because it addresses the price-sensitivity concern head-on with a specific math table. The piece covers the discount structure (15 percent lifetime), the skip-a-month mechanic, the pause-anytime rule, the cancellation policy, and the specific yearly savings for the brand’s average consumption cadence. Cross-reference the retention structure on our food and beverage marketing retainer page.
Content refresh cadence on food brand pillars
Content refresh cadence on food brand content pillars runs a rolling audit every 12 to 24 months by pillar. Recipes get refreshed every 12 months with new photography, updated schema, and any nutrition or ingredient adjustments. Ingredient comparison guides refresh every 18 months to update market data. Sourcing story pages refresh every 24 months to reflect farm partnership changes and new harvest angles. Buyer intent content refreshes every 12 months to update retailer availability and pricing.
Recipe refresh priority order
Recipe refresh priority runs by organic traffic rank. The top 20 recipes by monthly organic sessions get refreshed first (new photography, schema audit, related recipe internal links, updated nutrition). The next 40 get refreshed at 15 months. The remaining recipes get refreshed opportunistically when the ranking slips past position 15 in Google. Skipping the refresh cadence lets recipe rankings drift out of the top 3 inside 18 months as newer competitor recipes take the position.
Schema audit checklist per refresh
The schema audit checklist per refresh runs 8 items: Recipe schema completeness, aggregateRating count and accuracy, nutrition data accuracy, prepTime and cookTime match the recipe body, image URLs valid at CDN, related recipe internal links working, product card SKU URL live, and Google Search Console rich result eligibility validated. This checklist takes 20 minutes per recipe and prevents the schema drift that costs recipe rankings 20 to 40 positions quietly.
Reporting cadence for food brand content marketing
Reporting cadence on food brand content marketing runs a monthly executive report plus a quarterly business review. The monthly report ships in the first business week and covers organic sessions by pillar, top 10 ranking recipes with position trend, ingredient guide ranking movements, sourcing page performance, and organic-attributed DTC revenue. Every number carries a comparison to the prior month and a plain-language interpretation the founder reads in 7 minutes.
Metrics that matter for content marketing
Metrics that matter for food brand content marketing: organic sessions by pillar, recipe rich result impressions in Search Console, organic conversion rate to hero SKU pages, organic-attributed DTC revenue, and top 20 ranking positions by monthly organic sessions. Vanity metrics that do not matter: total pageviews without conversion context, average time on page without conversion attribution, and social share counts. The monthly report skips the vanity block entirely.
Quarterly business review structure
The quarterly business review runs 90 minutes with the founder, head of content, and SEO lead. Agenda: organic traffic trend by pillar, top 10 winning content pieces, top 10 losing content pieces (candidates for refresh or removal), competitive gap analysis against 5 named competitor brands, and next quarter’s content calendar with recipes and ingredient guides queued. According to Ahrefs content marketing research, brands running quarterly content audits outperform brands running annual audits by 40 to 70 percent on organic revenue over a 24-month window.
Internal linking discipline across food brand content
Internal linking discipline across food brand content moves authority from recipe pages toward hero SKU product pages and comparison guides. Every recipe links to the hero SKU it uses inline (once in the ingredient list, once in a bottom call-out card). Every ingredient comparison guide links to 3 to 6 recipes using the winning ingredient plus the hero SKU product page. Every sourcing story links to the 2 to 4 SKUs sourced from that specific farm or cooperative.
Anchor text strategy across recipe hubs
Anchor text on internal links varies across recipe hubs to avoid over-optimization patterns Google penalizes. Exact-match anchor (“single-origin Ethiopian coffee”) runs on 20 to 30 percent of internal links. Partial-match variations (“our Ethiopian roast”) run on 30 to 40 percent. Branded anchors (the SKU name) run on 20 to 30 percent. Generic anchors (“shop the coffee”) fill the remaining 10 to 20 percent. This ratio holds ranking without triggering the over-optimization penalty that shows up on brands that anchor-text-stuff every internal link with the same exact-match keyword. Cross-reference the linking layer on our food and beverage web design page.
Link equity from ingredient guides to SKU pages
Link equity from ingredient guides passes to SKU pages when the guide’s comparison table names the hero SKU in the winning column with a product card, and when the guide’s body links to 3 to 6 recipes that use the winning ingredient. This 3-hop path (guide to recipe to SKU) pushes authority from a high-traffic informational query down to a high-intent transactional page. According to Search Engine Land SEO coverage, informational content that internally links to transactional pages produces 2 to 4 times higher organic revenue than isolated content silos.
Wrapping up content marketing for food brands
Content marketing for food brands is the organic engine that turns a DTC snack, drink, or CPG storefront into a search-driven revenue channel. Recipe hub of 40 to 100 recipes. Ingredient comparison guides at 12 to 24 pieces. Sourcing story pages at 6 to 12 pieces. Buyer intent content at 8 to 16 pieces. Creator syndication calendar with 12 to 30 creators per quarter. Refresh cadence at 12 to 24 months by pillar. Reporting with organic sessions and organic revenue attribution.
If your DTC food brand is running paid social at 20,000 dollars monthly with a broken blog and zero recipe schema, professional content marketing for food brands pays for itself inside the first 90 days on organic traffic captured. Redefine Web ships content marketing inside our monthly retainer packages. Book a call and we will walk through the last three DTC food brands we built recipe hubs for, pillar by pillar.
Internal linking discipline across food brand content moves authority from recipe pages toward hero SKU product pages and comparison guides. Every recipe links to the hero SKU it uses inline (once in the ingredient list, once in a bottom call-out card). Every ingredient comparison guide links to 3 to 6 recipes using the winning ingredient plus the hero SKU product page. Every sourcing story links to the 2 to 4 SKUs sourced from that specific farm or cooperative.
Anchor text strategy across recipe hubs
Anchor text on internal links varies across recipe hubs to avoid over-optimization patterns Google penalizes. Exact-match anchor (“single-origin Ethiopian coffee”) runs on 20 to 30 percent of internal links. Partial-match variations (“our Ethiopian roast”) run on 30 to 40 percent. Branded anchors (the SKU name) run on 20 to 30 percent. Generic anchors (“shop the coffee”) fill the remaining 10 to 20 percent. This ratio holds ranking without triggering the over-optimization penalty that shows up on brands that anchor-text-stuff every internal link with the same exact-match keyword. Cross-reference the linking layer on our food and beverage web design page.
Link equity from ingredient guides to SKU pages
Link equity from ingredient guides passes to SKU pages when the guide’s comparison table names the hero SKU in the winning column with a product card, and when the guide’s body links to 3 to 6 recipes that use the winning ingredient. This 3-hop path (guide to recipe to SKU) pushes authority from a high-traffic informational query down to a high-intent transactional page. According to Search Engine Land SEO coverage, informational content that internally links to transactional pages produces 2 to 4 times higher organic revenue than isolated content silos.
Wrapping up content marketing for food brands
Content marketing for food brands is the organic engine that turns a DTC snack, drink, or CPG storefront into a search-driven revenue channel. Recipe hub of 40 to 100 recipes. Ingredient comparison guides at 12 to 24 pieces. Sourcing story pages at 6 to 12 pieces. Buyer intent content at 8 to 16 pieces. Creator syndication calendar with 12 to 30 creators per quarter. Refresh cadence at 12 to 24 months by pillar. Reporting with organic sessions and organic revenue attribution.
If your DTC food brand is running paid social at 20,000 dollars monthly with a broken blog and zero recipe schema, professional content marketing for food brands pays for itself inside the first 90 days on organic traffic captured. Redefine Web ships content marketing inside our monthly retainer packages. Book a call and we will walk through the last three DTC food brands we built recipe hubs for, pillar by pillar.
Content marketing for food brands starts with a recipe hub because recipe queries account for 40 to 60 percent of high-intent search volume in the food category. Every hero SKU needs 4 to 12 recipes anchored to it, each targeting a specific occasion and audience.
Skip the recipe hub and the brand loses the search real estate that pulls DTC storefront traffic month over month at zero incremental paid cost. Recipe traffic converts at 2 to 4 percent because the shopper landed with usage intent, not passive discovery, which is why food brands win on recipes.
Recipe schema and Google rich result eligibility
Every recipe page ships schema.org Recipe markup including cookTime, prepTime, recipeIngredient, recipeInstructions, nutrition, and aggregateRating. Correctly marked-up recipes qualify for Google’s recipe rich result carousel that pulls 3 to 6 times higher click-through rate than a plain blue link. The schema layer takes 15 minutes per recipe to author and 30 minutes to validate in Google Search Console. Cross-reference the recipe search stack on our food and beverage SEO page.
Recipe hub structure that scales
The recipe hub structure runs 40 to 100 recipes at maturity, organized by hero SKU (4 to 12 recipes per SKU) plus occasion tags (breakfast, weeknight dinner, meal prep, brunch, holiday). Every recipe links back to the hero SKU product page with the SKU embedded in an inline card. The hub earns internal linking value from ingredient comparison guides and the sourcing story pages, which feeds recipe ranking on Google. According to Google Search Central recipe structured data guidance, complete Recipe schema markup is required for eligibility in the recipe carousel and the ingredient search filter.
Pillar structure for food brand content marketing
The pillar structure on content marketing for food brands runs 4 content pillars concurrently: recipe hub (40 to 100 recipes), ingredient comparison guides (12 to 24 guides), sourcing story pages (6 to 12 pages), and buyer intent content (where to buy, subscription vs. one-time, gift bundle guides). Every pillar covers a distinct search intent and every pillar links back to the hero SKU product pages.
Ingredient comparison guide format
Ingredient comparison guides run 1,800 to 3,200 words comparing 2 to 4 ingredient types on 6 to 10 attributes with a comparison table, real-world use case examples, and links to the hero SKU that uses the specific ingredient. Example: organic vs. conventional oats compares nutritional profile, sourcing chain, cost, environmental impact, and taste on a 6-column table. The brand’s SKU appears in the winning column with a product card. These guides rank 3 to 8 months after publication and pull steady-state organic traffic.
Sourcing story pages that build trust
Sourcing story pages name the specific farms, cooperatives, or suppliers the brand sources from, with photos of the farms, farmer quotes, and specific harvest windows. A coffee brand’s Ethiopian farm page ranks for “single-origin Ethiopian coffee” and “Yirgacheffe coffee origin” plus 40 long-tail variations. The sourcing page pulls trust-building traffic that converts at 4 to 6 percent because the shopper landed pattern-matching on transparency and named provenance. Every sourcing page includes farmer or cooperative quotes, harvest dates, and a link back to 3 to 5 hero SKU pages that source from the named supplier.
Vejrø hospitality content case study
Vejrø Resort, a Danish private-island destination with an on-site restaurant focused on organic, locally sourced cuisine, joined us with strong social engagement and no organic-search real estate. Guests found the resort on Instagram but never in Google search for terms like “private island resort Denmark,” “farm-to-table hospitality Denmark,” or “Vejrø restaurant.” The same organic-search gap shows up on DTC food brands running paid social at 20,000 dollars monthly with a broken blog and zero recipe schema.
We built the conversion-focused website with on-site and off-site SEO tuned to the travel-niche keyword clusters, competitor analysis against comparable boutique resorts, and mobile-first design prioritizing guest discovery. Every page carried the structured data qualifying it for Google’s rich results in the hospitality category. Every internal link pushed authority toward the direct-booking conversion path.
Three months later, Vejrø hit 10,000 plus organic visitors, ranked for 200 plus first-page keywords, and pulled a 2.2 percent booking conversion rate from organic traffic. The same pattern applies to content marketing for food brands: recipe schema, ingredient comparison guides, and sourcing story pages pull organic traffic at 20 to 40 percent conversion into hero SKU pages inside 6 months when the content quality matches search intent and every page carries the right structured data markup. Vejrø also proved out the reporting discipline: every monthly report named the exact page, the exact keyword cluster, and the exact search feature (rich result, sitelinks, image pack) driving the incremental organic revenue instead of hiding behind aggregate traffic charts.
Recipe cadence and content calendar for food brands
Recipe cadence on a working food brand content calendar ships 2 to 4 new recipes per week during the first 6 months and drops to 1 per week at maturity. Each recipe takes 4 to 6 hours to produce (write, test in the kitchen, photograph, schema author, publish). At 3 recipes per week, the brand hits 78 recipes inside 6 months plus a backlog of ingredient comparison and sourcing content queued behind the recipe production line.
| Content pillar | Target volume year 1 | Production cost per piece | Refresh cadence |
|---|---|---|---|
| Recipe hub | 40 to 100 recipes | $180 to $320 | Every 12 months |
| Ingredient comparison guides | 12 to 24 guides | $450 to $780 | Every 18 months |
| Sourcing story pages | 6 to 12 pages | $680 to $1,200 | Every 24 months |
| Buyer intent content | 8 to 16 pieces | $220 to $420 | Every 12 months |
Photography as a content calendar constraint
Photography is the actual constraint on recipe cadence, not writing. Every recipe needs 6 to 12 photos: hero shot, ingredient flat lay, prep in progress, plated result, storage, and step shots for the schema markup. A working food brand batches photography 8 recipes at a time to keep the cost per recipe under 200 dollars. Skip the batching and the per-recipe cost climbs to 400 to 600 dollars, which caps recipe cadence at 1 per week and slows organic ranking timeline by 6 months.
Seasonal content calendar planning
Seasonal content calendar planning maps recipes and comparison guides to the seasonal windows they need to rank in. A Christmas cookie recipe needs to publish in September to rank by early December. A Valentine’s chocolate guide needs to publish in November to rank by early February. A back-to-school lunchbox recipe needs to publish in June to rank by late August. The 60-to-90-day ranking curve dictates the calendar.
Creator syndication inside food brand content
Creator syndication on food brand content marketing amplifies the recipe hub through Instagram Reels, TikTok, and YouTube Shorts creators paid to post their own version of the brand’s hero recipes. The creator content pulls net-new audiences into the recipe hub through the creator’s Link in Bio or Amazon Storefront tag. The syndication calendar names 12 to 30 creators per quarter with specific recipes assigned to each.
One brand we picked up had a spreadsheet titled “creator outreach 2023” with 47 rows and 3 responses. All 3 responses were auto-replies. The spreadsheet named zero recipes and offered flat rates below 100 dollars per post. Nobody posts a 30-second video for 87 dollars flat. Nobody.
Creator content commercial terms that work
Working creator content commercial terms run 350 to 1,500 dollars flat per post plus a 12 to 25 percent commission on tagged sales across a 30-day window. The commission mechanic pulls creators into follow-up posts because the incremental revenue continues past the initial fee. Mid-tier creators (30k to 150k followers) hit the sweet spot for food brand content because their engagement rate typically runs 4 to 8 percent versus 0.8 to 1.6 percent on mega-creators.
Content brief structure for creator partnerships
The content brief structure for creator partnerships runs a single page: the SKU, the specific recipe or usage occasion, 3 required brand mentions, 3 restricted claims (no health claims on non-medical SKUs), the pricing angle, the affiliate link, and 3 example videos that hit the tone. The brief avoids over-scripting because over-scripted creator content underperforms native creator voice by 40 to 60 percent on engagement rate.
Buyer intent content for food brand blogs
Buyer intent content on food brand blogs covers 8 to 16 pieces targeting explicit purchase-decision queries: “where to buy [brand],” “[brand] subscription vs. one-time,” “best [category] for [use case],” and “[brand] gift bundle.” Every buyer intent piece runs 1,400 to 2,400 words with a comparison table, product cards, and a clear conversion path to the specific SKU that matches the query intent. Buyer intent content converts at 3 to 6 percent versus 1 to 2 percent on recipe content because the shopper landed already planning to buy, not exploring a usage occasion.
Where-to-buy content structure
Where-to-buy content structure covers online (DTC storefront, Amazon, Target.com, Whole Foods online), retail (specific chain locators with the store finder embedded), and international (customs limitations, retailer partners abroad). Every piece names specific retailers, links to the store locator, and includes an FAQ block covering shipping availability, subscription options, and gift card compatibility. Where-to-buy content ranks for branded discovery queries the DTC storefront otherwise loses to competitor affiliate reviews.
Subscription versus one-time comparison content
Subscription versus one-time comparison content converts subscription commitments at 3 to 6 percent because it addresses the price-sensitivity concern head-on with a specific math table. The piece covers the discount structure (15 percent lifetime), the skip-a-month mechanic, the pause-anytime rule, the cancellation policy, and the specific yearly savings for the brand’s average consumption cadence. Cross-reference the retention structure on our food and beverage marketing retainer page.
Content refresh cadence on food brand pillars
Content refresh cadence on food brand content pillars runs a rolling audit every 12 to 24 months by pillar. Recipes get refreshed every 12 months with new photography, updated schema, and any nutrition or ingredient adjustments. Ingredient comparison guides refresh every 18 months to update market data. Sourcing story pages refresh every 24 months to reflect farm partnership changes and new harvest angles. Buyer intent content refreshes every 12 months to update retailer availability and pricing.
Recipe refresh priority order
Recipe refresh priority runs by organic traffic rank. The top 20 recipes by monthly organic sessions get refreshed first (new photography, schema audit, related recipe internal links, updated nutrition). The next 40 get refreshed at 15 months. The remaining recipes get refreshed opportunistically when the ranking slips past position 15 in Google. Skipping the refresh cadence lets recipe rankings drift out of the top 3 inside 18 months as newer competitor recipes take the position.
Schema audit checklist per refresh
The schema audit checklist per refresh runs 8 items: Recipe schema completeness, aggregateRating count and accuracy, nutrition data accuracy, prepTime and cookTime match the recipe body, image URLs valid at CDN, related recipe internal links working, product card SKU URL live, and Google Search Console rich result eligibility validated. This checklist takes 20 minutes per recipe and prevents the schema drift that costs recipe rankings 20 to 40 positions quietly.
Reporting cadence for food brand content marketing
Reporting cadence on food brand content marketing runs a monthly executive report plus a quarterly business review. The monthly report ships in the first business week and covers organic sessions by pillar, top 10 ranking recipes with position trend, ingredient guide ranking movements, sourcing page performance, and organic-attributed DTC revenue. Every number carries a comparison to the prior month and a plain-language interpretation the founder reads in 7 minutes.
Metrics that matter for content marketing
Metrics that matter for food brand content marketing: organic sessions by pillar, recipe rich result impressions in Search Console, organic conversion rate to hero SKU pages, organic-attributed DTC revenue, and top 20 ranking positions by monthly organic sessions. Vanity metrics that do not matter: total pageviews without conversion context, average time on page without conversion attribution, and social share counts. The monthly report skips the vanity block entirely.
Quarterly business review structure
The quarterly business review runs 90 minutes with the founder, head of content, and SEO lead. Agenda: organic traffic trend by pillar, top 10 winning content pieces, top 10 losing content pieces (candidates for refresh or removal), competitive gap analysis against 5 named competitor brands, and next quarter’s content calendar with recipes and ingredient guides queued. According to Ahrefs content marketing research, brands running quarterly content audits outperform brands running annual audits by 40 to 70 percent on organic revenue over a 24-month window.
Internal linking discipline across food brand content
Internal linking discipline across food brand content moves authority from recipe pages toward hero SKU product pages and comparison guides. Every recipe links to the hero SKU it uses inline (once in the ingredient list, once in a bottom call-out card). Every ingredient comparison guide links to 3 to 6 recipes using the winning ingredient plus the hero SKU product page. Every sourcing story links to the 2 to 4 SKUs sourced from that specific farm or cooperative.
Anchor text strategy across recipe hubs
Anchor text on internal links varies across recipe hubs to avoid over-optimization patterns Google penalizes. Exact-match anchor (“single-origin Ethiopian coffee”) runs on 20 to 30 percent of internal links. Partial-match variations (“our Ethiopian roast”) run on 30 to 40 percent. Branded anchors (the SKU name) run on 20 to 30 percent. Generic anchors (“shop the coffee”) fill the remaining 10 to 20 percent. This ratio holds ranking without triggering the over-optimization penalty that shows up on brands that anchor-text-stuff every internal link with the same exact-match keyword. Cross-reference the linking layer on our food and beverage web design page.
Link equity from ingredient guides to SKU pages
Link equity from ingredient guides passes to SKU pages when the guide’s comparison table names the hero SKU in the winning column with a product card, and when the guide’s body links to 3 to 6 recipes that use the winning ingredient. This 3-hop path (guide to recipe to SKU) pushes authority from a high-traffic informational query down to a high-intent transactional page. According to Search Engine Land SEO coverage, informational content that internally links to transactional pages produces 2 to 4 times higher organic revenue than isolated content silos.
Wrapping up content marketing for food brands
Content marketing for food brands is the organic engine that turns a DTC snack, drink, or CPG storefront into a search-driven revenue channel. Recipe hub of 40 to 100 recipes. Ingredient comparison guides at 12 to 24 pieces. Sourcing story pages at 6 to 12 pieces. Buyer intent content at 8 to 16 pieces. Creator syndication calendar with 12 to 30 creators per quarter. Refresh cadence at 12 to 24 months by pillar. Reporting with organic sessions and organic revenue attribution.
If your DTC food brand is running paid social at 20,000 dollars monthly with a broken blog and zero recipe schema, professional content marketing for food brands pays for itself inside the first 90 days on organic traffic captured. Redefine Web ships content marketing inside our monthly retainer packages. Book a call and we will walk through the last three DTC food brands we built recipe hubs for, pillar by pillar.
Anchor text on internal links varies across recipe hubs to avoid over-optimization patterns Google penalizes. Exact-match anchor (“single-origin Ethiopian coffee”) runs on 20 to 30 percent of internal links. Partial-match variations (“our Ethiopian roast”) run on 30 to 40 percent. Branded anchors (the SKU name) run on 20 to 30 percent. Generic anchors (“shop the coffee”) fill the remaining 10 to 20 percent. This ratio holds ranking without triggering the over-optimization penalty that shows up on brands that anchor-text-stuff every internal link with the same exact-match keyword. Cross-reference the linking layer on our food and beverage web design page.
Link equity from ingredient guides to SKU pages
Link equity from ingredient guides passes to SKU pages when the guide’s comparison table names the hero SKU in the winning column with a product card, and when the guide’s body links to 3 to 6 recipes that use the winning ingredient. This 3-hop path (guide to recipe to SKU) pushes authority from a high-traffic informational query down to a high-intent transactional page. According to Search Engine Land SEO coverage, informational content that internally links to transactional pages produces 2 to 4 times higher organic revenue than isolated content silos.
Wrapping up content marketing for food brands
Content marketing for food brands is the organic engine that turns a DTC snack, drink, or CPG storefront into a search-driven revenue channel. Recipe hub of 40 to 100 recipes. Ingredient comparison guides at 12 to 24 pieces. Sourcing story pages at 6 to 12 pieces. Buyer intent content at 8 to 16 pieces. Creator syndication calendar with 12 to 30 creators per quarter. Refresh cadence at 12 to 24 months by pillar. Reporting with organic sessions and organic revenue attribution.
If your DTC food brand is running paid social at 20,000 dollars monthly with a broken blog and zero recipe schema, professional content marketing for food brands pays for itself inside the first 90 days on organic traffic captured. Redefine Web ships content marketing inside our monthly retainer packages. Book a call and we will walk through the last three DTC food brands we built recipe hubs for, pillar by pillar.
Internal linking discipline across food brand content moves authority from recipe pages toward hero SKU product pages and comparison guides. Every recipe links to the hero SKU it uses inline (once in the ingredient list, once in a bottom call-out card). Every ingredient comparison guide links to 3 to 6 recipes using the winning ingredient plus the hero SKU product page. Every sourcing story links to the 2 to 4 SKUs sourced from that specific farm or cooperative.
Anchor text strategy across recipe hubs
Anchor text on internal links varies across recipe hubs to avoid over-optimization patterns Google penalizes. Exact-match anchor (“single-origin Ethiopian coffee”) runs on 20 to 30 percent of internal links. Partial-match variations (“our Ethiopian roast”) run on 30 to 40 percent. Branded anchors (the SKU name) run on 20 to 30 percent. Generic anchors (“shop the coffee”) fill the remaining 10 to 20 percent. This ratio holds ranking without triggering the over-optimization penalty that shows up on brands that anchor-text-stuff every internal link with the same exact-match keyword. Cross-reference the linking layer on our food and beverage web design page.
Link equity from ingredient guides to SKU pages
Link equity from ingredient guides passes to SKU pages when the guide’s comparison table names the hero SKU in the winning column with a product card, and when the guide’s body links to 3 to 6 recipes that use the winning ingredient. This 3-hop path (guide to recipe to SKU) pushes authority from a high-traffic informational query down to a high-intent transactional page. According to Search Engine Land SEO coverage, informational content that internally links to transactional pages produces 2 to 4 times higher organic revenue than isolated content silos.
Wrapping up content marketing for food brands
Content marketing for food brands is the organic engine that turns a DTC snack, drink, or CPG storefront into a search-driven revenue channel. Recipe hub of 40 to 100 recipes. Ingredient comparison guides at 12 to 24 pieces. Sourcing story pages at 6 to 12 pieces. Buyer intent content at 8 to 16 pieces. Creator syndication calendar with 12 to 30 creators per quarter. Refresh cadence at 12 to 24 months by pillar. Reporting with organic sessions and organic revenue attribution.
If your DTC food brand is running paid social at 20,000 dollars monthly with a broken blog and zero recipe schema, professional content marketing for food brands pays for itself inside the first 90 days on organic traffic captured. Redefine Web ships content marketing inside our monthly retainer packages. Book a call and we will walk through the last three DTC food brands we built recipe hubs for, pillar by pillar.
Content marketing for food brands starts with a recipe hub because recipe queries account for 40 to 60 percent of high-intent search volume in the food category. Every hero SKU needs 4 to 12 recipes anchored to it, each targeting a specific occasion and audience.
Skip the recipe hub and the brand loses the search real estate that pulls DTC storefront traffic month over month at zero incremental paid cost. Recipe traffic converts at 2 to 4 percent because the shopper landed with usage intent, not passive discovery, which is why food brands win on recipes.
Recipe schema and Google rich result eligibility
Every recipe page ships schema.org Recipe markup including cookTime, prepTime, recipeIngredient, recipeInstructions, nutrition, and aggregateRating. Correctly marked-up recipes qualify for Google’s recipe rich result carousel that pulls 3 to 6 times higher click-through rate than a plain blue link. The schema layer takes 15 minutes per recipe to author and 30 minutes to validate in Google Search Console. Cross-reference the recipe search stack on our food and beverage SEO page.
Recipe hub structure that scales
The recipe hub structure runs 40 to 100 recipes at maturity, organized by hero SKU (4 to 12 recipes per SKU) plus occasion tags (breakfast, weeknight dinner, meal prep, brunch, holiday). Every recipe links back to the hero SKU product page with the SKU embedded in an inline card. The hub earns internal linking value from ingredient comparison guides and the sourcing story pages, which feeds recipe ranking on Google. According to Google Search Central recipe structured data guidance, complete Recipe schema markup is required for eligibility in the recipe carousel and the ingredient search filter.
Pillar structure for food brand content marketing
The pillar structure on content marketing for food brands runs 4 content pillars concurrently: recipe hub (40 to 100 recipes), ingredient comparison guides (12 to 24 guides), sourcing story pages (6 to 12 pages), and buyer intent content (where to buy, subscription vs. one-time, gift bundle guides). Every pillar covers a distinct search intent and every pillar links back to the hero SKU product pages.
Ingredient comparison guide format
Ingredient comparison guides run 1,800 to 3,200 words comparing 2 to 4 ingredient types on 6 to 10 attributes with a comparison table, real-world use case examples, and links to the hero SKU that uses the specific ingredient. Example: organic vs. conventional oats compares nutritional profile, sourcing chain, cost, environmental impact, and taste on a 6-column table. The brand’s SKU appears in the winning column with a product card. These guides rank 3 to 8 months after publication and pull steady-state organic traffic.
Sourcing story pages that build trust
Sourcing story pages name the specific farms, cooperatives, or suppliers the brand sources from, with photos of the farms, farmer quotes, and specific harvest windows. A coffee brand’s Ethiopian farm page ranks for “single-origin Ethiopian coffee” and “Yirgacheffe coffee origin” plus 40 long-tail variations. The sourcing page pulls trust-building traffic that converts at 4 to 6 percent because the shopper landed pattern-matching on transparency and named provenance. Every sourcing page includes farmer or cooperative quotes, harvest dates, and a link back to 3 to 5 hero SKU pages that source from the named supplier.
Vejrø hospitality content case study
Vejrø Resort, a Danish private-island destination with an on-site restaurant focused on organic, locally sourced cuisine, joined us with strong social engagement and no organic-search real estate. Guests found the resort on Instagram but never in Google search for terms like “private island resort Denmark,” “farm-to-table hospitality Denmark,” or “Vejrø restaurant.” The same organic-search gap shows up on DTC food brands running paid social at 20,000 dollars monthly with a broken blog and zero recipe schema.
We built the conversion-focused website with on-site and off-site SEO tuned to the travel-niche keyword clusters, competitor analysis against comparable boutique resorts, and mobile-first design prioritizing guest discovery. Every page carried the structured data qualifying it for Google’s rich results in the hospitality category. Every internal link pushed authority toward the direct-booking conversion path.
Three months later, Vejrø hit 10,000 plus organic visitors, ranked for 200 plus first-page keywords, and pulled a 2.2 percent booking conversion rate from organic traffic. The same pattern applies to content marketing for food brands: recipe schema, ingredient comparison guides, and sourcing story pages pull organic traffic at 20 to 40 percent conversion into hero SKU pages inside 6 months when the content quality matches search intent and every page carries the right structured data markup. Vejrø also proved out the reporting discipline: every monthly report named the exact page, the exact keyword cluster, and the exact search feature (rich result, sitelinks, image pack) driving the incremental organic revenue instead of hiding behind aggregate traffic charts.
Recipe cadence and content calendar for food brands
Recipe cadence on a working food brand content calendar ships 2 to 4 new recipes per week during the first 6 months and drops to 1 per week at maturity. Each recipe takes 4 to 6 hours to produce (write, test in the kitchen, photograph, schema author, publish). At 3 recipes per week, the brand hits 78 recipes inside 6 months plus a backlog of ingredient comparison and sourcing content queued behind the recipe production line.
| Content pillar | Target volume year 1 | Production cost per piece | Refresh cadence |
|---|---|---|---|
| Recipe hub | 40 to 100 recipes | $180 to $320 | Every 12 months |
| Ingredient comparison guides | 12 to 24 guides | $450 to $780 | Every 18 months |
| Sourcing story pages | 6 to 12 pages | $680 to $1,200 | Every 24 months |
| Buyer intent content | 8 to 16 pieces | $220 to $420 | Every 12 months |
Photography as a content calendar constraint
Photography is the actual constraint on recipe cadence, not writing. Every recipe needs 6 to 12 photos: hero shot, ingredient flat lay, prep in progress, plated result, storage, and step shots for the schema markup. A working food brand batches photography 8 recipes at a time to keep the cost per recipe under 200 dollars. Skip the batching and the per-recipe cost climbs to 400 to 600 dollars, which caps recipe cadence at 1 per week and slows organic ranking timeline by 6 months.
Seasonal content calendar planning
Seasonal content calendar planning maps recipes and comparison guides to the seasonal windows they need to rank in. A Christmas cookie recipe needs to publish in September to rank by early December. A Valentine’s chocolate guide needs to publish in November to rank by early February. A back-to-school lunchbox recipe needs to publish in June to rank by late August. The 60-to-90-day ranking curve dictates the calendar.
Creator syndication inside food brand content
Creator syndication on food brand content marketing amplifies the recipe hub through Instagram Reels, TikTok, and YouTube Shorts creators paid to post their own version of the brand’s hero recipes. The creator content pulls net-new audiences into the recipe hub through the creator’s Link in Bio or Amazon Storefront tag. The syndication calendar names 12 to 30 creators per quarter with specific recipes assigned to each.
One brand we picked up had a spreadsheet titled “creator outreach 2023” with 47 rows and 3 responses. All 3 responses were auto-replies. The spreadsheet named zero recipes and offered flat rates below 100 dollars per post. Nobody posts a 30-second video for 87 dollars flat. Nobody.
Creator content commercial terms that work
Working creator content commercial terms run 350 to 1,500 dollars flat per post plus a 12 to 25 percent commission on tagged sales across a 30-day window. The commission mechanic pulls creators into follow-up posts because the incremental revenue continues past the initial fee. Mid-tier creators (30k to 150k followers) hit the sweet spot for food brand content because their engagement rate typically runs 4 to 8 percent versus 0.8 to 1.6 percent on mega-creators.
Content brief structure for creator partnerships
The content brief structure for creator partnerships runs a single page: the SKU, the specific recipe or usage occasion, 3 required brand mentions, 3 restricted claims (no health claims on non-medical SKUs), the pricing angle, the affiliate link, and 3 example videos that hit the tone. The brief avoids over-scripting because over-scripted creator content underperforms native creator voice by 40 to 60 percent on engagement rate.
Buyer intent content for food brand blogs
Buyer intent content on food brand blogs covers 8 to 16 pieces targeting explicit purchase-decision queries: “where to buy [brand],” “[brand] subscription vs. one-time,” “best [category] for [use case],” and “[brand] gift bundle.” Every buyer intent piece runs 1,400 to 2,400 words with a comparison table, product cards, and a clear conversion path to the specific SKU that matches the query intent. Buyer intent content converts at 3 to 6 percent versus 1 to 2 percent on recipe content because the shopper landed already planning to buy, not exploring a usage occasion.
Where-to-buy content structure
Where-to-buy content structure covers online (DTC storefront, Amazon, Target.com, Whole Foods online), retail (specific chain locators with the store finder embedded), and international (customs limitations, retailer partners abroad). Every piece names specific retailers, links to the store locator, and includes an FAQ block covering shipping availability, subscription options, and gift card compatibility. Where-to-buy content ranks for branded discovery queries the DTC storefront otherwise loses to competitor affiliate reviews.
Subscription versus one-time comparison content
Subscription versus one-time comparison content converts subscription commitments at 3 to 6 percent because it addresses the price-sensitivity concern head-on with a specific math table. The piece covers the discount structure (15 percent lifetime), the skip-a-month mechanic, the pause-anytime rule, the cancellation policy, and the specific yearly savings for the brand’s average consumption cadence. Cross-reference the retention structure on our food and beverage marketing retainer page.
Content refresh cadence on food brand pillars
Content refresh cadence on food brand content pillars runs a rolling audit every 12 to 24 months by pillar. Recipes get refreshed every 12 months with new photography, updated schema, and any nutrition or ingredient adjustments. Ingredient comparison guides refresh every 18 months to update market data. Sourcing story pages refresh every 24 months to reflect farm partnership changes and new harvest angles. Buyer intent content refreshes every 12 months to update retailer availability and pricing.
Recipe refresh priority order
Recipe refresh priority runs by organic traffic rank. The top 20 recipes by monthly organic sessions get refreshed first (new photography, schema audit, related recipe internal links, updated nutrition). The next 40 get refreshed at 15 months. The remaining recipes get refreshed opportunistically when the ranking slips past position 15 in Google. Skipping the refresh cadence lets recipe rankings drift out of the top 3 inside 18 months as newer competitor recipes take the position.
Schema audit checklist per refresh
The schema audit checklist per refresh runs 8 items: Recipe schema completeness, aggregateRating count and accuracy, nutrition data accuracy, prepTime and cookTime match the recipe body, image URLs valid at CDN, related recipe internal links working, product card SKU URL live, and Google Search Console rich result eligibility validated. This checklist takes 20 minutes per recipe and prevents the schema drift that costs recipe rankings 20 to 40 positions quietly.
Reporting cadence for food brand content marketing
Reporting cadence on food brand content marketing runs a monthly executive report plus a quarterly business review. The monthly report ships in the first business week and covers organic sessions by pillar, top 10 ranking recipes with position trend, ingredient guide ranking movements, sourcing page performance, and organic-attributed DTC revenue. Every number carries a comparison to the prior month and a plain-language interpretation the founder reads in 7 minutes.
Metrics that matter for content marketing
Metrics that matter for food brand content marketing: organic sessions by pillar, recipe rich result impressions in Search Console, organic conversion rate to hero SKU pages, organic-attributed DTC revenue, and top 20 ranking positions by monthly organic sessions. Vanity metrics that do not matter: total pageviews without conversion context, average time on page without conversion attribution, and social share counts. The monthly report skips the vanity block entirely.
Quarterly business review structure
The quarterly business review runs 90 minutes with the founder, head of content, and SEO lead. Agenda: organic traffic trend by pillar, top 10 winning content pieces, top 10 losing content pieces (candidates for refresh or removal), competitive gap analysis against 5 named competitor brands, and next quarter’s content calendar with recipes and ingredient guides queued. According to Ahrefs content marketing research, brands running quarterly content audits outperform brands running annual audits by 40 to 70 percent on organic revenue over a 24-month window.
Internal linking discipline across food brand content
Internal linking discipline across food brand content moves authority from recipe pages toward hero SKU product pages and comparison guides. Every recipe links to the hero SKU it uses inline (once in the ingredient list, once in a bottom call-out card). Every ingredient comparison guide links to 3 to 6 recipes using the winning ingredient plus the hero SKU product page. Every sourcing story links to the 2 to 4 SKUs sourced from that specific farm or cooperative.
Anchor text strategy across recipe hubs
Anchor text on internal links varies across recipe hubs to avoid over-optimization patterns Google penalizes. Exact-match anchor (“single-origin Ethiopian coffee”) runs on 20 to 30 percent of internal links. Partial-match variations (“our Ethiopian roast”) run on 30 to 40 percent. Branded anchors (the SKU name) run on 20 to 30 percent. Generic anchors (“shop the coffee”) fill the remaining 10 to 20 percent. This ratio holds ranking without triggering the over-optimization penalty that shows up on brands that anchor-text-stuff every internal link with the same exact-match keyword. Cross-reference the linking layer on our food and beverage web design page.
Link equity from ingredient guides to SKU pages
Link equity from ingredient guides passes to SKU pages when the guide’s comparison table names the hero SKU in the winning column with a product card, and when the guide’s body links to 3 to 6 recipes that use the winning ingredient. This 3-hop path (guide to recipe to SKU) pushes authority from a high-traffic informational query down to a high-intent transactional page. According to Search Engine Land SEO coverage, informational content that internally links to transactional pages produces 2 to 4 times higher organic revenue than isolated content silos.
Wrapping up content marketing for food brands
Content marketing for food brands is the organic engine that turns a DTC snack, drink, or CPG storefront into a search-driven revenue channel. Recipe hub of 40 to 100 recipes. Ingredient comparison guides at 12 to 24 pieces. Sourcing story pages at 6 to 12 pieces. Buyer intent content at 8 to 16 pieces. Creator syndication calendar with 12 to 30 creators per quarter. Refresh cadence at 12 to 24 months by pillar. Reporting with organic sessions and organic revenue attribution.
If your DTC food brand is running paid social at 20,000 dollars monthly with a broken blog and zero recipe schema, professional content marketing for food brands pays for itself inside the first 90 days on organic traffic captured. Redefine Web ships content marketing inside our monthly retainer packages. Book a call and we will walk through the last three DTC food brands we built recipe hubs for, pillar by pillar.
Content marketing for food brands starts with a recipe hub because recipe queries account for 40 to 60 percent of high-intent search volume in the food category. Every hero SKU needs 4 to 12 recipes anchored to it, each targeting a specific occasion and audience.
Skip the recipe hub and the brand loses the search real estate that pulls DTC storefront traffic month over month at zero incremental paid cost. Recipe traffic converts at 2 to 4 percent because the shopper landed with usage intent, not passive discovery, which is why food brands win on recipes.
Recipe schema and Google rich result eligibility
Every recipe page ships schema.org Recipe markup including cookTime, prepTime, recipeIngredient, recipeInstructions, nutrition, and aggregateRating. Correctly marked-up recipes qualify for Google’s recipe rich result carousel that pulls 3 to 6 times higher click-through rate than a plain blue link. The schema layer takes 15 minutes per recipe to author and 30 minutes to validate in Google Search Console. Cross-reference the recipe search stack on our food and beverage SEO page.
Recipe hub structure that scales
The recipe hub structure runs 40 to 100 recipes at maturity, organized by hero SKU (4 to 12 recipes per SKU) plus occasion tags (breakfast, weeknight dinner, meal prep, brunch, holiday). Every recipe links back to the hero SKU product page with the SKU embedded in an inline card. The hub earns internal linking value from ingredient comparison guides and the sourcing story pages, which feeds recipe ranking on Google. According to Google Search Central recipe structured data guidance, complete Recipe schema markup is required for eligibility in the recipe carousel and the ingredient search filter.
Pillar structure for food brand content marketing
The pillar structure on content marketing for food brands runs 4 content pillars concurrently: recipe hub (40 to 100 recipes), ingredient comparison guides (12 to 24 guides), sourcing story pages (6 to 12 pages), and buyer intent content (where to buy, subscription vs. one-time, gift bundle guides). Every pillar covers a distinct search intent and every pillar links back to the hero SKU product pages.
Ingredient comparison guide format
Ingredient comparison guides run 1,800 to 3,200 words comparing 2 to 4 ingredient types on 6 to 10 attributes with a comparison table, real-world use case examples, and links to the hero SKU that uses the specific ingredient. Example: organic vs. conventional oats compares nutritional profile, sourcing chain, cost, environmental impact, and taste on a 6-column table. The brand’s SKU appears in the winning column with a product card. These guides rank 3 to 8 months after publication and pull steady-state organic traffic.
Sourcing story pages that build trust
Sourcing story pages name the specific farms, cooperatives, or suppliers the brand sources from, with photos of the farms, farmer quotes, and specific harvest windows. A coffee brand’s Ethiopian farm page ranks for “single-origin Ethiopian coffee” and “Yirgacheffe coffee origin” plus 40 long-tail variations. The sourcing page pulls trust-building traffic that converts at 4 to 6 percent because the shopper landed pattern-matching on transparency and named provenance. Every sourcing page includes farmer or cooperative quotes, harvest dates, and a link back to 3 to 5 hero SKU pages that source from the named supplier.
Vejrø hospitality content case study
Vejrø Resort, a Danish private-island destination with an on-site restaurant focused on organic, locally sourced cuisine, joined us with strong social engagement and no organic-search real estate. Guests found the resort on Instagram but never in Google search for terms like “private island resort Denmark,” “farm-to-table hospitality Denmark,” or “Vejrø restaurant.” The same organic-search gap shows up on DTC food brands running paid social at 20,000 dollars monthly with a broken blog and zero recipe schema.
We built the conversion-focused website with on-site and off-site SEO tuned to the travel-niche keyword clusters, competitor analysis against comparable boutique resorts, and mobile-first design prioritizing guest discovery. Every page carried the structured data qualifying it for Google’s rich results in the hospitality category. Every internal link pushed authority toward the direct-booking conversion path.
Three months later, Vejrø hit 10,000 plus organic visitors, ranked for 200 plus first-page keywords, and pulled a 2.2 percent booking conversion rate from organic traffic. The same pattern applies to content marketing for food brands: recipe schema, ingredient comparison guides, and sourcing story pages pull organic traffic at 20 to 40 percent conversion into hero SKU pages inside 6 months when the content quality matches search intent and every page carries the right structured data markup. Vejrø also proved out the reporting discipline: every monthly report named the exact page, the exact keyword cluster, and the exact search feature (rich result, sitelinks, image pack) driving the incremental organic revenue instead of hiding behind aggregate traffic charts.
Recipe cadence and content calendar for food brands
Recipe cadence on a working food brand content calendar ships 2 to 4 new recipes per week during the first 6 months and drops to 1 per week at maturity. Each recipe takes 4 to 6 hours to produce (write, test in the kitchen, photograph, schema author, publish). At 3 recipes per week, the brand hits 78 recipes inside 6 months plus a backlog of ingredient comparison and sourcing content queued behind the recipe production line.
| Content pillar | Target volume year 1 | Production cost per piece | Refresh cadence |
|---|---|---|---|
| Recipe hub | 40 to 100 recipes | $180 to $320 | Every 12 months |
| Ingredient comparison guides | 12 to 24 guides | $450 to $780 | Every 18 months |
| Sourcing story pages | 6 to 12 pages | $680 to $1,200 | Every 24 months |
| Buyer intent content | 8 to 16 pieces | $220 to $420 | Every 12 months |
Photography as a content calendar constraint
Photography is the actual constraint on recipe cadence, not writing. Every recipe needs 6 to 12 photos: hero shot, ingredient flat lay, prep in progress, plated result, storage, and step shots for the schema markup. A working food brand batches photography 8 recipes at a time to keep the cost per recipe under 200 dollars. Skip the batching and the per-recipe cost climbs to 400 to 600 dollars, which caps recipe cadence at 1 per week and slows organic ranking timeline by 6 months.
Seasonal content calendar planning
Seasonal content calendar planning maps recipes and comparison guides to the seasonal windows they need to rank in. A Christmas cookie recipe needs to publish in September to rank by early December. A Valentine’s chocolate guide needs to publish in November to rank by early February. A back-to-school lunchbox recipe needs to publish in June to rank by late August. The 60-to-90-day ranking curve dictates the calendar.
Creator syndication inside food brand content
Creator syndication on food brand content marketing amplifies the recipe hub through Instagram Reels, TikTok, and YouTube Shorts creators paid to post their own version of the brand’s hero recipes. The creator content pulls net-new audiences into the recipe hub through the creator’s Link in Bio or Amazon Storefront tag. The syndication calendar names 12 to 30 creators per quarter with specific recipes assigned to each.
One brand we picked up had a spreadsheet titled “creator outreach 2023” with 47 rows and 3 responses. All 3 responses were auto-replies. The spreadsheet named zero recipes and offered flat rates below 100 dollars per post. Nobody posts a 30-second video for 87 dollars flat. Nobody.
Creator content commercial terms that work
Working creator content commercial terms run 350 to 1,500 dollars flat per post plus a 12 to 25 percent commission on tagged sales across a 30-day window. The commission mechanic pulls creators into follow-up posts because the incremental revenue continues past the initial fee. Mid-tier creators (30k to 150k followers) hit the sweet spot for food brand content because their engagement rate typically runs 4 to 8 percent versus 0.8 to 1.6 percent on mega-creators.
Content brief structure for creator partnerships
The content brief structure for creator partnerships runs a single page: the SKU, the specific recipe or usage occasion, 3 required brand mentions, 3 restricted claims (no health claims on non-medical SKUs), the pricing angle, the affiliate link, and 3 example videos that hit the tone. The brief avoids over-scripting because over-scripted creator content underperforms native creator voice by 40 to 60 percent on engagement rate.
Buyer intent content for food brand blogs
Buyer intent content on food brand blogs covers 8 to 16 pieces targeting explicit purchase-decision queries: “where to buy [brand],” “[brand] subscription vs. one-time,” “best [category] for [use case],” and “[brand] gift bundle.” Every buyer intent piece runs 1,400 to 2,400 words with a comparison table, product cards, and a clear conversion path to the specific SKU that matches the query intent. Buyer intent content converts at 3 to 6 percent versus 1 to 2 percent on recipe content because the shopper landed already planning to buy, not exploring a usage occasion.
Where-to-buy content structure
Where-to-buy content structure covers online (DTC storefront, Amazon, Target.com, Whole Foods online), retail (specific chain locators with the store finder embedded), and international (customs limitations, retailer partners abroad). Every piece names specific retailers, links to the store locator, and includes an FAQ block covering shipping availability, subscription options, and gift card compatibility. Where-to-buy content ranks for branded discovery queries the DTC storefront otherwise loses to competitor affiliate reviews.
Subscription versus one-time comparison content
Subscription versus one-time comparison content converts subscription commitments at 3 to 6 percent because it addresses the price-sensitivity concern head-on with a specific math table. The piece covers the discount structure (15 percent lifetime), the skip-a-month mechanic, the pause-anytime rule, the cancellation policy, and the specific yearly savings for the brand’s average consumption cadence. Cross-reference the retention structure on our food and beverage marketing retainer page.
Content refresh cadence on food brand pillars
Content refresh cadence on food brand content pillars runs a rolling audit every 12 to 24 months by pillar. Recipes get refreshed every 12 months with new photography, updated schema, and any nutrition or ingredient adjustments. Ingredient comparison guides refresh every 18 months to update market data. Sourcing story pages refresh every 24 months to reflect farm partnership changes and new harvest angles. Buyer intent content refreshes every 12 months to update retailer availability and pricing.
Recipe refresh priority order
Recipe refresh priority runs by organic traffic rank. The top 20 recipes by monthly organic sessions get refreshed first (new photography, schema audit, related recipe internal links, updated nutrition). The next 40 get refreshed at 15 months. The remaining recipes get refreshed opportunistically when the ranking slips past position 15 in Google. Skipping the refresh cadence lets recipe rankings drift out of the top 3 inside 18 months as newer competitor recipes take the position.
Schema audit checklist per refresh
The schema audit checklist per refresh runs 8 items: Recipe schema completeness, aggregateRating count and accuracy, nutrition data accuracy, prepTime and cookTime match the recipe body, image URLs valid at CDN, related recipe internal links working, product card SKU URL live, and Google Search Console rich result eligibility validated. This checklist takes 20 minutes per recipe and prevents the schema drift that costs recipe rankings 20 to 40 positions quietly.
Reporting cadence for food brand content marketing
Reporting cadence on food brand content marketing runs a monthly executive report plus a quarterly business review. The monthly report ships in the first business week and covers organic sessions by pillar, top 10 ranking recipes with position trend, ingredient guide ranking movements, sourcing page performance, and organic-attributed DTC revenue. Every number carries a comparison to the prior month and a plain-language interpretation the founder reads in 7 minutes.
Metrics that matter for content marketing
Metrics that matter for food brand content marketing: organic sessions by pillar, recipe rich result impressions in Search Console, organic conversion rate to hero SKU pages, organic-attributed DTC revenue, and top 20 ranking positions by monthly organic sessions. Vanity metrics that do not matter: total pageviews without conversion context, average time on page without conversion attribution, and social share counts. The monthly report skips the vanity block entirely.
Quarterly business review structure
The quarterly business review runs 90 minutes with the founder, head of content, and SEO lead. Agenda: organic traffic trend by pillar, top 10 winning content pieces, top 10 losing content pieces (candidates for refresh or removal), competitive gap analysis against 5 named competitor brands, and next quarter’s content calendar with recipes and ingredient guides queued. According to Ahrefs content marketing research, brands running quarterly content audits outperform brands running annual audits by 40 to 70 percent on organic revenue over a 24-month window.
Internal linking discipline across food brand content
Internal linking discipline across food brand content moves authority from recipe pages toward hero SKU product pages and comparison guides. Every recipe links to the hero SKU it uses inline (once in the ingredient list, once in a bottom call-out card). Every ingredient comparison guide links to 3 to 6 recipes using the winning ingredient plus the hero SKU product page. Every sourcing story links to the 2 to 4 SKUs sourced from that specific farm or cooperative.
Anchor text strategy across recipe hubs
Anchor text on internal links varies across recipe hubs to avoid over-optimization patterns Google penalizes. Exact-match anchor (“single-origin Ethiopian coffee”) runs on 20 to 30 percent of internal links. Partial-match variations (“our Ethiopian roast”) run on 30 to 40 percent. Branded anchors (the SKU name) run on 20 to 30 percent. Generic anchors (“shop the coffee”) fill the remaining 10 to 20 percent. This ratio holds ranking without triggering the over-optimization penalty that shows up on brands that anchor-text-stuff every internal link with the same exact-match keyword. Cross-reference the linking layer on our food and beverage web design page.
Link equity from ingredient guides to SKU pages
Link equity from ingredient guides passes to SKU pages when the guide’s comparison table names the hero SKU in the winning column with a product card, and when the guide’s body links to 3 to 6 recipes that use the winning ingredient. This 3-hop path (guide to recipe to SKU) pushes authority from a high-traffic informational query down to a high-intent transactional page. According to Search Engine Land SEO coverage, informational content that internally links to transactional pages produces 2 to 4 times higher organic revenue than isolated content silos.
Wrapping up content marketing for food brands
Content marketing for food brands is the organic engine that turns a DTC snack, drink, or CPG storefront into a search-driven revenue channel. Recipe hub of 40 to 100 recipes. Ingredient comparison guides at 12 to 24 pieces. Sourcing story pages at 6 to 12 pieces. Buyer intent content at 8 to 16 pieces. Creator syndication calendar with 12 to 30 creators per quarter. Refresh cadence at 12 to 24 months by pillar. Reporting with organic sessions and organic revenue attribution.
If your DTC food brand is running paid social at 20,000 dollars monthly with a broken blog and zero recipe schema, professional content marketing for food brands pays for itself inside the first 90 days on organic traffic captured. Redefine Web ships content marketing inside our monthly retainer packages. Book a call and we will walk through the last three DTC food brands we built recipe hubs for, pillar by pillar.
Content marketing for food brands starts with a recipe hub because recipe queries account for 40 to 60 percent of high-intent search volume in the food category. Every hero SKU needs 4 to 12 recipes anchored to it, each targeting a specific occasion and audience.
Skip the recipe hub and the brand loses the search real estate that pulls DTC storefront traffic month over month at zero incremental paid cost. Recipe traffic converts at 2 to 4 percent because the shopper landed with usage intent, not passive discovery, which is why food brands win on recipes.
Recipe schema and Google rich result eligibility
Every recipe page ships schema.org Recipe markup including cookTime, prepTime, recipeIngredient, recipeInstructions, nutrition, and aggregateRating. Correctly marked-up recipes qualify for Google’s recipe rich result carousel that pulls 3 to 6 times higher click-through rate than a plain blue link. The schema layer takes 15 minutes per recipe to author and 30 minutes to validate in Google Search Console. Cross-reference the recipe search stack on our food and beverage SEO page.
Recipe hub structure that scales
The recipe hub structure runs 40 to 100 recipes at maturity, organized by hero SKU (4 to 12 recipes per SKU) plus occasion tags (breakfast, weeknight dinner, meal prep, brunch, holiday). Every recipe links back to the hero SKU product page with the SKU embedded in an inline card. The hub earns internal linking value from ingredient comparison guides and the sourcing story pages, which feeds recipe ranking on Google. According to Google Search Central recipe structured data guidance, complete Recipe schema markup is required for eligibility in the recipe carousel and the ingredient search filter.
Pillar structure for food brand content marketing
The pillar structure on content marketing for food brands runs 4 content pillars concurrently: recipe hub (40 to 100 recipes), ingredient comparison guides (12 to 24 guides), sourcing story pages (6 to 12 pages), and buyer intent content (where to buy, subscription vs. one-time, gift bundle guides). Every pillar covers a distinct search intent and every pillar links back to the hero SKU product pages.
Ingredient comparison guide format
Ingredient comparison guides run 1,800 to 3,200 words comparing 2 to 4 ingredient types on 6 to 10 attributes with a comparison table, real-world use case examples, and links to the hero SKU that uses the specific ingredient. Example: organic vs. conventional oats compares nutritional profile, sourcing chain, cost, environmental impact, and taste on a 6-column table. The brand’s SKU appears in the winning column with a product card. These guides rank 3 to 8 months after publication and pull steady-state organic traffic.
Sourcing story pages that build trust
Sourcing story pages name the specific farms, cooperatives, or suppliers the brand sources from, with photos of the farms, farmer quotes, and specific harvest windows. A coffee brand’s Ethiopian farm page ranks for “single-origin Ethiopian coffee” and “Yirgacheffe coffee origin” plus 40 long-tail variations. The sourcing page pulls trust-building traffic that converts at 4 to 6 percent because the shopper landed pattern-matching on transparency and named provenance. Every sourcing page includes farmer or cooperative quotes, harvest dates, and a link back to 3 to 5 hero SKU pages that source from the named supplier.
Vejrø hospitality content case study
Vejrø Resort, a Danish private-island destination with an on-site restaurant focused on organic, locally sourced cuisine, joined us with strong social engagement and no organic-search real estate. Guests found the resort on Instagram but never in Google search for terms like “private island resort Denmark,” “farm-to-table hospitality Denmark,” or “Vejrø restaurant.” The same organic-search gap shows up on DTC food brands running paid social at 20,000 dollars monthly with a broken blog and zero recipe schema.
We built the conversion-focused website with on-site and off-site SEO tuned to the travel-niche keyword clusters, competitor analysis against comparable boutique resorts, and mobile-first design prioritizing guest discovery. Every page carried the structured data qualifying it for Google’s rich results in the hospitality category. Every internal link pushed authority toward the direct-booking conversion path.
Three months later, Vejrø hit 10,000 plus organic visitors, ranked for 200 plus first-page keywords, and pulled a 2.2 percent booking conversion rate from organic traffic. The same pattern applies to content marketing for food brands: recipe schema, ingredient comparison guides, and sourcing story pages pull organic traffic at 20 to 40 percent conversion into hero SKU pages inside 6 months when the content quality matches search intent and every page carries the right structured data markup. Vejrø also proved out the reporting discipline: every monthly report named the exact page, the exact keyword cluster, and the exact search feature (rich result, sitelinks, image pack) driving the incremental organic revenue instead of hiding behind aggregate traffic charts.
Recipe cadence and content calendar for food brands
Recipe cadence on a working food brand content calendar ships 2 to 4 new recipes per week during the first 6 months and drops to 1 per week at maturity. Each recipe takes 4 to 6 hours to produce (write, test in the kitchen, photograph, schema author, publish). At 3 recipes per week, the brand hits 78 recipes inside 6 months plus a backlog of ingredient comparison and sourcing content queued behind the recipe production line.
| Content pillar | Target volume year 1 | Production cost per piece | Refresh cadence |
|---|---|---|---|
| Recipe hub | 40 to 100 recipes | $180 to $320 | Every 12 months |
| Ingredient comparison guides | 12 to 24 guides | $450 to $780 | Every 18 months |
| Sourcing story pages | 6 to 12 pages | $680 to $1,200 | Every 24 months |
| Buyer intent content | 8 to 16 pieces | $220 to $420 | Every 12 months |
Photography as a content calendar constraint
Photography is the actual constraint on recipe cadence, not writing. Every recipe needs 6 to 12 photos: hero shot, ingredient flat lay, prep in progress, plated result, storage, and step shots for the schema markup. A working food brand batches photography 8 recipes at a time to keep the cost per recipe under 200 dollars. Skip the batching and the per-recipe cost climbs to 400 to 600 dollars, which caps recipe cadence at 1 per week and slows organic ranking timeline by 6 months.
Seasonal content calendar planning
Seasonal content calendar planning maps recipes and comparison guides to the seasonal windows they need to rank in. A Christmas cookie recipe needs to publish in September to rank by early December. A Valentine’s chocolate guide needs to publish in November to rank by early February. A back-to-school lunchbox recipe needs to publish in June to rank by late August. The 60-to-90-day ranking curve dictates the calendar.
Creator syndication inside food brand content
Creator syndication on food brand content marketing amplifies the recipe hub through Instagram Reels, TikTok, and YouTube Shorts creators paid to post their own version of the brand’s hero recipes. The creator content pulls net-new audiences into the recipe hub through the creator’s Link in Bio or Amazon Storefront tag. The syndication calendar names 12 to 30 creators per quarter with specific recipes assigned to each.
One brand we picked up had a spreadsheet titled “creator outreach 2023” with 47 rows and 3 responses. All 3 responses were auto-replies. The spreadsheet named zero recipes and offered flat rates below 100 dollars per post. Nobody posts a 30-second video for 87 dollars flat. Nobody.
Creator content commercial terms that work
Working creator content commercial terms run 350 to 1,500 dollars flat per post plus a 12 to 25 percent commission on tagged sales across a 30-day window. The commission mechanic pulls creators into follow-up posts because the incremental revenue continues past the initial fee. Mid-tier creators (30k to 150k followers) hit the sweet spot for food brand content because their engagement rate typically runs 4 to 8 percent versus 0.8 to 1.6 percent on mega-creators.
Content brief structure for creator partnerships
The content brief structure for creator partnerships runs a single page: the SKU, the specific recipe or usage occasion, 3 required brand mentions, 3 restricted claims (no health claims on non-medical SKUs), the pricing angle, the affiliate link, and 3 example videos that hit the tone. The brief avoids over-scripting because over-scripted creator content underperforms native creator voice by 40 to 60 percent on engagement rate.
Buyer intent content for food brand blogs
Buyer intent content on food brand blogs covers 8 to 16 pieces targeting explicit purchase-decision queries: “where to buy [brand],” “[brand] subscription vs. one-time,” “best [category] for [use case],” and “[brand] gift bundle.” Every buyer intent piece runs 1,400 to 2,400 words with a comparison table, product cards, and a clear conversion path to the specific SKU that matches the query intent. Buyer intent content converts at 3 to 6 percent versus 1 to 2 percent on recipe content because the shopper landed already planning to buy, not exploring a usage occasion.
Where-to-buy content structure
Where-to-buy content structure covers online (DTC storefront, Amazon, Target.com, Whole Foods online), retail (specific chain locators with the store finder embedded), and international (customs limitations, retailer partners abroad). Every piece names specific retailers, links to the store locator, and includes an FAQ block covering shipping availability, subscription options, and gift card compatibility. Where-to-buy content ranks for branded discovery queries the DTC storefront otherwise loses to competitor affiliate reviews.
Subscription versus one-time comparison content
Subscription versus one-time comparison content converts subscription commitments at 3 to 6 percent because it addresses the price-sensitivity concern head-on with a specific math table. The piece covers the discount structure (15 percent lifetime), the skip-a-month mechanic, the pause-anytime rule, the cancellation policy, and the specific yearly savings for the brand’s average consumption cadence. Cross-reference the retention structure on our food and beverage marketing retainer page.
Content refresh cadence on food brand pillars
Content refresh cadence on food brand content pillars runs a rolling audit every 12 to 24 months by pillar. Recipes get refreshed every 12 months with new photography, updated schema, and any nutrition or ingredient adjustments. Ingredient comparison guides refresh every 18 months to update market data. Sourcing story pages refresh every 24 months to reflect farm partnership changes and new harvest angles. Buyer intent content refreshes every 12 months to update retailer availability and pricing.
Recipe refresh priority order
Recipe refresh priority runs by organic traffic rank. The top 20 recipes by monthly organic sessions get refreshed first (new photography, schema audit, related recipe internal links, updated nutrition). The next 40 get refreshed at 15 months. The remaining recipes get refreshed opportunistically when the ranking slips past position 15 in Google. Skipping the refresh cadence lets recipe rankings drift out of the top 3 inside 18 months as newer competitor recipes take the position.
Schema audit checklist per refresh
The schema audit checklist per refresh runs 8 items: Recipe schema completeness, aggregateRating count and accuracy, nutrition data accuracy, prepTime and cookTime match the recipe body, image URLs valid at CDN, related recipe internal links working, product card SKU URL live, and Google Search Console rich result eligibility validated. This checklist takes 20 minutes per recipe and prevents the schema drift that costs recipe rankings 20 to 40 positions quietly.
Reporting cadence for food brand content marketing
Reporting cadence on food brand content marketing runs a monthly executive report plus a quarterly business review. The monthly report ships in the first business week and covers organic sessions by pillar, top 10 ranking recipes with position trend, ingredient guide ranking movements, sourcing page performance, and organic-attributed DTC revenue. Every number carries a comparison to the prior month and a plain-language interpretation the founder reads in 7 minutes.
Metrics that matter for content marketing
Metrics that matter for food brand content marketing: organic sessions by pillar, recipe rich result impressions in Search Console, organic conversion rate to hero SKU pages, organic-attributed DTC revenue, and top 20 ranking positions by monthly organic sessions. Vanity metrics that do not matter: total pageviews without conversion context, average time on page without conversion attribution, and social share counts. The monthly report skips the vanity block entirely.
Quarterly business review structure
The quarterly business review runs 90 minutes with the founder, head of content, and SEO lead. Agenda: organic traffic trend by pillar, top 10 winning content pieces, top 10 losing content pieces (candidates for refresh or removal), competitive gap analysis against 5 named competitor brands, and next quarter’s content calendar with recipes and ingredient guides queued. According to Ahrefs content marketing research, brands running quarterly content audits outperform brands running annual audits by 40 to 70 percent on organic revenue over a 24-month window.
Internal linking discipline across food brand content
Internal linking discipline across food brand content moves authority from recipe pages toward hero SKU product pages and comparison guides. Every recipe links to the hero SKU it uses inline (once in the ingredient list, once in a bottom call-out card). Every ingredient comparison guide links to 3 to 6 recipes using the winning ingredient plus the hero SKU product page. Every sourcing story links to the 2 to 4 SKUs sourced from that specific farm or cooperative.
Anchor text strategy across recipe hubs
Anchor text on internal links varies across recipe hubs to avoid over-optimization patterns Google penalizes. Exact-match anchor (“single-origin Ethiopian coffee”) runs on 20 to 30 percent of internal links. Partial-match variations (“our Ethiopian roast”) run on 30 to 40 percent. Branded anchors (the SKU name) run on 20 to 30 percent. Generic anchors (“shop the coffee”) fill the remaining 10 to 20 percent. This ratio holds ranking without triggering the over-optimization penalty that shows up on brands that anchor-text-stuff every internal link with the same exact-match keyword. Cross-reference the linking layer on our food and beverage web design page.
Link equity from ingredient guides to SKU pages
Link equity from ingredient guides passes to SKU pages when the guide’s comparison table names the hero SKU in the winning column with a product card, and when the guide’s body links to 3 to 6 recipes that use the winning ingredient. This 3-hop path (guide to recipe to SKU) pushes authority from a high-traffic informational query down to a high-intent transactional page. According to Search Engine Land SEO coverage, informational content that internally links to transactional pages produces 2 to 4 times higher organic revenue than isolated content silos.
Wrapping up content marketing for food brands
Content marketing for food brands is the organic engine that turns a DTC snack, drink, or CPG storefront into a search-driven revenue channel. Recipe hub of 40 to 100 recipes. Ingredient comparison guides at 12 to 24 pieces. Sourcing story pages at 6 to 12 pieces. Buyer intent content at 8 to 16 pieces. Creator syndication calendar with 12 to 30 creators per quarter. Refresh cadence at 12 to 24 months by pillar. Reporting with organic sessions and organic revenue attribution.
If your DTC food brand is running paid social at 20,000 dollars monthly with a broken blog and zero recipe schema, professional content marketing for food brands pays for itself inside the first 90 days on organic traffic captured. Redefine Web ships content marketing inside our monthly retainer packages. Book a call and we will walk through the last three DTC food brands we built recipe hubs for, pillar by pillar.
Content marketing for food brands starts with a recipe hub because recipe queries account for 40 to 60 percent of high-intent search volume in the food category. Every hero SKU needs 4 to 12 recipes anchored to it, each targeting a specific occasion and audience.
Skip the recipe hub and the brand loses the search real estate that pulls DTC storefront traffic month over month at zero incremental paid cost. Recipe traffic converts at 2 to 4 percent because the shopper landed with usage intent, not passive discovery, which is why food brands win on recipes.
Recipe schema and Google rich result eligibility
Every recipe page ships schema.org Recipe markup including cookTime, prepTime, recipeIngredient, recipeInstructions, nutrition, and aggregateRating. Correctly marked-up recipes qualify for Google’s recipe rich result carousel that pulls 3 to 6 times higher click-through rate than a plain blue link. The schema layer takes 15 minutes per recipe to author and 30 minutes to validate in Google Search Console. Cross-reference the recipe search stack on our food and beverage SEO page.
Recipe hub structure that scales
The recipe hub structure runs 40 to 100 recipes at maturity, organized by hero SKU (4 to 12 recipes per SKU) plus occasion tags (breakfast, weeknight dinner, meal prep, brunch, holiday). Every recipe links back to the hero SKU product page with the SKU embedded in an inline card. The hub earns internal linking value from ingredient comparison guides and the sourcing story pages, which feeds recipe ranking on Google. According to Google Search Central recipe structured data guidance, complete Recipe schema markup is required for eligibility in the recipe carousel and the ingredient search filter.
Pillar structure for food brand content marketing
The pillar structure on content marketing for food brands runs 4 content pillars concurrently: recipe hub (40 to 100 recipes), ingredient comparison guides (12 to 24 guides), sourcing story pages (6 to 12 pages), and buyer intent content (where to buy, subscription vs. one-time, gift bundle guides). Every pillar covers a distinct search intent and every pillar links back to the hero SKU product pages.
Ingredient comparison guide format
Ingredient comparison guides run 1,800 to 3,200 words comparing 2 to 4 ingredient types on 6 to 10 attributes with a comparison table, real-world use case examples, and links to the hero SKU that uses the specific ingredient. Example: organic vs. conventional oats compares nutritional profile, sourcing chain, cost, environmental impact, and taste on a 6-column table. The brand’s SKU appears in the winning column with a product card. These guides rank 3 to 8 months after publication and pull steady-state organic traffic.
Sourcing story pages that build trust
Sourcing story pages name the specific farms, cooperatives, or suppliers the brand sources from, with photos of the farms, farmer quotes, and specific harvest windows. A coffee brand’s Ethiopian farm page ranks for “single-origin Ethiopian coffee” and “Yirgacheffe coffee origin” plus 40 long-tail variations. The sourcing page pulls trust-building traffic that converts at 4 to 6 percent because the shopper landed pattern-matching on transparency and named provenance. Every sourcing page includes farmer or cooperative quotes, harvest dates, and a link back to 3 to 5 hero SKU pages that source from the named supplier.
Vejrø hospitality content case study
Vejrø Resort, a Danish private-island destination with an on-site restaurant focused on organic, locally sourced cuisine, joined us with strong social engagement and no organic-search real estate. Guests found the resort on Instagram but never in Google search for terms like “private island resort Denmark,” “farm-to-table hospitality Denmark,” or “Vejrø restaurant.” The same organic-search gap shows up on DTC food brands running paid social at 20,000 dollars monthly with a broken blog and zero recipe schema.
We built the conversion-focused website with on-site and off-site SEO tuned to the travel-niche keyword clusters, competitor analysis against comparable boutique resorts, and mobile-first design prioritizing guest discovery. Every page carried the structured data qualifying it for Google’s rich results in the hospitality category. Every internal link pushed authority toward the direct-booking conversion path.
Three months later, Vejrø hit 10,000 plus organic visitors, ranked for 200 plus first-page keywords, and pulled a 2.2 percent booking conversion rate from organic traffic. The same pattern applies to content marketing for food brands: recipe schema, ingredient comparison guides, and sourcing story pages pull organic traffic at 20 to 40 percent conversion into hero SKU pages inside 6 months when the content quality matches search intent and every page carries the right structured data markup. Vejrø also proved out the reporting discipline: every monthly report named the exact page, the exact keyword cluster, and the exact search feature (rich result, sitelinks, image pack) driving the incremental organic revenue instead of hiding behind aggregate traffic charts.
Recipe cadence and content calendar for food brands
Recipe cadence on a working food brand content calendar ships 2 to 4 new recipes per week during the first 6 months and drops to 1 per week at maturity. Each recipe takes 4 to 6 hours to produce (write, test in the kitchen, photograph, schema author, publish). At 3 recipes per week, the brand hits 78 recipes inside 6 months plus a backlog of ingredient comparison and sourcing content queued behind the recipe production line.
| Content pillar | Target volume year 1 | Production cost per piece | Refresh cadence |
|---|---|---|---|
| Recipe hub | 40 to 100 recipes | $180 to $320 | Every 12 months |
| Ingredient comparison guides | 12 to 24 guides | $450 to $780 | Every 18 months |
| Sourcing story pages | 6 to 12 pages | $680 to $1,200 | Every 24 months |
| Buyer intent content | 8 to 16 pieces | $220 to $420 | Every 12 months |
Photography as a content calendar constraint
Photography is the actual constraint on recipe cadence, not writing. Every recipe needs 6 to 12 photos: hero shot, ingredient flat lay, prep in progress, plated result, storage, and step shots for the schema markup. A working food brand batches photography 8 recipes at a time to keep the cost per recipe under 200 dollars. Skip the batching and the per-recipe cost climbs to 400 to 600 dollars, which caps recipe cadence at 1 per week and slows organic ranking timeline by 6 months.
Seasonal content calendar planning
Seasonal content calendar planning maps recipes and comparison guides to the seasonal windows they need to rank in. A Christmas cookie recipe needs to publish in September to rank by early December. A Valentine’s chocolate guide needs to publish in November to rank by early February. A back-to-school lunchbox recipe needs to publish in June to rank by late August. The 60-to-90-day ranking curve dictates the calendar.
Creator syndication inside food brand content
Creator syndication on food brand content marketing amplifies the recipe hub through Instagram Reels, TikTok, and YouTube Shorts creators paid to post their own version of the brand’s hero recipes. The creator content pulls net-new audiences into the recipe hub through the creator’s Link in Bio or Amazon Storefront tag. The syndication calendar names 12 to 30 creators per quarter with specific recipes assigned to each.
One brand we picked up had a spreadsheet titled “creator outreach 2023” with 47 rows and 3 responses. All 3 responses were auto-replies. The spreadsheet named zero recipes and offered flat rates below 100 dollars per post. Nobody posts a 30-second video for 87 dollars flat. Nobody.
Creator content commercial terms that work
Working creator content commercial terms run 350 to 1,500 dollars flat per post plus a 12 to 25 percent commission on tagged sales across a 30-day window. The commission mechanic pulls creators into follow-up posts because the incremental revenue continues past the initial fee. Mid-tier creators (30k to 150k followers) hit the sweet spot for food brand content because their engagement rate typically runs 4 to 8 percent versus 0.8 to 1.6 percent on mega-creators.
Content brief structure for creator partnerships
The content brief structure for creator partnerships runs a single page: the SKU, the specific recipe or usage occasion, 3 required brand mentions, 3 restricted claims (no health claims on non-medical SKUs), the pricing angle, the affiliate link, and 3 example videos that hit the tone. The brief avoids over-scripting because over-scripted creator content underperforms native creator voice by 40 to 60 percent on engagement rate.
Buyer intent content for food brand blogs
Buyer intent content on food brand blogs covers 8 to 16 pieces targeting explicit purchase-decision queries: “where to buy [brand],” “[brand] subscription vs. one-time,” “best [category] for [use case],” and “[brand] gift bundle.” Every buyer intent piece runs 1,400 to 2,400 words with a comparison table, product cards, and a clear conversion path to the specific SKU that matches the query intent. Buyer intent content converts at 3 to 6 percent versus 1 to 2 percent on recipe content because the shopper landed already planning to buy, not exploring a usage occasion.
Where-to-buy content structure
Where-to-buy content structure covers online (DTC storefront, Amazon, Target.com, Whole Foods online), retail (specific chain locators with the store finder embedded), and international (customs limitations, retailer partners abroad). Every piece names specific retailers, links to the store locator, and includes an FAQ block covering shipping availability, subscription options, and gift card compatibility. Where-to-buy content ranks for branded discovery queries the DTC storefront otherwise loses to competitor affiliate reviews.
Subscription versus one-time comparison content
Subscription versus one-time comparison content converts subscription commitments at 3 to 6 percent because it addresses the price-sensitivity concern head-on with a specific math table. The piece covers the discount structure (15 percent lifetime), the skip-a-month mechanic, the pause-anytime rule, the cancellation policy, and the specific yearly savings for the brand’s average consumption cadence. Cross-reference the retention structure on our food and beverage marketing retainer page.
Content refresh cadence on food brand pillars
Content refresh cadence on food brand content pillars runs a rolling audit every 12 to 24 months by pillar. Recipes get refreshed every 12 months with new photography, updated schema, and any nutrition or ingredient adjustments. Ingredient comparison guides refresh every 18 months to update market data. Sourcing story pages refresh every 24 months to reflect farm partnership changes and new harvest angles. Buyer intent content refreshes every 12 months to update retailer availability and pricing.
Recipe refresh priority order
Recipe refresh priority runs by organic traffic rank. The top 20 recipes by monthly organic sessions get refreshed first (new photography, schema audit, related recipe internal links, updated nutrition). The next 40 get refreshed at 15 months. The remaining recipes get refreshed opportunistically when the ranking slips past position 15 in Google. Skipping the refresh cadence lets recipe rankings drift out of the top 3 inside 18 months as newer competitor recipes take the position.
Schema audit checklist per refresh
The schema audit checklist per refresh runs 8 items: Recipe schema completeness, aggregateRating count and accuracy, nutrition data accuracy, prepTime and cookTime match the recipe body, image URLs valid at CDN, related recipe internal links working, product card SKU URL live, and Google Search Console rich result eligibility validated. This checklist takes 20 minutes per recipe and prevents the schema drift that costs recipe rankings 20 to 40 positions quietly.
Reporting cadence for food brand content marketing
Reporting cadence on food brand content marketing runs a monthly executive report plus a quarterly business review. The monthly report ships in the first business week and covers organic sessions by pillar, top 10 ranking recipes with position trend, ingredient guide ranking movements, sourcing page performance, and organic-attributed DTC revenue. Every number carries a comparison to the prior month and a plain-language interpretation the founder reads in 7 minutes.
Metrics that matter for content marketing
Metrics that matter for food brand content marketing: organic sessions by pillar, recipe rich result impressions in Search Console, organic conversion rate to hero SKU pages, organic-attributed DTC revenue, and top 20 ranking positions by monthly organic sessions. Vanity metrics that do not matter: total pageviews without conversion context, average time on page without conversion attribution, and social share counts. The monthly report skips the vanity block entirely.
Quarterly business review structure
The quarterly business review runs 90 minutes with the founder, head of content, and SEO lead. Agenda: organic traffic trend by pillar, top 10 winning content pieces, top 10 losing content pieces (candidates for refresh or removal), competitive gap analysis against 5 named competitor brands, and next quarter’s content calendar with recipes and ingredient guides queued. According to Ahrefs content marketing research, brands running quarterly content audits outperform brands running annual audits by 40 to 70 percent on organic revenue over a 24-month window.
Internal linking discipline across food brand content
Internal linking discipline across food brand content moves authority from recipe pages toward hero SKU product pages and comparison guides. Every recipe links to the hero SKU it uses inline (once in the ingredient list, once in a bottom call-out card). Every ingredient comparison guide links to 3 to 6 recipes using the winning ingredient plus the hero SKU product page. Every sourcing story links to the 2 to 4 SKUs sourced from that specific farm or cooperative.
Anchor text strategy across recipe hubs
Anchor text on internal links varies across recipe hubs to avoid over-optimization patterns Google penalizes. Exact-match anchor (“single-origin Ethiopian coffee”) runs on 20 to 30 percent of internal links. Partial-match variations (“our Ethiopian roast”) run on 30 to 40 percent. Branded anchors (the SKU name) run on 20 to 30 percent. Generic anchors (“shop the coffee”) fill the remaining 10 to 20 percent. This ratio holds ranking without triggering the over-optimization penalty that shows up on brands that anchor-text-stuff every internal link with the same exact-match keyword. Cross-reference the linking layer on our food and beverage web design page.
Link equity from ingredient guides to SKU pages
Link equity from ingredient guides passes to SKU pages when the guide’s comparison table names the hero SKU in the winning column with a product card, and when the guide’s body links to 3 to 6 recipes that use the winning ingredient. This 3-hop path (guide to recipe to SKU) pushes authority from a high-traffic informational query down to a high-intent transactional page. According to Search Engine Land SEO coverage, informational content that internally links to transactional pages produces 2 to 4 times higher organic revenue than isolated content silos.
Wrapping up content marketing for food brands
Content marketing for food brands is the organic engine that turns a DTC snack, drink, or CPG storefront into a search-driven revenue channel. Recipe hub of 40 to 100 recipes. Ingredient comparison guides at 12 to 24 pieces. Sourcing story pages at 6 to 12 pieces. Buyer intent content at 8 to 16 pieces. Creator syndication calendar with 12 to 30 creators per quarter. Refresh cadence at 12 to 24 months by pillar. Reporting with organic sessions and organic revenue attribution.
If your DTC food brand is running paid social at 20,000 dollars monthly with a broken blog and zero recipe schema, professional content marketing for food brands pays for itself inside the first 90 days on organic traffic captured. Redefine Web ships content marketing inside our monthly retainer packages. Book a call and we will walk through the last three DTC food brands we built recipe hubs for, pillar by pillar.
Anchor text on internal links varies across recipe hubs to avoid over-optimization patterns Google penalizes. Exact-match anchor (“single-origin Ethiopian coffee”) runs on 20 to 30 percent of internal links. Partial-match variations (“our Ethiopian roast”) run on 30 to 40 percent. Branded anchors (the SKU name) run on 20 to 30 percent. Generic anchors (“shop the coffee”) fill the remaining 10 to 20 percent. This ratio holds ranking without triggering the over-optimization penalty that shows up on brands that anchor-text-stuff every internal link with the same exact-match keyword. Cross-reference the linking layer on our food and beverage web design page.
Link equity from ingredient guides to SKU pages
Link equity from ingredient guides passes to SKU pages when the guide’s comparison table names the hero SKU in the winning column with a product card, and when the guide’s body links to 3 to 6 recipes that use the winning ingredient. This 3-hop path (guide to recipe to SKU) pushes authority from a high-traffic informational query down to a high-intent transactional page. According to Search Engine Land SEO coverage, informational content that internally links to transactional pages produces 2 to 4 times higher organic revenue than isolated content silos.
Wrapping up content marketing for food brands
Content marketing for food brands is the organic engine that turns a DTC snack, drink, or CPG storefront into a search-driven revenue channel. Recipe hub of 40 to 100 recipes. Ingredient comparison guides at 12 to 24 pieces. Sourcing story pages at 6 to 12 pieces. Buyer intent content at 8 to 16 pieces. Creator syndication calendar with 12 to 30 creators per quarter. Refresh cadence at 12 to 24 months by pillar. Reporting with organic sessions and organic revenue attribution.
If your DTC food brand is running paid social at 20,000 dollars monthly with a broken blog and zero recipe schema, professional content marketing for food brands pays for itself inside the first 90 days on organic traffic captured. Redefine Web ships content marketing inside our monthly retainer packages. Book a call and we will walk through the last three DTC food brands we built recipe hubs for, pillar by pillar.
Internal linking discipline across food brand content moves authority from recipe pages toward hero SKU product pages and comparison guides. Every recipe links to the hero SKU it uses inline (once in the ingredient list, once in a bottom call-out card). Every ingredient comparison guide links to 3 to 6 recipes using the winning ingredient plus the hero SKU product page. Every sourcing story links to the 2 to 4 SKUs sourced from that specific farm or cooperative.
Anchor text strategy across recipe hubs
Anchor text on internal links varies across recipe hubs to avoid over-optimization patterns Google penalizes. Exact-match anchor (“single-origin Ethiopian coffee”) runs on 20 to 30 percent of internal links. Partial-match variations (“our Ethiopian roast”) run on 30 to 40 percent. Branded anchors (the SKU name) run on 20 to 30 percent. Generic anchors (“shop the coffee”) fill the remaining 10 to 20 percent. This ratio holds ranking without triggering the over-optimization penalty that shows up on brands that anchor-text-stuff every internal link with the same exact-match keyword. Cross-reference the linking layer on our food and beverage web design page.
Link equity from ingredient guides to SKU pages
Link equity from ingredient guides passes to SKU pages when the guide’s comparison table names the hero SKU in the winning column with a product card, and when the guide’s body links to 3 to 6 recipes that use the winning ingredient. This 3-hop path (guide to recipe to SKU) pushes authority from a high-traffic informational query down to a high-intent transactional page. According to Search Engine Land SEO coverage, informational content that internally links to transactional pages produces 2 to 4 times higher organic revenue than isolated content silos.
Wrapping up content marketing for food brands
Content marketing for food brands is the organic engine that turns a DTC snack, drink, or CPG storefront into a search-driven revenue channel. Recipe hub of 40 to 100 recipes. Ingredient comparison guides at 12 to 24 pieces. Sourcing story pages at 6 to 12 pieces. Buyer intent content at 8 to 16 pieces. Creator syndication calendar with 12 to 30 creators per quarter. Refresh cadence at 12 to 24 months by pillar. Reporting with organic sessions and organic revenue attribution.
If your DTC food brand is running paid social at 20,000 dollars monthly with a broken blog and zero recipe schema, professional content marketing for food brands pays for itself inside the first 90 days on organic traffic captured. Redefine Web ships content marketing inside our monthly retainer packages. Book a call and we will walk through the last three DTC food brands we built recipe hubs for, pillar by pillar.
Content marketing for food brands starts with a recipe hub because recipe queries account for 40 to 60 percent of high-intent search volume in the food category. Every hero SKU needs 4 to 12 recipes anchored to it, each targeting a specific occasion and audience.
Skip the recipe hub and the brand loses the search real estate that pulls DTC storefront traffic month over month at zero incremental paid cost. Recipe traffic converts at 2 to 4 percent because the shopper landed with usage intent, not passive discovery, which is why food brands win on recipes.
Recipe schema and Google rich result eligibility
Every recipe page ships schema.org Recipe markup including cookTime, prepTime, recipeIngredient, recipeInstructions, nutrition, and aggregateRating. Correctly marked-up recipes qualify for Google’s recipe rich result carousel that pulls 3 to 6 times higher click-through rate than a plain blue link. The schema layer takes 15 minutes per recipe to author and 30 minutes to validate in Google Search Console. Cross-reference the recipe search stack on our food and beverage SEO page.
Recipe hub structure that scales
The recipe hub structure runs 40 to 100 recipes at maturity, organized by hero SKU (4 to 12 recipes per SKU) plus occasion tags (breakfast, weeknight dinner, meal prep, brunch, holiday). Every recipe links back to the hero SKU product page with the SKU embedded in an inline card. The hub earns internal linking value from ingredient comparison guides and the sourcing story pages, which feeds recipe ranking on Google. According to Google Search Central recipe structured data guidance, complete Recipe schema markup is required for eligibility in the recipe carousel and the ingredient search filter.
Pillar structure for food brand content marketing
The pillar structure on content marketing for food brands runs 4 content pillars concurrently: recipe hub (40 to 100 recipes), ingredient comparison guides (12 to 24 guides), sourcing story pages (6 to 12 pages), and buyer intent content (where to buy, subscription vs. one-time, gift bundle guides). Every pillar covers a distinct search intent and every pillar links back to the hero SKU product pages.
Ingredient comparison guide format
Ingredient comparison guides run 1,800 to 3,200 words comparing 2 to 4 ingredient types on 6 to 10 attributes with a comparison table, real-world use case examples, and links to the hero SKU that uses the specific ingredient. Example: organic vs. conventional oats compares nutritional profile, sourcing chain, cost, environmental impact, and taste on a 6-column table. The brand’s SKU appears in the winning column with a product card. These guides rank 3 to 8 months after publication and pull steady-state organic traffic.
Sourcing story pages that build trust
Sourcing story pages name the specific farms, cooperatives, or suppliers the brand sources from, with photos of the farms, farmer quotes, and specific harvest windows. A coffee brand’s Ethiopian farm page ranks for “single-origin Ethiopian coffee” and “Yirgacheffe coffee origin” plus 40 long-tail variations. The sourcing page pulls trust-building traffic that converts at 4 to 6 percent because the shopper landed pattern-matching on transparency and named provenance. Every sourcing page includes farmer or cooperative quotes, harvest dates, and a link back to 3 to 5 hero SKU pages that source from the named supplier.
Vejrø hospitality content case study
Vejrø Resort, a Danish private-island destination with an on-site restaurant focused on organic, locally sourced cuisine, joined us with strong social engagement and no organic-search real estate. Guests found the resort on Instagram but never in Google search for terms like “private island resort Denmark,” “farm-to-table hospitality Denmark,” or “Vejrø restaurant.” The same organic-search gap shows up on DTC food brands running paid social at 20,000 dollars monthly with a broken blog and zero recipe schema.
We built the conversion-focused website with on-site and off-site SEO tuned to the travel-niche keyword clusters, competitor analysis against comparable boutique resorts, and mobile-first design prioritizing guest discovery. Every page carried the structured data qualifying it for Google’s rich results in the hospitality category. Every internal link pushed authority toward the direct-booking conversion path.
Three months later, Vejrø hit 10,000 plus organic visitors, ranked for 200 plus first-page keywords, and pulled a 2.2 percent booking conversion rate from organic traffic. The same pattern applies to content marketing for food brands: recipe schema, ingredient comparison guides, and sourcing story pages pull organic traffic at 20 to 40 percent conversion into hero SKU pages inside 6 months when the content quality matches search intent and every page carries the right structured data markup. Vejrø also proved out the reporting discipline: every monthly report named the exact page, the exact keyword cluster, and the exact search feature (rich result, sitelinks, image pack) driving the incremental organic revenue instead of hiding behind aggregate traffic charts.
Recipe cadence and content calendar for food brands
Recipe cadence on a working food brand content calendar ships 2 to 4 new recipes per week during the first 6 months and drops to 1 per week at maturity. Each recipe takes 4 to 6 hours to produce (write, test in the kitchen, photograph, schema author, publish). At 3 recipes per week, the brand hits 78 recipes inside 6 months plus a backlog of ingredient comparison and sourcing content queued behind the recipe production line.
| Content pillar | Target volume year 1 | Production cost per piece | Refresh cadence |
|---|---|---|---|
| Recipe hub | 40 to 100 recipes | $180 to $320 | Every 12 months |
| Ingredient comparison guides | 12 to 24 guides | $450 to $780 | Every 18 months |
| Sourcing story pages | 6 to 12 pages | $680 to $1,200 | Every 24 months |
| Buyer intent content | 8 to 16 pieces | $220 to $420 | Every 12 months |
Photography as a content calendar constraint
Photography is the actual constraint on recipe cadence, not writing. Every recipe needs 6 to 12 photos: hero shot, ingredient flat lay, prep in progress, plated result, storage, and step shots for the schema markup. A working food brand batches photography 8 recipes at a time to keep the cost per recipe under 200 dollars. Skip the batching and the per-recipe cost climbs to 400 to 600 dollars, which caps recipe cadence at 1 per week and slows organic ranking timeline by 6 months.
Seasonal content calendar planning
Seasonal content calendar planning maps recipes and comparison guides to the seasonal windows they need to rank in. A Christmas cookie recipe needs to publish in September to rank by early December. A Valentine’s chocolate guide needs to publish in November to rank by early February. A back-to-school lunchbox recipe needs to publish in June to rank by late August. The 60-to-90-day ranking curve dictates the calendar.
Creator syndication inside food brand content
Creator syndication on food brand content marketing amplifies the recipe hub through Instagram Reels, TikTok, and YouTube Shorts creators paid to post their own version of the brand’s hero recipes. The creator content pulls net-new audiences into the recipe hub through the creator’s Link in Bio or Amazon Storefront tag. The syndication calendar names 12 to 30 creators per quarter with specific recipes assigned to each.
One brand we picked up had a spreadsheet titled “creator outreach 2023” with 47 rows and 3 responses. All 3 responses were auto-replies. The spreadsheet named zero recipes and offered flat rates below 100 dollars per post. Nobody posts a 30-second video for 87 dollars flat. Nobody.
Creator content commercial terms that work
Working creator content commercial terms run 350 to 1,500 dollars flat per post plus a 12 to 25 percent commission on tagged sales across a 30-day window. The commission mechanic pulls creators into follow-up posts because the incremental revenue continues past the initial fee. Mid-tier creators (30k to 150k followers) hit the sweet spot for food brand content because their engagement rate typically runs 4 to 8 percent versus 0.8 to 1.6 percent on mega-creators.
Content brief structure for creator partnerships
The content brief structure for creator partnerships runs a single page: the SKU, the specific recipe or usage occasion, 3 required brand mentions, 3 restricted claims (no health claims on non-medical SKUs), the pricing angle, the affiliate link, and 3 example videos that hit the tone. The brief avoids over-scripting because over-scripted creator content underperforms native creator voice by 40 to 60 percent on engagement rate.
Buyer intent content for food brand blogs
Buyer intent content on food brand blogs covers 8 to 16 pieces targeting explicit purchase-decision queries: “where to buy [brand],” “[brand] subscription vs. one-time,” “best [category] for [use case],” and “[brand] gift bundle.” Every buyer intent piece runs 1,400 to 2,400 words with a comparison table, product cards, and a clear conversion path to the specific SKU that matches the query intent. Buyer intent content converts at 3 to 6 percent versus 1 to 2 percent on recipe content because the shopper landed already planning to buy, not exploring a usage occasion.
Where-to-buy content structure
Where-to-buy content structure covers online (DTC storefront, Amazon, Target.com, Whole Foods online), retail (specific chain locators with the store finder embedded), and international (customs limitations, retailer partners abroad). Every piece names specific retailers, links to the store locator, and includes an FAQ block covering shipping availability, subscription options, and gift card compatibility. Where-to-buy content ranks for branded discovery queries the DTC storefront otherwise loses to competitor affiliate reviews.
Subscription versus one-time comparison content
Subscription versus one-time comparison content converts subscription commitments at 3 to 6 percent because it addresses the price-sensitivity concern head-on with a specific math table. The piece covers the discount structure (15 percent lifetime), the skip-a-month mechanic, the pause-anytime rule, the cancellation policy, and the specific yearly savings for the brand’s average consumption cadence. Cross-reference the retention structure on our food and beverage marketing retainer page.
Content refresh cadence on food brand pillars
Content refresh cadence on food brand content pillars runs a rolling audit every 12 to 24 months by pillar. Recipes get refreshed every 12 months with new photography, updated schema, and any nutrition or ingredient adjustments. Ingredient comparison guides refresh every 18 months to update market data. Sourcing story pages refresh every 24 months to reflect farm partnership changes and new harvest angles. Buyer intent content refreshes every 12 months to update retailer availability and pricing.
Recipe refresh priority order
Recipe refresh priority runs by organic traffic rank. The top 20 recipes by monthly organic sessions get refreshed first (new photography, schema audit, related recipe internal links, updated nutrition). The next 40 get refreshed at 15 months. The remaining recipes get refreshed opportunistically when the ranking slips past position 15 in Google. Skipping the refresh cadence lets recipe rankings drift out of the top 3 inside 18 months as newer competitor recipes take the position.
Schema audit checklist per refresh
The schema audit checklist per refresh runs 8 items: Recipe schema completeness, aggregateRating count and accuracy, nutrition data accuracy, prepTime and cookTime match the recipe body, image URLs valid at CDN, related recipe internal links working, product card SKU URL live, and Google Search Console rich result eligibility validated. This checklist takes 20 minutes per recipe and prevents the schema drift that costs recipe rankings 20 to 40 positions quietly.
Reporting cadence for food brand content marketing
Reporting cadence on food brand content marketing runs a monthly executive report plus a quarterly business review. The monthly report ships in the first business week and covers organic sessions by pillar, top 10 ranking recipes with position trend, ingredient guide ranking movements, sourcing page performance, and organic-attributed DTC revenue. Every number carries a comparison to the prior month and a plain-language interpretation the founder reads in 7 minutes.
Metrics that matter for content marketing
Metrics that matter for food brand content marketing: organic sessions by pillar, recipe rich result impressions in Search Console, organic conversion rate to hero SKU pages, organic-attributed DTC revenue, and top 20 ranking positions by monthly organic sessions. Vanity metrics that do not matter: total pageviews without conversion context, average time on page without conversion attribution, and social share counts. The monthly report skips the vanity block entirely.
Quarterly business review structure
The quarterly business review runs 90 minutes with the founder, head of content, and SEO lead. Agenda: organic traffic trend by pillar, top 10 winning content pieces, top 10 losing content pieces (candidates for refresh or removal), competitive gap analysis against 5 named competitor brands, and next quarter’s content calendar with recipes and ingredient guides queued. According to Ahrefs content marketing research, brands running quarterly content audits outperform brands running annual audits by 40 to 70 percent on organic revenue over a 24-month window.
Internal linking discipline across food brand content
Internal linking discipline across food brand content moves authority from recipe pages toward hero SKU product pages and comparison guides. Every recipe links to the hero SKU it uses inline (once in the ingredient list, once in a bottom call-out card). Every ingredient comparison guide links to 3 to 6 recipes using the winning ingredient plus the hero SKU product page. Every sourcing story links to the 2 to 4 SKUs sourced from that specific farm or cooperative.
Anchor text strategy across recipe hubs
Anchor text on internal links varies across recipe hubs to avoid over-optimization patterns Google penalizes. Exact-match anchor (“single-origin Ethiopian coffee”) runs on 20 to 30 percent of internal links. Partial-match variations (“our Ethiopian roast”) run on 30 to 40 percent. Branded anchors (the SKU name) run on 20 to 30 percent. Generic anchors (“shop the coffee”) fill the remaining 10 to 20 percent. This ratio holds ranking without triggering the over-optimization penalty that shows up on brands that anchor-text-stuff every internal link with the same exact-match keyword. Cross-reference the linking layer on our food and beverage web design page.
Link equity from ingredient guides to SKU pages
Link equity from ingredient guides passes to SKU pages when the guide’s comparison table names the hero SKU in the winning column with a product card, and when the guide’s body links to 3 to 6 recipes that use the winning ingredient. This 3-hop path (guide to recipe to SKU) pushes authority from a high-traffic informational query down to a high-intent transactional page. According to Search Engine Land SEO coverage, informational content that internally links to transactional pages produces 2 to 4 times higher organic revenue than isolated content silos.
Wrapping up content marketing for food brands
Content marketing for food brands is the organic engine that turns a DTC snack, drink, or CPG storefront into a search-driven revenue channel. Recipe hub of 40 to 100 recipes. Ingredient comparison guides at 12 to 24 pieces. Sourcing story pages at 6 to 12 pieces. Buyer intent content at 8 to 16 pieces. Creator syndication calendar with 12 to 30 creators per quarter. Refresh cadence at 12 to 24 months by pillar. Reporting with organic sessions and organic revenue attribution.
If your DTC food brand is running paid social at 20,000 dollars monthly with a broken blog and zero recipe schema, professional content marketing for food brands pays for itself inside the first 90 days on organic traffic captured. Redefine Web ships content marketing inside our monthly retainer packages. Book a call and we will walk through the last three DTC food brands we built recipe hubs for, pillar by pillar.
Content marketing for food brands starts with a recipe hub because recipe queries account for 40 to 60 percent of high-intent search volume in the food category. Every hero SKU needs 4 to 12 recipes anchored to it, each targeting a specific occasion and audience.
Skip the recipe hub and the brand loses the search real estate that pulls DTC storefront traffic month over month at zero incremental paid cost. Recipe traffic converts at 2 to 4 percent because the shopper landed with usage intent, not passive discovery, which is why food brands win on recipes.
Recipe schema and Google rich result eligibility
Every recipe page ships schema.org Recipe markup including cookTime, prepTime, recipeIngredient, recipeInstructions, nutrition, and aggregateRating. Correctly marked-up recipes qualify for Google’s recipe rich result carousel that pulls 3 to 6 times higher click-through rate than a plain blue link. The schema layer takes 15 minutes per recipe to author and 30 minutes to validate in Google Search Console. Cross-reference the recipe search stack on our food and beverage SEO page.
Recipe hub structure that scales
The recipe hub structure runs 40 to 100 recipes at maturity, organized by hero SKU (4 to 12 recipes per SKU) plus occasion tags (breakfast, weeknight dinner, meal prep, brunch, holiday). Every recipe links back to the hero SKU product page with the SKU embedded in an inline card. The hub earns internal linking value from ingredient comparison guides and the sourcing story pages, which feeds recipe ranking on Google. According to Google Search Central recipe structured data guidance, complete Recipe schema markup is required for eligibility in the recipe carousel and the ingredient search filter.
Pillar structure for food brand content marketing
The pillar structure on content marketing for food brands runs 4 content pillars concurrently: recipe hub (40 to 100 recipes), ingredient comparison guides (12 to 24 guides), sourcing story pages (6 to 12 pages), and buyer intent content (where to buy, subscription vs. one-time, gift bundle guides). Every pillar covers a distinct search intent and every pillar links back to the hero SKU product pages.
Ingredient comparison guide format
Ingredient comparison guides run 1,800 to 3,200 words comparing 2 to 4 ingredient types on 6 to 10 attributes with a comparison table, real-world use case examples, and links to the hero SKU that uses the specific ingredient. Example: organic vs. conventional oats compares nutritional profile, sourcing chain, cost, environmental impact, and taste on a 6-column table. The brand’s SKU appears in the winning column with a product card. These guides rank 3 to 8 months after publication and pull steady-state organic traffic.
Sourcing story pages that build trust
Sourcing story pages name the specific farms, cooperatives, or suppliers the brand sources from, with photos of the farms, farmer quotes, and specific harvest windows. A coffee brand’s Ethiopian farm page ranks for “single-origin Ethiopian coffee” and “Yirgacheffe coffee origin” plus 40 long-tail variations. The sourcing page pulls trust-building traffic that converts at 4 to 6 percent because the shopper landed pattern-matching on transparency and named provenance. Every sourcing page includes farmer or cooperative quotes, harvest dates, and a link back to 3 to 5 hero SKU pages that source from the named supplier.
Vejrø hospitality content case study
Vejrø Resort, a Danish private-island destination with an on-site restaurant focused on organic, locally sourced cuisine, joined us with strong social engagement and no organic-search real estate. Guests found the resort on Instagram but never in Google search for terms like “private island resort Denmark,” “farm-to-table hospitality Denmark,” or “Vejrø restaurant.” The same organic-search gap shows up on DTC food brands running paid social at 20,000 dollars monthly with a broken blog and zero recipe schema.
We built the conversion-focused website with on-site and off-site SEO tuned to the travel-niche keyword clusters, competitor analysis against comparable boutique resorts, and mobile-first design prioritizing guest discovery. Every page carried the structured data qualifying it for Google’s rich results in the hospitality category. Every internal link pushed authority toward the direct-booking conversion path.
Three months later, Vejrø hit 10,000 plus organic visitors, ranked for 200 plus first-page keywords, and pulled a 2.2 percent booking conversion rate from organic traffic. The same pattern applies to content marketing for food brands: recipe schema, ingredient comparison guides, and sourcing story pages pull organic traffic at 20 to 40 percent conversion into hero SKU pages inside 6 months when the content quality matches search intent and every page carries the right structured data markup. Vejrø also proved out the reporting discipline: every monthly report named the exact page, the exact keyword cluster, and the exact search feature (rich result, sitelinks, image pack) driving the incremental organic revenue instead of hiding behind aggregate traffic charts.
Recipe cadence and content calendar for food brands
Recipe cadence on a working food brand content calendar ships 2 to 4 new recipes per week during the first 6 months and drops to 1 per week at maturity. Each recipe takes 4 to 6 hours to produce (write, test in the kitchen, photograph, schema author, publish). At 3 recipes per week, the brand hits 78 recipes inside 6 months plus a backlog of ingredient comparison and sourcing content queued behind the recipe production line.
| Content pillar | Target volume year 1 | Production cost per piece | Refresh cadence |
|---|---|---|---|
| Recipe hub | 40 to 100 recipes | $180 to $320 | Every 12 months |
| Ingredient comparison guides | 12 to 24 guides | $450 to $780 | Every 18 months |
| Sourcing story pages | 6 to 12 pages | $680 to $1,200 | Every 24 months |
| Buyer intent content | 8 to 16 pieces | $220 to $420 | Every 12 months |
Photography as a content calendar constraint
Photography is the actual constraint on recipe cadence, not writing. Every recipe needs 6 to 12 photos: hero shot, ingredient flat lay, prep in progress, plated result, storage, and step shots for the schema markup. A working food brand batches photography 8 recipes at a time to keep the cost per recipe under 200 dollars. Skip the batching and the per-recipe cost climbs to 400 to 600 dollars, which caps recipe cadence at 1 per week and slows organic ranking timeline by 6 months.
Seasonal content calendar planning
Seasonal content calendar planning maps recipes and comparison guides to the seasonal windows they need to rank in. A Christmas cookie recipe needs to publish in September to rank by early December. A Valentine’s chocolate guide needs to publish in November to rank by early February. A back-to-school lunchbox recipe needs to publish in June to rank by late August. The 60-to-90-day ranking curve dictates the calendar.
Creator syndication inside food brand content
Creator syndication on food brand content marketing amplifies the recipe hub through Instagram Reels, TikTok, and YouTube Shorts creators paid to post their own version of the brand’s hero recipes. The creator content pulls net-new audiences into the recipe hub through the creator’s Link in Bio or Amazon Storefront tag. The syndication calendar names 12 to 30 creators per quarter with specific recipes assigned to each.
One brand we picked up had a spreadsheet titled “creator outreach 2023” with 47 rows and 3 responses. All 3 responses were auto-replies. The spreadsheet named zero recipes and offered flat rates below 100 dollars per post. Nobody posts a 30-second video for 87 dollars flat. Nobody.
Creator content commercial terms that work
Working creator content commercial terms run 350 to 1,500 dollars flat per post plus a 12 to 25 percent commission on tagged sales across a 30-day window. The commission mechanic pulls creators into follow-up posts because the incremental revenue continues past the initial fee. Mid-tier creators (30k to 150k followers) hit the sweet spot for food brand content because their engagement rate typically runs 4 to 8 percent versus 0.8 to 1.6 percent on mega-creators.
Content brief structure for creator partnerships
The content brief structure for creator partnerships runs a single page: the SKU, the specific recipe or usage occasion, 3 required brand mentions, 3 restricted claims (no health claims on non-medical SKUs), the pricing angle, the affiliate link, and 3 example videos that hit the tone. The brief avoids over-scripting because over-scripted creator content underperforms native creator voice by 40 to 60 percent on engagement rate.
Buyer intent content for food brand blogs
Buyer intent content on food brand blogs covers 8 to 16 pieces targeting explicit purchase-decision queries: “where to buy [brand],” “[brand] subscription vs. one-time,” “best [category] for [use case],” and “[brand] gift bundle.” Every buyer intent piece runs 1,400 to 2,400 words with a comparison table, product cards, and a clear conversion path to the specific SKU that matches the query intent. Buyer intent content converts at 3 to 6 percent versus 1 to 2 percent on recipe content because the shopper landed already planning to buy, not exploring a usage occasion.
Where-to-buy content structure
Where-to-buy content structure covers online (DTC storefront, Amazon, Target.com, Whole Foods online), retail (specific chain locators with the store finder embedded), and international (customs limitations, retailer partners abroad). Every piece names specific retailers, links to the store locator, and includes an FAQ block covering shipping availability, subscription options, and gift card compatibility. Where-to-buy content ranks for branded discovery queries the DTC storefront otherwise loses to competitor affiliate reviews.
Subscription versus one-time comparison content
Subscription versus one-time comparison content converts subscription commitments at 3 to 6 percent because it addresses the price-sensitivity concern head-on with a specific math table. The piece covers the discount structure (15 percent lifetime), the skip-a-month mechanic, the pause-anytime rule, the cancellation policy, and the specific yearly savings for the brand’s average consumption cadence. Cross-reference the retention structure on our food and beverage marketing retainer page.
Content refresh cadence on food brand pillars
Content refresh cadence on food brand content pillars runs a rolling audit every 12 to 24 months by pillar. Recipes get refreshed every 12 months with new photography, updated schema, and any nutrition or ingredient adjustments. Ingredient comparison guides refresh every 18 months to update market data. Sourcing story pages refresh every 24 months to reflect farm partnership changes and new harvest angles. Buyer intent content refreshes every 12 months to update retailer availability and pricing.
Recipe refresh priority order
Recipe refresh priority runs by organic traffic rank. The top 20 recipes by monthly organic sessions get refreshed first (new photography, schema audit, related recipe internal links, updated nutrition). The next 40 get refreshed at 15 months. The remaining recipes get refreshed opportunistically when the ranking slips past position 15 in Google. Skipping the refresh cadence lets recipe rankings drift out of the top 3 inside 18 months as newer competitor recipes take the position.
Schema audit checklist per refresh
The schema audit checklist per refresh runs 8 items: Recipe schema completeness, aggregateRating count and accuracy, nutrition data accuracy, prepTime and cookTime match the recipe body, image URLs valid at CDN, related recipe internal links working, product card SKU URL live, and Google Search Console rich result eligibility validated. This checklist takes 20 minutes per recipe and prevents the schema drift that costs recipe rankings 20 to 40 positions quietly.
Reporting cadence for food brand content marketing
Reporting cadence on food brand content marketing runs a monthly executive report plus a quarterly business review. The monthly report ships in the first business week and covers organic sessions by pillar, top 10 ranking recipes with position trend, ingredient guide ranking movements, sourcing page performance, and organic-attributed DTC revenue. Every number carries a comparison to the prior month and a plain-language interpretation the founder reads in 7 minutes.
Metrics that matter for content marketing
Metrics that matter for food brand content marketing: organic sessions by pillar, recipe rich result impressions in Search Console, organic conversion rate to hero SKU pages, organic-attributed DTC revenue, and top 20 ranking positions by monthly organic sessions. Vanity metrics that do not matter: total pageviews without conversion context, average time on page without conversion attribution, and social share counts. The monthly report skips the vanity block entirely.
Quarterly business review structure
The quarterly business review runs 90 minutes with the founder, head of content, and SEO lead. Agenda: organic traffic trend by pillar, top 10 winning content pieces, top 10 losing content pieces (candidates for refresh or removal), competitive gap analysis against 5 named competitor brands, and next quarter’s content calendar with recipes and ingredient guides queued. According to Ahrefs content marketing research, brands running quarterly content audits outperform brands running annual audits by 40 to 70 percent on organic revenue over a 24-month window.
Internal linking discipline across food brand content
Internal linking discipline across food brand content moves authority from recipe pages toward hero SKU product pages and comparison guides. Every recipe links to the hero SKU it uses inline (once in the ingredient list, once in a bottom call-out card). Every ingredient comparison guide links to 3 to 6 recipes using the winning ingredient plus the hero SKU product page. Every sourcing story links to the 2 to 4 SKUs sourced from that specific farm or cooperative.
Anchor text strategy across recipe hubs
Anchor text on internal links varies across recipe hubs to avoid over-optimization patterns Google penalizes. Exact-match anchor (“single-origin Ethiopian coffee”) runs on 20 to 30 percent of internal links. Partial-match variations (“our Ethiopian roast”) run on 30 to 40 percent. Branded anchors (the SKU name) run on 20 to 30 percent. Generic anchors (“shop the coffee”) fill the remaining 10 to 20 percent. This ratio holds ranking without triggering the over-optimization penalty that shows up on brands that anchor-text-stuff every internal link with the same exact-match keyword. Cross-reference the linking layer on our food and beverage web design page.
Link equity from ingredient guides to SKU pages
Link equity from ingredient guides passes to SKU pages when the guide’s comparison table names the hero SKU in the winning column with a product card, and when the guide’s body links to 3 to 6 recipes that use the winning ingredient. This 3-hop path (guide to recipe to SKU) pushes authority from a high-traffic informational query down to a high-intent transactional page. According to Search Engine Land SEO coverage, informational content that internally links to transactional pages produces 2 to 4 times higher organic revenue than isolated content silos.
Wrapping up content marketing for food brands
Content marketing for food brands is the organic engine that turns a DTC snack, drink, or CPG storefront into a search-driven revenue channel. Recipe hub of 40 to 100 recipes. Ingredient comparison guides at 12 to 24 pieces. Sourcing story pages at 6 to 12 pieces. Buyer intent content at 8 to 16 pieces. Creator syndication calendar with 12 to 30 creators per quarter. Refresh cadence at 12 to 24 months by pillar. Reporting with organic sessions and organic revenue attribution.
If your DTC food brand is running paid social at 20,000 dollars monthly with a broken blog and zero recipe schema, professional content marketing for food brands pays for itself inside the first 90 days on organic traffic captured. Redefine Web ships content marketing inside our monthly retainer packages. Book a call and we will walk through the last three DTC food brands we built recipe hubs for, pillar by pillar.
Anchor text on internal links varies across recipe hubs to avoid over-optimization patterns Google penalizes. Exact-match anchor (“single-origin Ethiopian coffee”) runs on 20 to 30 percent of internal links. Partial-match variations (“our Ethiopian roast”) run on 30 to 40 percent. Branded anchors (the SKU name) run on 20 to 30 percent. Generic anchors (“shop the coffee”) fill the remaining 10 to 20 percent. This ratio holds ranking without triggering the over-optimization penalty that shows up on brands that anchor-text-stuff every internal link with the same exact-match keyword. Cross-reference the linking layer on our food and beverage web design page.
Link equity from ingredient guides to SKU pages
Link equity from ingredient guides passes to SKU pages when the guide’s comparison table names the hero SKU in the winning column with a product card, and when the guide’s body links to 3 to 6 recipes that use the winning ingredient. This 3-hop path (guide to recipe to SKU) pushes authority from a high-traffic informational query down to a high-intent transactional page. According to Search Engine Land SEO coverage, informational content that internally links to transactional pages produces 2 to 4 times higher organic revenue than isolated content silos.
Wrapping up content marketing for food brands
Content marketing for food brands is the organic engine that turns a DTC snack, drink, or CPG storefront into a search-driven revenue channel. Recipe hub of 40 to 100 recipes. Ingredient comparison guides at 12 to 24 pieces. Sourcing story pages at 6 to 12 pieces. Buyer intent content at 8 to 16 pieces. Creator syndication calendar with 12 to 30 creators per quarter. Refresh cadence at 12 to 24 months by pillar. Reporting with organic sessions and organic revenue attribution.
If your DTC food brand is running paid social at 20,000 dollars monthly with a broken blog and zero recipe schema, professional content marketing for food brands pays for itself inside the first 90 days on organic traffic captured. Redefine Web ships content marketing inside our monthly retainer packages. Book a call and we will walk through the last three DTC food brands we built recipe hubs for, pillar by pillar.
Content marketing for food brands starts with a recipe hub because recipe queries account for 40 to 60 percent of high-intent search volume in the food category. Every hero SKU needs 4 to 12 recipes anchored to it, each targeting a specific occasion and audience.
Skip the recipe hub and the brand loses the search real estate that pulls DTC storefront traffic month over month at zero incremental paid cost. Recipe traffic converts at 2 to 4 percent because the shopper landed with usage intent, not passive discovery, which is why food brands win on recipes.
Recipe schema and Google rich result eligibility
Every recipe page ships schema.org Recipe markup including cookTime, prepTime, recipeIngredient, recipeInstructions, nutrition, and aggregateRating. Correctly marked-up recipes qualify for Google’s recipe rich result carousel that pulls 3 to 6 times higher click-through rate than a plain blue link. The schema layer takes 15 minutes per recipe to author and 30 minutes to validate in Google Search Console. Cross-reference the recipe search stack on our food and beverage SEO page.
Recipe hub structure that scales
The recipe hub structure runs 40 to 100 recipes at maturity, organized by hero SKU (4 to 12 recipes per SKU) plus occasion tags (breakfast, weeknight dinner, meal prep, brunch, holiday). Every recipe links back to the hero SKU product page with the SKU embedded in an inline card. The hub earns internal linking value from ingredient comparison guides and the sourcing story pages, which feeds recipe ranking on Google. According to Google Search Central recipe structured data guidance, complete Recipe schema markup is required for eligibility in the recipe carousel and the ingredient search filter.
Pillar structure for food brand content marketing
The pillar structure on content marketing for food brands runs 4 content pillars concurrently: recipe hub (40 to 100 recipes), ingredient comparison guides (12 to 24 guides), sourcing story pages (6 to 12 pages), and buyer intent content (where to buy, subscription vs. one-time, gift bundle guides). Every pillar covers a distinct search intent and every pillar links back to the hero SKU product pages.
Ingredient comparison guide format
Ingredient comparison guides run 1,800 to 3,200 words comparing 2 to 4 ingredient types on 6 to 10 attributes with a comparison table, real-world use case examples, and links to the hero SKU that uses the specific ingredient. Example: organic vs. conventional oats compares nutritional profile, sourcing chain, cost, environmental impact, and taste on a 6-column table. The brand’s SKU appears in the winning column with a product card. These guides rank 3 to 8 months after publication and pull steady-state organic traffic.
Sourcing story pages that build trust
Sourcing story pages name the specific farms, cooperatives, or suppliers the brand sources from, with photos of the farms, farmer quotes, and specific harvest windows. A coffee brand’s Ethiopian farm page ranks for “single-origin Ethiopian coffee” and “Yirgacheffe coffee origin” plus 40 long-tail variations. The sourcing page pulls trust-building traffic that converts at 4 to 6 percent because the shopper landed pattern-matching on transparency and named provenance. Every sourcing page includes farmer or cooperative quotes, harvest dates, and a link back to 3 to 5 hero SKU pages that source from the named supplier.
Vejrø hospitality content case study
Vejrø Resort, a Danish private-island destination with an on-site restaurant focused on organic, locally sourced cuisine, joined us with strong social engagement and no organic-search real estate. Guests found the resort on Instagram but never in Google search for terms like “private island resort Denmark,” “farm-to-table hospitality Denmark,” or “Vejrø restaurant.” The same organic-search gap shows up on DTC food brands running paid social at 20,000 dollars monthly with a broken blog and zero recipe schema.
We built the conversion-focused website with on-site and off-site SEO tuned to the travel-niche keyword clusters, competitor analysis against comparable boutique resorts, and mobile-first design prioritizing guest discovery. Every page carried the structured data qualifying it for Google’s rich results in the hospitality category. Every internal link pushed authority toward the direct-booking conversion path.
Three months later, Vejrø hit 10,000 plus organic visitors, ranked for 200 plus first-page keywords, and pulled a 2.2 percent booking conversion rate from organic traffic. The same pattern applies to content marketing for food brands: recipe schema, ingredient comparison guides, and sourcing story pages pull organic traffic at 20 to 40 percent conversion into hero SKU pages inside 6 months when the content quality matches search intent and every page carries the right structured data markup. Vejrø also proved out the reporting discipline: every monthly report named the exact page, the exact keyword cluster, and the exact search feature (rich result, sitelinks, image pack) driving the incremental organic revenue instead of hiding behind aggregate traffic charts.
Recipe cadence and content calendar for food brands
Recipe cadence on a working food brand content calendar ships 2 to 4 new recipes per week during the first 6 months and drops to 1 per week at maturity. Each recipe takes 4 to 6 hours to produce (write, test in the kitchen, photograph, schema author, publish). At 3 recipes per week, the brand hits 78 recipes inside 6 months plus a backlog of ingredient comparison and sourcing content queued behind the recipe production line.
| Content pillar | Target volume year 1 | Production cost per piece | Refresh cadence |
|---|---|---|---|
| Recipe hub | 40 to 100 recipes | $180 to $320 | Every 12 months |
| Ingredient comparison guides | 12 to 24 guides | $450 to $780 | Every 18 months |
| Sourcing story pages | 6 to 12 pages | $680 to $1,200 | Every 24 months |
| Buyer intent content | 8 to 16 pieces | $220 to $420 | Every 12 months |
Photography as a content calendar constraint
Photography is the actual constraint on recipe cadence, not writing. Every recipe needs 6 to 12 photos: hero shot, ingredient flat lay, prep in progress, plated result, storage, and step shots for the schema markup. A working food brand batches photography 8 recipes at a time to keep the cost per recipe under 200 dollars. Skip the batching and the per-recipe cost climbs to 400 to 600 dollars, which caps recipe cadence at 1 per week and slows organic ranking timeline by 6 months.
Seasonal content calendar planning
Seasonal content calendar planning maps recipes and comparison guides to the seasonal windows they need to rank in. A Christmas cookie recipe needs to publish in September to rank by early December. A Valentine’s chocolate guide needs to publish in November to rank by early February. A back-to-school lunchbox recipe needs to publish in June to rank by late August. The 60-to-90-day ranking curve dictates the calendar.
Creator syndication inside food brand content
Creator syndication on food brand content marketing amplifies the recipe hub through Instagram Reels, TikTok, and YouTube Shorts creators paid to post their own version of the brand’s hero recipes. The creator content pulls net-new audiences into the recipe hub through the creator’s Link in Bio or Amazon Storefront tag. The syndication calendar names 12 to 30 creators per quarter with specific recipes assigned to each.
One brand we picked up had a spreadsheet titled “creator outreach 2023” with 47 rows and 3 responses. All 3 responses were auto-replies. The spreadsheet named zero recipes and offered flat rates below 100 dollars per post. Nobody posts a 30-second video for 87 dollars flat. Nobody.
Creator content commercial terms that work
Working creator content commercial terms run 350 to 1,500 dollars flat per post plus a 12 to 25 percent commission on tagged sales across a 30-day window. The commission mechanic pulls creators into follow-up posts because the incremental revenue continues past the initial fee. Mid-tier creators (30k to 150k followers) hit the sweet spot for food brand content because their engagement rate typically runs 4 to 8 percent versus 0.8 to 1.6 percent on mega-creators.
Content brief structure for creator partnerships
The content brief structure for creator partnerships runs a single page: the SKU, the specific recipe or usage occasion, 3 required brand mentions, 3 restricted claims (no health claims on non-medical SKUs), the pricing angle, the affiliate link, and 3 example videos that hit the tone. The brief avoids over-scripting because over-scripted creator content underperforms native creator voice by 40 to 60 percent on engagement rate.
Buyer intent content for food brand blogs
Buyer intent content on food brand blogs covers 8 to 16 pieces targeting explicit purchase-decision queries: “where to buy [brand],” “[brand] subscription vs. one-time,” “best [category] for [use case],” and “[brand] gift bundle.” Every buyer intent piece runs 1,400 to 2,400 words with a comparison table, product cards, and a clear conversion path to the specific SKU that matches the query intent. Buyer intent content converts at 3 to 6 percent versus 1 to 2 percent on recipe content because the shopper landed already planning to buy, not exploring a usage occasion.
Where-to-buy content structure
Where-to-buy content structure covers online (DTC storefront, Amazon, Target.com, Whole Foods online), retail (specific chain locators with the store finder embedded), and international (customs limitations, retailer partners abroad). Every piece names specific retailers, links to the store locator, and includes an FAQ block covering shipping availability, subscription options, and gift card compatibility. Where-to-buy content ranks for branded discovery queries the DTC storefront otherwise loses to competitor affiliate reviews.
Subscription versus one-time comparison content
Subscription versus one-time comparison content converts subscription commitments at 3 to 6 percent because it addresses the price-sensitivity concern head-on with a specific math table. The piece covers the discount structure (15 percent lifetime), the skip-a-month mechanic, the pause-anytime rule, the cancellation policy, and the specific yearly savings for the brand’s average consumption cadence. Cross-reference the retention structure on our food and beverage marketing retainer page.
Content refresh cadence on food brand pillars
Content refresh cadence on food brand content pillars runs a rolling audit every 12 to 24 months by pillar. Recipes get refreshed every 12 months with new photography, updated schema, and any nutrition or ingredient adjustments. Ingredient comparison guides refresh every 18 months to update market data. Sourcing story pages refresh every 24 months to reflect farm partnership changes and new harvest angles. Buyer intent content refreshes every 12 months to update retailer availability and pricing.
Recipe refresh priority order
Recipe refresh priority runs by organic traffic rank. The top 20 recipes by monthly organic sessions get refreshed first (new photography, schema audit, related recipe internal links, updated nutrition). The next 40 get refreshed at 15 months. The remaining recipes get refreshed opportunistically when the ranking slips past position 15 in Google. Skipping the refresh cadence lets recipe rankings drift out of the top 3 inside 18 months as newer competitor recipes take the position.
Schema audit checklist per refresh
The schema audit checklist per refresh runs 8 items: Recipe schema completeness, aggregateRating count and accuracy, nutrition data accuracy, prepTime and cookTime match the recipe body, image URLs valid at CDN, related recipe internal links working, product card SKU URL live, and Google Search Console rich result eligibility validated. This checklist takes 20 minutes per recipe and prevents the schema drift that costs recipe rankings 20 to 40 positions quietly.
Reporting cadence for food brand content marketing
Reporting cadence on food brand content marketing runs a monthly executive report plus a quarterly business review. The monthly report ships in the first business week and covers organic sessions by pillar, top 10 ranking recipes with position trend, ingredient guide ranking movements, sourcing page performance, and organic-attributed DTC revenue. Every number carries a comparison to the prior month and a plain-language interpretation the founder reads in 7 minutes.
Metrics that matter for content marketing
Metrics that matter for food brand content marketing: organic sessions by pillar, recipe rich result impressions in Search Console, organic conversion rate to hero SKU pages, organic-attributed DTC revenue, and top 20 ranking positions by monthly organic sessions. Vanity metrics that do not matter: total pageviews without conversion context, average time on page without conversion attribution, and social share counts. The monthly report skips the vanity block entirely.
Quarterly business review structure
The quarterly business review runs 90 minutes with the founder, head of content, and SEO lead. Agenda: organic traffic trend by pillar, top 10 winning content pieces, top 10 losing content pieces (candidates for refresh or removal), competitive gap analysis against 5 named competitor brands, and next quarter’s content calendar with recipes and ingredient guides queued. According to Ahrefs content marketing research, brands running quarterly content audits outperform brands running annual audits by 40 to 70 percent on organic revenue over a 24-month window.
Internal linking discipline across food brand content
Internal linking discipline across food brand content moves authority from recipe pages toward hero SKU product pages and comparison guides. Every recipe links to the hero SKU it uses inline (once in the ingredient list, once in a bottom call-out card). Every ingredient comparison guide links to 3 to 6 recipes using the winning ingredient plus the hero SKU product page. Every sourcing story links to the 2 to 4 SKUs sourced from that specific farm or cooperative.
Anchor text strategy across recipe hubs
Anchor text on internal links varies across recipe hubs to avoid over-optimization patterns Google penalizes. Exact-match anchor (“single-origin Ethiopian coffee”) runs on 20 to 30 percent of internal links. Partial-match variations (“our Ethiopian roast”) run on 30 to 40 percent. Branded anchors (the SKU name) run on 20 to 30 percent. Generic anchors (“shop the coffee”) fill the remaining 10 to 20 percent. This ratio holds ranking without triggering the over-optimization penalty that shows up on brands that anchor-text-stuff every internal link with the same exact-match keyword. Cross-reference the linking layer on our food and beverage web design page.
Link equity from ingredient guides to SKU pages
Link equity from ingredient guides passes to SKU pages when the guide’s comparison table names the hero SKU in the winning column with a product card, and when the guide’s body links to 3 to 6 recipes that use the winning ingredient. This 3-hop path (guide to recipe to SKU) pushes authority from a high-traffic informational query down to a high-intent transactional page. According to Search Engine Land SEO coverage, informational content that internally links to transactional pages produces 2 to 4 times higher organic revenue than isolated content silos.
Wrapping up content marketing for food brands
Content marketing for food brands is the organic engine that turns a DTC snack, drink, or CPG storefront into a search-driven revenue channel. Recipe hub of 40 to 100 recipes. Ingredient comparison guides at 12 to 24 pieces. Sourcing story pages at 6 to 12 pieces. Buyer intent content at 8 to 16 pieces. Creator syndication calendar with 12 to 30 creators per quarter. Refresh cadence at 12 to 24 months by pillar. Reporting with organic sessions and organic revenue attribution.
If your DTC food brand is running paid social at 20,000 dollars monthly with a broken blog and zero recipe schema, professional content marketing for food brands pays for itself inside the first 90 days on organic traffic captured. Redefine Web ships content marketing inside our monthly retainer packages. Book a call and we will walk through the last three DTC food brands we built recipe hubs for, pillar by pillar.
Content marketing for food brands starts with a recipe hub because recipe queries account for 40 to 60 percent of high-intent search volume in the food category. Every hero SKU needs 4 to 12 recipes anchored to it, each targeting a specific occasion and audience.
Skip the recipe hub and the brand loses the search real estate that pulls DTC storefront traffic month over month at zero incremental paid cost. Recipe traffic converts at 2 to 4 percent because the shopper landed with usage intent, not passive discovery, which is why food brands win on recipes.
Recipe schema and Google rich result eligibility
Every recipe page ships schema.org Recipe markup including cookTime, prepTime, recipeIngredient, recipeInstructions, nutrition, and aggregateRating. Correctly marked-up recipes qualify for Google’s recipe rich result carousel that pulls 3 to 6 times higher click-through rate than a plain blue link. The schema layer takes 15 minutes per recipe to author and 30 minutes to validate in Google Search Console. Cross-reference the recipe search stack on our food and beverage SEO page.
Recipe hub structure that scales
The recipe hub structure runs 40 to 100 recipes at maturity, organized by hero SKU (4 to 12 recipes per SKU) plus occasion tags (breakfast, weeknight dinner, meal prep, brunch, holiday). Every recipe links back to the hero SKU product page with the SKU embedded in an inline card. The hub earns internal linking value from ingredient comparison guides and the sourcing story pages, which feeds recipe ranking on Google. According to Google Search Central recipe structured data guidance, complete Recipe schema markup is required for eligibility in the recipe carousel and the ingredient search filter.
Pillar structure for food brand content marketing
The pillar structure on content marketing for food brands runs 4 content pillars concurrently: recipe hub (40 to 100 recipes), ingredient comparison guides (12 to 24 guides), sourcing story pages (6 to 12 pages), and buyer intent content (where to buy, subscription vs. one-time, gift bundle guides). Every pillar covers a distinct search intent and every pillar links back to the hero SKU product pages.
Ingredient comparison guide format
Ingredient comparison guides run 1,800 to 3,200 words comparing 2 to 4 ingredient types on 6 to 10 attributes with a comparison table, real-world use case examples, and links to the hero SKU that uses the specific ingredient. Example: organic vs. conventional oats compares nutritional profile, sourcing chain, cost, environmental impact, and taste on a 6-column table. The brand’s SKU appears in the winning column with a product card. These guides rank 3 to 8 months after publication and pull steady-state organic traffic.
Sourcing story pages that build trust
Sourcing story pages name the specific farms, cooperatives, or suppliers the brand sources from, with photos of the farms, farmer quotes, and specific harvest windows. A coffee brand’s Ethiopian farm page ranks for “single-origin Ethiopian coffee” and “Yirgacheffe coffee origin” plus 40 long-tail variations. The sourcing page pulls trust-building traffic that converts at 4 to 6 percent because the shopper landed pattern-matching on transparency and named provenance. Every sourcing page includes farmer or cooperative quotes, harvest dates, and a link back to 3 to 5 hero SKU pages that source from the named supplier.
Vejrø hospitality content case study
Vejrø Resort, a Danish private-island destination with an on-site restaurant focused on organic, locally sourced cuisine, joined us with strong social engagement and no organic-search real estate. Guests found the resort on Instagram but never in Google search for terms like “private island resort Denmark,” “farm-to-table hospitality Denmark,” or “Vejrø restaurant.” The same organic-search gap shows up on DTC food brands running paid social at 20,000 dollars monthly with a broken blog and zero recipe schema.
We built the conversion-focused website with on-site and off-site SEO tuned to the travel-niche keyword clusters, competitor analysis against comparable boutique resorts, and mobile-first design prioritizing guest discovery. Every page carried the structured data qualifying it for Google’s rich results in the hospitality category. Every internal link pushed authority toward the direct-booking conversion path.
Three months later, Vejrø hit 10,000 plus organic visitors, ranked for 200 plus first-page keywords, and pulled a 2.2 percent booking conversion rate from organic traffic. The same pattern applies to content marketing for food brands: recipe schema, ingredient comparison guides, and sourcing story pages pull organic traffic at 20 to 40 percent conversion into hero SKU pages inside 6 months when the content quality matches search intent and every page carries the right structured data markup. Vejrø also proved out the reporting discipline: every monthly report named the exact page, the exact keyword cluster, and the exact search feature (rich result, sitelinks, image pack) driving the incremental organic revenue instead of hiding behind aggregate traffic charts.
Recipe cadence and content calendar for food brands
Recipe cadence on a working food brand content calendar ships 2 to 4 new recipes per week during the first 6 months and drops to 1 per week at maturity. Each recipe takes 4 to 6 hours to produce (write, test in the kitchen, photograph, schema author, publish). At 3 recipes per week, the brand hits 78 recipes inside 6 months plus a backlog of ingredient comparison and sourcing content queued behind the recipe production line.
| Content pillar | Target volume year 1 | Production cost per piece | Refresh cadence |
|---|---|---|---|
| Recipe hub | 40 to 100 recipes | $180 to $320 | Every 12 months |
| Ingredient comparison guides | 12 to 24 guides | $450 to $780 | Every 18 months |
| Sourcing story pages | 6 to 12 pages | $680 to $1,200 | Every 24 months |
| Buyer intent content | 8 to 16 pieces | $220 to $420 | Every 12 months |
Photography as a content calendar constraint
Photography is the actual constraint on recipe cadence, not writing. Every recipe needs 6 to 12 photos: hero shot, ingredient flat lay, prep in progress, plated result, storage, and step shots for the schema markup. A working food brand batches photography 8 recipes at a time to keep the cost per recipe under 200 dollars. Skip the batching and the per-recipe cost climbs to 400 to 600 dollars, which caps recipe cadence at 1 per week and slows organic ranking timeline by 6 months.
Seasonal content calendar planning
Seasonal content calendar planning maps recipes and comparison guides to the seasonal windows they need to rank in. A Christmas cookie recipe needs to publish in September to rank by early December. A Valentine’s chocolate guide needs to publish in November to rank by early February. A back-to-school lunchbox recipe needs to publish in June to rank by late August. The 60-to-90-day ranking curve dictates the calendar.
Creator syndication inside food brand content
Creator syndication on food brand content marketing amplifies the recipe hub through Instagram Reels, TikTok, and YouTube Shorts creators paid to post their own version of the brand’s hero recipes. The creator content pulls net-new audiences into the recipe hub through the creator’s Link in Bio or Amazon Storefront tag. The syndication calendar names 12 to 30 creators per quarter with specific recipes assigned to each.
One brand we picked up had a spreadsheet titled “creator outreach 2023” with 47 rows and 3 responses. All 3 responses were auto-replies. The spreadsheet named zero recipes and offered flat rates below 100 dollars per post. Nobody posts a 30-second video for 87 dollars flat. Nobody.
Creator content commercial terms that work
Working creator content commercial terms run 350 to 1,500 dollars flat per post plus a 12 to 25 percent commission on tagged sales across a 30-day window. The commission mechanic pulls creators into follow-up posts because the incremental revenue continues past the initial fee. Mid-tier creators (30k to 150k followers) hit the sweet spot for food brand content because their engagement rate typically runs 4 to 8 percent versus 0.8 to 1.6 percent on mega-creators.
Content brief structure for creator partnerships
The content brief structure for creator partnerships runs a single page: the SKU, the specific recipe or usage occasion, 3 required brand mentions, 3 restricted claims (no health claims on non-medical SKUs), the pricing angle, the affiliate link, and 3 example videos that hit the tone. The brief avoids over-scripting because over-scripted creator content underperforms native creator voice by 40 to 60 percent on engagement rate.
Buyer intent content for food brand blogs
Buyer intent content on food brand blogs covers 8 to 16 pieces targeting explicit purchase-decision queries: “where to buy [brand],” “[brand] subscription vs. one-time,” “best [category] for [use case],” and “[brand] gift bundle.” Every buyer intent piece runs 1,400 to 2,400 words with a comparison table, product cards, and a clear conversion path to the specific SKU that matches the query intent. Buyer intent content converts at 3 to 6 percent versus 1 to 2 percent on recipe content because the shopper landed already planning to buy, not exploring a usage occasion.
Where-to-buy content structure
Where-to-buy content structure covers online (DTC storefront, Amazon, Target.com, Whole Foods online), retail (specific chain locators with the store finder embedded), and international (customs limitations, retailer partners abroad). Every piece names specific retailers, links to the store locator, and includes an FAQ block covering shipping availability, subscription options, and gift card compatibility. Where-to-buy content ranks for branded discovery queries the DTC storefront otherwise loses to competitor affiliate reviews.
Subscription versus one-time comparison content
Subscription versus one-time comparison content converts subscription commitments at 3 to 6 percent because it addresses the price-sensitivity concern head-on with a specific math table. The piece covers the discount structure (15 percent lifetime), the skip-a-month mechanic, the pause-anytime rule, the cancellation policy, and the specific yearly savings for the brand’s average consumption cadence. Cross-reference the retention structure on our food and beverage marketing retainer page.
Content refresh cadence on food brand pillars
Content refresh cadence on food brand content pillars runs a rolling audit every 12 to 24 months by pillar. Recipes get refreshed every 12 months with new photography, updated schema, and any nutrition or ingredient adjustments. Ingredient comparison guides refresh every 18 months to update market data. Sourcing story pages refresh every 24 months to reflect farm partnership changes and new harvest angles. Buyer intent content refreshes every 12 months to update retailer availability and pricing.
Recipe refresh priority order
Recipe refresh priority runs by organic traffic rank. The top 20 recipes by monthly organic sessions get refreshed first (new photography, schema audit, related recipe internal links, updated nutrition). The next 40 get refreshed at 15 months. The remaining recipes get refreshed opportunistically when the ranking slips past position 15 in Google. Skipping the refresh cadence lets recipe rankings drift out of the top 3 inside 18 months as newer competitor recipes take the position.
Schema audit checklist per refresh
The schema audit checklist per refresh runs 8 items: Recipe schema completeness, aggregateRating count and accuracy, nutrition data accuracy, prepTime and cookTime match the recipe body, image URLs valid at CDN, related recipe internal links working, product card SKU URL live, and Google Search Console rich result eligibility validated. This checklist takes 20 minutes per recipe and prevents the schema drift that costs recipe rankings 20 to 40 positions quietly.
Reporting cadence for food brand content marketing
Reporting cadence on food brand content marketing runs a monthly executive report plus a quarterly business review. The monthly report ships in the first business week and covers organic sessions by pillar, top 10 ranking recipes with position trend, ingredient guide ranking movements, sourcing page performance, and organic-attributed DTC revenue. Every number carries a comparison to the prior month and a plain-language interpretation the founder reads in 7 minutes.
Metrics that matter for content marketing
Metrics that matter for food brand content marketing: organic sessions by pillar, recipe rich result impressions in Search Console, organic conversion rate to hero SKU pages, organic-attributed DTC revenue, and top 20 ranking positions by monthly organic sessions. Vanity metrics that do not matter: total pageviews without conversion context, average time on page without conversion attribution, and social share counts. The monthly report skips the vanity block entirely.
Quarterly business review structure
The quarterly business review runs 90 minutes with the founder, head of content, and SEO lead. Agenda: organic traffic trend by pillar, top 10 winning content pieces, top 10 losing content pieces (candidates for refresh or removal), competitive gap analysis against 5 named competitor brands, and next quarter’s content calendar with recipes and ingredient guides queued. According to Ahrefs content marketing research, brands running quarterly content audits outperform brands running annual audits by 40 to 70 percent on organic revenue over a 24-month window.
Internal linking discipline across food brand content
Internal linking discipline across food brand content moves authority from recipe pages toward hero SKU product pages and comparison guides. Every recipe links to the hero SKU it uses inline (once in the ingredient list, once in a bottom call-out card). Every ingredient comparison guide links to 3 to 6 recipes using the winning ingredient plus the hero SKU product page. Every sourcing story links to the 2 to 4 SKUs sourced from that specific farm or cooperative.
Anchor text strategy across recipe hubs
Anchor text on internal links varies across recipe hubs to avoid over-optimization patterns Google penalizes. Exact-match anchor (“single-origin Ethiopian coffee”) runs on 20 to 30 percent of internal links. Partial-match variations (“our Ethiopian roast”) run on 30 to 40 percent. Branded anchors (the SKU name) run on 20 to 30 percent. Generic anchors (“shop the coffee”) fill the remaining 10 to 20 percent. This ratio holds ranking without triggering the over-optimization penalty that shows up on brands that anchor-text-stuff every internal link with the same exact-match keyword. Cross-reference the linking layer on our food and beverage web design page.
Link equity from ingredient guides to SKU pages
Link equity from ingredient guides passes to SKU pages when the guide’s comparison table names the hero SKU in the winning column with a product card, and when the guide’s body links to 3 to 6 recipes that use the winning ingredient. This 3-hop path (guide to recipe to SKU) pushes authority from a high-traffic informational query down to a high-intent transactional page. According to Search Engine Land SEO coverage, informational content that internally links to transactional pages produces 2 to 4 times higher organic revenue than isolated content silos.
Wrapping up content marketing for food brands
Content marketing for food brands is the organic engine that turns a DTC snack, drink, or CPG storefront into a search-driven revenue channel. Recipe hub of 40 to 100 recipes. Ingredient comparison guides at 12 to 24 pieces. Sourcing story pages at 6 to 12 pieces. Buyer intent content at 8 to 16 pieces. Creator syndication calendar with 12 to 30 creators per quarter. Refresh cadence at 12 to 24 months by pillar. Reporting with organic sessions and organic revenue attribution.
If your DTC food brand is running paid social at 20,000 dollars monthly with a broken blog and zero recipe schema, professional content marketing for food brands pays for itself inside the first 90 days on organic traffic captured. Redefine Web ships content marketing inside our monthly retainer packages. Book a call and we will walk through the last three DTC food brands we built recipe hubs for, pillar by pillar.
Anchor text on internal links varies across recipe hubs to avoid over-optimization patterns Google penalizes. Exact-match anchor (“single-origin Ethiopian coffee”) runs on 20 to 30 percent of internal links. Partial-match variations (“our Ethiopian roast”) run on 30 to 40 percent. Branded anchors (the SKU name) run on 20 to 30 percent. Generic anchors (“shop the coffee”) fill the remaining 10 to 20 percent. This ratio holds ranking without triggering the over-optimization penalty that shows up on brands that anchor-text-stuff every internal link with the same exact-match keyword. Cross-reference the linking layer on our food and beverage web design page.
Link equity from ingredient guides to SKU pages
Link equity from ingredient guides passes to SKU pages when the guide’s comparison table names the hero SKU in the winning column with a product card, and when the guide’s body links to 3 to 6 recipes that use the winning ingredient. This 3-hop path (guide to recipe to SKU) pushes authority from a high-traffic informational query down to a high-intent transactional page. According to Search Engine Land SEO coverage, informational content that internally links to transactional pages produces 2 to 4 times higher organic revenue than isolated content silos.
Wrapping up content marketing for food brands
Content marketing for food brands is the organic engine that turns a DTC snack, drink, or CPG storefront into a search-driven revenue channel. Recipe hub of 40 to 100 recipes. Ingredient comparison guides at 12 to 24 pieces. Sourcing story pages at 6 to 12 pieces. Buyer intent content at 8 to 16 pieces. Creator syndication calendar with 12 to 30 creators per quarter. Refresh cadence at 12 to 24 months by pillar. Reporting with organic sessions and organic revenue attribution.
If your DTC food brand is running paid social at 20,000 dollars monthly with a broken blog and zero recipe schema, professional content marketing for food brands pays for itself inside the first 90 days on organic traffic captured. Redefine Web ships content marketing inside our monthly retainer packages. Book a call and we will walk through the last three DTC food brands we built recipe hubs for, pillar by pillar.
Internal linking discipline across food brand content moves authority from recipe pages toward hero SKU product pages and comparison guides. Every recipe links to the hero SKU it uses inline (once in the ingredient list, once in a bottom call-out card). Every ingredient comparison guide links to 3 to 6 recipes using the winning ingredient plus the hero SKU product page. Every sourcing story links to the 2 to 4 SKUs sourced from that specific farm or cooperative.
Anchor text strategy across recipe hubs
Anchor text on internal links varies across recipe hubs to avoid over-optimization patterns Google penalizes. Exact-match anchor (“single-origin Ethiopian coffee”) runs on 20 to 30 percent of internal links. Partial-match variations (“our Ethiopian roast”) run on 30 to 40 percent. Branded anchors (the SKU name) run on 20 to 30 percent. Generic anchors (“shop the coffee”) fill the remaining 10 to 20 percent. This ratio holds ranking without triggering the over-optimization penalty that shows up on brands that anchor-text-stuff every internal link with the same exact-match keyword. Cross-reference the linking layer on our food and beverage web design page.
Link equity from ingredient guides to SKU pages
Link equity from ingredient guides passes to SKU pages when the guide’s comparison table names the hero SKU in the winning column with a product card, and when the guide’s body links to 3 to 6 recipes that use the winning ingredient. This 3-hop path (guide to recipe to SKU) pushes authority from a high-traffic informational query down to a high-intent transactional page. According to Search Engine Land SEO coverage, informational content that internally links to transactional pages produces 2 to 4 times higher organic revenue than isolated content silos.
Wrapping up content marketing for food brands
Content marketing for food brands is the organic engine that turns a DTC snack, drink, or CPG storefront into a search-driven revenue channel. Recipe hub of 40 to 100 recipes. Ingredient comparison guides at 12 to 24 pieces. Sourcing story pages at 6 to 12 pieces. Buyer intent content at 8 to 16 pieces. Creator syndication calendar with 12 to 30 creators per quarter. Refresh cadence at 12 to 24 months by pillar. Reporting with organic sessions and organic revenue attribution.
If your DTC food brand is running paid social at 20,000 dollars monthly with a broken blog and zero recipe schema, professional content marketing for food brands pays for itself inside the first 90 days on organic traffic captured. Redefine Web ships content marketing inside our monthly retainer packages. Book a call and we will walk through the last three DTC food brands we built recipe hubs for, pillar by pillar.
Content marketing for food brands starts with a recipe hub because recipe queries account for 40 to 60 percent of high-intent search volume in the food category. Every hero SKU needs 4 to 12 recipes anchored to it, each targeting a specific occasion and audience.
Skip the recipe hub and the brand loses the search real estate that pulls DTC storefront traffic month over month at zero incremental paid cost. Recipe traffic converts at 2 to 4 percent because the shopper landed with usage intent, not passive discovery, which is why food brands win on recipes.
Recipe schema and Google rich result eligibility
Every recipe page ships schema.org Recipe markup including cookTime, prepTime, recipeIngredient, recipeInstructions, nutrition, and aggregateRating. Correctly marked-up recipes qualify for Google’s recipe rich result carousel that pulls 3 to 6 times higher click-through rate than a plain blue link. The schema layer takes 15 minutes per recipe to author and 30 minutes to validate in Google Search Console. Cross-reference the recipe search stack on our food and beverage SEO page.
Recipe hub structure that scales
The recipe hub structure runs 40 to 100 recipes at maturity, organized by hero SKU (4 to 12 recipes per SKU) plus occasion tags (breakfast, weeknight dinner, meal prep, brunch, holiday). Every recipe links back to the hero SKU product page with the SKU embedded in an inline card. The hub earns internal linking value from ingredient comparison guides and the sourcing story pages, which feeds recipe ranking on Google. According to Google Search Central recipe structured data guidance, complete Recipe schema markup is required for eligibility in the recipe carousel and the ingredient search filter.
Pillar structure for food brand content marketing
The pillar structure on content marketing for food brands runs 4 content pillars concurrently: recipe hub (40 to 100 recipes), ingredient comparison guides (12 to 24 guides), sourcing story pages (6 to 12 pages), and buyer intent content (where to buy, subscription vs. one-time, gift bundle guides). Every pillar covers a distinct search intent and every pillar links back to the hero SKU product pages.
Ingredient comparison guide format
Ingredient comparison guides run 1,800 to 3,200 words comparing 2 to 4 ingredient types on 6 to 10 attributes with a comparison table, real-world use case examples, and links to the hero SKU that uses the specific ingredient. Example: organic vs. conventional oats compares nutritional profile, sourcing chain, cost, environmental impact, and taste on a 6-column table. The brand’s SKU appears in the winning column with a product card. These guides rank 3 to 8 months after publication and pull steady-state organic traffic.
Sourcing story pages that build trust
Sourcing story pages name the specific farms, cooperatives, or suppliers the brand sources from, with photos of the farms, farmer quotes, and specific harvest windows. A coffee brand’s Ethiopian farm page ranks for “single-origin Ethiopian coffee” and “Yirgacheffe coffee origin” plus 40 long-tail variations. The sourcing page pulls trust-building traffic that converts at 4 to 6 percent because the shopper landed pattern-matching on transparency and named provenance. Every sourcing page includes farmer or cooperative quotes, harvest dates, and a link back to 3 to 5 hero SKU pages that source from the named supplier.
Vejrø hospitality content case study
Vejrø Resort, a Danish private-island destination with an on-site restaurant focused on organic, locally sourced cuisine, joined us with strong social engagement and no organic-search real estate. Guests found the resort on Instagram but never in Google search for terms like “private island resort Denmark,” “farm-to-table hospitality Denmark,” or “Vejrø restaurant.” The same organic-search gap shows up on DTC food brands running paid social at 20,000 dollars monthly with a broken blog and zero recipe schema.
We built the conversion-focused website with on-site and off-site SEO tuned to the travel-niche keyword clusters, competitor analysis against comparable boutique resorts, and mobile-first design prioritizing guest discovery. Every page carried the structured data qualifying it for Google’s rich results in the hospitality category. Every internal link pushed authority toward the direct-booking conversion path.
Three months later, Vejrø hit 10,000 plus organic visitors, ranked for 200 plus first-page keywords, and pulled a 2.2 percent booking conversion rate from organic traffic. The same pattern applies to content marketing for food brands: recipe schema, ingredient comparison guides, and sourcing story pages pull organic traffic at 20 to 40 percent conversion into hero SKU pages inside 6 months when the content quality matches search intent and every page carries the right structured data markup. Vejrø also proved out the reporting discipline: every monthly report named the exact page, the exact keyword cluster, and the exact search feature (rich result, sitelinks, image pack) driving the incremental organic revenue instead of hiding behind aggregate traffic charts.
Recipe cadence and content calendar for food brands
Recipe cadence on a working food brand content calendar ships 2 to 4 new recipes per week during the first 6 months and drops to 1 per week at maturity. Each recipe takes 4 to 6 hours to produce (write, test in the kitchen, photograph, schema author, publish). At 3 recipes per week, the brand hits 78 recipes inside 6 months plus a backlog of ingredient comparison and sourcing content queued behind the recipe production line.
| Content pillar | Target volume year 1 | Production cost per piece | Refresh cadence |
|---|---|---|---|
| Recipe hub | 40 to 100 recipes | $180 to $320 | Every 12 months |
| Ingredient comparison guides | 12 to 24 guides | $450 to $780 | Every 18 months |
| Sourcing story pages | 6 to 12 pages | $680 to $1,200 | Every 24 months |
| Buyer intent content | 8 to 16 pieces | $220 to $420 | Every 12 months |
Photography as a content calendar constraint
Photography is the actual constraint on recipe cadence, not writing. Every recipe needs 6 to 12 photos: hero shot, ingredient flat lay, prep in progress, plated result, storage, and step shots for the schema markup. A working food brand batches photography 8 recipes at a time to keep the cost per recipe under 200 dollars. Skip the batching and the per-recipe cost climbs to 400 to 600 dollars, which caps recipe cadence at 1 per week and slows organic ranking timeline by 6 months.
Seasonal content calendar planning
Seasonal content calendar planning maps recipes and comparison guides to the seasonal windows they need to rank in. A Christmas cookie recipe needs to publish in September to rank by early December. A Valentine’s chocolate guide needs to publish in November to rank by early February. A back-to-school lunchbox recipe needs to publish in June to rank by late August. The 60-to-90-day ranking curve dictates the calendar.
Creator syndication inside food brand content
Creator syndication on food brand content marketing amplifies the recipe hub through Instagram Reels, TikTok, and YouTube Shorts creators paid to post their own version of the brand’s hero recipes. The creator content pulls net-new audiences into the recipe hub through the creator’s Link in Bio or Amazon Storefront tag. The syndication calendar names 12 to 30 creators per quarter with specific recipes assigned to each.
One brand we picked up had a spreadsheet titled “creator outreach 2023” with 47 rows and 3 responses. All 3 responses were auto-replies. The spreadsheet named zero recipes and offered flat rates below 100 dollars per post. Nobody posts a 30-second video for 87 dollars flat. Nobody.
Creator content commercial terms that work
Working creator content commercial terms run 350 to 1,500 dollars flat per post plus a 12 to 25 percent commission on tagged sales across a 30-day window. The commission mechanic pulls creators into follow-up posts because the incremental revenue continues past the initial fee. Mid-tier creators (30k to 150k followers) hit the sweet spot for food brand content because their engagement rate typically runs 4 to 8 percent versus 0.8 to 1.6 percent on mega-creators.
Content brief structure for creator partnerships
The content brief structure for creator partnerships runs a single page: the SKU, the specific recipe or usage occasion, 3 required brand mentions, 3 restricted claims (no health claims on non-medical SKUs), the pricing angle, the affiliate link, and 3 example videos that hit the tone. The brief avoids over-scripting because over-scripted creator content underperforms native creator voice by 40 to 60 percent on engagement rate.
Buyer intent content for food brand blogs
Buyer intent content on food brand blogs covers 8 to 16 pieces targeting explicit purchase-decision queries: “where to buy [brand],” “[brand] subscription vs. one-time,” “best [category] for [use case],” and “[brand] gift bundle.” Every buyer intent piece runs 1,400 to 2,400 words with a comparison table, product cards, and a clear conversion path to the specific SKU that matches the query intent. Buyer intent content converts at 3 to 6 percent versus 1 to 2 percent on recipe content because the shopper landed already planning to buy, not exploring a usage occasion.
Where-to-buy content structure
Where-to-buy content structure covers online (DTC storefront, Amazon, Target.com, Whole Foods online), retail (specific chain locators with the store finder embedded), and international (customs limitations, retailer partners abroad). Every piece names specific retailers, links to the store locator, and includes an FAQ block covering shipping availability, subscription options, and gift card compatibility. Where-to-buy content ranks for branded discovery queries the DTC storefront otherwise loses to competitor affiliate reviews.
Subscription versus one-time comparison content
Subscription versus one-time comparison content converts subscription commitments at 3 to 6 percent because it addresses the price-sensitivity concern head-on with a specific math table. The piece covers the discount structure (15 percent lifetime), the skip-a-month mechanic, the pause-anytime rule, the cancellation policy, and the specific yearly savings for the brand’s average consumption cadence. Cross-reference the retention structure on our food and beverage marketing retainer page.
Content refresh cadence on food brand pillars
Content refresh cadence on food brand content pillars runs a rolling audit every 12 to 24 months by pillar. Recipes get refreshed every 12 months with new photography, updated schema, and any nutrition or ingredient adjustments. Ingredient comparison guides refresh every 18 months to update market data. Sourcing story pages refresh every 24 months to reflect farm partnership changes and new harvest angles. Buyer intent content refreshes every 12 months to update retailer availability and pricing.
Recipe refresh priority order
Recipe refresh priority runs by organic traffic rank. The top 20 recipes by monthly organic sessions get refreshed first (new photography, schema audit, related recipe internal links, updated nutrition). The next 40 get refreshed at 15 months. The remaining recipes get refreshed opportunistically when the ranking slips past position 15 in Google. Skipping the refresh cadence lets recipe rankings drift out of the top 3 inside 18 months as newer competitor recipes take the position.
Schema audit checklist per refresh
The schema audit checklist per refresh runs 8 items: Recipe schema completeness, aggregateRating count and accuracy, nutrition data accuracy, prepTime and cookTime match the recipe body, image URLs valid at CDN, related recipe internal links working, product card SKU URL live, and Google Search Console rich result eligibility validated. This checklist takes 20 minutes per recipe and prevents the schema drift that costs recipe rankings 20 to 40 positions quietly.
Reporting cadence for food brand content marketing
Reporting cadence on food brand content marketing runs a monthly executive report plus a quarterly business review. The monthly report ships in the first business week and covers organic sessions by pillar, top 10 ranking recipes with position trend, ingredient guide ranking movements, sourcing page performance, and organic-attributed DTC revenue. Every number carries a comparison to the prior month and a plain-language interpretation the founder reads in 7 minutes.
Metrics that matter for content marketing
Metrics that matter for food brand content marketing: organic sessions by pillar, recipe rich result impressions in Search Console, organic conversion rate to hero SKU pages, organic-attributed DTC revenue, and top 20 ranking positions by monthly organic sessions. Vanity metrics that do not matter: total pageviews without conversion context, average time on page without conversion attribution, and social share counts. The monthly report skips the vanity block entirely.
Quarterly business review structure
The quarterly business review runs 90 minutes with the founder, head of content, and SEO lead. Agenda: organic traffic trend by pillar, top 10 winning content pieces, top 10 losing content pieces (candidates for refresh or removal), competitive gap analysis against 5 named competitor brands, and next quarter’s content calendar with recipes and ingredient guides queued. According to Ahrefs content marketing research, brands running quarterly content audits outperform brands running annual audits by 40 to 70 percent on organic revenue over a 24-month window.
Internal linking discipline across food brand content
Internal linking discipline across food brand content moves authority from recipe pages toward hero SKU product pages and comparison guides. Every recipe links to the hero SKU it uses inline (once in the ingredient list, once in a bottom call-out card). Every ingredient comparison guide links to 3 to 6 recipes using the winning ingredient plus the hero SKU product page. Every sourcing story links to the 2 to 4 SKUs sourced from that specific farm or cooperative.
Anchor text strategy across recipe hubs
Anchor text on internal links varies across recipe hubs to avoid over-optimization patterns Google penalizes. Exact-match anchor (“single-origin Ethiopian coffee”) runs on 20 to 30 percent of internal links. Partial-match variations (“our Ethiopian roast”) run on 30 to 40 percent. Branded anchors (the SKU name) run on 20 to 30 percent. Generic anchors (“shop the coffee”) fill the remaining 10 to 20 percent. This ratio holds ranking without triggering the over-optimization penalty that shows up on brands that anchor-text-stuff every internal link with the same exact-match keyword. Cross-reference the linking layer on our food and beverage web design page.
Link equity from ingredient guides to SKU pages
Link equity from ingredient guides passes to SKU pages when the guide’s comparison table names the hero SKU in the winning column with a product card, and when the guide’s body links to 3 to 6 recipes that use the winning ingredient. This 3-hop path (guide to recipe to SKU) pushes authority from a high-traffic informational query down to a high-intent transactional page. According to Search Engine Land SEO coverage, informational content that internally links to transactional pages produces 2 to 4 times higher organic revenue than isolated content silos.
Wrapping up content marketing for food brands
Content marketing for food brands is the organic engine that turns a DTC snack, drink, or CPG storefront into a search-driven revenue channel. Recipe hub of 40 to 100 recipes. Ingredient comparison guides at 12 to 24 pieces. Sourcing story pages at 6 to 12 pieces. Buyer intent content at 8 to 16 pieces. Creator syndication calendar with 12 to 30 creators per quarter. Refresh cadence at 12 to 24 months by pillar. Reporting with organic sessions and organic revenue attribution.
If your DTC food brand is running paid social at 20,000 dollars monthly with a broken blog and zero recipe schema, professional content marketing for food brands pays for itself inside the first 90 days on organic traffic captured. Redefine Web ships content marketing inside our monthly retainer packages. Book a call and we will walk through the last three DTC food brands we built recipe hubs for, pillar by pillar.
Content marketing for food brands starts with a recipe hub because recipe queries account for 40 to 60 percent of high-intent search volume in the food category. Every hero SKU needs 4 to 12 recipes anchored to it, each targeting a specific occasion and audience.
Skip the recipe hub and the brand loses the search real estate that pulls DTC storefront traffic month over month at zero incremental paid cost. Recipe traffic converts at 2 to 4 percent because the shopper landed with usage intent, not passive discovery, which is why food brands win on recipes.
Recipe schema and Google rich result eligibility
Every recipe page ships schema.org Recipe markup including cookTime, prepTime, recipeIngredient, recipeInstructions, nutrition, and aggregateRating. Correctly marked-up recipes qualify for Google’s recipe rich result carousel that pulls 3 to 6 times higher click-through rate than a plain blue link. The schema layer takes 15 minutes per recipe to author and 30 minutes to validate in Google Search Console. Cross-reference the recipe search stack on our food and beverage SEO page.
Recipe hub structure that scales
The recipe hub structure runs 40 to 100 recipes at maturity, organized by hero SKU (4 to 12 recipes per SKU) plus occasion tags (breakfast, weeknight dinner, meal prep, brunch, holiday). Every recipe links back to the hero SKU product page with the SKU embedded in an inline card. The hub earns internal linking value from ingredient comparison guides and the sourcing story pages, which feeds recipe ranking on Google. According to Google Search Central recipe structured data guidance, complete Recipe schema markup is required for eligibility in the recipe carousel and the ingredient search filter.
Pillar structure for food brand content marketing
The pillar structure on content marketing for food brands runs 4 content pillars concurrently: recipe hub (40 to 100 recipes), ingredient comparison guides (12 to 24 guides), sourcing story pages (6 to 12 pages), and buyer intent content (where to buy, subscription vs. one-time, gift bundle guides). Every pillar covers a distinct search intent and every pillar links back to the hero SKU product pages.
Ingredient comparison guide format
Ingredient comparison guides run 1,800 to 3,200 words comparing 2 to 4 ingredient types on 6 to 10 attributes with a comparison table, real-world use case examples, and links to the hero SKU that uses the specific ingredient. Example: organic vs. conventional oats compares nutritional profile, sourcing chain, cost, environmental impact, and taste on a 6-column table. The brand’s SKU appears in the winning column with a product card. These guides rank 3 to 8 months after publication and pull steady-state organic traffic.
Sourcing story pages that build trust
Sourcing story pages name the specific farms, cooperatives, or suppliers the brand sources from, with photos of the farms, farmer quotes, and specific harvest windows. A coffee brand’s Ethiopian farm page ranks for “single-origin Ethiopian coffee” and “Yirgacheffe coffee origin” plus 40 long-tail variations. The sourcing page pulls trust-building traffic that converts at 4 to 6 percent because the shopper landed pattern-matching on transparency and named provenance. Every sourcing page includes farmer or cooperative quotes, harvest dates, and a link back to 3 to 5 hero SKU pages that source from the named supplier.
Vejrø hospitality content case study
Vejrø Resort, a Danish private-island destination with an on-site restaurant focused on organic, locally sourced cuisine, joined us with strong social engagement and no organic-search real estate. Guests found the resort on Instagram but never in Google search for terms like “private island resort Denmark,” “farm-to-table hospitality Denmark,” or “Vejrø restaurant.” The same organic-search gap shows up on DTC food brands running paid social at 20,000 dollars monthly with a broken blog and zero recipe schema.
We built the conversion-focused website with on-site and off-site SEO tuned to the travel-niche keyword clusters, competitor analysis against comparable boutique resorts, and mobile-first design prioritizing guest discovery. Every page carried the structured data qualifying it for Google’s rich results in the hospitality category. Every internal link pushed authority toward the direct-booking conversion path.
Three months later, Vejrø hit 10,000 plus organic visitors, ranked for 200 plus first-page keywords, and pulled a 2.2 percent booking conversion rate from organic traffic. The same pattern applies to content marketing for food brands: recipe schema, ingredient comparison guides, and sourcing story pages pull organic traffic at 20 to 40 percent conversion into hero SKU pages inside 6 months when the content quality matches search intent and every page carries the right structured data markup. Vejrø also proved out the reporting discipline: every monthly report named the exact page, the exact keyword cluster, and the exact search feature (rich result, sitelinks, image pack) driving the incremental organic revenue instead of hiding behind aggregate traffic charts.
Recipe cadence and content calendar for food brands
Recipe cadence on a working food brand content calendar ships 2 to 4 new recipes per week during the first 6 months and drops to 1 per week at maturity. Each recipe takes 4 to 6 hours to produce (write, test in the kitchen, photograph, schema author, publish). At 3 recipes per week, the brand hits 78 recipes inside 6 months plus a backlog of ingredient comparison and sourcing content queued behind the recipe production line.
| Content pillar | Target volume year 1 | Production cost per piece | Refresh cadence |
|---|---|---|---|
| Recipe hub | 40 to 100 recipes | $180 to $320 | Every 12 months |
| Ingredient comparison guides | 12 to 24 guides | $450 to $780 | Every 18 months |
| Sourcing story pages | 6 to 12 pages | $680 to $1,200 | Every 24 months |
| Buyer intent content | 8 to 16 pieces | $220 to $420 | Every 12 months |
Photography as a content calendar constraint
Photography is the actual constraint on recipe cadence, not writing. Every recipe needs 6 to 12 photos: hero shot, ingredient flat lay, prep in progress, plated result, storage, and step shots for the schema markup. A working food brand batches photography 8 recipes at a time to keep the cost per recipe under 200 dollars. Skip the batching and the per-recipe cost climbs to 400 to 600 dollars, which caps recipe cadence at 1 per week and slows organic ranking timeline by 6 months.
Seasonal content calendar planning
Seasonal content calendar planning maps recipes and comparison guides to the seasonal windows they need to rank in. A Christmas cookie recipe needs to publish in September to rank by early December. A Valentine’s chocolate guide needs to publish in November to rank by early February. A back-to-school lunchbox recipe needs to publish in June to rank by late August. The 60-to-90-day ranking curve dictates the calendar.
Creator syndication inside food brand content
Creator syndication on food brand content marketing amplifies the recipe hub through Instagram Reels, TikTok, and YouTube Shorts creators paid to post their own version of the brand’s hero recipes. The creator content pulls net-new audiences into the recipe hub through the creator’s Link in Bio or Amazon Storefront tag. The syndication calendar names 12 to 30 creators per quarter with specific recipes assigned to each.
One brand we picked up had a spreadsheet titled “creator outreach 2023” with 47 rows and 3 responses. All 3 responses were auto-replies. The spreadsheet named zero recipes and offered flat rates below 100 dollars per post. Nobody posts a 30-second video for 87 dollars flat. Nobody.
Creator content commercial terms that work
Working creator content commercial terms run 350 to 1,500 dollars flat per post plus a 12 to 25 percent commission on tagged sales across a 30-day window. The commission mechanic pulls creators into follow-up posts because the incremental revenue continues past the initial fee. Mid-tier creators (30k to 150k followers) hit the sweet spot for food brand content because their engagement rate typically runs 4 to 8 percent versus 0.8 to 1.6 percent on mega-creators.
Content brief structure for creator partnerships
The content brief structure for creator partnerships runs a single page: the SKU, the specific recipe or usage occasion, 3 required brand mentions, 3 restricted claims (no health claims on non-medical SKUs), the pricing angle, the affiliate link, and 3 example videos that hit the tone. The brief avoids over-scripting because over-scripted creator content underperforms native creator voice by 40 to 60 percent on engagement rate.
Buyer intent content for food brand blogs
Buyer intent content on food brand blogs covers 8 to 16 pieces targeting explicit purchase-decision queries: “where to buy [brand],” “[brand] subscription vs. one-time,” “best [category] for [use case],” and “[brand] gift bundle.” Every buyer intent piece runs 1,400 to 2,400 words with a comparison table, product cards, and a clear conversion path to the specific SKU that matches the query intent. Buyer intent content converts at 3 to 6 percent versus 1 to 2 percent on recipe content because the shopper landed already planning to buy, not exploring a usage occasion.
Where-to-buy content structure
Where-to-buy content structure covers online (DTC storefront, Amazon, Target.com, Whole Foods online), retail (specific chain locators with the store finder embedded), and international (customs limitations, retailer partners abroad). Every piece names specific retailers, links to the store locator, and includes an FAQ block covering shipping availability, subscription options, and gift card compatibility. Where-to-buy content ranks for branded discovery queries the DTC storefront otherwise loses to competitor affiliate reviews.
Subscription versus one-time comparison content
Subscription versus one-time comparison content converts subscription commitments at 3 to 6 percent because it addresses the price-sensitivity concern head-on with a specific math table. The piece covers the discount structure (15 percent lifetime), the skip-a-month mechanic, the pause-anytime rule, the cancellation policy, and the specific yearly savings for the brand’s average consumption cadence. Cross-reference the retention structure on our food and beverage marketing retainer page.
Content refresh cadence on food brand pillars
Content refresh cadence on food brand content pillars runs a rolling audit every 12 to 24 months by pillar. Recipes get refreshed every 12 months with new photography, updated schema, and any nutrition or ingredient adjustments. Ingredient comparison guides refresh every 18 months to update market data. Sourcing story pages refresh every 24 months to reflect farm partnership changes and new harvest angles. Buyer intent content refreshes every 12 months to update retailer availability and pricing.
Recipe refresh priority order
Recipe refresh priority runs by organic traffic rank. The top 20 recipes by monthly organic sessions get refreshed first (new photography, schema audit, related recipe internal links, updated nutrition). The next 40 get refreshed at 15 months. The remaining recipes get refreshed opportunistically when the ranking slips past position 15 in Google. Skipping the refresh cadence lets recipe rankings drift out of the top 3 inside 18 months as newer competitor recipes take the position.
Schema audit checklist per refresh
The schema audit checklist per refresh runs 8 items: Recipe schema completeness, aggregateRating count and accuracy, nutrition data accuracy, prepTime and cookTime match the recipe body, image URLs valid at CDN, related recipe internal links working, product card SKU URL live, and Google Search Console rich result eligibility validated. This checklist takes 20 minutes per recipe and prevents the schema drift that costs recipe rankings 20 to 40 positions quietly.
Reporting cadence for food brand content marketing
Reporting cadence on food brand content marketing runs a monthly executive report plus a quarterly business review. The monthly report ships in the first business week and covers organic sessions by pillar, top 10 ranking recipes with position trend, ingredient guide ranking movements, sourcing page performance, and organic-attributed DTC revenue. Every number carries a comparison to the prior month and a plain-language interpretation the founder reads in 7 minutes.
Metrics that matter for content marketing
Metrics that matter for food brand content marketing: organic sessions by pillar, recipe rich result impressions in Search Console, organic conversion rate to hero SKU pages, organic-attributed DTC revenue, and top 20 ranking positions by monthly organic sessions. Vanity metrics that do not matter: total pageviews without conversion context, average time on page without conversion attribution, and social share counts. The monthly report skips the vanity block entirely.
Quarterly business review structure
The quarterly business review runs 90 minutes with the founder, head of content, and SEO lead. Agenda: organic traffic trend by pillar, top 10 winning content pieces, top 10 losing content pieces (candidates for refresh or removal), competitive gap analysis against 5 named competitor brands, and next quarter’s content calendar with recipes and ingredient guides queued. According to Ahrefs content marketing research, brands running quarterly content audits outperform brands running annual audits by 40 to 70 percent on organic revenue over a 24-month window.
Internal linking discipline across food brand content
Internal linking discipline across food brand content moves authority from recipe pages toward hero SKU product pages and comparison guides. Every recipe links to the hero SKU it uses inline (once in the ingredient list, once in a bottom call-out card). Every ingredient comparison guide links to 3 to 6 recipes using the winning ingredient plus the hero SKU product page. Every sourcing story links to the 2 to 4 SKUs sourced from that specific farm or cooperative.
Anchor text strategy across recipe hubs
Anchor text on internal links varies across recipe hubs to avoid over-optimization patterns Google penalizes. Exact-match anchor (“single-origin Ethiopian coffee”) runs on 20 to 30 percent of internal links. Partial-match variations (“our Ethiopian roast”) run on 30 to 40 percent. Branded anchors (the SKU name) run on 20 to 30 percent. Generic anchors (“shop the coffee”) fill the remaining 10 to 20 percent. This ratio holds ranking without triggering the over-optimization penalty that shows up on brands that anchor-text-stuff every internal link with the same exact-match keyword. Cross-reference the linking layer on our food and beverage web design page.
Link equity from ingredient guides to SKU pages
Link equity from ingredient guides passes to SKU pages when the guide’s comparison table names the hero SKU in the winning column with a product card, and when the guide’s body links to 3 to 6 recipes that use the winning ingredient. This 3-hop path (guide to recipe to SKU) pushes authority from a high-traffic informational query down to a high-intent transactional page. According to Search Engine Land SEO coverage, informational content that internally links to transactional pages produces 2 to 4 times higher organic revenue than isolated content silos.
Wrapping up content marketing for food brands
Content marketing for food brands is the organic engine that turns a DTC snack, drink, or CPG storefront into a search-driven revenue channel. Recipe hub of 40 to 100 recipes. Ingredient comparison guides at 12 to 24 pieces. Sourcing story pages at 6 to 12 pieces. Buyer intent content at 8 to 16 pieces. Creator syndication calendar with 12 to 30 creators per quarter. Refresh cadence at 12 to 24 months by pillar. Reporting with organic sessions and organic revenue attribution.
If your DTC food brand is running paid social at 20,000 dollars monthly with a broken blog and zero recipe schema, professional content marketing for food brands pays for itself inside the first 90 days on organic traffic captured. Redefine Web ships content marketing inside our monthly retainer packages. Book a call and we will walk through the last three DTC food brands we built recipe hubs for, pillar by pillar.
Internal linking discipline across food brand content moves authority from recipe pages toward hero SKU product pages and comparison guides. Every recipe links to the hero SKU it uses inline (once in the ingredient list, once in a bottom call-out card). Every ingredient comparison guide links to 3 to 6 recipes using the winning ingredient plus the hero SKU product page. Every sourcing story links to the 2 to 4 SKUs sourced from that specific farm or cooperative.
Anchor text strategy across recipe hubs
Anchor text on internal links varies across recipe hubs to avoid over-optimization patterns Google penalizes. Exact-match anchor (“single-origin Ethiopian coffee”) runs on 20 to 30 percent of internal links. Partial-match variations (“our Ethiopian roast”) run on 30 to 40 percent. Branded anchors (the SKU name) run on 20 to 30 percent. Generic anchors (“shop the coffee”) fill the remaining 10 to 20 percent. This ratio holds ranking without triggering the over-optimization penalty that shows up on brands that anchor-text-stuff every internal link with the same exact-match keyword. Cross-reference the linking layer on our food and beverage web design page.
Link equity from ingredient guides to SKU pages
Link equity from ingredient guides passes to SKU pages when the guide’s comparison table names the hero SKU in the winning column with a product card, and when the guide’s body links to 3 to 6 recipes that use the winning ingredient. This 3-hop path (guide to recipe to SKU) pushes authority from a high-traffic informational query down to a high-intent transactional page. According to Search Engine Land SEO coverage, informational content that internally links to transactional pages produces 2 to 4 times higher organic revenue than isolated content silos.
Wrapping up content marketing for food brands
Content marketing for food brands is the organic engine that turns a DTC snack, drink, or CPG storefront into a search-driven revenue channel. Recipe hub of 40 to 100 recipes. Ingredient comparison guides at 12 to 24 pieces. Sourcing story pages at 6 to 12 pieces. Buyer intent content at 8 to 16 pieces. Creator syndication calendar with 12 to 30 creators per quarter. Refresh cadence at 12 to 24 months by pillar. Reporting with organic sessions and organic revenue attribution.
If your DTC food brand is running paid social at 20,000 dollars monthly with a broken blog and zero recipe schema, professional content marketing for food brands pays for itself inside the first 90 days on organic traffic captured. Redefine Web ships content marketing inside our monthly retainer packages. Book a call and we will walk through the last three DTC food brands we built recipe hubs for, pillar by pillar.
Content marketing for food brands starts with a recipe hub because recipe queries account for 40 to 60 percent of high-intent search volume in the food category. Every hero SKU needs 4 to 12 recipes anchored to it, each targeting a specific occasion and audience.
Skip the recipe hub and the brand loses the search real estate that pulls DTC storefront traffic month over month at zero incremental paid cost. Recipe traffic converts at 2 to 4 percent because the shopper landed with usage intent, not passive discovery, which is why food brands win on recipes.
Recipe schema and Google rich result eligibility
Every recipe page ships schema.org Recipe markup including cookTime, prepTime, recipeIngredient, recipeInstructions, nutrition, and aggregateRating. Correctly marked-up recipes qualify for Google’s recipe rich result carousel that pulls 3 to 6 times higher click-through rate than a plain blue link. The schema layer takes 15 minutes per recipe to author and 30 minutes to validate in Google Search Console. Cross-reference the recipe search stack on our food and beverage SEO page.
Recipe hub structure that scales
The recipe hub structure runs 40 to 100 recipes at maturity, organized by hero SKU (4 to 12 recipes per SKU) plus occasion tags (breakfast, weeknight dinner, meal prep, brunch, holiday). Every recipe links back to the hero SKU product page with the SKU embedded in an inline card. The hub earns internal linking value from ingredient comparison guides and the sourcing story pages, which feeds recipe ranking on Google. According to Google Search Central recipe structured data guidance, complete Recipe schema markup is required for eligibility in the recipe carousel and the ingredient search filter.
Pillar structure for food brand content marketing
The pillar structure on content marketing for food brands runs 4 content pillars concurrently: recipe hub (40 to 100 recipes), ingredient comparison guides (12 to 24 guides), sourcing story pages (6 to 12 pages), and buyer intent content (where to buy, subscription vs. one-time, gift bundle guides). Every pillar covers a distinct search intent and every pillar links back to the hero SKU product pages.
Ingredient comparison guide format
Ingredient comparison guides run 1,800 to 3,200 words comparing 2 to 4 ingredient types on 6 to 10 attributes with a comparison table, real-world use case examples, and links to the hero SKU that uses the specific ingredient. Example: organic vs. conventional oats compares nutritional profile, sourcing chain, cost, environmental impact, and taste on a 6-column table. The brand’s SKU appears in the winning column with a product card. These guides rank 3 to 8 months after publication and pull steady-state organic traffic.
Sourcing story pages that build trust
Sourcing story pages name the specific farms, cooperatives, or suppliers the brand sources from, with photos of the farms, farmer quotes, and specific harvest windows. A coffee brand’s Ethiopian farm page ranks for “single-origin Ethiopian coffee” and “Yirgacheffe coffee origin” plus 40 long-tail variations. The sourcing page pulls trust-building traffic that converts at 4 to 6 percent because the shopper landed pattern-matching on transparency and named provenance. Every sourcing page includes farmer or cooperative quotes, harvest dates, and a link back to 3 to 5 hero SKU pages that source from the named supplier.
Vejrø hospitality content case study
Vejrø Resort, a Danish private-island destination with an on-site restaurant focused on organic, locally sourced cuisine, joined us with strong social engagement and no organic-search real estate. Guests found the resort on Instagram but never in Google search for terms like “private island resort Denmark,” “farm-to-table hospitality Denmark,” or “Vejrø restaurant.” The same organic-search gap shows up on DTC food brands running paid social at 20,000 dollars monthly with a broken blog and zero recipe schema.
We built the conversion-focused website with on-site and off-site SEO tuned to the travel-niche keyword clusters, competitor analysis against comparable boutique resorts, and mobile-first design prioritizing guest discovery. Every page carried the structured data qualifying it for Google’s rich results in the hospitality category. Every internal link pushed authority toward the direct-booking conversion path.
Three months later, Vejrø hit 10,000 plus organic visitors, ranked for 200 plus first-page keywords, and pulled a 2.2 percent booking conversion rate from organic traffic. The same pattern applies to content marketing for food brands: recipe schema, ingredient comparison guides, and sourcing story pages pull organic traffic at 20 to 40 percent conversion into hero SKU pages inside 6 months when the content quality matches search intent and every page carries the right structured data markup. Vejrø also proved out the reporting discipline: every monthly report named the exact page, the exact keyword cluster, and the exact search feature (rich result, sitelinks, image pack) driving the incremental organic revenue instead of hiding behind aggregate traffic charts.
Recipe cadence and content calendar for food brands
Recipe cadence on a working food brand content calendar ships 2 to 4 new recipes per week during the first 6 months and drops to 1 per week at maturity. Each recipe takes 4 to 6 hours to produce (write, test in the kitchen, photograph, schema author, publish). At 3 recipes per week, the brand hits 78 recipes inside 6 months plus a backlog of ingredient comparison and sourcing content queued behind the recipe production line.
| Content pillar | Target volume year 1 | Production cost per piece | Refresh cadence |
|---|---|---|---|
| Recipe hub | 40 to 100 recipes | $180 to $320 | Every 12 months |
| Ingredient comparison guides | 12 to 24 guides | $450 to $780 | Every 18 months |
| Sourcing story pages | 6 to 12 pages | $680 to $1,200 | Every 24 months |
| Buyer intent content | 8 to 16 pieces | $220 to $420 | Every 12 months |
Photography as a content calendar constraint
Photography is the actual constraint on recipe cadence, not writing. Every recipe needs 6 to 12 photos: hero shot, ingredient flat lay, prep in progress, plated result, storage, and step shots for the schema markup. A working food brand batches photography 8 recipes at a time to keep the cost per recipe under 200 dollars. Skip the batching and the per-recipe cost climbs to 400 to 600 dollars, which caps recipe cadence at 1 per week and slows organic ranking timeline by 6 months.
Seasonal content calendar planning
Seasonal content calendar planning maps recipes and comparison guides to the seasonal windows they need to rank in. A Christmas cookie recipe needs to publish in September to rank by early December. A Valentine’s chocolate guide needs to publish in November to rank by early February. A back-to-school lunchbox recipe needs to publish in June to rank by late August. The 60-to-90-day ranking curve dictates the calendar.
Creator syndication inside food brand content
Creator syndication on food brand content marketing amplifies the recipe hub through Instagram Reels, TikTok, and YouTube Shorts creators paid to post their own version of the brand’s hero recipes. The creator content pulls net-new audiences into the recipe hub through the creator’s Link in Bio or Amazon Storefront tag. The syndication calendar names 12 to 30 creators per quarter with specific recipes assigned to each.
One brand we picked up had a spreadsheet titled “creator outreach 2023” with 47 rows and 3 responses. All 3 responses were auto-replies. The spreadsheet named zero recipes and offered flat rates below 100 dollars per post. Nobody posts a 30-second video for 87 dollars flat. Nobody.
Creator content commercial terms that work
Working creator content commercial terms run 350 to 1,500 dollars flat per post plus a 12 to 25 percent commission on tagged sales across a 30-day window. The commission mechanic pulls creators into follow-up posts because the incremental revenue continues past the initial fee. Mid-tier creators (30k to 150k followers) hit the sweet spot for food brand content because their engagement rate typically runs 4 to 8 percent versus 0.8 to 1.6 percent on mega-creators.
Content brief structure for creator partnerships
The content brief structure for creator partnerships runs a single page: the SKU, the specific recipe or usage occasion, 3 required brand mentions, 3 restricted claims (no health claims on non-medical SKUs), the pricing angle, the affiliate link, and 3 example videos that hit the tone. The brief avoids over-scripting because over-scripted creator content underperforms native creator voice by 40 to 60 percent on engagement rate.
Buyer intent content for food brand blogs
Buyer intent content on food brand blogs covers 8 to 16 pieces targeting explicit purchase-decision queries: “where to buy [brand],” “[brand] subscription vs. one-time,” “best [category] for [use case],” and “[brand] gift bundle.” Every buyer intent piece runs 1,400 to 2,400 words with a comparison table, product cards, and a clear conversion path to the specific SKU that matches the query intent. Buyer intent content converts at 3 to 6 percent versus 1 to 2 percent on recipe content because the shopper landed already planning to buy, not exploring a usage occasion.
Where-to-buy content structure
Where-to-buy content structure covers online (DTC storefront, Amazon, Target.com, Whole Foods online), retail (specific chain locators with the store finder embedded), and international (customs limitations, retailer partners abroad). Every piece names specific retailers, links to the store locator, and includes an FAQ block covering shipping availability, subscription options, and gift card compatibility. Where-to-buy content ranks for branded discovery queries the DTC storefront otherwise loses to competitor affiliate reviews.
Subscription versus one-time comparison content
Subscription versus one-time comparison content converts subscription commitments at 3 to 6 percent because it addresses the price-sensitivity concern head-on with a specific math table. The piece covers the discount structure (15 percent lifetime), the skip-a-month mechanic, the pause-anytime rule, the cancellation policy, and the specific yearly savings for the brand’s average consumption cadence. Cross-reference the retention structure on our food and beverage marketing retainer page.
Content refresh cadence on food brand pillars
Content refresh cadence on food brand content pillars runs a rolling audit every 12 to 24 months by pillar. Recipes get refreshed every 12 months with new photography, updated schema, and any nutrition or ingredient adjustments. Ingredient comparison guides refresh every 18 months to update market data. Sourcing story pages refresh every 24 months to reflect farm partnership changes and new harvest angles. Buyer intent content refreshes every 12 months to update retailer availability and pricing.
Recipe refresh priority order
Recipe refresh priority runs by organic traffic rank. The top 20 recipes by monthly organic sessions get refreshed first (new photography, schema audit, related recipe internal links, updated nutrition). The next 40 get refreshed at 15 months. The remaining recipes get refreshed opportunistically when the ranking slips past position 15 in Google. Skipping the refresh cadence lets recipe rankings drift out of the top 3 inside 18 months as newer competitor recipes take the position.
Schema audit checklist per refresh
The schema audit checklist per refresh runs 8 items: Recipe schema completeness, aggregateRating count and accuracy, nutrition data accuracy, prepTime and cookTime match the recipe body, image URLs valid at CDN, related recipe internal links working, product card SKU URL live, and Google Search Console rich result eligibility validated. This checklist takes 20 minutes per recipe and prevents the schema drift that costs recipe rankings 20 to 40 positions quietly.
Reporting cadence for food brand content marketing
Reporting cadence on food brand content marketing runs a monthly executive report plus a quarterly business review. The monthly report ships in the first business week and covers organic sessions by pillar, top 10 ranking recipes with position trend, ingredient guide ranking movements, sourcing page performance, and organic-attributed DTC revenue. Every number carries a comparison to the prior month and a plain-language interpretation the founder reads in 7 minutes.
Metrics that matter for content marketing
Metrics that matter for food brand content marketing: organic sessions by pillar, recipe rich result impressions in Search Console, organic conversion rate to hero SKU pages, organic-attributed DTC revenue, and top 20 ranking positions by monthly organic sessions. Vanity metrics that do not matter: total pageviews without conversion context, average time on page without conversion attribution, and social share counts. The monthly report skips the vanity block entirely.
Quarterly business review structure
The quarterly business review runs 90 minutes with the founder, head of content, and SEO lead. Agenda: organic traffic trend by pillar, top 10 winning content pieces, top 10 losing content pieces (candidates for refresh or removal), competitive gap analysis against 5 named competitor brands, and next quarter’s content calendar with recipes and ingredient guides queued. According to Ahrefs content marketing research, brands running quarterly content audits outperform brands running annual audits by 40 to 70 percent on organic revenue over a 24-month window.
Internal linking discipline across food brand content
Internal linking discipline across food brand content moves authority from recipe pages toward hero SKU product pages and comparison guides. Every recipe links to the hero SKU it uses inline (once in the ingredient list, once in a bottom call-out card). Every ingredient comparison guide links to 3 to 6 recipes using the winning ingredient plus the hero SKU product page. Every sourcing story links to the 2 to 4 SKUs sourced from that specific farm or cooperative.
Anchor text strategy across recipe hubs
Anchor text on internal links varies across recipe hubs to avoid over-optimization patterns Google penalizes. Exact-match anchor (“single-origin Ethiopian coffee”) runs on 20 to 30 percent of internal links. Partial-match variations (“our Ethiopian roast”) run on 30 to 40 percent. Branded anchors (the SKU name) run on 20 to 30 percent. Generic anchors (“shop the coffee”) fill the remaining 10 to 20 percent. This ratio holds ranking without triggering the over-optimization penalty that shows up on brands that anchor-text-stuff every internal link with the same exact-match keyword. Cross-reference the linking layer on our food and beverage web design page.
Link equity from ingredient guides to SKU pages
Link equity from ingredient guides passes to SKU pages when the guide’s comparison table names the hero SKU in the winning column with a product card, and when the guide’s body links to 3 to 6 recipes that use the winning ingredient. This 3-hop path (guide to recipe to SKU) pushes authority from a high-traffic informational query down to a high-intent transactional page. According to Search Engine Land SEO coverage, informational content that internally links to transactional pages produces 2 to 4 times higher organic revenue than isolated content silos.
Wrapping up content marketing for food brands
Content marketing for food brands is the organic engine that turns a DTC snack, drink, or CPG storefront into a search-driven revenue channel. Recipe hub of 40 to 100 recipes. Ingredient comparison guides at 12 to 24 pieces. Sourcing story pages at 6 to 12 pieces. Buyer intent content at 8 to 16 pieces. Creator syndication calendar with 12 to 30 creators per quarter. Refresh cadence at 12 to 24 months by pillar. Reporting with organic sessions and organic revenue attribution.
If your DTC food brand is running paid social at 20,000 dollars monthly with a broken blog and zero recipe schema, professional content marketing for food brands pays for itself inside the first 90 days on organic traffic captured. Redefine Web ships content marketing inside our monthly retainer packages. Book a call and we will walk through the last three DTC food brands we built recipe hubs for, pillar by pillar.
Content marketing for food brands starts with a recipe hub because recipe queries account for 40 to 60 percent of high-intent search volume in the food category. Every hero SKU needs 4 to 12 recipes anchored to it, each targeting a specific occasion and audience.
Skip the recipe hub and the brand loses the search real estate that pulls DTC storefront traffic month over month at zero incremental paid cost. Recipe traffic converts at 2 to 4 percent because the shopper landed with usage intent, not passive discovery, which is why food brands win on recipes.
Recipe schema and Google rich result eligibility
Every recipe page ships schema.org Recipe markup including cookTime, prepTime, recipeIngredient, recipeInstructions, nutrition, and aggregateRating. Correctly marked-up recipes qualify for Google’s recipe rich result carousel that pulls 3 to 6 times higher click-through rate than a plain blue link. The schema layer takes 15 minutes per recipe to author and 30 minutes to validate in Google Search Console. Cross-reference the recipe search stack on our food and beverage SEO page.
Recipe hub structure that scales
The recipe hub structure runs 40 to 100 recipes at maturity, organized by hero SKU (4 to 12 recipes per SKU) plus occasion tags (breakfast, weeknight dinner, meal prep, brunch, holiday). Every recipe links back to the hero SKU product page with the SKU embedded in an inline card. The hub earns internal linking value from ingredient comparison guides and the sourcing story pages, which feeds recipe ranking on Google. According to Google Search Central recipe structured data guidance, complete Recipe schema markup is required for eligibility in the recipe carousel and the ingredient search filter.
Pillar structure for food brand content marketing
The pillar structure on content marketing for food brands runs 4 content pillars concurrently: recipe hub (40 to 100 recipes), ingredient comparison guides (12 to 24 guides), sourcing story pages (6 to 12 pages), and buyer intent content (where to buy, subscription vs. one-time, gift bundle guides). Every pillar covers a distinct search intent and every pillar links back to the hero SKU product pages.
Ingredient comparison guide format
Ingredient comparison guides run 1,800 to 3,200 words comparing 2 to 4 ingredient types on 6 to 10 attributes with a comparison table, real-world use case examples, and links to the hero SKU that uses the specific ingredient. Example: organic vs. conventional oats compares nutritional profile, sourcing chain, cost, environmental impact, and taste on a 6-column table. The brand’s SKU appears in the winning column with a product card. These guides rank 3 to 8 months after publication and pull steady-state organic traffic.
Sourcing story pages that build trust
Sourcing story pages name the specific farms, cooperatives, or suppliers the brand sources from, with photos of the farms, farmer quotes, and specific harvest windows. A coffee brand’s Ethiopian farm page ranks for “single-origin Ethiopian coffee” and “Yirgacheffe coffee origin” plus 40 long-tail variations. The sourcing page pulls trust-building traffic that converts at 4 to 6 percent because the shopper landed pattern-matching on transparency and named provenance. Every sourcing page includes farmer or cooperative quotes, harvest dates, and a link back to 3 to 5 hero SKU pages that source from the named supplier.
Vejrø hospitality content case study
Vejrø Resort, a Danish private-island destination with an on-site restaurant focused on organic, locally sourced cuisine, joined us with strong social engagement and no organic-search real estate. Guests found the resort on Instagram but never in Google search for terms like “private island resort Denmark,” “farm-to-table hospitality Denmark,” or “Vejrø restaurant.” The same organic-search gap shows up on DTC food brands running paid social at 20,000 dollars monthly with a broken blog and zero recipe schema.
We built the conversion-focused website with on-site and off-site SEO tuned to the travel-niche keyword clusters, competitor analysis against comparable boutique resorts, and mobile-first design prioritizing guest discovery. Every page carried the structured data qualifying it for Google’s rich results in the hospitality category. Every internal link pushed authority toward the direct-booking conversion path.
Three months later, Vejrø hit 10,000 plus organic visitors, ranked for 200 plus first-page keywords, and pulled a 2.2 percent booking conversion rate from organic traffic. The same pattern applies to content marketing for food brands: recipe schema, ingredient comparison guides, and sourcing story pages pull organic traffic at 20 to 40 percent conversion into hero SKU pages inside 6 months when the content quality matches search intent and every page carries the right structured data markup. Vejrø also proved out the reporting discipline: every monthly report named the exact page, the exact keyword cluster, and the exact search feature (rich result, sitelinks, image pack) driving the incremental organic revenue instead of hiding behind aggregate traffic charts.
Recipe cadence and content calendar for food brands
Recipe cadence on a working food brand content calendar ships 2 to 4 new recipes per week during the first 6 months and drops to 1 per week at maturity. Each recipe takes 4 to 6 hours to produce (write, test in the kitchen, photograph, schema author, publish). At 3 recipes per week, the brand hits 78 recipes inside 6 months plus a backlog of ingredient comparison and sourcing content queued behind the recipe production line.
| Content pillar | Target volume year 1 | Production cost per piece | Refresh cadence |
|---|---|---|---|
| Recipe hub | 40 to 100 recipes | $180 to $320 | Every 12 months |
| Ingredient comparison guides | 12 to 24 guides | $450 to $780 | Every 18 months |
| Sourcing story pages | 6 to 12 pages | $680 to $1,200 | Every 24 months |
| Buyer intent content | 8 to 16 pieces | $220 to $420 | Every 12 months |
Photography as a content calendar constraint
Photography is the actual constraint on recipe cadence, not writing. Every recipe needs 6 to 12 photos: hero shot, ingredient flat lay, prep in progress, plated result, storage, and step shots for the schema markup. A working food brand batches photography 8 recipes at a time to keep the cost per recipe under 200 dollars. Skip the batching and the per-recipe cost climbs to 400 to 600 dollars, which caps recipe cadence at 1 per week and slows organic ranking timeline by 6 months.
Seasonal content calendar planning
Seasonal content calendar planning maps recipes and comparison guides to the seasonal windows they need to rank in. A Christmas cookie recipe needs to publish in September to rank by early December. A Valentine’s chocolate guide needs to publish in November to rank by early February. A back-to-school lunchbox recipe needs to publish in June to rank by late August. The 60-to-90-day ranking curve dictates the calendar.
Creator syndication inside food brand content
Creator syndication on food brand content marketing amplifies the recipe hub through Instagram Reels, TikTok, and YouTube Shorts creators paid to post their own version of the brand’s hero recipes. The creator content pulls net-new audiences into the recipe hub through the creator’s Link in Bio or Amazon Storefront tag. The syndication calendar names 12 to 30 creators per quarter with specific recipes assigned to each.
One brand we picked up had a spreadsheet titled “creator outreach 2023” with 47 rows and 3 responses. All 3 responses were auto-replies. The spreadsheet named zero recipes and offered flat rates below 100 dollars per post. Nobody posts a 30-second video for 87 dollars flat. Nobody.
Creator content commercial terms that work
Working creator content commercial terms run 350 to 1,500 dollars flat per post plus a 12 to 25 percent commission on tagged sales across a 30-day window. The commission mechanic pulls creators into follow-up posts because the incremental revenue continues past the initial fee. Mid-tier creators (30k to 150k followers) hit the sweet spot for food brand content because their engagement rate typically runs 4 to 8 percent versus 0.8 to 1.6 percent on mega-creators.
Content brief structure for creator partnerships
The content brief structure for creator partnerships runs a single page: the SKU, the specific recipe or usage occasion, 3 required brand mentions, 3 restricted claims (no health claims on non-medical SKUs), the pricing angle, the affiliate link, and 3 example videos that hit the tone. The brief avoids over-scripting because over-scripted creator content underperforms native creator voice by 40 to 60 percent on engagement rate.
Buyer intent content for food brand blogs
Buyer intent content on food brand blogs covers 8 to 16 pieces targeting explicit purchase-decision queries: “where to buy [brand],” “[brand] subscription vs. one-time,” “best [category] for [use case],” and “[brand] gift bundle.” Every buyer intent piece runs 1,400 to 2,400 words with a comparison table, product cards, and a clear conversion path to the specific SKU that matches the query intent. Buyer intent content converts at 3 to 6 percent versus 1 to 2 percent on recipe content because the shopper landed already planning to buy, not exploring a usage occasion.
Where-to-buy content structure
Where-to-buy content structure covers online (DTC storefront, Amazon, Target.com, Whole Foods online), retail (specific chain locators with the store finder embedded), and international (customs limitations, retailer partners abroad). Every piece names specific retailers, links to the store locator, and includes an FAQ block covering shipping availability, subscription options, and gift card compatibility. Where-to-buy content ranks for branded discovery queries the DTC storefront otherwise loses to competitor affiliate reviews.
Subscription versus one-time comparison content
Subscription versus one-time comparison content converts subscription commitments at 3 to 6 percent because it addresses the price-sensitivity concern head-on with a specific math table. The piece covers the discount structure (15 percent lifetime), the skip-a-month mechanic, the pause-anytime rule, the cancellation policy, and the specific yearly savings for the brand’s average consumption cadence. Cross-reference the retention structure on our food and beverage marketing retainer page.
Content refresh cadence on food brand pillars
Content refresh cadence on food brand content pillars runs a rolling audit every 12 to 24 months by pillar. Recipes get refreshed every 12 months with new photography, updated schema, and any nutrition or ingredient adjustments. Ingredient comparison guides refresh every 18 months to update market data. Sourcing story pages refresh every 24 months to reflect farm partnership changes and new harvest angles. Buyer intent content refreshes every 12 months to update retailer availability and pricing.
Recipe refresh priority order
Recipe refresh priority runs by organic traffic rank. The top 20 recipes by monthly organic sessions get refreshed first (new photography, schema audit, related recipe internal links, updated nutrition). The next 40 get refreshed at 15 months. The remaining recipes get refreshed opportunistically when the ranking slips past position 15 in Google. Skipping the refresh cadence lets recipe rankings drift out of the top 3 inside 18 months as newer competitor recipes take the position.
Schema audit checklist per refresh
The schema audit checklist per refresh runs 8 items: Recipe schema completeness, aggregateRating count and accuracy, nutrition data accuracy, prepTime and cookTime match the recipe body, image URLs valid at CDN, related recipe internal links working, product card SKU URL live, and Google Search Console rich result eligibility validated. This checklist takes 20 minutes per recipe and prevents the schema drift that costs recipe rankings 20 to 40 positions quietly.
Reporting cadence for food brand content marketing
Reporting cadence on food brand content marketing runs a monthly executive report plus a quarterly business review. The monthly report ships in the first business week and covers organic sessions by pillar, top 10 ranking recipes with position trend, ingredient guide ranking movements, sourcing page performance, and organic-attributed DTC revenue. Every number carries a comparison to the prior month and a plain-language interpretation the founder reads in 7 minutes.
Metrics that matter for content marketing
Metrics that matter for food brand content marketing: organic sessions by pillar, recipe rich result impressions in Search Console, organic conversion rate to hero SKU pages, organic-attributed DTC revenue, and top 20 ranking positions by monthly organic sessions. Vanity metrics that do not matter: total pageviews without conversion context, average time on page without conversion attribution, and social share counts. The monthly report skips the vanity block entirely.
Quarterly business review structure
The quarterly business review runs 90 minutes with the founder, head of content, and SEO lead. Agenda: organic traffic trend by pillar, top 10 winning content pieces, top 10 losing content pieces (candidates for refresh or removal), competitive gap analysis against 5 named competitor brands, and next quarter’s content calendar with recipes and ingredient guides queued. According to Ahrefs content marketing research, brands running quarterly content audits outperform brands running annual audits by 40 to 70 percent on organic revenue over a 24-month window.
Internal linking discipline across food brand content
Internal linking discipline across food brand content moves authority from recipe pages toward hero SKU product pages and comparison guides. Every recipe links to the hero SKU it uses inline (once in the ingredient list, once in a bottom call-out card). Every ingredient comparison guide links to 3 to 6 recipes using the winning ingredient plus the hero SKU product page. Every sourcing story links to the 2 to 4 SKUs sourced from that specific farm or cooperative.
Anchor text strategy across recipe hubs
Anchor text on internal links varies across recipe hubs to avoid over-optimization patterns Google penalizes. Exact-match anchor (“single-origin Ethiopian coffee”) runs on 20 to 30 percent of internal links. Partial-match variations (“our Ethiopian roast”) run on 30 to 40 percent. Branded anchors (the SKU name) run on 20 to 30 percent. Generic anchors (“shop the coffee”) fill the remaining 10 to 20 percent. This ratio holds ranking without triggering the over-optimization penalty that shows up on brands that anchor-text-stuff every internal link with the same exact-match keyword. Cross-reference the linking layer on our food and beverage web design page.
Link equity from ingredient guides to SKU pages
Link equity from ingredient guides passes to SKU pages when the guide’s comparison table names the hero SKU in the winning column with a product card, and when the guide’s body links to 3 to 6 recipes that use the winning ingredient. This 3-hop path (guide to recipe to SKU) pushes authority from a high-traffic informational query down to a high-intent transactional page. According to Search Engine Land SEO coverage, informational content that internally links to transactional pages produces 2 to 4 times higher organic revenue than isolated content silos.
Wrapping up content marketing for food brands
Content marketing for food brands is the organic engine that turns a DTC snack, drink, or CPG storefront into a search-driven revenue channel. Recipe hub of 40 to 100 recipes. Ingredient comparison guides at 12 to 24 pieces. Sourcing story pages at 6 to 12 pieces. Buyer intent content at 8 to 16 pieces. Creator syndication calendar with 12 to 30 creators per quarter. Refresh cadence at 12 to 24 months by pillar. Reporting with organic sessions and organic revenue attribution.
If your DTC food brand is running paid social at 20,000 dollars monthly with a broken blog and zero recipe schema, professional content marketing for food brands pays for itself inside the first 90 days on organic traffic captured. Redefine Web ships content marketing inside our monthly retainer packages. Book a call and we will walk through the last three DTC food brands we built recipe hubs for, pillar by pillar.
Anchor text on internal links varies across recipe hubs to avoid over-optimization patterns Google penalizes. Exact-match anchor (“single-origin Ethiopian coffee”) runs on 20 to 30 percent of internal links. Partial-match variations (“our Ethiopian roast”) run on 30 to 40 percent. Branded anchors (the SKU name) run on 20 to 30 percent. Generic anchors (“shop the coffee”) fill the remaining 10 to 20 percent. This ratio holds ranking without triggering the over-optimization penalty that shows up on brands that anchor-text-stuff every internal link with the same exact-match keyword. Cross-reference the linking layer on our food and beverage web design page.
Link equity from ingredient guides to SKU pages
Link equity from ingredient guides passes to SKU pages when the guide’s comparison table names the hero SKU in the winning column with a product card, and when the guide’s body links to 3 to 6 recipes that use the winning ingredient. This 3-hop path (guide to recipe to SKU) pushes authority from a high-traffic informational query down to a high-intent transactional page. According to Search Engine Land SEO coverage, informational content that internally links to transactional pages produces 2 to 4 times higher organic revenue than isolated content silos.
Wrapping up content marketing for food brands
Content marketing for food brands is the organic engine that turns a DTC snack, drink, or CPG storefront into a search-driven revenue channel. Recipe hub of 40 to 100 recipes. Ingredient comparison guides at 12 to 24 pieces. Sourcing story pages at 6 to 12 pieces. Buyer intent content at 8 to 16 pieces. Creator syndication calendar with 12 to 30 creators per quarter. Refresh cadence at 12 to 24 months by pillar. Reporting with organic sessions and organic revenue attribution.
If your DTC food brand is running paid social at 20,000 dollars monthly with a broken blog and zero recipe schema, professional content marketing for food brands pays for itself inside the first 90 days on organic traffic captured. Redefine Web ships content marketing inside our monthly retainer packages. Book a call and we will walk through the last three DTC food brands we built recipe hubs for, pillar by pillar.
Internal linking discipline across food brand content moves authority from recipe pages toward hero SKU product pages and comparison guides. Every recipe links to the hero SKU it uses inline (once in the ingredient list, once in a bottom call-out card). Every ingredient comparison guide links to 3 to 6 recipes using the winning ingredient plus the hero SKU product page. Every sourcing story links to the 2 to 4 SKUs sourced from that specific farm or cooperative.
Anchor text strategy across recipe hubs
Anchor text on internal links varies across recipe hubs to avoid over-optimization patterns Google penalizes. Exact-match anchor (“single-origin Ethiopian coffee”) runs on 20 to 30 percent of internal links. Partial-match variations (“our Ethiopian roast”) run on 30 to 40 percent. Branded anchors (the SKU name) run on 20 to 30 percent. Generic anchors (“shop the coffee”) fill the remaining 10 to 20 percent. This ratio holds ranking without triggering the over-optimization penalty that shows up on brands that anchor-text-stuff every internal link with the same exact-match keyword. Cross-reference the linking layer on our food and beverage web design page.
Link equity from ingredient guides to SKU pages
Link equity from ingredient guides passes to SKU pages when the guide’s comparison table names the hero SKU in the winning column with a product card, and when the guide’s body links to 3 to 6 recipes that use the winning ingredient. This 3-hop path (guide to recipe to SKU) pushes authority from a high-traffic informational query down to a high-intent transactional page. According to Search Engine Land SEO coverage, informational content that internally links to transactional pages produces 2 to 4 times higher organic revenue than isolated content silos.
Wrapping up content marketing for food brands
Content marketing for food brands is the organic engine that turns a DTC snack, drink, or CPG storefront into a search-driven revenue channel. Recipe hub of 40 to 100 recipes. Ingredient comparison guides at 12 to 24 pieces. Sourcing story pages at 6 to 12 pieces. Buyer intent content at 8 to 16 pieces. Creator syndication calendar with 12 to 30 creators per quarter. Refresh cadence at 12 to 24 months by pillar. Reporting with organic sessions and organic revenue attribution.
If your DTC food brand is running paid social at 20,000 dollars monthly with a broken blog and zero recipe schema, professional content marketing for food brands pays for itself inside the first 90 days on organic traffic captured. Redefine Web ships content marketing inside our monthly retainer packages. Book a call and we will walk through the last three DTC food brands we built recipe hubs for, pillar by pillar.
Content marketing for food brands starts with a recipe hub because recipe queries account for 40 to 60 percent of high-intent search volume in the food category. Every hero SKU needs 4 to 12 recipes anchored to it, each targeting a specific occasion and audience.
Skip the recipe hub and the brand loses the search real estate that pulls DTC storefront traffic month over month at zero incremental paid cost. Recipe traffic converts at 2 to 4 percent because the shopper landed with usage intent, not passive discovery, which is why food brands win on recipes.
Recipe schema and Google rich result eligibility
Every recipe page ships schema.org Recipe markup including cookTime, prepTime, recipeIngredient, recipeInstructions, nutrition, and aggregateRating. Correctly marked-up recipes qualify for Google’s recipe rich result carousel that pulls 3 to 6 times higher click-through rate than a plain blue link. The schema layer takes 15 minutes per recipe to author and 30 minutes to validate in Google Search Console. Cross-reference the recipe search stack on our food and beverage SEO page.
Recipe hub structure that scales
The recipe hub structure runs 40 to 100 recipes at maturity, organized by hero SKU (4 to 12 recipes per SKU) plus occasion tags (breakfast, weeknight dinner, meal prep, brunch, holiday). Every recipe links back to the hero SKU product page with the SKU embedded in an inline card. The hub earns internal linking value from ingredient comparison guides and the sourcing story pages, which feeds recipe ranking on Google. According to Google Search Central recipe structured data guidance, complete Recipe schema markup is required for eligibility in the recipe carousel and the ingredient search filter.
Pillar structure for food brand content marketing
The pillar structure on content marketing for food brands runs 4 content pillars concurrently: recipe hub (40 to 100 recipes), ingredient comparison guides (12 to 24 guides), sourcing story pages (6 to 12 pages), and buyer intent content (where to buy, subscription vs. one-time, gift bundle guides). Every pillar covers a distinct search intent and every pillar links back to the hero SKU product pages.
Ingredient comparison guide format
Ingredient comparison guides run 1,800 to 3,200 words comparing 2 to 4 ingredient types on 6 to 10 attributes with a comparison table, real-world use case examples, and links to the hero SKU that uses the specific ingredient. Example: organic vs. conventional oats compares nutritional profile, sourcing chain, cost, environmental impact, and taste on a 6-column table. The brand’s SKU appears in the winning column with a product card. These guides rank 3 to 8 months after publication and pull steady-state organic traffic.
Sourcing story pages that build trust
Sourcing story pages name the specific farms, cooperatives, or suppliers the brand sources from, with photos of the farms, farmer quotes, and specific harvest windows. A coffee brand’s Ethiopian farm page ranks for “single-origin Ethiopian coffee” and “Yirgacheffe coffee origin” plus 40 long-tail variations. The sourcing page pulls trust-building traffic that converts at 4 to 6 percent because the shopper landed pattern-matching on transparency and named provenance. Every sourcing page includes farmer or cooperative quotes, harvest dates, and a link back to 3 to 5 hero SKU pages that source from the named supplier.
Vejrø hospitality content case study
Vejrø Resort, a Danish private-island destination with an on-site restaurant focused on organic, locally sourced cuisine, joined us with strong social engagement and no organic-search real estate. Guests found the resort on Instagram but never in Google search for terms like “private island resort Denmark,” “farm-to-table hospitality Denmark,” or “Vejrø restaurant.” The same organic-search gap shows up on DTC food brands running paid social at 20,000 dollars monthly with a broken blog and zero recipe schema.
We built the conversion-focused website with on-site and off-site SEO tuned to the travel-niche keyword clusters, competitor analysis against comparable boutique resorts, and mobile-first design prioritizing guest discovery. Every page carried the structured data qualifying it for Google’s rich results in the hospitality category. Every internal link pushed authority toward the direct-booking conversion path.
Three months later, Vejrø hit 10,000 plus organic visitors, ranked for 200 plus first-page keywords, and pulled a 2.2 percent booking conversion rate from organic traffic. The same pattern applies to content marketing for food brands: recipe schema, ingredient comparison guides, and sourcing story pages pull organic traffic at 20 to 40 percent conversion into hero SKU pages inside 6 months when the content quality matches search intent and every page carries the right structured data markup. Vejrø also proved out the reporting discipline: every monthly report named the exact page, the exact keyword cluster, and the exact search feature (rich result, sitelinks, image pack) driving the incremental organic revenue instead of hiding behind aggregate traffic charts.
Recipe cadence and content calendar for food brands
Recipe cadence on a working food brand content calendar ships 2 to 4 new recipes per week during the first 6 months and drops to 1 per week at maturity. Each recipe takes 4 to 6 hours to produce (write, test in the kitchen, photograph, schema author, publish). At 3 recipes per week, the brand hits 78 recipes inside 6 months plus a backlog of ingredient comparison and sourcing content queued behind the recipe production line.
| Content pillar | Target volume year 1 | Production cost per piece | Refresh cadence |
|---|---|---|---|
| Recipe hub | 40 to 100 recipes | $180 to $320 | Every 12 months |
| Ingredient comparison guides | 12 to 24 guides | $450 to $780 | Every 18 months |
| Sourcing story pages | 6 to 12 pages | $680 to $1,200 | Every 24 months |
| Buyer intent content | 8 to 16 pieces | $220 to $420 | Every 12 months |
Photography as a content calendar constraint
Photography is the actual constraint on recipe cadence, not writing. Every recipe needs 6 to 12 photos: hero shot, ingredient flat lay, prep in progress, plated result, storage, and step shots for the schema markup. A working food brand batches photography 8 recipes at a time to keep the cost per recipe under 200 dollars. Skip the batching and the per-recipe cost climbs to 400 to 600 dollars, which caps recipe cadence at 1 per week and slows organic ranking timeline by 6 months.
Seasonal content calendar planning
Seasonal content calendar planning maps recipes and comparison guides to the seasonal windows they need to rank in. A Christmas cookie recipe needs to publish in September to rank by early December. A Valentine’s chocolate guide needs to publish in November to rank by early February. A back-to-school lunchbox recipe needs to publish in June to rank by late August. The 60-to-90-day ranking curve dictates the calendar.
Creator syndication inside food brand content
Creator syndication on food brand content marketing amplifies the recipe hub through Instagram Reels, TikTok, and YouTube Shorts creators paid to post their own version of the brand’s hero recipes. The creator content pulls net-new audiences into the recipe hub through the creator’s Link in Bio or Amazon Storefront tag. The syndication calendar names 12 to 30 creators per quarter with specific recipes assigned to each.
One brand we picked up had a spreadsheet titled “creator outreach 2023” with 47 rows and 3 responses. All 3 responses were auto-replies. The spreadsheet named zero recipes and offered flat rates below 100 dollars per post. Nobody posts a 30-second video for 87 dollars flat. Nobody.
Creator content commercial terms that work
Working creator content commercial terms run 350 to 1,500 dollars flat per post plus a 12 to 25 percent commission on tagged sales across a 30-day window. The commission mechanic pulls creators into follow-up posts because the incremental revenue continues past the initial fee. Mid-tier creators (30k to 150k followers) hit the sweet spot for food brand content because their engagement rate typically runs 4 to 8 percent versus 0.8 to 1.6 percent on mega-creators.
Content brief structure for creator partnerships
The content brief structure for creator partnerships runs a single page: the SKU, the specific recipe or usage occasion, 3 required brand mentions, 3 restricted claims (no health claims on non-medical SKUs), the pricing angle, the affiliate link, and 3 example videos that hit the tone. The brief avoids over-scripting because over-scripted creator content underperforms native creator voice by 40 to 60 percent on engagement rate.
Buyer intent content for food brand blogs
Buyer intent content on food brand blogs covers 8 to 16 pieces targeting explicit purchase-decision queries: “where to buy [brand],” “[brand] subscription vs. one-time,” “best [category] for [use case],” and “[brand] gift bundle.” Every buyer intent piece runs 1,400 to 2,400 words with a comparison table, product cards, and a clear conversion path to the specific SKU that matches the query intent. Buyer intent content converts at 3 to 6 percent versus 1 to 2 percent on recipe content because the shopper landed already planning to buy, not exploring a usage occasion.
Where-to-buy content structure
Where-to-buy content structure covers online (DTC storefront, Amazon, Target.com, Whole Foods online), retail (specific chain locators with the store finder embedded), and international (customs limitations, retailer partners abroad). Every piece names specific retailers, links to the store locator, and includes an FAQ block covering shipping availability, subscription options, and gift card compatibility. Where-to-buy content ranks for branded discovery queries the DTC storefront otherwise loses to competitor affiliate reviews.
Subscription versus one-time comparison content
Subscription versus one-time comparison content converts subscription commitments at 3 to 6 percent because it addresses the price-sensitivity concern head-on with a specific math table. The piece covers the discount structure (15 percent lifetime), the skip-a-month mechanic, the pause-anytime rule, the cancellation policy, and the specific yearly savings for the brand’s average consumption cadence. Cross-reference the retention structure on our food and beverage marketing retainer page.
Content refresh cadence on food brand pillars
Content refresh cadence on food brand content pillars runs a rolling audit every 12 to 24 months by pillar. Recipes get refreshed every 12 months with new photography, updated schema, and any nutrition or ingredient adjustments. Ingredient comparison guides refresh every 18 months to update market data. Sourcing story pages refresh every 24 months to reflect farm partnership changes and new harvest angles. Buyer intent content refreshes every 12 months to update retailer availability and pricing.
Recipe refresh priority order
Recipe refresh priority runs by organic traffic rank. The top 20 recipes by monthly organic sessions get refreshed first (new photography, schema audit, related recipe internal links, updated nutrition). The next 40 get refreshed at 15 months. The remaining recipes get refreshed opportunistically when the ranking slips past position 15 in Google. Skipping the refresh cadence lets recipe rankings drift out of the top 3 inside 18 months as newer competitor recipes take the position.
Schema audit checklist per refresh
The schema audit checklist per refresh runs 8 items: Recipe schema completeness, aggregateRating count and accuracy, nutrition data accuracy, prepTime and cookTime match the recipe body, image URLs valid at CDN, related recipe internal links working, product card SKU URL live, and Google Search Console rich result eligibility validated. This checklist takes 20 minutes per recipe and prevents the schema drift that costs recipe rankings 20 to 40 positions quietly.
Reporting cadence for food brand content marketing
Reporting cadence on food brand content marketing runs a monthly executive report plus a quarterly business review. The monthly report ships in the first business week and covers organic sessions by pillar, top 10 ranking recipes with position trend, ingredient guide ranking movements, sourcing page performance, and organic-attributed DTC revenue. Every number carries a comparison to the prior month and a plain-language interpretation the founder reads in 7 minutes.
Metrics that matter for content marketing
Metrics that matter for food brand content marketing: organic sessions by pillar, recipe rich result impressions in Search Console, organic conversion rate to hero SKU pages, organic-attributed DTC revenue, and top 20 ranking positions by monthly organic sessions. Vanity metrics that do not matter: total pageviews without conversion context, average time on page without conversion attribution, and social share counts. The monthly report skips the vanity block entirely.
Quarterly business review structure
The quarterly business review runs 90 minutes with the founder, head of content, and SEO lead. Agenda: organic traffic trend by pillar, top 10 winning content pieces, top 10 losing content pieces (candidates for refresh or removal), competitive gap analysis against 5 named competitor brands, and next quarter’s content calendar with recipes and ingredient guides queued. According to Ahrefs content marketing research, brands running quarterly content audits outperform brands running annual audits by 40 to 70 percent on organic revenue over a 24-month window.
Internal linking discipline across food brand content
Internal linking discipline across food brand content moves authority from recipe pages toward hero SKU product pages and comparison guides. Every recipe links to the hero SKU it uses inline (once in the ingredient list, once in a bottom call-out card). Every ingredient comparison guide links to 3 to 6 recipes using the winning ingredient plus the hero SKU product page. Every sourcing story links to the 2 to 4 SKUs sourced from that specific farm or cooperative.
Anchor text strategy across recipe hubs
Anchor text on internal links varies across recipe hubs to avoid over-optimization patterns Google penalizes. Exact-match anchor (“single-origin Ethiopian coffee”) runs on 20 to 30 percent of internal links. Partial-match variations (“our Ethiopian roast”) run on 30 to 40 percent. Branded anchors (the SKU name) run on 20 to 30 percent. Generic anchors (“shop the coffee”) fill the remaining 10 to 20 percent. This ratio holds ranking without triggering the over-optimization penalty that shows up on brands that anchor-text-stuff every internal link with the same exact-match keyword. Cross-reference the linking layer on our food and beverage web design page.
Link equity from ingredient guides to SKU pages
Link equity from ingredient guides passes to SKU pages when the guide’s comparison table names the hero SKU in the winning column with a product card, and when the guide’s body links to 3 to 6 recipes that use the winning ingredient. This 3-hop path (guide to recipe to SKU) pushes authority from a high-traffic informational query down to a high-intent transactional page. According to Search Engine Land SEO coverage, informational content that internally links to transactional pages produces 2 to 4 times higher organic revenue than isolated content silos.
Wrapping up content marketing for food brands
Content marketing for food brands is the organic engine that turns a DTC snack, drink, or CPG storefront into a search-driven revenue channel. Recipe hub of 40 to 100 recipes. Ingredient comparison guides at 12 to 24 pieces. Sourcing story pages at 6 to 12 pieces. Buyer intent content at 8 to 16 pieces. Creator syndication calendar with 12 to 30 creators per quarter. Refresh cadence at 12 to 24 months by pillar. Reporting with organic sessions and organic revenue attribution.
If your DTC food brand is running paid social at 20,000 dollars monthly with a broken blog and zero recipe schema, professional content marketing for food brands pays for itself inside the first 90 days on organic traffic captured. Redefine Web ships content marketing inside our monthly retainer packages. Book a call and we will walk through the last three DTC food brands we built recipe hubs for, pillar by pillar.
Content marketing for food brands starts with a recipe hub because recipe queries account for 40 to 60 percent of high-intent search volume in the food category. Every hero SKU needs 4 to 12 recipes anchored to it, each targeting a specific occasion and audience.
Skip the recipe hub and the brand loses the search real estate that pulls DTC storefront traffic month over month at zero incremental paid cost. Recipe traffic converts at 2 to 4 percent because the shopper landed with usage intent, not passive discovery, which is why food brands win on recipes.
Recipe schema and Google rich result eligibility
Every recipe page ships schema.org Recipe markup including cookTime, prepTime, recipeIngredient, recipeInstructions, nutrition, and aggregateRating. Correctly marked-up recipes qualify for Google’s recipe rich result carousel that pulls 3 to 6 times higher click-through rate than a plain blue link. The schema layer takes 15 minutes per recipe to author and 30 minutes to validate in Google Search Console. Cross-reference the recipe search stack on our food and beverage SEO page.
Recipe hub structure that scales
The recipe hub structure runs 40 to 100 recipes at maturity, organized by hero SKU (4 to 12 recipes per SKU) plus occasion tags (breakfast, weeknight dinner, meal prep, brunch, holiday). Every recipe links back to the hero SKU product page with the SKU embedded in an inline card. The hub earns internal linking value from ingredient comparison guides and the sourcing story pages, which feeds recipe ranking on Google. According to Google Search Central recipe structured data guidance, complete Recipe schema markup is required for eligibility in the recipe carousel and the ingredient search filter.
Pillar structure for food brand content marketing
The pillar structure on content marketing for food brands runs 4 content pillars concurrently: recipe hub (40 to 100 recipes), ingredient comparison guides (12 to 24 guides), sourcing story pages (6 to 12 pages), and buyer intent content (where to buy, subscription vs. one-time, gift bundle guides). Every pillar covers a distinct search intent and every pillar links back to the hero SKU product pages.
Ingredient comparison guide format
Ingredient comparison guides run 1,800 to 3,200 words comparing 2 to 4 ingredient types on 6 to 10 attributes with a comparison table, real-world use case examples, and links to the hero SKU that uses the specific ingredient. Example: organic vs. conventional oats compares nutritional profile, sourcing chain, cost, environmental impact, and taste on a 6-column table. The brand’s SKU appears in the winning column with a product card. These guides rank 3 to 8 months after publication and pull steady-state organic traffic.
Sourcing story pages that build trust
Sourcing story pages name the specific farms, cooperatives, or suppliers the brand sources from, with photos of the farms, farmer quotes, and specific harvest windows. A coffee brand’s Ethiopian farm page ranks for “single-origin Ethiopian coffee” and “Yirgacheffe coffee origin” plus 40 long-tail variations. The sourcing page pulls trust-building traffic that converts at 4 to 6 percent because the shopper landed pattern-matching on transparency and named provenance. Every sourcing page includes farmer or cooperative quotes, harvest dates, and a link back to 3 to 5 hero SKU pages that source from the named supplier.
Vejrø hospitality content case study
Vejrø Resort, a Danish private-island destination with an on-site restaurant focused on organic, locally sourced cuisine, joined us with strong social engagement and no organic-search real estate. Guests found the resort on Instagram but never in Google search for terms like “private island resort Denmark,” “farm-to-table hospitality Denmark,” or “Vejrø restaurant.” The same organic-search gap shows up on DTC food brands running paid social at 20,000 dollars monthly with a broken blog and zero recipe schema.
We built the conversion-focused website with on-site and off-site SEO tuned to the travel-niche keyword clusters, competitor analysis against comparable boutique resorts, and mobile-first design prioritizing guest discovery. Every page carried the structured data qualifying it for Google’s rich results in the hospitality category. Every internal link pushed authority toward the direct-booking conversion path.
Three months later, Vejrø hit 10,000 plus organic visitors, ranked for 200 plus first-page keywords, and pulled a 2.2 percent booking conversion rate from organic traffic. The same pattern applies to content marketing for food brands: recipe schema, ingredient comparison guides, and sourcing story pages pull organic traffic at 20 to 40 percent conversion into hero SKU pages inside 6 months when the content quality matches search intent and every page carries the right structured data markup. Vejrø also proved out the reporting discipline: every monthly report named the exact page, the exact keyword cluster, and the exact search feature (rich result, sitelinks, image pack) driving the incremental organic revenue instead of hiding behind aggregate traffic charts.
Recipe cadence and content calendar for food brands
Recipe cadence on a working food brand content calendar ships 2 to 4 new recipes per week during the first 6 months and drops to 1 per week at maturity. Each recipe takes 4 to 6 hours to produce (write, test in the kitchen, photograph, schema author, publish). At 3 recipes per week, the brand hits 78 recipes inside 6 months plus a backlog of ingredient comparison and sourcing content queued behind the recipe production line.
| Content pillar | Target volume year 1 | Production cost per piece | Refresh cadence |
|---|---|---|---|
| Recipe hub | 40 to 100 recipes | $180 to $320 | Every 12 months |
| Ingredient comparison guides | 12 to 24 guides | $450 to $780 | Every 18 months |
| Sourcing story pages | 6 to 12 pages | $680 to $1,200 | Every 24 months |
| Buyer intent content | 8 to 16 pieces | $220 to $420 | Every 12 months |
Photography as a content calendar constraint
Photography is the actual constraint on recipe cadence, not writing. Every recipe needs 6 to 12 photos: hero shot, ingredient flat lay, prep in progress, plated result, storage, and step shots for the schema markup. A working food brand batches photography 8 recipes at a time to keep the cost per recipe under 200 dollars. Skip the batching and the per-recipe cost climbs to 400 to 600 dollars, which caps recipe cadence at 1 per week and slows organic ranking timeline by 6 months.
Seasonal content calendar planning
Seasonal content calendar planning maps recipes and comparison guides to the seasonal windows they need to rank in. A Christmas cookie recipe needs to publish in September to rank by early December. A Valentine’s chocolate guide needs to publish in November to rank by early February. A back-to-school lunchbox recipe needs to publish in June to rank by late August. The 60-to-90-day ranking curve dictates the calendar.
Creator syndication inside food brand content
Creator syndication on food brand content marketing amplifies the recipe hub through Instagram Reels, TikTok, and YouTube Shorts creators paid to post their own version of the brand’s hero recipes. The creator content pulls net-new audiences into the recipe hub through the creator’s Link in Bio or Amazon Storefront tag. The syndication calendar names 12 to 30 creators per quarter with specific recipes assigned to each.
One brand we picked up had a spreadsheet titled “creator outreach 2023” with 47 rows and 3 responses. All 3 responses were auto-replies. The spreadsheet named zero recipes and offered flat rates below 100 dollars per post. Nobody posts a 30-second video for 87 dollars flat. Nobody.
Creator content commercial terms that work
Working creator content commercial terms run 350 to 1,500 dollars flat per post plus a 12 to 25 percent commission on tagged sales across a 30-day window. The commission mechanic pulls creators into follow-up posts because the incremental revenue continues past the initial fee. Mid-tier creators (30k to 150k followers) hit the sweet spot for food brand content because their engagement rate typically runs 4 to 8 percent versus 0.8 to 1.6 percent on mega-creators.
Content brief structure for creator partnerships
The content brief structure for creator partnerships runs a single page: the SKU, the specific recipe or usage occasion, 3 required brand mentions, 3 restricted claims (no health claims on non-medical SKUs), the pricing angle, the affiliate link, and 3 example videos that hit the tone. The brief avoids over-scripting because over-scripted creator content underperforms native creator voice by 40 to 60 percent on engagement rate.
Buyer intent content for food brand blogs
Buyer intent content on food brand blogs covers 8 to 16 pieces targeting explicit purchase-decision queries: “where to buy [brand],” “[brand] subscription vs. one-time,” “best [category] for [use case],” and “[brand] gift bundle.” Every buyer intent piece runs 1,400 to 2,400 words with a comparison table, product cards, and a clear conversion path to the specific SKU that matches the query intent. Buyer intent content converts at 3 to 6 percent versus 1 to 2 percent on recipe content because the shopper landed already planning to buy, not exploring a usage occasion.
Where-to-buy content structure
Where-to-buy content structure covers online (DTC storefront, Amazon, Target.com, Whole Foods online), retail (specific chain locators with the store finder embedded), and international (customs limitations, retailer partners abroad). Every piece names specific retailers, links to the store locator, and includes an FAQ block covering shipping availability, subscription options, and gift card compatibility. Where-to-buy content ranks for branded discovery queries the DTC storefront otherwise loses to competitor affiliate reviews.
Subscription versus one-time comparison content
Subscription versus one-time comparison content converts subscription commitments at 3 to 6 percent because it addresses the price-sensitivity concern head-on with a specific math table. The piece covers the discount structure (15 percent lifetime), the skip-a-month mechanic, the pause-anytime rule, the cancellation policy, and the specific yearly savings for the brand’s average consumption cadence. Cross-reference the retention structure on our food and beverage marketing retainer page.
Content refresh cadence on food brand pillars
Content refresh cadence on food brand content pillars runs a rolling audit every 12 to 24 months by pillar. Recipes get refreshed every 12 months with new photography, updated schema, and any nutrition or ingredient adjustments. Ingredient comparison guides refresh every 18 months to update market data. Sourcing story pages refresh every 24 months to reflect farm partnership changes and new harvest angles. Buyer intent content refreshes every 12 months to update retailer availability and pricing.
Recipe refresh priority order
Recipe refresh priority runs by organic traffic rank. The top 20 recipes by monthly organic sessions get refreshed first (new photography, schema audit, related recipe internal links, updated nutrition). The next 40 get refreshed at 15 months. The remaining recipes get refreshed opportunistically when the ranking slips past position 15 in Google. Skipping the refresh cadence lets recipe rankings drift out of the top 3 inside 18 months as newer competitor recipes take the position.
Schema audit checklist per refresh
The schema audit checklist per refresh runs 8 items: Recipe schema completeness, aggregateRating count and accuracy, nutrition data accuracy, prepTime and cookTime match the recipe body, image URLs valid at CDN, related recipe internal links working, product card SKU URL live, and Google Search Console rich result eligibility validated. This checklist takes 20 minutes per recipe and prevents the schema drift that costs recipe rankings 20 to 40 positions quietly.
Reporting cadence for food brand content marketing
Reporting cadence on food brand content marketing runs a monthly executive report plus a quarterly business review. The monthly report ships in the first business week and covers organic sessions by pillar, top 10 ranking recipes with position trend, ingredient guide ranking movements, sourcing page performance, and organic-attributed DTC revenue. Every number carries a comparison to the prior month and a plain-language interpretation the founder reads in 7 minutes.
Metrics that matter for content marketing
Metrics that matter for food brand content marketing: organic sessions by pillar, recipe rich result impressions in Search Console, organic conversion rate to hero SKU pages, organic-attributed DTC revenue, and top 20 ranking positions by monthly organic sessions. Vanity metrics that do not matter: total pageviews without conversion context, average time on page without conversion attribution, and social share counts. The monthly report skips the vanity block entirely.
Quarterly business review structure
The quarterly business review runs 90 minutes with the founder, head of content, and SEO lead. Agenda: organic traffic trend by pillar, top 10 winning content pieces, top 10 losing content pieces (candidates for refresh or removal), competitive gap analysis against 5 named competitor brands, and next quarter’s content calendar with recipes and ingredient guides queued. According to Ahrefs content marketing research, brands running quarterly content audits outperform brands running annual audits by 40 to 70 percent on organic revenue over a 24-month window.
Internal linking discipline across food brand content
Internal linking discipline across food brand content moves authority from recipe pages toward hero SKU product pages and comparison guides. Every recipe links to the hero SKU it uses inline (once in the ingredient list, once in a bottom call-out card). Every ingredient comparison guide links to 3 to 6 recipes using the winning ingredient plus the hero SKU product page. Every sourcing story links to the 2 to 4 SKUs sourced from that specific farm or cooperative.
Anchor text strategy across recipe hubs
Anchor text on internal links varies across recipe hubs to avoid over-optimization patterns Google penalizes. Exact-match anchor (“single-origin Ethiopian coffee”) runs on 20 to 30 percent of internal links. Partial-match variations (“our Ethiopian roast”) run on 30 to 40 percent. Branded anchors (the SKU name) run on 20 to 30 percent. Generic anchors (“shop the coffee”) fill the remaining 10 to 20 percent. This ratio holds ranking without triggering the over-optimization penalty that shows up on brands that anchor-text-stuff every internal link with the same exact-match keyword. Cross-reference the linking layer on our food and beverage web design page.
Link equity from ingredient guides to SKU pages
Link equity from ingredient guides passes to SKU pages when the guide’s comparison table names the hero SKU in the winning column with a product card, and when the guide’s body links to 3 to 6 recipes that use the winning ingredient. This 3-hop path (guide to recipe to SKU) pushes authority from a high-traffic informational query down to a high-intent transactional page. According to Search Engine Land SEO coverage, informational content that internally links to transactional pages produces 2 to 4 times higher organic revenue than isolated content silos.
Wrapping up content marketing for food brands
Content marketing for food brands is the organic engine that turns a DTC snack, drink, or CPG storefront into a search-driven revenue channel. Recipe hub of 40 to 100 recipes. Ingredient comparison guides at 12 to 24 pieces. Sourcing story pages at 6 to 12 pieces. Buyer intent content at 8 to 16 pieces. Creator syndication calendar with 12 to 30 creators per quarter. Refresh cadence at 12 to 24 months by pillar. Reporting with organic sessions and organic revenue attribution.
If your DTC food brand is running paid social at 20,000 dollars monthly with a broken blog and zero recipe schema, professional content marketing for food brands pays for itself inside the first 90 days on organic traffic captured. Redefine Web ships content marketing inside our monthly retainer packages. Book a call and we will walk through the last three DTC food brands we built recipe hubs for, pillar by pillar.
Internal linking discipline across food brand content moves authority from recipe pages toward hero SKU product pages and comparison guides. Every recipe links to the hero SKU it uses inline (once in the ingredient list, once in a bottom call-out card). Every ingredient comparison guide links to 3 to 6 recipes using the winning ingredient plus the hero SKU product page. Every sourcing story links to the 2 to 4 SKUs sourced from that specific farm or cooperative.
Anchor text strategy across recipe hubs
Anchor text on internal links varies across recipe hubs to avoid over-optimization patterns Google penalizes. Exact-match anchor (“single-origin Ethiopian coffee”) runs on 20 to 30 percent of internal links. Partial-match variations (“our Ethiopian roast”) run on 30 to 40 percent. Branded anchors (the SKU name) run on 20 to 30 percent. Generic anchors (“shop the coffee”) fill the remaining 10 to 20 percent. This ratio holds ranking without triggering the over-optimization penalty that shows up on brands that anchor-text-stuff every internal link with the same exact-match keyword. Cross-reference the linking layer on our food and beverage web design page.
Link equity from ingredient guides to SKU pages
Link equity from ingredient guides passes to SKU pages when the guide’s comparison table names the hero SKU in the winning column with a product card, and when the guide’s body links to 3 to 6 recipes that use the winning ingredient. This 3-hop path (guide to recipe to SKU) pushes authority from a high-traffic informational query down to a high-intent transactional page. According to Search Engine Land SEO coverage, informational content that internally links to transactional pages produces 2 to 4 times higher organic revenue than isolated content silos.
Wrapping up content marketing for food brands
Content marketing for food brands is the organic engine that turns a DTC snack, drink, or CPG storefront into a search-driven revenue channel. Recipe hub of 40 to 100 recipes. Ingredient comparison guides at 12 to 24 pieces. Sourcing story pages at 6 to 12 pieces. Buyer intent content at 8 to 16 pieces. Creator syndication calendar with 12 to 30 creators per quarter. Refresh cadence at 12 to 24 months by pillar. Reporting with organic sessions and organic revenue attribution.
If your DTC food brand is running paid social at 20,000 dollars monthly with a broken blog and zero recipe schema, professional content marketing for food brands pays for itself inside the first 90 days on organic traffic captured. Redefine Web ships content marketing inside our monthly retainer packages. Book a call and we will walk through the last three DTC food brands we built recipe hubs for, pillar by pillar.
Internal linking discipline across food brand content moves authority from recipe pages toward hero SKU product pages and comparison guides. Every recipe links to the hero SKU it uses inline (once in the ingredient list, once in a bottom call-out card). Every ingredient comparison guide links to 3 to 6 recipes using the winning ingredient plus the hero SKU product page. Every sourcing story links to the 2 to 4 SKUs sourced from that specific farm or cooperative.
Anchor text strategy across recipe hubs
Anchor text on internal links varies across recipe hubs to avoid over-optimization patterns Google penalizes. Exact-match anchor (“single-origin Ethiopian coffee”) runs on 20 to 30 percent of internal links. Partial-match variations (“our Ethiopian roast”) run on 30 to 40 percent. Branded anchors (the SKU name) run on 20 to 30 percent. Generic anchors (“shop the coffee”) fill the remaining 10 to 20 percent. This ratio holds ranking without triggering the over-optimization penalty that shows up on brands that anchor-text-stuff every internal link with the same exact-match keyword. Cross-reference the linking layer on our food and beverage web design page.
Link equity from ingredient guides to SKU pages
Link equity from ingredient guides passes to SKU pages when the guide’s comparison table names the hero SKU in the winning column with a product card, and when the guide’s body links to 3 to 6 recipes that use the winning ingredient. This 3-hop path (guide to recipe to SKU) pushes authority from a high-traffic informational query down to a high-intent transactional page. According to Search Engine Land SEO coverage, informational content that internally links to transactional pages produces 2 to 4 times higher organic revenue than isolated content silos.
Wrapping up content marketing for food brands
Content marketing for food brands is the organic engine that turns a DTC snack, drink, or CPG storefront into a search-driven revenue channel. Recipe hub of 40 to 100 recipes. Ingredient comparison guides at 12 to 24 pieces. Sourcing story pages at 6 to 12 pieces. Buyer intent content at 8 to 16 pieces. Creator syndication calendar with 12 to 30 creators per quarter. Refresh cadence at 12 to 24 months by pillar. Reporting with organic sessions and organic revenue attribution.
If your DTC food brand is running paid social at 20,000 dollars monthly with a broken blog and zero recipe schema, professional content marketing for food brands pays for itself inside the first 90 days on organic traffic captured. Redefine Web ships content marketing inside our monthly retainer packages. Book a call and we will walk through the last three DTC food brands we built recipe hubs for, pillar by pillar.
Content marketing for food brands starts with a recipe hub because recipe queries account for 40 to 60 percent of high-intent search volume in the food category. Every hero SKU needs 4 to 12 recipes anchored to it, each targeting a specific occasion and audience.
Skip the recipe hub and the brand loses the search real estate that pulls DTC storefront traffic month over month at zero incremental paid cost. Recipe traffic converts at 2 to 4 percent because the shopper landed with usage intent, not passive discovery, which is why food brands win on recipes.
Recipe schema and Google rich result eligibility
Every recipe page ships schema.org Recipe markup including cookTime, prepTime, recipeIngredient, recipeInstructions, nutrition, and aggregateRating. Correctly marked-up recipes qualify for Google’s recipe rich result carousel that pulls 3 to 6 times higher click-through rate than a plain blue link. The schema layer takes 15 minutes per recipe to author and 30 minutes to validate in Google Search Console. Cross-reference the recipe search stack on our food and beverage SEO page.
Recipe hub structure that scales
The recipe hub structure runs 40 to 100 recipes at maturity, organized by hero SKU (4 to 12 recipes per SKU) plus occasion tags (breakfast, weeknight dinner, meal prep, brunch, holiday). Every recipe links back to the hero SKU product page with the SKU embedded in an inline card. The hub earns internal linking value from ingredient comparison guides and the sourcing story pages, which feeds recipe ranking on Google. According to Google Search Central recipe structured data guidance, complete Recipe schema markup is required for eligibility in the recipe carousel and the ingredient search filter.
Pillar structure for food brand content marketing
The pillar structure on content marketing for food brands runs 4 content pillars concurrently: recipe hub (40 to 100 recipes), ingredient comparison guides (12 to 24 guides), sourcing story pages (6 to 12 pages), and buyer intent content (where to buy, subscription vs. one-time, gift bundle guides). Every pillar covers a distinct search intent and every pillar links back to the hero SKU product pages.
Ingredient comparison guide format
Ingredient comparison guides run 1,800 to 3,200 words comparing 2 to 4 ingredient types on 6 to 10 attributes with a comparison table, real-world use case examples, and links to the hero SKU that uses the specific ingredient. Example: organic vs. conventional oats compares nutritional profile, sourcing chain, cost, environmental impact, and taste on a 6-column table. The brand’s SKU appears in the winning column with a product card. These guides rank 3 to 8 months after publication and pull steady-state organic traffic.
Sourcing story pages that build trust
Sourcing story pages name the specific farms, cooperatives, or suppliers the brand sources from, with photos of the farms, farmer quotes, and specific harvest windows. A coffee brand’s Ethiopian farm page ranks for “single-origin Ethiopian coffee” and “Yirgacheffe coffee origin” plus 40 long-tail variations. The sourcing page pulls trust-building traffic that converts at 4 to 6 percent because the shopper landed pattern-matching on transparency and named provenance. Every sourcing page includes farmer or cooperative quotes, harvest dates, and a link back to 3 to 5 hero SKU pages that source from the named supplier.
Vejrø hospitality content case study
Vejrø Resort, a Danish private-island destination with an on-site restaurant focused on organic, locally sourced cuisine, joined us with strong social engagement and no organic-search real estate. Guests found the resort on Instagram but never in Google search for terms like “private island resort Denmark,” “farm-to-table hospitality Denmark,” or “Vejrø restaurant.” The same organic-search gap shows up on DTC food brands running paid social at 20,000 dollars monthly with a broken blog and zero recipe schema.
We built the conversion-focused website with on-site and off-site SEO tuned to the travel-niche keyword clusters, competitor analysis against comparable boutique resorts, and mobile-first design prioritizing guest discovery. Every page carried the structured data qualifying it for Google’s rich results in the hospitality category. Every internal link pushed authority toward the direct-booking conversion path.
Three months later, Vejrø hit 10,000 plus organic visitors, ranked for 200 plus first-page keywords, and pulled a 2.2 percent booking conversion rate from organic traffic. The same pattern applies to content marketing for food brands: recipe schema, ingredient comparison guides, and sourcing story pages pull organic traffic at 20 to 40 percent conversion into hero SKU pages inside 6 months when the content quality matches search intent and every page carries the right structured data markup. Vejrø also proved out the reporting discipline: every monthly report named the exact page, the exact keyword cluster, and the exact search feature (rich result, sitelinks, image pack) driving the incremental organic revenue instead of hiding behind aggregate traffic charts.
Recipe cadence and content calendar for food brands
Recipe cadence on a working food brand content calendar ships 2 to 4 new recipes per week during the first 6 months and drops to 1 per week at maturity. Each recipe takes 4 to 6 hours to produce (write, test in the kitchen, photograph, schema author, publish). At 3 recipes per week, the brand hits 78 recipes inside 6 months plus a backlog of ingredient comparison and sourcing content queued behind the recipe production line.
| Content pillar | Target volume year 1 | Production cost per piece | Refresh cadence |
|---|---|---|---|
| Recipe hub | 40 to 100 recipes | $180 to $320 | Every 12 months |
| Ingredient comparison guides | 12 to 24 guides | $450 to $780 | Every 18 months |
| Sourcing story pages | 6 to 12 pages | $680 to $1,200 | Every 24 months |
| Buyer intent content | 8 to 16 pieces | $220 to $420 | Every 12 months |
Photography as a content calendar constraint
Photography is the actual constraint on recipe cadence, not writing. Every recipe needs 6 to 12 photos: hero shot, ingredient flat lay, prep in progress, plated result, storage, and step shots for the schema markup. A working food brand batches photography 8 recipes at a time to keep the cost per recipe under 200 dollars. Skip the batching and the per-recipe cost climbs to 400 to 600 dollars, which caps recipe cadence at 1 per week and slows organic ranking timeline by 6 months.
Seasonal content calendar planning
Seasonal content calendar planning maps recipes and comparison guides to the seasonal windows they need to rank in. A Christmas cookie recipe needs to publish in September to rank by early December. A Valentine’s chocolate guide needs to publish in November to rank by early February. A back-to-school lunchbox recipe needs to publish in June to rank by late August. The 60-to-90-day ranking curve dictates the calendar.
Creator syndication inside food brand content
Creator syndication on food brand content marketing amplifies the recipe hub through Instagram Reels, TikTok, and YouTube Shorts creators paid to post their own version of the brand’s hero recipes. The creator content pulls net-new audiences into the recipe hub through the creator’s Link in Bio or Amazon Storefront tag. The syndication calendar names 12 to 30 creators per quarter with specific recipes assigned to each.
One brand we picked up had a spreadsheet titled “creator outreach 2023” with 47 rows and 3 responses. All 3 responses were auto-replies. The spreadsheet named zero recipes and offered flat rates below 100 dollars per post. Nobody posts a 30-second video for 87 dollars flat. Nobody.
Creator content commercial terms that work
Working creator content commercial terms run 350 to 1,500 dollars flat per post plus a 12 to 25 percent commission on tagged sales across a 30-day window. The commission mechanic pulls creators into follow-up posts because the incremental revenue continues past the initial fee. Mid-tier creators (30k to 150k followers) hit the sweet spot for food brand content because their engagement rate typically runs 4 to 8 percent versus 0.8 to 1.6 percent on mega-creators.
Content brief structure for creator partnerships
The content brief structure for creator partnerships runs a single page: the SKU, the specific recipe or usage occasion, 3 required brand mentions, 3 restricted claims (no health claims on non-medical SKUs), the pricing angle, the affiliate link, and 3 example videos that hit the tone. The brief avoids over-scripting because over-scripted creator content underperforms native creator voice by 40 to 60 percent on engagement rate.
Buyer intent content for food brand blogs
Buyer intent content on food brand blogs covers 8 to 16 pieces targeting explicit purchase-decision queries: “where to buy [brand],” “[brand] subscription vs. one-time,” “best [category] for [use case],” and “[brand] gift bundle.” Every buyer intent piece runs 1,400 to 2,400 words with a comparison table, product cards, and a clear conversion path to the specific SKU that matches the query intent. Buyer intent content converts at 3 to 6 percent versus 1 to 2 percent on recipe content because the shopper landed already planning to buy, not exploring a usage occasion.
Where-to-buy content structure
Where-to-buy content structure covers online (DTC storefront, Amazon, Target.com, Whole Foods online), retail (specific chain locators with the store finder embedded), and international (customs limitations, retailer partners abroad). Every piece names specific retailers, links to the store locator, and includes an FAQ block covering shipping availability, subscription options, and gift card compatibility. Where-to-buy content ranks for branded discovery queries the DTC storefront otherwise loses to competitor affiliate reviews.
Subscription versus one-time comparison content
Subscription versus one-time comparison content converts subscription commitments at 3 to 6 percent because it addresses the price-sensitivity concern head-on with a specific math table. The piece covers the discount structure (15 percent lifetime), the skip-a-month mechanic, the pause-anytime rule, the cancellation policy, and the specific yearly savings for the brand’s average consumption cadence. Cross-reference the retention structure on our food and beverage marketing retainer page.
Content refresh cadence on food brand pillars
Content refresh cadence on food brand content pillars runs a rolling audit every 12 to 24 months by pillar. Recipes get refreshed every 12 months with new photography, updated schema, and any nutrition or ingredient adjustments. Ingredient comparison guides refresh every 18 months to update market data. Sourcing story pages refresh every 24 months to reflect farm partnership changes and new harvest angles. Buyer intent content refreshes every 12 months to update retailer availability and pricing.
Recipe refresh priority order
Recipe refresh priority runs by organic traffic rank. The top 20 recipes by monthly organic sessions get refreshed first (new photography, schema audit, related recipe internal links, updated nutrition). The next 40 get refreshed at 15 months. The remaining recipes get refreshed opportunistically when the ranking slips past position 15 in Google. Skipping the refresh cadence lets recipe rankings drift out of the top 3 inside 18 months as newer competitor recipes take the position.
Schema audit checklist per refresh
The schema audit checklist per refresh runs 8 items: Recipe schema completeness, aggregateRating count and accuracy, nutrition data accuracy, prepTime and cookTime match the recipe body, image URLs valid at CDN, related recipe internal links working, product card SKU URL live, and Google Search Console rich result eligibility validated. This checklist takes 20 minutes per recipe and prevents the schema drift that costs recipe rankings 20 to 40 positions quietly.
Reporting cadence for food brand content marketing
Reporting cadence on food brand content marketing runs a monthly executive report plus a quarterly business review. The monthly report ships in the first business week and covers organic sessions by pillar, top 10 ranking recipes with position trend, ingredient guide ranking movements, sourcing page performance, and organic-attributed DTC revenue. Every number carries a comparison to the prior month and a plain-language interpretation the founder reads in 7 minutes.
Metrics that matter for content marketing
Metrics that matter for food brand content marketing: organic sessions by pillar, recipe rich result impressions in Search Console, organic conversion rate to hero SKU pages, organic-attributed DTC revenue, and top 20 ranking positions by monthly organic sessions. Vanity metrics that do not matter: total pageviews without conversion context, average time on page without conversion attribution, and social share counts. The monthly report skips the vanity block entirely.
Quarterly business review structure
The quarterly business review runs 90 minutes with the founder, head of content, and SEO lead. Agenda: organic traffic trend by pillar, top 10 winning content pieces, top 10 losing content pieces (candidates for refresh or removal), competitive gap analysis against 5 named competitor brands, and next quarter’s content calendar with recipes and ingredient guides queued. According to Ahrefs content marketing research, brands running quarterly content audits outperform brands running annual audits by 40 to 70 percent on organic revenue over a 24-month window.
Internal linking discipline across food brand content
Internal linking discipline across food brand content moves authority from recipe pages toward hero SKU product pages and comparison guides. Every recipe links to the hero SKU it uses inline (once in the ingredient list, once in a bottom call-out card). Every ingredient comparison guide links to 3 to 6 recipes using the winning ingredient plus the hero SKU product page. Every sourcing story links to the 2 to 4 SKUs sourced from that specific farm or cooperative.
Anchor text strategy across recipe hubs
Anchor text on internal links varies across recipe hubs to avoid over-optimization patterns Google penalizes. Exact-match anchor (“single-origin Ethiopian coffee”) runs on 20 to 30 percent of internal links. Partial-match variations (“our Ethiopian roast”) run on 30 to 40 percent. Branded anchors (the SKU name) run on 20 to 30 percent. Generic anchors (“shop the coffee”) fill the remaining 10 to 20 percent. This ratio holds ranking without triggering the over-optimization penalty that shows up on brands that anchor-text-stuff every internal link with the same exact-match keyword. Cross-reference the linking layer on our food and beverage web design page.
Link equity from ingredient guides to SKU pages
Link equity from ingredient guides passes to SKU pages when the guide’s comparison table names the hero SKU in the winning column with a product card, and when the guide’s body links to 3 to 6 recipes that use the winning ingredient. This 3-hop path (guide to recipe to SKU) pushes authority from a high-traffic informational query down to a high-intent transactional page. According to Search Engine Land SEO coverage, informational content that internally links to transactional pages produces 2 to 4 times higher organic revenue than isolated content silos.
Wrapping up content marketing for food brands
Content marketing for food brands is the organic engine that turns a DTC snack, drink, or CPG storefront into a search-driven revenue channel. Recipe hub of 40 to 100 recipes. Ingredient comparison guides at 12 to 24 pieces. Sourcing story pages at 6 to 12 pieces. Buyer intent content at 8 to 16 pieces. Creator syndication calendar with 12 to 30 creators per quarter. Refresh cadence at 12 to 24 months by pillar. Reporting with organic sessions and organic revenue attribution.
If your DTC food brand is running paid social at 20,000 dollars monthly with a broken blog and zero recipe schema, professional content marketing for food brands pays for itself inside the first 90 days on organic traffic captured. Redefine Web ships content marketing inside our monthly retainer packages. Book a call and we will walk through the last three DTC food brands we built recipe hubs for, pillar by pillar.
Content marketing for food brands starts with a recipe hub because recipe queries account for 40 to 60 percent of high-intent search volume in the food category. Every hero SKU needs 4 to 12 recipes anchored to it, each targeting a specific occasion and audience.
Skip the recipe hub and the brand loses the search real estate that pulls DTC storefront traffic month over month at zero incremental paid cost. Recipe traffic converts at 2 to 4 percent because the shopper landed with usage intent, not passive discovery, which is why food brands win on recipes.
Recipe schema and Google rich result eligibility
Every recipe page ships schema.org Recipe markup including cookTime, prepTime, recipeIngredient, recipeInstructions, nutrition, and aggregateRating. Correctly marked-up recipes qualify for Google’s recipe rich result carousel that pulls 3 to 6 times higher click-through rate than a plain blue link. The schema layer takes 15 minutes per recipe to author and 30 minutes to validate in Google Search Console. Cross-reference the recipe search stack on our food and beverage SEO page.
Recipe hub structure that scales
The recipe hub structure runs 40 to 100 recipes at maturity, organized by hero SKU (4 to 12 recipes per SKU) plus occasion tags (breakfast, weeknight dinner, meal prep, brunch, holiday). Every recipe links back to the hero SKU product page with the SKU embedded in an inline card. The hub earns internal linking value from ingredient comparison guides and the sourcing story pages, which feeds recipe ranking on Google. According to Google Search Central recipe structured data guidance, complete Recipe schema markup is required for eligibility in the recipe carousel and the ingredient search filter.
Pillar structure for food brand content marketing
The pillar structure on content marketing for food brands runs 4 content pillars concurrently: recipe hub (40 to 100 recipes), ingredient comparison guides (12 to 24 guides), sourcing story pages (6 to 12 pages), and buyer intent content (where to buy, subscription vs. one-time, gift bundle guides). Every pillar covers a distinct search intent and every pillar links back to the hero SKU product pages.
Ingredient comparison guide format
Ingredient comparison guides run 1,800 to 3,200 words comparing 2 to 4 ingredient types on 6 to 10 attributes with a comparison table, real-world use case examples, and links to the hero SKU that uses the specific ingredient. Example: organic vs. conventional oats compares nutritional profile, sourcing chain, cost, environmental impact, and taste on a 6-column table. The brand’s SKU appears in the winning column with a product card. These guides rank 3 to 8 months after publication and pull steady-state organic traffic.
Sourcing story pages that build trust
Sourcing story pages name the specific farms, cooperatives, or suppliers the brand sources from, with photos of the farms, farmer quotes, and specific harvest windows. A coffee brand’s Ethiopian farm page ranks for “single-origin Ethiopian coffee” and “Yirgacheffe coffee origin” plus 40 long-tail variations. The sourcing page pulls trust-building traffic that converts at 4 to 6 percent because the shopper landed pattern-matching on transparency and named provenance. Every sourcing page includes farmer or cooperative quotes, harvest dates, and a link back to 3 to 5 hero SKU pages that source from the named supplier.
Vejrø hospitality content case study
Vejrø Resort, a Danish private-island destination with an on-site restaurant focused on organic, locally sourced cuisine, joined us with strong social engagement and no organic-search real estate. Guests found the resort on Instagram but never in Google search for terms like “private island resort Denmark,” “farm-to-table hospitality Denmark,” or “Vejrø restaurant.” The same organic-search gap shows up on DTC food brands running paid social at 20,000 dollars monthly with a broken blog and zero recipe schema.
We built the conversion-focused website with on-site and off-site SEO tuned to the travel-niche keyword clusters, competitor analysis against comparable boutique resorts, and mobile-first design prioritizing guest discovery. Every page carried the structured data qualifying it for Google’s rich results in the hospitality category. Every internal link pushed authority toward the direct-booking conversion path.
Three months later, Vejrø hit 10,000 plus organic visitors, ranked for 200 plus first-page keywords, and pulled a 2.2 percent booking conversion rate from organic traffic. The same pattern applies to content marketing for food brands: recipe schema, ingredient comparison guides, and sourcing story pages pull organic traffic at 20 to 40 percent conversion into hero SKU pages inside 6 months when the content quality matches search intent and every page carries the right structured data markup. Vejrø also proved out the reporting discipline: every monthly report named the exact page, the exact keyword cluster, and the exact search feature (rich result, sitelinks, image pack) driving the incremental organic revenue instead of hiding behind aggregate traffic charts.
Recipe cadence and content calendar for food brands
Recipe cadence on a working food brand content calendar ships 2 to 4 new recipes per week during the first 6 months and drops to 1 per week at maturity. Each recipe takes 4 to 6 hours to produce (write, test in the kitchen, photograph, schema author, publish). At 3 recipes per week, the brand hits 78 recipes inside 6 months plus a backlog of ingredient comparison and sourcing content queued behind the recipe production line.
| Content pillar | Target volume year 1 | Production cost per piece | Refresh cadence |
|---|---|---|---|
| Recipe hub | 40 to 100 recipes | $180 to $320 | Every 12 months |
| Ingredient comparison guides | 12 to 24 guides | $450 to $780 | Every 18 months |
| Sourcing story pages | 6 to 12 pages | $680 to $1,200 | Every 24 months |
| Buyer intent content | 8 to 16 pieces | $220 to $420 | Every 12 months |
Photography as a content calendar constraint
Photography is the actual constraint on recipe cadence, not writing. Every recipe needs 6 to 12 photos: hero shot, ingredient flat lay, prep in progress, plated result, storage, and step shots for the schema markup. A working food brand batches photography 8 recipes at a time to keep the cost per recipe under 200 dollars. Skip the batching and the per-recipe cost climbs to 400 to 600 dollars, which caps recipe cadence at 1 per week and slows organic ranking timeline by 6 months.
Seasonal content calendar planning
Seasonal content calendar planning maps recipes and comparison guides to the seasonal windows they need to rank in. A Christmas cookie recipe needs to publish in September to rank by early December. A Valentine’s chocolate guide needs to publish in November to rank by early February. A back-to-school lunchbox recipe needs to publish in June to rank by late August. The 60-to-90-day ranking curve dictates the calendar.
Creator syndication inside food brand content
Creator syndication on food brand content marketing amplifies the recipe hub through Instagram Reels, TikTok, and YouTube Shorts creators paid to post their own version of the brand’s hero recipes. The creator content pulls net-new audiences into the recipe hub through the creator’s Link in Bio or Amazon Storefront tag. The syndication calendar names 12 to 30 creators per quarter with specific recipes assigned to each.
One brand we picked up had a spreadsheet titled “creator outreach 2023” with 47 rows and 3 responses. All 3 responses were auto-replies. The spreadsheet named zero recipes and offered flat rates below 100 dollars per post. Nobody posts a 30-second video for 87 dollars flat. Nobody.
Creator content commercial terms that work
Working creator content commercial terms run 350 to 1,500 dollars flat per post plus a 12 to 25 percent commission on tagged sales across a 30-day window. The commission mechanic pulls creators into follow-up posts because the incremental revenue continues past the initial fee. Mid-tier creators (30k to 150k followers) hit the sweet spot for food brand content because their engagement rate typically runs 4 to 8 percent versus 0.8 to 1.6 percent on mega-creators.
Content brief structure for creator partnerships
The content brief structure for creator partnerships runs a single page: the SKU, the specific recipe or usage occasion, 3 required brand mentions, 3 restricted claims (no health claims on non-medical SKUs), the pricing angle, the affiliate link, and 3 example videos that hit the tone. The brief avoids over-scripting because over-scripted creator content underperforms native creator voice by 40 to 60 percent on engagement rate.
Buyer intent content for food brand blogs
Buyer intent content on food brand blogs covers 8 to 16 pieces targeting explicit purchase-decision queries: “where to buy [brand],” “[brand] subscription vs. one-time,” “best [category] for [use case],” and “[brand] gift bundle.” Every buyer intent piece runs 1,400 to 2,400 words with a comparison table, product cards, and a clear conversion path to the specific SKU that matches the query intent. Buyer intent content converts at 3 to 6 percent versus 1 to 2 percent on recipe content because the shopper landed already planning to buy, not exploring a usage occasion.
Where-to-buy content structure
Where-to-buy content structure covers online (DTC storefront, Amazon, Target.com, Whole Foods online), retail (specific chain locators with the store finder embedded), and international (customs limitations, retailer partners abroad). Every piece names specific retailers, links to the store locator, and includes an FAQ block covering shipping availability, subscription options, and gift card compatibility. Where-to-buy content ranks for branded discovery queries the DTC storefront otherwise loses to competitor affiliate reviews.
Subscription versus one-time comparison content
Subscription versus one-time comparison content converts subscription commitments at 3 to 6 percent because it addresses the price-sensitivity concern head-on with a specific math table. The piece covers the discount structure (15 percent lifetime), the skip-a-month mechanic, the pause-anytime rule, the cancellation policy, and the specific yearly savings for the brand’s average consumption cadence. Cross-reference the retention structure on our food and beverage marketing retainer page.
Content refresh cadence on food brand pillars
Content refresh cadence on food brand content pillars runs a rolling audit every 12 to 24 months by pillar. Recipes get refreshed every 12 months with new photography, updated schema, and any nutrition or ingredient adjustments. Ingredient comparison guides refresh every 18 months to update market data. Sourcing story pages refresh every 24 months to reflect farm partnership changes and new harvest angles. Buyer intent content refreshes every 12 months to update retailer availability and pricing.
Recipe refresh priority order
Recipe refresh priority runs by organic traffic rank. The top 20 recipes by monthly organic sessions get refreshed first (new photography, schema audit, related recipe internal links, updated nutrition). The next 40 get refreshed at 15 months. The remaining recipes get refreshed opportunistically when the ranking slips past position 15 in Google. Skipping the refresh cadence lets recipe rankings drift out of the top 3 inside 18 months as newer competitor recipes take the position.
Schema audit checklist per refresh
The schema audit checklist per refresh runs 8 items: Recipe schema completeness, aggregateRating count and accuracy, nutrition data accuracy, prepTime and cookTime match the recipe body, image URLs valid at CDN, related recipe internal links working, product card SKU URL live, and Google Search Console rich result eligibility validated. This checklist takes 20 minutes per recipe and prevents the schema drift that costs recipe rankings 20 to 40 positions quietly.
Reporting cadence for food brand content marketing
Reporting cadence on food brand content marketing runs a monthly executive report plus a quarterly business review. The monthly report ships in the first business week and covers organic sessions by pillar, top 10 ranking recipes with position trend, ingredient guide ranking movements, sourcing page performance, and organic-attributed DTC revenue. Every number carries a comparison to the prior month and a plain-language interpretation the founder reads in 7 minutes.
Metrics that matter for content marketing
Metrics that matter for food brand content marketing: organic sessions by pillar, recipe rich result impressions in Search Console, organic conversion rate to hero SKU pages, organic-attributed DTC revenue, and top 20 ranking positions by monthly organic sessions. Vanity metrics that do not matter: total pageviews without conversion context, average time on page without conversion attribution, and social share counts. The monthly report skips the vanity block entirely.
Quarterly business review structure
The quarterly business review runs 90 minutes with the founder, head of content, and SEO lead. Agenda: organic traffic trend by pillar, top 10 winning content pieces, top 10 losing content pieces (candidates for refresh or removal), competitive gap analysis against 5 named competitor brands, and next quarter’s content calendar with recipes and ingredient guides queued. According to Ahrefs content marketing research, brands running quarterly content audits outperform brands running annual audits by 40 to 70 percent on organic revenue over a 24-month window.
Internal linking discipline across food brand content
Internal linking discipline across food brand content moves authority from recipe pages toward hero SKU product pages and comparison guides. Every recipe links to the hero SKU it uses inline (once in the ingredient list, once in a bottom call-out card). Every ingredient comparison guide links to 3 to 6 recipes using the winning ingredient plus the hero SKU product page. Every sourcing story links to the 2 to 4 SKUs sourced from that specific farm or cooperative.
Anchor text strategy across recipe hubs
Anchor text on internal links varies across recipe hubs to avoid over-optimization patterns Google penalizes. Exact-match anchor (“single-origin Ethiopian coffee”) runs on 20 to 30 percent of internal links. Partial-match variations (“our Ethiopian roast”) run on 30 to 40 percent. Branded anchors (the SKU name) run on 20 to 30 percent. Generic anchors (“shop the coffee”) fill the remaining 10 to 20 percent. This ratio holds ranking without triggering the over-optimization penalty that shows up on brands that anchor-text-stuff every internal link with the same exact-match keyword. Cross-reference the linking layer on our food and beverage web design page.
Link equity from ingredient guides to SKU pages
Link equity from ingredient guides passes to SKU pages when the guide’s comparison table names the hero SKU in the winning column with a product card, and when the guide’s body links to 3 to 6 recipes that use the winning ingredient. This 3-hop path (guide to recipe to SKU) pushes authority from a high-traffic informational query down to a high-intent transactional page. According to Search Engine Land SEO coverage, informational content that internally links to transactional pages produces 2 to 4 times higher organic revenue than isolated content silos.
Wrapping up content marketing for food brands
Content marketing for food brands is the organic engine that turns a DTC snack, drink, or CPG storefront into a search-driven revenue channel. Recipe hub of 40 to 100 recipes. Ingredient comparison guides at 12 to 24 pieces. Sourcing story pages at 6 to 12 pieces. Buyer intent content at 8 to 16 pieces. Creator syndication calendar with 12 to 30 creators per quarter. Refresh cadence at 12 to 24 months by pillar. Reporting with organic sessions and organic revenue attribution.
If your DTC food brand is running paid social at 20,000 dollars monthly with a broken blog and zero recipe schema, professional content marketing for food brands pays for itself inside the first 90 days on organic traffic captured. Redefine Web ships content marketing inside our monthly retainer packages. Book a call and we will walk through the last three DTC food brands we built recipe hubs for, pillar by pillar.
Anchor text on internal links varies across recipe hubs to avoid over-optimization patterns Google penalizes. Exact-match anchor (“single-origin Ethiopian coffee”) runs on 20 to 30 percent of internal links. Partial-match variations (“our Ethiopian roast”) run on 30 to 40 percent. Branded anchors (the SKU name) run on 20 to 30 percent. Generic anchors (“shop the coffee”) fill the remaining 10 to 20 percent. This ratio holds ranking without triggering the over-optimization penalty that shows up on brands that anchor-text-stuff every internal link with the same exact-match keyword. Cross-reference the linking layer on our food and beverage web design page.
Link equity from ingredient guides to SKU pages
Link equity from ingredient guides passes to SKU pages when the guide’s comparison table names the hero SKU in the winning column with a product card, and when the guide’s body links to 3 to 6 recipes that use the winning ingredient. This 3-hop path (guide to recipe to SKU) pushes authority from a high-traffic informational query down to a high-intent transactional page. According to Search Engine Land SEO coverage, informational content that internally links to transactional pages produces 2 to 4 times higher organic revenue than isolated content silos.
Wrapping up content marketing for food brands
Content marketing for food brands is the organic engine that turns a DTC snack, drink, or CPG storefront into a search-driven revenue channel. Recipe hub of 40 to 100 recipes. Ingredient comparison guides at 12 to 24 pieces. Sourcing story pages at 6 to 12 pieces. Buyer intent content at 8 to 16 pieces. Creator syndication calendar with 12 to 30 creators per quarter. Refresh cadence at 12 to 24 months by pillar. Reporting with organic sessions and organic revenue attribution.
If your DTC food brand is running paid social at 20,000 dollars monthly with a broken blog and zero recipe schema, professional content marketing for food brands pays for itself inside the first 90 days on organic traffic captured. Redefine Web ships content marketing inside our monthly retainer packages. Book a call and we will walk through the last three DTC food brands we built recipe hubs for, pillar by pillar.
Internal linking discipline across food brand content moves authority from recipe pages toward hero SKU product pages and comparison guides. Every recipe links to the hero SKU it uses inline (once in the ingredient list, once in a bottom call-out card). Every ingredient comparison guide links to 3 to 6 recipes using the winning ingredient plus the hero SKU product page. Every sourcing story links to the 2 to 4 SKUs sourced from that specific farm or cooperative.
Anchor text strategy across recipe hubs
Anchor text on internal links varies across recipe hubs to avoid over-optimization patterns Google penalizes. Exact-match anchor (“single-origin Ethiopian coffee”) runs on 20 to 30 percent of internal links. Partial-match variations (“our Ethiopian roast”) run on 30 to 40 percent. Branded anchors (the SKU name) run on 20 to 30 percent. Generic anchors (“shop the coffee”) fill the remaining 10 to 20 percent. This ratio holds ranking without triggering the over-optimization penalty that shows up on brands that anchor-text-stuff every internal link with the same exact-match keyword. Cross-reference the linking layer on our food and beverage web design page.
Link equity from ingredient guides to SKU pages
Link equity from ingredient guides passes to SKU pages when the guide’s comparison table names the hero SKU in the winning column with a product card, and when the guide’s body links to 3 to 6 recipes that use the winning ingredient. This 3-hop path (guide to recipe to SKU) pushes authority from a high-traffic informational query down to a high-intent transactional page. According to Search Engine Land SEO coverage, informational content that internally links to transactional pages produces 2 to 4 times higher organic revenue than isolated content silos.
Wrapping up content marketing for food brands
Content marketing for food brands is the organic engine that turns a DTC snack, drink, or CPG storefront into a search-driven revenue channel. Recipe hub of 40 to 100 recipes. Ingredient comparison guides at 12 to 24 pieces. Sourcing story pages at 6 to 12 pieces. Buyer intent content at 8 to 16 pieces. Creator syndication calendar with 12 to 30 creators per quarter. Refresh cadence at 12 to 24 months by pillar. Reporting with organic sessions and organic revenue attribution.
If your DTC food brand is running paid social at 20,000 dollars monthly with a broken blog and zero recipe schema, professional content marketing for food brands pays for itself inside the first 90 days on organic traffic captured. Redefine Web ships content marketing inside our monthly retainer packages. Book a call and we will walk through the last three DTC food brands we built recipe hubs for, pillar by pillar.
Content marketing for food brands starts with a recipe hub because recipe queries account for 40 to 60 percent of high-intent search volume in the food category. Every hero SKU needs 4 to 12 recipes anchored to it, each targeting a specific occasion and audience.
Skip the recipe hub and the brand loses the search real estate that pulls DTC storefront traffic month over month at zero incremental paid cost. Recipe traffic converts at 2 to 4 percent because the shopper landed with usage intent, not passive discovery, which is why food brands win on recipes.
Recipe schema and Google rich result eligibility
Every recipe page ships schema.org Recipe markup including cookTime, prepTime, recipeIngredient, recipeInstructions, nutrition, and aggregateRating. Correctly marked-up recipes qualify for Google’s recipe rich result carousel that pulls 3 to 6 times higher click-through rate than a plain blue link. The schema layer takes 15 minutes per recipe to author and 30 minutes to validate in Google Search Console. Cross-reference the recipe search stack on our food and beverage SEO page.
Recipe hub structure that scales
The recipe hub structure runs 40 to 100 recipes at maturity, organized by hero SKU (4 to 12 recipes per SKU) plus occasion tags (breakfast, weeknight dinner, meal prep, brunch, holiday). Every recipe links back to the hero SKU product page with the SKU embedded in an inline card. The hub earns internal linking value from ingredient comparison guides and the sourcing story pages, which feeds recipe ranking on Google. According to Google Search Central recipe structured data guidance, complete Recipe schema markup is required for eligibility in the recipe carousel and the ingredient search filter.
Pillar structure for food brand content marketing
The pillar structure on content marketing for food brands runs 4 content pillars concurrently: recipe hub (40 to 100 recipes), ingredient comparison guides (12 to 24 guides), sourcing story pages (6 to 12 pages), and buyer intent content (where to buy, subscription vs. one-time, gift bundle guides). Every pillar covers a distinct search intent and every pillar links back to the hero SKU product pages.
Ingredient comparison guide format
Ingredient comparison guides run 1,800 to 3,200 words comparing 2 to 4 ingredient types on 6 to 10 attributes with a comparison table, real-world use case examples, and links to the hero SKU that uses the specific ingredient. Example: organic vs. conventional oats compares nutritional profile, sourcing chain, cost, environmental impact, and taste on a 6-column table. The brand’s SKU appears in the winning column with a product card. These guides rank 3 to 8 months after publication and pull steady-state organic traffic.
Sourcing story pages that build trust
Sourcing story pages name the specific farms, cooperatives, or suppliers the brand sources from, with photos of the farms, farmer quotes, and specific harvest windows. A coffee brand’s Ethiopian farm page ranks for “single-origin Ethiopian coffee” and “Yirgacheffe coffee origin” plus 40 long-tail variations. The sourcing page pulls trust-building traffic that converts at 4 to 6 percent because the shopper landed pattern-matching on transparency and named provenance. Every sourcing page includes farmer or cooperative quotes, harvest dates, and a link back to 3 to 5 hero SKU pages that source from the named supplier.
Vejrø hospitality content case study
Vejrø Resort, a Danish private-island destination with an on-site restaurant focused on organic, locally sourced cuisine, joined us with strong social engagement and no organic-search real estate. Guests found the resort on Instagram but never in Google search for terms like “private island resort Denmark,” “farm-to-table hospitality Denmark,” or “Vejrø restaurant.” The same organic-search gap shows up on DTC food brands running paid social at 20,000 dollars monthly with a broken blog and zero recipe schema.
We built the conversion-focused website with on-site and off-site SEO tuned to the travel-niche keyword clusters, competitor analysis against comparable boutique resorts, and mobile-first design prioritizing guest discovery. Every page carried the structured data qualifying it for Google’s rich results in the hospitality category. Every internal link pushed authority toward the direct-booking conversion path.
Three months later, Vejrø hit 10,000 plus organic visitors, ranked for 200 plus first-page keywords, and pulled a 2.2 percent booking conversion rate from organic traffic. The same pattern applies to content marketing for food brands: recipe schema, ingredient comparison guides, and sourcing story pages pull organic traffic at 20 to 40 percent conversion into hero SKU pages inside 6 months when the content quality matches search intent and every page carries the right structured data markup. Vejrø also proved out the reporting discipline: every monthly report named the exact page, the exact keyword cluster, and the exact search feature (rich result, sitelinks, image pack) driving the incremental organic revenue instead of hiding behind aggregate traffic charts.
Recipe cadence and content calendar for food brands
Recipe cadence on a working food brand content calendar ships 2 to 4 new recipes per week during the first 6 months and drops to 1 per week at maturity. Each recipe takes 4 to 6 hours to produce (write, test in the kitchen, photograph, schema author, publish). At 3 recipes per week, the brand hits 78 recipes inside 6 months plus a backlog of ingredient comparison and sourcing content queued behind the recipe production line.
| Content pillar | Target volume year 1 | Production cost per piece | Refresh cadence |
|---|---|---|---|
| Recipe hub | 40 to 100 recipes | $180 to $320 | Every 12 months |
| Ingredient comparison guides | 12 to 24 guides | $450 to $780 | Every 18 months |
| Sourcing story pages | 6 to 12 pages | $680 to $1,200 | Every 24 months |
| Buyer intent content | 8 to 16 pieces | $220 to $420 | Every 12 months |
Photography as a content calendar constraint
Photography is the actual constraint on recipe cadence, not writing. Every recipe needs 6 to 12 photos: hero shot, ingredient flat lay, prep in progress, plated result, storage, and step shots for the schema markup. A working food brand batches photography 8 recipes at a time to keep the cost per recipe under 200 dollars. Skip the batching and the per-recipe cost climbs to 400 to 600 dollars, which caps recipe cadence at 1 per week and slows organic ranking timeline by 6 months.
Seasonal content calendar planning
Seasonal content calendar planning maps recipes and comparison guides to the seasonal windows they need to rank in. A Christmas cookie recipe needs to publish in September to rank by early December. A Valentine’s chocolate guide needs to publish in November to rank by early February. A back-to-school lunchbox recipe needs to publish in June to rank by late August. The 60-to-90-day ranking curve dictates the calendar.
Creator syndication inside food brand content
Creator syndication on food brand content marketing amplifies the recipe hub through Instagram Reels, TikTok, and YouTube Shorts creators paid to post their own version of the brand’s hero recipes. The creator content pulls net-new audiences into the recipe hub through the creator’s Link in Bio or Amazon Storefront tag. The syndication calendar names 12 to 30 creators per quarter with specific recipes assigned to each.
One brand we picked up had a spreadsheet titled “creator outreach 2023” with 47 rows and 3 responses. All 3 responses were auto-replies. The spreadsheet named zero recipes and offered flat rates below 100 dollars per post. Nobody posts a 30-second video for 87 dollars flat. Nobody.
Creator content commercial terms that work
Working creator content commercial terms run 350 to 1,500 dollars flat per post plus a 12 to 25 percent commission on tagged sales across a 30-day window. The commission mechanic pulls creators into follow-up posts because the incremental revenue continues past the initial fee. Mid-tier creators (30k to 150k followers) hit the sweet spot for food brand content because their engagement rate typically runs 4 to 8 percent versus 0.8 to 1.6 percent on mega-creators.
Content brief structure for creator partnerships
The content brief structure for creator partnerships runs a single page: the SKU, the specific recipe or usage occasion, 3 required brand mentions, 3 restricted claims (no health claims on non-medical SKUs), the pricing angle, the affiliate link, and 3 example videos that hit the tone. The brief avoids over-scripting because over-scripted creator content underperforms native creator voice by 40 to 60 percent on engagement rate.
Buyer intent content for food brand blogs
Buyer intent content on food brand blogs covers 8 to 16 pieces targeting explicit purchase-decision queries: “where to buy [brand],” “[brand] subscription vs. one-time,” “best [category] for [use case],” and “[brand] gift bundle.” Every buyer intent piece runs 1,400 to 2,400 words with a comparison table, product cards, and a clear conversion path to the specific SKU that matches the query intent. Buyer intent content converts at 3 to 6 percent versus 1 to 2 percent on recipe content because the shopper landed already planning to buy, not exploring a usage occasion.
Where-to-buy content structure
Where-to-buy content structure covers online (DTC storefront, Amazon, Target.com, Whole Foods online), retail (specific chain locators with the store finder embedded), and international (customs limitations, retailer partners abroad). Every piece names specific retailers, links to the store locator, and includes an FAQ block covering shipping availability, subscription options, and gift card compatibility. Where-to-buy content ranks for branded discovery queries the DTC storefront otherwise loses to competitor affiliate reviews.
Subscription versus one-time comparison content
Subscription versus one-time comparison content converts subscription commitments at 3 to 6 percent because it addresses the price-sensitivity concern head-on with a specific math table. The piece covers the discount structure (15 percent lifetime), the skip-a-month mechanic, the pause-anytime rule, the cancellation policy, and the specific yearly savings for the brand’s average consumption cadence. Cross-reference the retention structure on our food and beverage marketing retainer page.
Content refresh cadence on food brand pillars
Content refresh cadence on food brand content pillars runs a rolling audit every 12 to 24 months by pillar. Recipes get refreshed every 12 months with new photography, updated schema, and any nutrition or ingredient adjustments. Ingredient comparison guides refresh every 18 months to update market data. Sourcing story pages refresh every 24 months to reflect farm partnership changes and new harvest angles. Buyer intent content refreshes every 12 months to update retailer availability and pricing.
Recipe refresh priority order
Recipe refresh priority runs by organic traffic rank. The top 20 recipes by monthly organic sessions get refreshed first (new photography, schema audit, related recipe internal links, updated nutrition). The next 40 get refreshed at 15 months. The remaining recipes get refreshed opportunistically when the ranking slips past position 15 in Google. Skipping the refresh cadence lets recipe rankings drift out of the top 3 inside 18 months as newer competitor recipes take the position.
Schema audit checklist per refresh
The schema audit checklist per refresh runs 8 items: Recipe schema completeness, aggregateRating count and accuracy, nutrition data accuracy, prepTime and cookTime match the recipe body, image URLs valid at CDN, related recipe internal links working, product card SKU URL live, and Google Search Console rich result eligibility validated. This checklist takes 20 minutes per recipe and prevents the schema drift that costs recipe rankings 20 to 40 positions quietly.
Reporting cadence for food brand content marketing
Reporting cadence on food brand content marketing runs a monthly executive report plus a quarterly business review. The monthly report ships in the first business week and covers organic sessions by pillar, top 10 ranking recipes with position trend, ingredient guide ranking movements, sourcing page performance, and organic-attributed DTC revenue. Every number carries a comparison to the prior month and a plain-language interpretation the founder reads in 7 minutes.
Metrics that matter for content marketing
Metrics that matter for food brand content marketing: organic sessions by pillar, recipe rich result impressions in Search Console, organic conversion rate to hero SKU pages, organic-attributed DTC revenue, and top 20 ranking positions by monthly organic sessions. Vanity metrics that do not matter: total pageviews without conversion context, average time on page without conversion attribution, and social share counts. The monthly report skips the vanity block entirely.
Quarterly business review structure
The quarterly business review runs 90 minutes with the founder, head of content, and SEO lead. Agenda: organic traffic trend by pillar, top 10 winning content pieces, top 10 losing content pieces (candidates for refresh or removal), competitive gap analysis against 5 named competitor brands, and next quarter’s content calendar with recipes and ingredient guides queued. According to Ahrefs content marketing research, brands running quarterly content audits outperform brands running annual audits by 40 to 70 percent on organic revenue over a 24-month window.
Internal linking discipline across food brand content
Internal linking discipline across food brand content moves authority from recipe pages toward hero SKU product pages and comparison guides. Every recipe links to the hero SKU it uses inline (once in the ingredient list, once in a bottom call-out card). Every ingredient comparison guide links to 3 to 6 recipes using the winning ingredient plus the hero SKU product page. Every sourcing story links to the 2 to 4 SKUs sourced from that specific farm or cooperative.
Anchor text strategy across recipe hubs
Anchor text on internal links varies across recipe hubs to avoid over-optimization patterns Google penalizes. Exact-match anchor (“single-origin Ethiopian coffee”) runs on 20 to 30 percent of internal links. Partial-match variations (“our Ethiopian roast”) run on 30 to 40 percent. Branded anchors (the SKU name) run on 20 to 30 percent. Generic anchors (“shop the coffee”) fill the remaining 10 to 20 percent. This ratio holds ranking without triggering the over-optimization penalty that shows up on brands that anchor-text-stuff every internal link with the same exact-match keyword. Cross-reference the linking layer on our food and beverage web design page.
Link equity from ingredient guides to SKU pages
Link equity from ingredient guides passes to SKU pages when the guide’s comparison table names the hero SKU in the winning column with a product card, and when the guide’s body links to 3 to 6 recipes that use the winning ingredient. This 3-hop path (guide to recipe to SKU) pushes authority from a high-traffic informational query down to a high-intent transactional page. According to Search Engine Land SEO coverage, informational content that internally links to transactional pages produces 2 to 4 times higher organic revenue than isolated content silos.
Wrapping up content marketing for food brands
Content marketing for food brands is the organic engine that turns a DTC snack, drink, or CPG storefront into a search-driven revenue channel. Recipe hub of 40 to 100 recipes. Ingredient comparison guides at 12 to 24 pieces. Sourcing story pages at 6 to 12 pieces. Buyer intent content at 8 to 16 pieces. Creator syndication calendar with 12 to 30 creators per quarter. Refresh cadence at 12 to 24 months by pillar. Reporting with organic sessions and organic revenue attribution.
If your DTC food brand is running paid social at 20,000 dollars monthly with a broken blog and zero recipe schema, professional content marketing for food brands pays for itself inside the first 90 days on organic traffic captured. Redefine Web ships content marketing inside our monthly retainer packages. Book a call and we will walk through the last three DTC food brands we built recipe hubs for, pillar by pillar.
Content marketing for food brands starts with a recipe hub because recipe queries account for 40 to 60 percent of high-intent search volume in the food category. Every hero SKU needs 4 to 12 recipes anchored to it, each targeting a specific occasion and audience.
Skip the recipe hub and the brand loses the search real estate that pulls DTC storefront traffic month over month at zero incremental paid cost. Recipe traffic converts at 2 to 4 percent because the shopper landed with usage intent, not passive discovery, which is why food brands win on recipes.
Recipe schema and Google rich result eligibility
Every recipe page ships schema.org Recipe markup including cookTime, prepTime, recipeIngredient, recipeInstructions, nutrition, and aggregateRating. Correctly marked-up recipes qualify for Google’s recipe rich result carousel that pulls 3 to 6 times higher click-through rate than a plain blue link. The schema layer takes 15 minutes per recipe to author and 30 minutes to validate in Google Search Console. Cross-reference the recipe search stack on our food and beverage SEO page.
Recipe hub structure that scales
The recipe hub structure runs 40 to 100 recipes at maturity, organized by hero SKU (4 to 12 recipes per SKU) plus occasion tags (breakfast, weeknight dinner, meal prep, brunch, holiday). Every recipe links back to the hero SKU product page with the SKU embedded in an inline card. The hub earns internal linking value from ingredient comparison guides and the sourcing story pages, which feeds recipe ranking on Google. According to Google Search Central recipe structured data guidance, complete Recipe schema markup is required for eligibility in the recipe carousel and the ingredient search filter.
Pillar structure for food brand content marketing
The pillar structure on content marketing for food brands runs 4 content pillars concurrently: recipe hub (40 to 100 recipes), ingredient comparison guides (12 to 24 guides), sourcing story pages (6 to 12 pages), and buyer intent content (where to buy, subscription vs. one-time, gift bundle guides). Every pillar covers a distinct search intent and every pillar links back to the hero SKU product pages.
Ingredient comparison guide format
Ingredient comparison guides run 1,800 to 3,200 words comparing 2 to 4 ingredient types on 6 to 10 attributes with a comparison table, real-world use case examples, and links to the hero SKU that uses the specific ingredient. Example: organic vs. conventional oats compares nutritional profile, sourcing chain, cost, environmental impact, and taste on a 6-column table. The brand’s SKU appears in the winning column with a product card. These guides rank 3 to 8 months after publication and pull steady-state organic traffic.
Sourcing story pages that build trust
Sourcing story pages name the specific farms, cooperatives, or suppliers the brand sources from, with photos of the farms, farmer quotes, and specific harvest windows. A coffee brand’s Ethiopian farm page ranks for “single-origin Ethiopian coffee” and “Yirgacheffe coffee origin” plus 40 long-tail variations. The sourcing page pulls trust-building traffic that converts at 4 to 6 percent because the shopper landed pattern-matching on transparency and named provenance. Every sourcing page includes farmer or cooperative quotes, harvest dates, and a link back to 3 to 5 hero SKU pages that source from the named supplier.
Vejrø hospitality content case study
Vejrø Resort, a Danish private-island destination with an on-site restaurant focused on organic, locally sourced cuisine, joined us with strong social engagement and no organic-search real estate. Guests found the resort on Instagram but never in Google search for terms like “private island resort Denmark,” “farm-to-table hospitality Denmark,” or “Vejrø restaurant.” The same organic-search gap shows up on DTC food brands running paid social at 20,000 dollars monthly with a broken blog and zero recipe schema.
We built the conversion-focused website with on-site and off-site SEO tuned to the travel-niche keyword clusters, competitor analysis against comparable boutique resorts, and mobile-first design prioritizing guest discovery. Every page carried the structured data qualifying it for Google’s rich results in the hospitality category. Every internal link pushed authority toward the direct-booking conversion path.
Three months later, Vejrø hit 10,000 plus organic visitors, ranked for 200 plus first-page keywords, and pulled a 2.2 percent booking conversion rate from organic traffic. The same pattern applies to content marketing for food brands: recipe schema, ingredient comparison guides, and sourcing story pages pull organic traffic at 20 to 40 percent conversion into hero SKU pages inside 6 months when the content quality matches search intent and every page carries the right structured data markup. Vejrø also proved out the reporting discipline: every monthly report named the exact page, the exact keyword cluster, and the exact search feature (rich result, sitelinks, image pack) driving the incremental organic revenue instead of hiding behind aggregate traffic charts.
Recipe cadence and content calendar for food brands
Recipe cadence on a working food brand content calendar ships 2 to 4 new recipes per week during the first 6 months and drops to 1 per week at maturity. Each recipe takes 4 to 6 hours to produce (write, test in the kitchen, photograph, schema author, publish). At 3 recipes per week, the brand hits 78 recipes inside 6 months plus a backlog of ingredient comparison and sourcing content queued behind the recipe production line.
| Content pillar | Target volume year 1 | Production cost per piece | Refresh cadence |
|---|---|---|---|
| Recipe hub | 40 to 100 recipes | $180 to $320 | Every 12 months |
| Ingredient comparison guides | 12 to 24 guides | $450 to $780 | Every 18 months |
| Sourcing story pages | 6 to 12 pages | $680 to $1,200 | Every 24 months |
| Buyer intent content | 8 to 16 pieces | $220 to $420 | Every 12 months |
Photography as a content calendar constraint
Photography is the actual constraint on recipe cadence, not writing. Every recipe needs 6 to 12 photos: hero shot, ingredient flat lay, prep in progress, plated result, storage, and step shots for the schema markup. A working food brand batches photography 8 recipes at a time to keep the cost per recipe under 200 dollars. Skip the batching and the per-recipe cost climbs to 400 to 600 dollars, which caps recipe cadence at 1 per week and slows organic ranking timeline by 6 months.
Seasonal content calendar planning
Seasonal content calendar planning maps recipes and comparison guides to the seasonal windows they need to rank in. A Christmas cookie recipe needs to publish in September to rank by early December. A Valentine’s chocolate guide needs to publish in November to rank by early February. A back-to-school lunchbox recipe needs to publish in June to rank by late August. The 60-to-90-day ranking curve dictates the calendar.
Creator syndication inside food brand content
Creator syndication on food brand content marketing amplifies the recipe hub through Instagram Reels, TikTok, and YouTube Shorts creators paid to post their own version of the brand’s hero recipes. The creator content pulls net-new audiences into the recipe hub through the creator’s Link in Bio or Amazon Storefront tag. The syndication calendar names 12 to 30 creators per quarter with specific recipes assigned to each.
One brand we picked up had a spreadsheet titled “creator outreach 2023” with 47 rows and 3 responses. All 3 responses were auto-replies. The spreadsheet named zero recipes and offered flat rates below 100 dollars per post. Nobody posts a 30-second video for 87 dollars flat. Nobody.
Creator content commercial terms that work
Working creator content commercial terms run 350 to 1,500 dollars flat per post plus a 12 to 25 percent commission on tagged sales across a 30-day window. The commission mechanic pulls creators into follow-up posts because the incremental revenue continues past the initial fee. Mid-tier creators (30k to 150k followers) hit the sweet spot for food brand content because their engagement rate typically runs 4 to 8 percent versus 0.8 to 1.6 percent on mega-creators.
Content brief structure for creator partnerships
The content brief structure for creator partnerships runs a single page: the SKU, the specific recipe or usage occasion, 3 required brand mentions, 3 restricted claims (no health claims on non-medical SKUs), the pricing angle, the affiliate link, and 3 example videos that hit the tone. The brief avoids over-scripting because over-scripted creator content underperforms native creator voice by 40 to 60 percent on engagement rate.
Buyer intent content for food brand blogs
Buyer intent content on food brand blogs covers 8 to 16 pieces targeting explicit purchase-decision queries: “where to buy [brand],” “[brand] subscription vs. one-time,” “best [category] for [use case],” and “[brand] gift bundle.” Every buyer intent piece runs 1,400 to 2,400 words with a comparison table, product cards, and a clear conversion path to the specific SKU that matches the query intent. Buyer intent content converts at 3 to 6 percent versus 1 to 2 percent on recipe content because the shopper landed already planning to buy, not exploring a usage occasion.
Where-to-buy content structure
Where-to-buy content structure covers online (DTC storefront, Amazon, Target.com, Whole Foods online), retail (specific chain locators with the store finder embedded), and international (customs limitations, retailer partners abroad). Every piece names specific retailers, links to the store locator, and includes an FAQ block covering shipping availability, subscription options, and gift card compatibility. Where-to-buy content ranks for branded discovery queries the DTC storefront otherwise loses to competitor affiliate reviews.
Subscription versus one-time comparison content
Subscription versus one-time comparison content converts subscription commitments at 3 to 6 percent because it addresses the price-sensitivity concern head-on with a specific math table. The piece covers the discount structure (15 percent lifetime), the skip-a-month mechanic, the pause-anytime rule, the cancellation policy, and the specific yearly savings for the brand’s average consumption cadence. Cross-reference the retention structure on our food and beverage marketing retainer page.
Content refresh cadence on food brand pillars
Content refresh cadence on food brand content pillars runs a rolling audit every 12 to 24 months by pillar. Recipes get refreshed every 12 months with new photography, updated schema, and any nutrition or ingredient adjustments. Ingredient comparison guides refresh every 18 months to update market data. Sourcing story pages refresh every 24 months to reflect farm partnership changes and new harvest angles. Buyer intent content refreshes every 12 months to update retailer availability and pricing.
Recipe refresh priority order
Recipe refresh priority runs by organic traffic rank. The top 20 recipes by monthly organic sessions get refreshed first (new photography, schema audit, related recipe internal links, updated nutrition). The next 40 get refreshed at 15 months. The remaining recipes get refreshed opportunistically when the ranking slips past position 15 in Google. Skipping the refresh cadence lets recipe rankings drift out of the top 3 inside 18 months as newer competitor recipes take the position.
Schema audit checklist per refresh
The schema audit checklist per refresh runs 8 items: Recipe schema completeness, aggregateRating count and accuracy, nutrition data accuracy, prepTime and cookTime match the recipe body, image URLs valid at CDN, related recipe internal links working, product card SKU URL live, and Google Search Console rich result eligibility validated. This checklist takes 20 minutes per recipe and prevents the schema drift that costs recipe rankings 20 to 40 positions quietly.
Reporting cadence for food brand content marketing
Reporting cadence on food brand content marketing runs a monthly executive report plus a quarterly business review. The monthly report ships in the first business week and covers organic sessions by pillar, top 10 ranking recipes with position trend, ingredient guide ranking movements, sourcing page performance, and organic-attributed DTC revenue. Every number carries a comparison to the prior month and a plain-language interpretation the founder reads in 7 minutes.
Metrics that matter for content marketing
Metrics that matter for food brand content marketing: organic sessions by pillar, recipe rich result impressions in Search Console, organic conversion rate to hero SKU pages, organic-attributed DTC revenue, and top 20 ranking positions by monthly organic sessions. Vanity metrics that do not matter: total pageviews without conversion context, average time on page without conversion attribution, and social share counts. The monthly report skips the vanity block entirely.
Quarterly business review structure
The quarterly business review runs 90 minutes with the founder, head of content, and SEO lead. Agenda: organic traffic trend by pillar, top 10 winning content pieces, top 10 losing content pieces (candidates for refresh or removal), competitive gap analysis against 5 named competitor brands, and next quarter’s content calendar with recipes and ingredient guides queued. According to Ahrefs content marketing research, brands running quarterly content audits outperform brands running annual audits by 40 to 70 percent on organic revenue over a 24-month window.
Internal linking discipline across food brand content
Internal linking discipline across food brand content moves authority from recipe pages toward hero SKU product pages and comparison guides. Every recipe links to the hero SKU it uses inline (once in the ingredient list, once in a bottom call-out card). Every ingredient comparison guide links to 3 to 6 recipes using the winning ingredient plus the hero SKU product page. Every sourcing story links to the 2 to 4 SKUs sourced from that specific farm or cooperative.
Anchor text strategy across recipe hubs
Anchor text on internal links varies across recipe hubs to avoid over-optimization patterns Google penalizes. Exact-match anchor (“single-origin Ethiopian coffee”) runs on 20 to 30 percent of internal links. Partial-match variations (“our Ethiopian roast”) run on 30 to 40 percent. Branded anchors (the SKU name) run on 20 to 30 percent. Generic anchors (“shop the coffee”) fill the remaining 10 to 20 percent. This ratio holds ranking without triggering the over-optimization penalty that shows up on brands that anchor-text-stuff every internal link with the same exact-match keyword. Cross-reference the linking layer on our food and beverage web design page.
Link equity from ingredient guides to SKU pages
Link equity from ingredient guides passes to SKU pages when the guide’s comparison table names the hero SKU in the winning column with a product card, and when the guide’s body links to 3 to 6 recipes that use the winning ingredient. This 3-hop path (guide to recipe to SKU) pushes authority from a high-traffic informational query down to a high-intent transactional page. According to Search Engine Land SEO coverage, informational content that internally links to transactional pages produces 2 to 4 times higher organic revenue than isolated content silos.
Wrapping up content marketing for food brands
Content marketing for food brands is the organic engine that turns a DTC snack, drink, or CPG storefront into a search-driven revenue channel. Recipe hub of 40 to 100 recipes. Ingredient comparison guides at 12 to 24 pieces. Sourcing story pages at 6 to 12 pieces. Buyer intent content at 8 to 16 pieces. Creator syndication calendar with 12 to 30 creators per quarter. Refresh cadence at 12 to 24 months by pillar. Reporting with organic sessions and organic revenue attribution.
If your DTC food brand is running paid social at 20,000 dollars monthly with a broken blog and zero recipe schema, professional content marketing for food brands pays for itself inside the first 90 days on organic traffic captured. Redefine Web ships content marketing inside our monthly retainer packages. Book a call and we will walk through the last three DTC food brands we built recipe hubs for, pillar by pillar.
Content marketing for food brands starts with a recipe hub because recipe queries account for 40 to 60 percent of high-intent search volume in the food category. Every hero SKU needs 4 to 12 recipes anchored to it, each targeting a specific occasion and audience.
Skip the recipe hub and the brand loses the search real estate that pulls DTC storefront traffic month over month at zero incremental paid cost. Recipe traffic converts at 2 to 4 percent because the shopper landed with usage intent, not passive discovery, which is why food brands win on recipes.
Recipe schema and Google rich result eligibility
Every recipe page ships schema.org Recipe markup including cookTime, prepTime, recipeIngredient, recipeInstructions, nutrition, and aggregateRating. Correctly marked-up recipes qualify for Google’s recipe rich result carousel that pulls 3 to 6 times higher click-through rate than a plain blue link. The schema layer takes 15 minutes per recipe to author and 30 minutes to validate in Google Search Console. Cross-reference the recipe search stack on our food and beverage SEO page.
Recipe hub structure that scales
The recipe hub structure runs 40 to 100 recipes at maturity, organized by hero SKU (4 to 12 recipes per SKU) plus occasion tags (breakfast, weeknight dinner, meal prep, brunch, holiday). Every recipe links back to the hero SKU product page with the SKU embedded in an inline card. The hub earns internal linking value from ingredient comparison guides and the sourcing story pages, which feeds recipe ranking on Google. According to Google Search Central recipe structured data guidance, complete Recipe schema markup is required for eligibility in the recipe carousel and the ingredient search filter.
Pillar structure for food brand content marketing
The pillar structure on content marketing for food brands runs 4 content pillars concurrently: recipe hub (40 to 100 recipes), ingredient comparison guides (12 to 24 guides), sourcing story pages (6 to 12 pages), and buyer intent content (where to buy, subscription vs. one-time, gift bundle guides). Every pillar covers a distinct search intent and every pillar links back to the hero SKU product pages.
Ingredient comparison guide format
Ingredient comparison guides run 1,800 to 3,200 words comparing 2 to 4 ingredient types on 6 to 10 attributes with a comparison table, real-world use case examples, and links to the hero SKU that uses the specific ingredient. Example: organic vs. conventional oats compares nutritional profile, sourcing chain, cost, environmental impact, and taste on a 6-column table. The brand’s SKU appears in the winning column with a product card. These guides rank 3 to 8 months after publication and pull steady-state organic traffic.
Sourcing story pages that build trust
Sourcing story pages name the specific farms, cooperatives, or suppliers the brand sources from, with photos of the farms, farmer quotes, and specific harvest windows. A coffee brand’s Ethiopian farm page ranks for “single-origin Ethiopian coffee” and “Yirgacheffe coffee origin” plus 40 long-tail variations. The sourcing page pulls trust-building traffic that converts at 4 to 6 percent because the shopper landed pattern-matching on transparency and named provenance. Every sourcing page includes farmer or cooperative quotes, harvest dates, and a link back to 3 to 5 hero SKU pages that source from the named supplier.
Vejrø hospitality content case study
Vejrø Resort, a Danish private-island destination with an on-site restaurant focused on organic, locally sourced cuisine, joined us with strong social engagement and no organic-search real estate. Guests found the resort on Instagram but never in Google search for terms like “private island resort Denmark,” “farm-to-table hospitality Denmark,” or “Vejrø restaurant.” The same organic-search gap shows up on DTC food brands running paid social at 20,000 dollars monthly with a broken blog and zero recipe schema.
We built the conversion-focused website with on-site and off-site SEO tuned to the travel-niche keyword clusters, competitor analysis against comparable boutique resorts, and mobile-first design prioritizing guest discovery. Every page carried the structured data qualifying it for Google’s rich results in the hospitality category. Every internal link pushed authority toward the direct-booking conversion path.
Three months later, Vejrø hit 10,000 plus organic visitors, ranked for 200 plus first-page keywords, and pulled a 2.2 percent booking conversion rate from organic traffic. The same pattern applies to content marketing for food brands: recipe schema, ingredient comparison guides, and sourcing story pages pull organic traffic at 20 to 40 percent conversion into hero SKU pages inside 6 months when the content quality matches search intent and every page carries the right structured data markup. Vejrø also proved out the reporting discipline: every monthly report named the exact page, the exact keyword cluster, and the exact search feature (rich result, sitelinks, image pack) driving the incremental organic revenue instead of hiding behind aggregate traffic charts.
Recipe cadence and content calendar for food brands
Recipe cadence on a working food brand content calendar ships 2 to 4 new recipes per week during the first 6 months and drops to 1 per week at maturity. Each recipe takes 4 to 6 hours to produce (write, test in the kitchen, photograph, schema author, publish). At 3 recipes per week, the brand hits 78 recipes inside 6 months plus a backlog of ingredient comparison and sourcing content queued behind the recipe production line.
| Content pillar | Target volume year 1 | Production cost per piece | Refresh cadence |
|---|---|---|---|
| Recipe hub | 40 to 100 recipes | $180 to $320 | Every 12 months |
| Ingredient comparison guides | 12 to 24 guides | $450 to $780 | Every 18 months |
| Sourcing story pages | 6 to 12 pages | $680 to $1,200 | Every 24 months |
| Buyer intent content | 8 to 16 pieces | $220 to $420 | Every 12 months |
Photography as a content calendar constraint
Photography is the actual constraint on recipe cadence, not writing. Every recipe needs 6 to 12 photos: hero shot, ingredient flat lay, prep in progress, plated result, storage, and step shots for the schema markup. A working food brand batches photography 8 recipes at a time to keep the cost per recipe under 200 dollars. Skip the batching and the per-recipe cost climbs to 400 to 600 dollars, which caps recipe cadence at 1 per week and slows organic ranking timeline by 6 months.
Seasonal content calendar planning
Seasonal content calendar planning maps recipes and comparison guides to the seasonal windows they need to rank in. A Christmas cookie recipe needs to publish in September to rank by early December. A Valentine’s chocolate guide needs to publish in November to rank by early February. A back-to-school lunchbox recipe needs to publish in June to rank by late August. The 60-to-90-day ranking curve dictates the calendar.
Creator syndication inside food brand content
Creator syndication on food brand content marketing amplifies the recipe hub through Instagram Reels, TikTok, and YouTube Shorts creators paid to post their own version of the brand’s hero recipes. The creator content pulls net-new audiences into the recipe hub through the creator’s Link in Bio or Amazon Storefront tag. The syndication calendar names 12 to 30 creators per quarter with specific recipes assigned to each.
One brand we picked up had a spreadsheet titled “creator outreach 2023” with 47 rows and 3 responses. All 3 responses were auto-replies. The spreadsheet named zero recipes and offered flat rates below 100 dollars per post. Nobody posts a 30-second video for 87 dollars flat. Nobody.
Creator content commercial terms that work
Working creator content commercial terms run 350 to 1,500 dollars flat per post plus a 12 to 25 percent commission on tagged sales across a 30-day window. The commission mechanic pulls creators into follow-up posts because the incremental revenue continues past the initial fee. Mid-tier creators (30k to 150k followers) hit the sweet spot for food brand content because their engagement rate typically runs 4 to 8 percent versus 0.8 to 1.6 percent on mega-creators.
Content brief structure for creator partnerships
The content brief structure for creator partnerships runs a single page: the SKU, the specific recipe or usage occasion, 3 required brand mentions, 3 restricted claims (no health claims on non-medical SKUs), the pricing angle, the affiliate link, and 3 example videos that hit the tone. The brief avoids over-scripting because over-scripted creator content underperforms native creator voice by 40 to 60 percent on engagement rate.
Buyer intent content for food brand blogs
Buyer intent content on food brand blogs covers 8 to 16 pieces targeting explicit purchase-decision queries: “where to buy [brand],” “[brand] subscription vs. one-time,” “best [category] for [use case],” and “[brand] gift bundle.” Every buyer intent piece runs 1,400 to 2,400 words with a comparison table, product cards, and a clear conversion path to the specific SKU that matches the query intent. Buyer intent content converts at 3 to 6 percent versus 1 to 2 percent on recipe content because the shopper landed already planning to buy, not exploring a usage occasion.
Where-to-buy content structure
Where-to-buy content structure covers online (DTC storefront, Amazon, Target.com, Whole Foods online), retail (specific chain locators with the store finder embedded), and international (customs limitations, retailer partners abroad). Every piece names specific retailers, links to the store locator, and includes an FAQ block covering shipping availability, subscription options, and gift card compatibility. Where-to-buy content ranks for branded discovery queries the DTC storefront otherwise loses to competitor affiliate reviews.
Subscription versus one-time comparison content
Subscription versus one-time comparison content converts subscription commitments at 3 to 6 percent because it addresses the price-sensitivity concern head-on with a specific math table. The piece covers the discount structure (15 percent lifetime), the skip-a-month mechanic, the pause-anytime rule, the cancellation policy, and the specific yearly savings for the brand’s average consumption cadence. Cross-reference the retention structure on our food and beverage marketing retainer page.
Content refresh cadence on food brand pillars
Content refresh cadence on food brand content pillars runs a rolling audit every 12 to 24 months by pillar. Recipes get refreshed every 12 months with new photography, updated schema, and any nutrition or ingredient adjustments. Ingredient comparison guides refresh every 18 months to update market data. Sourcing story pages refresh every 24 months to reflect farm partnership changes and new harvest angles. Buyer intent content refreshes every 12 months to update retailer availability and pricing.
Recipe refresh priority order
Recipe refresh priority runs by organic traffic rank. The top 20 recipes by monthly organic sessions get refreshed first (new photography, schema audit, related recipe internal links, updated nutrition). The next 40 get refreshed at 15 months. The remaining recipes get refreshed opportunistically when the ranking slips past position 15 in Google. Skipping the refresh cadence lets recipe rankings drift out of the top 3 inside 18 months as newer competitor recipes take the position.
Schema audit checklist per refresh
The schema audit checklist per refresh runs 8 items: Recipe schema completeness, aggregateRating count and accuracy, nutrition data accuracy, prepTime and cookTime match the recipe body, image URLs valid at CDN, related recipe internal links working, product card SKU URL live, and Google Search Console rich result eligibility validated. This checklist takes 20 minutes per recipe and prevents the schema drift that costs recipe rankings 20 to 40 positions quietly.
Reporting cadence for food brand content marketing
Reporting cadence on food brand content marketing runs a monthly executive report plus a quarterly business review. The monthly report ships in the first business week and covers organic sessions by pillar, top 10 ranking recipes with position trend, ingredient guide ranking movements, sourcing page performance, and organic-attributed DTC revenue. Every number carries a comparison to the prior month and a plain-language interpretation the founder reads in 7 minutes.
Metrics that matter for content marketing
Metrics that matter for food brand content marketing: organic sessions by pillar, recipe rich result impressions in Search Console, organic conversion rate to hero SKU pages, organic-attributed DTC revenue, and top 20 ranking positions by monthly organic sessions. Vanity metrics that do not matter: total pageviews without conversion context, average time on page without conversion attribution, and social share counts. The monthly report skips the vanity block entirely.
Quarterly business review structure
The quarterly business review runs 90 minutes with the founder, head of content, and SEO lead. Agenda: organic traffic trend by pillar, top 10 winning content pieces, top 10 losing content pieces (candidates for refresh or removal), competitive gap analysis against 5 named competitor brands, and next quarter’s content calendar with recipes and ingredient guides queued. According to Ahrefs content marketing research, brands running quarterly content audits outperform brands running annual audits by 40 to 70 percent on organic revenue over a 24-month window.
Internal linking discipline across food brand content
Internal linking discipline across food brand content moves authority from recipe pages toward hero SKU product pages and comparison guides. Every recipe links to the hero SKU it uses inline (once in the ingredient list, once in a bottom call-out card). Every ingredient comparison guide links to 3 to 6 recipes using the winning ingredient plus the hero SKU product page. Every sourcing story links to the 2 to 4 SKUs sourced from that specific farm or cooperative.
Anchor text strategy across recipe hubs
Anchor text on internal links varies across recipe hubs to avoid over-optimization patterns Google penalizes. Exact-match anchor (“single-origin Ethiopian coffee”) runs on 20 to 30 percent of internal links. Partial-match variations (“our Ethiopian roast”) run on 30 to 40 percent. Branded anchors (the SKU name) run on 20 to 30 percent. Generic anchors (“shop the coffee”) fill the remaining 10 to 20 percent. This ratio holds ranking without triggering the over-optimization penalty that shows up on brands that anchor-text-stuff every internal link with the same exact-match keyword. Cross-reference the linking layer on our food and beverage web design page.
Link equity from ingredient guides to SKU pages
Link equity from ingredient guides passes to SKU pages when the guide’s comparison table names the hero SKU in the winning column with a product card, and when the guide’s body links to 3 to 6 recipes that use the winning ingredient. This 3-hop path (guide to recipe to SKU) pushes authority from a high-traffic informational query down to a high-intent transactional page. According to Search Engine Land SEO coverage, informational content that internally links to transactional pages produces 2 to 4 times higher organic revenue than isolated content silos.
Wrapping up content marketing for food brands
Content marketing for food brands is the organic engine that turns a DTC snack, drink, or CPG storefront into a search-driven revenue channel. Recipe hub of 40 to 100 recipes. Ingredient comparison guides at 12 to 24 pieces. Sourcing story pages at 6 to 12 pieces. Buyer intent content at 8 to 16 pieces. Creator syndication calendar with 12 to 30 creators per quarter. Refresh cadence at 12 to 24 months by pillar. Reporting with organic sessions and organic revenue attribution.
If your DTC food brand is running paid social at 20,000 dollars monthly with a broken blog and zero recipe schema, professional content marketing for food brands pays for itself inside the first 90 days on organic traffic captured. Redefine Web ships content marketing inside our monthly retainer packages. Book a call and we will walk through the last three DTC food brands we built recipe hubs for, pillar by pillar.
Internal linking discipline across food brand content moves authority from recipe pages toward hero SKU product pages and comparison guides. Every recipe links to the hero SKU it uses inline (once in the ingredient list, once in a bottom call-out card). Every ingredient comparison guide links to 3 to 6 recipes using the winning ingredient plus the hero SKU product page. Every sourcing story links to the 2 to 4 SKUs sourced from that specific farm or cooperative.
Anchor text strategy across recipe hubs
Anchor text on internal links varies across recipe hubs to avoid over-optimization patterns Google penalizes. Exact-match anchor (“single-origin Ethiopian coffee”) runs on 20 to 30 percent of internal links. Partial-match variations (“our Ethiopian roast”) run on 30 to 40 percent. Branded anchors (the SKU name) run on 20 to 30 percent. Generic anchors (“shop the coffee”) fill the remaining 10 to 20 percent. This ratio holds ranking without triggering the over-optimization penalty that shows up on brands that anchor-text-stuff every internal link with the same exact-match keyword. Cross-reference the linking layer on our food and beverage web design page.
Link equity from ingredient guides to SKU pages
Link equity from ingredient guides passes to SKU pages when the guide’s comparison table names the hero SKU in the winning column with a product card, and when the guide’s body links to 3 to 6 recipes that use the winning ingredient. This 3-hop path (guide to recipe to SKU) pushes authority from a high-traffic informational query down to a high-intent transactional page. According to Search Engine Land SEO coverage, informational content that internally links to transactional pages produces 2 to 4 times higher organic revenue than isolated content silos.
Wrapping up content marketing for food brands
Content marketing for food brands is the organic engine that turns a DTC snack, drink, or CPG storefront into a search-driven revenue channel. Recipe hub of 40 to 100 recipes. Ingredient comparison guides at 12 to 24 pieces. Sourcing story pages at 6 to 12 pieces. Buyer intent content at 8 to 16 pieces. Creator syndication calendar with 12 to 30 creators per quarter. Refresh cadence at 12 to 24 months by pillar. Reporting with organic sessions and organic revenue attribution.
If your DTC food brand is running paid social at 20,000 dollars monthly with a broken blog and zero recipe schema, professional content marketing for food brands pays for itself inside the first 90 days on organic traffic captured. Redefine Web ships content marketing inside our monthly retainer packages. Book a call and we will walk through the last three DTC food brands we built recipe hubs for, pillar by pillar.
Content marketing for food brands starts with a recipe hub because recipe queries account for 40 to 60 percent of high-intent search volume in the food category. Every hero SKU needs 4 to 12 recipes anchored to it, each targeting a specific occasion and audience.
Skip the recipe hub and the brand loses the search real estate that pulls DTC storefront traffic month over month at zero incremental paid cost. Recipe traffic converts at 2 to 4 percent because the shopper landed with usage intent, not passive discovery, which is why food brands win on recipes.
Recipe schema and Google rich result eligibility
Every recipe page ships schema.org Recipe markup including cookTime, prepTime, recipeIngredient, recipeInstructions, nutrition, and aggregateRating. Correctly marked-up recipes qualify for Google’s recipe rich result carousel that pulls 3 to 6 times higher click-through rate than a plain blue link. The schema layer takes 15 minutes per recipe to author and 30 minutes to validate in Google Search Console. Cross-reference the recipe search stack on our food and beverage SEO page.
Recipe hub structure that scales
The recipe hub structure runs 40 to 100 recipes at maturity, organized by hero SKU (4 to 12 recipes per SKU) plus occasion tags (breakfast, weeknight dinner, meal prep, brunch, holiday). Every recipe links back to the hero SKU product page with the SKU embedded in an inline card. The hub earns internal linking value from ingredient comparison guides and the sourcing story pages, which feeds recipe ranking on Google. According to Google Search Central recipe structured data guidance, complete Recipe schema markup is required for eligibility in the recipe carousel and the ingredient search filter.
Pillar structure for food brand content marketing
The pillar structure on content marketing for food brands runs 4 content pillars concurrently: recipe hub (40 to 100 recipes), ingredient comparison guides (12 to 24 guides), sourcing story pages (6 to 12 pages), and buyer intent content (where to buy, subscription vs. one-time, gift bundle guides). Every pillar covers a distinct search intent and every pillar links back to the hero SKU product pages.
Ingredient comparison guide format
Ingredient comparison guides run 1,800 to 3,200 words comparing 2 to 4 ingredient types on 6 to 10 attributes with a comparison table, real-world use case examples, and links to the hero SKU that uses the specific ingredient. Example: organic vs. conventional oats compares nutritional profile, sourcing chain, cost, environmental impact, and taste on a 6-column table. The brand’s SKU appears in the winning column with a product card. These guides rank 3 to 8 months after publication and pull steady-state organic traffic.
Sourcing story pages that build trust
Sourcing story pages name the specific farms, cooperatives, or suppliers the brand sources from, with photos of the farms, farmer quotes, and specific harvest windows. A coffee brand’s Ethiopian farm page ranks for “single-origin Ethiopian coffee” and “Yirgacheffe coffee origin” plus 40 long-tail variations. The sourcing page pulls trust-building traffic that converts at 4 to 6 percent because the shopper landed pattern-matching on transparency and named provenance. Every sourcing page includes farmer or cooperative quotes, harvest dates, and a link back to 3 to 5 hero SKU pages that source from the named supplier.
Vejrø hospitality content case study
Vejrø Resort, a Danish private-island destination with an on-site restaurant focused on organic, locally sourced cuisine, joined us with strong social engagement and no organic-search real estate. Guests found the resort on Instagram but never in Google search for terms like “private island resort Denmark,” “farm-to-table hospitality Denmark,” or “Vejrø restaurant.” The same organic-search gap shows up on DTC food brands running paid social at 20,000 dollars monthly with a broken blog and zero recipe schema.
We built the conversion-focused website with on-site and off-site SEO tuned to the travel-niche keyword clusters, competitor analysis against comparable boutique resorts, and mobile-first design prioritizing guest discovery. Every page carried the structured data qualifying it for Google’s rich results in the hospitality category. Every internal link pushed authority toward the direct-booking conversion path.
Three months later, Vejrø hit 10,000 plus organic visitors, ranked for 200 plus first-page keywords, and pulled a 2.2 percent booking conversion rate from organic traffic. The same pattern applies to content marketing for food brands: recipe schema, ingredient comparison guides, and sourcing story pages pull organic traffic at 20 to 40 percent conversion into hero SKU pages inside 6 months when the content quality matches search intent and every page carries the right structured data markup. Vejrø also proved out the reporting discipline: every monthly report named the exact page, the exact keyword cluster, and the exact search feature (rich result, sitelinks, image pack) driving the incremental organic revenue instead of hiding behind aggregate traffic charts.
Recipe cadence and content calendar for food brands
Recipe cadence on a working food brand content calendar ships 2 to 4 new recipes per week during the first 6 months and drops to 1 per week at maturity. Each recipe takes 4 to 6 hours to produce (write, test in the kitchen, photograph, schema author, publish). At 3 recipes per week, the brand hits 78 recipes inside 6 months plus a backlog of ingredient comparison and sourcing content queued behind the recipe production line.
| Content pillar | Target volume year 1 | Production cost per piece | Refresh cadence |
|---|---|---|---|
| Recipe hub | 40 to 100 recipes | $180 to $320 | Every 12 months |
| Ingredient comparison guides | 12 to 24 guides | $450 to $780 | Every 18 months |
| Sourcing story pages | 6 to 12 pages | $680 to $1,200 | Every 24 months |
| Buyer intent content | 8 to 16 pieces | $220 to $420 | Every 12 months |
Photography as a content calendar constraint
Photography is the actual constraint on recipe cadence, not writing. Every recipe needs 6 to 12 photos: hero shot, ingredient flat lay, prep in progress, plated result, storage, and step shots for the schema markup. A working food brand batches photography 8 recipes at a time to keep the cost per recipe under 200 dollars. Skip the batching and the per-recipe cost climbs to 400 to 600 dollars, which caps recipe cadence at 1 per week and slows organic ranking timeline by 6 months.
Seasonal content calendar planning
Seasonal content calendar planning maps recipes and comparison guides to the seasonal windows they need to rank in. A Christmas cookie recipe needs to publish in September to rank by early December. A Valentine’s chocolate guide needs to publish in November to rank by early February. A back-to-school lunchbox recipe needs to publish in June to rank by late August. The 60-to-90-day ranking curve dictates the calendar.
Creator syndication inside food brand content
Creator syndication on food brand content marketing amplifies the recipe hub through Instagram Reels, TikTok, and YouTube Shorts creators paid to post their own version of the brand’s hero recipes. The creator content pulls net-new audiences into the recipe hub through the creator’s Link in Bio or Amazon Storefront tag. The syndication calendar names 12 to 30 creators per quarter with specific recipes assigned to each.
One brand we picked up had a spreadsheet titled “creator outreach 2023” with 47 rows and 3 responses. All 3 responses were auto-replies. The spreadsheet named zero recipes and offered flat rates below 100 dollars per post. Nobody posts a 30-second video for 87 dollars flat. Nobody.
Creator content commercial terms that work
Working creator content commercial terms run 350 to 1,500 dollars flat per post plus a 12 to 25 percent commission on tagged sales across a 30-day window. The commission mechanic pulls creators into follow-up posts because the incremental revenue continues past the initial fee. Mid-tier creators (30k to 150k followers) hit the sweet spot for food brand content because their engagement rate typically runs 4 to 8 percent versus 0.8 to 1.6 percent on mega-creators.
Content brief structure for creator partnerships
The content brief structure for creator partnerships runs a single page: the SKU, the specific recipe or usage occasion, 3 required brand mentions, 3 restricted claims (no health claims on non-medical SKUs), the pricing angle, the affiliate link, and 3 example videos that hit the tone. The brief avoids over-scripting because over-scripted creator content underperforms native creator voice by 40 to 60 percent on engagement rate.
Buyer intent content for food brand blogs
Buyer intent content on food brand blogs covers 8 to 16 pieces targeting explicit purchase-decision queries: “where to buy [brand],” “[brand] subscription vs. one-time,” “best [category] for [use case],” and “[brand] gift bundle.” Every buyer intent piece runs 1,400 to 2,400 words with a comparison table, product cards, and a clear conversion path to the specific SKU that matches the query intent. Buyer intent content converts at 3 to 6 percent versus 1 to 2 percent on recipe content because the shopper landed already planning to buy, not exploring a usage occasion.
Where-to-buy content structure
Where-to-buy content structure covers online (DTC storefront, Amazon, Target.com, Whole Foods online), retail (specific chain locators with the store finder embedded), and international (customs limitations, retailer partners abroad). Every piece names specific retailers, links to the store locator, and includes an FAQ block covering shipping availability, subscription options, and gift card compatibility. Where-to-buy content ranks for branded discovery queries the DTC storefront otherwise loses to competitor affiliate reviews.
Subscription versus one-time comparison content
Subscription versus one-time comparison content converts subscription commitments at 3 to 6 percent because it addresses the price-sensitivity concern head-on with a specific math table. The piece covers the discount structure (15 percent lifetime), the skip-a-month mechanic, the pause-anytime rule, the cancellation policy, and the specific yearly savings for the brand’s average consumption cadence. Cross-reference the retention structure on our food and beverage marketing retainer page.
Content refresh cadence on food brand pillars
Content refresh cadence on food brand content pillars runs a rolling audit every 12 to 24 months by pillar. Recipes get refreshed every 12 months with new photography, updated schema, and any nutrition or ingredient adjustments. Ingredient comparison guides refresh every 18 months to update market data. Sourcing story pages refresh every 24 months to reflect farm partnership changes and new harvest angles. Buyer intent content refreshes every 12 months to update retailer availability and pricing.
Recipe refresh priority order
Recipe refresh priority runs by organic traffic rank. The top 20 recipes by monthly organic sessions get refreshed first (new photography, schema audit, related recipe internal links, updated nutrition). The next 40 get refreshed at 15 months. The remaining recipes get refreshed opportunistically when the ranking slips past position 15 in Google. Skipping the refresh cadence lets recipe rankings drift out of the top 3 inside 18 months as newer competitor recipes take the position.
Schema audit checklist per refresh
The schema audit checklist per refresh runs 8 items: Recipe schema completeness, aggregateRating count and accuracy, nutrition data accuracy, prepTime and cookTime match the recipe body, image URLs valid at CDN, related recipe internal links working, product card SKU URL live, and Google Search Console rich result eligibility validated. This checklist takes 20 minutes per recipe and prevents the schema drift that costs recipe rankings 20 to 40 positions quietly.
Reporting cadence for food brand content marketing
Reporting cadence on food brand content marketing runs a monthly executive report plus a quarterly business review. The monthly report ships in the first business week and covers organic sessions by pillar, top 10 ranking recipes with position trend, ingredient guide ranking movements, sourcing page performance, and organic-attributed DTC revenue. Every number carries a comparison to the prior month and a plain-language interpretation the founder reads in 7 minutes.
Metrics that matter for content marketing
Metrics that matter for food brand content marketing: organic sessions by pillar, recipe rich result impressions in Search Console, organic conversion rate to hero SKU pages, organic-attributed DTC revenue, and top 20 ranking positions by monthly organic sessions. Vanity metrics that do not matter: total pageviews without conversion context, average time on page without conversion attribution, and social share counts. The monthly report skips the vanity block entirely.
Quarterly business review structure
The quarterly business review runs 90 minutes with the founder, head of content, and SEO lead. Agenda: organic traffic trend by pillar, top 10 winning content pieces, top 10 losing content pieces (candidates for refresh or removal), competitive gap analysis against 5 named competitor brands, and next quarter’s content calendar with recipes and ingredient guides queued. According to Ahrefs content marketing research, brands running quarterly content audits outperform brands running annual audits by 40 to 70 percent on organic revenue over a 24-month window.
Internal linking discipline across food brand content
Internal linking discipline across food brand content moves authority from recipe pages toward hero SKU product pages and comparison guides. Every recipe links to the hero SKU it uses inline (once in the ingredient list, once in a bottom call-out card). Every ingredient comparison guide links to 3 to 6 recipes using the winning ingredient plus the hero SKU product page. Every sourcing story links to the 2 to 4 SKUs sourced from that specific farm or cooperative.
Anchor text strategy across recipe hubs
Anchor text on internal links varies across recipe hubs to avoid over-optimization patterns Google penalizes. Exact-match anchor (“single-origin Ethiopian coffee”) runs on 20 to 30 percent of internal links. Partial-match variations (“our Ethiopian roast”) run on 30 to 40 percent. Branded anchors (the SKU name) run on 20 to 30 percent. Generic anchors (“shop the coffee”) fill the remaining 10 to 20 percent. This ratio holds ranking without triggering the over-optimization penalty that shows up on brands that anchor-text-stuff every internal link with the same exact-match keyword. Cross-reference the linking layer on our food and beverage web design page.
Link equity from ingredient guides to SKU pages
Link equity from ingredient guides passes to SKU pages when the guide’s comparison table names the hero SKU in the winning column with a product card, and when the guide’s body links to 3 to 6 recipes that use the winning ingredient. This 3-hop path (guide to recipe to SKU) pushes authority from a high-traffic informational query down to a high-intent transactional page. According to Search Engine Land SEO coverage, informational content that internally links to transactional pages produces 2 to 4 times higher organic revenue than isolated content silos.
Wrapping up content marketing for food brands
Content marketing for food brands is the organic engine that turns a DTC snack, drink, or CPG storefront into a search-driven revenue channel. Recipe hub of 40 to 100 recipes. Ingredient comparison guides at 12 to 24 pieces. Sourcing story pages at 6 to 12 pieces. Buyer intent content at 8 to 16 pieces. Creator syndication calendar with 12 to 30 creators per quarter. Refresh cadence at 12 to 24 months by pillar. Reporting with organic sessions and organic revenue attribution.
If your DTC food brand is running paid social at 20,000 dollars monthly with a broken blog and zero recipe schema, professional content marketing for food brands pays for itself inside the first 90 days on organic traffic captured. Redefine Web ships content marketing inside our monthly retainer packages. Book a call and we will walk through the last three DTC food brands we built recipe hubs for, pillar by pillar.
Content marketing for food brands starts with a recipe hub because recipe queries account for 40 to 60 percent of high-intent search volume in the food category. Every hero SKU needs 4 to 12 recipes anchored to it, each targeting a specific occasion and audience.
Skip the recipe hub and the brand loses the search real estate that pulls DTC storefront traffic month over month at zero incremental paid cost. Recipe traffic converts at 2 to 4 percent because the shopper landed with usage intent, not passive discovery, which is why food brands win on recipes.
Recipe schema and Google rich result eligibility
Every recipe page ships schema.org Recipe markup including cookTime, prepTime, recipeIngredient, recipeInstructions, nutrition, and aggregateRating. Correctly marked-up recipes qualify for Google’s recipe rich result carousel that pulls 3 to 6 times higher click-through rate than a plain blue link. The schema layer takes 15 minutes per recipe to author and 30 minutes to validate in Google Search Console. Cross-reference the recipe search stack on our food and beverage SEO page.
Recipe hub structure that scales
The recipe hub structure runs 40 to 100 recipes at maturity, organized by hero SKU (4 to 12 recipes per SKU) plus occasion tags (breakfast, weeknight dinner, meal prep, brunch, holiday). Every recipe links back to the hero SKU product page with the SKU embedded in an inline card. The hub earns internal linking value from ingredient comparison guides and the sourcing story pages, which feeds recipe ranking on Google. According to Google Search Central recipe structured data guidance, complete Recipe schema markup is required for eligibility in the recipe carousel and the ingredient search filter.
Pillar structure for food brand content marketing
The pillar structure on content marketing for food brands runs 4 content pillars concurrently: recipe hub (40 to 100 recipes), ingredient comparison guides (12 to 24 guides), sourcing story pages (6 to 12 pages), and buyer intent content (where to buy, subscription vs. one-time, gift bundle guides). Every pillar covers a distinct search intent and every pillar links back to the hero SKU product pages.
Ingredient comparison guide format
Ingredient comparison guides run 1,800 to 3,200 words comparing 2 to 4 ingredient types on 6 to 10 attributes with a comparison table, real-world use case examples, and links to the hero SKU that uses the specific ingredient. Example: organic vs. conventional oats compares nutritional profile, sourcing chain, cost, environmental impact, and taste on a 6-column table. The brand’s SKU appears in the winning column with a product card. These guides rank 3 to 8 months after publication and pull steady-state organic traffic.
Sourcing story pages that build trust
Sourcing story pages name the specific farms, cooperatives, or suppliers the brand sources from, with photos of the farms, farmer quotes, and specific harvest windows. A coffee brand’s Ethiopian farm page ranks for “single-origin Ethiopian coffee” and “Yirgacheffe coffee origin” plus 40 long-tail variations. The sourcing page pulls trust-building traffic that converts at 4 to 6 percent because the shopper landed pattern-matching on transparency and named provenance. Every sourcing page includes farmer or cooperative quotes, harvest dates, and a link back to 3 to 5 hero SKU pages that source from the named supplier.
Vejrø hospitality content case study
Vejrø Resort, a Danish private-island destination with an on-site restaurant focused on organic, locally sourced cuisine, joined us with strong social engagement and no organic-search real estate. Guests found the resort on Instagram but never in Google search for terms like “private island resort Denmark,” “farm-to-table hospitality Denmark,” or “Vejrø restaurant.” The same organic-search gap shows up on DTC food brands running paid social at 20,000 dollars monthly with a broken blog and zero recipe schema.
We built the conversion-focused website with on-site and off-site SEO tuned to the travel-niche keyword clusters, competitor analysis against comparable boutique resorts, and mobile-first design prioritizing guest discovery. Every page carried the structured data qualifying it for Google’s rich results in the hospitality category. Every internal link pushed authority toward the direct-booking conversion path.
Three months later, Vejrø hit 10,000 plus organic visitors, ranked for 200 plus first-page keywords, and pulled a 2.2 percent booking conversion rate from organic traffic. The same pattern applies to content marketing for food brands: recipe schema, ingredient comparison guides, and sourcing story pages pull organic traffic at 20 to 40 percent conversion into hero SKU pages inside 6 months when the content quality matches search intent and every page carries the right structured data markup. Vejrø also proved out the reporting discipline: every monthly report named the exact page, the exact keyword cluster, and the exact search feature (rich result, sitelinks, image pack) driving the incremental organic revenue instead of hiding behind aggregate traffic charts.
Recipe cadence and content calendar for food brands
Recipe cadence on a working food brand content calendar ships 2 to 4 new recipes per week during the first 6 months and drops to 1 per week at maturity. Each recipe takes 4 to 6 hours to produce (write, test in the kitchen, photograph, schema author, publish). At 3 recipes per week, the brand hits 78 recipes inside 6 months plus a backlog of ingredient comparison and sourcing content queued behind the recipe production line.
| Content pillar | Target volume year 1 | Production cost per piece | Refresh cadence |
|---|---|---|---|
| Recipe hub | 40 to 100 recipes | $180 to $320 | Every 12 months |
| Ingredient comparison guides | 12 to 24 guides | $450 to $780 | Every 18 months |
| Sourcing story pages | 6 to 12 pages | $680 to $1,200 | Every 24 months |
| Buyer intent content | 8 to 16 pieces | $220 to $420 | Every 12 months |
Photography as a content calendar constraint
Photography is the actual constraint on recipe cadence, not writing. Every recipe needs 6 to 12 photos: hero shot, ingredient flat lay, prep in progress, plated result, storage, and step shots for the schema markup. A working food brand batches photography 8 recipes at a time to keep the cost per recipe under 200 dollars. Skip the batching and the per-recipe cost climbs to 400 to 600 dollars, which caps recipe cadence at 1 per week and slows organic ranking timeline by 6 months.
Seasonal content calendar planning
Seasonal content calendar planning maps recipes and comparison guides to the seasonal windows they need to rank in. A Christmas cookie recipe needs to publish in September to rank by early December. A Valentine’s chocolate guide needs to publish in November to rank by early February. A back-to-school lunchbox recipe needs to publish in June to rank by late August. The 60-to-90-day ranking curve dictates the calendar.
Creator syndication inside food brand content
Creator syndication on food brand content marketing amplifies the recipe hub through Instagram Reels, TikTok, and YouTube Shorts creators paid to post their own version of the brand’s hero recipes. The creator content pulls net-new audiences into the recipe hub through the creator’s Link in Bio or Amazon Storefront tag. The syndication calendar names 12 to 30 creators per quarter with specific recipes assigned to each.
One brand we picked up had a spreadsheet titled “creator outreach 2023” with 47 rows and 3 responses. All 3 responses were auto-replies. The spreadsheet named zero recipes and offered flat rates below 100 dollars per post. Nobody posts a 30-second video for 87 dollars flat. Nobody.
Creator content commercial terms that work
Working creator content commercial terms run 350 to 1,500 dollars flat per post plus a 12 to 25 percent commission on tagged sales across a 30-day window. The commission mechanic pulls creators into follow-up posts because the incremental revenue continues past the initial fee. Mid-tier creators (30k to 150k followers) hit the sweet spot for food brand content because their engagement rate typically runs 4 to 8 percent versus 0.8 to 1.6 percent on mega-creators.
Content brief structure for creator partnerships
The content brief structure for creator partnerships runs a single page: the SKU, the specific recipe or usage occasion, 3 required brand mentions, 3 restricted claims (no health claims on non-medical SKUs), the pricing angle, the affiliate link, and 3 example videos that hit the tone. The brief avoids over-scripting because over-scripted creator content underperforms native creator voice by 40 to 60 percent on engagement rate.
Buyer intent content for food brand blogs
Buyer intent content on food brand blogs covers 8 to 16 pieces targeting explicit purchase-decision queries: “where to buy [brand],” “[brand] subscription vs. one-time,” “best [category] for [use case],” and “[brand] gift bundle.” Every buyer intent piece runs 1,400 to 2,400 words with a comparison table, product cards, and a clear conversion path to the specific SKU that matches the query intent. Buyer intent content converts at 3 to 6 percent versus 1 to 2 percent on recipe content because the shopper landed already planning to buy, not exploring a usage occasion.
Where-to-buy content structure
Where-to-buy content structure covers online (DTC storefront, Amazon, Target.com, Whole Foods online), retail (specific chain locators with the store finder embedded), and international (customs limitations, retailer partners abroad). Every piece names specific retailers, links to the store locator, and includes an FAQ block covering shipping availability, subscription options, and gift card compatibility. Where-to-buy content ranks for branded discovery queries the DTC storefront otherwise loses to competitor affiliate reviews.
Subscription versus one-time comparison content
Subscription versus one-time comparison content converts subscription commitments at 3 to 6 percent because it addresses the price-sensitivity concern head-on with a specific math table. The piece covers the discount structure (15 percent lifetime), the skip-a-month mechanic, the pause-anytime rule, the cancellation policy, and the specific yearly savings for the brand’s average consumption cadence. Cross-reference the retention structure on our food and beverage marketing retainer page.
Content refresh cadence on food brand pillars
Content refresh cadence on food brand content pillars runs a rolling audit every 12 to 24 months by pillar. Recipes get refreshed every 12 months with new photography, updated schema, and any nutrition or ingredient adjustments. Ingredient comparison guides refresh every 18 months to update market data. Sourcing story pages refresh every 24 months to reflect farm partnership changes and new harvest angles. Buyer intent content refreshes every 12 months to update retailer availability and pricing.
Recipe refresh priority order
Recipe refresh priority runs by organic traffic rank. The top 20 recipes by monthly organic sessions get refreshed first (new photography, schema audit, related recipe internal links, updated nutrition). The next 40 get refreshed at 15 months. The remaining recipes get refreshed opportunistically when the ranking slips past position 15 in Google. Skipping the refresh cadence lets recipe rankings drift out of the top 3 inside 18 months as newer competitor recipes take the position.
Schema audit checklist per refresh
The schema audit checklist per refresh runs 8 items: Recipe schema completeness, aggregateRating count and accuracy, nutrition data accuracy, prepTime and cookTime match the recipe body, image URLs valid at CDN, related recipe internal links working, product card SKU URL live, and Google Search Console rich result eligibility validated. This checklist takes 20 minutes per recipe and prevents the schema drift that costs recipe rankings 20 to 40 positions quietly.
Reporting cadence for food brand content marketing
Reporting cadence on food brand content marketing runs a monthly executive report plus a quarterly business review. The monthly report ships in the first business week and covers organic sessions by pillar, top 10 ranking recipes with position trend, ingredient guide ranking movements, sourcing page performance, and organic-attributed DTC revenue. Every number carries a comparison to the prior month and a plain-language interpretation the founder reads in 7 minutes.
Metrics that matter for content marketing
Metrics that matter for food brand content marketing: organic sessions by pillar, recipe rich result impressions in Search Console, organic conversion rate to hero SKU pages, organic-attributed DTC revenue, and top 20 ranking positions by monthly organic sessions. Vanity metrics that do not matter: total pageviews without conversion context, average time on page without conversion attribution, and social share counts. The monthly report skips the vanity block entirely.
Quarterly business review structure
The quarterly business review runs 90 minutes with the founder, head of content, and SEO lead. Agenda: organic traffic trend by pillar, top 10 winning content pieces, top 10 losing content pieces (candidates for refresh or removal), competitive gap analysis against 5 named competitor brands, and next quarter’s content calendar with recipes and ingredient guides queued. According to Ahrefs content marketing research, brands running quarterly content audits outperform brands running annual audits by 40 to 70 percent on organic revenue over a 24-month window.
Internal linking discipline across food brand content
Internal linking discipline across food brand content moves authority from recipe pages toward hero SKU product pages and comparison guides. Every recipe links to the hero SKU it uses inline (once in the ingredient list, once in a bottom call-out card). Every ingredient comparison guide links to 3 to 6 recipes using the winning ingredient plus the hero SKU product page. Every sourcing story links to the 2 to 4 SKUs sourced from that specific farm or cooperative.
Anchor text strategy across recipe hubs
Anchor text on internal links varies across recipe hubs to avoid over-optimization patterns Google penalizes. Exact-match anchor (“single-origin Ethiopian coffee”) runs on 20 to 30 percent of internal links. Partial-match variations (“our Ethiopian roast”) run on 30 to 40 percent. Branded anchors (the SKU name) run on 20 to 30 percent. Generic anchors (“shop the coffee”) fill the remaining 10 to 20 percent. This ratio holds ranking without triggering the over-optimization penalty that shows up on brands that anchor-text-stuff every internal link with the same exact-match keyword. Cross-reference the linking layer on our food and beverage web design page.
Link equity from ingredient guides to SKU pages
Link equity from ingredient guides passes to SKU pages when the guide’s comparison table names the hero SKU in the winning column with a product card, and when the guide’s body links to 3 to 6 recipes that use the winning ingredient. This 3-hop path (guide to recipe to SKU) pushes authority from a high-traffic informational query down to a high-intent transactional page. According to Search Engine Land SEO coverage, informational content that internally links to transactional pages produces 2 to 4 times higher organic revenue than isolated content silos.
Wrapping up content marketing for food brands
Content marketing for food brands is the organic engine that turns a DTC snack, drink, or CPG storefront into a search-driven revenue channel. Recipe hub of 40 to 100 recipes. Ingredient comparison guides at 12 to 24 pieces. Sourcing story pages at 6 to 12 pieces. Buyer intent content at 8 to 16 pieces. Creator syndication calendar with 12 to 30 creators per quarter. Refresh cadence at 12 to 24 months by pillar. Reporting with organic sessions and organic revenue attribution.
If your DTC food brand is running paid social at 20,000 dollars monthly with a broken blog and zero recipe schema, professional content marketing for food brands pays for itself inside the first 90 days on organic traffic captured. Redefine Web ships content marketing inside our monthly retainer packages. Book a call and we will walk through the last three DTC food brands we built recipe hubs for, pillar by pillar.
Anchor text on internal links varies across recipe hubs to avoid over-optimization patterns Google penalizes. Exact-match anchor (“single-origin Ethiopian coffee”) runs on 20 to 30 percent of internal links. Partial-match variations (“our Ethiopian roast”) run on 30 to 40 percent. Branded anchors (the SKU name) run on 20 to 30 percent. Generic anchors (“shop the coffee”) fill the remaining 10 to 20 percent. This ratio holds ranking without triggering the over-optimization penalty that shows up on brands that anchor-text-stuff every internal link with the same exact-match keyword. Cross-reference the linking layer on our food and beverage web design page.
Link equity from ingredient guides to SKU pages
Link equity from ingredient guides passes to SKU pages when the guide’s comparison table names the hero SKU in the winning column with a product card, and when the guide’s body links to 3 to 6 recipes that use the winning ingredient. This 3-hop path (guide to recipe to SKU) pushes authority from a high-traffic informational query down to a high-intent transactional page. According to Search Engine Land SEO coverage, informational content that internally links to transactional pages produces 2 to 4 times higher organic revenue than isolated content silos.
Wrapping up content marketing for food brands
Content marketing for food brands is the organic engine that turns a DTC snack, drink, or CPG storefront into a search-driven revenue channel. Recipe hub of 40 to 100 recipes. Ingredient comparison guides at 12 to 24 pieces. Sourcing story pages at 6 to 12 pieces. Buyer intent content at 8 to 16 pieces. Creator syndication calendar with 12 to 30 creators per quarter. Refresh cadence at 12 to 24 months by pillar. Reporting with organic sessions and organic revenue attribution.
If your DTC food brand is running paid social at 20,000 dollars monthly with a broken blog and zero recipe schema, professional content marketing for food brands pays for itself inside the first 90 days on organic traffic captured. Redefine Web ships content marketing inside our monthly retainer packages. Book a call and we will walk through the last three DTC food brands we built recipe hubs for, pillar by pillar.
Internal linking discipline across food brand content moves authority from recipe pages toward hero SKU product pages and comparison guides. Every recipe links to the hero SKU it uses inline (once in the ingredient list, once in a bottom call-out card). Every ingredient comparison guide links to 3 to 6 recipes using the winning ingredient plus the hero SKU product page. Every sourcing story links to the 2 to 4 SKUs sourced from that specific farm or cooperative.
Anchor text strategy across recipe hubs
Anchor text on internal links varies across recipe hubs to avoid over-optimization patterns Google penalizes. Exact-match anchor (“single-origin Ethiopian coffee”) runs on 20 to 30 percent of internal links. Partial-match variations (“our Ethiopian roast”) run on 30 to 40 percent. Branded anchors (the SKU name) run on 20 to 30 percent. Generic anchors (“shop the coffee”) fill the remaining 10 to 20 percent. This ratio holds ranking without triggering the over-optimization penalty that shows up on brands that anchor-text-stuff every internal link with the same exact-match keyword. Cross-reference the linking layer on our food and beverage web design page.
Link equity from ingredient guides to SKU pages
Link equity from ingredient guides passes to SKU pages when the guide’s comparison table names the hero SKU in the winning column with a product card, and when the guide’s body links to 3 to 6 recipes that use the winning ingredient. This 3-hop path (guide to recipe to SKU) pushes authority from a high-traffic informational query down to a high-intent transactional page. According to Search Engine Land SEO coverage, informational content that internally links to transactional pages produces 2 to 4 times higher organic revenue than isolated content silos.
Wrapping up content marketing for food brands
Content marketing for food brands is the organic engine that turns a DTC snack, drink, or CPG storefront into a search-driven revenue channel. Recipe hub of 40 to 100 recipes. Ingredient comparison guides at 12 to 24 pieces. Sourcing story pages at 6 to 12 pieces. Buyer intent content at 8 to 16 pieces. Creator syndication calendar with 12 to 30 creators per quarter. Refresh cadence at 12 to 24 months by pillar. Reporting with organic sessions and organic revenue attribution.
If your DTC food brand is running paid social at 20,000 dollars monthly with a broken blog and zero recipe schema, professional content marketing for food brands pays for itself inside the first 90 days on organic traffic captured. Redefine Web ships content marketing inside our monthly retainer packages. Book a call and we will walk through the last three DTC food brands we built recipe hubs for, pillar by pillar.
Content marketing for food brands starts with a recipe hub because recipe queries account for 40 to 60 percent of high-intent search volume in the food category. Every hero SKU needs 4 to 12 recipes anchored to it, each targeting a specific occasion and audience.
Skip the recipe hub and the brand loses the search real estate that pulls DTC storefront traffic month over month at zero incremental paid cost. Recipe traffic converts at 2 to 4 percent because the shopper landed with usage intent, not passive discovery, which is why food brands win on recipes.
Recipe schema and Google rich result eligibility
Every recipe page ships schema.org Recipe markup including cookTime, prepTime, recipeIngredient, recipeInstructions, nutrition, and aggregateRating. Correctly marked-up recipes qualify for Google’s recipe rich result carousel that pulls 3 to 6 times higher click-through rate than a plain blue link. The schema layer takes 15 minutes per recipe to author and 30 minutes to validate in Google Search Console. Cross-reference the recipe search stack on our food and beverage SEO page.
Recipe hub structure that scales
The recipe hub structure runs 40 to 100 recipes at maturity, organized by hero SKU (4 to 12 recipes per SKU) plus occasion tags (breakfast, weeknight dinner, meal prep, brunch, holiday). Every recipe links back to the hero SKU product page with the SKU embedded in an inline card. The hub earns internal linking value from ingredient comparison guides and the sourcing story pages, which feeds recipe ranking on Google. According to Google Search Central recipe structured data guidance, complete Recipe schema markup is required for eligibility in the recipe carousel and the ingredient search filter.
Pillar structure for food brand content marketing
The pillar structure on content marketing for food brands runs 4 content pillars concurrently: recipe hub (40 to 100 recipes), ingredient comparison guides (12 to 24 guides), sourcing story pages (6 to 12 pages), and buyer intent content (where to buy, subscription vs. one-time, gift bundle guides). Every pillar covers a distinct search intent and every pillar links back to the hero SKU product pages.
Ingredient comparison guide format
Ingredient comparison guides run 1,800 to 3,200 words comparing 2 to 4 ingredient types on 6 to 10 attributes with a comparison table, real-world use case examples, and links to the hero SKU that uses the specific ingredient. Example: organic vs. conventional oats compares nutritional profile, sourcing chain, cost, environmental impact, and taste on a 6-column table. The brand’s SKU appears in the winning column with a product card. These guides rank 3 to 8 months after publication and pull steady-state organic traffic.
Sourcing story pages that build trust
Sourcing story pages name the specific farms, cooperatives, or suppliers the brand sources from, with photos of the farms, farmer quotes, and specific harvest windows. A coffee brand’s Ethiopian farm page ranks for “single-origin Ethiopian coffee” and “Yirgacheffe coffee origin” plus 40 long-tail variations. The sourcing page pulls trust-building traffic that converts at 4 to 6 percent because the shopper landed pattern-matching on transparency and named provenance. Every sourcing page includes farmer or cooperative quotes, harvest dates, and a link back to 3 to 5 hero SKU pages that source from the named supplier.
Vejrø hospitality content case study
Vejrø Resort, a Danish private-island destination with an on-site restaurant focused on organic, locally sourced cuisine, joined us with strong social engagement and no organic-search real estate. Guests found the resort on Instagram but never in Google search for terms like “private island resort Denmark,” “farm-to-table hospitality Denmark,” or “Vejrø restaurant.” The same organic-search gap shows up on DTC food brands running paid social at 20,000 dollars monthly with a broken blog and zero recipe schema.
We built the conversion-focused website with on-site and off-site SEO tuned to the travel-niche keyword clusters, competitor analysis against comparable boutique resorts, and mobile-first design prioritizing guest discovery. Every page carried the structured data qualifying it for Google’s rich results in the hospitality category. Every internal link pushed authority toward the direct-booking conversion path.
Three months later, Vejrø hit 10,000 plus organic visitors, ranked for 200 plus first-page keywords, and pulled a 2.2 percent booking conversion rate from organic traffic. The same pattern applies to content marketing for food brands: recipe schema, ingredient comparison guides, and sourcing story pages pull organic traffic at 20 to 40 percent conversion into hero SKU pages inside 6 months when the content quality matches search intent and every page carries the right structured data markup. Vejrø also proved out the reporting discipline: every monthly report named the exact page, the exact keyword cluster, and the exact search feature (rich result, sitelinks, image pack) driving the incremental organic revenue instead of hiding behind aggregate traffic charts.
Recipe cadence and content calendar for food brands
Recipe cadence on a working food brand content calendar ships 2 to 4 new recipes per week during the first 6 months and drops to 1 per week at maturity. Each recipe takes 4 to 6 hours to produce (write, test in the kitchen, photograph, schema author, publish). At 3 recipes per week, the brand hits 78 recipes inside 6 months plus a backlog of ingredient comparison and sourcing content queued behind the recipe production line.
| Content pillar | Target volume year 1 | Production cost per piece | Refresh cadence |
|---|---|---|---|
| Recipe hub | 40 to 100 recipes | $180 to $320 | Every 12 months |
| Ingredient comparison guides | 12 to 24 guides | $450 to $780 | Every 18 months |
| Sourcing story pages | 6 to 12 pages | $680 to $1,200 | Every 24 months |
| Buyer intent content | 8 to 16 pieces | $220 to $420 | Every 12 months |
Photography as a content calendar constraint
Photography is the actual constraint on recipe cadence, not writing. Every recipe needs 6 to 12 photos: hero shot, ingredient flat lay, prep in progress, plated result, storage, and step shots for the schema markup. A working food brand batches photography 8 recipes at a time to keep the cost per recipe under 200 dollars. Skip the batching and the per-recipe cost climbs to 400 to 600 dollars, which caps recipe cadence at 1 per week and slows organic ranking timeline by 6 months.
Seasonal content calendar planning
Seasonal content calendar planning maps recipes and comparison guides to the seasonal windows they need to rank in. A Christmas cookie recipe needs to publish in September to rank by early December. A Valentine’s chocolate guide needs to publish in November to rank by early February. A back-to-school lunchbox recipe needs to publish in June to rank by late August. The 60-to-90-day ranking curve dictates the calendar.
Creator syndication inside food brand content
Creator syndication on food brand content marketing amplifies the recipe hub through Instagram Reels, TikTok, and YouTube Shorts creators paid to post their own version of the brand’s hero recipes. The creator content pulls net-new audiences into the recipe hub through the creator’s Link in Bio or Amazon Storefront tag. The syndication calendar names 12 to 30 creators per quarter with specific recipes assigned to each.
One brand we picked up had a spreadsheet titled “creator outreach 2023” with 47 rows and 3 responses. All 3 responses were auto-replies. The spreadsheet named zero recipes and offered flat rates below 100 dollars per post. Nobody posts a 30-second video for 87 dollars flat. Nobody.
Creator content commercial terms that work
Working creator content commercial terms run 350 to 1,500 dollars flat per post plus a 12 to 25 percent commission on tagged sales across a 30-day window. The commission mechanic pulls creators into follow-up posts because the incremental revenue continues past the initial fee. Mid-tier creators (30k to 150k followers) hit the sweet spot for food brand content because their engagement rate typically runs 4 to 8 percent versus 0.8 to 1.6 percent on mega-creators.
Content brief structure for creator partnerships
The content brief structure for creator partnerships runs a single page: the SKU, the specific recipe or usage occasion, 3 required brand mentions, 3 restricted claims (no health claims on non-medical SKUs), the pricing angle, the affiliate link, and 3 example videos that hit the tone. The brief avoids over-scripting because over-scripted creator content underperforms native creator voice by 40 to 60 percent on engagement rate.
Buyer intent content for food brand blogs
Buyer intent content on food brand blogs covers 8 to 16 pieces targeting explicit purchase-decision queries: “where to buy [brand],” “[brand] subscription vs. one-time,” “best [category] for [use case],” and “[brand] gift bundle.” Every buyer intent piece runs 1,400 to 2,400 words with a comparison table, product cards, and a clear conversion path to the specific SKU that matches the query intent. Buyer intent content converts at 3 to 6 percent versus 1 to 2 percent on recipe content because the shopper landed already planning to buy, not exploring a usage occasion.
Where-to-buy content structure
Where-to-buy content structure covers online (DTC storefront, Amazon, Target.com, Whole Foods online), retail (specific chain locators with the store finder embedded), and international (customs limitations, retailer partners abroad). Every piece names specific retailers, links to the store locator, and includes an FAQ block covering shipping availability, subscription options, and gift card compatibility. Where-to-buy content ranks for branded discovery queries the DTC storefront otherwise loses to competitor affiliate reviews.
Subscription versus one-time comparison content
Subscription versus one-time comparison content converts subscription commitments at 3 to 6 percent because it addresses the price-sensitivity concern head-on with a specific math table. The piece covers the discount structure (15 percent lifetime), the skip-a-month mechanic, the pause-anytime rule, the cancellation policy, and the specific yearly savings for the brand’s average consumption cadence. Cross-reference the retention structure on our food and beverage marketing retainer page.
Content refresh cadence on food brand pillars
Content refresh cadence on food brand content pillars runs a rolling audit every 12 to 24 months by pillar. Recipes get refreshed every 12 months with new photography, updated schema, and any nutrition or ingredient adjustments. Ingredient comparison guides refresh every 18 months to update market data. Sourcing story pages refresh every 24 months to reflect farm partnership changes and new harvest angles. Buyer intent content refreshes every 12 months to update retailer availability and pricing.
Recipe refresh priority order
Recipe refresh priority runs by organic traffic rank. The top 20 recipes by monthly organic sessions get refreshed first (new photography, schema audit, related recipe internal links, updated nutrition). The next 40 get refreshed at 15 months. The remaining recipes get refreshed opportunistically when the ranking slips past position 15 in Google. Skipping the refresh cadence lets recipe rankings drift out of the top 3 inside 18 months as newer competitor recipes take the position.
Schema audit checklist per refresh
The schema audit checklist per refresh runs 8 items: Recipe schema completeness, aggregateRating count and accuracy, nutrition data accuracy, prepTime and cookTime match the recipe body, image URLs valid at CDN, related recipe internal links working, product card SKU URL live, and Google Search Console rich result eligibility validated. This checklist takes 20 minutes per recipe and prevents the schema drift that costs recipe rankings 20 to 40 positions quietly.
Reporting cadence for food brand content marketing
Reporting cadence on food brand content marketing runs a monthly executive report plus a quarterly business review. The monthly report ships in the first business week and covers organic sessions by pillar, top 10 ranking recipes with position trend, ingredient guide ranking movements, sourcing page performance, and organic-attributed DTC revenue. Every number carries a comparison to the prior month and a plain-language interpretation the founder reads in 7 minutes.
Metrics that matter for content marketing
Metrics that matter for food brand content marketing: organic sessions by pillar, recipe rich result impressions in Search Console, organic conversion rate to hero SKU pages, organic-attributed DTC revenue, and top 20 ranking positions by monthly organic sessions. Vanity metrics that do not matter: total pageviews without conversion context, average time on page without conversion attribution, and social share counts. The monthly report skips the vanity block entirely.
Quarterly business review structure
The quarterly business review runs 90 minutes with the founder, head of content, and SEO lead. Agenda: organic traffic trend by pillar, top 10 winning content pieces, top 10 losing content pieces (candidates for refresh or removal), competitive gap analysis against 5 named competitor brands, and next quarter’s content calendar with recipes and ingredient guides queued. According to Ahrefs content marketing research, brands running quarterly content audits outperform brands running annual audits by 40 to 70 percent on organic revenue over a 24-month window.
Internal linking discipline across food brand content
Internal linking discipline across food brand content moves authority from recipe pages toward hero SKU product pages and comparison guides. Every recipe links to the hero SKU it uses inline (once in the ingredient list, once in a bottom call-out card). Every ingredient comparison guide links to 3 to 6 recipes using the winning ingredient plus the hero SKU product page. Every sourcing story links to the 2 to 4 SKUs sourced from that specific farm or cooperative.
Anchor text strategy across recipe hubs
Anchor text on internal links varies across recipe hubs to avoid over-optimization patterns Google penalizes. Exact-match anchor (“single-origin Ethiopian coffee”) runs on 20 to 30 percent of internal links. Partial-match variations (“our Ethiopian roast”) run on 30 to 40 percent. Branded anchors (the SKU name) run on 20 to 30 percent. Generic anchors (“shop the coffee”) fill the remaining 10 to 20 percent. This ratio holds ranking without triggering the over-optimization penalty that shows up on brands that anchor-text-stuff every internal link with the same exact-match keyword. Cross-reference the linking layer on our food and beverage web design page.
Link equity from ingredient guides to SKU pages
Link equity from ingredient guides passes to SKU pages when the guide’s comparison table names the hero SKU in the winning column with a product card, and when the guide’s body links to 3 to 6 recipes that use the winning ingredient. This 3-hop path (guide to recipe to SKU) pushes authority from a high-traffic informational query down to a high-intent transactional page. According to Search Engine Land SEO coverage, informational content that internally links to transactional pages produces 2 to 4 times higher organic revenue than isolated content silos.
Wrapping up content marketing for food brands
Content marketing for food brands is the organic engine that turns a DTC snack, drink, or CPG storefront into a search-driven revenue channel. Recipe hub of 40 to 100 recipes. Ingredient comparison guides at 12 to 24 pieces. Sourcing story pages at 6 to 12 pieces. Buyer intent content at 8 to 16 pieces. Creator syndication calendar with 12 to 30 creators per quarter. Refresh cadence at 12 to 24 months by pillar. Reporting with organic sessions and organic revenue attribution.
If your DTC food brand is running paid social at 20,000 dollars monthly with a broken blog and zero recipe schema, professional content marketing for food brands pays for itself inside the first 90 days on organic traffic captured. Redefine Web ships content marketing inside our monthly retainer packages. Book a call and we will walk through the last three DTC food brands we built recipe hubs for, pillar by pillar.
Content marketing for food brands starts with a recipe hub because recipe queries account for 40 to 60 percent of high-intent search volume in the food category. Every hero SKU needs 4 to 12 recipes anchored to it, each targeting a specific occasion and audience.
Skip the recipe hub and the brand loses the search real estate that pulls DTC storefront traffic month over month at zero incremental paid cost. Recipe traffic converts at 2 to 4 percent because the shopper landed with usage intent, not passive discovery, which is why food brands win on recipes.
Recipe schema and Google rich result eligibility
Every recipe page ships schema.org Recipe markup including cookTime, prepTime, recipeIngredient, recipeInstructions, nutrition, and aggregateRating. Correctly marked-up recipes qualify for Google’s recipe rich result carousel that pulls 3 to 6 times higher click-through rate than a plain blue link. The schema layer takes 15 minutes per recipe to author and 30 minutes to validate in Google Search Console. Cross-reference the recipe search stack on our food and beverage SEO page.
Recipe hub structure that scales
The recipe hub structure runs 40 to 100 recipes at maturity, organized by hero SKU (4 to 12 recipes per SKU) plus occasion tags (breakfast, weeknight dinner, meal prep, brunch, holiday). Every recipe links back to the hero SKU product page with the SKU embedded in an inline card. The hub earns internal linking value from ingredient comparison guides and the sourcing story pages, which feeds recipe ranking on Google. According to Google Search Central recipe structured data guidance, complete Recipe schema markup is required for eligibility in the recipe carousel and the ingredient search filter.
Pillar structure for food brand content marketing
The pillar structure on content marketing for food brands runs 4 content pillars concurrently: recipe hub (40 to 100 recipes), ingredient comparison guides (12 to 24 guides), sourcing story pages (6 to 12 pages), and buyer intent content (where to buy, subscription vs. one-time, gift bundle guides). Every pillar covers a distinct search intent and every pillar links back to the hero SKU product pages.
Ingredient comparison guide format
Ingredient comparison guides run 1,800 to 3,200 words comparing 2 to 4 ingredient types on 6 to 10 attributes with a comparison table, real-world use case examples, and links to the hero SKU that uses the specific ingredient. Example: organic vs. conventional oats compares nutritional profile, sourcing chain, cost, environmental impact, and taste on a 6-column table. The brand’s SKU appears in the winning column with a product card. These guides rank 3 to 8 months after publication and pull steady-state organic traffic.
Sourcing story pages that build trust
Sourcing story pages name the specific farms, cooperatives, or suppliers the brand sources from, with photos of the farms, farmer quotes, and specific harvest windows. A coffee brand’s Ethiopian farm page ranks for “single-origin Ethiopian coffee” and “Yirgacheffe coffee origin” plus 40 long-tail variations. The sourcing page pulls trust-building traffic that converts at 4 to 6 percent because the shopper landed pattern-matching on transparency and named provenance. Every sourcing page includes farmer or cooperative quotes, harvest dates, and a link back to 3 to 5 hero SKU pages that source from the named supplier.
Vejrø hospitality content case study
Vejrø Resort, a Danish private-island destination with an on-site restaurant focused on organic, locally sourced cuisine, joined us with strong social engagement and no organic-search real estate. Guests found the resort on Instagram but never in Google search for terms like “private island resort Denmark,” “farm-to-table hospitality Denmark,” or “Vejrø restaurant.” The same organic-search gap shows up on DTC food brands running paid social at 20,000 dollars monthly with a broken blog and zero recipe schema.
We built the conversion-focused website with on-site and off-site SEO tuned to the travel-niche keyword clusters, competitor analysis against comparable boutique resorts, and mobile-first design prioritizing guest discovery. Every page carried the structured data qualifying it for Google’s rich results in the hospitality category. Every internal link pushed authority toward the direct-booking conversion path.
Three months later, Vejrø hit 10,000 plus organic visitors, ranked for 200 plus first-page keywords, and pulled a 2.2 percent booking conversion rate from organic traffic. The same pattern applies to content marketing for food brands: recipe schema, ingredient comparison guides, and sourcing story pages pull organic traffic at 20 to 40 percent conversion into hero SKU pages inside 6 months when the content quality matches search intent and every page carries the right structured data markup. Vejrø also proved out the reporting discipline: every monthly report named the exact page, the exact keyword cluster, and the exact search feature (rich result, sitelinks, image pack) driving the incremental organic revenue instead of hiding behind aggregate traffic charts.
Recipe cadence and content calendar for food brands
Recipe cadence on a working food brand content calendar ships 2 to 4 new recipes per week during the first 6 months and drops to 1 per week at maturity. Each recipe takes 4 to 6 hours to produce (write, test in the kitchen, photograph, schema author, publish). At 3 recipes per week, the brand hits 78 recipes inside 6 months plus a backlog of ingredient comparison and sourcing content queued behind the recipe production line.
| Content pillar | Target volume year 1 | Production cost per piece | Refresh cadence |
|---|---|---|---|
| Recipe hub | 40 to 100 recipes | $180 to $320 | Every 12 months |
| Ingredient comparison guides | 12 to 24 guides | $450 to $780 | Every 18 months |
| Sourcing story pages | 6 to 12 pages | $680 to $1,200 | Every 24 months |
| Buyer intent content | 8 to 16 pieces | $220 to $420 | Every 12 months |
Photography as a content calendar constraint
Photography is the actual constraint on recipe cadence, not writing. Every recipe needs 6 to 12 photos: hero shot, ingredient flat lay, prep in progress, plated result, storage, and step shots for the schema markup. A working food brand batches photography 8 recipes at a time to keep the cost per recipe under 200 dollars. Skip the batching and the per-recipe cost climbs to 400 to 600 dollars, which caps recipe cadence at 1 per week and slows organic ranking timeline by 6 months.
Seasonal content calendar planning
Seasonal content calendar planning maps recipes and comparison guides to the seasonal windows they need to rank in. A Christmas cookie recipe needs to publish in September to rank by early December. A Valentine’s chocolate guide needs to publish in November to rank by early February. A back-to-school lunchbox recipe needs to publish in June to rank by late August. The 60-to-90-day ranking curve dictates the calendar.
Creator syndication inside food brand content
Creator syndication on food brand content marketing amplifies the recipe hub through Instagram Reels, TikTok, and YouTube Shorts creators paid to post their own version of the brand’s hero recipes. The creator content pulls net-new audiences into the recipe hub through the creator’s Link in Bio or Amazon Storefront tag. The syndication calendar names 12 to 30 creators per quarter with specific recipes assigned to each.
One brand we picked up had a spreadsheet titled “creator outreach 2023” with 47 rows and 3 responses. All 3 responses were auto-replies. The spreadsheet named zero recipes and offered flat rates below 100 dollars per post. Nobody posts a 30-second video for 87 dollars flat. Nobody.
Creator content commercial terms that work
Working creator content commercial terms run 350 to 1,500 dollars flat per post plus a 12 to 25 percent commission on tagged sales across a 30-day window. The commission mechanic pulls creators into follow-up posts because the incremental revenue continues past the initial fee. Mid-tier creators (30k to 150k followers) hit the sweet spot for food brand content because their engagement rate typically runs 4 to 8 percent versus 0.8 to 1.6 percent on mega-creators.
Content brief structure for creator partnerships
The content brief structure for creator partnerships runs a single page: the SKU, the specific recipe or usage occasion, 3 required brand mentions, 3 restricted claims (no health claims on non-medical SKUs), the pricing angle, the affiliate link, and 3 example videos that hit the tone. The brief avoids over-scripting because over-scripted creator content underperforms native creator voice by 40 to 60 percent on engagement rate.
Buyer intent content for food brand blogs
Buyer intent content on food brand blogs covers 8 to 16 pieces targeting explicit purchase-decision queries: “where to buy [brand],” “[brand] subscription vs. one-time,” “best [category] for [use case],” and “[brand] gift bundle.” Every buyer intent piece runs 1,400 to 2,400 words with a comparison table, product cards, and a clear conversion path to the specific SKU that matches the query intent. Buyer intent content converts at 3 to 6 percent versus 1 to 2 percent on recipe content because the shopper landed already planning to buy, not exploring a usage occasion.
Where-to-buy content structure
Where-to-buy content structure covers online (DTC storefront, Amazon, Target.com, Whole Foods online), retail (specific chain locators with the store finder embedded), and international (customs limitations, retailer partners abroad). Every piece names specific retailers, links to the store locator, and includes an FAQ block covering shipping availability, subscription options, and gift card compatibility. Where-to-buy content ranks for branded discovery queries the DTC storefront otherwise loses to competitor affiliate reviews.
Subscription versus one-time comparison content
Subscription versus one-time comparison content converts subscription commitments at 3 to 6 percent because it addresses the price-sensitivity concern head-on with a specific math table. The piece covers the discount structure (15 percent lifetime), the skip-a-month mechanic, the pause-anytime rule, the cancellation policy, and the specific yearly savings for the brand’s average consumption cadence. Cross-reference the retention structure on our food and beverage marketing retainer page.
Content refresh cadence on food brand pillars
Content refresh cadence on food brand content pillars runs a rolling audit every 12 to 24 months by pillar. Recipes get refreshed every 12 months with new photography, updated schema, and any nutrition or ingredient adjustments. Ingredient comparison guides refresh every 18 months to update market data. Sourcing story pages refresh every 24 months to reflect farm partnership changes and new harvest angles. Buyer intent content refreshes every 12 months to update retailer availability and pricing.
Recipe refresh priority order
Recipe refresh priority runs by organic traffic rank. The top 20 recipes by monthly organic sessions get refreshed first (new photography, schema audit, related recipe internal links, updated nutrition). The next 40 get refreshed at 15 months. The remaining recipes get refreshed opportunistically when the ranking slips past position 15 in Google. Skipping the refresh cadence lets recipe rankings drift out of the top 3 inside 18 months as newer competitor recipes take the position.
Schema audit checklist per refresh
The schema audit checklist per refresh runs 8 items: Recipe schema completeness, aggregateRating count and accuracy, nutrition data accuracy, prepTime and cookTime match the recipe body, image URLs valid at CDN, related recipe internal links working, product card SKU URL live, and Google Search Console rich result eligibility validated. This checklist takes 20 minutes per recipe and prevents the schema drift that costs recipe rankings 20 to 40 positions quietly.
Reporting cadence for food brand content marketing
Reporting cadence on food brand content marketing runs a monthly executive report plus a quarterly business review. The monthly report ships in the first business week and covers organic sessions by pillar, top 10 ranking recipes with position trend, ingredient guide ranking movements, sourcing page performance, and organic-attributed DTC revenue. Every number carries a comparison to the prior month and a plain-language interpretation the founder reads in 7 minutes.
Metrics that matter for content marketing
Metrics that matter for food brand content marketing: organic sessions by pillar, recipe rich result impressions in Search Console, organic conversion rate to hero SKU pages, organic-attributed DTC revenue, and top 20 ranking positions by monthly organic sessions. Vanity metrics that do not matter: total pageviews without conversion context, average time on page without conversion attribution, and social share counts. The monthly report skips the vanity block entirely.
Quarterly business review structure
The quarterly business review runs 90 minutes with the founder, head of content, and SEO lead. Agenda: organic traffic trend by pillar, top 10 winning content pieces, top 10 losing content pieces (candidates for refresh or removal), competitive gap analysis against 5 named competitor brands, and next quarter’s content calendar with recipes and ingredient guides queued. According to Ahrefs content marketing research, brands running quarterly content audits outperform brands running annual audits by 40 to 70 percent on organic revenue over a 24-month window.
Internal linking discipline across food brand content
Internal linking discipline across food brand content moves authority from recipe pages toward hero SKU product pages and comparison guides. Every recipe links to the hero SKU it uses inline (once in the ingredient list, once in a bottom call-out card). Every ingredient comparison guide links to 3 to 6 recipes using the winning ingredient plus the hero SKU product page. Every sourcing story links to the 2 to 4 SKUs sourced from that specific farm or cooperative.
Anchor text strategy across recipe hubs
Anchor text on internal links varies across recipe hubs to avoid over-optimization patterns Google penalizes. Exact-match anchor (“single-origin Ethiopian coffee”) runs on 20 to 30 percent of internal links. Partial-match variations (“our Ethiopian roast”) run on 30 to 40 percent. Branded anchors (the SKU name) run on 20 to 30 percent. Generic anchors (“shop the coffee”) fill the remaining 10 to 20 percent. This ratio holds ranking without triggering the over-optimization penalty that shows up on brands that anchor-text-stuff every internal link with the same exact-match keyword. Cross-reference the linking layer on our food and beverage web design page.
Link equity from ingredient guides to SKU pages
Link equity from ingredient guides passes to SKU pages when the guide’s comparison table names the hero SKU in the winning column with a product card, and when the guide’s body links to 3 to 6 recipes that use the winning ingredient. This 3-hop path (guide to recipe to SKU) pushes authority from a high-traffic informational query down to a high-intent transactional page. According to Search Engine Land SEO coverage, informational content that internally links to transactional pages produces 2 to 4 times higher organic revenue than isolated content silos.
Wrapping up content marketing for food brands
Content marketing for food brands is the organic engine that turns a DTC snack, drink, or CPG storefront into a search-driven revenue channel. Recipe hub of 40 to 100 recipes. Ingredient comparison guides at 12 to 24 pieces. Sourcing story pages at 6 to 12 pieces. Buyer intent content at 8 to 16 pieces. Creator syndication calendar with 12 to 30 creators per quarter. Refresh cadence at 12 to 24 months by pillar. Reporting with organic sessions and organic revenue attribution.
If your DTC food brand is running paid social at 20,000 dollars monthly with a broken blog and zero recipe schema, professional content marketing for food brands pays for itself inside the first 90 days on organic traffic captured. Redefine Web ships content marketing inside our monthly retainer packages. Book a call and we will walk through the last three DTC food brands we built recipe hubs for, pillar by pillar.
Content marketing for food brands starts with a recipe hub because recipe queries account for 40 to 60 percent of high-intent search volume in the food category. Every hero SKU needs 4 to 12 recipes anchored to it, each targeting a specific occasion and audience.
Skip the recipe hub and the brand loses the search real estate that pulls DTC storefront traffic month over month at zero incremental paid cost. Recipe traffic converts at 2 to 4 percent because the shopper landed with usage intent, not passive discovery, which is why food brands win on recipes.
Recipe schema and Google rich result eligibility
Every recipe page ships schema.org Recipe markup including cookTime, prepTime, recipeIngredient, recipeInstructions, nutrition, and aggregateRating. Correctly marked-up recipes qualify for Google’s recipe rich result carousel that pulls 3 to 6 times higher click-through rate than a plain blue link. The schema layer takes 15 minutes per recipe to author and 30 minutes to validate in Google Search Console. Cross-reference the recipe search stack on our food and beverage SEO page.
Recipe hub structure that scales
The recipe hub structure runs 40 to 100 recipes at maturity, organized by hero SKU (4 to 12 recipes per SKU) plus occasion tags (breakfast, weeknight dinner, meal prep, brunch, holiday). Every recipe links back to the hero SKU product page with the SKU embedded in an inline card. The hub earns internal linking value from ingredient comparison guides and the sourcing story pages, which feeds recipe ranking on Google. According to Google Search Central recipe structured data guidance, complete Recipe schema markup is required for eligibility in the recipe carousel and the ingredient search filter.
Pillar structure for food brand content marketing
The pillar structure on content marketing for food brands runs 4 content pillars concurrently: recipe hub (40 to 100 recipes), ingredient comparison guides (12 to 24 guides), sourcing story pages (6 to 12 pages), and buyer intent content (where to buy, subscription vs. one-time, gift bundle guides). Every pillar covers a distinct search intent and every pillar links back to the hero SKU product pages.
Ingredient comparison guide format
Ingredient comparison guides run 1,800 to 3,200 words comparing 2 to 4 ingredient types on 6 to 10 attributes with a comparison table, real-world use case examples, and links to the hero SKU that uses the specific ingredient. Example: organic vs. conventional oats compares nutritional profile, sourcing chain, cost, environmental impact, and taste on a 6-column table. The brand’s SKU appears in the winning column with a product card. These guides rank 3 to 8 months after publication and pull steady-state organic traffic.
Sourcing story pages that build trust
Sourcing story pages name the specific farms, cooperatives, or suppliers the brand sources from, with photos of the farms, farmer quotes, and specific harvest windows. A coffee brand’s Ethiopian farm page ranks for “single-origin Ethiopian coffee” and “Yirgacheffe coffee origin” plus 40 long-tail variations. The sourcing page pulls trust-building traffic that converts at 4 to 6 percent because the shopper landed pattern-matching on transparency and named provenance. Every sourcing page includes farmer or cooperative quotes, harvest dates, and a link back to 3 to 5 hero SKU pages that source from the named supplier.
Vejrø hospitality content case study
Vejrø Resort, a Danish private-island destination with an on-site restaurant focused on organic, locally sourced cuisine, joined us with strong social engagement and no organic-search real estate. Guests found the resort on Instagram but never in Google search for terms like “private island resort Denmark,” “farm-to-table hospitality Denmark,” or “Vejrø restaurant.” The same organic-search gap shows up on DTC food brands running paid social at 20,000 dollars monthly with a broken blog and zero recipe schema.
We built the conversion-focused website with on-site and off-site SEO tuned to the travel-niche keyword clusters, competitor analysis against comparable boutique resorts, and mobile-first design prioritizing guest discovery. Every page carried the structured data qualifying it for Google’s rich results in the hospitality category. Every internal link pushed authority toward the direct-booking conversion path.
Three months later, Vejrø hit 10,000 plus organic visitors, ranked for 200 plus first-page keywords, and pulled a 2.2 percent booking conversion rate from organic traffic. The same pattern applies to content marketing for food brands: recipe schema, ingredient comparison guides, and sourcing story pages pull organic traffic at 20 to 40 percent conversion into hero SKU pages inside 6 months when the content quality matches search intent and every page carries the right structured data markup. Vejrø also proved out the reporting discipline: every monthly report named the exact page, the exact keyword cluster, and the exact search feature (rich result, sitelinks, image pack) driving the incremental organic revenue instead of hiding behind aggregate traffic charts.
Recipe cadence and content calendar for food brands
Recipe cadence on a working food brand content calendar ships 2 to 4 new recipes per week during the first 6 months and drops to 1 per week at maturity. Each recipe takes 4 to 6 hours to produce (write, test in the kitchen, photograph, schema author, publish). At 3 recipes per week, the brand hits 78 recipes inside 6 months plus a backlog of ingredient comparison and sourcing content queued behind the recipe production line.
| Content pillar | Target volume year 1 | Production cost per piece | Refresh cadence |
|---|---|---|---|
| Recipe hub | 40 to 100 recipes | $180 to $320 | Every 12 months |
| Ingredient comparison guides | 12 to 24 guides | $450 to $780 | Every 18 months |
| Sourcing story pages | 6 to 12 pages | $680 to $1,200 | Every 24 months |
| Buyer intent content | 8 to 16 pieces | $220 to $420 | Every 12 months |
Photography as a content calendar constraint
Photography is the actual constraint on recipe cadence, not writing. Every recipe needs 6 to 12 photos: hero shot, ingredient flat lay, prep in progress, plated result, storage, and step shots for the schema markup. A working food brand batches photography 8 recipes at a time to keep the cost per recipe under 200 dollars. Skip the batching and the per-recipe cost climbs to 400 to 600 dollars, which caps recipe cadence at 1 per week and slows organic ranking timeline by 6 months.
Seasonal content calendar planning
Seasonal content calendar planning maps recipes and comparison guides to the seasonal windows they need to rank in. A Christmas cookie recipe needs to publish in September to rank by early December. A Valentine’s chocolate guide needs to publish in November to rank by early February. A back-to-school lunchbox recipe needs to publish in June to rank by late August. The 60-to-90-day ranking curve dictates the calendar.
Creator syndication inside food brand content
Creator syndication on food brand content marketing amplifies the recipe hub through Instagram Reels, TikTok, and YouTube Shorts creators paid to post their own version of the brand’s hero recipes. The creator content pulls net-new audiences into the recipe hub through the creator’s Link in Bio or Amazon Storefront tag. The syndication calendar names 12 to 30 creators per quarter with specific recipes assigned to each.
One brand we picked up had a spreadsheet titled “creator outreach 2023” with 47 rows and 3 responses. All 3 responses were auto-replies. The spreadsheet named zero recipes and offered flat rates below 100 dollars per post. Nobody posts a 30-second video for 87 dollars flat. Nobody.
Creator content commercial terms that work
Working creator content commercial terms run 350 to 1,500 dollars flat per post plus a 12 to 25 percent commission on tagged sales across a 30-day window. The commission mechanic pulls creators into follow-up posts because the incremental revenue continues past the initial fee. Mid-tier creators (30k to 150k followers) hit the sweet spot for food brand content because their engagement rate typically runs 4 to 8 percent versus 0.8 to 1.6 percent on mega-creators.
Content brief structure for creator partnerships
The content brief structure for creator partnerships runs a single page: the SKU, the specific recipe or usage occasion, 3 required brand mentions, 3 restricted claims (no health claims on non-medical SKUs), the pricing angle, the affiliate link, and 3 example videos that hit the tone. The brief avoids over-scripting because over-scripted creator content underperforms native creator voice by 40 to 60 percent on engagement rate.
Buyer intent content for food brand blogs
Buyer intent content on food brand blogs covers 8 to 16 pieces targeting explicit purchase-decision queries: “where to buy [brand],” “[brand] subscription vs. one-time,” “best [category] for [use case],” and “[brand] gift bundle.” Every buyer intent piece runs 1,400 to 2,400 words with a comparison table, product cards, and a clear conversion path to the specific SKU that matches the query intent. Buyer intent content converts at 3 to 6 percent versus 1 to 2 percent on recipe content because the shopper landed already planning to buy, not exploring a usage occasion.
Where-to-buy content structure
Where-to-buy content structure covers online (DTC storefront, Amazon, Target.com, Whole Foods online), retail (specific chain locators with the store finder embedded), and international (customs limitations, retailer partners abroad). Every piece names specific retailers, links to the store locator, and includes an FAQ block covering shipping availability, subscription options, and gift card compatibility. Where-to-buy content ranks for branded discovery queries the DTC storefront otherwise loses to competitor affiliate reviews.
Subscription versus one-time comparison content
Subscription versus one-time comparison content converts subscription commitments at 3 to 6 percent because it addresses the price-sensitivity concern head-on with a specific math table. The piece covers the discount structure (15 percent lifetime), the skip-a-month mechanic, the pause-anytime rule, the cancellation policy, and the specific yearly savings for the brand’s average consumption cadence. Cross-reference the retention structure on our food and beverage marketing retainer page.
Content refresh cadence on food brand pillars
Content refresh cadence on food brand content pillars runs a rolling audit every 12 to 24 months by pillar. Recipes get refreshed every 12 months with new photography, updated schema, and any nutrition or ingredient adjustments. Ingredient comparison guides refresh every 18 months to update market data. Sourcing story pages refresh every 24 months to reflect farm partnership changes and new harvest angles. Buyer intent content refreshes every 12 months to update retailer availability and pricing.
Recipe refresh priority order
Recipe refresh priority runs by organic traffic rank. The top 20 recipes by monthly organic sessions get refreshed first (new photography, schema audit, related recipe internal links, updated nutrition). The next 40 get refreshed at 15 months. The remaining recipes get refreshed opportunistically when the ranking slips past position 15 in Google. Skipping the refresh cadence lets recipe rankings drift out of the top 3 inside 18 months as newer competitor recipes take the position.
Schema audit checklist per refresh
The schema audit checklist per refresh runs 8 items: Recipe schema completeness, aggregateRating count and accuracy, nutrition data accuracy, prepTime and cookTime match the recipe body, image URLs valid at CDN, related recipe internal links working, product card SKU URL live, and Google Search Console rich result eligibility validated. This checklist takes 20 minutes per recipe and prevents the schema drift that costs recipe rankings 20 to 40 positions quietly.
Reporting cadence for food brand content marketing
Reporting cadence on food brand content marketing runs a monthly executive report plus a quarterly business review. The monthly report ships in the first business week and covers organic sessions by pillar, top 10 ranking recipes with position trend, ingredient guide ranking movements, sourcing page performance, and organic-attributed DTC revenue. Every number carries a comparison to the prior month and a plain-language interpretation the founder reads in 7 minutes.
Metrics that matter for content marketing
Metrics that matter for food brand content marketing: organic sessions by pillar, recipe rich result impressions in Search Console, organic conversion rate to hero SKU pages, organic-attributed DTC revenue, and top 20 ranking positions by monthly organic sessions. Vanity metrics that do not matter: total pageviews without conversion context, average time on page without conversion attribution, and social share counts. The monthly report skips the vanity block entirely.
Quarterly business review structure
The quarterly business review runs 90 minutes with the founder, head of content, and SEO lead. Agenda: organic traffic trend by pillar, top 10 winning content pieces, top 10 losing content pieces (candidates for refresh or removal), competitive gap analysis against 5 named competitor brands, and next quarter’s content calendar with recipes and ingredient guides queued. According to Ahrefs content marketing research, brands running quarterly content audits outperform brands running annual audits by 40 to 70 percent on organic revenue over a 24-month window.
Internal linking discipline across food brand content
Internal linking discipline across food brand content moves authority from recipe pages toward hero SKU product pages and comparison guides. Every recipe links to the hero SKU it uses inline (once in the ingredient list, once in a bottom call-out card). Every ingredient comparison guide links to 3 to 6 recipes using the winning ingredient plus the hero SKU product page. Every sourcing story links to the 2 to 4 SKUs sourced from that specific farm or cooperative.
Anchor text strategy across recipe hubs
Anchor text on internal links varies across recipe hubs to avoid over-optimization patterns Google penalizes. Exact-match anchor (“single-origin Ethiopian coffee”) runs on 20 to 30 percent of internal links. Partial-match variations (“our Ethiopian roast”) run on 30 to 40 percent. Branded anchors (the SKU name) run on 20 to 30 percent. Generic anchors (“shop the coffee”) fill the remaining 10 to 20 percent. This ratio holds ranking without triggering the over-optimization penalty that shows up on brands that anchor-text-stuff every internal link with the same exact-match keyword. Cross-reference the linking layer on our food and beverage web design page.
Link equity from ingredient guides to SKU pages
Link equity from ingredient guides passes to SKU pages when the guide’s comparison table names the hero SKU in the winning column with a product card, and when the guide’s body links to 3 to 6 recipes that use the winning ingredient. This 3-hop path (guide to recipe to SKU) pushes authority from a high-traffic informational query down to a high-intent transactional page. According to Search Engine Land SEO coverage, informational content that internally links to transactional pages produces 2 to 4 times higher organic revenue than isolated content silos.
Wrapping up content marketing for food brands
Content marketing for food brands is the organic engine that turns a DTC snack, drink, or CPG storefront into a search-driven revenue channel. Recipe hub of 40 to 100 recipes. Ingredient comparison guides at 12 to 24 pieces. Sourcing story pages at 6 to 12 pieces. Buyer intent content at 8 to 16 pieces. Creator syndication calendar with 12 to 30 creators per quarter. Refresh cadence at 12 to 24 months by pillar. Reporting with organic sessions and organic revenue attribution.
If your DTC food brand is running paid social at 20,000 dollars monthly with a broken blog and zero recipe schema, professional content marketing for food brands pays for itself inside the first 90 days on organic traffic captured. Redefine Web ships content marketing inside our monthly retainer packages. Book a call and we will walk through the last three DTC food brands we built recipe hubs for, pillar by pillar.
Internal linking discipline across food brand content moves authority from recipe pages toward hero SKU product pages and comparison guides. Every recipe links to the hero SKU it uses inline (once in the ingredient list, once in a bottom call-out card). Every ingredient comparison guide links to 3 to 6 recipes using the winning ingredient plus the hero SKU product page. Every sourcing story links to the 2 to 4 SKUs sourced from that specific farm or cooperative.
Anchor text strategy across recipe hubs
Anchor text on internal links varies across recipe hubs to avoid over-optimization patterns Google penalizes. Exact-match anchor (“single-origin Ethiopian coffee”) runs on 20 to 30 percent of internal links. Partial-match variations (“our Ethiopian roast”) run on 30 to 40 percent. Branded anchors (the SKU name) run on 20 to 30 percent. Generic anchors (“shop the coffee”) fill the remaining 10 to 20 percent. This ratio holds ranking without triggering the over-optimization penalty that shows up on brands that anchor-text-stuff every internal link with the same exact-match keyword. Cross-reference the linking layer on our food and beverage web design page.
Link equity from ingredient guides to SKU pages
Link equity from ingredient guides passes to SKU pages when the guide’s comparison table names the hero SKU in the winning column with a product card, and when the guide’s body links to 3 to 6 recipes that use the winning ingredient. This 3-hop path (guide to recipe to SKU) pushes authority from a high-traffic informational query down to a high-intent transactional page. According to Search Engine Land SEO coverage, informational content that internally links to transactional pages produces 2 to 4 times higher organic revenue than isolated content silos.
Wrapping up content marketing for food brands
Content marketing for food brands is the organic engine that turns a DTC snack, drink, or CPG storefront into a search-driven revenue channel. Recipe hub of 40 to 100 recipes. Ingredient comparison guides at 12 to 24 pieces. Sourcing story pages at 6 to 12 pieces. Buyer intent content at 8 to 16 pieces. Creator syndication calendar with 12 to 30 creators per quarter. Refresh cadence at 12 to 24 months by pillar. Reporting with organic sessions and organic revenue attribution.
If your DTC food brand is running paid social at 20,000 dollars monthly with a broken blog and zero recipe schema, professional content marketing for food brands pays for itself inside the first 90 days on organic traffic captured. Redefine Web ships content marketing inside our monthly retainer packages. Book a call and we will walk through the last three DTC food brands we built recipe hubs for, pillar by pillar.
Content marketing for food brands starts with a recipe hub because recipe queries account for 40 to 60 percent of high-intent search volume in the food category. Every hero SKU needs 4 to 12 recipes anchored to it, each targeting a specific occasion and audience.
Skip the recipe hub and the brand loses the search real estate that pulls DTC storefront traffic month over month at zero incremental paid cost. Recipe traffic converts at 2 to 4 percent because the shopper landed with usage intent, not passive discovery, which is why food brands win on recipes.
Recipe schema and Google rich result eligibility
Every recipe page ships schema.org Recipe markup including cookTime, prepTime, recipeIngredient, recipeInstructions, nutrition, and aggregateRating. Correctly marked-up recipes qualify for Google’s recipe rich result carousel that pulls 3 to 6 times higher click-through rate than a plain blue link. The schema layer takes 15 minutes per recipe to author and 30 minutes to validate in Google Search Console. Cross-reference the recipe search stack on our food and beverage SEO page.
Recipe hub structure that scales
The recipe hub structure runs 40 to 100 recipes at maturity, organized by hero SKU (4 to 12 recipes per SKU) plus occasion tags (breakfast, weeknight dinner, meal prep, brunch, holiday). Every recipe links back to the hero SKU product page with the SKU embedded in an inline card. The hub earns internal linking value from ingredient comparison guides and the sourcing story pages, which feeds recipe ranking on Google. According to Google Search Central recipe structured data guidance, complete Recipe schema markup is required for eligibility in the recipe carousel and the ingredient search filter.
Pillar structure for food brand content marketing
The pillar structure on content marketing for food brands runs 4 content pillars concurrently: recipe hub (40 to 100 recipes), ingredient comparison guides (12 to 24 guides), sourcing story pages (6 to 12 pages), and buyer intent content (where to buy, subscription vs. one-time, gift bundle guides). Every pillar covers a distinct search intent and every pillar links back to the hero SKU product pages.
Ingredient comparison guide format
Ingredient comparison guides run 1,800 to 3,200 words comparing 2 to 4 ingredient types on 6 to 10 attributes with a comparison table, real-world use case examples, and links to the hero SKU that uses the specific ingredient. Example: organic vs. conventional oats compares nutritional profile, sourcing chain, cost, environmental impact, and taste on a 6-column table. The brand’s SKU appears in the winning column with a product card. These guides rank 3 to 8 months after publication and pull steady-state organic traffic.
Sourcing story pages that build trust
Sourcing story pages name the specific farms, cooperatives, or suppliers the brand sources from, with photos of the farms, farmer quotes, and specific harvest windows. A coffee brand’s Ethiopian farm page ranks for “single-origin Ethiopian coffee” and “Yirgacheffe coffee origin” plus 40 long-tail variations. The sourcing page pulls trust-building traffic that converts at 4 to 6 percent because the shopper landed pattern-matching on transparency and named provenance. Every sourcing page includes farmer or cooperative quotes, harvest dates, and a link back to 3 to 5 hero SKU pages that source from the named supplier.
Vejrø hospitality content case study
Vejrø Resort, a Danish private-island destination with an on-site restaurant focused on organic, locally sourced cuisine, joined us with strong social engagement and no organic-search real estate. Guests found the resort on Instagram but never in Google search for terms like “private island resort Denmark,” “farm-to-table hospitality Denmark,” or “Vejrø restaurant.” The same organic-search gap shows up on DTC food brands running paid social at 20,000 dollars monthly with a broken blog and zero recipe schema.
We built the conversion-focused website with on-site and off-site SEO tuned to the travel-niche keyword clusters, competitor analysis against comparable boutique resorts, and mobile-first design prioritizing guest discovery. Every page carried the structured data qualifying it for Google’s rich results in the hospitality category. Every internal link pushed authority toward the direct-booking conversion path.
Three months later, Vejrø hit 10,000 plus organic visitors, ranked for 200 plus first-page keywords, and pulled a 2.2 percent booking conversion rate from organic traffic. The same pattern applies to content marketing for food brands: recipe schema, ingredient comparison guides, and sourcing story pages pull organic traffic at 20 to 40 percent conversion into hero SKU pages inside 6 months when the content quality matches search intent and every page carries the right structured data markup. Vejrø also proved out the reporting discipline: every monthly report named the exact page, the exact keyword cluster, and the exact search feature (rich result, sitelinks, image pack) driving the incremental organic revenue instead of hiding behind aggregate traffic charts.
Recipe cadence and content calendar for food brands
Recipe cadence on a working food brand content calendar ships 2 to 4 new recipes per week during the first 6 months and drops to 1 per week at maturity. Each recipe takes 4 to 6 hours to produce (write, test in the kitchen, photograph, schema author, publish). At 3 recipes per week, the brand hits 78 recipes inside 6 months plus a backlog of ingredient comparison and sourcing content queued behind the recipe production line.
| Content pillar | Target volume year 1 | Production cost per piece | Refresh cadence |
|---|---|---|---|
| Recipe hub | 40 to 100 recipes | $180 to $320 | Every 12 months |
| Ingredient comparison guides | 12 to 24 guides | $450 to $780 | Every 18 months |
| Sourcing story pages | 6 to 12 pages | $680 to $1,200 | Every 24 months |
| Buyer intent content | 8 to 16 pieces | $220 to $420 | Every 12 months |
Photography as a content calendar constraint
Photography is the actual constraint on recipe cadence, not writing. Every recipe needs 6 to 12 photos: hero shot, ingredient flat lay, prep in progress, plated result, storage, and step shots for the schema markup. A working food brand batches photography 8 recipes at a time to keep the cost per recipe under 200 dollars. Skip the batching and the per-recipe cost climbs to 400 to 600 dollars, which caps recipe cadence at 1 per week and slows organic ranking timeline by 6 months.
Seasonal content calendar planning
Seasonal content calendar planning maps recipes and comparison guides to the seasonal windows they need to rank in. A Christmas cookie recipe needs to publish in September to rank by early December. A Valentine’s chocolate guide needs to publish in November to rank by early February. A back-to-school lunchbox recipe needs to publish in June to rank by late August. The 60-to-90-day ranking curve dictates the calendar.
Creator syndication inside food brand content
Creator syndication on food brand content marketing amplifies the recipe hub through Instagram Reels, TikTok, and YouTube Shorts creators paid to post their own version of the brand’s hero recipes. The creator content pulls net-new audiences into the recipe hub through the creator’s Link in Bio or Amazon Storefront tag. The syndication calendar names 12 to 30 creators per quarter with specific recipes assigned to each.
One brand we picked up had a spreadsheet titled “creator outreach 2023” with 47 rows and 3 responses. All 3 responses were auto-replies. The spreadsheet named zero recipes and offered flat rates below 100 dollars per post. Nobody posts a 30-second video for 87 dollars flat. Nobody.
Creator content commercial terms that work
Working creator content commercial terms run 350 to 1,500 dollars flat per post plus a 12 to 25 percent commission on tagged sales across a 30-day window. The commission mechanic pulls creators into follow-up posts because the incremental revenue continues past the initial fee. Mid-tier creators (30k to 150k followers) hit the sweet spot for food brand content because their engagement rate typically runs 4 to 8 percent versus 0.8 to 1.6 percent on mega-creators.
Content brief structure for creator partnerships
The content brief structure for creator partnerships runs a single page: the SKU, the specific recipe or usage occasion, 3 required brand mentions, 3 restricted claims (no health claims on non-medical SKUs), the pricing angle, the affiliate link, and 3 example videos that hit the tone. The brief avoids over-scripting because over-scripted creator content underperforms native creator voice by 40 to 60 percent on engagement rate.
Buyer intent content for food brand blogs
Buyer intent content on food brand blogs covers 8 to 16 pieces targeting explicit purchase-decision queries: “where to buy [brand],” “[brand] subscription vs. one-time,” “best [category] for [use case],” and “[brand] gift bundle.” Every buyer intent piece runs 1,400 to 2,400 words with a comparison table, product cards, and a clear conversion path to the specific SKU that matches the query intent. Buyer intent content converts at 3 to 6 percent versus 1 to 2 percent on recipe content because the shopper landed already planning to buy, not exploring a usage occasion.
Where-to-buy content structure
Where-to-buy content structure covers online (DTC storefront, Amazon, Target.com, Whole Foods online), retail (specific chain locators with the store finder embedded), and international (customs limitations, retailer partners abroad). Every piece names specific retailers, links to the store locator, and includes an FAQ block covering shipping availability, subscription options, and gift card compatibility. Where-to-buy content ranks for branded discovery queries the DTC storefront otherwise loses to competitor affiliate reviews.
Subscription versus one-time comparison content
Subscription versus one-time comparison content converts subscription commitments at 3 to 6 percent because it addresses the price-sensitivity concern head-on with a specific math table. The piece covers the discount structure (15 percent lifetime), the skip-a-month mechanic, the pause-anytime rule, the cancellation policy, and the specific yearly savings for the brand’s average consumption cadence. Cross-reference the retention structure on our food and beverage marketing retainer page.
Content refresh cadence on food brand pillars
Content refresh cadence on food brand content pillars runs a rolling audit every 12 to 24 months by pillar. Recipes get refreshed every 12 months with new photography, updated schema, and any nutrition or ingredient adjustments. Ingredient comparison guides refresh every 18 months to update market data. Sourcing story pages refresh every 24 months to reflect farm partnership changes and new harvest angles. Buyer intent content refreshes every 12 months to update retailer availability and pricing.
Recipe refresh priority order
Recipe refresh priority runs by organic traffic rank. The top 20 recipes by monthly organic sessions get refreshed first (new photography, schema audit, related recipe internal links, updated nutrition). The next 40 get refreshed at 15 months. The remaining recipes get refreshed opportunistically when the ranking slips past position 15 in Google. Skipping the refresh cadence lets recipe rankings drift out of the top 3 inside 18 months as newer competitor recipes take the position.
Schema audit checklist per refresh
The schema audit checklist per refresh runs 8 items: Recipe schema completeness, aggregateRating count and accuracy, nutrition data accuracy, prepTime and cookTime match the recipe body, image URLs valid at CDN, related recipe internal links working, product card SKU URL live, and Google Search Console rich result eligibility validated. This checklist takes 20 minutes per recipe and prevents the schema drift that costs recipe rankings 20 to 40 positions quietly.
Reporting cadence for food brand content marketing
Reporting cadence on food brand content marketing runs a monthly executive report plus a quarterly business review. The monthly report ships in the first business week and covers organic sessions by pillar, top 10 ranking recipes with position trend, ingredient guide ranking movements, sourcing page performance, and organic-attributed DTC revenue. Every number carries a comparison to the prior month and a plain-language interpretation the founder reads in 7 minutes.
Metrics that matter for content marketing
Metrics that matter for food brand content marketing: organic sessions by pillar, recipe rich result impressions in Search Console, organic conversion rate to hero SKU pages, organic-attributed DTC revenue, and top 20 ranking positions by monthly organic sessions. Vanity metrics that do not matter: total pageviews without conversion context, average time on page without conversion attribution, and social share counts. The monthly report skips the vanity block entirely.
Quarterly business review structure
The quarterly business review runs 90 minutes with the founder, head of content, and SEO lead. Agenda: organic traffic trend by pillar, top 10 winning content pieces, top 10 losing content pieces (candidates for refresh or removal), competitive gap analysis against 5 named competitor brands, and next quarter’s content calendar with recipes and ingredient guides queued. According to Ahrefs content marketing research, brands running quarterly content audits outperform brands running annual audits by 40 to 70 percent on organic revenue over a 24-month window.
Internal linking discipline across food brand content
Internal linking discipline across food brand content moves authority from recipe pages toward hero SKU product pages and comparison guides. Every recipe links to the hero SKU it uses inline (once in the ingredient list, once in a bottom call-out card). Every ingredient comparison guide links to 3 to 6 recipes using the winning ingredient plus the hero SKU product page. Every sourcing story links to the 2 to 4 SKUs sourced from that specific farm or cooperative.
Anchor text strategy across recipe hubs
Anchor text on internal links varies across recipe hubs to avoid over-optimization patterns Google penalizes. Exact-match anchor (“single-origin Ethiopian coffee”) runs on 20 to 30 percent of internal links. Partial-match variations (“our Ethiopian roast”) run on 30 to 40 percent. Branded anchors (the SKU name) run on 20 to 30 percent. Generic anchors (“shop the coffee”) fill the remaining 10 to 20 percent. This ratio holds ranking without triggering the over-optimization penalty that shows up on brands that anchor-text-stuff every internal link with the same exact-match keyword. Cross-reference the linking layer on our food and beverage web design page.
Link equity from ingredient guides to SKU pages
Link equity from ingredient guides passes to SKU pages when the guide’s comparison table names the hero SKU in the winning column with a product card, and when the guide’s body links to 3 to 6 recipes that use the winning ingredient. This 3-hop path (guide to recipe to SKU) pushes authority from a high-traffic informational query down to a high-intent transactional page. According to Search Engine Land SEO coverage, informational content that internally links to transactional pages produces 2 to 4 times higher organic revenue than isolated content silos.
Wrapping up content marketing for food brands
Content marketing for food brands is the organic engine that turns a DTC snack, drink, or CPG storefront into a search-driven revenue channel. Recipe hub of 40 to 100 recipes. Ingredient comparison guides at 12 to 24 pieces. Sourcing story pages at 6 to 12 pieces. Buyer intent content at 8 to 16 pieces. Creator syndication calendar with 12 to 30 creators per quarter. Refresh cadence at 12 to 24 months by pillar. Reporting with organic sessions and organic revenue attribution.
If your DTC food brand is running paid social at 20,000 dollars monthly with a broken blog and zero recipe schema, professional content marketing for food brands pays for itself inside the first 90 days on organic traffic captured. Redefine Web ships content marketing inside our monthly retainer packages. Book a call and we will walk through the last three DTC food brands we built recipe hubs for, pillar by pillar.
Content marketing for food brands starts with a recipe hub because recipe queries account for 40 to 60 percent of high-intent search volume in the food category. Every hero SKU needs 4 to 12 recipes anchored to it, each targeting a specific occasion and audience.
Skip the recipe hub and the brand loses the search real estate that pulls DTC storefront traffic month over month at zero incremental paid cost. Recipe traffic converts at 2 to 4 percent because the shopper landed with usage intent, not passive discovery, which is why food brands win on recipes.
Recipe schema and Google rich result eligibility
Every recipe page ships schema.org Recipe markup including cookTime, prepTime, recipeIngredient, recipeInstructions, nutrition, and aggregateRating. Correctly marked-up recipes qualify for Google’s recipe rich result carousel that pulls 3 to 6 times higher click-through rate than a plain blue link. The schema layer takes 15 minutes per recipe to author and 30 minutes to validate in Google Search Console. Cross-reference the recipe search stack on our food and beverage SEO page.
Recipe hub structure that scales
The recipe hub structure runs 40 to 100 recipes at maturity, organized by hero SKU (4 to 12 recipes per SKU) plus occasion tags (breakfast, weeknight dinner, meal prep, brunch, holiday). Every recipe links back to the hero SKU product page with the SKU embedded in an inline card. The hub earns internal linking value from ingredient comparison guides and the sourcing story pages, which feeds recipe ranking on Google. According to Google Search Central recipe structured data guidance, complete Recipe schema markup is required for eligibility in the recipe carousel and the ingredient search filter.
Pillar structure for food brand content marketing
The pillar structure on content marketing for food brands runs 4 content pillars concurrently: recipe hub (40 to 100 recipes), ingredient comparison guides (12 to 24 guides), sourcing story pages (6 to 12 pages), and buyer intent content (where to buy, subscription vs. one-time, gift bundle guides). Every pillar covers a distinct search intent and every pillar links back to the hero SKU product pages.
Ingredient comparison guide format
Ingredient comparison guides run 1,800 to 3,200 words comparing 2 to 4 ingredient types on 6 to 10 attributes with a comparison table, real-world use case examples, and links to the hero SKU that uses the specific ingredient. Example: organic vs. conventional oats compares nutritional profile, sourcing chain, cost, environmental impact, and taste on a 6-column table. The brand’s SKU appears in the winning column with a product card. These guides rank 3 to 8 months after publication and pull steady-state organic traffic.
Sourcing story pages that build trust
Sourcing story pages name the specific farms, cooperatives, or suppliers the brand sources from, with photos of the farms, farmer quotes, and specific harvest windows. A coffee brand’s Ethiopian farm page ranks for “single-origin Ethiopian coffee” and “Yirgacheffe coffee origin” plus 40 long-tail variations. The sourcing page pulls trust-building traffic that converts at 4 to 6 percent because the shopper landed pattern-matching on transparency and named provenance. Every sourcing page includes farmer or cooperative quotes, harvest dates, and a link back to 3 to 5 hero SKU pages that source from the named supplier.
Vejrø hospitality content case study
Vejrø Resort, a Danish private-island destination with an on-site restaurant focused on organic, locally sourced cuisine, joined us with strong social engagement and no organic-search real estate. Guests found the resort on Instagram but never in Google search for terms like “private island resort Denmark,” “farm-to-table hospitality Denmark,” or “Vejrø restaurant.” The same organic-search gap shows up on DTC food brands running paid social at 20,000 dollars monthly with a broken blog and zero recipe schema.
We built the conversion-focused website with on-site and off-site SEO tuned to the travel-niche keyword clusters, competitor analysis against comparable boutique resorts, and mobile-first design prioritizing guest discovery. Every page carried the structured data qualifying it for Google’s rich results in the hospitality category. Every internal link pushed authority toward the direct-booking conversion path.
Three months later, Vejrø hit 10,000 plus organic visitors, ranked for 200 plus first-page keywords, and pulled a 2.2 percent booking conversion rate from organic traffic. The same pattern applies to content marketing for food brands: recipe schema, ingredient comparison guides, and sourcing story pages pull organic traffic at 20 to 40 percent conversion into hero SKU pages inside 6 months when the content quality matches search intent and every page carries the right structured data markup. Vejrø also proved out the reporting discipline: every monthly report named the exact page, the exact keyword cluster, and the exact search feature (rich result, sitelinks, image pack) driving the incremental organic revenue instead of hiding behind aggregate traffic charts.
Recipe cadence and content calendar for food brands
Recipe cadence on a working food brand content calendar ships 2 to 4 new recipes per week during the first 6 months and drops to 1 per week at maturity. Each recipe takes 4 to 6 hours to produce (write, test in the kitchen, photograph, schema author, publish). At 3 recipes per week, the brand hits 78 recipes inside 6 months plus a backlog of ingredient comparison and sourcing content queued behind the recipe production line.
| Content pillar | Target volume year 1 | Production cost per piece | Refresh cadence |
|---|---|---|---|
| Recipe hub | 40 to 100 recipes | $180 to $320 | Every 12 months |
| Ingredient comparison guides | 12 to 24 guides | $450 to $780 | Every 18 months |
| Sourcing story pages | 6 to 12 pages | $680 to $1,200 | Every 24 months |
| Buyer intent content | 8 to 16 pieces | $220 to $420 | Every 12 months |
Photography as a content calendar constraint
Photography is the actual constraint on recipe cadence, not writing. Every recipe needs 6 to 12 photos: hero shot, ingredient flat lay, prep in progress, plated result, storage, and step shots for the schema markup. A working food brand batches photography 8 recipes at a time to keep the cost per recipe under 200 dollars. Skip the batching and the per-recipe cost climbs to 400 to 600 dollars, which caps recipe cadence at 1 per week and slows organic ranking timeline by 6 months.
Seasonal content calendar planning
Seasonal content calendar planning maps recipes and comparison guides to the seasonal windows they need to rank in. A Christmas cookie recipe needs to publish in September to rank by early December. A Valentine’s chocolate guide needs to publish in November to rank by early February. A back-to-school lunchbox recipe needs to publish in June to rank by late August. The 60-to-90-day ranking curve dictates the calendar.
Creator syndication inside food brand content
Creator syndication on food brand content marketing amplifies the recipe hub through Instagram Reels, TikTok, and YouTube Shorts creators paid to post their own version of the brand’s hero recipes. The creator content pulls net-new audiences into the recipe hub through the creator’s Link in Bio or Amazon Storefront tag. The syndication calendar names 12 to 30 creators per quarter with specific recipes assigned to each.
One brand we picked up had a spreadsheet titled “creator outreach 2023” with 47 rows and 3 responses. All 3 responses were auto-replies. The spreadsheet named zero recipes and offered flat rates below 100 dollars per post. Nobody posts a 30-second video for 87 dollars flat. Nobody.
Creator content commercial terms that work
Working creator content commercial terms run 350 to 1,500 dollars flat per post plus a 12 to 25 percent commission on tagged sales across a 30-day window. The commission mechanic pulls creators into follow-up posts because the incremental revenue continues past the initial fee. Mid-tier creators (30k to 150k followers) hit the sweet spot for food brand content because their engagement rate typically runs 4 to 8 percent versus 0.8 to 1.6 percent on mega-creators.
Content brief structure for creator partnerships
The content brief structure for creator partnerships runs a single page: the SKU, the specific recipe or usage occasion, 3 required brand mentions, 3 restricted claims (no health claims on non-medical SKUs), the pricing angle, the affiliate link, and 3 example videos that hit the tone. The brief avoids over-scripting because over-scripted creator content underperforms native creator voice by 40 to 60 percent on engagement rate.
Buyer intent content for food brand blogs
Buyer intent content on food brand blogs covers 8 to 16 pieces targeting explicit purchase-decision queries: “where to buy [brand],” “[brand] subscription vs. one-time,” “best [category] for [use case],” and “[brand] gift bundle.” Every buyer intent piece runs 1,400 to 2,400 words with a comparison table, product cards, and a clear conversion path to the specific SKU that matches the query intent. Buyer intent content converts at 3 to 6 percent versus 1 to 2 percent on recipe content because the shopper landed already planning to buy, not exploring a usage occasion.
Where-to-buy content structure
Where-to-buy content structure covers online (DTC storefront, Amazon, Target.com, Whole Foods online), retail (specific chain locators with the store finder embedded), and international (customs limitations, retailer partners abroad). Every piece names specific retailers, links to the store locator, and includes an FAQ block covering shipping availability, subscription options, and gift card compatibility. Where-to-buy content ranks for branded discovery queries the DTC storefront otherwise loses to competitor affiliate reviews.
Subscription versus one-time comparison content
Subscription versus one-time comparison content converts subscription commitments at 3 to 6 percent because it addresses the price-sensitivity concern head-on with a specific math table. The piece covers the discount structure (15 percent lifetime), the skip-a-month mechanic, the pause-anytime rule, the cancellation policy, and the specific yearly savings for the brand’s average consumption cadence. Cross-reference the retention structure on our food and beverage marketing retainer page.
Content refresh cadence on food brand pillars
Content refresh cadence on food brand content pillars runs a rolling audit every 12 to 24 months by pillar. Recipes get refreshed every 12 months with new photography, updated schema, and any nutrition or ingredient adjustments. Ingredient comparison guides refresh every 18 months to update market data. Sourcing story pages refresh every 24 months to reflect farm partnership changes and new harvest angles. Buyer intent content refreshes every 12 months to update retailer availability and pricing.
Recipe refresh priority order
Recipe refresh priority runs by organic traffic rank. The top 20 recipes by monthly organic sessions get refreshed first (new photography, schema audit, related recipe internal links, updated nutrition). The next 40 get refreshed at 15 months. The remaining recipes get refreshed opportunistically when the ranking slips past position 15 in Google. Skipping the refresh cadence lets recipe rankings drift out of the top 3 inside 18 months as newer competitor recipes take the position.
Schema audit checklist per refresh
The schema audit checklist per refresh runs 8 items: Recipe schema completeness, aggregateRating count and accuracy, nutrition data accuracy, prepTime and cookTime match the recipe body, image URLs valid at CDN, related recipe internal links working, product card SKU URL live, and Google Search Console rich result eligibility validated. This checklist takes 20 minutes per recipe and prevents the schema drift that costs recipe rankings 20 to 40 positions quietly.
Reporting cadence for food brand content marketing
Reporting cadence on food brand content marketing runs a monthly executive report plus a quarterly business review. The monthly report ships in the first business week and covers organic sessions by pillar, top 10 ranking recipes with position trend, ingredient guide ranking movements, sourcing page performance, and organic-attributed DTC revenue. Every number carries a comparison to the prior month and a plain-language interpretation the founder reads in 7 minutes.
Metrics that matter for content marketing
Metrics that matter for food brand content marketing: organic sessions by pillar, recipe rich result impressions in Search Console, organic conversion rate to hero SKU pages, organic-attributed DTC revenue, and top 20 ranking positions by monthly organic sessions. Vanity metrics that do not matter: total pageviews without conversion context, average time on page without conversion attribution, and social share counts. The monthly report skips the vanity block entirely.
Quarterly business review structure
The quarterly business review runs 90 minutes with the founder, head of content, and SEO lead. Agenda: organic traffic trend by pillar, top 10 winning content pieces, top 10 losing content pieces (candidates for refresh or removal), competitive gap analysis against 5 named competitor brands, and next quarter’s content calendar with recipes and ingredient guides queued. According to Ahrefs content marketing research, brands running quarterly content audits outperform brands running annual audits by 40 to 70 percent on organic revenue over a 24-month window.
Internal linking discipline across food brand content
Internal linking discipline across food brand content moves authority from recipe pages toward hero SKU product pages and comparison guides. Every recipe links to the hero SKU it uses inline (once in the ingredient list, once in a bottom call-out card). Every ingredient comparison guide links to 3 to 6 recipes using the winning ingredient plus the hero SKU product page. Every sourcing story links to the 2 to 4 SKUs sourced from that specific farm or cooperative.
Anchor text strategy across recipe hubs
Anchor text on internal links varies across recipe hubs to avoid over-optimization patterns Google penalizes. Exact-match anchor (“single-origin Ethiopian coffee”) runs on 20 to 30 percent of internal links. Partial-match variations (“our Ethiopian roast”) run on 30 to 40 percent. Branded anchors (the SKU name) run on 20 to 30 percent. Generic anchors (“shop the coffee”) fill the remaining 10 to 20 percent. This ratio holds ranking without triggering the over-optimization penalty that shows up on brands that anchor-text-stuff every internal link with the same exact-match keyword. Cross-reference the linking layer on our food and beverage web design page.
Link equity from ingredient guides to SKU pages
Link equity from ingredient guides passes to SKU pages when the guide’s comparison table names the hero SKU in the winning column with a product card, and when the guide’s body links to 3 to 6 recipes that use the winning ingredient. This 3-hop path (guide to recipe to SKU) pushes authority from a high-traffic informational query down to a high-intent transactional page. According to Search Engine Land SEO coverage, informational content that internally links to transactional pages produces 2 to 4 times higher organic revenue than isolated content silos.
Wrapping up content marketing for food brands
Content marketing for food brands is the organic engine that turns a DTC snack, drink, or CPG storefront into a search-driven revenue channel. Recipe hub of 40 to 100 recipes. Ingredient comparison guides at 12 to 24 pieces. Sourcing story pages at 6 to 12 pieces. Buyer intent content at 8 to 16 pieces. Creator syndication calendar with 12 to 30 creators per quarter. Refresh cadence at 12 to 24 months by pillar. Reporting with organic sessions and organic revenue attribution.
If your DTC food brand is running paid social at 20,000 dollars monthly with a broken blog and zero recipe schema, professional content marketing for food brands pays for itself inside the first 90 days on organic traffic captured. Redefine Web ships content marketing inside our monthly retainer packages. Book a call and we will walk through the last three DTC food brands we built recipe hubs for, pillar by pillar.
Anchor text on internal links varies across recipe hubs to avoid over-optimization patterns Google penalizes. Exact-match anchor (“single-origin Ethiopian coffee”) runs on 20 to 30 percent of internal links. Partial-match variations (“our Ethiopian roast”) run on 30 to 40 percent. Branded anchors (the SKU name) run on 20 to 30 percent. Generic anchors (“shop the coffee”) fill the remaining 10 to 20 percent. This ratio holds ranking without triggering the over-optimization penalty that shows up on brands that anchor-text-stuff every internal link with the same exact-match keyword. Cross-reference the linking layer on our food and beverage web design page.
Link equity from ingredient guides to SKU pages
Link equity from ingredient guides passes to SKU pages when the guide’s comparison table names the hero SKU in the winning column with a product card, and when the guide’s body links to 3 to 6 recipes that use the winning ingredient. This 3-hop path (guide to recipe to SKU) pushes authority from a high-traffic informational query down to a high-intent transactional page. According to Search Engine Land SEO coverage, informational content that internally links to transactional pages produces 2 to 4 times higher organic revenue than isolated content silos.
Wrapping up content marketing for food brands
Content marketing for food brands is the organic engine that turns a DTC snack, drink, or CPG storefront into a search-driven revenue channel. Recipe hub of 40 to 100 recipes. Ingredient comparison guides at 12 to 24 pieces. Sourcing story pages at 6 to 12 pieces. Buyer intent content at 8 to 16 pieces. Creator syndication calendar with 12 to 30 creators per quarter. Refresh cadence at 12 to 24 months by pillar. Reporting with organic sessions and organic revenue attribution.
If your DTC food brand is running paid social at 20,000 dollars monthly with a broken blog and zero recipe schema, professional content marketing for food brands pays for itself inside the first 90 days on organic traffic captured. Redefine Web ships content marketing inside our monthly retainer packages. Book a call and we will walk through the last three DTC food brands we built recipe hubs for, pillar by pillar.
Internal linking discipline across food brand content moves authority from recipe pages toward hero SKU product pages and comparison guides. Every recipe links to the hero SKU it uses inline (once in the ingredient list, once in a bottom call-out card). Every ingredient comparison guide links to 3 to 6 recipes using the winning ingredient plus the hero SKU product page. Every sourcing story links to the 2 to 4 SKUs sourced from that specific farm or cooperative.
Anchor text strategy across recipe hubs
Anchor text on internal links varies across recipe hubs to avoid over-optimization patterns Google penalizes. Exact-match anchor (“single-origin Ethiopian coffee”) runs on 20 to 30 percent of internal links. Partial-match variations (“our Ethiopian roast”) run on 30 to 40 percent. Branded anchors (the SKU name) run on 20 to 30 percent. Generic anchors (“shop the coffee”) fill the remaining 10 to 20 percent. This ratio holds ranking without triggering the over-optimization penalty that shows up on brands that anchor-text-stuff every internal link with the same exact-match keyword. Cross-reference the linking layer on our food and beverage web design page.
Link equity from ingredient guides to SKU pages
Link equity from ingredient guides passes to SKU pages when the guide’s comparison table names the hero SKU in the winning column with a product card, and when the guide’s body links to 3 to 6 recipes that use the winning ingredient. This 3-hop path (guide to recipe to SKU) pushes authority from a high-traffic informational query down to a high-intent transactional page. According to Search Engine Land SEO coverage, informational content that internally links to transactional pages produces 2 to 4 times higher organic revenue than isolated content silos.
Wrapping up content marketing for food brands
Content marketing for food brands is the organic engine that turns a DTC snack, drink, or CPG storefront into a search-driven revenue channel. Recipe hub of 40 to 100 recipes. Ingredient comparison guides at 12 to 24 pieces. Sourcing story pages at 6 to 12 pieces. Buyer intent content at 8 to 16 pieces. Creator syndication calendar with 12 to 30 creators per quarter. Refresh cadence at 12 to 24 months by pillar. Reporting with organic sessions and organic revenue attribution.
If your DTC food brand is running paid social at 20,000 dollars monthly with a broken blog and zero recipe schema, professional content marketing for food brands pays for itself inside the first 90 days on organic traffic captured. Redefine Web ships content marketing inside our monthly retainer packages. Book a call and we will walk through the last three DTC food brands we built recipe hubs for, pillar by pillar.
Content marketing for food brands starts with a recipe hub because recipe queries account for 40 to 60 percent of high-intent search volume in the food category. Every hero SKU needs 4 to 12 recipes anchored to it, each targeting a specific occasion and audience.
Skip the recipe hub and the brand loses the search real estate that pulls DTC storefront traffic month over month at zero incremental paid cost. Recipe traffic converts at 2 to 4 percent because the shopper landed with usage intent, not passive discovery, which is why food brands win on recipes.
Recipe schema and Google rich result eligibility
Every recipe page ships schema.org Recipe markup including cookTime, prepTime, recipeIngredient, recipeInstructions, nutrition, and aggregateRating. Correctly marked-up recipes qualify for Google’s recipe rich result carousel that pulls 3 to 6 times higher click-through rate than a plain blue link. The schema layer takes 15 minutes per recipe to author and 30 minutes to validate in Google Search Console. Cross-reference the recipe search stack on our food and beverage SEO page.
Recipe hub structure that scales
The recipe hub structure runs 40 to 100 recipes at maturity, organized by hero SKU (4 to 12 recipes per SKU) plus occasion tags (breakfast, weeknight dinner, meal prep, brunch, holiday). Every recipe links back to the hero SKU product page with the SKU embedded in an inline card. The hub earns internal linking value from ingredient comparison guides and the sourcing story pages, which feeds recipe ranking on Google. According to Google Search Central recipe structured data guidance, complete Recipe schema markup is required for eligibility in the recipe carousel and the ingredient search filter.
Pillar structure for food brand content marketing
The pillar structure on content marketing for food brands runs 4 content pillars concurrently: recipe hub (40 to 100 recipes), ingredient comparison guides (12 to 24 guides), sourcing story pages (6 to 12 pages), and buyer intent content (where to buy, subscription vs. one-time, gift bundle guides). Every pillar covers a distinct search intent and every pillar links back to the hero SKU product pages.
Ingredient comparison guide format
Ingredient comparison guides run 1,800 to 3,200 words comparing 2 to 4 ingredient types on 6 to 10 attributes with a comparison table, real-world use case examples, and links to the hero SKU that uses the specific ingredient. Example: organic vs. conventional oats compares nutritional profile, sourcing chain, cost, environmental impact, and taste on a 6-column table. The brand’s SKU appears in the winning column with a product card. These guides rank 3 to 8 months after publication and pull steady-state organic traffic.
Sourcing story pages that build trust
Sourcing story pages name the specific farms, cooperatives, or suppliers the brand sources from, with photos of the farms, farmer quotes, and specific harvest windows. A coffee brand’s Ethiopian farm page ranks for “single-origin Ethiopian coffee” and “Yirgacheffe coffee origin” plus 40 long-tail variations. The sourcing page pulls trust-building traffic that converts at 4 to 6 percent because the shopper landed pattern-matching on transparency and named provenance. Every sourcing page includes farmer or cooperative quotes, harvest dates, and a link back to 3 to 5 hero SKU pages that source from the named supplier.
Vejrø hospitality content case study
Vejrø Resort, a Danish private-island destination with an on-site restaurant focused on organic, locally sourced cuisine, joined us with strong social engagement and no organic-search real estate. Guests found the resort on Instagram but never in Google search for terms like “private island resort Denmark,” “farm-to-table hospitality Denmark,” or “Vejrø restaurant.” The same organic-search gap shows up on DTC food brands running paid social at 20,000 dollars monthly with a broken blog and zero recipe schema.
We built the conversion-focused website with on-site and off-site SEO tuned to the travel-niche keyword clusters, competitor analysis against comparable boutique resorts, and mobile-first design prioritizing guest discovery. Every page carried the structured data qualifying it for Google’s rich results in the hospitality category. Every internal link pushed authority toward the direct-booking conversion path.
Three months later, Vejrø hit 10,000 plus organic visitors, ranked for 200 plus first-page keywords, and pulled a 2.2 percent booking conversion rate from organic traffic. The same pattern applies to content marketing for food brands: recipe schema, ingredient comparison guides, and sourcing story pages pull organic traffic at 20 to 40 percent conversion into hero SKU pages inside 6 months when the content quality matches search intent and every page carries the right structured data markup. Vejrø also proved out the reporting discipline: every monthly report named the exact page, the exact keyword cluster, and the exact search feature (rich result, sitelinks, image pack) driving the incremental organic revenue instead of hiding behind aggregate traffic charts.
Recipe cadence and content calendar for food brands
Recipe cadence on a working food brand content calendar ships 2 to 4 new recipes per week during the first 6 months and drops to 1 per week at maturity. Each recipe takes 4 to 6 hours to produce (write, test in the kitchen, photograph, schema author, publish). At 3 recipes per week, the brand hits 78 recipes inside 6 months plus a backlog of ingredient comparison and sourcing content queued behind the recipe production line.
| Content pillar | Target volume year 1 | Production cost per piece | Refresh cadence |
|---|---|---|---|
| Recipe hub | 40 to 100 recipes | $180 to $320 | Every 12 months |
| Ingredient comparison guides | 12 to 24 guides | $450 to $780 | Every 18 months |
| Sourcing story pages | 6 to 12 pages | $680 to $1,200 | Every 24 months |
| Buyer intent content | 8 to 16 pieces | $220 to $420 | Every 12 months |
Photography as a content calendar constraint
Photography is the actual constraint on recipe cadence, not writing. Every recipe needs 6 to 12 photos: hero shot, ingredient flat lay, prep in progress, plated result, storage, and step shots for the schema markup. A working food brand batches photography 8 recipes at a time to keep the cost per recipe under 200 dollars. Skip the batching and the per-recipe cost climbs to 400 to 600 dollars, which caps recipe cadence at 1 per week and slows organic ranking timeline by 6 months.
Seasonal content calendar planning
Seasonal content calendar planning maps recipes and comparison guides to the seasonal windows they need to rank in. A Christmas cookie recipe needs to publish in September to rank by early December. A Valentine’s chocolate guide needs to publish in November to rank by early February. A back-to-school lunchbox recipe needs to publish in June to rank by late August. The 60-to-90-day ranking curve dictates the calendar.
Creator syndication inside food brand content
Creator syndication on food brand content marketing amplifies the recipe hub through Instagram Reels, TikTok, and YouTube Shorts creators paid to post their own version of the brand’s hero recipes. The creator content pulls net-new audiences into the recipe hub through the creator’s Link in Bio or Amazon Storefront tag. The syndication calendar names 12 to 30 creators per quarter with specific recipes assigned to each.
One brand we picked up had a spreadsheet titled “creator outreach 2023” with 47 rows and 3 responses. All 3 responses were auto-replies. The spreadsheet named zero recipes and offered flat rates below 100 dollars per post. Nobody posts a 30-second video for 87 dollars flat. Nobody.
Creator content commercial terms that work
Working creator content commercial terms run 350 to 1,500 dollars flat per post plus a 12 to 25 percent commission on tagged sales across a 30-day window. The commission mechanic pulls creators into follow-up posts because the incremental revenue continues past the initial fee. Mid-tier creators (30k to 150k followers) hit the sweet spot for food brand content because their engagement rate typically runs 4 to 8 percent versus 0.8 to 1.6 percent on mega-creators.
Content brief structure for creator partnerships
The content brief structure for creator partnerships runs a single page: the SKU, the specific recipe or usage occasion, 3 required brand mentions, 3 restricted claims (no health claims on non-medical SKUs), the pricing angle, the affiliate link, and 3 example videos that hit the tone. The brief avoids over-scripting because over-scripted creator content underperforms native creator voice by 40 to 60 percent on engagement rate.
Buyer intent content for food brand blogs
Buyer intent content on food brand blogs covers 8 to 16 pieces targeting explicit purchase-decision queries: “where to buy [brand],” “[brand] subscription vs. one-time,” “best [category] for [use case],” and “[brand] gift bundle.” Every buyer intent piece runs 1,400 to 2,400 words with a comparison table, product cards, and a clear conversion path to the specific SKU that matches the query intent. Buyer intent content converts at 3 to 6 percent versus 1 to 2 percent on recipe content because the shopper landed already planning to buy, not exploring a usage occasion.
Where-to-buy content structure
Where-to-buy content structure covers online (DTC storefront, Amazon, Target.com, Whole Foods online), retail (specific chain locators with the store finder embedded), and international (customs limitations, retailer partners abroad). Every piece names specific retailers, links to the store locator, and includes an FAQ block covering shipping availability, subscription options, and gift card compatibility. Where-to-buy content ranks for branded discovery queries the DTC storefront otherwise loses to competitor affiliate reviews.
Subscription versus one-time comparison content
Subscription versus one-time comparison content converts subscription commitments at 3 to 6 percent because it addresses the price-sensitivity concern head-on with a specific math table. The piece covers the discount structure (15 percent lifetime), the skip-a-month mechanic, the pause-anytime rule, the cancellation policy, and the specific yearly savings for the brand’s average consumption cadence. Cross-reference the retention structure on our food and beverage marketing retainer page.
Content refresh cadence on food brand pillars
Content refresh cadence on food brand content pillars runs a rolling audit every 12 to 24 months by pillar. Recipes get refreshed every 12 months with new photography, updated schema, and any nutrition or ingredient adjustments. Ingredient comparison guides refresh every 18 months to update market data. Sourcing story pages refresh every 24 months to reflect farm partnership changes and new harvest angles. Buyer intent content refreshes every 12 months to update retailer availability and pricing.
Recipe refresh priority order
Recipe refresh priority runs by organic traffic rank. The top 20 recipes by monthly organic sessions get refreshed first (new photography, schema audit, related recipe internal links, updated nutrition). The next 40 get refreshed at 15 months. The remaining recipes get refreshed opportunistically when the ranking slips past position 15 in Google. Skipping the refresh cadence lets recipe rankings drift out of the top 3 inside 18 months as newer competitor recipes take the position.
Schema audit checklist per refresh
The schema audit checklist per refresh runs 8 items: Recipe schema completeness, aggregateRating count and accuracy, nutrition data accuracy, prepTime and cookTime match the recipe body, image URLs valid at CDN, related recipe internal links working, product card SKU URL live, and Google Search Console rich result eligibility validated. This checklist takes 20 minutes per recipe and prevents the schema drift that costs recipe rankings 20 to 40 positions quietly.
Reporting cadence for food brand content marketing
Reporting cadence on food brand content marketing runs a monthly executive report plus a quarterly business review. The monthly report ships in the first business week and covers organic sessions by pillar, top 10 ranking recipes with position trend, ingredient guide ranking movements, sourcing page performance, and organic-attributed DTC revenue. Every number carries a comparison to the prior month and a plain-language interpretation the founder reads in 7 minutes.
Metrics that matter for content marketing
Metrics that matter for food brand content marketing: organic sessions by pillar, recipe rich result impressions in Search Console, organic conversion rate to hero SKU pages, organic-attributed DTC revenue, and top 20 ranking positions by monthly organic sessions. Vanity metrics that do not matter: total pageviews without conversion context, average time on page without conversion attribution, and social share counts. The monthly report skips the vanity block entirely.
Quarterly business review structure
The quarterly business review runs 90 minutes with the founder, head of content, and SEO lead. Agenda: organic traffic trend by pillar, top 10 winning content pieces, top 10 losing content pieces (candidates for refresh or removal), competitive gap analysis against 5 named competitor brands, and next quarter’s content calendar with recipes and ingredient guides queued. According to Ahrefs content marketing research, brands running quarterly content audits outperform brands running annual audits by 40 to 70 percent on organic revenue over a 24-month window.
Internal linking discipline across food brand content
Internal linking discipline across food brand content moves authority from recipe pages toward hero SKU product pages and comparison guides. Every recipe links to the hero SKU it uses inline (once in the ingredient list, once in a bottom call-out card). Every ingredient comparison guide links to 3 to 6 recipes using the winning ingredient plus the hero SKU product page. Every sourcing story links to the 2 to 4 SKUs sourced from that specific farm or cooperative.
Anchor text strategy across recipe hubs
Anchor text on internal links varies across recipe hubs to avoid over-optimization patterns Google penalizes. Exact-match anchor (“single-origin Ethiopian coffee”) runs on 20 to 30 percent of internal links. Partial-match variations (“our Ethiopian roast”) run on 30 to 40 percent. Branded anchors (the SKU name) run on 20 to 30 percent. Generic anchors (“shop the coffee”) fill the remaining 10 to 20 percent. This ratio holds ranking without triggering the over-optimization penalty that shows up on brands that anchor-text-stuff every internal link with the same exact-match keyword. Cross-reference the linking layer on our food and beverage web design page.
Link equity from ingredient guides to SKU pages
Link equity from ingredient guides passes to SKU pages when the guide’s comparison table names the hero SKU in the winning column with a product card, and when the guide’s body links to 3 to 6 recipes that use the winning ingredient. This 3-hop path (guide to recipe to SKU) pushes authority from a high-traffic informational query down to a high-intent transactional page. According to Search Engine Land SEO coverage, informational content that internally links to transactional pages produces 2 to 4 times higher organic revenue than isolated content silos.
Wrapping up content marketing for food brands
Content marketing for food brands is the organic engine that turns a DTC snack, drink, or CPG storefront into a search-driven revenue channel. Recipe hub of 40 to 100 recipes. Ingredient comparison guides at 12 to 24 pieces. Sourcing story pages at 6 to 12 pieces. Buyer intent content at 8 to 16 pieces. Creator syndication calendar with 12 to 30 creators per quarter. Refresh cadence at 12 to 24 months by pillar. Reporting with organic sessions and organic revenue attribution.
If your DTC food brand is running paid social at 20,000 dollars monthly with a broken blog and zero recipe schema, professional content marketing for food brands pays for itself inside the first 90 days on organic traffic captured. Redefine Web ships content marketing inside our monthly retainer packages. Book a call and we will walk through the last three DTC food brands we built recipe hubs for, pillar by pillar.
Content marketing for food brands starts with a recipe hub because recipe queries account for 40 to 60 percent of high-intent search volume in the food category. Every hero SKU needs 4 to 12 recipes anchored to it, each targeting a specific occasion and audience.
Skip the recipe hub and the brand loses the search real estate that pulls DTC storefront traffic month over month at zero incremental paid cost. Recipe traffic converts at 2 to 4 percent because the shopper landed with usage intent, not passive discovery, which is why food brands win on recipes.
Recipe schema and Google rich result eligibility
Every recipe page ships schema.org Recipe markup including cookTime, prepTime, recipeIngredient, recipeInstructions, nutrition, and aggregateRating. Correctly marked-up recipes qualify for Google’s recipe rich result carousel that pulls 3 to 6 times higher click-through rate than a plain blue link. The schema layer takes 15 minutes per recipe to author and 30 minutes to validate in Google Search Console. Cross-reference the recipe search stack on our food and beverage SEO page.
Recipe hub structure that scales
The recipe hub structure runs 40 to 100 recipes at maturity, organized by hero SKU (4 to 12 recipes per SKU) plus occasion tags (breakfast, weeknight dinner, meal prep, brunch, holiday). Every recipe links back to the hero SKU product page with the SKU embedded in an inline card. The hub earns internal linking value from ingredient comparison guides and the sourcing story pages, which feeds recipe ranking on Google. According to Google Search Central recipe structured data guidance, complete Recipe schema markup is required for eligibility in the recipe carousel and the ingredient search filter.
Pillar structure for food brand content marketing
The pillar structure on content marketing for food brands runs 4 content pillars concurrently: recipe hub (40 to 100 recipes), ingredient comparison guides (12 to 24 guides), sourcing story pages (6 to 12 pages), and buyer intent content (where to buy, subscription vs. one-time, gift bundle guides). Every pillar covers a distinct search intent and every pillar links back to the hero SKU product pages.
Ingredient comparison guide format
Ingredient comparison guides run 1,800 to 3,200 words comparing 2 to 4 ingredient types on 6 to 10 attributes with a comparison table, real-world use case examples, and links to the hero SKU that uses the specific ingredient. Example: organic vs. conventional oats compares nutritional profile, sourcing chain, cost, environmental impact, and taste on a 6-column table. The brand’s SKU appears in the winning column with a product card. These guides rank 3 to 8 months after publication and pull steady-state organic traffic.
Sourcing story pages that build trust
Sourcing story pages name the specific farms, cooperatives, or suppliers the brand sources from, with photos of the farms, farmer quotes, and specific harvest windows. A coffee brand’s Ethiopian farm page ranks for “single-origin Ethiopian coffee” and “Yirgacheffe coffee origin” plus 40 long-tail variations. The sourcing page pulls trust-building traffic that converts at 4 to 6 percent because the shopper landed pattern-matching on transparency and named provenance. Every sourcing page includes farmer or cooperative quotes, harvest dates, and a link back to 3 to 5 hero SKU pages that source from the named supplier.
Vejrø hospitality content case study
Vejrø Resort, a Danish private-island destination with an on-site restaurant focused on organic, locally sourced cuisine, joined us with strong social engagement and no organic-search real estate. Guests found the resort on Instagram but never in Google search for terms like “private island resort Denmark,” “farm-to-table hospitality Denmark,” or “Vejrø restaurant.” The same organic-search gap shows up on DTC food brands running paid social at 20,000 dollars monthly with a broken blog and zero recipe schema.
We built the conversion-focused website with on-site and off-site SEO tuned to the travel-niche keyword clusters, competitor analysis against comparable boutique resorts, and mobile-first design prioritizing guest discovery. Every page carried the structured data qualifying it for Google’s rich results in the hospitality category. Every internal link pushed authority toward the direct-booking conversion path.
Three months later, Vejrø hit 10,000 plus organic visitors, ranked for 200 plus first-page keywords, and pulled a 2.2 percent booking conversion rate from organic traffic. The same pattern applies to content marketing for food brands: recipe schema, ingredient comparison guides, and sourcing story pages pull organic traffic at 20 to 40 percent conversion into hero SKU pages inside 6 months when the content quality matches search intent and every page carries the right structured data markup. Vejrø also proved out the reporting discipline: every monthly report named the exact page, the exact keyword cluster, and the exact search feature (rich result, sitelinks, image pack) driving the incremental organic revenue instead of hiding behind aggregate traffic charts.
Recipe cadence and content calendar for food brands
Recipe cadence on a working food brand content calendar ships 2 to 4 new recipes per week during the first 6 months and drops to 1 per week at maturity. Each recipe takes 4 to 6 hours to produce (write, test in the kitchen, photograph, schema author, publish). At 3 recipes per week, the brand hits 78 recipes inside 6 months plus a backlog of ingredient comparison and sourcing content queued behind the recipe production line.
| Content pillar | Target volume year 1 | Production cost per piece | Refresh cadence |
|---|---|---|---|
| Recipe hub | 40 to 100 recipes | $180 to $320 | Every 12 months |
| Ingredient comparison guides | 12 to 24 guides | $450 to $780 | Every 18 months |
| Sourcing story pages | 6 to 12 pages | $680 to $1,200 | Every 24 months |
| Buyer intent content | 8 to 16 pieces | $220 to $420 | Every 12 months |
Photography as a content calendar constraint
Photography is the actual constraint on recipe cadence, not writing. Every recipe needs 6 to 12 photos: hero shot, ingredient flat lay, prep in progress, plated result, storage, and step shots for the schema markup. A working food brand batches photography 8 recipes at a time to keep the cost per recipe under 200 dollars. Skip the batching and the per-recipe cost climbs to 400 to 600 dollars, which caps recipe cadence at 1 per week and slows organic ranking timeline by 6 months.
Seasonal content calendar planning
Seasonal content calendar planning maps recipes and comparison guides to the seasonal windows they need to rank in. A Christmas cookie recipe needs to publish in September to rank by early December. A Valentine’s chocolate guide needs to publish in November to rank by early February. A back-to-school lunchbox recipe needs to publish in June to rank by late August. The 60-to-90-day ranking curve dictates the calendar.
Creator syndication inside food brand content
Creator syndication on food brand content marketing amplifies the recipe hub through Instagram Reels, TikTok, and YouTube Shorts creators paid to post their own version of the brand’s hero recipes. The creator content pulls net-new audiences into the recipe hub through the creator’s Link in Bio or Amazon Storefront tag. The syndication calendar names 12 to 30 creators per quarter with specific recipes assigned to each.
One brand we picked up had a spreadsheet titled “creator outreach 2023” with 47 rows and 3 responses. All 3 responses were auto-replies. The spreadsheet named zero recipes and offered flat rates below 100 dollars per post. Nobody posts a 30-second video for 87 dollars flat. Nobody.
Creator content commercial terms that work
Working creator content commercial terms run 350 to 1,500 dollars flat per post plus a 12 to 25 percent commission on tagged sales across a 30-day window. The commission mechanic pulls creators into follow-up posts because the incremental revenue continues past the initial fee. Mid-tier creators (30k to 150k followers) hit the sweet spot for food brand content because their engagement rate typically runs 4 to 8 percent versus 0.8 to 1.6 percent on mega-creators.
Content brief structure for creator partnerships
The content brief structure for creator partnerships runs a single page: the SKU, the specific recipe or usage occasion, 3 required brand mentions, 3 restricted claims (no health claims on non-medical SKUs), the pricing angle, the affiliate link, and 3 example videos that hit the tone. The brief avoids over-scripting because over-scripted creator content underperforms native creator voice by 40 to 60 percent on engagement rate.
Buyer intent content for food brand blogs
Buyer intent content on food brand blogs covers 8 to 16 pieces targeting explicit purchase-decision queries: “where to buy [brand],” “[brand] subscription vs. one-time,” “best [category] for [use case],” and “[brand] gift bundle.” Every buyer intent piece runs 1,400 to 2,400 words with a comparison table, product cards, and a clear conversion path to the specific SKU that matches the query intent. Buyer intent content converts at 3 to 6 percent versus 1 to 2 percent on recipe content because the shopper landed already planning to buy, not exploring a usage occasion.
Where-to-buy content structure
Where-to-buy content structure covers online (DTC storefront, Amazon, Target.com, Whole Foods online), retail (specific chain locators with the store finder embedded), and international (customs limitations, retailer partners abroad). Every piece names specific retailers, links to the store locator, and includes an FAQ block covering shipping availability, subscription options, and gift card compatibility. Where-to-buy content ranks for branded discovery queries the DTC storefront otherwise loses to competitor affiliate reviews.
Subscription versus one-time comparison content
Subscription versus one-time comparison content converts subscription commitments at 3 to 6 percent because it addresses the price-sensitivity concern head-on with a specific math table. The piece covers the discount structure (15 percent lifetime), the skip-a-month mechanic, the pause-anytime rule, the cancellation policy, and the specific yearly savings for the brand’s average consumption cadence. Cross-reference the retention structure on our food and beverage marketing retainer page.
Content refresh cadence on food brand pillars
Content refresh cadence on food brand content pillars runs a rolling audit every 12 to 24 months by pillar. Recipes get refreshed every 12 months with new photography, updated schema, and any nutrition or ingredient adjustments. Ingredient comparison guides refresh every 18 months to update market data. Sourcing story pages refresh every 24 months to reflect farm partnership changes and new harvest angles. Buyer intent content refreshes every 12 months to update retailer availability and pricing.
Recipe refresh priority order
Recipe refresh priority runs by organic traffic rank. The top 20 recipes by monthly organic sessions get refreshed first (new photography, schema audit, related recipe internal links, updated nutrition). The next 40 get refreshed at 15 months. The remaining recipes get refreshed opportunistically when the ranking slips past position 15 in Google. Skipping the refresh cadence lets recipe rankings drift out of the top 3 inside 18 months as newer competitor recipes take the position.
Schema audit checklist per refresh
The schema audit checklist per refresh runs 8 items: Recipe schema completeness, aggregateRating count and accuracy, nutrition data accuracy, prepTime and cookTime match the recipe body, image URLs valid at CDN, related recipe internal links working, product card SKU URL live, and Google Search Console rich result eligibility validated. This checklist takes 20 minutes per recipe and prevents the schema drift that costs recipe rankings 20 to 40 positions quietly.
Reporting cadence for food brand content marketing
Reporting cadence on food brand content marketing runs a monthly executive report plus a quarterly business review. The monthly report ships in the first business week and covers organic sessions by pillar, top 10 ranking recipes with position trend, ingredient guide ranking movements, sourcing page performance, and organic-attributed DTC revenue. Every number carries a comparison to the prior month and a plain-language interpretation the founder reads in 7 minutes.
Metrics that matter for content marketing
Metrics that matter for food brand content marketing: organic sessions by pillar, recipe rich result impressions in Search Console, organic conversion rate to hero SKU pages, organic-attributed DTC revenue, and top 20 ranking positions by monthly organic sessions. Vanity metrics that do not matter: total pageviews without conversion context, average time on page without conversion attribution, and social share counts. The monthly report skips the vanity block entirely.
Quarterly business review structure
The quarterly business review runs 90 minutes with the founder, head of content, and SEO lead. Agenda: organic traffic trend by pillar, top 10 winning content pieces, top 10 losing content pieces (candidates for refresh or removal), competitive gap analysis against 5 named competitor brands, and next quarter’s content calendar with recipes and ingredient guides queued. According to Ahrefs content marketing research, brands running quarterly content audits outperform brands running annual audits by 40 to 70 percent on organic revenue over a 24-month window.
Internal linking discipline across food brand content
Internal linking discipline across food brand content moves authority from recipe pages toward hero SKU product pages and comparison guides. Every recipe links to the hero SKU it uses inline (once in the ingredient list, once in a bottom call-out card). Every ingredient comparison guide links to 3 to 6 recipes using the winning ingredient plus the hero SKU product page. Every sourcing story links to the 2 to 4 SKUs sourced from that specific farm or cooperative.
Anchor text strategy across recipe hubs
Anchor text on internal links varies across recipe hubs to avoid over-optimization patterns Google penalizes. Exact-match anchor (“single-origin Ethiopian coffee”) runs on 20 to 30 percent of internal links. Partial-match variations (“our Ethiopian roast”) run on 30 to 40 percent. Branded anchors (the SKU name) run on 20 to 30 percent. Generic anchors (“shop the coffee”) fill the remaining 10 to 20 percent. This ratio holds ranking without triggering the over-optimization penalty that shows up on brands that anchor-text-stuff every internal link with the same exact-match keyword. Cross-reference the linking layer on our food and beverage web design page.
Link equity from ingredient guides to SKU pages
Link equity from ingredient guides passes to SKU pages when the guide’s comparison table names the hero SKU in the winning column with a product card, and when the guide’s body links to 3 to 6 recipes that use the winning ingredient. This 3-hop path (guide to recipe to SKU) pushes authority from a high-traffic informational query down to a high-intent transactional page. According to Search Engine Land SEO coverage, informational content that internally links to transactional pages produces 2 to 4 times higher organic revenue than isolated content silos.
Wrapping up content marketing for food brands
Content marketing for food brands is the organic engine that turns a DTC snack, drink, or CPG storefront into a search-driven revenue channel. Recipe hub of 40 to 100 recipes. Ingredient comparison guides at 12 to 24 pieces. Sourcing story pages at 6 to 12 pieces. Buyer intent content at 8 to 16 pieces. Creator syndication calendar with 12 to 30 creators per quarter. Refresh cadence at 12 to 24 months by pillar. Reporting with organic sessions and organic revenue attribution.
If your DTC food brand is running paid social at 20,000 dollars monthly with a broken blog and zero recipe schema, professional content marketing for food brands pays for itself inside the first 90 days on organic traffic captured. Redefine Web ships content marketing inside our monthly retainer packages. Book a call and we will walk through the last three DTC food brands we built recipe hubs for, pillar by pillar.
Anchor text on internal links varies across recipe hubs to avoid over-optimization patterns Google penalizes. Exact-match anchor (“single-origin Ethiopian coffee”) runs on 20 to 30 percent of internal links. Partial-match variations (“our Ethiopian roast”) run on 30 to 40 percent. Branded anchors (the SKU name) run on 20 to 30 percent. Generic anchors (“shop the coffee”) fill the remaining 10 to 20 percent. This ratio holds ranking without triggering the over-optimization penalty that shows up on brands that anchor-text-stuff every internal link with the same exact-match keyword. Cross-reference the linking layer on our food and beverage web design page.
Link equity from ingredient guides to SKU pages
Link equity from ingredient guides passes to SKU pages when the guide’s comparison table names the hero SKU in the winning column with a product card, and when the guide’s body links to 3 to 6 recipes that use the winning ingredient. This 3-hop path (guide to recipe to SKU) pushes authority from a high-traffic informational query down to a high-intent transactional page. According to Search Engine Land SEO coverage, informational content that internally links to transactional pages produces 2 to 4 times higher organic revenue than isolated content silos.
Wrapping up content marketing for food brands
Content marketing for food brands is the organic engine that turns a DTC snack, drink, or CPG storefront into a search-driven revenue channel. Recipe hub of 40 to 100 recipes. Ingredient comparison guides at 12 to 24 pieces. Sourcing story pages at 6 to 12 pieces. Buyer intent content at 8 to 16 pieces. Creator syndication calendar with 12 to 30 creators per quarter. Refresh cadence at 12 to 24 months by pillar. Reporting with organic sessions and organic revenue attribution.
If your DTC food brand is running paid social at 20,000 dollars monthly with a broken blog and zero recipe schema, professional content marketing for food brands pays for itself inside the first 90 days on organic traffic captured. Redefine Web ships content marketing inside our monthly retainer packages. Book a call and we will walk through the last three DTC food brands we built recipe hubs for, pillar by pillar.
Content marketing for food brands starts with a recipe hub because recipe queries account for 40 to 60 percent of high-intent search volume in the food category. Every hero SKU needs 4 to 12 recipes anchored to it, each targeting a specific occasion and audience.
Skip the recipe hub and the brand loses the search real estate that pulls DTC storefront traffic month over month at zero incremental paid cost. Recipe traffic converts at 2 to 4 percent because the shopper landed with usage intent, not passive discovery, which is why food brands win on recipes.
Recipe schema and Google rich result eligibility
Every recipe page ships schema.org Recipe markup including cookTime, prepTime, recipeIngredient, recipeInstructions, nutrition, and aggregateRating. Correctly marked-up recipes qualify for Google’s recipe rich result carousel that pulls 3 to 6 times higher click-through rate than a plain blue link. The schema layer takes 15 minutes per recipe to author and 30 minutes to validate in Google Search Console. Cross-reference the recipe search stack on our food and beverage SEO page.
Recipe hub structure that scales
The recipe hub structure runs 40 to 100 recipes at maturity, organized by hero SKU (4 to 12 recipes per SKU) plus occasion tags (breakfast, weeknight dinner, meal prep, brunch, holiday). Every recipe links back to the hero SKU product page with the SKU embedded in an inline card. The hub earns internal linking value from ingredient comparison guides and the sourcing story pages, which feeds recipe ranking on Google. According to Google Search Central recipe structured data guidance, complete Recipe schema markup is required for eligibility in the recipe carousel and the ingredient search filter.
Pillar structure for food brand content marketing
The pillar structure on content marketing for food brands runs 4 content pillars concurrently: recipe hub (40 to 100 recipes), ingredient comparison guides (12 to 24 guides), sourcing story pages (6 to 12 pages), and buyer intent content (where to buy, subscription vs. one-time, gift bundle guides). Every pillar covers a distinct search intent and every pillar links back to the hero SKU product pages.
Ingredient comparison guide format
Ingredient comparison guides run 1,800 to 3,200 words comparing 2 to 4 ingredient types on 6 to 10 attributes with a comparison table, real-world use case examples, and links to the hero SKU that uses the specific ingredient. Example: organic vs. conventional oats compares nutritional profile, sourcing chain, cost, environmental impact, and taste on a 6-column table. The brand’s SKU appears in the winning column with a product card. These guides rank 3 to 8 months after publication and pull steady-state organic traffic.
Sourcing story pages that build trust
Sourcing story pages name the specific farms, cooperatives, or suppliers the brand sources from, with photos of the farms, farmer quotes, and specific harvest windows. A coffee brand’s Ethiopian farm page ranks for “single-origin Ethiopian coffee” and “Yirgacheffe coffee origin” plus 40 long-tail variations. The sourcing page pulls trust-building traffic that converts at 4 to 6 percent because the shopper landed pattern-matching on transparency and named provenance. Every sourcing page includes farmer or cooperative quotes, harvest dates, and a link back to 3 to 5 hero SKU pages that source from the named supplier.
Vejrø hospitality content case study
Vejrø Resort, a Danish private-island destination with an on-site restaurant focused on organic, locally sourced cuisine, joined us with strong social engagement and no organic-search real estate. Guests found the resort on Instagram but never in Google search for terms like “private island resort Denmark,” “farm-to-table hospitality Denmark,” or “Vejrø restaurant.” The same organic-search gap shows up on DTC food brands running paid social at 20,000 dollars monthly with a broken blog and zero recipe schema.
We built the conversion-focused website with on-site and off-site SEO tuned to the travel-niche keyword clusters, competitor analysis against comparable boutique resorts, and mobile-first design prioritizing guest discovery. Every page carried the structured data qualifying it for Google’s rich results in the hospitality category. Every internal link pushed authority toward the direct-booking conversion path.
Three months later, Vejrø hit 10,000 plus organic visitors, ranked for 200 plus first-page keywords, and pulled a 2.2 percent booking conversion rate from organic traffic. The same pattern applies to content marketing for food brands: recipe schema, ingredient comparison guides, and sourcing story pages pull organic traffic at 20 to 40 percent conversion into hero SKU pages inside 6 months when the content quality matches search intent and every page carries the right structured data markup. Vejrø also proved out the reporting discipline: every monthly report named the exact page, the exact keyword cluster, and the exact search feature (rich result, sitelinks, image pack) driving the incremental organic revenue instead of hiding behind aggregate traffic charts.
Recipe cadence and content calendar for food brands
Recipe cadence on a working food brand content calendar ships 2 to 4 new recipes per week during the first 6 months and drops to 1 per week at maturity. Each recipe takes 4 to 6 hours to produce (write, test in the kitchen, photograph, schema author, publish). At 3 recipes per week, the brand hits 78 recipes inside 6 months plus a backlog of ingredient comparison and sourcing content queued behind the recipe production line.
| Content pillar | Target volume year 1 | Production cost per piece | Refresh cadence |
|---|---|---|---|
| Recipe hub | 40 to 100 recipes | $180 to $320 | Every 12 months |
| Ingredient comparison guides | 12 to 24 guides | $450 to $780 | Every 18 months |
| Sourcing story pages | 6 to 12 pages | $680 to $1,200 | Every 24 months |
| Buyer intent content | 8 to 16 pieces | $220 to $420 | Every 12 months |
Photography as a content calendar constraint
Photography is the actual constraint on recipe cadence, not writing. Every recipe needs 6 to 12 photos: hero shot, ingredient flat lay, prep in progress, plated result, storage, and step shots for the schema markup. A working food brand batches photography 8 recipes at a time to keep the cost per recipe under 200 dollars. Skip the batching and the per-recipe cost climbs to 400 to 600 dollars, which caps recipe cadence at 1 per week and slows organic ranking timeline by 6 months.
Seasonal content calendar planning
Seasonal content calendar planning maps recipes and comparison guides to the seasonal windows they need to rank in. A Christmas cookie recipe needs to publish in September to rank by early December. A Valentine’s chocolate guide needs to publish in November to rank by early February. A back-to-school lunchbox recipe needs to publish in June to rank by late August. The 60-to-90-day ranking curve dictates the calendar.
Creator syndication inside food brand content
Creator syndication on food brand content marketing amplifies the recipe hub through Instagram Reels, TikTok, and YouTube Shorts creators paid to post their own version of the brand’s hero recipes. The creator content pulls net-new audiences into the recipe hub through the creator’s Link in Bio or Amazon Storefront tag. The syndication calendar names 12 to 30 creators per quarter with specific recipes assigned to each.
One brand we picked up had a spreadsheet titled “creator outreach 2023” with 47 rows and 3 responses. All 3 responses were auto-replies. The spreadsheet named zero recipes and offered flat rates below 100 dollars per post. Nobody posts a 30-second video for 87 dollars flat. Nobody.
Creator content commercial terms that work
Working creator content commercial terms run 350 to 1,500 dollars flat per post plus a 12 to 25 percent commission on tagged sales across a 30-day window. The commission mechanic pulls creators into follow-up posts because the incremental revenue continues past the initial fee. Mid-tier creators (30k to 150k followers) hit the sweet spot for food brand content because their engagement rate typically runs 4 to 8 percent versus 0.8 to 1.6 percent on mega-creators.
Content brief structure for creator partnerships
The content brief structure for creator partnerships runs a single page: the SKU, the specific recipe or usage occasion, 3 required brand mentions, 3 restricted claims (no health claims on non-medical SKUs), the pricing angle, the affiliate link, and 3 example videos that hit the tone. The brief avoids over-scripting because over-scripted creator content underperforms native creator voice by 40 to 60 percent on engagement rate.
Buyer intent content for food brand blogs
Buyer intent content on food brand blogs covers 8 to 16 pieces targeting explicit purchase-decision queries: “where to buy [brand],” “[brand] subscription vs. one-time,” “best [category] for [use case],” and “[brand] gift bundle.” Every buyer intent piece runs 1,400 to 2,400 words with a comparison table, product cards, and a clear conversion path to the specific SKU that matches the query intent. Buyer intent content converts at 3 to 6 percent versus 1 to 2 percent on recipe content because the shopper landed already planning to buy, not exploring a usage occasion.
Where-to-buy content structure
Where-to-buy content structure covers online (DTC storefront, Amazon, Target.com, Whole Foods online), retail (specific chain locators with the store finder embedded), and international (customs limitations, retailer partners abroad). Every piece names specific retailers, links to the store locator, and includes an FAQ block covering shipping availability, subscription options, and gift card compatibility. Where-to-buy content ranks for branded discovery queries the DTC storefront otherwise loses to competitor affiliate reviews.
Subscription versus one-time comparison content
Subscription versus one-time comparison content converts subscription commitments at 3 to 6 percent because it addresses the price-sensitivity concern head-on with a specific math table. The piece covers the discount structure (15 percent lifetime), the skip-a-month mechanic, the pause-anytime rule, the cancellation policy, and the specific yearly savings for the brand’s average consumption cadence. Cross-reference the retention structure on our food and beverage marketing retainer page.
Content refresh cadence on food brand pillars
Content refresh cadence on food brand content pillars runs a rolling audit every 12 to 24 months by pillar. Recipes get refreshed every 12 months with new photography, updated schema, and any nutrition or ingredient adjustments. Ingredient comparison guides refresh every 18 months to update market data. Sourcing story pages refresh every 24 months to reflect farm partnership changes and new harvest angles. Buyer intent content refreshes every 12 months to update retailer availability and pricing.
Recipe refresh priority order
Recipe refresh priority runs by organic traffic rank. The top 20 recipes by monthly organic sessions get refreshed first (new photography, schema audit, related recipe internal links, updated nutrition). The next 40 get refreshed at 15 months. The remaining recipes get refreshed opportunistically when the ranking slips past position 15 in Google. Skipping the refresh cadence lets recipe rankings drift out of the top 3 inside 18 months as newer competitor recipes take the position.
Schema audit checklist per refresh
The schema audit checklist per refresh runs 8 items: Recipe schema completeness, aggregateRating count and accuracy, nutrition data accuracy, prepTime and cookTime match the recipe body, image URLs valid at CDN, related recipe internal links working, product card SKU URL live, and Google Search Console rich result eligibility validated. This checklist takes 20 minutes per recipe and prevents the schema drift that costs recipe rankings 20 to 40 positions quietly.
Reporting cadence for food brand content marketing
Reporting cadence on food brand content marketing runs a monthly executive report plus a quarterly business review. The monthly report ships in the first business week and covers organic sessions by pillar, top 10 ranking recipes with position trend, ingredient guide ranking movements, sourcing page performance, and organic-attributed DTC revenue. Every number carries a comparison to the prior month and a plain-language interpretation the founder reads in 7 minutes.
Metrics that matter for content marketing
Metrics that matter for food brand content marketing: organic sessions by pillar, recipe rich result impressions in Search Console, organic conversion rate to hero SKU pages, organic-attributed DTC revenue, and top 20 ranking positions by monthly organic sessions. Vanity metrics that do not matter: total pageviews without conversion context, average time on page without conversion attribution, and social share counts. The monthly report skips the vanity block entirely.
Quarterly business review structure
The quarterly business review runs 90 minutes with the founder, head of content, and SEO lead. Agenda: organic traffic trend by pillar, top 10 winning content pieces, top 10 losing content pieces (candidates for refresh or removal), competitive gap analysis against 5 named competitor brands, and next quarter’s content calendar with recipes and ingredient guides queued. According to Ahrefs content marketing research, brands running quarterly content audits outperform brands running annual audits by 40 to 70 percent on organic revenue over a 24-month window.
Internal linking discipline across food brand content
Internal linking discipline across food brand content moves authority from recipe pages toward hero SKU product pages and comparison guides. Every recipe links to the hero SKU it uses inline (once in the ingredient list, once in a bottom call-out card). Every ingredient comparison guide links to 3 to 6 recipes using the winning ingredient plus the hero SKU product page. Every sourcing story links to the 2 to 4 SKUs sourced from that specific farm or cooperative.
Anchor text strategy across recipe hubs
Anchor text on internal links varies across recipe hubs to avoid over-optimization patterns Google penalizes. Exact-match anchor (“single-origin Ethiopian coffee”) runs on 20 to 30 percent of internal links. Partial-match variations (“our Ethiopian roast”) run on 30 to 40 percent. Branded anchors (the SKU name) run on 20 to 30 percent. Generic anchors (“shop the coffee”) fill the remaining 10 to 20 percent. This ratio holds ranking without triggering the over-optimization penalty that shows up on brands that anchor-text-stuff every internal link with the same exact-match keyword. Cross-reference the linking layer on our food and beverage web design page.
Link equity from ingredient guides to SKU pages
Link equity from ingredient guides passes to SKU pages when the guide’s comparison table names the hero SKU in the winning column with a product card, and when the guide’s body links to 3 to 6 recipes that use the winning ingredient. This 3-hop path (guide to recipe to SKU) pushes authority from a high-traffic informational query down to a high-intent transactional page. According to Search Engine Land SEO coverage, informational content that internally links to transactional pages produces 2 to 4 times higher organic revenue than isolated content silos.
Wrapping up content marketing for food brands
Content marketing for food brands is the organic engine that turns a DTC snack, drink, or CPG storefront into a search-driven revenue channel. Recipe hub of 40 to 100 recipes. Ingredient comparison guides at 12 to 24 pieces. Sourcing story pages at 6 to 12 pieces. Buyer intent content at 8 to 16 pieces. Creator syndication calendar with 12 to 30 creators per quarter. Refresh cadence at 12 to 24 months by pillar. Reporting with organic sessions and organic revenue attribution.
If your DTC food brand is running paid social at 20,000 dollars monthly with a broken blog and zero recipe schema, professional content marketing for food brands pays for itself inside the first 90 days on organic traffic captured. Redefine Web ships content marketing inside our monthly retainer packages. Book a call and we will walk through the last three DTC food brands we built recipe hubs for, pillar by pillar.
Internal linking discipline across food brand content moves authority from recipe pages toward hero SKU product pages and comparison guides. Every recipe links to the hero SKU it uses inline (once in the ingredient list, once in a bottom call-out card). Every ingredient comparison guide links to 3 to 6 recipes using the winning ingredient plus the hero SKU product page. Every sourcing story links to the 2 to 4 SKUs sourced from that specific farm or cooperative.
Anchor text strategy across recipe hubs
Anchor text on internal links varies across recipe hubs to avoid over-optimization patterns Google penalizes. Exact-match anchor (“single-origin Ethiopian coffee”) runs on 20 to 30 percent of internal links. Partial-match variations (“our Ethiopian roast”) run on 30 to 40 percent. Branded anchors (the SKU name) run on 20 to 30 percent. Generic anchors (“shop the coffee”) fill the remaining 10 to 20 percent. This ratio holds ranking without triggering the over-optimization penalty that shows up on brands that anchor-text-stuff every internal link with the same exact-match keyword. Cross-reference the linking layer on our food and beverage web design page.
Link equity from ingredient guides to SKU pages
Link equity from ingredient guides passes to SKU pages when the guide’s comparison table names the hero SKU in the winning column with a product card, and when the guide’s body links to 3 to 6 recipes that use the winning ingredient. This 3-hop path (guide to recipe to SKU) pushes authority from a high-traffic informational query down to a high-intent transactional page. According to Search Engine Land SEO coverage, informational content that internally links to transactional pages produces 2 to 4 times higher organic revenue than isolated content silos.
Wrapping up content marketing for food brands
Content marketing for food brands is the organic engine that turns a DTC snack, drink, or CPG storefront into a search-driven revenue channel. Recipe hub of 40 to 100 recipes. Ingredient comparison guides at 12 to 24 pieces. Sourcing story pages at 6 to 12 pieces. Buyer intent content at 8 to 16 pieces. Creator syndication calendar with 12 to 30 creators per quarter. Refresh cadence at 12 to 24 months by pillar. Reporting with organic sessions and organic revenue attribution.
If your DTC food brand is running paid social at 20,000 dollars monthly with a broken blog and zero recipe schema, professional content marketing for food brands pays for itself inside the first 90 days on organic traffic captured. Redefine Web ships content marketing inside our monthly retainer packages. Book a call and we will walk through the last three DTC food brands we built recipe hubs for, pillar by pillar.
Content marketing for food brands starts with a recipe hub because recipe queries account for 40 to 60 percent of high-intent search volume in the food category. Every hero SKU needs 4 to 12 recipes anchored to it, each targeting a specific occasion and audience.
Skip the recipe hub and the brand loses the search real estate that pulls DTC storefront traffic month over month at zero incremental paid cost. Recipe traffic converts at 2 to 4 percent because the shopper landed with usage intent, not passive discovery, which is why food brands win on recipes.
Recipe schema and Google rich result eligibility
Every recipe page ships schema.org Recipe markup including cookTime, prepTime, recipeIngredient, recipeInstructions, nutrition, and aggregateRating. Correctly marked-up recipes qualify for Google’s recipe rich result carousel that pulls 3 to 6 times higher click-through rate than a plain blue link. The schema layer takes 15 minutes per recipe to author and 30 minutes to validate in Google Search Console. Cross-reference the recipe search stack on our food and beverage SEO page.
Recipe hub structure that scales
The recipe hub structure runs 40 to 100 recipes at maturity, organized by hero SKU (4 to 12 recipes per SKU) plus occasion tags (breakfast, weeknight dinner, meal prep, brunch, holiday). Every recipe links back to the hero SKU product page with the SKU embedded in an inline card. The hub earns internal linking value from ingredient comparison guides and the sourcing story pages, which feeds recipe ranking on Google. According to Google Search Central recipe structured data guidance, complete Recipe schema markup is required for eligibility in the recipe carousel and the ingredient search filter.
Pillar structure for food brand content marketing
The pillar structure on content marketing for food brands runs 4 content pillars concurrently: recipe hub (40 to 100 recipes), ingredient comparison guides (12 to 24 guides), sourcing story pages (6 to 12 pages), and buyer intent content (where to buy, subscription vs. one-time, gift bundle guides). Every pillar covers a distinct search intent and every pillar links back to the hero SKU product pages.
Ingredient comparison guide format
Ingredient comparison guides run 1,800 to 3,200 words comparing 2 to 4 ingredient types on 6 to 10 attributes with a comparison table, real-world use case examples, and links to the hero SKU that uses the specific ingredient. Example: organic vs. conventional oats compares nutritional profile, sourcing chain, cost, environmental impact, and taste on a 6-column table. The brand’s SKU appears in the winning column with a product card. These guides rank 3 to 8 months after publication and pull steady-state organic traffic.
Sourcing story pages that build trust
Sourcing story pages name the specific farms, cooperatives, or suppliers the brand sources from, with photos of the farms, farmer quotes, and specific harvest windows. A coffee brand’s Ethiopian farm page ranks for “single-origin Ethiopian coffee” and “Yirgacheffe coffee origin” plus 40 long-tail variations. The sourcing page pulls trust-building traffic that converts at 4 to 6 percent because the shopper landed pattern-matching on transparency and named provenance. Every sourcing page includes farmer or cooperative quotes, harvest dates, and a link back to 3 to 5 hero SKU pages that source from the named supplier.
Vejrø hospitality content case study
Vejrø Resort, a Danish private-island destination with an on-site restaurant focused on organic, locally sourced cuisine, joined us with strong social engagement and no organic-search real estate. Guests found the resort on Instagram but never in Google search for terms like “private island resort Denmark,” “farm-to-table hospitality Denmark,” or “Vejrø restaurant.” The same organic-search gap shows up on DTC food brands running paid social at 20,000 dollars monthly with a broken blog and zero recipe schema.
We built the conversion-focused website with on-site and off-site SEO tuned to the travel-niche keyword clusters, competitor analysis against comparable boutique resorts, and mobile-first design prioritizing guest discovery. Every page carried the structured data qualifying it for Google’s rich results in the hospitality category. Every internal link pushed authority toward the direct-booking conversion path.
Three months later, Vejrø hit 10,000 plus organic visitors, ranked for 200 plus first-page keywords, and pulled a 2.2 percent booking conversion rate from organic traffic. The same pattern applies to content marketing for food brands: recipe schema, ingredient comparison guides, and sourcing story pages pull organic traffic at 20 to 40 percent conversion into hero SKU pages inside 6 months when the content quality matches search intent and every page carries the right structured data markup. Vejrø also proved out the reporting discipline: every monthly report named the exact page, the exact keyword cluster, and the exact search feature (rich result, sitelinks, image pack) driving the incremental organic revenue instead of hiding behind aggregate traffic charts.
Recipe cadence and content calendar for food brands
Recipe cadence on a working food brand content calendar ships 2 to 4 new recipes per week during the first 6 months and drops to 1 per week at maturity. Each recipe takes 4 to 6 hours to produce (write, test in the kitchen, photograph, schema author, publish). At 3 recipes per week, the brand hits 78 recipes inside 6 months plus a backlog of ingredient comparison and sourcing content queued behind the recipe production line.
| Content pillar | Target volume year 1 | Production cost per piece | Refresh cadence |
|---|---|---|---|
| Recipe hub | 40 to 100 recipes | $180 to $320 | Every 12 months |
| Ingredient comparison guides | 12 to 24 guides | $450 to $780 | Every 18 months |
| Sourcing story pages | 6 to 12 pages | $680 to $1,200 | Every 24 months |
| Buyer intent content | 8 to 16 pieces | $220 to $420 | Every 12 months |
Photography as a content calendar constraint
Photography is the actual constraint on recipe cadence, not writing. Every recipe needs 6 to 12 photos: hero shot, ingredient flat lay, prep in progress, plated result, storage, and step shots for the schema markup. A working food brand batches photography 8 recipes at a time to keep the cost per recipe under 200 dollars. Skip the batching and the per-recipe cost climbs to 400 to 600 dollars, which caps recipe cadence at 1 per week and slows organic ranking timeline by 6 months.
Seasonal content calendar planning
Seasonal content calendar planning maps recipes and comparison guides to the seasonal windows they need to rank in. A Christmas cookie recipe needs to publish in September to rank by early December. A Valentine’s chocolate guide needs to publish in November to rank by early February. A back-to-school lunchbox recipe needs to publish in June to rank by late August. The 60-to-90-day ranking curve dictates the calendar.
Creator syndication inside food brand content
Creator syndication on food brand content marketing amplifies the recipe hub through Instagram Reels, TikTok, and YouTube Shorts creators paid to post their own version of the brand’s hero recipes. The creator content pulls net-new audiences into the recipe hub through the creator’s Link in Bio or Amazon Storefront tag. The syndication calendar names 12 to 30 creators per quarter with specific recipes assigned to each.
One brand we picked up had a spreadsheet titled “creator outreach 2023” with 47 rows and 3 responses. All 3 responses were auto-replies. The spreadsheet named zero recipes and offered flat rates below 100 dollars per post. Nobody posts a 30-second video for 87 dollars flat. Nobody.
Creator content commercial terms that work
Working creator content commercial terms run 350 to 1,500 dollars flat per post plus a 12 to 25 percent commission on tagged sales across a 30-day window. The commission mechanic pulls creators into follow-up posts because the incremental revenue continues past the initial fee. Mid-tier creators (30k to 150k followers) hit the sweet spot for food brand content because their engagement rate typically runs 4 to 8 percent versus 0.8 to 1.6 percent on mega-creators.
Content brief structure for creator partnerships
The content brief structure for creator partnerships runs a single page: the SKU, the specific recipe or usage occasion, 3 required brand mentions, 3 restricted claims (no health claims on non-medical SKUs), the pricing angle, the affiliate link, and 3 example videos that hit the tone. The brief avoids over-scripting because over-scripted creator content underperforms native creator voice by 40 to 60 percent on engagement rate.
Buyer intent content for food brand blogs
Buyer intent content on food brand blogs covers 8 to 16 pieces targeting explicit purchase-decision queries: “where to buy [brand],” “[brand] subscription vs. one-time,” “best [category] for [use case],” and “[brand] gift bundle.” Every buyer intent piece runs 1,400 to 2,400 words with a comparison table, product cards, and a clear conversion path to the specific SKU that matches the query intent. Buyer intent content converts at 3 to 6 percent versus 1 to 2 percent on recipe content because the shopper landed already planning to buy, not exploring a usage occasion.
Where-to-buy content structure
Where-to-buy content structure covers online (DTC storefront, Amazon, Target.com, Whole Foods online), retail (specific chain locators with the store finder embedded), and international (customs limitations, retailer partners abroad). Every piece names specific retailers, links to the store locator, and includes an FAQ block covering shipping availability, subscription options, and gift card compatibility. Where-to-buy content ranks for branded discovery queries the DTC storefront otherwise loses to competitor affiliate reviews.
Subscription versus one-time comparison content
Subscription versus one-time comparison content converts subscription commitments at 3 to 6 percent because it addresses the price-sensitivity concern head-on with a specific math table. The piece covers the discount structure (15 percent lifetime), the skip-a-month mechanic, the pause-anytime rule, the cancellation policy, and the specific yearly savings for the brand’s average consumption cadence. Cross-reference the retention structure on our food and beverage marketing retainer page.
Content refresh cadence on food brand pillars
Content refresh cadence on food brand content pillars runs a rolling audit every 12 to 24 months by pillar. Recipes get refreshed every 12 months with new photography, updated schema, and any nutrition or ingredient adjustments. Ingredient comparison guides refresh every 18 months to update market data. Sourcing story pages refresh every 24 months to reflect farm partnership changes and new harvest angles. Buyer intent content refreshes every 12 months to update retailer availability and pricing.
Recipe refresh priority order
Recipe refresh priority runs by organic traffic rank. The top 20 recipes by monthly organic sessions get refreshed first (new photography, schema audit, related recipe internal links, updated nutrition). The next 40 get refreshed at 15 months. The remaining recipes get refreshed opportunistically when the ranking slips past position 15 in Google. Skipping the refresh cadence lets recipe rankings drift out of the top 3 inside 18 months as newer competitor recipes take the position.
Schema audit checklist per refresh
The schema audit checklist per refresh runs 8 items: Recipe schema completeness, aggregateRating count and accuracy, nutrition data accuracy, prepTime and cookTime match the recipe body, image URLs valid at CDN, related recipe internal links working, product card SKU URL live, and Google Search Console rich result eligibility validated. This checklist takes 20 minutes per recipe and prevents the schema drift that costs recipe rankings 20 to 40 positions quietly.
Reporting cadence for food brand content marketing
Reporting cadence on food brand content marketing runs a monthly executive report plus a quarterly business review. The monthly report ships in the first business week and covers organic sessions by pillar, top 10 ranking recipes with position trend, ingredient guide ranking movements, sourcing page performance, and organic-attributed DTC revenue. Every number carries a comparison to the prior month and a plain-language interpretation the founder reads in 7 minutes.
Metrics that matter for content marketing
Metrics that matter for food brand content marketing: organic sessions by pillar, recipe rich result impressions in Search Console, organic conversion rate to hero SKU pages, organic-attributed DTC revenue, and top 20 ranking positions by monthly organic sessions. Vanity metrics that do not matter: total pageviews without conversion context, average time on page without conversion attribution, and social share counts. The monthly report skips the vanity block entirely.
Quarterly business review structure
The quarterly business review runs 90 minutes with the founder, head of content, and SEO lead. Agenda: organic traffic trend by pillar, top 10 winning content pieces, top 10 losing content pieces (candidates for refresh or removal), competitive gap analysis against 5 named competitor brands, and next quarter’s content calendar with recipes and ingredient guides queued. According to Ahrefs content marketing research, brands running quarterly content audits outperform brands running annual audits by 40 to 70 percent on organic revenue over a 24-month window.
Internal linking discipline across food brand content
Internal linking discipline across food brand content moves authority from recipe pages toward hero SKU product pages and comparison guides. Every recipe links to the hero SKU it uses inline (once in the ingredient list, once in a bottom call-out card). Every ingredient comparison guide links to 3 to 6 recipes using the winning ingredient plus the hero SKU product page. Every sourcing story links to the 2 to 4 SKUs sourced from that specific farm or cooperative.
Anchor text strategy across recipe hubs
Anchor text on internal links varies across recipe hubs to avoid over-optimization patterns Google penalizes. Exact-match anchor (“single-origin Ethiopian coffee”) runs on 20 to 30 percent of internal links. Partial-match variations (“our Ethiopian roast”) run on 30 to 40 percent. Branded anchors (the SKU name) run on 20 to 30 percent. Generic anchors (“shop the coffee”) fill the remaining 10 to 20 percent. This ratio holds ranking without triggering the over-optimization penalty that shows up on brands that anchor-text-stuff every internal link with the same exact-match keyword. Cross-reference the linking layer on our food and beverage web design page.
Link equity from ingredient guides to SKU pages
Link equity from ingredient guides passes to SKU pages when the guide’s comparison table names the hero SKU in the winning column with a product card, and when the guide’s body links to 3 to 6 recipes that use the winning ingredient. This 3-hop path (guide to recipe to SKU) pushes authority from a high-traffic informational query down to a high-intent transactional page. According to Search Engine Land SEO coverage, informational content that internally links to transactional pages produces 2 to 4 times higher organic revenue than isolated content silos.
Wrapping up content marketing for food brands
Content marketing for food brands is the organic engine that turns a DTC snack, drink, or CPG storefront into a search-driven revenue channel. Recipe hub of 40 to 100 recipes. Ingredient comparison guides at 12 to 24 pieces. Sourcing story pages at 6 to 12 pieces. Buyer intent content at 8 to 16 pieces. Creator syndication calendar with 12 to 30 creators per quarter. Refresh cadence at 12 to 24 months by pillar. Reporting with organic sessions and organic revenue attribution.
If your DTC food brand is running paid social at 20,000 dollars monthly with a broken blog and zero recipe schema, professional content marketing for food brands pays for itself inside the first 90 days on organic traffic captured. Redefine Web ships content marketing inside our monthly retainer packages. Book a call and we will walk through the last three DTC food brands we built recipe hubs for, pillar by pillar.
Content marketing for food brands starts with a recipe hub because recipe queries account for 40 to 60 percent of high-intent search volume in the food category. Every hero SKU needs 4 to 12 recipes anchored to it, each targeting a specific occasion and audience.
Skip the recipe hub and the brand loses the search real estate that pulls DTC storefront traffic month over month at zero incremental paid cost. Recipe traffic converts at 2 to 4 percent because the shopper landed with usage intent, not passive discovery, which is why food brands win on recipes.
Recipe schema and Google rich result eligibility
Every recipe page ships schema.org Recipe markup including cookTime, prepTime, recipeIngredient, recipeInstructions, nutrition, and aggregateRating. Correctly marked-up recipes qualify for Google’s recipe rich result carousel that pulls 3 to 6 times higher click-through rate than a plain blue link. The schema layer takes 15 minutes per recipe to author and 30 minutes to validate in Google Search Console. Cross-reference the recipe search stack on our food and beverage SEO page.
Recipe hub structure that scales
The recipe hub structure runs 40 to 100 recipes at maturity, organized by hero SKU (4 to 12 recipes per SKU) plus occasion tags (breakfast, weeknight dinner, meal prep, brunch, holiday). Every recipe links back to the hero SKU product page with the SKU embedded in an inline card. The hub earns internal linking value from ingredient comparison guides and the sourcing story pages, which feeds recipe ranking on Google. According to Google Search Central recipe structured data guidance, complete Recipe schema markup is required for eligibility in the recipe carousel and the ingredient search filter.
Pillar structure for food brand content marketing
The pillar structure on content marketing for food brands runs 4 content pillars concurrently: recipe hub (40 to 100 recipes), ingredient comparison guides (12 to 24 guides), sourcing story pages (6 to 12 pages), and buyer intent content (where to buy, subscription vs. one-time, gift bundle guides). Every pillar covers a distinct search intent and every pillar links back to the hero SKU product pages.
Ingredient comparison guide format
Ingredient comparison guides run 1,800 to 3,200 words comparing 2 to 4 ingredient types on 6 to 10 attributes with a comparison table, real-world use case examples, and links to the hero SKU that uses the specific ingredient. Example: organic vs. conventional oats compares nutritional profile, sourcing chain, cost, environmental impact, and taste on a 6-column table. The brand’s SKU appears in the winning column with a product card. These guides rank 3 to 8 months after publication and pull steady-state organic traffic.
Sourcing story pages that build trust
Sourcing story pages name the specific farms, cooperatives, or suppliers the brand sources from, with photos of the farms, farmer quotes, and specific harvest windows. A coffee brand’s Ethiopian farm page ranks for “single-origin Ethiopian coffee” and “Yirgacheffe coffee origin” plus 40 long-tail variations. The sourcing page pulls trust-building traffic that converts at 4 to 6 percent because the shopper landed pattern-matching on transparency and named provenance. Every sourcing page includes farmer or cooperative quotes, harvest dates, and a link back to 3 to 5 hero SKU pages that source from the named supplier.
Vejrø hospitality content case study
Vejrø Resort, a Danish private-island destination with an on-site restaurant focused on organic, locally sourced cuisine, joined us with strong social engagement and no organic-search real estate. Guests found the resort on Instagram but never in Google search for terms like “private island resort Denmark,” “farm-to-table hospitality Denmark,” or “Vejrø restaurant.” The same organic-search gap shows up on DTC food brands running paid social at 20,000 dollars monthly with a broken blog and zero recipe schema.
We built the conversion-focused website with on-site and off-site SEO tuned to the travel-niche keyword clusters, competitor analysis against comparable boutique resorts, and mobile-first design prioritizing guest discovery. Every page carried the structured data qualifying it for Google’s rich results in the hospitality category. Every internal link pushed authority toward the direct-booking conversion path.
Three months later, Vejrø hit 10,000 plus organic visitors, ranked for 200 plus first-page keywords, and pulled a 2.2 percent booking conversion rate from organic traffic. The same pattern applies to content marketing for food brands: recipe schema, ingredient comparison guides, and sourcing story pages pull organic traffic at 20 to 40 percent conversion into hero SKU pages inside 6 months when the content quality matches search intent and every page carries the right structured data markup. Vejrø also proved out the reporting discipline: every monthly report named the exact page, the exact keyword cluster, and the exact search feature (rich result, sitelinks, image pack) driving the incremental organic revenue instead of hiding behind aggregate traffic charts.
Recipe cadence and content calendar for food brands
Recipe cadence on a working food brand content calendar ships 2 to 4 new recipes per week during the first 6 months and drops to 1 per week at maturity. Each recipe takes 4 to 6 hours to produce (write, test in the kitchen, photograph, schema author, publish). At 3 recipes per week, the brand hits 78 recipes inside 6 months plus a backlog of ingredient comparison and sourcing content queued behind the recipe production line.
| Content pillar | Target volume year 1 | Production cost per piece | Refresh cadence |
|---|---|---|---|
| Recipe hub | 40 to 100 recipes | $180 to $320 | Every 12 months |
| Ingredient comparison guides | 12 to 24 guides | $450 to $780 | Every 18 months |
| Sourcing story pages | 6 to 12 pages | $680 to $1,200 | Every 24 months |
| Buyer intent content | 8 to 16 pieces | $220 to $420 | Every 12 months |
Photography as a content calendar constraint
Photography is the actual constraint on recipe cadence, not writing. Every recipe needs 6 to 12 photos: hero shot, ingredient flat lay, prep in progress, plated result, storage, and step shots for the schema markup. A working food brand batches photography 8 recipes at a time to keep the cost per recipe under 200 dollars. Skip the batching and the per-recipe cost climbs to 400 to 600 dollars, which caps recipe cadence at 1 per week and slows organic ranking timeline by 6 months.
Seasonal content calendar planning
Seasonal content calendar planning maps recipes and comparison guides to the seasonal windows they need to rank in. A Christmas cookie recipe needs to publish in September to rank by early December. A Valentine’s chocolate guide needs to publish in November to rank by early February. A back-to-school lunchbox recipe needs to publish in June to rank by late August. The 60-to-90-day ranking curve dictates the calendar.
Creator syndication inside food brand content
Creator syndication on food brand content marketing amplifies the recipe hub through Instagram Reels, TikTok, and YouTube Shorts creators paid to post their own version of the brand’s hero recipes. The creator content pulls net-new audiences into the recipe hub through the creator’s Link in Bio or Amazon Storefront tag. The syndication calendar names 12 to 30 creators per quarter with specific recipes assigned to each.
One brand we picked up had a spreadsheet titled “creator outreach 2023” with 47 rows and 3 responses. All 3 responses were auto-replies. The spreadsheet named zero recipes and offered flat rates below 100 dollars per post. Nobody posts a 30-second video for 87 dollars flat. Nobody.
Creator content commercial terms that work
Working creator content commercial terms run 350 to 1,500 dollars flat per post plus a 12 to 25 percent commission on tagged sales across a 30-day window. The commission mechanic pulls creators into follow-up posts because the incremental revenue continues past the initial fee. Mid-tier creators (30k to 150k followers) hit the sweet spot for food brand content because their engagement rate typically runs 4 to 8 percent versus 0.8 to 1.6 percent on mega-creators.
Content brief structure for creator partnerships
The content brief structure for creator partnerships runs a single page: the SKU, the specific recipe or usage occasion, 3 required brand mentions, 3 restricted claims (no health claims on non-medical SKUs), the pricing angle, the affiliate link, and 3 example videos that hit the tone. The brief avoids over-scripting because over-scripted creator content underperforms native creator voice by 40 to 60 percent on engagement rate.
Buyer intent content for food brand blogs
Buyer intent content on food brand blogs covers 8 to 16 pieces targeting explicit purchase-decision queries: “where to buy [brand],” “[brand] subscription vs. one-time,” “best [category] for [use case],” and “[brand] gift bundle.” Every buyer intent piece runs 1,400 to 2,400 words with a comparison table, product cards, and a clear conversion path to the specific SKU that matches the query intent. Buyer intent content converts at 3 to 6 percent versus 1 to 2 percent on recipe content because the shopper landed already planning to buy, not exploring a usage occasion.
Where-to-buy content structure
Where-to-buy content structure covers online (DTC storefront, Amazon, Target.com, Whole Foods online), retail (specific chain locators with the store finder embedded), and international (customs limitations, retailer partners abroad). Every piece names specific retailers, links to the store locator, and includes an FAQ block covering shipping availability, subscription options, and gift card compatibility. Where-to-buy content ranks for branded discovery queries the DTC storefront otherwise loses to competitor affiliate reviews.
Subscription versus one-time comparison content
Subscription versus one-time comparison content converts subscription commitments at 3 to 6 percent because it addresses the price-sensitivity concern head-on with a specific math table. The piece covers the discount structure (15 percent lifetime), the skip-a-month mechanic, the pause-anytime rule, the cancellation policy, and the specific yearly savings for the brand’s average consumption cadence. Cross-reference the retention structure on our food and beverage marketing retainer page.
Content refresh cadence on food brand pillars
Content refresh cadence on food brand content pillars runs a rolling audit every 12 to 24 months by pillar. Recipes get refreshed every 12 months with new photography, updated schema, and any nutrition or ingredient adjustments. Ingredient comparison guides refresh every 18 months to update market data. Sourcing story pages refresh every 24 months to reflect farm partnership changes and new harvest angles. Buyer intent content refreshes every 12 months to update retailer availability and pricing.
Recipe refresh priority order
Recipe refresh priority runs by organic traffic rank. The top 20 recipes by monthly organic sessions get refreshed first (new photography, schema audit, related recipe internal links, updated nutrition). The next 40 get refreshed at 15 months. The remaining recipes get refreshed opportunistically when the ranking slips past position 15 in Google. Skipping the refresh cadence lets recipe rankings drift out of the top 3 inside 18 months as newer competitor recipes take the position.
Schema audit checklist per refresh
The schema audit checklist per refresh runs 8 items: Recipe schema completeness, aggregateRating count and accuracy, nutrition data accuracy, prepTime and cookTime match the recipe body, image URLs valid at CDN, related recipe internal links working, product card SKU URL live, and Google Search Console rich result eligibility validated. This checklist takes 20 minutes per recipe and prevents the schema drift that costs recipe rankings 20 to 40 positions quietly.
Reporting cadence for food brand content marketing
Reporting cadence on food brand content marketing runs a monthly executive report plus a quarterly business review. The monthly report ships in the first business week and covers organic sessions by pillar, top 10 ranking recipes with position trend, ingredient guide ranking movements, sourcing page performance, and organic-attributed DTC revenue. Every number carries a comparison to the prior month and a plain-language interpretation the founder reads in 7 minutes.
Metrics that matter for content marketing
Metrics that matter for food brand content marketing: organic sessions by pillar, recipe rich result impressions in Search Console, organic conversion rate to hero SKU pages, organic-attributed DTC revenue, and top 20 ranking positions by monthly organic sessions. Vanity metrics that do not matter: total pageviews without conversion context, average time on page without conversion attribution, and social share counts. The monthly report skips the vanity block entirely.
Quarterly business review structure
The quarterly business review runs 90 minutes with the founder, head of content, and SEO lead. Agenda: organic traffic trend by pillar, top 10 winning content pieces, top 10 losing content pieces (candidates for refresh or removal), competitive gap analysis against 5 named competitor brands, and next quarter’s content calendar with recipes and ingredient guides queued. According to Ahrefs content marketing research, brands running quarterly content audits outperform brands running annual audits by 40 to 70 percent on organic revenue over a 24-month window.
Internal linking discipline across food brand content
Internal linking discipline across food brand content moves authority from recipe pages toward hero SKU product pages and comparison guides. Every recipe links to the hero SKU it uses inline (once in the ingredient list, once in a bottom call-out card). Every ingredient comparison guide links to 3 to 6 recipes using the winning ingredient plus the hero SKU product page. Every sourcing story links to the 2 to 4 SKUs sourced from that specific farm or cooperative.
Anchor text strategy across recipe hubs
Anchor text on internal links varies across recipe hubs to avoid over-optimization patterns Google penalizes. Exact-match anchor (“single-origin Ethiopian coffee”) runs on 20 to 30 percent of internal links. Partial-match variations (“our Ethiopian roast”) run on 30 to 40 percent. Branded anchors (the SKU name) run on 20 to 30 percent. Generic anchors (“shop the coffee”) fill the remaining 10 to 20 percent. This ratio holds ranking without triggering the over-optimization penalty that shows up on brands that anchor-text-stuff every internal link with the same exact-match keyword. Cross-reference the linking layer on our food and beverage web design page.
Link equity from ingredient guides to SKU pages
Link equity from ingredient guides passes to SKU pages when the guide’s comparison table names the hero SKU in the winning column with a product card, and when the guide’s body links to 3 to 6 recipes that use the winning ingredient. This 3-hop path (guide to recipe to SKU) pushes authority from a high-traffic informational query down to a high-intent transactional page. According to Search Engine Land SEO coverage, informational content that internally links to transactional pages produces 2 to 4 times higher organic revenue than isolated content silos.
Wrapping up content marketing for food brands
Content marketing for food brands is the organic engine that turns a DTC snack, drink, or CPG storefront into a search-driven revenue channel. Recipe hub of 40 to 100 recipes. Ingredient comparison guides at 12 to 24 pieces. Sourcing story pages at 6 to 12 pieces. Buyer intent content at 8 to 16 pieces. Creator syndication calendar with 12 to 30 creators per quarter. Refresh cadence at 12 to 24 months by pillar. Reporting with organic sessions and organic revenue attribution.
If your DTC food brand is running paid social at 20,000 dollars monthly with a broken blog and zero recipe schema, professional content marketing for food brands pays for itself inside the first 90 days on organic traffic captured. Redefine Web ships content marketing inside our monthly retainer packages. Book a call and we will walk through the last three DTC food brands we built recipe hubs for, pillar by pillar.
Anchor text on internal links varies across recipe hubs to avoid over-optimization patterns Google penalizes. Exact-match anchor (“single-origin Ethiopian coffee”) runs on 20 to 30 percent of internal links. Partial-match variations (“our Ethiopian roast”) run on 30 to 40 percent. Branded anchors (the SKU name) run on 20 to 30 percent. Generic anchors (“shop the coffee”) fill the remaining 10 to 20 percent. This ratio holds ranking without triggering the over-optimization penalty that shows up on brands that anchor-text-stuff every internal link with the same exact-match keyword. Cross-reference the linking layer on our food and beverage web design page.
Link equity from ingredient guides to SKU pages
Link equity from ingredient guides passes to SKU pages when the guide’s comparison table names the hero SKU in the winning column with a product card, and when the guide’s body links to 3 to 6 recipes that use the winning ingredient. This 3-hop path (guide to recipe to SKU) pushes authority from a high-traffic informational query down to a high-intent transactional page. According to Search Engine Land SEO coverage, informational content that internally links to transactional pages produces 2 to 4 times higher organic revenue than isolated content silos.
Wrapping up content marketing for food brands
Content marketing for food brands is the organic engine that turns a DTC snack, drink, or CPG storefront into a search-driven revenue channel. Recipe hub of 40 to 100 recipes. Ingredient comparison guides at 12 to 24 pieces. Sourcing story pages at 6 to 12 pieces. Buyer intent content at 8 to 16 pieces. Creator syndication calendar with 12 to 30 creators per quarter. Refresh cadence at 12 to 24 months by pillar. Reporting with organic sessions and organic revenue attribution.
If your DTC food brand is running paid social at 20,000 dollars monthly with a broken blog and zero recipe schema, professional content marketing for food brands pays for itself inside the first 90 days on organic traffic captured. Redefine Web ships content marketing inside our monthly retainer packages. Book a call and we will walk through the last three DTC food brands we built recipe hubs for, pillar by pillar.
Internal linking discipline across food brand content moves authority from recipe pages toward hero SKU product pages and comparison guides. Every recipe links to the hero SKU it uses inline (once in the ingredient list, once in a bottom call-out card). Every ingredient comparison guide links to 3 to 6 recipes using the winning ingredient plus the hero SKU product page. Every sourcing story links to the 2 to 4 SKUs sourced from that specific farm or cooperative.
Anchor text strategy across recipe hubs
Anchor text on internal links varies across recipe hubs to avoid over-optimization patterns Google penalizes. Exact-match anchor (“single-origin Ethiopian coffee”) runs on 20 to 30 percent of internal links. Partial-match variations (“our Ethiopian roast”) run on 30 to 40 percent. Branded anchors (the SKU name) run on 20 to 30 percent. Generic anchors (“shop the coffee”) fill the remaining 10 to 20 percent. This ratio holds ranking without triggering the over-optimization penalty that shows up on brands that anchor-text-stuff every internal link with the same exact-match keyword. Cross-reference the linking layer on our food and beverage web design page.
Link equity from ingredient guides to SKU pages
Link equity from ingredient guides passes to SKU pages when the guide’s comparison table names the hero SKU in the winning column with a product card, and when the guide’s body links to 3 to 6 recipes that use the winning ingredient. This 3-hop path (guide to recipe to SKU) pushes authority from a high-traffic informational query down to a high-intent transactional page. According to Search Engine Land SEO coverage, informational content that internally links to transactional pages produces 2 to 4 times higher organic revenue than isolated content silos.
Wrapping up content marketing for food brands
Content marketing for food brands is the organic engine that turns a DTC snack, drink, or CPG storefront into a search-driven revenue channel. Recipe hub of 40 to 100 recipes. Ingredient comparison guides at 12 to 24 pieces. Sourcing story pages at 6 to 12 pieces. Buyer intent content at 8 to 16 pieces. Creator syndication calendar with 12 to 30 creators per quarter. Refresh cadence at 12 to 24 months by pillar. Reporting with organic sessions and organic revenue attribution.
If your DTC food brand is running paid social at 20,000 dollars monthly with a broken blog and zero recipe schema, professional content marketing for food brands pays for itself inside the first 90 days on organic traffic captured. Redefine Web ships content marketing inside our monthly retainer packages. Book a call and we will walk through the last three DTC food brands we built recipe hubs for, pillar by pillar.
Content marketing for food brands starts with a recipe hub because recipe queries account for 40 to 60 percent of high-intent search volume in the food category. Every hero SKU needs 4 to 12 recipes anchored to it, each targeting a specific occasion and audience.
Skip the recipe hub and the brand loses the search real estate that pulls DTC storefront traffic month over month at zero incremental paid cost. Recipe traffic converts at 2 to 4 percent because the shopper landed with usage intent, not passive discovery, which is why food brands win on recipes.
Recipe schema and Google rich result eligibility
Every recipe page ships schema.org Recipe markup including cookTime, prepTime, recipeIngredient, recipeInstructions, nutrition, and aggregateRating. Correctly marked-up recipes qualify for Google’s recipe rich result carousel that pulls 3 to 6 times higher click-through rate than a plain blue link. The schema layer takes 15 minutes per recipe to author and 30 minutes to validate in Google Search Console. Cross-reference the recipe search stack on our food and beverage SEO page.
Recipe hub structure that scales
The recipe hub structure runs 40 to 100 recipes at maturity, organized by hero SKU (4 to 12 recipes per SKU) plus occasion tags (breakfast, weeknight dinner, meal prep, brunch, holiday). Every recipe links back to the hero SKU product page with the SKU embedded in an inline card. The hub earns internal linking value from ingredient comparison guides and the sourcing story pages, which feeds recipe ranking on Google. According to Google Search Central recipe structured data guidance, complete Recipe schema markup is required for eligibility in the recipe carousel and the ingredient search filter.
Pillar structure for food brand content marketing
The pillar structure on content marketing for food brands runs 4 content pillars concurrently: recipe hub (40 to 100 recipes), ingredient comparison guides (12 to 24 guides), sourcing story pages (6 to 12 pages), and buyer intent content (where to buy, subscription vs. one-time, gift bundle guides). Every pillar covers a distinct search intent and every pillar links back to the hero SKU product pages.
Ingredient comparison guide format
Ingredient comparison guides run 1,800 to 3,200 words comparing 2 to 4 ingredient types on 6 to 10 attributes with a comparison table, real-world use case examples, and links to the hero SKU that uses the specific ingredient. Example: organic vs. conventional oats compares nutritional profile, sourcing chain, cost, environmental impact, and taste on a 6-column table. The brand’s SKU appears in the winning column with a product card. These guides rank 3 to 8 months after publication and pull steady-state organic traffic.
Sourcing story pages that build trust
Sourcing story pages name the specific farms, cooperatives, or suppliers the brand sources from, with photos of the farms, farmer quotes, and specific harvest windows. A coffee brand’s Ethiopian farm page ranks for “single-origin Ethiopian coffee” and “Yirgacheffe coffee origin” plus 40 long-tail variations. The sourcing page pulls trust-building traffic that converts at 4 to 6 percent because the shopper landed pattern-matching on transparency and named provenance. Every sourcing page includes farmer or cooperative quotes, harvest dates, and a link back to 3 to 5 hero SKU pages that source from the named supplier.
Vejrø hospitality content case study
Vejrø Resort, a Danish private-island destination with an on-site restaurant focused on organic, locally sourced cuisine, joined us with strong social engagement and no organic-search real estate. Guests found the resort on Instagram but never in Google search for terms like “private island resort Denmark,” “farm-to-table hospitality Denmark,” or “Vejrø restaurant.” The same organic-search gap shows up on DTC food brands running paid social at 20,000 dollars monthly with a broken blog and zero recipe schema.
We built the conversion-focused website with on-site and off-site SEO tuned to the travel-niche keyword clusters, competitor analysis against comparable boutique resorts, and mobile-first design prioritizing guest discovery. Every page carried the structured data qualifying it for Google’s rich results in the hospitality category. Every internal link pushed authority toward the direct-booking conversion path.
Three months later, Vejrø hit 10,000 plus organic visitors, ranked for 200 plus first-page keywords, and pulled a 2.2 percent booking conversion rate from organic traffic. The same pattern applies to content marketing for food brands: recipe schema, ingredient comparison guides, and sourcing story pages pull organic traffic at 20 to 40 percent conversion into hero SKU pages inside 6 months when the content quality matches search intent and every page carries the right structured data markup. Vejrø also proved out the reporting discipline: every monthly report named the exact page, the exact keyword cluster, and the exact search feature (rich result, sitelinks, image pack) driving the incremental organic revenue instead of hiding behind aggregate traffic charts.
Recipe cadence and content calendar for food brands
Recipe cadence on a working food brand content calendar ships 2 to 4 new recipes per week during the first 6 months and drops to 1 per week at maturity. Each recipe takes 4 to 6 hours to produce (write, test in the kitchen, photograph, schema author, publish). At 3 recipes per week, the brand hits 78 recipes inside 6 months plus a backlog of ingredient comparison and sourcing content queued behind the recipe production line.
| Content pillar | Target volume year 1 | Production cost per piece | Refresh cadence |
|---|---|---|---|
| Recipe hub | 40 to 100 recipes | $180 to $320 | Every 12 months |
| Ingredient comparison guides | 12 to 24 guides | $450 to $780 | Every 18 months |
| Sourcing story pages | 6 to 12 pages | $680 to $1,200 | Every 24 months |
| Buyer intent content | 8 to 16 pieces | $220 to $420 | Every 12 months |
Photography as a content calendar constraint
Photography is the actual constraint on recipe cadence, not writing. Every recipe needs 6 to 12 photos: hero shot, ingredient flat lay, prep in progress, plated result, storage, and step shots for the schema markup. A working food brand batches photography 8 recipes at a time to keep the cost per recipe under 200 dollars. Skip the batching and the per-recipe cost climbs to 400 to 600 dollars, which caps recipe cadence at 1 per week and slows organic ranking timeline by 6 months.
Seasonal content calendar planning
Seasonal content calendar planning maps recipes and comparison guides to the seasonal windows they need to rank in. A Christmas cookie recipe needs to publish in September to rank by early December. A Valentine’s chocolate guide needs to publish in November to rank by early February. A back-to-school lunchbox recipe needs to publish in June to rank by late August. The 60-to-90-day ranking curve dictates the calendar.
Creator syndication inside food brand content
Creator syndication on food brand content marketing amplifies the recipe hub through Instagram Reels, TikTok, and YouTube Shorts creators paid to post their own version of the brand’s hero recipes. The creator content pulls net-new audiences into the recipe hub through the creator’s Link in Bio or Amazon Storefront tag. The syndication calendar names 12 to 30 creators per quarter with specific recipes assigned to each.
One brand we picked up had a spreadsheet titled “creator outreach 2023” with 47 rows and 3 responses. All 3 responses were auto-replies. The spreadsheet named zero recipes and offered flat rates below 100 dollars per post. Nobody posts a 30-second video for 87 dollars flat. Nobody.
Creator content commercial terms that work
Working creator content commercial terms run 350 to 1,500 dollars flat per post plus a 12 to 25 percent commission on tagged sales across a 30-day window. The commission mechanic pulls creators into follow-up posts because the incremental revenue continues past the initial fee. Mid-tier creators (30k to 150k followers) hit the sweet spot for food brand content because their engagement rate typically runs 4 to 8 percent versus 0.8 to 1.6 percent on mega-creators.
Content brief structure for creator partnerships
The content brief structure for creator partnerships runs a single page: the SKU, the specific recipe or usage occasion, 3 required brand mentions, 3 restricted claims (no health claims on non-medical SKUs), the pricing angle, the affiliate link, and 3 example videos that hit the tone. The brief avoids over-scripting because over-scripted creator content underperforms native creator voice by 40 to 60 percent on engagement rate.
Buyer intent content for food brand blogs
Buyer intent content on food brand blogs covers 8 to 16 pieces targeting explicit purchase-decision queries: “where to buy [brand],” “[brand] subscription vs. one-time,” “best [category] for [use case],” and “[brand] gift bundle.” Every buyer intent piece runs 1,400 to 2,400 words with a comparison table, product cards, and a clear conversion path to the specific SKU that matches the query intent. Buyer intent content converts at 3 to 6 percent versus 1 to 2 percent on recipe content because the shopper landed already planning to buy, not exploring a usage occasion.
Where-to-buy content structure
Where-to-buy content structure covers online (DTC storefront, Amazon, Target.com, Whole Foods online), retail (specific chain locators with the store finder embedded), and international (customs limitations, retailer partners abroad). Every piece names specific retailers, links to the store locator, and includes an FAQ block covering shipping availability, subscription options, and gift card compatibility. Where-to-buy content ranks for branded discovery queries the DTC storefront otherwise loses to competitor affiliate reviews.
Subscription versus one-time comparison content
Subscription versus one-time comparison content converts subscription commitments at 3 to 6 percent because it addresses the price-sensitivity concern head-on with a specific math table. The piece covers the discount structure (15 percent lifetime), the skip-a-month mechanic, the pause-anytime rule, the cancellation policy, and the specific yearly savings for the brand’s average consumption cadence. Cross-reference the retention structure on our food and beverage marketing retainer page.
Content refresh cadence on food brand pillars
Content refresh cadence on food brand content pillars runs a rolling audit every 12 to 24 months by pillar. Recipes get refreshed every 12 months with new photography, updated schema, and any nutrition or ingredient adjustments. Ingredient comparison guides refresh every 18 months to update market data. Sourcing story pages refresh every 24 months to reflect farm partnership changes and new harvest angles. Buyer intent content refreshes every 12 months to update retailer availability and pricing.
Recipe refresh priority order
Recipe refresh priority runs by organic traffic rank. The top 20 recipes by monthly organic sessions get refreshed first (new photography, schema audit, related recipe internal links, updated nutrition). The next 40 get refreshed at 15 months. The remaining recipes get refreshed opportunistically when the ranking slips past position 15 in Google. Skipping the refresh cadence lets recipe rankings drift out of the top 3 inside 18 months as newer competitor recipes take the position.
Schema audit checklist per refresh
The schema audit checklist per refresh runs 8 items: Recipe schema completeness, aggregateRating count and accuracy, nutrition data accuracy, prepTime and cookTime match the recipe body, image URLs valid at CDN, related recipe internal links working, product card SKU URL live, and Google Search Console rich result eligibility validated. This checklist takes 20 minutes per recipe and prevents the schema drift that costs recipe rankings 20 to 40 positions quietly.
Reporting cadence for food brand content marketing
Reporting cadence on food brand content marketing runs a monthly executive report plus a quarterly business review. The monthly report ships in the first business week and covers organic sessions by pillar, top 10 ranking recipes with position trend, ingredient guide ranking movements, sourcing page performance, and organic-attributed DTC revenue. Every number carries a comparison to the prior month and a plain-language interpretation the founder reads in 7 minutes.
Metrics that matter for content marketing
Metrics that matter for food brand content marketing: organic sessions by pillar, recipe rich result impressions in Search Console, organic conversion rate to hero SKU pages, organic-attributed DTC revenue, and top 20 ranking positions by monthly organic sessions. Vanity metrics that do not matter: total pageviews without conversion context, average time on page without conversion attribution, and social share counts. The monthly report skips the vanity block entirely.
Quarterly business review structure
The quarterly business review runs 90 minutes with the founder, head of content, and SEO lead. Agenda: organic traffic trend by pillar, top 10 winning content pieces, top 10 losing content pieces (candidates for refresh or removal), competitive gap analysis against 5 named competitor brands, and next quarter’s content calendar with recipes and ingredient guides queued. According to Ahrefs content marketing research, brands running quarterly content audits outperform brands running annual audits by 40 to 70 percent on organic revenue over a 24-month window.
Internal linking discipline across food brand content
Internal linking discipline across food brand content moves authority from recipe pages toward hero SKU product pages and comparison guides. Every recipe links to the hero SKU it uses inline (once in the ingredient list, once in a bottom call-out card). Every ingredient comparison guide links to 3 to 6 recipes using the winning ingredient plus the hero SKU product page. Every sourcing story links to the 2 to 4 SKUs sourced from that specific farm or cooperative.
Anchor text strategy across recipe hubs
Anchor text on internal links varies across recipe hubs to avoid over-optimization patterns Google penalizes. Exact-match anchor (“single-origin Ethiopian coffee”) runs on 20 to 30 percent of internal links. Partial-match variations (“our Ethiopian roast”) run on 30 to 40 percent. Branded anchors (the SKU name) run on 20 to 30 percent. Generic anchors (“shop the coffee”) fill the remaining 10 to 20 percent. This ratio holds ranking without triggering the over-optimization penalty that shows up on brands that anchor-text-stuff every internal link with the same exact-match keyword. Cross-reference the linking layer on our food and beverage web design page.
Link equity from ingredient guides to SKU pages
Link equity from ingredient guides passes to SKU pages when the guide’s comparison table names the hero SKU in the winning column with a product card, and when the guide’s body links to 3 to 6 recipes that use the winning ingredient. This 3-hop path (guide to recipe to SKU) pushes authority from a high-traffic informational query down to a high-intent transactional page. According to Search Engine Land SEO coverage, informational content that internally links to transactional pages produces 2 to 4 times higher organic revenue than isolated content silos.
Wrapping up content marketing for food brands
Content marketing for food brands is the organic engine that turns a DTC snack, drink, or CPG storefront into a search-driven revenue channel. Recipe hub of 40 to 100 recipes. Ingredient comparison guides at 12 to 24 pieces. Sourcing story pages at 6 to 12 pieces. Buyer intent content at 8 to 16 pieces. Creator syndication calendar with 12 to 30 creators per quarter. Refresh cadence at 12 to 24 months by pillar. Reporting with organic sessions and organic revenue attribution.
If your DTC food brand is running paid social at 20,000 dollars monthly with a broken blog and zero recipe schema, professional content marketing for food brands pays for itself inside the first 90 days on organic traffic captured. Redefine Web ships content marketing inside our monthly retainer packages. Book a call and we will walk through the last three DTC food brands we built recipe hubs for, pillar by pillar.
Content marketing for food brands starts with a recipe hub because recipe queries account for 40 to 60 percent of high-intent search volume in the food category. Every hero SKU needs 4 to 12 recipes anchored to it, each targeting a specific occasion and audience.
Skip the recipe hub and the brand loses the search real estate that pulls DTC storefront traffic month over month at zero incremental paid cost. Recipe traffic converts at 2 to 4 percent because the shopper landed with usage intent, not passive discovery, which is why food brands win on recipes.
Recipe schema and Google rich result eligibility
Every recipe page ships schema.org Recipe markup including cookTime, prepTime, recipeIngredient, recipeInstructions, nutrition, and aggregateRating. Correctly marked-up recipes qualify for Google’s recipe rich result carousel that pulls 3 to 6 times higher click-through rate than a plain blue link. The schema layer takes 15 minutes per recipe to author and 30 minutes to validate in Google Search Console. Cross-reference the recipe search stack on our food and beverage SEO page.
Recipe hub structure that scales
The recipe hub structure runs 40 to 100 recipes at maturity, organized by hero SKU (4 to 12 recipes per SKU) plus occasion tags (breakfast, weeknight dinner, meal prep, brunch, holiday). Every recipe links back to the hero SKU product page with the SKU embedded in an inline card. The hub earns internal linking value from ingredient comparison guides and the sourcing story pages, which feeds recipe ranking on Google. According to Google Search Central recipe structured data guidance, complete Recipe schema markup is required for eligibility in the recipe carousel and the ingredient search filter.
Pillar structure for food brand content marketing
The pillar structure on content marketing for food brands runs 4 content pillars concurrently: recipe hub (40 to 100 recipes), ingredient comparison guides (12 to 24 guides), sourcing story pages (6 to 12 pages), and buyer intent content (where to buy, subscription vs. one-time, gift bundle guides). Every pillar covers a distinct search intent and every pillar links back to the hero SKU product pages.
Ingredient comparison guide format
Ingredient comparison guides run 1,800 to 3,200 words comparing 2 to 4 ingredient types on 6 to 10 attributes with a comparison table, real-world use case examples, and links to the hero SKU that uses the specific ingredient. Example: organic vs. conventional oats compares nutritional profile, sourcing chain, cost, environmental impact, and taste on a 6-column table. The brand’s SKU appears in the winning column with a product card. These guides rank 3 to 8 months after publication and pull steady-state organic traffic.
Sourcing story pages that build trust
Sourcing story pages name the specific farms, cooperatives, or suppliers the brand sources from, with photos of the farms, farmer quotes, and specific harvest windows. A coffee brand’s Ethiopian farm page ranks for “single-origin Ethiopian coffee” and “Yirgacheffe coffee origin” plus 40 long-tail variations. The sourcing page pulls trust-building traffic that converts at 4 to 6 percent because the shopper landed pattern-matching on transparency and named provenance. Every sourcing page includes farmer or cooperative quotes, harvest dates, and a link back to 3 to 5 hero SKU pages that source from the named supplier.
Vejrø hospitality content case study
Vejrø Resort, a Danish private-island destination with an on-site restaurant focused on organic, locally sourced cuisine, joined us with strong social engagement and no organic-search real estate. Guests found the resort on Instagram but never in Google search for terms like “private island resort Denmark,” “farm-to-table hospitality Denmark,” or “Vejrø restaurant.” The same organic-search gap shows up on DTC food brands running paid social at 20,000 dollars monthly with a broken blog and zero recipe schema.
We built the conversion-focused website with on-site and off-site SEO tuned to the travel-niche keyword clusters, competitor analysis against comparable boutique resorts, and mobile-first design prioritizing guest discovery. Every page carried the structured data qualifying it for Google’s rich results in the hospitality category. Every internal link pushed authority toward the direct-booking conversion path.
Three months later, Vejrø hit 10,000 plus organic visitors, ranked for 200 plus first-page keywords, and pulled a 2.2 percent booking conversion rate from organic traffic. The same pattern applies to content marketing for food brands: recipe schema, ingredient comparison guides, and sourcing story pages pull organic traffic at 20 to 40 percent conversion into hero SKU pages inside 6 months when the content quality matches search intent and every page carries the right structured data markup. Vejrø also proved out the reporting discipline: every monthly report named the exact page, the exact keyword cluster, and the exact search feature (rich result, sitelinks, image pack) driving the incremental organic revenue instead of hiding behind aggregate traffic charts.
Recipe cadence and content calendar for food brands
Recipe cadence on a working food brand content calendar ships 2 to 4 new recipes per week during the first 6 months and drops to 1 per week at maturity. Each recipe takes 4 to 6 hours to produce (write, test in the kitchen, photograph, schema author, publish). At 3 recipes per week, the brand hits 78 recipes inside 6 months plus a backlog of ingredient comparison and sourcing content queued behind the recipe production line.
| Content pillar | Target volume year 1 | Production cost per piece | Refresh cadence |
|---|---|---|---|
| Recipe hub | 40 to 100 recipes | $180 to $320 | Every 12 months |
| Ingredient comparison guides | 12 to 24 guides | $450 to $780 | Every 18 months |
| Sourcing story pages | 6 to 12 pages | $680 to $1,200 | Every 24 months |
| Buyer intent content | 8 to 16 pieces | $220 to $420 | Every 12 months |
Photography as a content calendar constraint
Photography is the actual constraint on recipe cadence, not writing. Every recipe needs 6 to 12 photos: hero shot, ingredient flat lay, prep in progress, plated result, storage, and step shots for the schema markup. A working food brand batches photography 8 recipes at a time to keep the cost per recipe under 200 dollars. Skip the batching and the per-recipe cost climbs to 400 to 600 dollars, which caps recipe cadence at 1 per week and slows organic ranking timeline by 6 months.
Seasonal content calendar planning
Seasonal content calendar planning maps recipes and comparison guides to the seasonal windows they need to rank in. A Christmas cookie recipe needs to publish in September to rank by early December. A Valentine’s chocolate guide needs to publish in November to rank by early February. A back-to-school lunchbox recipe needs to publish in June to rank by late August. The 60-to-90-day ranking curve dictates the calendar.
Creator syndication inside food brand content
Creator syndication on food brand content marketing amplifies the recipe hub through Instagram Reels, TikTok, and YouTube Shorts creators paid to post their own version of the brand’s hero recipes. The creator content pulls net-new audiences into the recipe hub through the creator’s Link in Bio or Amazon Storefront tag. The syndication calendar names 12 to 30 creators per quarter with specific recipes assigned to each.
One brand we picked up had a spreadsheet titled “creator outreach 2023” with 47 rows and 3 responses. All 3 responses were auto-replies. The spreadsheet named zero recipes and offered flat rates below 100 dollars per post. Nobody posts a 30-second video for 87 dollars flat. Nobody.
Creator content commercial terms that work
Working creator content commercial terms run 350 to 1,500 dollars flat per post plus a 12 to 25 percent commission on tagged sales across a 30-day window. The commission mechanic pulls creators into follow-up posts because the incremental revenue continues past the initial fee. Mid-tier creators (30k to 150k followers) hit the sweet spot for food brand content because their engagement rate typically runs 4 to 8 percent versus 0.8 to 1.6 percent on mega-creators.
Content brief structure for creator partnerships
The content brief structure for creator partnerships runs a single page: the SKU, the specific recipe or usage occasion, 3 required brand mentions, 3 restricted claims (no health claims on non-medical SKUs), the pricing angle, the affiliate link, and 3 example videos that hit the tone. The brief avoids over-scripting because over-scripted creator content underperforms native creator voice by 40 to 60 percent on engagement rate.
Buyer intent content for food brand blogs
Buyer intent content on food brand blogs covers 8 to 16 pieces targeting explicit purchase-decision queries: “where to buy [brand],” “[brand] subscription vs. one-time,” “best [category] for [use case],” and “[brand] gift bundle.” Every buyer intent piece runs 1,400 to 2,400 words with a comparison table, product cards, and a clear conversion path to the specific SKU that matches the query intent. Buyer intent content converts at 3 to 6 percent versus 1 to 2 percent on recipe content because the shopper landed already planning to buy, not exploring a usage occasion.
Where-to-buy content structure
Where-to-buy content structure covers online (DTC storefront, Amazon, Target.com, Whole Foods online), retail (specific chain locators with the store finder embedded), and international (customs limitations, retailer partners abroad). Every piece names specific retailers, links to the store locator, and includes an FAQ block covering shipping availability, subscription options, and gift card compatibility. Where-to-buy content ranks for branded discovery queries the DTC storefront otherwise loses to competitor affiliate reviews.
Subscription versus one-time comparison content
Subscription versus one-time comparison content converts subscription commitments at 3 to 6 percent because it addresses the price-sensitivity concern head-on with a specific math table. The piece covers the discount structure (15 percent lifetime), the skip-a-month mechanic, the pause-anytime rule, the cancellation policy, and the specific yearly savings for the brand’s average consumption cadence. Cross-reference the retention structure on our food and beverage marketing retainer page.
Content refresh cadence on food brand pillars
Content refresh cadence on food brand content pillars runs a rolling audit every 12 to 24 months by pillar. Recipes get refreshed every 12 months with new photography, updated schema, and any nutrition or ingredient adjustments. Ingredient comparison guides refresh every 18 months to update market data. Sourcing story pages refresh every 24 months to reflect farm partnership changes and new harvest angles. Buyer intent content refreshes every 12 months to update retailer availability and pricing.
Recipe refresh priority order
Recipe refresh priority runs by organic traffic rank. The top 20 recipes by monthly organic sessions get refreshed first (new photography, schema audit, related recipe internal links, updated nutrition). The next 40 get refreshed at 15 months. The remaining recipes get refreshed opportunistically when the ranking slips past position 15 in Google. Skipping the refresh cadence lets recipe rankings drift out of the top 3 inside 18 months as newer competitor recipes take the position.
Schema audit checklist per refresh
The schema audit checklist per refresh runs 8 items: Recipe schema completeness, aggregateRating count and accuracy, nutrition data accuracy, prepTime and cookTime match the recipe body, image URLs valid at CDN, related recipe internal links working, product card SKU URL live, and Google Search Console rich result eligibility validated. This checklist takes 20 minutes per recipe and prevents the schema drift that costs recipe rankings 20 to 40 positions quietly.
Reporting cadence for food brand content marketing
Reporting cadence on food brand content marketing runs a monthly executive report plus a quarterly business review. The monthly report ships in the first business week and covers organic sessions by pillar, top 10 ranking recipes with position trend, ingredient guide ranking movements, sourcing page performance, and organic-attributed DTC revenue. Every number carries a comparison to the prior month and a plain-language interpretation the founder reads in 7 minutes.
Metrics that matter for content marketing
Metrics that matter for food brand content marketing: organic sessions by pillar, recipe rich result impressions in Search Console, organic conversion rate to hero SKU pages, organic-attributed DTC revenue, and top 20 ranking positions by monthly organic sessions. Vanity metrics that do not matter: total pageviews without conversion context, average time on page without conversion attribution, and social share counts. The monthly report skips the vanity block entirely.
Quarterly business review structure
The quarterly business review runs 90 minutes with the founder, head of content, and SEO lead. Agenda: organic traffic trend by pillar, top 10 winning content pieces, top 10 losing content pieces (candidates for refresh or removal), competitive gap analysis against 5 named competitor brands, and next quarter’s content calendar with recipes and ingredient guides queued. According to Ahrefs content marketing research, brands running quarterly content audits outperform brands running annual audits by 40 to 70 percent on organic revenue over a 24-month window.
Internal linking discipline across food brand content
Internal linking discipline across food brand content moves authority from recipe pages toward hero SKU product pages and comparison guides. Every recipe links to the hero SKU it uses inline (once in the ingredient list, once in a bottom call-out card). Every ingredient comparison guide links to 3 to 6 recipes using the winning ingredient plus the hero SKU product page. Every sourcing story links to the 2 to 4 SKUs sourced from that specific farm or cooperative.
Anchor text strategy across recipe hubs
Anchor text on internal links varies across recipe hubs to avoid over-optimization patterns Google penalizes. Exact-match anchor (“single-origin Ethiopian coffee”) runs on 20 to 30 percent of internal links. Partial-match variations (“our Ethiopian roast”) run on 30 to 40 percent. Branded anchors (the SKU name) run on 20 to 30 percent. Generic anchors (“shop the coffee”) fill the remaining 10 to 20 percent. This ratio holds ranking without triggering the over-optimization penalty that shows up on brands that anchor-text-stuff every internal link with the same exact-match keyword. Cross-reference the linking layer on our food and beverage web design page.
Link equity from ingredient guides to SKU pages
Link equity from ingredient guides passes to SKU pages when the guide’s comparison table names the hero SKU in the winning column with a product card, and when the guide’s body links to 3 to 6 recipes that use the winning ingredient. This 3-hop path (guide to recipe to SKU) pushes authority from a high-traffic informational query down to a high-intent transactional page. According to Search Engine Land SEO coverage, informational content that internally links to transactional pages produces 2 to 4 times higher organic revenue than isolated content silos.
Wrapping up content marketing for food brands
Content marketing for food brands is the organic engine that turns a DTC snack, drink, or CPG storefront into a search-driven revenue channel. Recipe hub of 40 to 100 recipes. Ingredient comparison guides at 12 to 24 pieces. Sourcing story pages at 6 to 12 pieces. Buyer intent content at 8 to 16 pieces. Creator syndication calendar with 12 to 30 creators per quarter. Refresh cadence at 12 to 24 months by pillar. Reporting with organic sessions and organic revenue attribution.
If your DTC food brand is running paid social at 20,000 dollars monthly with a broken blog and zero recipe schema, professional content marketing for food brands pays for itself inside the first 90 days on organic traffic captured. Redefine Web ships content marketing inside our monthly retainer packages. Book a call and we will walk through the last three DTC food brands we built recipe hubs for, pillar by pillar.
Internal linking discipline across food brand content moves authority from recipe pages toward hero SKU product pages and comparison guides. Every recipe links to the hero SKU it uses inline (once in the ingredient list, once in a bottom call-out card). Every ingredient comparison guide links to 3 to 6 recipes using the winning ingredient plus the hero SKU product page. Every sourcing story links to the 2 to 4 SKUs sourced from that specific farm or cooperative.
Anchor text strategy across recipe hubs
Anchor text on internal links varies across recipe hubs to avoid over-optimization patterns Google penalizes. Exact-match anchor (“single-origin Ethiopian coffee”) runs on 20 to 30 percent of internal links. Partial-match variations (“our Ethiopian roast”) run on 30 to 40 percent. Branded anchors (the SKU name) run on 20 to 30 percent. Generic anchors (“shop the coffee”) fill the remaining 10 to 20 percent. This ratio holds ranking without triggering the over-optimization penalty that shows up on brands that anchor-text-stuff every internal link with the same exact-match keyword. Cross-reference the linking layer on our food and beverage web design page.
Link equity from ingredient guides to SKU pages
Link equity from ingredient guides passes to SKU pages when the guide’s comparison table names the hero SKU in the winning column with a product card, and when the guide’s body links to 3 to 6 recipes that use the winning ingredient. This 3-hop path (guide to recipe to SKU) pushes authority from a high-traffic informational query down to a high-intent transactional page. According to Search Engine Land SEO coverage, informational content that internally links to transactional pages produces 2 to 4 times higher organic revenue than isolated content silos.
Wrapping up content marketing for food brands
Content marketing for food brands is the organic engine that turns a DTC snack, drink, or CPG storefront into a search-driven revenue channel. Recipe hub of 40 to 100 recipes. Ingredient comparison guides at 12 to 24 pieces. Sourcing story pages at 6 to 12 pieces. Buyer intent content at 8 to 16 pieces. Creator syndication calendar with 12 to 30 creators per quarter. Refresh cadence at 12 to 24 months by pillar. Reporting with organic sessions and organic revenue attribution.
If your DTC food brand is running paid social at 20,000 dollars monthly with a broken blog and zero recipe schema, professional content marketing for food brands pays for itself inside the first 90 days on organic traffic captured. Redefine Web ships content marketing inside our monthly retainer packages. Book a call and we will walk through the last three DTC food brands we built recipe hubs for, pillar by pillar.
Content marketing for food brands starts with a recipe hub because recipe queries account for 40 to 60 percent of high-intent search volume in the food category. Every hero SKU needs 4 to 12 recipes anchored to it, each targeting a specific occasion and audience.
Skip the recipe hub and the brand loses the search real estate that pulls DTC storefront traffic month over month at zero incremental paid cost. Recipe traffic converts at 2 to 4 percent because the shopper landed with usage intent, not passive discovery, which is why food brands win on recipes.
Recipe schema and Google rich result eligibility
Every recipe page ships schema.org Recipe markup including cookTime, prepTime, recipeIngredient, recipeInstructions, nutrition, and aggregateRating. Correctly marked-up recipes qualify for Google’s recipe rich result carousel that pulls 3 to 6 times higher click-through rate than a plain blue link. The schema layer takes 15 minutes per recipe to author and 30 minutes to validate in Google Search Console. Cross-reference the recipe search stack on our food and beverage SEO page.
Recipe hub structure that scales
The recipe hub structure runs 40 to 100 recipes at maturity, organized by hero SKU (4 to 12 recipes per SKU) plus occasion tags (breakfast, weeknight dinner, meal prep, brunch, holiday). Every recipe links back to the hero SKU product page with the SKU embedded in an inline card. The hub earns internal linking value from ingredient comparison guides and the sourcing story pages, which feeds recipe ranking on Google. According to Google Search Central recipe structured data guidance, complete Recipe schema markup is required for eligibility in the recipe carousel and the ingredient search filter.
Pillar structure for food brand content marketing
The pillar structure on content marketing for food brands runs 4 content pillars concurrently: recipe hub (40 to 100 recipes), ingredient comparison guides (12 to 24 guides), sourcing story pages (6 to 12 pages), and buyer intent content (where to buy, subscription vs. one-time, gift bundle guides). Every pillar covers a distinct search intent and every pillar links back to the hero SKU product pages.
Ingredient comparison guide format
Ingredient comparison guides run 1,800 to 3,200 words comparing 2 to 4 ingredient types on 6 to 10 attributes with a comparison table, real-world use case examples, and links to the hero SKU that uses the specific ingredient. Example: organic vs. conventional oats compares nutritional profile, sourcing chain, cost, environmental impact, and taste on a 6-column table. The brand’s SKU appears in the winning column with a product card. These guides rank 3 to 8 months after publication and pull steady-state organic traffic.
Sourcing story pages that build trust
Sourcing story pages name the specific farms, cooperatives, or suppliers the brand sources from, with photos of the farms, farmer quotes, and specific harvest windows. A coffee brand’s Ethiopian farm page ranks for “single-origin Ethiopian coffee” and “Yirgacheffe coffee origin” plus 40 long-tail variations. The sourcing page pulls trust-building traffic that converts at 4 to 6 percent because the shopper landed pattern-matching on transparency and named provenance. Every sourcing page includes farmer or cooperative quotes, harvest dates, and a link back to 3 to 5 hero SKU pages that source from the named supplier.
Vejrø hospitality content case study
Vejrø Resort, a Danish private-island destination with an on-site restaurant focused on organic, locally sourced cuisine, joined us with strong social engagement and no organic-search real estate. Guests found the resort on Instagram but never in Google search for terms like “private island resort Denmark,” “farm-to-table hospitality Denmark,” or “Vejrø restaurant.” The same organic-search gap shows up on DTC food brands running paid social at 20,000 dollars monthly with a broken blog and zero recipe schema.
We built the conversion-focused website with on-site and off-site SEO tuned to the travel-niche keyword clusters, competitor analysis against comparable boutique resorts, and mobile-first design prioritizing guest discovery. Every page carried the structured data qualifying it for Google’s rich results in the hospitality category. Every internal link pushed authority toward the direct-booking conversion path.
Three months later, Vejrø hit 10,000 plus organic visitors, ranked for 200 plus first-page keywords, and pulled a 2.2 percent booking conversion rate from organic traffic. The same pattern applies to content marketing for food brands: recipe schema, ingredient comparison guides, and sourcing story pages pull organic traffic at 20 to 40 percent conversion into hero SKU pages inside 6 months when the content quality matches search intent and every page carries the right structured data markup. Vejrø also proved out the reporting discipline: every monthly report named the exact page, the exact keyword cluster, and the exact search feature (rich result, sitelinks, image pack) driving the incremental organic revenue instead of hiding behind aggregate traffic charts.
Recipe cadence and content calendar for food brands
Recipe cadence on a working food brand content calendar ships 2 to 4 new recipes per week during the first 6 months and drops to 1 per week at maturity. Each recipe takes 4 to 6 hours to produce (write, test in the kitchen, photograph, schema author, publish). At 3 recipes per week, the brand hits 78 recipes inside 6 months plus a backlog of ingredient comparison and sourcing content queued behind the recipe production line.
| Content pillar | Target volume year 1 | Production cost per piece | Refresh cadence |
|---|---|---|---|
| Recipe hub | 40 to 100 recipes | $180 to $320 | Every 12 months |
| Ingredient comparison guides | 12 to 24 guides | $450 to $780 | Every 18 months |
| Sourcing story pages | 6 to 12 pages | $680 to $1,200 | Every 24 months |
| Buyer intent content | 8 to 16 pieces | $220 to $420 | Every 12 months |
Photography as a content calendar constraint
Photography is the actual constraint on recipe cadence, not writing. Every recipe needs 6 to 12 photos: hero shot, ingredient flat lay, prep in progress, plated result, storage, and step shots for the schema markup. A working food brand batches photography 8 recipes at a time to keep the cost per recipe under 200 dollars. Skip the batching and the per-recipe cost climbs to 400 to 600 dollars, which caps recipe cadence at 1 per week and slows organic ranking timeline by 6 months.
Seasonal content calendar planning
Seasonal content calendar planning maps recipes and comparison guides to the seasonal windows they need to rank in. A Christmas cookie recipe needs to publish in September to rank by early December. A Valentine’s chocolate guide needs to publish in November to rank by early February. A back-to-school lunchbox recipe needs to publish in June to rank by late August. The 60-to-90-day ranking curve dictates the calendar.
Creator syndication inside food brand content
Creator syndication on food brand content marketing amplifies the recipe hub through Instagram Reels, TikTok, and YouTube Shorts creators paid to post their own version of the brand’s hero recipes. The creator content pulls net-new audiences into the recipe hub through the creator’s Link in Bio or Amazon Storefront tag. The syndication calendar names 12 to 30 creators per quarter with specific recipes assigned to each.
One brand we picked up had a spreadsheet titled “creator outreach 2023” with 47 rows and 3 responses. All 3 responses were auto-replies. The spreadsheet named zero recipes and offered flat rates below 100 dollars per post. Nobody posts a 30-second video for 87 dollars flat. Nobody.
Creator content commercial terms that work
Working creator content commercial terms run 350 to 1,500 dollars flat per post plus a 12 to 25 percent commission on tagged sales across a 30-day window. The commission mechanic pulls creators into follow-up posts because the incremental revenue continues past the initial fee. Mid-tier creators (30k to 150k followers) hit the sweet spot for food brand content because their engagement rate typically runs 4 to 8 percent versus 0.8 to 1.6 percent on mega-creators.
Content brief structure for creator partnerships
The content brief structure for creator partnerships runs a single page: the SKU, the specific recipe or usage occasion, 3 required brand mentions, 3 restricted claims (no health claims on non-medical SKUs), the pricing angle, the affiliate link, and 3 example videos that hit the tone. The brief avoids over-scripting because over-scripted creator content underperforms native creator voice by 40 to 60 percent on engagement rate.
Buyer intent content for food brand blogs
Buyer intent content on food brand blogs covers 8 to 16 pieces targeting explicit purchase-decision queries: “where to buy [brand],” “[brand] subscription vs. one-time,” “best [category] for [use case],” and “[brand] gift bundle.” Every buyer intent piece runs 1,400 to 2,400 words with a comparison table, product cards, and a clear conversion path to the specific SKU that matches the query intent. Buyer intent content converts at 3 to 6 percent versus 1 to 2 percent on recipe content because the shopper landed already planning to buy, not exploring a usage occasion.
Where-to-buy content structure
Where-to-buy content structure covers online (DTC storefront, Amazon, Target.com, Whole Foods online), retail (specific chain locators with the store finder embedded), and international (customs limitations, retailer partners abroad). Every piece names specific retailers, links to the store locator, and includes an FAQ block covering shipping availability, subscription options, and gift card compatibility. Where-to-buy content ranks for branded discovery queries the DTC storefront otherwise loses to competitor affiliate reviews.
Subscription versus one-time comparison content
Subscription versus one-time comparison content converts subscription commitments at 3 to 6 percent because it addresses the price-sensitivity concern head-on with a specific math table. The piece covers the discount structure (15 percent lifetime), the skip-a-month mechanic, the pause-anytime rule, the cancellation policy, and the specific yearly savings for the brand’s average consumption cadence. Cross-reference the retention structure on our food and beverage marketing retainer page.
Content refresh cadence on food brand pillars
Content refresh cadence on food brand content pillars runs a rolling audit every 12 to 24 months by pillar. Recipes get refreshed every 12 months with new photography, updated schema, and any nutrition or ingredient adjustments. Ingredient comparison guides refresh every 18 months to update market data. Sourcing story pages refresh every 24 months to reflect farm partnership changes and new harvest angles. Buyer intent content refreshes every 12 months to update retailer availability and pricing.
Recipe refresh priority order
Recipe refresh priority runs by organic traffic rank. The top 20 recipes by monthly organic sessions get refreshed first (new photography, schema audit, related recipe internal links, updated nutrition). The next 40 get refreshed at 15 months. The remaining recipes get refreshed opportunistically when the ranking slips past position 15 in Google. Skipping the refresh cadence lets recipe rankings drift out of the top 3 inside 18 months as newer competitor recipes take the position.
Schema audit checklist per refresh
The schema audit checklist per refresh runs 8 items: Recipe schema completeness, aggregateRating count and accuracy, nutrition data accuracy, prepTime and cookTime match the recipe body, image URLs valid at CDN, related recipe internal links working, product card SKU URL live, and Google Search Console rich result eligibility validated. This checklist takes 20 minutes per recipe and prevents the schema drift that costs recipe rankings 20 to 40 positions quietly.
Reporting cadence for food brand content marketing
Reporting cadence on food brand content marketing runs a monthly executive report plus a quarterly business review. The monthly report ships in the first business week and covers organic sessions by pillar, top 10 ranking recipes with position trend, ingredient guide ranking movements, sourcing page performance, and organic-attributed DTC revenue. Every number carries a comparison to the prior month and a plain-language interpretation the founder reads in 7 minutes.
Metrics that matter for content marketing
Metrics that matter for food brand content marketing: organic sessions by pillar, recipe rich result impressions in Search Console, organic conversion rate to hero SKU pages, organic-attributed DTC revenue, and top 20 ranking positions by monthly organic sessions. Vanity metrics that do not matter: total pageviews without conversion context, average time on page without conversion attribution, and social share counts. The monthly report skips the vanity block entirely.
Quarterly business review structure
The quarterly business review runs 90 minutes with the founder, head of content, and SEO lead. Agenda: organic traffic trend by pillar, top 10 winning content pieces, top 10 losing content pieces (candidates for refresh or removal), competitive gap analysis against 5 named competitor brands, and next quarter’s content calendar with recipes and ingredient guides queued. According to Ahrefs content marketing research, brands running quarterly content audits outperform brands running annual audits by 40 to 70 percent on organic revenue over a 24-month window.
Internal linking discipline across food brand content
Internal linking discipline across food brand content moves authority from recipe pages toward hero SKU product pages and comparison guides. Every recipe links to the hero SKU it uses inline (once in the ingredient list, once in a bottom call-out card). Every ingredient comparison guide links to 3 to 6 recipes using the winning ingredient plus the hero SKU product page. Every sourcing story links to the 2 to 4 SKUs sourced from that specific farm or cooperative.
Anchor text strategy across recipe hubs
Anchor text on internal links varies across recipe hubs to avoid over-optimization patterns Google penalizes. Exact-match anchor (“single-origin Ethiopian coffee”) runs on 20 to 30 percent of internal links. Partial-match variations (“our Ethiopian roast”) run on 30 to 40 percent. Branded anchors (the SKU name) run on 20 to 30 percent. Generic anchors (“shop the coffee”) fill the remaining 10 to 20 percent. This ratio holds ranking without triggering the over-optimization penalty that shows up on brands that anchor-text-stuff every internal link with the same exact-match keyword. Cross-reference the linking layer on our food and beverage web design page.
Link equity from ingredient guides to SKU pages
Link equity from ingredient guides passes to SKU pages when the guide’s comparison table names the hero SKU in the winning column with a product card, and when the guide’s body links to 3 to 6 recipes that use the winning ingredient. This 3-hop path (guide to recipe to SKU) pushes authority from a high-traffic informational query down to a high-intent transactional page. According to Search Engine Land SEO coverage, informational content that internally links to transactional pages produces 2 to 4 times higher organic revenue than isolated content silos.
Wrapping up content marketing for food brands
Content marketing for food brands is the organic engine that turns a DTC snack, drink, or CPG storefront into a search-driven revenue channel. Recipe hub of 40 to 100 recipes. Ingredient comparison guides at 12 to 24 pieces. Sourcing story pages at 6 to 12 pieces. Buyer intent content at 8 to 16 pieces. Creator syndication calendar with 12 to 30 creators per quarter. Refresh cadence at 12 to 24 months by pillar. Reporting with organic sessions and organic revenue attribution.
If your DTC food brand is running paid social at 20,000 dollars monthly with a broken blog and zero recipe schema, professional content marketing for food brands pays for itself inside the first 90 days on organic traffic captured. Redefine Web ships content marketing inside our monthly retainer packages. Book a call and we will walk through the last three DTC food brands we built recipe hubs for, pillar by pillar.
Internal linking discipline across food brand content moves authority from recipe pages toward hero SKU product pages and comparison guides. Every recipe links to the hero SKU it uses inline (once in the ingredient list, once in a bottom call-out card). Every ingredient comparison guide links to 3 to 6 recipes using the winning ingredient plus the hero SKU product page. Every sourcing story links to the 2 to 4 SKUs sourced from that specific farm or cooperative.
Anchor text strategy across recipe hubs
Anchor text on internal links varies across recipe hubs to avoid over-optimization patterns Google penalizes. Exact-match anchor (“single-origin Ethiopian coffee”) runs on 20 to 30 percent of internal links. Partial-match variations (“our Ethiopian roast”) run on 30 to 40 percent. Branded anchors (the SKU name) run on 20 to 30 percent. Generic anchors (“shop the coffee”) fill the remaining 10 to 20 percent. This ratio holds ranking without triggering the over-optimization penalty that shows up on brands that anchor-text-stuff every internal link with the same exact-match keyword. Cross-reference the linking layer on our food and beverage web design page.
Link equity from ingredient guides to SKU pages
Link equity from ingredient guides passes to SKU pages when the guide’s comparison table names the hero SKU in the winning column with a product card, and when the guide’s body links to 3 to 6 recipes that use the winning ingredient. This 3-hop path (guide to recipe to SKU) pushes authority from a high-traffic informational query down to a high-intent transactional page. According to Search Engine Land SEO coverage, informational content that internally links to transactional pages produces 2 to 4 times higher organic revenue than isolated content silos.
Wrapping up content marketing for food brands
Content marketing for food brands is the organic engine that turns a DTC snack, drink, or CPG storefront into a search-driven revenue channel. Recipe hub of 40 to 100 recipes. Ingredient comparison guides at 12 to 24 pieces. Sourcing story pages at 6 to 12 pieces. Buyer intent content at 8 to 16 pieces. Creator syndication calendar with 12 to 30 creators per quarter. Refresh cadence at 12 to 24 months by pillar. Reporting with organic sessions and organic revenue attribution.
If your DTC food brand is running paid social at 20,000 dollars monthly with a broken blog and zero recipe schema, professional content marketing for food brands pays for itself inside the first 90 days on organic traffic captured. Redefine Web ships content marketing inside our monthly retainer packages. Book a call and we will walk through the last three DTC food brands we built recipe hubs for, pillar by pillar.
Content marketing for food brands starts with a recipe hub because recipe queries account for 40 to 60 percent of high-intent search volume in the food category. Every hero SKU needs 4 to 12 recipes anchored to it, each targeting a specific occasion and audience.
Skip the recipe hub and the brand loses the search real estate that pulls DTC storefront traffic month over month at zero incremental paid cost. Recipe traffic converts at 2 to 4 percent because the shopper landed with usage intent, not passive discovery, which is why food brands win on recipes.
Recipe schema and Google rich result eligibility
Every recipe page ships schema.org Recipe markup including cookTime, prepTime, recipeIngredient, recipeInstructions, nutrition, and aggregateRating. Correctly marked-up recipes qualify for Google’s recipe rich result carousel that pulls 3 to 6 times higher click-through rate than a plain blue link. The schema layer takes 15 minutes per recipe to author and 30 minutes to validate in Google Search Console. Cross-reference the recipe search stack on our food and beverage SEO page.
Recipe hub structure that scales
The recipe hub structure runs 40 to 100 recipes at maturity, organized by hero SKU (4 to 12 recipes per SKU) plus occasion tags (breakfast, weeknight dinner, meal prep, brunch, holiday). Every recipe links back to the hero SKU product page with the SKU embedded in an inline card. The hub earns internal linking value from ingredient comparison guides and the sourcing story pages, which feeds recipe ranking on Google. According to Google Search Central recipe structured data guidance, complete Recipe schema markup is required for eligibility in the recipe carousel and the ingredient search filter.
Pillar structure for food brand content marketing
The pillar structure on content marketing for food brands runs 4 content pillars concurrently: recipe hub (40 to 100 recipes), ingredient comparison guides (12 to 24 guides), sourcing story pages (6 to 12 pages), and buyer intent content (where to buy, subscription vs. one-time, gift bundle guides). Every pillar covers a distinct search intent and every pillar links back to the hero SKU product pages.
Ingredient comparison guide format
Ingredient comparison guides run 1,800 to 3,200 words comparing 2 to 4 ingredient types on 6 to 10 attributes with a comparison table, real-world use case examples, and links to the hero SKU that uses the specific ingredient. Example: organic vs. conventional oats compares nutritional profile, sourcing chain, cost, environmental impact, and taste on a 6-column table. The brand’s SKU appears in the winning column with a product card. These guides rank 3 to 8 months after publication and pull steady-state organic traffic.
Sourcing story pages that build trust
Sourcing story pages name the specific farms, cooperatives, or suppliers the brand sources from, with photos of the farms, farmer quotes, and specific harvest windows. A coffee brand’s Ethiopian farm page ranks for “single-origin Ethiopian coffee” and “Yirgacheffe coffee origin” plus 40 long-tail variations. The sourcing page pulls trust-building traffic that converts at 4 to 6 percent because the shopper landed pattern-matching on transparency and named provenance. Every sourcing page includes farmer or cooperative quotes, harvest dates, and a link back to 3 to 5 hero SKU pages that source from the named supplier.
Vejrø hospitality content case study
Vejrø Resort, a Danish private-island destination with an on-site restaurant focused on organic, locally sourced cuisine, joined us with strong social engagement and no organic-search real estate. Guests found the resort on Instagram but never in Google search for terms like “private island resort Denmark,” “farm-to-table hospitality Denmark,” or “Vejrø restaurant.” The same organic-search gap shows up on DTC food brands running paid social at 20,000 dollars monthly with a broken blog and zero recipe schema.
We built the conversion-focused website with on-site and off-site SEO tuned to the travel-niche keyword clusters, competitor analysis against comparable boutique resorts, and mobile-first design prioritizing guest discovery. Every page carried the structured data qualifying it for Google’s rich results in the hospitality category. Every internal link pushed authority toward the direct-booking conversion path.
Three months later, Vejrø hit 10,000 plus organic visitors, ranked for 200 plus first-page keywords, and pulled a 2.2 percent booking conversion rate from organic traffic. The same pattern applies to content marketing for food brands: recipe schema, ingredient comparison guides, and sourcing story pages pull organic traffic at 20 to 40 percent conversion into hero SKU pages inside 6 months when the content quality matches search intent and every page carries the right structured data markup. Vejrø also proved out the reporting discipline: every monthly report named the exact page, the exact keyword cluster, and the exact search feature (rich result, sitelinks, image pack) driving the incremental organic revenue instead of hiding behind aggregate traffic charts.
Recipe cadence and content calendar for food brands
Recipe cadence on a working food brand content calendar ships 2 to 4 new recipes per week during the first 6 months and drops to 1 per week at maturity. Each recipe takes 4 to 6 hours to produce (write, test in the kitchen, photograph, schema author, publish). At 3 recipes per week, the brand hits 78 recipes inside 6 months plus a backlog of ingredient comparison and sourcing content queued behind the recipe production line.
| Content pillar | Target volume year 1 | Production cost per piece | Refresh cadence |
|---|---|---|---|
| Recipe hub | 40 to 100 recipes | $180 to $320 | Every 12 months |
| Ingredient comparison guides | 12 to 24 guides | $450 to $780 | Every 18 months |
| Sourcing story pages | 6 to 12 pages | $680 to $1,200 | Every 24 months |
| Buyer intent content | 8 to 16 pieces | $220 to $420 | Every 12 months |
Photography as a content calendar constraint
Photography is the actual constraint on recipe cadence, not writing. Every recipe needs 6 to 12 photos: hero shot, ingredient flat lay, prep in progress, plated result, storage, and step shots for the schema markup. A working food brand batches photography 8 recipes at a time to keep the cost per recipe under 200 dollars. Skip the batching and the per-recipe cost climbs to 400 to 600 dollars, which caps recipe cadence at 1 per week and slows organic ranking timeline by 6 months.
Seasonal content calendar planning
Seasonal content calendar planning maps recipes and comparison guides to the seasonal windows they need to rank in. A Christmas cookie recipe needs to publish in September to rank by early December. A Valentine’s chocolate guide needs to publish in November to rank by early February. A back-to-school lunchbox recipe needs to publish in June to rank by late August. The 60-to-90-day ranking curve dictates the calendar.
Creator syndication inside food brand content
Creator syndication on food brand content marketing amplifies the recipe hub through Instagram Reels, TikTok, and YouTube Shorts creators paid to post their own version of the brand’s hero recipes. The creator content pulls net-new audiences into the recipe hub through the creator’s Link in Bio or Amazon Storefront tag. The syndication calendar names 12 to 30 creators per quarter with specific recipes assigned to each.
One brand we picked up had a spreadsheet titled “creator outreach 2023” with 47 rows and 3 responses. All 3 responses were auto-replies. The spreadsheet named zero recipes and offered flat rates below 100 dollars per post. Nobody posts a 30-second video for 87 dollars flat. Nobody.
Creator content commercial terms that work
Working creator content commercial terms run 350 to 1,500 dollars flat per post plus a 12 to 25 percent commission on tagged sales across a 30-day window. The commission mechanic pulls creators into follow-up posts because the incremental revenue continues past the initial fee. Mid-tier creators (30k to 150k followers) hit the sweet spot for food brand content because their engagement rate typically runs 4 to 8 percent versus 0.8 to 1.6 percent on mega-creators.
Content brief structure for creator partnerships
The content brief structure for creator partnerships runs a single page: the SKU, the specific recipe or usage occasion, 3 required brand mentions, 3 restricted claims (no health claims on non-medical SKUs), the pricing angle, the affiliate link, and 3 example videos that hit the tone. The brief avoids over-scripting because over-scripted creator content underperforms native creator voice by 40 to 60 percent on engagement rate.
Buyer intent content for food brand blogs
Buyer intent content on food brand blogs covers 8 to 16 pieces targeting explicit purchase-decision queries: “where to buy [brand],” “[brand] subscription vs. one-time,” “best [category] for [use case],” and “[brand] gift bundle.” Every buyer intent piece runs 1,400 to 2,400 words with a comparison table, product cards, and a clear conversion path to the specific SKU that matches the query intent. Buyer intent content converts at 3 to 6 percent versus 1 to 2 percent on recipe content because the shopper landed already planning to buy, not exploring a usage occasion.
Where-to-buy content structure
Where-to-buy content structure covers online (DTC storefront, Amazon, Target.com, Whole Foods online), retail (specific chain locators with the store finder embedded), and international (customs limitations, retailer partners abroad). Every piece names specific retailers, links to the store locator, and includes an FAQ block covering shipping availability, subscription options, and gift card compatibility. Where-to-buy content ranks for branded discovery queries the DTC storefront otherwise loses to competitor affiliate reviews.
Subscription versus one-time comparison content
Subscription versus one-time comparison content converts subscription commitments at 3 to 6 percent because it addresses the price-sensitivity concern head-on with a specific math table. The piece covers the discount structure (15 percent lifetime), the skip-a-month mechanic, the pause-anytime rule, the cancellation policy, and the specific yearly savings for the brand’s average consumption cadence. Cross-reference the retention structure on our food and beverage marketing retainer page.
Content refresh cadence on food brand pillars
Content refresh cadence on food brand content pillars runs a rolling audit every 12 to 24 months by pillar. Recipes get refreshed every 12 months with new photography, updated schema, and any nutrition or ingredient adjustments. Ingredient comparison guides refresh every 18 months to update market data. Sourcing story pages refresh every 24 months to reflect farm partnership changes and new harvest angles. Buyer intent content refreshes every 12 months to update retailer availability and pricing.
Recipe refresh priority order
Recipe refresh priority runs by organic traffic rank. The top 20 recipes by monthly organic sessions get refreshed first (new photography, schema audit, related recipe internal links, updated nutrition). The next 40 get refreshed at 15 months. The remaining recipes get refreshed opportunistically when the ranking slips past position 15 in Google. Skipping the refresh cadence lets recipe rankings drift out of the top 3 inside 18 months as newer competitor recipes take the position.
Schema audit checklist per refresh
The schema audit checklist per refresh runs 8 items: Recipe schema completeness, aggregateRating count and accuracy, nutrition data accuracy, prepTime and cookTime match the recipe body, image URLs valid at CDN, related recipe internal links working, product card SKU URL live, and Google Search Console rich result eligibility validated. This checklist takes 20 minutes per recipe and prevents the schema drift that costs recipe rankings 20 to 40 positions quietly.
Reporting cadence for food brand content marketing
Reporting cadence on food brand content marketing runs a monthly executive report plus a quarterly business review. The monthly report ships in the first business week and covers organic sessions by pillar, top 10 ranking recipes with position trend, ingredient guide ranking movements, sourcing page performance, and organic-attributed DTC revenue. Every number carries a comparison to the prior month and a plain-language interpretation the founder reads in 7 minutes.
Metrics that matter for content marketing
Metrics that matter for food brand content marketing: organic sessions by pillar, recipe rich result impressions in Search Console, organic conversion rate to hero SKU pages, organic-attributed DTC revenue, and top 20 ranking positions by monthly organic sessions. Vanity metrics that do not matter: total pageviews without conversion context, average time on page without conversion attribution, and social share counts. The monthly report skips the vanity block entirely.
Quarterly business review structure
The quarterly business review runs 90 minutes with the founder, head of content, and SEO lead. Agenda: organic traffic trend by pillar, top 10 winning content pieces, top 10 losing content pieces (candidates for refresh or removal), competitive gap analysis against 5 named competitor brands, and next quarter’s content calendar with recipes and ingredient guides queued. According to Ahrefs content marketing research, brands running quarterly content audits outperform brands running annual audits by 40 to 70 percent on organic revenue over a 24-month window.
Internal linking discipline across food brand content
Internal linking discipline across food brand content moves authority from recipe pages toward hero SKU product pages and comparison guides. Every recipe links to the hero SKU it uses inline (once in the ingredient list, once in a bottom call-out card). Every ingredient comparison guide links to 3 to 6 recipes using the winning ingredient plus the hero SKU product page. Every sourcing story links to the 2 to 4 SKUs sourced from that specific farm or cooperative.
Anchor text strategy across recipe hubs
Anchor text on internal links varies across recipe hubs to avoid over-optimization patterns Google penalizes. Exact-match anchor (“single-origin Ethiopian coffee”) runs on 20 to 30 percent of internal links. Partial-match variations (“our Ethiopian roast”) run on 30 to 40 percent. Branded anchors (the SKU name) run on 20 to 30 percent. Generic anchors (“shop the coffee”) fill the remaining 10 to 20 percent. This ratio holds ranking without triggering the over-optimization penalty that shows up on brands that anchor-text-stuff every internal link with the same exact-match keyword. Cross-reference the linking layer on our food and beverage web design page.
Link equity from ingredient guides to SKU pages
Link equity from ingredient guides passes to SKU pages when the guide’s comparison table names the hero SKU in the winning column with a product card, and when the guide’s body links to 3 to 6 recipes that use the winning ingredient. This 3-hop path (guide to recipe to SKU) pushes authority from a high-traffic informational query down to a high-intent transactional page. According to Search Engine Land SEO coverage, informational content that internally links to transactional pages produces 2 to 4 times higher organic revenue than isolated content silos.
Wrapping up content marketing for food brands
Content marketing for food brands is the organic engine that turns a DTC snack, drink, or CPG storefront into a search-driven revenue channel. Recipe hub of 40 to 100 recipes. Ingredient comparison guides at 12 to 24 pieces. Sourcing story pages at 6 to 12 pieces. Buyer intent content at 8 to 16 pieces. Creator syndication calendar with 12 to 30 creators per quarter. Refresh cadence at 12 to 24 months by pillar. Reporting with organic sessions and organic revenue attribution.
If your DTC food brand is running paid social at 20,000 dollars monthly with a broken blog and zero recipe schema, professional content marketing for food brands pays for itself inside the first 90 days on organic traffic captured. Redefine Web ships content marketing inside our monthly retainer packages. Book a call and we will walk through the last three DTC food brands we built recipe hubs for, pillar by pillar.
Content marketing for food brands starts with a recipe hub because recipe queries account for 40 to 60 percent of high-intent search volume in the food category. Every hero SKU needs 4 to 12 recipes anchored to it, each targeting a specific occasion and audience.
Skip the recipe hub and the brand loses the search real estate that pulls DTC storefront traffic month over month at zero incremental paid cost. Recipe traffic converts at 2 to 4 percent because the shopper landed with usage intent, not passive discovery, which is why food brands win on recipes.
Recipe schema and Google rich result eligibility
Every recipe page ships schema.org Recipe markup including cookTime, prepTime, recipeIngredient, recipeInstructions, nutrition, and aggregateRating. Correctly marked-up recipes qualify for Google’s recipe rich result carousel that pulls 3 to 6 times higher click-through rate than a plain blue link. The schema layer takes 15 minutes per recipe to author and 30 minutes to validate in Google Search Console. Cross-reference the recipe search stack on our food and beverage SEO page.
Recipe hub structure that scales
The recipe hub structure runs 40 to 100 recipes at maturity, organized by hero SKU (4 to 12 recipes per SKU) plus occasion tags (breakfast, weeknight dinner, meal prep, brunch, holiday). Every recipe links back to the hero SKU product page with the SKU embedded in an inline card. The hub earns internal linking value from ingredient comparison guides and the sourcing story pages, which feeds recipe ranking on Google. According to Google Search Central recipe structured data guidance, complete Recipe schema markup is required for eligibility in the recipe carousel and the ingredient search filter.
Pillar structure for food brand content marketing
The pillar structure on content marketing for food brands runs 4 content pillars concurrently: recipe hub (40 to 100 recipes), ingredient comparison guides (12 to 24 guides), sourcing story pages (6 to 12 pages), and buyer intent content (where to buy, subscription vs. one-time, gift bundle guides). Every pillar covers a distinct search intent and every pillar links back to the hero SKU product pages.
Ingredient comparison guide format
Ingredient comparison guides run 1,800 to 3,200 words comparing 2 to 4 ingredient types on 6 to 10 attributes with a comparison table, real-world use case examples, and links to the hero SKU that uses the specific ingredient. Example: organic vs. conventional oats compares nutritional profile, sourcing chain, cost, environmental impact, and taste on a 6-column table. The brand’s SKU appears in the winning column with a product card. These guides rank 3 to 8 months after publication and pull steady-state organic traffic.
Sourcing story pages that build trust
Sourcing story pages name the specific farms, cooperatives, or suppliers the brand sources from, with photos of the farms, farmer quotes, and specific harvest windows. A coffee brand’s Ethiopian farm page ranks for “single-origin Ethiopian coffee” and “Yirgacheffe coffee origin” plus 40 long-tail variations. The sourcing page pulls trust-building traffic that converts at 4 to 6 percent because the shopper landed pattern-matching on transparency and named provenance. Every sourcing page includes farmer or cooperative quotes, harvest dates, and a link back to 3 to 5 hero SKU pages that source from the named supplier.
Vejrø hospitality content case study
Vejrø Resort, a Danish private-island destination with an on-site restaurant focused on organic, locally sourced cuisine, joined us with strong social engagement and no organic-search real estate. Guests found the resort on Instagram but never in Google search for terms like “private island resort Denmark,” “farm-to-table hospitality Denmark,” or “Vejrø restaurant.” The same organic-search gap shows up on DTC food brands running paid social at 20,000 dollars monthly with a broken blog and zero recipe schema.
We built the conversion-focused website with on-site and off-site SEO tuned to the travel-niche keyword clusters, competitor analysis against comparable boutique resorts, and mobile-first design prioritizing guest discovery. Every page carried the structured data qualifying it for Google’s rich results in the hospitality category. Every internal link pushed authority toward the direct-booking conversion path.
Three months later, Vejrø hit 10,000 plus organic visitors, ranked for 200 plus first-page keywords, and pulled a 2.2 percent booking conversion rate from organic traffic. The same pattern applies to content marketing for food brands: recipe schema, ingredient comparison guides, and sourcing story pages pull organic traffic at 20 to 40 percent conversion into hero SKU pages inside 6 months when the content quality matches search intent and every page carries the right structured data markup. Vejrø also proved out the reporting discipline: every monthly report named the exact page, the exact keyword cluster, and the exact search feature (rich result, sitelinks, image pack) driving the incremental organic revenue instead of hiding behind aggregate traffic charts.
Recipe cadence and content calendar for food brands
Recipe cadence on a working food brand content calendar ships 2 to 4 new recipes per week during the first 6 months and drops to 1 per week at maturity. Each recipe takes 4 to 6 hours to produce (write, test in the kitchen, photograph, schema author, publish). At 3 recipes per week, the brand hits 78 recipes inside 6 months plus a backlog of ingredient comparison and sourcing content queued behind the recipe production line.
| Content pillar | Target volume year 1 | Production cost per piece | Refresh cadence |
|---|---|---|---|
| Recipe hub | 40 to 100 recipes | $180 to $320 | Every 12 months |
| Ingredient comparison guides | 12 to 24 guides | $450 to $780 | Every 18 months |
| Sourcing story pages | 6 to 12 pages | $680 to $1,200 | Every 24 months |
| Buyer intent content | 8 to 16 pieces | $220 to $420 | Every 12 months |
Photography as a content calendar constraint
Photography is the actual constraint on recipe cadence, not writing. Every recipe needs 6 to 12 photos: hero shot, ingredient flat lay, prep in progress, plated result, storage, and step shots for the schema markup. A working food brand batches photography 8 recipes at a time to keep the cost per recipe under 200 dollars. Skip the batching and the per-recipe cost climbs to 400 to 600 dollars, which caps recipe cadence at 1 per week and slows organic ranking timeline by 6 months.
Seasonal content calendar planning
Seasonal content calendar planning maps recipes and comparison guides to the seasonal windows they need to rank in. A Christmas cookie recipe needs to publish in September to rank by early December. A Valentine’s chocolate guide needs to publish in November to rank by early February. A back-to-school lunchbox recipe needs to publish in June to rank by late August. The 60-to-90-day ranking curve dictates the calendar.
Creator syndication inside food brand content
Creator syndication on food brand content marketing amplifies the recipe hub through Instagram Reels, TikTok, and YouTube Shorts creators paid to post their own version of the brand’s hero recipes. The creator content pulls net-new audiences into the recipe hub through the creator’s Link in Bio or Amazon Storefront tag. The syndication calendar names 12 to 30 creators per quarter with specific recipes assigned to each.
One brand we picked up had a spreadsheet titled “creator outreach 2023” with 47 rows and 3 responses. All 3 responses were auto-replies. The spreadsheet named zero recipes and offered flat rates below 100 dollars per post. Nobody posts a 30-second video for 87 dollars flat. Nobody.
Creator content commercial terms that work
Working creator content commercial terms run 350 to 1,500 dollars flat per post plus a 12 to 25 percent commission on tagged sales across a 30-day window. The commission mechanic pulls creators into follow-up posts because the incremental revenue continues past the initial fee. Mid-tier creators (30k to 150k followers) hit the sweet spot for food brand content because their engagement rate typically runs 4 to 8 percent versus 0.8 to 1.6 percent on mega-creators.
Content brief structure for creator partnerships
The content brief structure for creator partnerships runs a single page: the SKU, the specific recipe or usage occasion, 3 required brand mentions, 3 restricted claims (no health claims on non-medical SKUs), the pricing angle, the affiliate link, and 3 example videos that hit the tone. The brief avoids over-scripting because over-scripted creator content underperforms native creator voice by 40 to 60 percent on engagement rate.
Buyer intent content for food brand blogs
Buyer intent content on food brand blogs covers 8 to 16 pieces targeting explicit purchase-decision queries: “where to buy [brand],” “[brand] subscription vs. one-time,” “best [category] for [use case],” and “[brand] gift bundle.” Every buyer intent piece runs 1,400 to 2,400 words with a comparison table, product cards, and a clear conversion path to the specific SKU that matches the query intent. Buyer intent content converts at 3 to 6 percent versus 1 to 2 percent on recipe content because the shopper landed already planning to buy, not exploring a usage occasion.
Where-to-buy content structure
Where-to-buy content structure covers online (DTC storefront, Amazon, Target.com, Whole Foods online), retail (specific chain locators with the store finder embedded), and international (customs limitations, retailer partners abroad). Every piece names specific retailers, links to the store locator, and includes an FAQ block covering shipping availability, subscription options, and gift card compatibility. Where-to-buy content ranks for branded discovery queries the DTC storefront otherwise loses to competitor affiliate reviews.
Subscription versus one-time comparison content
Subscription versus one-time comparison content converts subscription commitments at 3 to 6 percent because it addresses the price-sensitivity concern head-on with a specific math table. The piece covers the discount structure (15 percent lifetime), the skip-a-month mechanic, the pause-anytime rule, the cancellation policy, and the specific yearly savings for the brand’s average consumption cadence. Cross-reference the retention structure on our food and beverage marketing retainer page.
Content refresh cadence on food brand pillars
Content refresh cadence on food brand content pillars runs a rolling audit every 12 to 24 months by pillar. Recipes get refreshed every 12 months with new photography, updated schema, and any nutrition or ingredient adjustments. Ingredient comparison guides refresh every 18 months to update market data. Sourcing story pages refresh every 24 months to reflect farm partnership changes and new harvest angles. Buyer intent content refreshes every 12 months to update retailer availability and pricing.
Recipe refresh priority order
Recipe refresh priority runs by organic traffic rank. The top 20 recipes by monthly organic sessions get refreshed first (new photography, schema audit, related recipe internal links, updated nutrition). The next 40 get refreshed at 15 months. The remaining recipes get refreshed opportunistically when the ranking slips past position 15 in Google. Skipping the refresh cadence lets recipe rankings drift out of the top 3 inside 18 months as newer competitor recipes take the position.
Schema audit checklist per refresh
The schema audit checklist per refresh runs 8 items: Recipe schema completeness, aggregateRating count and accuracy, nutrition data accuracy, prepTime and cookTime match the recipe body, image URLs valid at CDN, related recipe internal links working, product card SKU URL live, and Google Search Console rich result eligibility validated. This checklist takes 20 minutes per recipe and prevents the schema drift that costs recipe rankings 20 to 40 positions quietly.
Reporting cadence for food brand content marketing
Reporting cadence on food brand content marketing runs a monthly executive report plus a quarterly business review. The monthly report ships in the first business week and covers organic sessions by pillar, top 10 ranking recipes with position trend, ingredient guide ranking movements, sourcing page performance, and organic-attributed DTC revenue. Every number carries a comparison to the prior month and a plain-language interpretation the founder reads in 7 minutes.
Metrics that matter for content marketing
Metrics that matter for food brand content marketing: organic sessions by pillar, recipe rich result impressions in Search Console, organic conversion rate to hero SKU pages, organic-attributed DTC revenue, and top 20 ranking positions by monthly organic sessions. Vanity metrics that do not matter: total pageviews without conversion context, average time on page without conversion attribution, and social share counts. The monthly report skips the vanity block entirely.
Quarterly business review structure
The quarterly business review runs 90 minutes with the founder, head of content, and SEO lead. Agenda: organic traffic trend by pillar, top 10 winning content pieces, top 10 losing content pieces (candidates for refresh or removal), competitive gap analysis against 5 named competitor brands, and next quarter’s content calendar with recipes and ingredient guides queued. According to Ahrefs content marketing research, brands running quarterly content audits outperform brands running annual audits by 40 to 70 percent on organic revenue over a 24-month window.
Internal linking discipline across food brand content
Internal linking discipline across food brand content moves authority from recipe pages toward hero SKU product pages and comparison guides. Every recipe links to the hero SKU it uses inline (once in the ingredient list, once in a bottom call-out card). Every ingredient comparison guide links to 3 to 6 recipes using the winning ingredient plus the hero SKU product page. Every sourcing story links to the 2 to 4 SKUs sourced from that specific farm or cooperative.
Anchor text strategy across recipe hubs
Anchor text on internal links varies across recipe hubs to avoid over-optimization patterns Google penalizes. Exact-match anchor (“single-origin Ethiopian coffee”) runs on 20 to 30 percent of internal links. Partial-match variations (“our Ethiopian roast”) run on 30 to 40 percent. Branded anchors (the SKU name) run on 20 to 30 percent. Generic anchors (“shop the coffee”) fill the remaining 10 to 20 percent. This ratio holds ranking without triggering the over-optimization penalty that shows up on brands that anchor-text-stuff every internal link with the same exact-match keyword. Cross-reference the linking layer on our food and beverage web design page.
Link equity from ingredient guides to SKU pages
Link equity from ingredient guides passes to SKU pages when the guide’s comparison table names the hero SKU in the winning column with a product card, and when the guide’s body links to 3 to 6 recipes that use the winning ingredient. This 3-hop path (guide to recipe to SKU) pushes authority from a high-traffic informational query down to a high-intent transactional page. According to Search Engine Land SEO coverage, informational content that internally links to transactional pages produces 2 to 4 times higher organic revenue than isolated content silos.
Wrapping up content marketing for food brands
Content marketing for food brands is the organic engine that turns a DTC snack, drink, or CPG storefront into a search-driven revenue channel. Recipe hub of 40 to 100 recipes. Ingredient comparison guides at 12 to 24 pieces. Sourcing story pages at 6 to 12 pieces. Buyer intent content at 8 to 16 pieces. Creator syndication calendar with 12 to 30 creators per quarter. Refresh cadence at 12 to 24 months by pillar. Reporting with organic sessions and organic revenue attribution.
If your DTC food brand is running paid social at 20,000 dollars monthly with a broken blog and zero recipe schema, professional content marketing for food brands pays for itself inside the first 90 days on organic traffic captured. Redefine Web ships content marketing inside our monthly retainer packages. Book a call and we will walk through the last three DTC food brands we built recipe hubs for, pillar by pillar.
Anchor text on internal links varies across recipe hubs to avoid over-optimization patterns Google penalizes. Exact-match anchor (“single-origin Ethiopian coffee”) runs on 20 to 30 percent of internal links. Partial-match variations (“our Ethiopian roast”) run on 30 to 40 percent. Branded anchors (the SKU name) run on 20 to 30 percent. Generic anchors (“shop the coffee”) fill the remaining 10 to 20 percent. This ratio holds ranking without triggering the over-optimization penalty that shows up on brands that anchor-text-stuff every internal link with the same exact-match keyword. Cross-reference the linking layer on our food and beverage web design page.
Link equity from ingredient guides to SKU pages
Link equity from ingredient guides passes to SKU pages when the guide’s comparison table names the hero SKU in the winning column with a product card, and when the guide’s body links to 3 to 6 recipes that use the winning ingredient. This 3-hop path (guide to recipe to SKU) pushes authority from a high-traffic informational query down to a high-intent transactional page. According to Search Engine Land SEO coverage, informational content that internally links to transactional pages produces 2 to 4 times higher organic revenue than isolated content silos.
Wrapping up content marketing for food brands
Content marketing for food brands is the organic engine that turns a DTC snack, drink, or CPG storefront into a search-driven revenue channel. Recipe hub of 40 to 100 recipes. Ingredient comparison guides at 12 to 24 pieces. Sourcing story pages at 6 to 12 pieces. Buyer intent content at 8 to 16 pieces. Creator syndication calendar with 12 to 30 creators per quarter. Refresh cadence at 12 to 24 months by pillar. Reporting with organic sessions and organic revenue attribution.
If your DTC food brand is running paid social at 20,000 dollars monthly with a broken blog and zero recipe schema, professional content marketing for food brands pays for itself inside the first 90 days on organic traffic captured. Redefine Web ships content marketing inside our monthly retainer packages. Book a call and we will walk through the last three DTC food brands we built recipe hubs for, pillar by pillar.
Internal linking discipline across food brand content moves authority from recipe pages toward hero SKU product pages and comparison guides. Every recipe links to the hero SKU it uses inline (once in the ingredient list, once in a bottom call-out card). Every ingredient comparison guide links to 3 to 6 recipes using the winning ingredient plus the hero SKU product page. Every sourcing story links to the 2 to 4 SKUs sourced from that specific farm or cooperative.
Anchor text strategy across recipe hubs
Anchor text on internal links varies across recipe hubs to avoid over-optimization patterns Google penalizes. Exact-match anchor (“single-origin Ethiopian coffee”) runs on 20 to 30 percent of internal links. Partial-match variations (“our Ethiopian roast”) run on 30 to 40 percent. Branded anchors (the SKU name) run on 20 to 30 percent. Generic anchors (“shop the coffee”) fill the remaining 10 to 20 percent. This ratio holds ranking without triggering the over-optimization penalty that shows up on brands that anchor-text-stuff every internal link with the same exact-match keyword. Cross-reference the linking layer on our food and beverage web design page.
Link equity from ingredient guides to SKU pages
Link equity from ingredient guides passes to SKU pages when the guide’s comparison table names the hero SKU in the winning column with a product card, and when the guide’s body links to 3 to 6 recipes that use the winning ingredient. This 3-hop path (guide to recipe to SKU) pushes authority from a high-traffic informational query down to a high-intent transactional page. According to Search Engine Land SEO coverage, informational content that internally links to transactional pages produces 2 to 4 times higher organic revenue than isolated content silos.
Wrapping up content marketing for food brands
Content marketing for food brands is the organic engine that turns a DTC snack, drink, or CPG storefront into a search-driven revenue channel. Recipe hub of 40 to 100 recipes. Ingredient comparison guides at 12 to 24 pieces. Sourcing story pages at 6 to 12 pieces. Buyer intent content at 8 to 16 pieces. Creator syndication calendar with 12 to 30 creators per quarter. Refresh cadence at 12 to 24 months by pillar. Reporting with organic sessions and organic revenue attribution.
If your DTC food brand is running paid social at 20,000 dollars monthly with a broken blog and zero recipe schema, professional content marketing for food brands pays for itself inside the first 90 days on organic traffic captured. Redefine Web ships content marketing inside our monthly retainer packages. Book a call and we will walk through the last three DTC food brands we built recipe hubs for, pillar by pillar.
Content marketing for food brands starts with a recipe hub because recipe queries account for 40 to 60 percent of high-intent search volume in the food category. Every hero SKU needs 4 to 12 recipes anchored to it, each targeting a specific occasion and audience.
Skip the recipe hub and the brand loses the search real estate that pulls DTC storefront traffic month over month at zero incremental paid cost. Recipe traffic converts at 2 to 4 percent because the shopper landed with usage intent, not passive discovery, which is why food brands win on recipes.
Recipe schema and Google rich result eligibility
Every recipe page ships schema.org Recipe markup including cookTime, prepTime, recipeIngredient, recipeInstructions, nutrition, and aggregateRating. Correctly marked-up recipes qualify for Google’s recipe rich result carousel that pulls 3 to 6 times higher click-through rate than a plain blue link. The schema layer takes 15 minutes per recipe to author and 30 minutes to validate in Google Search Console. Cross-reference the recipe search stack on our food and beverage SEO page.
Recipe hub structure that scales
The recipe hub structure runs 40 to 100 recipes at maturity, organized by hero SKU (4 to 12 recipes per SKU) plus occasion tags (breakfast, weeknight dinner, meal prep, brunch, holiday). Every recipe links back to the hero SKU product page with the SKU embedded in an inline card. The hub earns internal linking value from ingredient comparison guides and the sourcing story pages, which feeds recipe ranking on Google. According to Google Search Central recipe structured data guidance, complete Recipe schema markup is required for eligibility in the recipe carousel and the ingredient search filter.
Pillar structure for food brand content marketing
The pillar structure on content marketing for food brands runs 4 content pillars concurrently: recipe hub (40 to 100 recipes), ingredient comparison guides (12 to 24 guides), sourcing story pages (6 to 12 pages), and buyer intent content (where to buy, subscription vs. one-time, gift bundle guides). Every pillar covers a distinct search intent and every pillar links back to the hero SKU product pages.
Ingredient comparison guide format
Ingredient comparison guides run 1,800 to 3,200 words comparing 2 to 4 ingredient types on 6 to 10 attributes with a comparison table, real-world use case examples, and links to the hero SKU that uses the specific ingredient. Example: organic vs. conventional oats compares nutritional profile, sourcing chain, cost, environmental impact, and taste on a 6-column table. The brand’s SKU appears in the winning column with a product card. These guides rank 3 to 8 months after publication and pull steady-state organic traffic.
Sourcing story pages that build trust
Sourcing story pages name the specific farms, cooperatives, or suppliers the brand sources from, with photos of the farms, farmer quotes, and specific harvest windows. A coffee brand’s Ethiopian farm page ranks for “single-origin Ethiopian coffee” and “Yirgacheffe coffee origin” plus 40 long-tail variations. The sourcing page pulls trust-building traffic that converts at 4 to 6 percent because the shopper landed pattern-matching on transparency and named provenance. Every sourcing page includes farmer or cooperative quotes, harvest dates, and a link back to 3 to 5 hero SKU pages that source from the named supplier.
Vejrø hospitality content case study
Vejrø Resort, a Danish private-island destination with an on-site restaurant focused on organic, locally sourced cuisine, joined us with strong social engagement and no organic-search real estate. Guests found the resort on Instagram but never in Google search for terms like “private island resort Denmark,” “farm-to-table hospitality Denmark,” or “Vejrø restaurant.” The same organic-search gap shows up on DTC food brands running paid social at 20,000 dollars monthly with a broken blog and zero recipe schema.
We built the conversion-focused website with on-site and off-site SEO tuned to the travel-niche keyword clusters, competitor analysis against comparable boutique resorts, and mobile-first design prioritizing guest discovery. Every page carried the structured data qualifying it for Google’s rich results in the hospitality category. Every internal link pushed authority toward the direct-booking conversion path.
Three months later, Vejrø hit 10,000 plus organic visitors, ranked for 200 plus first-page keywords, and pulled a 2.2 percent booking conversion rate from organic traffic. The same pattern applies to content marketing for food brands: recipe schema, ingredient comparison guides, and sourcing story pages pull organic traffic at 20 to 40 percent conversion into hero SKU pages inside 6 months when the content quality matches search intent and every page carries the right structured data markup. Vejrø also proved out the reporting discipline: every monthly report named the exact page, the exact keyword cluster, and the exact search feature (rich result, sitelinks, image pack) driving the incremental organic revenue instead of hiding behind aggregate traffic charts.
Recipe cadence and content calendar for food brands
Recipe cadence on a working food brand content calendar ships 2 to 4 new recipes per week during the first 6 months and drops to 1 per week at maturity. Each recipe takes 4 to 6 hours to produce (write, test in the kitchen, photograph, schema author, publish). At 3 recipes per week, the brand hits 78 recipes inside 6 months plus a backlog of ingredient comparison and sourcing content queued behind the recipe production line.
| Content pillar | Target volume year 1 | Production cost per piece | Refresh cadence |
|---|---|---|---|
| Recipe hub | 40 to 100 recipes | $180 to $320 | Every 12 months |
| Ingredient comparison guides | 12 to 24 guides | $450 to $780 | Every 18 months |
| Sourcing story pages | 6 to 12 pages | $680 to $1,200 | Every 24 months |
| Buyer intent content | 8 to 16 pieces | $220 to $420 | Every 12 months |
Photography as a content calendar constraint
Photography is the actual constraint on recipe cadence, not writing. Every recipe needs 6 to 12 photos: hero shot, ingredient flat lay, prep in progress, plated result, storage, and step shots for the schema markup. A working food brand batches photography 8 recipes at a time to keep the cost per recipe under 200 dollars. Skip the batching and the per-recipe cost climbs to 400 to 600 dollars, which caps recipe cadence at 1 per week and slows organic ranking timeline by 6 months.
Seasonal content calendar planning
Seasonal content calendar planning maps recipes and comparison guides to the seasonal windows they need to rank in. A Christmas cookie recipe needs to publish in September to rank by early December. A Valentine’s chocolate guide needs to publish in November to rank by early February. A back-to-school lunchbox recipe needs to publish in June to rank by late August. The 60-to-90-day ranking curve dictates the calendar.
Creator syndication inside food brand content
Creator syndication on food brand content marketing amplifies the recipe hub through Instagram Reels, TikTok, and YouTube Shorts creators paid to post their own version of the brand’s hero recipes. The creator content pulls net-new audiences into the recipe hub through the creator’s Link in Bio or Amazon Storefront tag. The syndication calendar names 12 to 30 creators per quarter with specific recipes assigned to each.
One brand we picked up had a spreadsheet titled “creator outreach 2023” with 47 rows and 3 responses. All 3 responses were auto-replies. The spreadsheet named zero recipes and offered flat rates below 100 dollars per post. Nobody posts a 30-second video for 87 dollars flat. Nobody.
Creator content commercial terms that work
Working creator content commercial terms run 350 to 1,500 dollars flat per post plus a 12 to 25 percent commission on tagged sales across a 30-day window. The commission mechanic pulls creators into follow-up posts because the incremental revenue continues past the initial fee. Mid-tier creators (30k to 150k followers) hit the sweet spot for food brand content because their engagement rate typically runs 4 to 8 percent versus 0.8 to 1.6 percent on mega-creators.
Content brief structure for creator partnerships
The content brief structure for creator partnerships runs a single page: the SKU, the specific recipe or usage occasion, 3 required brand mentions, 3 restricted claims (no health claims on non-medical SKUs), the pricing angle, the affiliate link, and 3 example videos that hit the tone. The brief avoids over-scripting because over-scripted creator content underperforms native creator voice by 40 to 60 percent on engagement rate.
Buyer intent content for food brand blogs
Buyer intent content on food brand blogs covers 8 to 16 pieces targeting explicit purchase-decision queries: “where to buy [brand],” “[brand] subscription vs. one-time,” “best [category] for [use case],” and “[brand] gift bundle.” Every buyer intent piece runs 1,400 to 2,400 words with a comparison table, product cards, and a clear conversion path to the specific SKU that matches the query intent. Buyer intent content converts at 3 to 6 percent versus 1 to 2 percent on recipe content because the shopper landed already planning to buy, not exploring a usage occasion.
Where-to-buy content structure
Where-to-buy content structure covers online (DTC storefront, Amazon, Target.com, Whole Foods online), retail (specific chain locators with the store finder embedded), and international (customs limitations, retailer partners abroad). Every piece names specific retailers, links to the store locator, and includes an FAQ block covering shipping availability, subscription options, and gift card compatibility. Where-to-buy content ranks for branded discovery queries the DTC storefront otherwise loses to competitor affiliate reviews.
Subscription versus one-time comparison content
Subscription versus one-time comparison content converts subscription commitments at 3 to 6 percent because it addresses the price-sensitivity concern head-on with a specific math table. The piece covers the discount structure (15 percent lifetime), the skip-a-month mechanic, the pause-anytime rule, the cancellation policy, and the specific yearly savings for the brand’s average consumption cadence. Cross-reference the retention structure on our food and beverage marketing retainer page.
Content refresh cadence on food brand pillars
Content refresh cadence on food brand content pillars runs a rolling audit every 12 to 24 months by pillar. Recipes get refreshed every 12 months with new photography, updated schema, and any nutrition or ingredient adjustments. Ingredient comparison guides refresh every 18 months to update market data. Sourcing story pages refresh every 24 months to reflect farm partnership changes and new harvest angles. Buyer intent content refreshes every 12 months to update retailer availability and pricing.
Recipe refresh priority order
Recipe refresh priority runs by organic traffic rank. The top 20 recipes by monthly organic sessions get refreshed first (new photography, schema audit, related recipe internal links, updated nutrition). The next 40 get refreshed at 15 months. The remaining recipes get refreshed opportunistically when the ranking slips past position 15 in Google. Skipping the refresh cadence lets recipe rankings drift out of the top 3 inside 18 months as newer competitor recipes take the position.
Schema audit checklist per refresh
The schema audit checklist per refresh runs 8 items: Recipe schema completeness, aggregateRating count and accuracy, nutrition data accuracy, prepTime and cookTime match the recipe body, image URLs valid at CDN, related recipe internal links working, product card SKU URL live, and Google Search Console rich result eligibility validated. This checklist takes 20 minutes per recipe and prevents the schema drift that costs recipe rankings 20 to 40 positions quietly.
Reporting cadence for food brand content marketing
Reporting cadence on food brand content marketing runs a monthly executive report plus a quarterly business review. The monthly report ships in the first business week and covers organic sessions by pillar, top 10 ranking recipes with position trend, ingredient guide ranking movements, sourcing page performance, and organic-attributed DTC revenue. Every number carries a comparison to the prior month and a plain-language interpretation the founder reads in 7 minutes.
Metrics that matter for content marketing
Metrics that matter for food brand content marketing: organic sessions by pillar, recipe rich result impressions in Search Console, organic conversion rate to hero SKU pages, organic-attributed DTC revenue, and top 20 ranking positions by monthly organic sessions. Vanity metrics that do not matter: total pageviews without conversion context, average time on page without conversion attribution, and social share counts. The monthly report skips the vanity block entirely.
Quarterly business review structure
The quarterly business review runs 90 minutes with the founder, head of content, and SEO lead. Agenda: organic traffic trend by pillar, top 10 winning content pieces, top 10 losing content pieces (candidates for refresh or removal), competitive gap analysis against 5 named competitor brands, and next quarter’s content calendar with recipes and ingredient guides queued. According to Ahrefs content marketing research, brands running quarterly content audits outperform brands running annual audits by 40 to 70 percent on organic revenue over a 24-month window.
Internal linking discipline across food brand content
Internal linking discipline across food brand content moves authority from recipe pages toward hero SKU product pages and comparison guides. Every recipe links to the hero SKU it uses inline (once in the ingredient list, once in a bottom call-out card). Every ingredient comparison guide links to 3 to 6 recipes using the winning ingredient plus the hero SKU product page. Every sourcing story links to the 2 to 4 SKUs sourced from that specific farm or cooperative.
Anchor text strategy across recipe hubs
Anchor text on internal links varies across recipe hubs to avoid over-optimization patterns Google penalizes. Exact-match anchor (“single-origin Ethiopian coffee”) runs on 20 to 30 percent of internal links. Partial-match variations (“our Ethiopian roast”) run on 30 to 40 percent. Branded anchors (the SKU name) run on 20 to 30 percent. Generic anchors (“shop the coffee”) fill the remaining 10 to 20 percent. This ratio holds ranking without triggering the over-optimization penalty that shows up on brands that anchor-text-stuff every internal link with the same exact-match keyword. Cross-reference the linking layer on our food and beverage web design page.
Link equity from ingredient guides to SKU pages
Link equity from ingredient guides passes to SKU pages when the guide’s comparison table names the hero SKU in the winning column with a product card, and when the guide’s body links to 3 to 6 recipes that use the winning ingredient. This 3-hop path (guide to recipe to SKU) pushes authority from a high-traffic informational query down to a high-intent transactional page. According to Search Engine Land SEO coverage, informational content that internally links to transactional pages produces 2 to 4 times higher organic revenue than isolated content silos.
Wrapping up content marketing for food brands
Content marketing for food brands is the organic engine that turns a DTC snack, drink, or CPG storefront into a search-driven revenue channel. Recipe hub of 40 to 100 recipes. Ingredient comparison guides at 12 to 24 pieces. Sourcing story pages at 6 to 12 pieces. Buyer intent content at 8 to 16 pieces. Creator syndication calendar with 12 to 30 creators per quarter. Refresh cadence at 12 to 24 months by pillar. Reporting with organic sessions and organic revenue attribution.
If your DTC food brand is running paid social at 20,000 dollars monthly with a broken blog and zero recipe schema, professional content marketing for food brands pays for itself inside the first 90 days on organic traffic captured. Redefine Web ships content marketing inside our monthly retainer packages. Book a call and we will walk through the last three DTC food brands we built recipe hubs for, pillar by pillar.
Content marketing for food brands starts with a recipe hub because recipe queries account for 40 to 60 percent of high-intent search volume in the food category. Every hero SKU needs 4 to 12 recipes anchored to it, each targeting a specific occasion and audience.
Skip the recipe hub and the brand loses the search real estate that pulls DTC storefront traffic month over month at zero incremental paid cost. Recipe traffic converts at 2 to 4 percent because the shopper landed with usage intent, not passive discovery, which is why food brands win on recipes.
Recipe schema and Google rich result eligibility
Every recipe page ships schema.org Recipe markup including cookTime, prepTime, recipeIngredient, recipeInstructions, nutrition, and aggregateRating. Correctly marked-up recipes qualify for Google’s recipe rich result carousel that pulls 3 to 6 times higher click-through rate than a plain blue link. The schema layer takes 15 minutes per recipe to author and 30 minutes to validate in Google Search Console. Cross-reference the recipe search stack on our food and beverage SEO page.
Recipe hub structure that scales
The recipe hub structure runs 40 to 100 recipes at maturity, organized by hero SKU (4 to 12 recipes per SKU) plus occasion tags (breakfast, weeknight dinner, meal prep, brunch, holiday). Every recipe links back to the hero SKU product page with the SKU embedded in an inline card. The hub earns internal linking value from ingredient comparison guides and the sourcing story pages, which feeds recipe ranking on Google. According to Google Search Central recipe structured data guidance, complete Recipe schema markup is required for eligibility in the recipe carousel and the ingredient search filter.
Pillar structure for food brand content marketing
The pillar structure on content marketing for food brands runs 4 content pillars concurrently: recipe hub (40 to 100 recipes), ingredient comparison guides (12 to 24 guides), sourcing story pages (6 to 12 pages), and buyer intent content (where to buy, subscription vs. one-time, gift bundle guides). Every pillar covers a distinct search intent and every pillar links back to the hero SKU product pages.
Ingredient comparison guide format
Ingredient comparison guides run 1,800 to 3,200 words comparing 2 to 4 ingredient types on 6 to 10 attributes with a comparison table, real-world use case examples, and links to the hero SKU that uses the specific ingredient. Example: organic vs. conventional oats compares nutritional profile, sourcing chain, cost, environmental impact, and taste on a 6-column table. The brand’s SKU appears in the winning column with a product card. These guides rank 3 to 8 months after publication and pull steady-state organic traffic.
Sourcing story pages that build trust
Sourcing story pages name the specific farms, cooperatives, or suppliers the brand sources from, with photos of the farms, farmer quotes, and specific harvest windows. A coffee brand’s Ethiopian farm page ranks for “single-origin Ethiopian coffee” and “Yirgacheffe coffee origin” plus 40 long-tail variations. The sourcing page pulls trust-building traffic that converts at 4 to 6 percent because the shopper landed pattern-matching on transparency and named provenance. Every sourcing page includes farmer or cooperative quotes, harvest dates, and a link back to 3 to 5 hero SKU pages that source from the named supplier.
Vejrø hospitality content case study
Vejrø Resort, a Danish private-island destination with an on-site restaurant focused on organic, locally sourced cuisine, joined us with strong social engagement and no organic-search real estate. Guests found the resort on Instagram but never in Google search for terms like “private island resort Denmark,” “farm-to-table hospitality Denmark,” or “Vejrø restaurant.” The same organic-search gap shows up on DTC food brands running paid social at 20,000 dollars monthly with a broken blog and zero recipe schema.
We built the conversion-focused website with on-site and off-site SEO tuned to the travel-niche keyword clusters, competitor analysis against comparable boutique resorts, and mobile-first design prioritizing guest discovery. Every page carried the structured data qualifying it for Google’s rich results in the hospitality category. Every internal link pushed authority toward the direct-booking conversion path.
Three months later, Vejrø hit 10,000 plus organic visitors, ranked for 200 plus first-page keywords, and pulled a 2.2 percent booking conversion rate from organic traffic. The same pattern applies to content marketing for food brands: recipe schema, ingredient comparison guides, and sourcing story pages pull organic traffic at 20 to 40 percent conversion into hero SKU pages inside 6 months when the content quality matches search intent and every page carries the right structured data markup. Vejrø also proved out the reporting discipline: every monthly report named the exact page, the exact keyword cluster, and the exact search feature (rich result, sitelinks, image pack) driving the incremental organic revenue instead of hiding behind aggregate traffic charts.
Recipe cadence and content calendar for food brands
Recipe cadence on a working food brand content calendar ships 2 to 4 new recipes per week during the first 6 months and drops to 1 per week at maturity. Each recipe takes 4 to 6 hours to produce (write, test in the kitchen, photograph, schema author, publish). At 3 recipes per week, the brand hits 78 recipes inside 6 months plus a backlog of ingredient comparison and sourcing content queued behind the recipe production line.
| Content pillar | Target volume year 1 | Production cost per piece | Refresh cadence |
|---|---|---|---|
| Recipe hub | 40 to 100 recipes | $180 to $320 | Every 12 months |
| Ingredient comparison guides | 12 to 24 guides | $450 to $780 | Every 18 months |
| Sourcing story pages | 6 to 12 pages | $680 to $1,200 | Every 24 months |
| Buyer intent content | 8 to 16 pieces | $220 to $420 | Every 12 months |
Photography as a content calendar constraint
Photography is the actual constraint on recipe cadence, not writing. Every recipe needs 6 to 12 photos: hero shot, ingredient flat lay, prep in progress, plated result, storage, and step shots for the schema markup. A working food brand batches photography 8 recipes at a time to keep the cost per recipe under 200 dollars. Skip the batching and the per-recipe cost climbs to 400 to 600 dollars, which caps recipe cadence at 1 per week and slows organic ranking timeline by 6 months.
Seasonal content calendar planning
Seasonal content calendar planning maps recipes and comparison guides to the seasonal windows they need to rank in. A Christmas cookie recipe needs to publish in September to rank by early December. A Valentine’s chocolate guide needs to publish in November to rank by early February. A back-to-school lunchbox recipe needs to publish in June to rank by late August. The 60-to-90-day ranking curve dictates the calendar.
Creator syndication inside food brand content
Creator syndication on food brand content marketing amplifies the recipe hub through Instagram Reels, TikTok, and YouTube Shorts creators paid to post their own version of the brand’s hero recipes. The creator content pulls net-new audiences into the recipe hub through the creator’s Link in Bio or Amazon Storefront tag. The syndication calendar names 12 to 30 creators per quarter with specific recipes assigned to each.
One brand we picked up had a spreadsheet titled “creator outreach 2023” with 47 rows and 3 responses. All 3 responses were auto-replies. The spreadsheet named zero recipes and offered flat rates below 100 dollars per post. Nobody posts a 30-second video for 87 dollars flat. Nobody.
Creator content commercial terms that work
Working creator content commercial terms run 350 to 1,500 dollars flat per post plus a 12 to 25 percent commission on tagged sales across a 30-day window. The commission mechanic pulls creators into follow-up posts because the incremental revenue continues past the initial fee. Mid-tier creators (30k to 150k followers) hit the sweet spot for food brand content because their engagement rate typically runs 4 to 8 percent versus 0.8 to 1.6 percent on mega-creators.
Content brief structure for creator partnerships
The content brief structure for creator partnerships runs a single page: the SKU, the specific recipe or usage occasion, 3 required brand mentions, 3 restricted claims (no health claims on non-medical SKUs), the pricing angle, the affiliate link, and 3 example videos that hit the tone. The brief avoids over-scripting because over-scripted creator content underperforms native creator voice by 40 to 60 percent on engagement rate.
Buyer intent content for food brand blogs
Buyer intent content on food brand blogs covers 8 to 16 pieces targeting explicit purchase-decision queries: “where to buy [brand],” “[brand] subscription vs. one-time,” “best [category] for [use case],” and “[brand] gift bundle.” Every buyer intent piece runs 1,400 to 2,400 words with a comparison table, product cards, and a clear conversion path to the specific SKU that matches the query intent. Buyer intent content converts at 3 to 6 percent versus 1 to 2 percent on recipe content because the shopper landed already planning to buy, not exploring a usage occasion.
Where-to-buy content structure
Where-to-buy content structure covers online (DTC storefront, Amazon, Target.com, Whole Foods online), retail (specific chain locators with the store finder embedded), and international (customs limitations, retailer partners abroad). Every piece names specific retailers, links to the store locator, and includes an FAQ block covering shipping availability, subscription options, and gift card compatibility. Where-to-buy content ranks for branded discovery queries the DTC storefront otherwise loses to competitor affiliate reviews.
Subscription versus one-time comparison content
Subscription versus one-time comparison content converts subscription commitments at 3 to 6 percent because it addresses the price-sensitivity concern head-on with a specific math table. The piece covers the discount structure (15 percent lifetime), the skip-a-month mechanic, the pause-anytime rule, the cancellation policy, and the specific yearly savings for the brand’s average consumption cadence. Cross-reference the retention structure on our food and beverage marketing retainer page.
Content refresh cadence on food brand pillars
Content refresh cadence on food brand content pillars runs a rolling audit every 12 to 24 months by pillar. Recipes get refreshed every 12 months with new photography, updated schema, and any nutrition or ingredient adjustments. Ingredient comparison guides refresh every 18 months to update market data. Sourcing story pages refresh every 24 months to reflect farm partnership changes and new harvest angles. Buyer intent content refreshes every 12 months to update retailer availability and pricing.
Recipe refresh priority order
Recipe refresh priority runs by organic traffic rank. The top 20 recipes by monthly organic sessions get refreshed first (new photography, schema audit, related recipe internal links, updated nutrition). The next 40 get refreshed at 15 months. The remaining recipes get refreshed opportunistically when the ranking slips past position 15 in Google. Skipping the refresh cadence lets recipe rankings drift out of the top 3 inside 18 months as newer competitor recipes take the position.
Schema audit checklist per refresh
The schema audit checklist per refresh runs 8 items: Recipe schema completeness, aggregateRating count and accuracy, nutrition data accuracy, prepTime and cookTime match the recipe body, image URLs valid at CDN, related recipe internal links working, product card SKU URL live, and Google Search Console rich result eligibility validated. This checklist takes 20 minutes per recipe and prevents the schema drift that costs recipe rankings 20 to 40 positions quietly.
Reporting cadence for food brand content marketing
Reporting cadence on food brand content marketing runs a monthly executive report plus a quarterly business review. The monthly report ships in the first business week and covers organic sessions by pillar, top 10 ranking recipes with position trend, ingredient guide ranking movements, sourcing page performance, and organic-attributed DTC revenue. Every number carries a comparison to the prior month and a plain-language interpretation the founder reads in 7 minutes.
Metrics that matter for content marketing
Metrics that matter for food brand content marketing: organic sessions by pillar, recipe rich result impressions in Search Console, organic conversion rate to hero SKU pages, organic-attributed DTC revenue, and top 20 ranking positions by monthly organic sessions. Vanity metrics that do not matter: total pageviews without conversion context, average time on page without conversion attribution, and social share counts. The monthly report skips the vanity block entirely.
Quarterly business review structure
The quarterly business review runs 90 minutes with the founder, head of content, and SEO lead. Agenda: organic traffic trend by pillar, top 10 winning content pieces, top 10 losing content pieces (candidates for refresh or removal), competitive gap analysis against 5 named competitor brands, and next quarter’s content calendar with recipes and ingredient guides queued. According to Ahrefs content marketing research, brands running quarterly content audits outperform brands running annual audits by 40 to 70 percent on organic revenue over a 24-month window.
Internal linking discipline across food brand content
Internal linking discipline across food brand content moves authority from recipe pages toward hero SKU product pages and comparison guides. Every recipe links to the hero SKU it uses inline (once in the ingredient list, once in a bottom call-out card). Every ingredient comparison guide links to 3 to 6 recipes using the winning ingredient plus the hero SKU product page. Every sourcing story links to the 2 to 4 SKUs sourced from that specific farm or cooperative.
Anchor text strategy across recipe hubs
Anchor text on internal links varies across recipe hubs to avoid over-optimization patterns Google penalizes. Exact-match anchor (“single-origin Ethiopian coffee”) runs on 20 to 30 percent of internal links. Partial-match variations (“our Ethiopian roast”) run on 30 to 40 percent. Branded anchors (the SKU name) run on 20 to 30 percent. Generic anchors (“shop the coffee”) fill the remaining 10 to 20 percent. This ratio holds ranking without triggering the over-optimization penalty that shows up on brands that anchor-text-stuff every internal link with the same exact-match keyword. Cross-reference the linking layer on our food and beverage web design page.
Link equity from ingredient guides to SKU pages
Link equity from ingredient guides passes to SKU pages when the guide’s comparison table names the hero SKU in the winning column with a product card, and when the guide’s body links to 3 to 6 recipes that use the winning ingredient. This 3-hop path (guide to recipe to SKU) pushes authority from a high-traffic informational query down to a high-intent transactional page. According to Search Engine Land SEO coverage, informational content that internally links to transactional pages produces 2 to 4 times higher organic revenue than isolated content silos.
Wrapping up content marketing for food brands
Content marketing for food brands is the organic engine that turns a DTC snack, drink, or CPG storefront into a search-driven revenue channel. Recipe hub of 40 to 100 recipes. Ingredient comparison guides at 12 to 24 pieces. Sourcing story pages at 6 to 12 pieces. Buyer intent content at 8 to 16 pieces. Creator syndication calendar with 12 to 30 creators per quarter. Refresh cadence at 12 to 24 months by pillar. Reporting with organic sessions and organic revenue attribution.
If your DTC food brand is running paid social at 20,000 dollars monthly with a broken blog and zero recipe schema, professional content marketing for food brands pays for itself inside the first 90 days on organic traffic captured. Redefine Web ships content marketing inside our monthly retainer packages. Book a call and we will walk through the last three DTC food brands we built recipe hubs for, pillar by pillar.
Content marketing for food brands starts with a recipe hub because recipe queries account for 40 to 60 percent of high-intent search volume in the food category. Every hero SKU needs 4 to 12 recipes anchored to it, each targeting a specific occasion and audience.
Skip the recipe hub and the brand loses the search real estate that pulls DTC storefront traffic month over month at zero incremental paid cost. Recipe traffic converts at 2 to 4 percent because the shopper landed with usage intent, not passive discovery, which is why food brands win on recipes.
Recipe schema and Google rich result eligibility
Every recipe page ships schema.org Recipe markup including cookTime, prepTime, recipeIngredient, recipeInstructions, nutrition, and aggregateRating. Correctly marked-up recipes qualify for Google’s recipe rich result carousel that pulls 3 to 6 times higher click-through rate than a plain blue link. The schema layer takes 15 minutes per recipe to author and 30 minutes to validate in Google Search Console. Cross-reference the recipe search stack on our food and beverage SEO page.
Recipe hub structure that scales
The recipe hub structure runs 40 to 100 recipes at maturity, organized by hero SKU (4 to 12 recipes per SKU) plus occasion tags (breakfast, weeknight dinner, meal prep, brunch, holiday). Every recipe links back to the hero SKU product page with the SKU embedded in an inline card. The hub earns internal linking value from ingredient comparison guides and the sourcing story pages, which feeds recipe ranking on Google. According to Google Search Central recipe structured data guidance, complete Recipe schema markup is required for eligibility in the recipe carousel and the ingredient search filter.
Pillar structure for food brand content marketing
The pillar structure on content marketing for food brands runs 4 content pillars concurrently: recipe hub (40 to 100 recipes), ingredient comparison guides (12 to 24 guides), sourcing story pages (6 to 12 pages), and buyer intent content (where to buy, subscription vs. one-time, gift bundle guides). Every pillar covers a distinct search intent and every pillar links back to the hero SKU product pages.
Ingredient comparison guide format
Ingredient comparison guides run 1,800 to 3,200 words comparing 2 to 4 ingredient types on 6 to 10 attributes with a comparison table, real-world use case examples, and links to the hero SKU that uses the specific ingredient. Example: organic vs. conventional oats compares nutritional profile, sourcing chain, cost, environmental impact, and taste on a 6-column table. The brand’s SKU appears in the winning column with a product card. These guides rank 3 to 8 months after publication and pull steady-state organic traffic.
Sourcing story pages that build trust
Sourcing story pages name the specific farms, cooperatives, or suppliers the brand sources from, with photos of the farms, farmer quotes, and specific harvest windows. A coffee brand’s Ethiopian farm page ranks for “single-origin Ethiopian coffee” and “Yirgacheffe coffee origin” plus 40 long-tail variations. The sourcing page pulls trust-building traffic that converts at 4 to 6 percent because the shopper landed pattern-matching on transparency and named provenance. Every sourcing page includes farmer or cooperative quotes, harvest dates, and a link back to 3 to 5 hero SKU pages that source from the named supplier.
Vejrø hospitality content case study
Vejrø Resort, a Danish private-island destination with an on-site restaurant focused on organic, locally sourced cuisine, joined us with strong social engagement and no organic-search real estate. Guests found the resort on Instagram but never in Google search for terms like “private island resort Denmark,” “farm-to-table hospitality Denmark,” or “Vejrø restaurant.” The same organic-search gap shows up on DTC food brands running paid social at 20,000 dollars monthly with a broken blog and zero recipe schema.
We built the conversion-focused website with on-site and off-site SEO tuned to the travel-niche keyword clusters, competitor analysis against comparable boutique resorts, and mobile-first design prioritizing guest discovery. Every page carried the structured data qualifying it for Google’s rich results in the hospitality category. Every internal link pushed authority toward the direct-booking conversion path.
Three months later, Vejrø hit 10,000 plus organic visitors, ranked for 200 plus first-page keywords, and pulled a 2.2 percent booking conversion rate from organic traffic. The same pattern applies to content marketing for food brands: recipe schema, ingredient comparison guides, and sourcing story pages pull organic traffic at 20 to 40 percent conversion into hero SKU pages inside 6 months when the content quality matches search intent and every page carries the right structured data markup. Vejrø also proved out the reporting discipline: every monthly report named the exact page, the exact keyword cluster, and the exact search feature (rich result, sitelinks, image pack) driving the incremental organic revenue instead of hiding behind aggregate traffic charts.
Recipe cadence and content calendar for food brands
Recipe cadence on a working food brand content calendar ships 2 to 4 new recipes per week during the first 6 months and drops to 1 per week at maturity. Each recipe takes 4 to 6 hours to produce (write, test in the kitchen, photograph, schema author, publish). At 3 recipes per week, the brand hits 78 recipes inside 6 months plus a backlog of ingredient comparison and sourcing content queued behind the recipe production line.
| Content pillar | Target volume year 1 | Production cost per piece | Refresh cadence |
|---|---|---|---|
| Recipe hub | 40 to 100 recipes | $180 to $320 | Every 12 months |
| Ingredient comparison guides | 12 to 24 guides | $450 to $780 | Every 18 months |
| Sourcing story pages | 6 to 12 pages | $680 to $1,200 | Every 24 months |
| Buyer intent content | 8 to 16 pieces | $220 to $420 | Every 12 months |
Photography as a content calendar constraint
Photography is the actual constraint on recipe cadence, not writing. Every recipe needs 6 to 12 photos: hero shot, ingredient flat lay, prep in progress, plated result, storage, and step shots for the schema markup. A working food brand batches photography 8 recipes at a time to keep the cost per recipe under 200 dollars. Skip the batching and the per-recipe cost climbs to 400 to 600 dollars, which caps recipe cadence at 1 per week and slows organic ranking timeline by 6 months.
Seasonal content calendar planning
Seasonal content calendar planning maps recipes and comparison guides to the seasonal windows they need to rank in. A Christmas cookie recipe needs to publish in September to rank by early December. A Valentine’s chocolate guide needs to publish in November to rank by early February. A back-to-school lunchbox recipe needs to publish in June to rank by late August. The 60-to-90-day ranking curve dictates the calendar.
Creator syndication inside food brand content
Creator syndication on food brand content marketing amplifies the recipe hub through Instagram Reels, TikTok, and YouTube Shorts creators paid to post their own version of the brand’s hero recipes. The creator content pulls net-new audiences into the recipe hub through the creator’s Link in Bio or Amazon Storefront tag. The syndication calendar names 12 to 30 creators per quarter with specific recipes assigned to each.
One brand we picked up had a spreadsheet titled “creator outreach 2023” with 47 rows and 3 responses. All 3 responses were auto-replies. The spreadsheet named zero recipes and offered flat rates below 100 dollars per post. Nobody posts a 30-second video for 87 dollars flat. Nobody.
Creator content commercial terms that work
Working creator content commercial terms run 350 to 1,500 dollars flat per post plus a 12 to 25 percent commission on tagged sales across a 30-day window. The commission mechanic pulls creators into follow-up posts because the incremental revenue continues past the initial fee. Mid-tier creators (30k to 150k followers) hit the sweet spot for food brand content because their engagement rate typically runs 4 to 8 percent versus 0.8 to 1.6 percent on mega-creators.
Content brief structure for creator partnerships
The content brief structure for creator partnerships runs a single page: the SKU, the specific recipe or usage occasion, 3 required brand mentions, 3 restricted claims (no health claims on non-medical SKUs), the pricing angle, the affiliate link, and 3 example videos that hit the tone. The brief avoids over-scripting because over-scripted creator content underperforms native creator voice by 40 to 60 percent on engagement rate.
Buyer intent content for food brand blogs
Buyer intent content on food brand blogs covers 8 to 16 pieces targeting explicit purchase-decision queries: “where to buy [brand],” “[brand] subscription vs. one-time,” “best [category] for [use case],” and “[brand] gift bundle.” Every buyer intent piece runs 1,400 to 2,400 words with a comparison table, product cards, and a clear conversion path to the specific SKU that matches the query intent. Buyer intent content converts at 3 to 6 percent versus 1 to 2 percent on recipe content because the shopper landed already planning to buy, not exploring a usage occasion.
Where-to-buy content structure
Where-to-buy content structure covers online (DTC storefront, Amazon, Target.com, Whole Foods online), retail (specific chain locators with the store finder embedded), and international (customs limitations, retailer partners abroad). Every piece names specific retailers, links to the store locator, and includes an FAQ block covering shipping availability, subscription options, and gift card compatibility. Where-to-buy content ranks for branded discovery queries the DTC storefront otherwise loses to competitor affiliate reviews.
Subscription versus one-time comparison content
Subscription versus one-time comparison content converts subscription commitments at 3 to 6 percent because it addresses the price-sensitivity concern head-on with a specific math table. The piece covers the discount structure (15 percent lifetime), the skip-a-month mechanic, the pause-anytime rule, the cancellation policy, and the specific yearly savings for the brand’s average consumption cadence. Cross-reference the retention structure on our food and beverage marketing retainer page.
Content refresh cadence on food brand pillars
Content refresh cadence on food brand content pillars runs a rolling audit every 12 to 24 months by pillar. Recipes get refreshed every 12 months with new photography, updated schema, and any nutrition or ingredient adjustments. Ingredient comparison guides refresh every 18 months to update market data. Sourcing story pages refresh every 24 months to reflect farm partnership changes and new harvest angles. Buyer intent content refreshes every 12 months to update retailer availability and pricing.
Recipe refresh priority order
Recipe refresh priority runs by organic traffic rank. The top 20 recipes by monthly organic sessions get refreshed first (new photography, schema audit, related recipe internal links, updated nutrition). The next 40 get refreshed at 15 months. The remaining recipes get refreshed opportunistically when the ranking slips past position 15 in Google. Skipping the refresh cadence lets recipe rankings drift out of the top 3 inside 18 months as newer competitor recipes take the position.
Schema audit checklist per refresh
The schema audit checklist per refresh runs 8 items: Recipe schema completeness, aggregateRating count and accuracy, nutrition data accuracy, prepTime and cookTime match the recipe body, image URLs valid at CDN, related recipe internal links working, product card SKU URL live, and Google Search Console rich result eligibility validated. This checklist takes 20 minutes per recipe and prevents the schema drift that costs recipe rankings 20 to 40 positions quietly.
Reporting cadence for food brand content marketing
Reporting cadence on food brand content marketing runs a monthly executive report plus a quarterly business review. The monthly report ships in the first business week and covers organic sessions by pillar, top 10 ranking recipes with position trend, ingredient guide ranking movements, sourcing page performance, and organic-attributed DTC revenue. Every number carries a comparison to the prior month and a plain-language interpretation the founder reads in 7 minutes.
Metrics that matter for content marketing
Metrics that matter for food brand content marketing: organic sessions by pillar, recipe rich result impressions in Search Console, organic conversion rate to hero SKU pages, organic-attributed DTC revenue, and top 20 ranking positions by monthly organic sessions. Vanity metrics that do not matter: total pageviews without conversion context, average time on page without conversion attribution, and social share counts. The monthly report skips the vanity block entirely.
Quarterly business review structure
The quarterly business review runs 90 minutes with the founder, head of content, and SEO lead. Agenda: organic traffic trend by pillar, top 10 winning content pieces, top 10 losing content pieces (candidates for refresh or removal), competitive gap analysis against 5 named competitor brands, and next quarter’s content calendar with recipes and ingredient guides queued. According to Ahrefs content marketing research, brands running quarterly content audits outperform brands running annual audits by 40 to 70 percent on organic revenue over a 24-month window.
Internal linking discipline across food brand content
Internal linking discipline across food brand content moves authority from recipe pages toward hero SKU product pages and comparison guides. Every recipe links to the hero SKU it uses inline (once in the ingredient list, once in a bottom call-out card). Every ingredient comparison guide links to 3 to 6 recipes using the winning ingredient plus the hero SKU product page. Every sourcing story links to the 2 to 4 SKUs sourced from that specific farm or cooperative.
Anchor text strategy across recipe hubs
Anchor text on internal links varies across recipe hubs to avoid over-optimization patterns Google penalizes. Exact-match anchor (“single-origin Ethiopian coffee”) runs on 20 to 30 percent of internal links. Partial-match variations (“our Ethiopian roast”) run on 30 to 40 percent. Branded anchors (the SKU name) run on 20 to 30 percent. Generic anchors (“shop the coffee”) fill the remaining 10 to 20 percent. This ratio holds ranking without triggering the over-optimization penalty that shows up on brands that anchor-text-stuff every internal link with the same exact-match keyword. Cross-reference the linking layer on our food and beverage web design page.
Link equity from ingredient guides to SKU pages
Link equity from ingredient guides passes to SKU pages when the guide’s comparison table names the hero SKU in the winning column with a product card, and when the guide’s body links to 3 to 6 recipes that use the winning ingredient. This 3-hop path (guide to recipe to SKU) pushes authority from a high-traffic informational query down to a high-intent transactional page. According to Search Engine Land SEO coverage, informational content that internally links to transactional pages produces 2 to 4 times higher organic revenue than isolated content silos.
Wrapping up content marketing for food brands
Content marketing for food brands is the organic engine that turns a DTC snack, drink, or CPG storefront into a search-driven revenue channel. Recipe hub of 40 to 100 recipes. Ingredient comparison guides at 12 to 24 pieces. Sourcing story pages at 6 to 12 pieces. Buyer intent content at 8 to 16 pieces. Creator syndication calendar with 12 to 30 creators per quarter. Refresh cadence at 12 to 24 months by pillar. Reporting with organic sessions and organic revenue attribution.
If your DTC food brand is running paid social at 20,000 dollars monthly with a broken blog and zero recipe schema, professional content marketing for food brands pays for itself inside the first 90 days on organic traffic captured. Redefine Web ships content marketing inside our monthly retainer packages. Book a call and we will walk through the last three DTC food brands we built recipe hubs for, pillar by pillar.
Content marketing for food brands starts with a recipe hub because recipe queries account for 40 to 60 percent of high-intent search volume in the food category. Every hero SKU needs 4 to 12 recipes anchored to it, each targeting a specific occasion and audience.
Skip the recipe hub and the brand loses the search real estate that pulls DTC storefront traffic month over month at zero incremental paid cost. Recipe traffic converts at 2 to 4 percent because the shopper landed with usage intent, not passive discovery, which is why food brands win on recipes.
Recipe schema and Google rich result eligibility
Every recipe page ships schema.org Recipe markup including cookTime, prepTime, recipeIngredient, recipeInstructions, nutrition, and aggregateRating. Correctly marked-up recipes qualify for Google’s recipe rich result carousel that pulls 3 to 6 times higher click-through rate than a plain blue link. The schema layer takes 15 minutes per recipe to author and 30 minutes to validate in Google Search Console. Cross-reference the recipe search stack on our food and beverage SEO page.
Recipe hub structure that scales
The recipe hub structure runs 40 to 100 recipes at maturity, organized by hero SKU (4 to 12 recipes per SKU) plus occasion tags (breakfast, weeknight dinner, meal prep, brunch, holiday). Every recipe links back to the hero SKU product page with the SKU embedded in an inline card. The hub earns internal linking value from ingredient comparison guides and the sourcing story pages, which feeds recipe ranking on Google. According to Google Search Central recipe structured data guidance, complete Recipe schema markup is required for eligibility in the recipe carousel and the ingredient search filter.
Pillar structure for food brand content marketing
The pillar structure on content marketing for food brands runs 4 content pillars concurrently: recipe hub (40 to 100 recipes), ingredient comparison guides (12 to 24 guides), sourcing story pages (6 to 12 pages), and buyer intent content (where to buy, subscription vs. one-time, gift bundle guides). Every pillar covers a distinct search intent and every pillar links back to the hero SKU product pages.
Ingredient comparison guide format
Ingredient comparison guides run 1,800 to 3,200 words comparing 2 to 4 ingredient types on 6 to 10 attributes with a comparison table, real-world use case examples, and links to the hero SKU that uses the specific ingredient. Example: organic vs. conventional oats compares nutritional profile, sourcing chain, cost, environmental impact, and taste on a 6-column table. The brand’s SKU appears in the winning column with a product card. These guides rank 3 to 8 months after publication and pull steady-state organic traffic.
Sourcing story pages that build trust
Sourcing story pages name the specific farms, cooperatives, or suppliers the brand sources from, with photos of the farms, farmer quotes, and specific harvest windows. A coffee brand’s Ethiopian farm page ranks for “single-origin Ethiopian coffee” and “Yirgacheffe coffee origin” plus 40 long-tail variations. The sourcing page pulls trust-building traffic that converts at 4 to 6 percent because the shopper landed pattern-matching on transparency and named provenance. Every sourcing page includes farmer or cooperative quotes, harvest dates, and a link back to 3 to 5 hero SKU pages that source from the named supplier.
Vejrø hospitality content case study
Vejrø Resort, a Danish private-island destination with an on-site restaurant focused on organic, locally sourced cuisine, joined us with strong social engagement and no organic-search real estate. Guests found the resort on Instagram but never in Google search for terms like “private island resort Denmark,” “farm-to-table hospitality Denmark,” or “Vejrø restaurant.” The same organic-search gap shows up on DTC food brands running paid social at 20,000 dollars monthly with a broken blog and zero recipe schema.
We built the conversion-focused website with on-site and off-site SEO tuned to the travel-niche keyword clusters, competitor analysis against comparable boutique resorts, and mobile-first design prioritizing guest discovery. Every page carried the structured data qualifying it for Google’s rich results in the hospitality category. Every internal link pushed authority toward the direct-booking conversion path.
Three months later, Vejrø hit 10,000 plus organic visitors, ranked for 200 plus first-page keywords, and pulled a 2.2 percent booking conversion rate from organic traffic. The same pattern applies to content marketing for food brands: recipe schema, ingredient comparison guides, and sourcing story pages pull organic traffic at 20 to 40 percent conversion into hero SKU pages inside 6 months when the content quality matches search intent and every page carries the right structured data markup. Vejrø also proved out the reporting discipline: every monthly report named the exact page, the exact keyword cluster, and the exact search feature (rich result, sitelinks, image pack) driving the incremental organic revenue instead of hiding behind aggregate traffic charts.
Recipe cadence and content calendar for food brands
Recipe cadence on a working food brand content calendar ships 2 to 4 new recipes per week during the first 6 months and drops to 1 per week at maturity. Each recipe takes 4 to 6 hours to produce (write, test in the kitchen, photograph, schema author, publish). At 3 recipes per week, the brand hits 78 recipes inside 6 months plus a backlog of ingredient comparison and sourcing content queued behind the recipe production line.
| Content pillar | Target volume year 1 | Production cost per piece | Refresh cadence |
|---|---|---|---|
| Recipe hub | 40 to 100 recipes | $180 to $320 | Every 12 months |
| Ingredient comparison guides | 12 to 24 guides | $450 to $780 | Every 18 months |
| Sourcing story pages | 6 to 12 pages | $680 to $1,200 | Every 24 months |
| Buyer intent content | 8 to 16 pieces | $220 to $420 | Every 12 months |
Photography as a content calendar constraint
Photography is the actual constraint on recipe cadence, not writing. Every recipe needs 6 to 12 photos: hero shot, ingredient flat lay, prep in progress, plated result, storage, and step shots for the schema markup. A working food brand batches photography 8 recipes at a time to keep the cost per recipe under 200 dollars. Skip the batching and the per-recipe cost climbs to 400 to 600 dollars, which caps recipe cadence at 1 per week and slows organic ranking timeline by 6 months.
Seasonal content calendar planning
Seasonal content calendar planning maps recipes and comparison guides to the seasonal windows they need to rank in. A Christmas cookie recipe needs to publish in September to rank by early December. A Valentine’s chocolate guide needs to publish in November to rank by early February. A back-to-school lunchbox recipe needs to publish in June to rank by late August. The 60-to-90-day ranking curve dictates the calendar.
Creator syndication inside food brand content
Creator syndication on food brand content marketing amplifies the recipe hub through Instagram Reels, TikTok, and YouTube Shorts creators paid to post their own version of the brand’s hero recipes. The creator content pulls net-new audiences into the recipe hub through the creator’s Link in Bio or Amazon Storefront tag. The syndication calendar names 12 to 30 creators per quarter with specific recipes assigned to each.
One brand we picked up had a spreadsheet titled “creator outreach 2023” with 47 rows and 3 responses. All 3 responses were auto-replies. The spreadsheet named zero recipes and offered flat rates below 100 dollars per post. Nobody posts a 30-second video for 87 dollars flat. Nobody.
Creator content commercial terms that work
Working creator content commercial terms run 350 to 1,500 dollars flat per post plus a 12 to 25 percent commission on tagged sales across a 30-day window. The commission mechanic pulls creators into follow-up posts because the incremental revenue continues past the initial fee. Mid-tier creators (30k to 150k followers) hit the sweet spot for food brand content because their engagement rate typically runs 4 to 8 percent versus 0.8 to 1.6 percent on mega-creators.
Content brief structure for creator partnerships
The content brief structure for creator partnerships runs a single page: the SKU, the specific recipe or usage occasion, 3 required brand mentions, 3 restricted claims (no health claims on non-medical SKUs), the pricing angle, the affiliate link, and 3 example videos that hit the tone. The brief avoids over-scripting because over-scripted creator content underperforms native creator voice by 40 to 60 percent on engagement rate.
Buyer intent content for food brand blogs
Buyer intent content on food brand blogs covers 8 to 16 pieces targeting explicit purchase-decision queries: “where to buy [brand],” “[brand] subscription vs. one-time,” “best [category] for [use case],” and “[brand] gift bundle.” Every buyer intent piece runs 1,400 to 2,400 words with a comparison table, product cards, and a clear conversion path to the specific SKU that matches the query intent. Buyer intent content converts at 3 to 6 percent versus 1 to 2 percent on recipe content because the shopper landed already planning to buy, not exploring a usage occasion.
Where-to-buy content structure
Where-to-buy content structure covers online (DTC storefront, Amazon, Target.com, Whole Foods online), retail (specific chain locators with the store finder embedded), and international (customs limitations, retailer partners abroad). Every piece names specific retailers, links to the store locator, and includes an FAQ block covering shipping availability, subscription options, and gift card compatibility. Where-to-buy content ranks for branded discovery queries the DTC storefront otherwise loses to competitor affiliate reviews.
Subscription versus one-time comparison content
Subscription versus one-time comparison content converts subscription commitments at 3 to 6 percent because it addresses the price-sensitivity concern head-on with a specific math table. The piece covers the discount structure (15 percent lifetime), the skip-a-month mechanic, the pause-anytime rule, the cancellation policy, and the specific yearly savings for the brand’s average consumption cadence. Cross-reference the retention structure on our food and beverage marketing retainer page.
Content refresh cadence on food brand pillars
Content refresh cadence on food brand content pillars runs a rolling audit every 12 to 24 months by pillar. Recipes get refreshed every 12 months with new photography, updated schema, and any nutrition or ingredient adjustments. Ingredient comparison guides refresh every 18 months to update market data. Sourcing story pages refresh every 24 months to reflect farm partnership changes and new harvest angles. Buyer intent content refreshes every 12 months to update retailer availability and pricing.
Recipe refresh priority order
Recipe refresh priority runs by organic traffic rank. The top 20 recipes by monthly organic sessions get refreshed first (new photography, schema audit, related recipe internal links, updated nutrition). The next 40 get refreshed at 15 months. The remaining recipes get refreshed opportunistically when the ranking slips past position 15 in Google. Skipping the refresh cadence lets recipe rankings drift out of the top 3 inside 18 months as newer competitor recipes take the position.
Schema audit checklist per refresh
The schema audit checklist per refresh runs 8 items: Recipe schema completeness, aggregateRating count and accuracy, nutrition data accuracy, prepTime and cookTime match the recipe body, image URLs valid at CDN, related recipe internal links working, product card SKU URL live, and Google Search Console rich result eligibility validated. This checklist takes 20 minutes per recipe and prevents the schema drift that costs recipe rankings 20 to 40 positions quietly.
Reporting cadence for food brand content marketing
Reporting cadence on food brand content marketing runs a monthly executive report plus a quarterly business review. The monthly report ships in the first business week and covers organic sessions by pillar, top 10 ranking recipes with position trend, ingredient guide ranking movements, sourcing page performance, and organic-attributed DTC revenue. Every number carries a comparison to the prior month and a plain-language interpretation the founder reads in 7 minutes.
Metrics that matter for content marketing
Metrics that matter for food brand content marketing: organic sessions by pillar, recipe rich result impressions in Search Console, organic conversion rate to hero SKU pages, organic-attributed DTC revenue, and top 20 ranking positions by monthly organic sessions. Vanity metrics that do not matter: total pageviews without conversion context, average time on page without conversion attribution, and social share counts. The monthly report skips the vanity block entirely.
Quarterly business review structure
The quarterly business review runs 90 minutes with the founder, head of content, and SEO lead. Agenda: organic traffic trend by pillar, top 10 winning content pieces, top 10 losing content pieces (candidates for refresh or removal), competitive gap analysis against 5 named competitor brands, and next quarter’s content calendar with recipes and ingredient guides queued. According to Ahrefs content marketing research, brands running quarterly content audits outperform brands running annual audits by 40 to 70 percent on organic revenue over a 24-month window.
Internal linking discipline across food brand content
Internal linking discipline across food brand content moves authority from recipe pages toward hero SKU product pages and comparison guides. Every recipe links to the hero SKU it uses inline (once in the ingredient list, once in a bottom call-out card). Every ingredient comparison guide links to 3 to 6 recipes using the winning ingredient plus the hero SKU product page. Every sourcing story links to the 2 to 4 SKUs sourced from that specific farm or cooperative.
Anchor text strategy across recipe hubs
Anchor text on internal links varies across recipe hubs to avoid over-optimization patterns Google penalizes. Exact-match anchor (“single-origin Ethiopian coffee”) runs on 20 to 30 percent of internal links. Partial-match variations (“our Ethiopian roast”) run on 30 to 40 percent. Branded anchors (the SKU name) run on 20 to 30 percent. Generic anchors (“shop the coffee”) fill the remaining 10 to 20 percent. This ratio holds ranking without triggering the over-optimization penalty that shows up on brands that anchor-text-stuff every internal link with the same exact-match keyword. Cross-reference the linking layer on our food and beverage web design page.
Link equity from ingredient guides to SKU pages
Link equity from ingredient guides passes to SKU pages when the guide’s comparison table names the hero SKU in the winning column with a product card, and when the guide’s body links to 3 to 6 recipes that use the winning ingredient. This 3-hop path (guide to recipe to SKU) pushes authority from a high-traffic informational query down to a high-intent transactional page. According to Search Engine Land SEO coverage, informational content that internally links to transactional pages produces 2 to 4 times higher organic revenue than isolated content silos.
Wrapping up content marketing for food brands
Content marketing for food brands is the organic engine that turns a DTC snack, drink, or CPG storefront into a search-driven revenue channel. Recipe hub of 40 to 100 recipes. Ingredient comparison guides at 12 to 24 pieces. Sourcing story pages at 6 to 12 pieces. Buyer intent content at 8 to 16 pieces. Creator syndication calendar with 12 to 30 creators per quarter. Refresh cadence at 12 to 24 months by pillar. Reporting with organic sessions and organic revenue attribution.
If your DTC food brand is running paid social at 20,000 dollars monthly with a broken blog and zero recipe schema, professional content marketing for food brands pays for itself inside the first 90 days on organic traffic captured. Redefine Web ships content marketing inside our monthly retainer packages. Book a call and we will walk through the last three DTC food brands we built recipe hubs for, pillar by pillar.
Internal linking discipline across food brand content moves authority from recipe pages toward hero SKU product pages and comparison guides. Every recipe links to the hero SKU it uses inline (once in the ingredient list, once in a bottom call-out card). Every ingredient comparison guide links to 3 to 6 recipes using the winning ingredient plus the hero SKU product page. Every sourcing story links to the 2 to 4 SKUs sourced from that specific farm or cooperative.
Anchor text strategy across recipe hubs
Anchor text on internal links varies across recipe hubs to avoid over-optimization patterns Google penalizes. Exact-match anchor (“single-origin Ethiopian coffee”) runs on 20 to 30 percent of internal links. Partial-match variations (“our Ethiopian roast”) run on 30 to 40 percent. Branded anchors (the SKU name) run on 20 to 30 percent. Generic anchors (“shop the coffee”) fill the remaining 10 to 20 percent. This ratio holds ranking without triggering the over-optimization penalty that shows up on brands that anchor-text-stuff every internal link with the same exact-match keyword. Cross-reference the linking layer on our food and beverage web design page.
Link equity from ingredient guides to SKU pages
Link equity from ingredient guides passes to SKU pages when the guide’s comparison table names the hero SKU in the winning column with a product card, and when the guide’s body links to 3 to 6 recipes that use the winning ingredient. This 3-hop path (guide to recipe to SKU) pushes authority from a high-traffic informational query down to a high-intent transactional page. According to Search Engine Land SEO coverage, informational content that internally links to transactional pages produces 2 to 4 times higher organic revenue than isolated content silos.
Wrapping up content marketing for food brands
Content marketing for food brands is the organic engine that turns a DTC snack, drink, or CPG storefront into a search-driven revenue channel. Recipe hub of 40 to 100 recipes. Ingredient comparison guides at 12 to 24 pieces. Sourcing story pages at 6 to 12 pieces. Buyer intent content at 8 to 16 pieces. Creator syndication calendar with 12 to 30 creators per quarter. Refresh cadence at 12 to 24 months by pillar. Reporting with organic sessions and organic revenue attribution.
If your DTC food brand is running paid social at 20,000 dollars monthly with a broken blog and zero recipe schema, professional content marketing for food brands pays for itself inside the first 90 days on organic traffic captured. Redefine Web ships content marketing inside our monthly retainer packages. Book a call and we will walk through the last three DTC food brands we built recipe hubs for, pillar by pillar.
Content marketing for food brands starts with a recipe hub because recipe queries account for 40 to 60 percent of high-intent search volume in the food category. Every hero SKU needs 4 to 12 recipes anchored to it, each targeting a specific occasion and audience.
Skip the recipe hub and the brand loses the search real estate that pulls DTC storefront traffic month over month at zero incremental paid cost. Recipe traffic converts at 2 to 4 percent because the shopper landed with usage intent, not passive discovery, which is why food brands win on recipes.
Recipe schema and Google rich result eligibility
Every recipe page ships schema.org Recipe markup including cookTime, prepTime, recipeIngredient, recipeInstructions, nutrition, and aggregateRating. Correctly marked-up recipes qualify for Google’s recipe rich result carousel that pulls 3 to 6 times higher click-through rate than a plain blue link. The schema layer takes 15 minutes per recipe to author and 30 minutes to validate in Google Search Console. Cross-reference the recipe search stack on our food and beverage SEO page.
Recipe hub structure that scales
The recipe hub structure runs 40 to 100 recipes at maturity, organized by hero SKU (4 to 12 recipes per SKU) plus occasion tags (breakfast, weeknight dinner, meal prep, brunch, holiday). Every recipe links back to the hero SKU product page with the SKU embedded in an inline card. The hub earns internal linking value from ingredient comparison guides and the sourcing story pages, which feeds recipe ranking on Google. According to Google Search Central recipe structured data guidance, complete Recipe schema markup is required for eligibility in the recipe carousel and the ingredient search filter.
Pillar structure for food brand content marketing
The pillar structure on content marketing for food brands runs 4 content pillars concurrently: recipe hub (40 to 100 recipes), ingredient comparison guides (12 to 24 guides), sourcing story pages (6 to 12 pages), and buyer intent content (where to buy, subscription vs. one-time, gift bundle guides). Every pillar covers a distinct search intent and every pillar links back to the hero SKU product pages.
Ingredient comparison guide format
Ingredient comparison guides run 1,800 to 3,200 words comparing 2 to 4 ingredient types on 6 to 10 attributes with a comparison table, real-world use case examples, and links to the hero SKU that uses the specific ingredient. Example: organic vs. conventional oats compares nutritional profile, sourcing chain, cost, environmental impact, and taste on a 6-column table. The brand’s SKU appears in the winning column with a product card. These guides rank 3 to 8 months after publication and pull steady-state organic traffic.
Sourcing story pages that build trust
Sourcing story pages name the specific farms, cooperatives, or suppliers the brand sources from, with photos of the farms, farmer quotes, and specific harvest windows. A coffee brand’s Ethiopian farm page ranks for “single-origin Ethiopian coffee” and “Yirgacheffe coffee origin” plus 40 long-tail variations. The sourcing page pulls trust-building traffic that converts at 4 to 6 percent because the shopper landed pattern-matching on transparency and named provenance. Every sourcing page includes farmer or cooperative quotes, harvest dates, and a link back to 3 to 5 hero SKU pages that source from the named supplier.
Vejrø hospitality content case study
Vejrø Resort, a Danish private-island destination with an on-site restaurant focused on organic, locally sourced cuisine, joined us with strong social engagement and no organic-search real estate. Guests found the resort on Instagram but never in Google search for terms like “private island resort Denmark,” “farm-to-table hospitality Denmark,” or “Vejrø restaurant.” The same organic-search gap shows up on DTC food brands running paid social at 20,000 dollars monthly with a broken blog and zero recipe schema.
We built the conversion-focused website with on-site and off-site SEO tuned to the travel-niche keyword clusters, competitor analysis against comparable boutique resorts, and mobile-first design prioritizing guest discovery. Every page carried the structured data qualifying it for Google’s rich results in the hospitality category. Every internal link pushed authority toward the direct-booking conversion path.
Three months later, Vejrø hit 10,000 plus organic visitors, ranked for 200 plus first-page keywords, and pulled a 2.2 percent booking conversion rate from organic traffic. The same pattern applies to content marketing for food brands: recipe schema, ingredient comparison guides, and sourcing story pages pull organic traffic at 20 to 40 percent conversion into hero SKU pages inside 6 months when the content quality matches search intent and every page carries the right structured data markup. Vejrø also proved out the reporting discipline: every monthly report named the exact page, the exact keyword cluster, and the exact search feature (rich result, sitelinks, image pack) driving the incremental organic revenue instead of hiding behind aggregate traffic charts.
Recipe cadence and content calendar for food brands
Recipe cadence on a working food brand content calendar ships 2 to 4 new recipes per week during the first 6 months and drops to 1 per week at maturity. Each recipe takes 4 to 6 hours to produce (write, test in the kitchen, photograph, schema author, publish). At 3 recipes per week, the brand hits 78 recipes inside 6 months plus a backlog of ingredient comparison and sourcing content queued behind the recipe production line.
| Content pillar | Target volume year 1 | Production cost per piece | Refresh cadence |
|---|---|---|---|
| Recipe hub | 40 to 100 recipes | $180 to $320 | Every 12 months |
| Ingredient comparison guides | 12 to 24 guides | $450 to $780 | Every 18 months |
| Sourcing story pages | 6 to 12 pages | $680 to $1,200 | Every 24 months |
| Buyer intent content | 8 to 16 pieces | $220 to $420 | Every 12 months |
Photography as a content calendar constraint
Photography is the actual constraint on recipe cadence, not writing. Every recipe needs 6 to 12 photos: hero shot, ingredient flat lay, prep in progress, plated result, storage, and step shots for the schema markup. A working food brand batches photography 8 recipes at a time to keep the cost per recipe under 200 dollars. Skip the batching and the per-recipe cost climbs to 400 to 600 dollars, which caps recipe cadence at 1 per week and slows organic ranking timeline by 6 months.
Seasonal content calendar planning
Seasonal content calendar planning maps recipes and comparison guides to the seasonal windows they need to rank in. A Christmas cookie recipe needs to publish in September to rank by early December. A Valentine’s chocolate guide needs to publish in November to rank by early February. A back-to-school lunchbox recipe needs to publish in June to rank by late August. The 60-to-90-day ranking curve dictates the calendar.
Creator syndication inside food brand content
Creator syndication on food brand content marketing amplifies the recipe hub through Instagram Reels, TikTok, and YouTube Shorts creators paid to post their own version of the brand’s hero recipes. The creator content pulls net-new audiences into the recipe hub through the creator’s Link in Bio or Amazon Storefront tag. The syndication calendar names 12 to 30 creators per quarter with specific recipes assigned to each.
One brand we picked up had a spreadsheet titled “creator outreach 2023” with 47 rows and 3 responses. All 3 responses were auto-replies. The spreadsheet named zero recipes and offered flat rates below 100 dollars per post. Nobody posts a 30-second video for 87 dollars flat. Nobody.
Creator content commercial terms that work
Working creator content commercial terms run 350 to 1,500 dollars flat per post plus a 12 to 25 percent commission on tagged sales across a 30-day window. The commission mechanic pulls creators into follow-up posts because the incremental revenue continues past the initial fee. Mid-tier creators (30k to 150k followers) hit the sweet spot for food brand content because their engagement rate typically runs 4 to 8 percent versus 0.8 to 1.6 percent on mega-creators.
Content brief structure for creator partnerships
The content brief structure for creator partnerships runs a single page: the SKU, the specific recipe or usage occasion, 3 required brand mentions, 3 restricted claims (no health claims on non-medical SKUs), the pricing angle, the affiliate link, and 3 example videos that hit the tone. The brief avoids over-scripting because over-scripted creator content underperforms native creator voice by 40 to 60 percent on engagement rate.
Buyer intent content for food brand blogs
Buyer intent content on food brand blogs covers 8 to 16 pieces targeting explicit purchase-decision queries: “where to buy [brand],” “[brand] subscription vs. one-time,” “best [category] for [use case],” and “[brand] gift bundle.” Every buyer intent piece runs 1,400 to 2,400 words with a comparison table, product cards, and a clear conversion path to the specific SKU that matches the query intent. Buyer intent content converts at 3 to 6 percent versus 1 to 2 percent on recipe content because the shopper landed already planning to buy, not exploring a usage occasion.
Where-to-buy content structure
Where-to-buy content structure covers online (DTC storefront, Amazon, Target.com, Whole Foods online), retail (specific chain locators with the store finder embedded), and international (customs limitations, retailer partners abroad). Every piece names specific retailers, links to the store locator, and includes an FAQ block covering shipping availability, subscription options, and gift card compatibility. Where-to-buy content ranks for branded discovery queries the DTC storefront otherwise loses to competitor affiliate reviews.
Subscription versus one-time comparison content
Subscription versus one-time comparison content converts subscription commitments at 3 to 6 percent because it addresses the price-sensitivity concern head-on with a specific math table. The piece covers the discount structure (15 percent lifetime), the skip-a-month mechanic, the pause-anytime rule, the cancellation policy, and the specific yearly savings for the brand’s average consumption cadence. Cross-reference the retention structure on our food and beverage marketing retainer page.
Content refresh cadence on food brand pillars
Content refresh cadence on food brand content pillars runs a rolling audit every 12 to 24 months by pillar. Recipes get refreshed every 12 months with new photography, updated schema, and any nutrition or ingredient adjustments. Ingredient comparison guides refresh every 18 months to update market data. Sourcing story pages refresh every 24 months to reflect farm partnership changes and new harvest angles. Buyer intent content refreshes every 12 months to update retailer availability and pricing.
Recipe refresh priority order
Recipe refresh priority runs by organic traffic rank. The top 20 recipes by monthly organic sessions get refreshed first (new photography, schema audit, related recipe internal links, updated nutrition). The next 40 get refreshed at 15 months. The remaining recipes get refreshed opportunistically when the ranking slips past position 15 in Google. Skipping the refresh cadence lets recipe rankings drift out of the top 3 inside 18 months as newer competitor recipes take the position.
Schema audit checklist per refresh
The schema audit checklist per refresh runs 8 items: Recipe schema completeness, aggregateRating count and accuracy, nutrition data accuracy, prepTime and cookTime match the recipe body, image URLs valid at CDN, related recipe internal links working, product card SKU URL live, and Google Search Console rich result eligibility validated. This checklist takes 20 minutes per recipe and prevents the schema drift that costs recipe rankings 20 to 40 positions quietly.
Reporting cadence for food brand content marketing
Reporting cadence on food brand content marketing runs a monthly executive report plus a quarterly business review. The monthly report ships in the first business week and covers organic sessions by pillar, top 10 ranking recipes with position trend, ingredient guide ranking movements, sourcing page performance, and organic-attributed DTC revenue. Every number carries a comparison to the prior month and a plain-language interpretation the founder reads in 7 minutes.
Metrics that matter for content marketing
Metrics that matter for food brand content marketing: organic sessions by pillar, recipe rich result impressions in Search Console, organic conversion rate to hero SKU pages, organic-attributed DTC revenue, and top 20 ranking positions by monthly organic sessions. Vanity metrics that do not matter: total pageviews without conversion context, average time on page without conversion attribution, and social share counts. The monthly report skips the vanity block entirely.
Quarterly business review structure
The quarterly business review runs 90 minutes with the founder, head of content, and SEO lead. Agenda: organic traffic trend by pillar, top 10 winning content pieces, top 10 losing content pieces (candidates for refresh or removal), competitive gap analysis against 5 named competitor brands, and next quarter’s content calendar with recipes and ingredient guides queued. According to Ahrefs content marketing research, brands running quarterly content audits outperform brands running annual audits by 40 to 70 percent on organic revenue over a 24-month window.
Internal linking discipline across food brand content
Internal linking discipline across food brand content moves authority from recipe pages toward hero SKU product pages and comparison guides. Every recipe links to the hero SKU it uses inline (once in the ingredient list, once in a bottom call-out card). Every ingredient comparison guide links to 3 to 6 recipes using the winning ingredient plus the hero SKU product page. Every sourcing story links to the 2 to 4 SKUs sourced from that specific farm or cooperative.
Anchor text strategy across recipe hubs
Anchor text on internal links varies across recipe hubs to avoid over-optimization patterns Google penalizes. Exact-match anchor (“single-origin Ethiopian coffee”) runs on 20 to 30 percent of internal links. Partial-match variations (“our Ethiopian roast”) run on 30 to 40 percent. Branded anchors (the SKU name) run on 20 to 30 percent. Generic anchors (“shop the coffee”) fill the remaining 10 to 20 percent. This ratio holds ranking without triggering the over-optimization penalty that shows up on brands that anchor-text-stuff every internal link with the same exact-match keyword. Cross-reference the linking layer on our food and beverage web design page.
Link equity from ingredient guides to SKU pages
Link equity from ingredient guides passes to SKU pages when the guide’s comparison table names the hero SKU in the winning column with a product card, and when the guide’s body links to 3 to 6 recipes that use the winning ingredient. This 3-hop path (guide to recipe to SKU) pushes authority from a high-traffic informational query down to a high-intent transactional page. According to Search Engine Land SEO coverage, informational content that internally links to transactional pages produces 2 to 4 times higher organic revenue than isolated content silos.
Wrapping up content marketing for food brands
Content marketing for food brands is the organic engine that turns a DTC snack, drink, or CPG storefront into a search-driven revenue channel. Recipe hub of 40 to 100 recipes. Ingredient comparison guides at 12 to 24 pieces. Sourcing story pages at 6 to 12 pieces. Buyer intent content at 8 to 16 pieces. Creator syndication calendar with 12 to 30 creators per quarter. Refresh cadence at 12 to 24 months by pillar. Reporting with organic sessions and organic revenue attribution.
If your DTC food brand is running paid social at 20,000 dollars monthly with a broken blog and zero recipe schema, professional content marketing for food brands pays for itself inside the first 90 days on organic traffic captured. Redefine Web ships content marketing inside our monthly retainer packages. Book a call and we will walk through the last three DTC food brands we built recipe hubs for, pillar by pillar.
Content marketing for food brands starts with a recipe hub because recipe queries account for 40 to 60 percent of high-intent search volume in the food category. Every hero SKU needs 4 to 12 recipes anchored to it, each targeting a specific occasion and audience.
Skip the recipe hub and the brand loses the search real estate that pulls DTC storefront traffic month over month at zero incremental paid cost. Recipe traffic converts at 2 to 4 percent because the shopper landed with usage intent, not passive discovery, which is why food brands win on recipes.
Recipe schema and Google rich result eligibility
Every recipe page ships schema.org Recipe markup including cookTime, prepTime, recipeIngredient, recipeInstructions, nutrition, and aggregateRating. Correctly marked-up recipes qualify for Google’s recipe rich result carousel that pulls 3 to 6 times higher click-through rate than a plain blue link. The schema layer takes 15 minutes per recipe to author and 30 minutes to validate in Google Search Console. Cross-reference the recipe search stack on our food and beverage SEO page.
Recipe hub structure that scales
The recipe hub structure runs 40 to 100 recipes at maturity, organized by hero SKU (4 to 12 recipes per SKU) plus occasion tags (breakfast, weeknight dinner, meal prep, brunch, holiday). Every recipe links back to the hero SKU product page with the SKU embedded in an inline card. The hub earns internal linking value from ingredient comparison guides and the sourcing story pages, which feeds recipe ranking on Google. According to Google Search Central recipe structured data guidance, complete Recipe schema markup is required for eligibility in the recipe carousel and the ingredient search filter.
Pillar structure for food brand content marketing
The pillar structure on content marketing for food brands runs 4 content pillars concurrently: recipe hub (40 to 100 recipes), ingredient comparison guides (12 to 24 guides), sourcing story pages (6 to 12 pages), and buyer intent content (where to buy, subscription vs. one-time, gift bundle guides). Every pillar covers a distinct search intent and every pillar links back to the hero SKU product pages.
Ingredient comparison guide format
Ingredient comparison guides run 1,800 to 3,200 words comparing 2 to 4 ingredient types on 6 to 10 attributes with a comparison table, real-world use case examples, and links to the hero SKU that uses the specific ingredient. Example: organic vs. conventional oats compares nutritional profile, sourcing chain, cost, environmental impact, and taste on a 6-column table. The brand’s SKU appears in the winning column with a product card. These guides rank 3 to 8 months after publication and pull steady-state organic traffic.
Sourcing story pages that build trust
Sourcing story pages name the specific farms, cooperatives, or suppliers the brand sources from, with photos of the farms, farmer quotes, and specific harvest windows. A coffee brand’s Ethiopian farm page ranks for “single-origin Ethiopian coffee” and “Yirgacheffe coffee origin” plus 40 long-tail variations. The sourcing page pulls trust-building traffic that converts at 4 to 6 percent because the shopper landed pattern-matching on transparency and named provenance. Every sourcing page includes farmer or cooperative quotes, harvest dates, and a link back to 3 to 5 hero SKU pages that source from the named supplier.
Vejrø hospitality content case study
Vejrø Resort, a Danish private-island destination with an on-site restaurant focused on organic, locally sourced cuisine, joined us with strong social engagement and no organic-search real estate. Guests found the resort on Instagram but never in Google search for terms like “private island resort Denmark,” “farm-to-table hospitality Denmark,” or “Vejrø restaurant.” The same organic-search gap shows up on DTC food brands running paid social at 20,000 dollars monthly with a broken blog and zero recipe schema.
We built the conversion-focused website with on-site and off-site SEO tuned to the travel-niche keyword clusters, competitor analysis against comparable boutique resorts, and mobile-first design prioritizing guest discovery. Every page carried the structured data qualifying it for Google’s rich results in the hospitality category. Every internal link pushed authority toward the direct-booking conversion path.
Three months later, Vejrø hit 10,000 plus organic visitors, ranked for 200 plus first-page keywords, and pulled a 2.2 percent booking conversion rate from organic traffic. The same pattern applies to content marketing for food brands: recipe schema, ingredient comparison guides, and sourcing story pages pull organic traffic at 20 to 40 percent conversion into hero SKU pages inside 6 months when the content quality matches search intent and every page carries the right structured data markup. Vejrø also proved out the reporting discipline: every monthly report named the exact page, the exact keyword cluster, and the exact search feature (rich result, sitelinks, image pack) driving the incremental organic revenue instead of hiding behind aggregate traffic charts.
Recipe cadence and content calendar for food brands
Recipe cadence on a working food brand content calendar ships 2 to 4 new recipes per week during the first 6 months and drops to 1 per week at maturity. Each recipe takes 4 to 6 hours to produce (write, test in the kitchen, photograph, schema author, publish). At 3 recipes per week, the brand hits 78 recipes inside 6 months plus a backlog of ingredient comparison and sourcing content queued behind the recipe production line.
| Content pillar | Target volume year 1 | Production cost per piece | Refresh cadence |
|---|---|---|---|
| Recipe hub | 40 to 100 recipes | $180 to $320 | Every 12 months |
| Ingredient comparison guides | 12 to 24 guides | $450 to $780 | Every 18 months |
| Sourcing story pages | 6 to 12 pages | $680 to $1,200 | Every 24 months |
| Buyer intent content | 8 to 16 pieces | $220 to $420 | Every 12 months |
Photography as a content calendar constraint
Photography is the actual constraint on recipe cadence, not writing. Every recipe needs 6 to 12 photos: hero shot, ingredient flat lay, prep in progress, plated result, storage, and step shots for the schema markup. A working food brand batches photography 8 recipes at a time to keep the cost per recipe under 200 dollars. Skip the batching and the per-recipe cost climbs to 400 to 600 dollars, which caps recipe cadence at 1 per week and slows organic ranking timeline by 6 months.
Seasonal content calendar planning
Seasonal content calendar planning maps recipes and comparison guides to the seasonal windows they need to rank in. A Christmas cookie recipe needs to publish in September to rank by early December. A Valentine’s chocolate guide needs to publish in November to rank by early February. A back-to-school lunchbox recipe needs to publish in June to rank by late August. The 60-to-90-day ranking curve dictates the calendar.
Creator syndication inside food brand content
Creator syndication on food brand content marketing amplifies the recipe hub through Instagram Reels, TikTok, and YouTube Shorts creators paid to post their own version of the brand’s hero recipes. The creator content pulls net-new audiences into the recipe hub through the creator’s Link in Bio or Amazon Storefront tag. The syndication calendar names 12 to 30 creators per quarter with specific recipes assigned to each.
One brand we picked up had a spreadsheet titled “creator outreach 2023” with 47 rows and 3 responses. All 3 responses were auto-replies. The spreadsheet named zero recipes and offered flat rates below 100 dollars per post. Nobody posts a 30-second video for 87 dollars flat. Nobody.
Creator content commercial terms that work
Working creator content commercial terms run 350 to 1,500 dollars flat per post plus a 12 to 25 percent commission on tagged sales across a 30-day window. The commission mechanic pulls creators into follow-up posts because the incremental revenue continues past the initial fee. Mid-tier creators (30k to 150k followers) hit the sweet spot for food brand content because their engagement rate typically runs 4 to 8 percent versus 0.8 to 1.6 percent on mega-creators.
Content brief structure for creator partnerships
The content brief structure for creator partnerships runs a single page: the SKU, the specific recipe or usage occasion, 3 required brand mentions, 3 restricted claims (no health claims on non-medical SKUs), the pricing angle, the affiliate link, and 3 example videos that hit the tone. The brief avoids over-scripting because over-scripted creator content underperforms native creator voice by 40 to 60 percent on engagement rate.
Buyer intent content for food brand blogs
Buyer intent content on food brand blogs covers 8 to 16 pieces targeting explicit purchase-decision queries: “where to buy [brand],” “[brand] subscription vs. one-time,” “best [category] for [use case],” and “[brand] gift bundle.” Every buyer intent piece runs 1,400 to 2,400 words with a comparison table, product cards, and a clear conversion path to the specific SKU that matches the query intent. Buyer intent content converts at 3 to 6 percent versus 1 to 2 percent on recipe content because the shopper landed already planning to buy, not exploring a usage occasion.
Where-to-buy content structure
Where-to-buy content structure covers online (DTC storefront, Amazon, Target.com, Whole Foods online), retail (specific chain locators with the store finder embedded), and international (customs limitations, retailer partners abroad). Every piece names specific retailers, links to the store locator, and includes an FAQ block covering shipping availability, subscription options, and gift card compatibility. Where-to-buy content ranks for branded discovery queries the DTC storefront otherwise loses to competitor affiliate reviews.
Subscription versus one-time comparison content
Subscription versus one-time comparison content converts subscription commitments at 3 to 6 percent because it addresses the price-sensitivity concern head-on with a specific math table. The piece covers the discount structure (15 percent lifetime), the skip-a-month mechanic, the pause-anytime rule, the cancellation policy, and the specific yearly savings for the brand’s average consumption cadence. Cross-reference the retention structure on our food and beverage marketing retainer page.
Content refresh cadence on food brand pillars
Content refresh cadence on food brand content pillars runs a rolling audit every 12 to 24 months by pillar. Recipes get refreshed every 12 months with new photography, updated schema, and any nutrition or ingredient adjustments. Ingredient comparison guides refresh every 18 months to update market data. Sourcing story pages refresh every 24 months to reflect farm partnership changes and new harvest angles. Buyer intent content refreshes every 12 months to update retailer availability and pricing.
Recipe refresh priority order
Recipe refresh priority runs by organic traffic rank. The top 20 recipes by monthly organic sessions get refreshed first (new photography, schema audit, related recipe internal links, updated nutrition). The next 40 get refreshed at 15 months. The remaining recipes get refreshed opportunistically when the ranking slips past position 15 in Google. Skipping the refresh cadence lets recipe rankings drift out of the top 3 inside 18 months as newer competitor recipes take the position.
Schema audit checklist per refresh
The schema audit checklist per refresh runs 8 items: Recipe schema completeness, aggregateRating count and accuracy, nutrition data accuracy, prepTime and cookTime match the recipe body, image URLs valid at CDN, related recipe internal links working, product card SKU URL live, and Google Search Console rich result eligibility validated. This checklist takes 20 minutes per recipe and prevents the schema drift that costs recipe rankings 20 to 40 positions quietly.
Reporting cadence for food brand content marketing
Reporting cadence on food brand content marketing runs a monthly executive report plus a quarterly business review. The monthly report ships in the first business week and covers organic sessions by pillar, top 10 ranking recipes with position trend, ingredient guide ranking movements, sourcing page performance, and organic-attributed DTC revenue. Every number carries a comparison to the prior month and a plain-language interpretation the founder reads in 7 minutes.
Metrics that matter for content marketing
Metrics that matter for food brand content marketing: organic sessions by pillar, recipe rich result impressions in Search Console, organic conversion rate to hero SKU pages, organic-attributed DTC revenue, and top 20 ranking positions by monthly organic sessions. Vanity metrics that do not matter: total pageviews without conversion context, average time on page without conversion attribution, and social share counts. The monthly report skips the vanity block entirely.
Quarterly business review structure
The quarterly business review runs 90 minutes with the founder, head of content, and SEO lead. Agenda: organic traffic trend by pillar, top 10 winning content pieces, top 10 losing content pieces (candidates for refresh or removal), competitive gap analysis against 5 named competitor brands, and next quarter’s content calendar with recipes and ingredient guides queued. According to Ahrefs content marketing research, brands running quarterly content audits outperform brands running annual audits by 40 to 70 percent on organic revenue over a 24-month window.
Internal linking discipline across food brand content
Internal linking discipline across food brand content moves authority from recipe pages toward hero SKU product pages and comparison guides. Every recipe links to the hero SKU it uses inline (once in the ingredient list, once in a bottom call-out card). Every ingredient comparison guide links to 3 to 6 recipes using the winning ingredient plus the hero SKU product page. Every sourcing story links to the 2 to 4 SKUs sourced from that specific farm or cooperative.
Anchor text strategy across recipe hubs
Anchor text on internal links varies across recipe hubs to avoid over-optimization patterns Google penalizes. Exact-match anchor (“single-origin Ethiopian coffee”) runs on 20 to 30 percent of internal links. Partial-match variations (“our Ethiopian roast”) run on 30 to 40 percent. Branded anchors (the SKU name) run on 20 to 30 percent. Generic anchors (“shop the coffee”) fill the remaining 10 to 20 percent. This ratio holds ranking without triggering the over-optimization penalty that shows up on brands that anchor-text-stuff every internal link with the same exact-match keyword. Cross-reference the linking layer on our food and beverage web design page.
Link equity from ingredient guides to SKU pages
Link equity from ingredient guides passes to SKU pages when the guide’s comparison table names the hero SKU in the winning column with a product card, and when the guide’s body links to 3 to 6 recipes that use the winning ingredient. This 3-hop path (guide to recipe to SKU) pushes authority from a high-traffic informational query down to a high-intent transactional page. According to Search Engine Land SEO coverage, informational content that internally links to transactional pages produces 2 to 4 times higher organic revenue than isolated content silos.
Wrapping up content marketing for food brands
Content marketing for food brands is the organic engine that turns a DTC snack, drink, or CPG storefront into a search-driven revenue channel. Recipe hub of 40 to 100 recipes. Ingredient comparison guides at 12 to 24 pieces. Sourcing story pages at 6 to 12 pieces. Buyer intent content at 8 to 16 pieces. Creator syndication calendar with 12 to 30 creators per quarter. Refresh cadence at 12 to 24 months by pillar. Reporting with organic sessions and organic revenue attribution.
If your DTC food brand is running paid social at 20,000 dollars monthly with a broken blog and zero recipe schema, professional content marketing for food brands pays for itself inside the first 90 days on organic traffic captured. Redefine Web ships content marketing inside our monthly retainer packages. Book a call and we will walk through the last three DTC food brands we built recipe hubs for, pillar by pillar.
Anchor text on internal links varies across recipe hubs to avoid over-optimization patterns Google penalizes. Exact-match anchor (“single-origin Ethiopian coffee”) runs on 20 to 30 percent of internal links. Partial-match variations (“our Ethiopian roast”) run on 30 to 40 percent. Branded anchors (the SKU name) run on 20 to 30 percent. Generic anchors (“shop the coffee”) fill the remaining 10 to 20 percent. This ratio holds ranking without triggering the over-optimization penalty that shows up on brands that anchor-text-stuff every internal link with the same exact-match keyword. Cross-reference the linking layer on our food and beverage web design page.
Link equity from ingredient guides to SKU pages
Link equity from ingredient guides passes to SKU pages when the guide’s comparison table names the hero SKU in the winning column with a product card, and when the guide’s body links to 3 to 6 recipes that use the winning ingredient. This 3-hop path (guide to recipe to SKU) pushes authority from a high-traffic informational query down to a high-intent transactional page. According to Search Engine Land SEO coverage, informational content that internally links to transactional pages produces 2 to 4 times higher organic revenue than isolated content silos.
Wrapping up content marketing for food brands
Content marketing for food brands is the organic engine that turns a DTC snack, drink, or CPG storefront into a search-driven revenue channel. Recipe hub of 40 to 100 recipes. Ingredient comparison guides at 12 to 24 pieces. Sourcing story pages at 6 to 12 pieces. Buyer intent content at 8 to 16 pieces. Creator syndication calendar with 12 to 30 creators per quarter. Refresh cadence at 12 to 24 months by pillar. Reporting with organic sessions and organic revenue attribution.
If your DTC food brand is running paid social at 20,000 dollars monthly with a broken blog and zero recipe schema, professional content marketing for food brands pays for itself inside the first 90 days on organic traffic captured. Redefine Web ships content marketing inside our monthly retainer packages. Book a call and we will walk through the last three DTC food brands we built recipe hubs for, pillar by pillar.
Internal linking discipline across food brand content moves authority from recipe pages toward hero SKU product pages and comparison guides. Every recipe links to the hero SKU it uses inline (once in the ingredient list, once in a bottom call-out card). Every ingredient comparison guide links to 3 to 6 recipes using the winning ingredient plus the hero SKU product page. Every sourcing story links to the 2 to 4 SKUs sourced from that specific farm or cooperative.
Anchor text strategy across recipe hubs
Anchor text on internal links varies across recipe hubs to avoid over-optimization patterns Google penalizes. Exact-match anchor (“single-origin Ethiopian coffee”) runs on 20 to 30 percent of internal links. Partial-match variations (“our Ethiopian roast”) run on 30 to 40 percent. Branded anchors (the SKU name) run on 20 to 30 percent. Generic anchors (“shop the coffee”) fill the remaining 10 to 20 percent. This ratio holds ranking without triggering the over-optimization penalty that shows up on brands that anchor-text-stuff every internal link with the same exact-match keyword. Cross-reference the linking layer on our food and beverage web design page.
Link equity from ingredient guides to SKU pages
Link equity from ingredient guides passes to SKU pages when the guide’s comparison table names the hero SKU in the winning column with a product card, and when the guide’s body links to 3 to 6 recipes that use the winning ingredient. This 3-hop path (guide to recipe to SKU) pushes authority from a high-traffic informational query down to a high-intent transactional page. According to Search Engine Land SEO coverage, informational content that internally links to transactional pages produces 2 to 4 times higher organic revenue than isolated content silos.
Wrapping up content marketing for food brands
Content marketing for food brands is the organic engine that turns a DTC snack, drink, or CPG storefront into a search-driven revenue channel. Recipe hub of 40 to 100 recipes. Ingredient comparison guides at 12 to 24 pieces. Sourcing story pages at 6 to 12 pieces. Buyer intent content at 8 to 16 pieces. Creator syndication calendar with 12 to 30 creators per quarter. Refresh cadence at 12 to 24 months by pillar. Reporting with organic sessions and organic revenue attribution.
If your DTC food brand is running paid social at 20,000 dollars monthly with a broken blog and zero recipe schema, professional content marketing for food brands pays for itself inside the first 90 days on organic traffic captured. Redefine Web ships content marketing inside our monthly retainer packages. Book a call and we will walk through the last three DTC food brands we built recipe hubs for, pillar by pillar.
Content marketing for food brands starts with a recipe hub because recipe queries account for 40 to 60 percent of high-intent search volume in the food category. Every hero SKU needs 4 to 12 recipes anchored to it, each targeting a specific occasion and audience.
Skip the recipe hub and the brand loses the search real estate that pulls DTC storefront traffic month over month at zero incremental paid cost. Recipe traffic converts at 2 to 4 percent because the shopper landed with usage intent, not passive discovery, which is why food brands win on recipes.
Recipe schema and Google rich result eligibility
Every recipe page ships schema.org Recipe markup including cookTime, prepTime, recipeIngredient, recipeInstructions, nutrition, and aggregateRating. Correctly marked-up recipes qualify for Google’s recipe rich result carousel that pulls 3 to 6 times higher click-through rate than a plain blue link. The schema layer takes 15 minutes per recipe to author and 30 minutes to validate in Google Search Console. Cross-reference the recipe search stack on our food and beverage SEO page.
Recipe hub structure that scales
The recipe hub structure runs 40 to 100 recipes at maturity, organized by hero SKU (4 to 12 recipes per SKU) plus occasion tags (breakfast, weeknight dinner, meal prep, brunch, holiday). Every recipe links back to the hero SKU product page with the SKU embedded in an inline card. The hub earns internal linking value from ingredient comparison guides and the sourcing story pages, which feeds recipe ranking on Google. According to Google Search Central recipe structured data guidance, complete Recipe schema markup is required for eligibility in the recipe carousel and the ingredient search filter.
Pillar structure for food brand content marketing
The pillar structure on content marketing for food brands runs 4 content pillars concurrently: recipe hub (40 to 100 recipes), ingredient comparison guides (12 to 24 guides), sourcing story pages (6 to 12 pages), and buyer intent content (where to buy, subscription vs. one-time, gift bundle guides). Every pillar covers a distinct search intent and every pillar links back to the hero SKU product pages.
Ingredient comparison guide format
Ingredient comparison guides run 1,800 to 3,200 words comparing 2 to 4 ingredient types on 6 to 10 attributes with a comparison table, real-world use case examples, and links to the hero SKU that uses the specific ingredient. Example: organic vs. conventional oats compares nutritional profile, sourcing chain, cost, environmental impact, and taste on a 6-column table. The brand’s SKU appears in the winning column with a product card. These guides rank 3 to 8 months after publication and pull steady-state organic traffic.
Sourcing story pages that build trust
Sourcing story pages name the specific farms, cooperatives, or suppliers the brand sources from, with photos of the farms, farmer quotes, and specific harvest windows. A coffee brand’s Ethiopian farm page ranks for “single-origin Ethiopian coffee” and “Yirgacheffe coffee origin” plus 40 long-tail variations. The sourcing page pulls trust-building traffic that converts at 4 to 6 percent because the shopper landed pattern-matching on transparency and named provenance. Every sourcing page includes farmer or cooperative quotes, harvest dates, and a link back to 3 to 5 hero SKU pages that source from the named supplier.
Vejrø hospitality content case study
Vejrø Resort, a Danish private-island destination with an on-site restaurant focused on organic, locally sourced cuisine, joined us with strong social engagement and no organic-search real estate. Guests found the resort on Instagram but never in Google search for terms like “private island resort Denmark,” “farm-to-table hospitality Denmark,” or “Vejrø restaurant.” The same organic-search gap shows up on DTC food brands running paid social at 20,000 dollars monthly with a broken blog and zero recipe schema.
We built the conversion-focused website with on-site and off-site SEO tuned to the travel-niche keyword clusters, competitor analysis against comparable boutique resorts, and mobile-first design prioritizing guest discovery. Every page carried the structured data qualifying it for Google’s rich results in the hospitality category. Every internal link pushed authority toward the direct-booking conversion path.
Three months later, Vejrø hit 10,000 plus organic visitors, ranked for 200 plus first-page keywords, and pulled a 2.2 percent booking conversion rate from organic traffic. The same pattern applies to content marketing for food brands: recipe schema, ingredient comparison guides, and sourcing story pages pull organic traffic at 20 to 40 percent conversion into hero SKU pages inside 6 months when the content quality matches search intent and every page carries the right structured data markup. Vejrø also proved out the reporting discipline: every monthly report named the exact page, the exact keyword cluster, and the exact search feature (rich result, sitelinks, image pack) driving the incremental organic revenue instead of hiding behind aggregate traffic charts.
Recipe cadence and content calendar for food brands
Recipe cadence on a working food brand content calendar ships 2 to 4 new recipes per week during the first 6 months and drops to 1 per week at maturity. Each recipe takes 4 to 6 hours to produce (write, test in the kitchen, photograph, schema author, publish). At 3 recipes per week, the brand hits 78 recipes inside 6 months plus a backlog of ingredient comparison and sourcing content queued behind the recipe production line.
| Content pillar | Target volume year 1 | Production cost per piece | Refresh cadence |
|---|---|---|---|
| Recipe hub | 40 to 100 recipes | $180 to $320 | Every 12 months |
| Ingredient comparison guides | 12 to 24 guides | $450 to $780 | Every 18 months |
| Sourcing story pages | 6 to 12 pages | $680 to $1,200 | Every 24 months |
| Buyer intent content | 8 to 16 pieces | $220 to $420 | Every 12 months |
Photography as a content calendar constraint
Photography is the actual constraint on recipe cadence, not writing. Every recipe needs 6 to 12 photos: hero shot, ingredient flat lay, prep in progress, plated result, storage, and step shots for the schema markup. A working food brand batches photography 8 recipes at a time to keep the cost per recipe under 200 dollars. Skip the batching and the per-recipe cost climbs to 400 to 600 dollars, which caps recipe cadence at 1 per week and slows organic ranking timeline by 6 months.
Seasonal content calendar planning
Seasonal content calendar planning maps recipes and comparison guides to the seasonal windows they need to rank in. A Christmas cookie recipe needs to publish in September to rank by early December. A Valentine’s chocolate guide needs to publish in November to rank by early February. A back-to-school lunchbox recipe needs to publish in June to rank by late August. The 60-to-90-day ranking curve dictates the calendar.
Creator syndication inside food brand content
Creator syndication on food brand content marketing amplifies the recipe hub through Instagram Reels, TikTok, and YouTube Shorts creators paid to post their own version of the brand’s hero recipes. The creator content pulls net-new audiences into the recipe hub through the creator’s Link in Bio or Amazon Storefront tag. The syndication calendar names 12 to 30 creators per quarter with specific recipes assigned to each.
One brand we picked up had a spreadsheet titled “creator outreach 2023” with 47 rows and 3 responses. All 3 responses were auto-replies. The spreadsheet named zero recipes and offered flat rates below 100 dollars per post. Nobody posts a 30-second video for 87 dollars flat. Nobody.
Creator content commercial terms that work
Working creator content commercial terms run 350 to 1,500 dollars flat per post plus a 12 to 25 percent commission on tagged sales across a 30-day window. The commission mechanic pulls creators into follow-up posts because the incremental revenue continues past the initial fee. Mid-tier creators (30k to 150k followers) hit the sweet spot for food brand content because their engagement rate typically runs 4 to 8 percent versus 0.8 to 1.6 percent on mega-creators.
Content brief structure for creator partnerships
The content brief structure for creator partnerships runs a single page: the SKU, the specific recipe or usage occasion, 3 required brand mentions, 3 restricted claims (no health claims on non-medical SKUs), the pricing angle, the affiliate link, and 3 example videos that hit the tone. The brief avoids over-scripting because over-scripted creator content underperforms native creator voice by 40 to 60 percent on engagement rate.
Buyer intent content for food brand blogs
Buyer intent content on food brand blogs covers 8 to 16 pieces targeting explicit purchase-decision queries: “where to buy [brand],” “[brand] subscription vs. one-time,” “best [category] for [use case],” and “[brand] gift bundle.” Every buyer intent piece runs 1,400 to 2,400 words with a comparison table, product cards, and a clear conversion path to the specific SKU that matches the query intent. Buyer intent content converts at 3 to 6 percent versus 1 to 2 percent on recipe content because the shopper landed already planning to buy, not exploring a usage occasion.
Where-to-buy content structure
Where-to-buy content structure covers online (DTC storefront, Amazon, Target.com, Whole Foods online), retail (specific chain locators with the store finder embedded), and international (customs limitations, retailer partners abroad). Every piece names specific retailers, links to the store locator, and includes an FAQ block covering shipping availability, subscription options, and gift card compatibility. Where-to-buy content ranks for branded discovery queries the DTC storefront otherwise loses to competitor affiliate reviews.
Subscription versus one-time comparison content
Subscription versus one-time comparison content converts subscription commitments at 3 to 6 percent because it addresses the price-sensitivity concern head-on with a specific math table. The piece covers the discount structure (15 percent lifetime), the skip-a-month mechanic, the pause-anytime rule, the cancellation policy, and the specific yearly savings for the brand’s average consumption cadence. Cross-reference the retention structure on our food and beverage marketing retainer page.
Content refresh cadence on food brand pillars
Content refresh cadence on food brand content pillars runs a rolling audit every 12 to 24 months by pillar. Recipes get refreshed every 12 months with new photography, updated schema, and any nutrition or ingredient adjustments. Ingredient comparison guides refresh every 18 months to update market data. Sourcing story pages refresh every 24 months to reflect farm partnership changes and new harvest angles. Buyer intent content refreshes every 12 months to update retailer availability and pricing.
Recipe refresh priority order
Recipe refresh priority runs by organic traffic rank. The top 20 recipes by monthly organic sessions get refreshed first (new photography, schema audit, related recipe internal links, updated nutrition). The next 40 get refreshed at 15 months. The remaining recipes get refreshed opportunistically when the ranking slips past position 15 in Google. Skipping the refresh cadence lets recipe rankings drift out of the top 3 inside 18 months as newer competitor recipes take the position.
Schema audit checklist per refresh
The schema audit checklist per refresh runs 8 items: Recipe schema completeness, aggregateRating count and accuracy, nutrition data accuracy, prepTime and cookTime match the recipe body, image URLs valid at CDN, related recipe internal links working, product card SKU URL live, and Google Search Console rich result eligibility validated. This checklist takes 20 minutes per recipe and prevents the schema drift that costs recipe rankings 20 to 40 positions quietly.
Reporting cadence for food brand content marketing
Reporting cadence on food brand content marketing runs a monthly executive report plus a quarterly business review. The monthly report ships in the first business week and covers organic sessions by pillar, top 10 ranking recipes with position trend, ingredient guide ranking movements, sourcing page performance, and organic-attributed DTC revenue. Every number carries a comparison to the prior month and a plain-language interpretation the founder reads in 7 minutes.
Metrics that matter for content marketing
Metrics that matter for food brand content marketing: organic sessions by pillar, recipe rich result impressions in Search Console, organic conversion rate to hero SKU pages, organic-attributed DTC revenue, and top 20 ranking positions by monthly organic sessions. Vanity metrics that do not matter: total pageviews without conversion context, average time on page without conversion attribution, and social share counts. The monthly report skips the vanity block entirely.
Quarterly business review structure
The quarterly business review runs 90 minutes with the founder, head of content, and SEO lead. Agenda: organic traffic trend by pillar, top 10 winning content pieces, top 10 losing content pieces (candidates for refresh or removal), competitive gap analysis against 5 named competitor brands, and next quarter’s content calendar with recipes and ingredient guides queued. According to Ahrefs content marketing research, brands running quarterly content audits outperform brands running annual audits by 40 to 70 percent on organic revenue over a 24-month window.
Internal linking discipline across food brand content
Internal linking discipline across food brand content moves authority from recipe pages toward hero SKU product pages and comparison guides. Every recipe links to the hero SKU it uses inline (once in the ingredient list, once in a bottom call-out card). Every ingredient comparison guide links to 3 to 6 recipes using the winning ingredient plus the hero SKU product page. Every sourcing story links to the 2 to 4 SKUs sourced from that specific farm or cooperative.
Anchor text strategy across recipe hubs
Anchor text on internal links varies across recipe hubs to avoid over-optimization patterns Google penalizes. Exact-match anchor (“single-origin Ethiopian coffee”) runs on 20 to 30 percent of internal links. Partial-match variations (“our Ethiopian roast”) run on 30 to 40 percent. Branded anchors (the SKU name) run on 20 to 30 percent. Generic anchors (“shop the coffee”) fill the remaining 10 to 20 percent. This ratio holds ranking without triggering the over-optimization penalty that shows up on brands that anchor-text-stuff every internal link with the same exact-match keyword. Cross-reference the linking layer on our food and beverage web design page.
Link equity from ingredient guides to SKU pages
Link equity from ingredient guides passes to SKU pages when the guide’s comparison table names the hero SKU in the winning column with a product card, and when the guide’s body links to 3 to 6 recipes that use the winning ingredient. This 3-hop path (guide to recipe to SKU) pushes authority from a high-traffic informational query down to a high-intent transactional page. According to Search Engine Land SEO coverage, informational content that internally links to transactional pages produces 2 to 4 times higher organic revenue than isolated content silos.
Wrapping up content marketing for food brands
Content marketing for food brands is the organic engine that turns a DTC snack, drink, or CPG storefront into a search-driven revenue channel. Recipe hub of 40 to 100 recipes. Ingredient comparison guides at 12 to 24 pieces. Sourcing story pages at 6 to 12 pieces. Buyer intent content at 8 to 16 pieces. Creator syndication calendar with 12 to 30 creators per quarter. Refresh cadence at 12 to 24 months by pillar. Reporting with organic sessions and organic revenue attribution.
If your DTC food brand is running paid social at 20,000 dollars monthly with a broken blog and zero recipe schema, professional content marketing for food brands pays for itself inside the first 90 days on organic traffic captured. Redefine Web ships content marketing inside our monthly retainer packages. Book a call and we will walk through the last three DTC food brands we built recipe hubs for, pillar by pillar.
Content marketing for food brands starts with a recipe hub because recipe queries account for 40 to 60 percent of high-intent search volume in the food category. Every hero SKU needs 4 to 12 recipes anchored to it, each targeting a specific occasion and audience.
Skip the recipe hub and the brand loses the search real estate that pulls DTC storefront traffic month over month at zero incremental paid cost. Recipe traffic converts at 2 to 4 percent because the shopper landed with usage intent, not passive discovery, which is why food brands win on recipes.
Recipe schema and Google rich result eligibility
Every recipe page ships schema.org Recipe markup including cookTime, prepTime, recipeIngredient, recipeInstructions, nutrition, and aggregateRating. Correctly marked-up recipes qualify for Google’s recipe rich result carousel that pulls 3 to 6 times higher click-through rate than a plain blue link. The schema layer takes 15 minutes per recipe to author and 30 minutes to validate in Google Search Console. Cross-reference the recipe search stack on our food and beverage SEO page.
Recipe hub structure that scales
The recipe hub structure runs 40 to 100 recipes at maturity, organized by hero SKU (4 to 12 recipes per SKU) plus occasion tags (breakfast, weeknight dinner, meal prep, brunch, holiday). Every recipe links back to the hero SKU product page with the SKU embedded in an inline card. The hub earns internal linking value from ingredient comparison guides and the sourcing story pages, which feeds recipe ranking on Google. According to Google Search Central recipe structured data guidance, complete Recipe schema markup is required for eligibility in the recipe carousel and the ingredient search filter.
Pillar structure for food brand content marketing
The pillar structure on content marketing for food brands runs 4 content pillars concurrently: recipe hub (40 to 100 recipes), ingredient comparison guides (12 to 24 guides), sourcing story pages (6 to 12 pages), and buyer intent content (where to buy, subscription vs. one-time, gift bundle guides). Every pillar covers a distinct search intent and every pillar links back to the hero SKU product pages.
Ingredient comparison guide format
Ingredient comparison guides run 1,800 to 3,200 words comparing 2 to 4 ingredient types on 6 to 10 attributes with a comparison table, real-world use case examples, and links to the hero SKU that uses the specific ingredient. Example: organic vs. conventional oats compares nutritional profile, sourcing chain, cost, environmental impact, and taste on a 6-column table. The brand’s SKU appears in the winning column with a product card. These guides rank 3 to 8 months after publication and pull steady-state organic traffic.
Sourcing story pages that build trust
Sourcing story pages name the specific farms, cooperatives, or suppliers the brand sources from, with photos of the farms, farmer quotes, and specific harvest windows. A coffee brand’s Ethiopian farm page ranks for “single-origin Ethiopian coffee” and “Yirgacheffe coffee origin” plus 40 long-tail variations. The sourcing page pulls trust-building traffic that converts at 4 to 6 percent because the shopper landed pattern-matching on transparency and named provenance. Every sourcing page includes farmer or cooperative quotes, harvest dates, and a link back to 3 to 5 hero SKU pages that source from the named supplier.
Vejrø hospitality content case study
Vejrø Resort, a Danish private-island destination with an on-site restaurant focused on organic, locally sourced cuisine, joined us with strong social engagement and no organic-search real estate. Guests found the resort on Instagram but never in Google search for terms like “private island resort Denmark,” “farm-to-table hospitality Denmark,” or “Vejrø restaurant.” The same organic-search gap shows up on DTC food brands running paid social at 20,000 dollars monthly with a broken blog and zero recipe schema.
We built the conversion-focused website with on-site and off-site SEO tuned to the travel-niche keyword clusters, competitor analysis against comparable boutique resorts, and mobile-first design prioritizing guest discovery. Every page carried the structured data qualifying it for Google’s rich results in the hospitality category. Every internal link pushed authority toward the direct-booking conversion path.
Three months later, Vejrø hit 10,000 plus organic visitors, ranked for 200 plus first-page keywords, and pulled a 2.2 percent booking conversion rate from organic traffic. The same pattern applies to content marketing for food brands: recipe schema, ingredient comparison guides, and sourcing story pages pull organic traffic at 20 to 40 percent conversion into hero SKU pages inside 6 months when the content quality matches search intent and every page carries the right structured data markup. Vejrø also proved out the reporting discipline: every monthly report named the exact page, the exact keyword cluster, and the exact search feature (rich result, sitelinks, image pack) driving the incremental organic revenue instead of hiding behind aggregate traffic charts.
Recipe cadence and content calendar for food brands
Recipe cadence on a working food brand content calendar ships 2 to 4 new recipes per week during the first 6 months and drops to 1 per week at maturity. Each recipe takes 4 to 6 hours to produce (write, test in the kitchen, photograph, schema author, publish). At 3 recipes per week, the brand hits 78 recipes inside 6 months plus a backlog of ingredient comparison and sourcing content queued behind the recipe production line.
| Content pillar | Target volume year 1 | Production cost per piece | Refresh cadence |
|---|---|---|---|
| Recipe hub | 40 to 100 recipes | $180 to $320 | Every 12 months |
| Ingredient comparison guides | 12 to 24 guides | $450 to $780 | Every 18 months |
| Sourcing story pages | 6 to 12 pages | $680 to $1,200 | Every 24 months |
| Buyer intent content | 8 to 16 pieces | $220 to $420 | Every 12 months |
Photography as a content calendar constraint
Photography is the actual constraint on recipe cadence, not writing. Every recipe needs 6 to 12 photos: hero shot, ingredient flat lay, prep in progress, plated result, storage, and step shots for the schema markup. A working food brand batches photography 8 recipes at a time to keep the cost per recipe under 200 dollars. Skip the batching and the per-recipe cost climbs to 400 to 600 dollars, which caps recipe cadence at 1 per week and slows organic ranking timeline by 6 months.
Seasonal content calendar planning
Seasonal content calendar planning maps recipes and comparison guides to the seasonal windows they need to rank in. A Christmas cookie recipe needs to publish in September to rank by early December. A Valentine’s chocolate guide needs to publish in November to rank by early February. A back-to-school lunchbox recipe needs to publish in June to rank by late August. The 60-to-90-day ranking curve dictates the calendar.
Creator syndication inside food brand content
Creator syndication on food brand content marketing amplifies the recipe hub through Instagram Reels, TikTok, and YouTube Shorts creators paid to post their own version of the brand’s hero recipes. The creator content pulls net-new audiences into the recipe hub through the creator’s Link in Bio or Amazon Storefront tag. The syndication calendar names 12 to 30 creators per quarter with specific recipes assigned to each.
One brand we picked up had a spreadsheet titled “creator outreach 2023” with 47 rows and 3 responses. All 3 responses were auto-replies. The spreadsheet named zero recipes and offered flat rates below 100 dollars per post. Nobody posts a 30-second video for 87 dollars flat. Nobody.
Creator content commercial terms that work
Working creator content commercial terms run 350 to 1,500 dollars flat per post plus a 12 to 25 percent commission on tagged sales across a 30-day window. The commission mechanic pulls creators into follow-up posts because the incremental revenue continues past the initial fee. Mid-tier creators (30k to 150k followers) hit the sweet spot for food brand content because their engagement rate typically runs 4 to 8 percent versus 0.8 to 1.6 percent on mega-creators.
Content brief structure for creator partnerships
The content brief structure for creator partnerships runs a single page: the SKU, the specific recipe or usage occasion, 3 required brand mentions, 3 restricted claims (no health claims on non-medical SKUs), the pricing angle, the affiliate link, and 3 example videos that hit the tone. The brief avoids over-scripting because over-scripted creator content underperforms native creator voice by 40 to 60 percent on engagement rate.
Buyer intent content for food brand blogs
Buyer intent content on food brand blogs covers 8 to 16 pieces targeting explicit purchase-decision queries: “where to buy [brand],” “[brand] subscription vs. one-time,” “best [category] for [use case],” and “[brand] gift bundle.” Every buyer intent piece runs 1,400 to 2,400 words with a comparison table, product cards, and a clear conversion path to the specific SKU that matches the query intent. Buyer intent content converts at 3 to 6 percent versus 1 to 2 percent on recipe content because the shopper landed already planning to buy, not exploring a usage occasion.
Where-to-buy content structure
Where-to-buy content structure covers online (DTC storefront, Amazon, Target.com, Whole Foods online), retail (specific chain locators with the store finder embedded), and international (customs limitations, retailer partners abroad). Every piece names specific retailers, links to the store locator, and includes an FAQ block covering shipping availability, subscription options, and gift card compatibility. Where-to-buy content ranks for branded discovery queries the DTC storefront otherwise loses to competitor affiliate reviews.
Subscription versus one-time comparison content
Subscription versus one-time comparison content converts subscription commitments at 3 to 6 percent because it addresses the price-sensitivity concern head-on with a specific math table. The piece covers the discount structure (15 percent lifetime), the skip-a-month mechanic, the pause-anytime rule, the cancellation policy, and the specific yearly savings for the brand’s average consumption cadence. Cross-reference the retention structure on our food and beverage marketing retainer page.
Content refresh cadence on food brand pillars
Content refresh cadence on food brand content pillars runs a rolling audit every 12 to 24 months by pillar. Recipes get refreshed every 12 months with new photography, updated schema, and any nutrition or ingredient adjustments. Ingredient comparison guides refresh every 18 months to update market data. Sourcing story pages refresh every 24 months to reflect farm partnership changes and new harvest angles. Buyer intent content refreshes every 12 months to update retailer availability and pricing.
Recipe refresh priority order
Recipe refresh priority runs by organic traffic rank. The top 20 recipes by monthly organic sessions get refreshed first (new photography, schema audit, related recipe internal links, updated nutrition). The next 40 get refreshed at 15 months. The remaining recipes get refreshed opportunistically when the ranking slips past position 15 in Google. Skipping the refresh cadence lets recipe rankings drift out of the top 3 inside 18 months as newer competitor recipes take the position.
Schema audit checklist per refresh
The schema audit checklist per refresh runs 8 items: Recipe schema completeness, aggregateRating count and accuracy, nutrition data accuracy, prepTime and cookTime match the recipe body, image URLs valid at CDN, related recipe internal links working, product card SKU URL live, and Google Search Console rich result eligibility validated. This checklist takes 20 minutes per recipe and prevents the schema drift that costs recipe rankings 20 to 40 positions quietly.
Reporting cadence for food brand content marketing
Reporting cadence on food brand content marketing runs a monthly executive report plus a quarterly business review. The monthly report ships in the first business week and covers organic sessions by pillar, top 10 ranking recipes with position trend, ingredient guide ranking movements, sourcing page performance, and organic-attributed DTC revenue. Every number carries a comparison to the prior month and a plain-language interpretation the founder reads in 7 minutes.
Metrics that matter for content marketing
Metrics that matter for food brand content marketing: organic sessions by pillar, recipe rich result impressions in Search Console, organic conversion rate to hero SKU pages, organic-attributed DTC revenue, and top 20 ranking positions by monthly organic sessions. Vanity metrics that do not matter: total pageviews without conversion context, average time on page without conversion attribution, and social share counts. The monthly report skips the vanity block entirely.
Quarterly business review structure
The quarterly business review runs 90 minutes with the founder, head of content, and SEO lead. Agenda: organic traffic trend by pillar, top 10 winning content pieces, top 10 losing content pieces (candidates for refresh or removal), competitive gap analysis against 5 named competitor brands, and next quarter’s content calendar with recipes and ingredient guides queued. According to Ahrefs content marketing research, brands running quarterly content audits outperform brands running annual audits by 40 to 70 percent on organic revenue over a 24-month window.
Internal linking discipline across food brand content
Internal linking discipline across food brand content moves authority from recipe pages toward hero SKU product pages and comparison guides. Every recipe links to the hero SKU it uses inline (once in the ingredient list, once in a bottom call-out card). Every ingredient comparison guide links to 3 to 6 recipes using the winning ingredient plus the hero SKU product page. Every sourcing story links to the 2 to 4 SKUs sourced from that specific farm or cooperative.
Anchor text strategy across recipe hubs
Anchor text on internal links varies across recipe hubs to avoid over-optimization patterns Google penalizes. Exact-match anchor (“single-origin Ethiopian coffee”) runs on 20 to 30 percent of internal links. Partial-match variations (“our Ethiopian roast”) run on 30 to 40 percent. Branded anchors (the SKU name) run on 20 to 30 percent. Generic anchors (“shop the coffee”) fill the remaining 10 to 20 percent. This ratio holds ranking without triggering the over-optimization penalty that shows up on brands that anchor-text-stuff every internal link with the same exact-match keyword. Cross-reference the linking layer on our food and beverage web design page.
Link equity from ingredient guides to SKU pages
Link equity from ingredient guides passes to SKU pages when the guide’s comparison table names the hero SKU in the winning column with a product card, and when the guide’s body links to 3 to 6 recipes that use the winning ingredient. This 3-hop path (guide to recipe to SKU) pushes authority from a high-traffic informational query down to a high-intent transactional page. According to Search Engine Land SEO coverage, informational content that internally links to transactional pages produces 2 to 4 times higher organic revenue than isolated content silos.
Wrapping up content marketing for food brands
Content marketing for food brands is the organic engine that turns a DTC snack, drink, or CPG storefront into a search-driven revenue channel. Recipe hub of 40 to 100 recipes. Ingredient comparison guides at 12 to 24 pieces. Sourcing story pages at 6 to 12 pieces. Buyer intent content at 8 to 16 pieces. Creator syndication calendar with 12 to 30 creators per quarter. Refresh cadence at 12 to 24 months by pillar. Reporting with organic sessions and organic revenue attribution.
If your DTC food brand is running paid social at 20,000 dollars monthly with a broken blog and zero recipe schema, professional content marketing for food brands pays for itself inside the first 90 days on organic traffic captured. Redefine Web ships content marketing inside our monthly retainer packages. Book a call and we will walk through the last three DTC food brands we built recipe hubs for, pillar by pillar.
Anchor text on internal links varies across recipe hubs to avoid over-optimization patterns Google penalizes. Exact-match anchor (“single-origin Ethiopian coffee”) runs on 20 to 30 percent of internal links. Partial-match variations (“our Ethiopian roast”) run on 30 to 40 percent. Branded anchors (the SKU name) run on 20 to 30 percent. Generic anchors (“shop the coffee”) fill the remaining 10 to 20 percent. This ratio holds ranking without triggering the over-optimization penalty that shows up on brands that anchor-text-stuff every internal link with the same exact-match keyword. Cross-reference the linking layer on our food and beverage web design page.
Link equity from ingredient guides to SKU pages
Link equity from ingredient guides passes to SKU pages when the guide’s comparison table names the hero SKU in the winning column with a product card, and when the guide’s body links to 3 to 6 recipes that use the winning ingredient. This 3-hop path (guide to recipe to SKU) pushes authority from a high-traffic informational query down to a high-intent transactional page. According to Search Engine Land SEO coverage, informational content that internally links to transactional pages produces 2 to 4 times higher organic revenue than isolated content silos.
Wrapping up content marketing for food brands
Content marketing for food brands is the organic engine that turns a DTC snack, drink, or CPG storefront into a search-driven revenue channel. Recipe hub of 40 to 100 recipes. Ingredient comparison guides at 12 to 24 pieces. Sourcing story pages at 6 to 12 pieces. Buyer intent content at 8 to 16 pieces. Creator syndication calendar with 12 to 30 creators per quarter. Refresh cadence at 12 to 24 months by pillar. Reporting with organic sessions and organic revenue attribution.
If your DTC food brand is running paid social at 20,000 dollars monthly with a broken blog and zero recipe schema, professional content marketing for food brands pays for itself inside the first 90 days on organic traffic captured. Redefine Web ships content marketing inside our monthly retainer packages. Book a call and we will walk through the last three DTC food brands we built recipe hubs for, pillar by pillar.
Content marketing for food brands starts with a recipe hub because recipe queries account for 40 to 60 percent of high-intent search volume in the food category. Every hero SKU needs 4 to 12 recipes anchored to it, each targeting a specific occasion and audience.
Skip the recipe hub and the brand loses the search real estate that pulls DTC storefront traffic month over month at zero incremental paid cost. Recipe traffic converts at 2 to 4 percent because the shopper landed with usage intent, not passive discovery, which is why food brands win on recipes.
Recipe schema and Google rich result eligibility
Every recipe page ships schema.org Recipe markup including cookTime, prepTime, recipeIngredient, recipeInstructions, nutrition, and aggregateRating. Correctly marked-up recipes qualify for Google’s recipe rich result carousel that pulls 3 to 6 times higher click-through rate than a plain blue link. The schema layer takes 15 minutes per recipe to author and 30 minutes to validate in Google Search Console. Cross-reference the recipe search stack on our food and beverage SEO page.
Recipe hub structure that scales
The recipe hub structure runs 40 to 100 recipes at maturity, organized by hero SKU (4 to 12 recipes per SKU) plus occasion tags (breakfast, weeknight dinner, meal prep, brunch, holiday). Every recipe links back to the hero SKU product page with the SKU embedded in an inline card. The hub earns internal linking value from ingredient comparison guides and the sourcing story pages, which feeds recipe ranking on Google. According to Google Search Central recipe structured data guidance, complete Recipe schema markup is required for eligibility in the recipe carousel and the ingredient search filter.
Pillar structure for food brand content marketing
The pillar structure on content marketing for food brands runs 4 content pillars concurrently: recipe hub (40 to 100 recipes), ingredient comparison guides (12 to 24 guides), sourcing story pages (6 to 12 pages), and buyer intent content (where to buy, subscription vs. one-time, gift bundle guides). Every pillar covers a distinct search intent and every pillar links back to the hero SKU product pages.
Ingredient comparison guide format
Ingredient comparison guides run 1,800 to 3,200 words comparing 2 to 4 ingredient types on 6 to 10 attributes with a comparison table, real-world use case examples, and links to the hero SKU that uses the specific ingredient. Example: organic vs. conventional oats compares nutritional profile, sourcing chain, cost, environmental impact, and taste on a 6-column table. The brand’s SKU appears in the winning column with a product card. These guides rank 3 to 8 months after publication and pull steady-state organic traffic.
Sourcing story pages that build trust
Sourcing story pages name the specific farms, cooperatives, or suppliers the brand sources from, with photos of the farms, farmer quotes, and specific harvest windows. A coffee brand’s Ethiopian farm page ranks for “single-origin Ethiopian coffee” and “Yirgacheffe coffee origin” plus 40 long-tail variations. The sourcing page pulls trust-building traffic that converts at 4 to 6 percent because the shopper landed pattern-matching on transparency and named provenance. Every sourcing page includes farmer or cooperative quotes, harvest dates, and a link back to 3 to 5 hero SKU pages that source from the named supplier.
Vejrø hospitality content case study
Vejrø Resort, a Danish private-island destination with an on-site restaurant focused on organic, locally sourced cuisine, joined us with strong social engagement and no organic-search real estate. Guests found the resort on Instagram but never in Google search for terms like “private island resort Denmark,” “farm-to-table hospitality Denmark,” or “Vejrø restaurant.” The same organic-search gap shows up on DTC food brands running paid social at 20,000 dollars monthly with a broken blog and zero recipe schema.
We built the conversion-focused website with on-site and off-site SEO tuned to the travel-niche keyword clusters, competitor analysis against comparable boutique resorts, and mobile-first design prioritizing guest discovery. Every page carried the structured data qualifying it for Google’s rich results in the hospitality category. Every internal link pushed authority toward the direct-booking conversion path.
Three months later, Vejrø hit 10,000 plus organic visitors, ranked for 200 plus first-page keywords, and pulled a 2.2 percent booking conversion rate from organic traffic. The same pattern applies to content marketing for food brands: recipe schema, ingredient comparison guides, and sourcing story pages pull organic traffic at 20 to 40 percent conversion into hero SKU pages inside 6 months when the content quality matches search intent and every page carries the right structured data markup. Vejrø also proved out the reporting discipline: every monthly report named the exact page, the exact keyword cluster, and the exact search feature (rich result, sitelinks, image pack) driving the incremental organic revenue instead of hiding behind aggregate traffic charts.
Recipe cadence and content calendar for food brands
Recipe cadence on a working food brand content calendar ships 2 to 4 new recipes per week during the first 6 months and drops to 1 per week at maturity. Each recipe takes 4 to 6 hours to produce (write, test in the kitchen, photograph, schema author, publish). At 3 recipes per week, the brand hits 78 recipes inside 6 months plus a backlog of ingredient comparison and sourcing content queued behind the recipe production line.
| Content pillar | Target volume year 1 | Production cost per piece | Refresh cadence |
|---|---|---|---|
| Recipe hub | 40 to 100 recipes | $180 to $320 | Every 12 months |
| Ingredient comparison guides | 12 to 24 guides | $450 to $780 | Every 18 months |
| Sourcing story pages | 6 to 12 pages | $680 to $1,200 | Every 24 months |
| Buyer intent content | 8 to 16 pieces | $220 to $420 | Every 12 months |
Photography as a content calendar constraint
Photography is the actual constraint on recipe cadence, not writing. Every recipe needs 6 to 12 photos: hero shot, ingredient flat lay, prep in progress, plated result, storage, and step shots for the schema markup. A working food brand batches photography 8 recipes at a time to keep the cost per recipe under 200 dollars. Skip the batching and the per-recipe cost climbs to 400 to 600 dollars, which caps recipe cadence at 1 per week and slows organic ranking timeline by 6 months.
Seasonal content calendar planning
Seasonal content calendar planning maps recipes and comparison guides to the seasonal windows they need to rank in. A Christmas cookie recipe needs to publish in September to rank by early December. A Valentine’s chocolate guide needs to publish in November to rank by early February. A back-to-school lunchbox recipe needs to publish in June to rank by late August. The 60-to-90-day ranking curve dictates the calendar.
Creator syndication inside food brand content
Creator syndication on food brand content marketing amplifies the recipe hub through Instagram Reels, TikTok, and YouTube Shorts creators paid to post their own version of the brand’s hero recipes. The creator content pulls net-new audiences into the recipe hub through the creator’s Link in Bio or Amazon Storefront tag. The syndication calendar names 12 to 30 creators per quarter with specific recipes assigned to each.
One brand we picked up had a spreadsheet titled “creator outreach 2023” with 47 rows and 3 responses. All 3 responses were auto-replies. The spreadsheet named zero recipes and offered flat rates below 100 dollars per post. Nobody posts a 30-second video for 87 dollars flat. Nobody.
Creator content commercial terms that work
Working creator content commercial terms run 350 to 1,500 dollars flat per post plus a 12 to 25 percent commission on tagged sales across a 30-day window. The commission mechanic pulls creators into follow-up posts because the incremental revenue continues past the initial fee. Mid-tier creators (30k to 150k followers) hit the sweet spot for food brand content because their engagement rate typically runs 4 to 8 percent versus 0.8 to 1.6 percent on mega-creators.
Content brief structure for creator partnerships
The content brief structure for creator partnerships runs a single page: the SKU, the specific recipe or usage occasion, 3 required brand mentions, 3 restricted claims (no health claims on non-medical SKUs), the pricing angle, the affiliate link, and 3 example videos that hit the tone. The brief avoids over-scripting because over-scripted creator content underperforms native creator voice by 40 to 60 percent on engagement rate.
Buyer intent content for food brand blogs
Buyer intent content on food brand blogs covers 8 to 16 pieces targeting explicit purchase-decision queries: “where to buy [brand],” “[brand] subscription vs. one-time,” “best [category] for [use case],” and “[brand] gift bundle.” Every buyer intent piece runs 1,400 to 2,400 words with a comparison table, product cards, and a clear conversion path to the specific SKU that matches the query intent. Buyer intent content converts at 3 to 6 percent versus 1 to 2 percent on recipe content because the shopper landed already planning to buy, not exploring a usage occasion.
Where-to-buy content structure
Where-to-buy content structure covers online (DTC storefront, Amazon, Target.com, Whole Foods online), retail (specific chain locators with the store finder embedded), and international (customs limitations, retailer partners abroad). Every piece names specific retailers, links to the store locator, and includes an FAQ block covering shipping availability, subscription options, and gift card compatibility. Where-to-buy content ranks for branded discovery queries the DTC storefront otherwise loses to competitor affiliate reviews.
Subscription versus one-time comparison content
Subscription versus one-time comparison content converts subscription commitments at 3 to 6 percent because it addresses the price-sensitivity concern head-on with a specific math table. The piece covers the discount structure (15 percent lifetime), the skip-a-month mechanic, the pause-anytime rule, the cancellation policy, and the specific yearly savings for the brand’s average consumption cadence. Cross-reference the retention structure on our food and beverage marketing retainer page.
Content refresh cadence on food brand pillars
Content refresh cadence on food brand content pillars runs a rolling audit every 12 to 24 months by pillar. Recipes get refreshed every 12 months with new photography, updated schema, and any nutrition or ingredient adjustments. Ingredient comparison guides refresh every 18 months to update market data. Sourcing story pages refresh every 24 months to reflect farm partnership changes and new harvest angles. Buyer intent content refreshes every 12 months to update retailer availability and pricing.
Recipe refresh priority order
Recipe refresh priority runs by organic traffic rank. The top 20 recipes by monthly organic sessions get refreshed first (new photography, schema audit, related recipe internal links, updated nutrition). The next 40 get refreshed at 15 months. The remaining recipes get refreshed opportunistically when the ranking slips past position 15 in Google. Skipping the refresh cadence lets recipe rankings drift out of the top 3 inside 18 months as newer competitor recipes take the position.
Schema audit checklist per refresh
The schema audit checklist per refresh runs 8 items: Recipe schema completeness, aggregateRating count and accuracy, nutrition data accuracy, prepTime and cookTime match the recipe body, image URLs valid at CDN, related recipe internal links working, product card SKU URL live, and Google Search Console rich result eligibility validated. This checklist takes 20 minutes per recipe and prevents the schema drift that costs recipe rankings 20 to 40 positions quietly.
Reporting cadence for food brand content marketing
Reporting cadence on food brand content marketing runs a monthly executive report plus a quarterly business review. The monthly report ships in the first business week and covers organic sessions by pillar, top 10 ranking recipes with position trend, ingredient guide ranking movements, sourcing page performance, and organic-attributed DTC revenue. Every number carries a comparison to the prior month and a plain-language interpretation the founder reads in 7 minutes.
Metrics that matter for content marketing
Metrics that matter for food brand content marketing: organic sessions by pillar, recipe rich result impressions in Search Console, organic conversion rate to hero SKU pages, organic-attributed DTC revenue, and top 20 ranking positions by monthly organic sessions. Vanity metrics that do not matter: total pageviews without conversion context, average time on page without conversion attribution, and social share counts. The monthly report skips the vanity block entirely.
Quarterly business review structure
The quarterly business review runs 90 minutes with the founder, head of content, and SEO lead. Agenda: organic traffic trend by pillar, top 10 winning content pieces, top 10 losing content pieces (candidates for refresh or removal), competitive gap analysis against 5 named competitor brands, and next quarter’s content calendar with recipes and ingredient guides queued. According to Ahrefs content marketing research, brands running quarterly content audits outperform brands running annual audits by 40 to 70 percent on organic revenue over a 24-month window.
Internal linking discipline across food brand content
Internal linking discipline across food brand content moves authority from recipe pages toward hero SKU product pages and comparison guides. Every recipe links to the hero SKU it uses inline (once in the ingredient list, once in a bottom call-out card). Every ingredient comparison guide links to 3 to 6 recipes using the winning ingredient plus the hero SKU product page. Every sourcing story links to the 2 to 4 SKUs sourced from that specific farm or cooperative.
Anchor text strategy across recipe hubs
Anchor text on internal links varies across recipe hubs to avoid over-optimization patterns Google penalizes. Exact-match anchor (“single-origin Ethiopian coffee”) runs on 20 to 30 percent of internal links. Partial-match variations (“our Ethiopian roast”) run on 30 to 40 percent. Branded anchors (the SKU name) run on 20 to 30 percent. Generic anchors (“shop the coffee”) fill the remaining 10 to 20 percent. This ratio holds ranking without triggering the over-optimization penalty that shows up on brands that anchor-text-stuff every internal link with the same exact-match keyword. Cross-reference the linking layer on our food and beverage web design page.
Link equity from ingredient guides to SKU pages
Link equity from ingredient guides passes to SKU pages when the guide’s comparison table names the hero SKU in the winning column with a product card, and when the guide’s body links to 3 to 6 recipes that use the winning ingredient. This 3-hop path (guide to recipe to SKU) pushes authority from a high-traffic informational query down to a high-intent transactional page. According to Search Engine Land SEO coverage, informational content that internally links to transactional pages produces 2 to 4 times higher organic revenue than isolated content silos.
Wrapping up content marketing for food brands
Content marketing for food brands is the organic engine that turns a DTC snack, drink, or CPG storefront into a search-driven revenue channel. Recipe hub of 40 to 100 recipes. Ingredient comparison guides at 12 to 24 pieces. Sourcing story pages at 6 to 12 pieces. Buyer intent content at 8 to 16 pieces. Creator syndication calendar with 12 to 30 creators per quarter. Refresh cadence at 12 to 24 months by pillar. Reporting with organic sessions and organic revenue attribution.
If your DTC food brand is running paid social at 20,000 dollars monthly with a broken blog and zero recipe schema, professional content marketing for food brands pays for itself inside the first 90 days on organic traffic captured. Redefine Web ships content marketing inside our monthly retainer packages. Book a call and we will walk through the last three DTC food brands we built recipe hubs for, pillar by pillar.
Content marketing for food brands starts with a recipe hub because recipe queries account for 40 to 60 percent of high-intent search volume in the food category. Every hero SKU needs 4 to 12 recipes anchored to it, each targeting a specific occasion and audience.
Skip the recipe hub and the brand loses the search real estate that pulls DTC storefront traffic month over month at zero incremental paid cost. Recipe traffic converts at 2 to 4 percent because the shopper landed with usage intent, not passive discovery, which is why food brands win on recipes.
Recipe schema and Google rich result eligibility
Every recipe page ships schema.org Recipe markup including cookTime, prepTime, recipeIngredient, recipeInstructions, nutrition, and aggregateRating. Correctly marked-up recipes qualify for Google’s recipe rich result carousel that pulls 3 to 6 times higher click-through rate than a plain blue link. The schema layer takes 15 minutes per recipe to author and 30 minutes to validate in Google Search Console. Cross-reference the recipe search stack on our food and beverage SEO page.
Recipe hub structure that scales
The recipe hub structure runs 40 to 100 recipes at maturity, organized by hero SKU (4 to 12 recipes per SKU) plus occasion tags (breakfast, weeknight dinner, meal prep, brunch, holiday). Every recipe links back to the hero SKU product page with the SKU embedded in an inline card. The hub earns internal linking value from ingredient comparison guides and the sourcing story pages, which feeds recipe ranking on Google. According to Google Search Central recipe structured data guidance, complete Recipe schema markup is required for eligibility in the recipe carousel and the ingredient search filter.
Pillar structure for food brand content marketing
The pillar structure on content marketing for food brands runs 4 content pillars concurrently: recipe hub (40 to 100 recipes), ingredient comparison guides (12 to 24 guides), sourcing story pages (6 to 12 pages), and buyer intent content (where to buy, subscription vs. one-time, gift bundle guides). Every pillar covers a distinct search intent and every pillar links back to the hero SKU product pages.
Ingredient comparison guide format
Ingredient comparison guides run 1,800 to 3,200 words comparing 2 to 4 ingredient types on 6 to 10 attributes with a comparison table, real-world use case examples, and links to the hero SKU that uses the specific ingredient. Example: organic vs. conventional oats compares nutritional profile, sourcing chain, cost, environmental impact, and taste on a 6-column table. The brand’s SKU appears in the winning column with a product card. These guides rank 3 to 8 months after publication and pull steady-state organic traffic.
Sourcing story pages that build trust
Sourcing story pages name the specific farms, cooperatives, or suppliers the brand sources from, with photos of the farms, farmer quotes, and specific harvest windows. A coffee brand’s Ethiopian farm page ranks for “single-origin Ethiopian coffee” and “Yirgacheffe coffee origin” plus 40 long-tail variations. The sourcing page pulls trust-building traffic that converts at 4 to 6 percent because the shopper landed pattern-matching on transparency and named provenance. Every sourcing page includes farmer or cooperative quotes, harvest dates, and a link back to 3 to 5 hero SKU pages that source from the named supplier.
Vejrø hospitality content case study
Vejrø Resort, a Danish private-island destination with an on-site restaurant focused on organic, locally sourced cuisine, joined us with strong social engagement and no organic-search real estate. Guests found the resort on Instagram but never in Google search for terms like “private island resort Denmark,” “farm-to-table hospitality Denmark,” or “Vejrø restaurant.” The same organic-search gap shows up on DTC food brands running paid social at 20,000 dollars monthly with a broken blog and zero recipe schema.
We built the conversion-focused website with on-site and off-site SEO tuned to the travel-niche keyword clusters, competitor analysis against comparable boutique resorts, and mobile-first design prioritizing guest discovery. Every page carried the structured data qualifying it for Google’s rich results in the hospitality category. Every internal link pushed authority toward the direct-booking conversion path.
Three months later, Vejrø hit 10,000 plus organic visitors, ranked for 200 plus first-page keywords, and pulled a 2.2 percent booking conversion rate from organic traffic. The same pattern applies to content marketing for food brands: recipe schema, ingredient comparison guides, and sourcing story pages pull organic traffic at 20 to 40 percent conversion into hero SKU pages inside 6 months when the content quality matches search intent and every page carries the right structured data markup. Vejrø also proved out the reporting discipline: every monthly report named the exact page, the exact keyword cluster, and the exact search feature (rich result, sitelinks, image pack) driving the incremental organic revenue instead of hiding behind aggregate traffic charts.
Recipe cadence and content calendar for food brands
Recipe cadence on a working food brand content calendar ships 2 to 4 new recipes per week during the first 6 months and drops to 1 per week at maturity. Each recipe takes 4 to 6 hours to produce (write, test in the kitchen, photograph, schema author, publish). At 3 recipes per week, the brand hits 78 recipes inside 6 months plus a backlog of ingredient comparison and sourcing content queued behind the recipe production line.
| Content pillar | Target volume year 1 | Production cost per piece | Refresh cadence |
|---|---|---|---|
| Recipe hub | 40 to 100 recipes | $180 to $320 | Every 12 months |
| Ingredient comparison guides | 12 to 24 guides | $450 to $780 | Every 18 months |
| Sourcing story pages | 6 to 12 pages | $680 to $1,200 | Every 24 months |
| Buyer intent content | 8 to 16 pieces | $220 to $420 | Every 12 months |
Photography as a content calendar constraint
Photography is the actual constraint on recipe cadence, not writing. Every recipe needs 6 to 12 photos: hero shot, ingredient flat lay, prep in progress, plated result, storage, and step shots for the schema markup. A working food brand batches photography 8 recipes at a time to keep the cost per recipe under 200 dollars. Skip the batching and the per-recipe cost climbs to 400 to 600 dollars, which caps recipe cadence at 1 per week and slows organic ranking timeline by 6 months.
Seasonal content calendar planning
Seasonal content calendar planning maps recipes and comparison guides to the seasonal windows they need to rank in. A Christmas cookie recipe needs to publish in September to rank by early December. A Valentine’s chocolate guide needs to publish in November to rank by early February. A back-to-school lunchbox recipe needs to publish in June to rank by late August. The 60-to-90-day ranking curve dictates the calendar.
Creator syndication inside food brand content
Creator syndication on food brand content marketing amplifies the recipe hub through Instagram Reels, TikTok, and YouTube Shorts creators paid to post their own version of the brand’s hero recipes. The creator content pulls net-new audiences into the recipe hub through the creator’s Link in Bio or Amazon Storefront tag. The syndication calendar names 12 to 30 creators per quarter with specific recipes assigned to each.
One brand we picked up had a spreadsheet titled “creator outreach 2023” with 47 rows and 3 responses. All 3 responses were auto-replies. The spreadsheet named zero recipes and offered flat rates below 100 dollars per post. Nobody posts a 30-second video for 87 dollars flat. Nobody.
Creator content commercial terms that work
Working creator content commercial terms run 350 to 1,500 dollars flat per post plus a 12 to 25 percent commission on tagged sales across a 30-day window. The commission mechanic pulls creators into follow-up posts because the incremental revenue continues past the initial fee. Mid-tier creators (30k to 150k followers) hit the sweet spot for food brand content because their engagement rate typically runs 4 to 8 percent versus 0.8 to 1.6 percent on mega-creators.
Content brief structure for creator partnerships
The content brief structure for creator partnerships runs a single page: the SKU, the specific recipe or usage occasion, 3 required brand mentions, 3 restricted claims (no health claims on non-medical SKUs), the pricing angle, the affiliate link, and 3 example videos that hit the tone. The brief avoids over-scripting because over-scripted creator content underperforms native creator voice by 40 to 60 percent on engagement rate.
Buyer intent content for food brand blogs
Buyer intent content on food brand blogs covers 8 to 16 pieces targeting explicit purchase-decision queries: “where to buy [brand],” “[brand] subscription vs. one-time,” “best [category] for [use case],” and “[brand] gift bundle.” Every buyer intent piece runs 1,400 to 2,400 words with a comparison table, product cards, and a clear conversion path to the specific SKU that matches the query intent. Buyer intent content converts at 3 to 6 percent versus 1 to 2 percent on recipe content because the shopper landed already planning to buy, not exploring a usage occasion.
Where-to-buy content structure
Where-to-buy content structure covers online (DTC storefront, Amazon, Target.com, Whole Foods online), retail (specific chain locators with the store finder embedded), and international (customs limitations, retailer partners abroad). Every piece names specific retailers, links to the store locator, and includes an FAQ block covering shipping availability, subscription options, and gift card compatibility. Where-to-buy content ranks for branded discovery queries the DTC storefront otherwise loses to competitor affiliate reviews.
Subscription versus one-time comparison content
Subscription versus one-time comparison content converts subscription commitments at 3 to 6 percent because it addresses the price-sensitivity concern head-on with a specific math table. The piece covers the discount structure (15 percent lifetime), the skip-a-month mechanic, the pause-anytime rule, the cancellation policy, and the specific yearly savings for the brand’s average consumption cadence. Cross-reference the retention structure on our food and beverage marketing retainer page.
Content refresh cadence on food brand pillars
Content refresh cadence on food brand content pillars runs a rolling audit every 12 to 24 months by pillar. Recipes get refreshed every 12 months with new photography, updated schema, and any nutrition or ingredient adjustments. Ingredient comparison guides refresh every 18 months to update market data. Sourcing story pages refresh every 24 months to reflect farm partnership changes and new harvest angles. Buyer intent content refreshes every 12 months to update retailer availability and pricing.
Recipe refresh priority order
Recipe refresh priority runs by organic traffic rank. The top 20 recipes by monthly organic sessions get refreshed first (new photography, schema audit, related recipe internal links, updated nutrition). The next 40 get refreshed at 15 months. The remaining recipes get refreshed opportunistically when the ranking slips past position 15 in Google. Skipping the refresh cadence lets recipe rankings drift out of the top 3 inside 18 months as newer competitor recipes take the position.
Schema audit checklist per refresh
The schema audit checklist per refresh runs 8 items: Recipe schema completeness, aggregateRating count and accuracy, nutrition data accuracy, prepTime and cookTime match the recipe body, image URLs valid at CDN, related recipe internal links working, product card SKU URL live, and Google Search Console rich result eligibility validated. This checklist takes 20 minutes per recipe and prevents the schema drift that costs recipe rankings 20 to 40 positions quietly.
Reporting cadence for food brand content marketing
Reporting cadence on food brand content marketing runs a monthly executive report plus a quarterly business review. The monthly report ships in the first business week and covers organic sessions by pillar, top 10 ranking recipes with position trend, ingredient guide ranking movements, sourcing page performance, and organic-attributed DTC revenue. Every number carries a comparison to the prior month and a plain-language interpretation the founder reads in 7 minutes.
Metrics that matter for content marketing
Metrics that matter for food brand content marketing: organic sessions by pillar, recipe rich result impressions in Search Console, organic conversion rate to hero SKU pages, organic-attributed DTC revenue, and top 20 ranking positions by monthly organic sessions. Vanity metrics that do not matter: total pageviews without conversion context, average time on page without conversion attribution, and social share counts. The monthly report skips the vanity block entirely.
Quarterly business review structure
The quarterly business review runs 90 minutes with the founder, head of content, and SEO lead. Agenda: organic traffic trend by pillar, top 10 winning content pieces, top 10 losing content pieces (candidates for refresh or removal), competitive gap analysis against 5 named competitor brands, and next quarter’s content calendar with recipes and ingredient guides queued. According to Ahrefs content marketing research, brands running quarterly content audits outperform brands running annual audits by 40 to 70 percent on organic revenue over a 24-month window.
Internal linking discipline across food brand content
Internal linking discipline across food brand content moves authority from recipe pages toward hero SKU product pages and comparison guides. Every recipe links to the hero SKU it uses inline (once in the ingredient list, once in a bottom call-out card). Every ingredient comparison guide links to 3 to 6 recipes using the winning ingredient plus the hero SKU product page. Every sourcing story links to the 2 to 4 SKUs sourced from that specific farm or cooperative.
Anchor text strategy across recipe hubs
Anchor text on internal links varies across recipe hubs to avoid over-optimization patterns Google penalizes. Exact-match anchor (“single-origin Ethiopian coffee”) runs on 20 to 30 percent of internal links. Partial-match variations (“our Ethiopian roast”) run on 30 to 40 percent. Branded anchors (the SKU name) run on 20 to 30 percent. Generic anchors (“shop the coffee”) fill the remaining 10 to 20 percent. This ratio holds ranking without triggering the over-optimization penalty that shows up on brands that anchor-text-stuff every internal link with the same exact-match keyword. Cross-reference the linking layer on our food and beverage web design page.
Link equity from ingredient guides to SKU pages
Link equity from ingredient guides passes to SKU pages when the guide’s comparison table names the hero SKU in the winning column with a product card, and when the guide’s body links to 3 to 6 recipes that use the winning ingredient. This 3-hop path (guide to recipe to SKU) pushes authority from a high-traffic informational query down to a high-intent transactional page. According to Search Engine Land SEO coverage, informational content that internally links to transactional pages produces 2 to 4 times higher organic revenue than isolated content silos.
Wrapping up content marketing for food brands
Content marketing for food brands is the organic engine that turns a DTC snack, drink, or CPG storefront into a search-driven revenue channel. Recipe hub of 40 to 100 recipes. Ingredient comparison guides at 12 to 24 pieces. Sourcing story pages at 6 to 12 pieces. Buyer intent content at 8 to 16 pieces. Creator syndication calendar with 12 to 30 creators per quarter. Refresh cadence at 12 to 24 months by pillar. Reporting with organic sessions and organic revenue attribution.
If your DTC food brand is running paid social at 20,000 dollars monthly with a broken blog and zero recipe schema, professional content marketing for food brands pays for itself inside the first 90 days on organic traffic captured. Redefine Web ships content marketing inside our monthly retainer packages. Book a call and we will walk through the last three DTC food brands we built recipe hubs for, pillar by pillar.
Internal linking discipline across food brand content moves authority from recipe pages toward hero SKU product pages and comparison guides. Every recipe links to the hero SKU it uses inline (once in the ingredient list, once in a bottom call-out card). Every ingredient comparison guide links to 3 to 6 recipes using the winning ingredient plus the hero SKU product page. Every sourcing story links to the 2 to 4 SKUs sourced from that specific farm or cooperative.
Anchor text strategy across recipe hubs
Anchor text on internal links varies across recipe hubs to avoid over-optimization patterns Google penalizes. Exact-match anchor (“single-origin Ethiopian coffee”) runs on 20 to 30 percent of internal links. Partial-match variations (“our Ethiopian roast”) run on 30 to 40 percent. Branded anchors (the SKU name) run on 20 to 30 percent. Generic anchors (“shop the coffee”) fill the remaining 10 to 20 percent. This ratio holds ranking without triggering the over-optimization penalty that shows up on brands that anchor-text-stuff every internal link with the same exact-match keyword. Cross-reference the linking layer on our food and beverage web design page.
Link equity from ingredient guides to SKU pages
Link equity from ingredient guides passes to SKU pages when the guide’s comparison table names the hero SKU in the winning column with a product card, and when the guide’s body links to 3 to 6 recipes that use the winning ingredient. This 3-hop path (guide to recipe to SKU) pushes authority from a high-traffic informational query down to a high-intent transactional page. According to Search Engine Land SEO coverage, informational content that internally links to transactional pages produces 2 to 4 times higher organic revenue than isolated content silos.
Wrapping up content marketing for food brands
Content marketing for food brands is the organic engine that turns a DTC snack, drink, or CPG storefront into a search-driven revenue channel. Recipe hub of 40 to 100 recipes. Ingredient comparison guides at 12 to 24 pieces. Sourcing story pages at 6 to 12 pieces. Buyer intent content at 8 to 16 pieces. Creator syndication calendar with 12 to 30 creators per quarter. Refresh cadence at 12 to 24 months by pillar. Reporting with organic sessions and organic revenue attribution.
If your DTC food brand is running paid social at 20,000 dollars monthly with a broken blog and zero recipe schema, professional content marketing for food brands pays for itself inside the first 90 days on organic traffic captured. Redefine Web ships content marketing inside our monthly retainer packages. Book a call and we will walk through the last three DTC food brands we built recipe hubs for, pillar by pillar.
Content marketing for food brands starts with a recipe hub because recipe queries account for 40 to 60 percent of high-intent search volume in the food category. Every hero SKU needs 4 to 12 recipes anchored to it, each targeting a specific occasion and audience.
Skip the recipe hub and the brand loses the search real estate that pulls DTC storefront traffic month over month at zero incremental paid cost. Recipe traffic converts at 2 to 4 percent because the shopper landed with usage intent, not passive discovery, which is why food brands win on recipes.
Recipe schema and Google rich result eligibility
Every recipe page ships schema.org Recipe markup including cookTime, prepTime, recipeIngredient, recipeInstructions, nutrition, and aggregateRating. Correctly marked-up recipes qualify for Google’s recipe rich result carousel that pulls 3 to 6 times higher click-through rate than a plain blue link. The schema layer takes 15 minutes per recipe to author and 30 minutes to validate in Google Search Console. Cross-reference the recipe search stack on our food and beverage SEO page.
Recipe hub structure that scales
The recipe hub structure runs 40 to 100 recipes at maturity, organized by hero SKU (4 to 12 recipes per SKU) plus occasion tags (breakfast, weeknight dinner, meal prep, brunch, holiday). Every recipe links back to the hero SKU product page with the SKU embedded in an inline card. The hub earns internal linking value from ingredient comparison guides and the sourcing story pages, which feeds recipe ranking on Google. According to Google Search Central recipe structured data guidance, complete Recipe schema markup is required for eligibility in the recipe carousel and the ingredient search filter.
Pillar structure for food brand content marketing
The pillar structure on content marketing for food brands runs 4 content pillars concurrently: recipe hub (40 to 100 recipes), ingredient comparison guides (12 to 24 guides), sourcing story pages (6 to 12 pages), and buyer intent content (where to buy, subscription vs. one-time, gift bundle guides). Every pillar covers a distinct search intent and every pillar links back to the hero SKU product pages.
Ingredient comparison guide format
Ingredient comparison guides run 1,800 to 3,200 words comparing 2 to 4 ingredient types on 6 to 10 attributes with a comparison table, real-world use case examples, and links to the hero SKU that uses the specific ingredient. Example: organic vs. conventional oats compares nutritional profile, sourcing chain, cost, environmental impact, and taste on a 6-column table. The brand’s SKU appears in the winning column with a product card. These guides rank 3 to 8 months after publication and pull steady-state organic traffic.
Sourcing story pages that build trust
Sourcing story pages name the specific farms, cooperatives, or suppliers the brand sources from, with photos of the farms, farmer quotes, and specific harvest windows. A coffee brand’s Ethiopian farm page ranks for “single-origin Ethiopian coffee” and “Yirgacheffe coffee origin” plus 40 long-tail variations. The sourcing page pulls trust-building traffic that converts at 4 to 6 percent because the shopper landed pattern-matching on transparency and named provenance. Every sourcing page includes farmer or cooperative quotes, harvest dates, and a link back to 3 to 5 hero SKU pages that source from the named supplier.
Vejrø hospitality content case study
Vejrø Resort, a Danish private-island destination with an on-site restaurant focused on organic, locally sourced cuisine, joined us with strong social engagement and no organic-search real estate. Guests found the resort on Instagram but never in Google search for terms like “private island resort Denmark,” “farm-to-table hospitality Denmark,” or “Vejrø restaurant.” The same organic-search gap shows up on DTC food brands running paid social at 20,000 dollars monthly with a broken blog and zero recipe schema.
We built the conversion-focused website with on-site and off-site SEO tuned to the travel-niche keyword clusters, competitor analysis against comparable boutique resorts, and mobile-first design prioritizing guest discovery. Every page carried the structured data qualifying it for Google’s rich results in the hospitality category. Every internal link pushed authority toward the direct-booking conversion path.
Three months later, Vejrø hit 10,000 plus organic visitors, ranked for 200 plus first-page keywords, and pulled a 2.2 percent booking conversion rate from organic traffic. The same pattern applies to content marketing for food brands: recipe schema, ingredient comparison guides, and sourcing story pages pull organic traffic at 20 to 40 percent conversion into hero SKU pages inside 6 months when the content quality matches search intent and every page carries the right structured data markup. Vejrø also proved out the reporting discipline: every monthly report named the exact page, the exact keyword cluster, and the exact search feature (rich result, sitelinks, image pack) driving the incremental organic revenue instead of hiding behind aggregate traffic charts.
Recipe cadence and content calendar for food brands
Recipe cadence on a working food brand content calendar ships 2 to 4 new recipes per week during the first 6 months and drops to 1 per week at maturity. Each recipe takes 4 to 6 hours to produce (write, test in the kitchen, photograph, schema author, publish). At 3 recipes per week, the brand hits 78 recipes inside 6 months plus a backlog of ingredient comparison and sourcing content queued behind the recipe production line.
| Content pillar | Target volume year 1 | Production cost per piece | Refresh cadence |
|---|---|---|---|
| Recipe hub | 40 to 100 recipes | $180 to $320 | Every 12 months |
| Ingredient comparison guides | 12 to 24 guides | $450 to $780 | Every 18 months |
| Sourcing story pages | 6 to 12 pages | $680 to $1,200 | Every 24 months |
| Buyer intent content | 8 to 16 pieces | $220 to $420 | Every 12 months |
Photography as a content calendar constraint
Photography is the actual constraint on recipe cadence, not writing. Every recipe needs 6 to 12 photos: hero shot, ingredient flat lay, prep in progress, plated result, storage, and step shots for the schema markup. A working food brand batches photography 8 recipes at a time to keep the cost per recipe under 200 dollars. Skip the batching and the per-recipe cost climbs to 400 to 600 dollars, which caps recipe cadence at 1 per week and slows organic ranking timeline by 6 months.
Seasonal content calendar planning
Seasonal content calendar planning maps recipes and comparison guides to the seasonal windows they need to rank in. A Christmas cookie recipe needs to publish in September to rank by early December. A Valentine’s chocolate guide needs to publish in November to rank by early February. A back-to-school lunchbox recipe needs to publish in June to rank by late August. The 60-to-90-day ranking curve dictates the calendar.
Creator syndication inside food brand content
Creator syndication on food brand content marketing amplifies the recipe hub through Instagram Reels, TikTok, and YouTube Shorts creators paid to post their own version of the brand’s hero recipes. The creator content pulls net-new audiences into the recipe hub through the creator’s Link in Bio or Amazon Storefront tag. The syndication calendar names 12 to 30 creators per quarter with specific recipes assigned to each.
One brand we picked up had a spreadsheet titled “creator outreach 2023” with 47 rows and 3 responses. All 3 responses were auto-replies. The spreadsheet named zero recipes and offered flat rates below 100 dollars per post. Nobody posts a 30-second video for 87 dollars flat. Nobody.
Creator content commercial terms that work
Working creator content commercial terms run 350 to 1,500 dollars flat per post plus a 12 to 25 percent commission on tagged sales across a 30-day window. The commission mechanic pulls creators into follow-up posts because the incremental revenue continues past the initial fee. Mid-tier creators (30k to 150k followers) hit the sweet spot for food brand content because their engagement rate typically runs 4 to 8 percent versus 0.8 to 1.6 percent on mega-creators.
Content brief structure for creator partnerships
The content brief structure for creator partnerships runs a single page: the SKU, the specific recipe or usage occasion, 3 required brand mentions, 3 restricted claims (no health claims on non-medical SKUs), the pricing angle, the affiliate link, and 3 example videos that hit the tone. The brief avoids over-scripting because over-scripted creator content underperforms native creator voice by 40 to 60 percent on engagement rate.
Buyer intent content for food brand blogs
Buyer intent content on food brand blogs covers 8 to 16 pieces targeting explicit purchase-decision queries: “where to buy [brand],” “[brand] subscription vs. one-time,” “best [category] for [use case],” and “[brand] gift bundle.” Every buyer intent piece runs 1,400 to 2,400 words with a comparison table, product cards, and a clear conversion path to the specific SKU that matches the query intent. Buyer intent content converts at 3 to 6 percent versus 1 to 2 percent on recipe content because the shopper landed already planning to buy, not exploring a usage occasion.
Where-to-buy content structure
Where-to-buy content structure covers online (DTC storefront, Amazon, Target.com, Whole Foods online), retail (specific chain locators with the store finder embedded), and international (customs limitations, retailer partners abroad). Every piece names specific retailers, links to the store locator, and includes an FAQ block covering shipping availability, subscription options, and gift card compatibility. Where-to-buy content ranks for branded discovery queries the DTC storefront otherwise loses to competitor affiliate reviews.
Subscription versus one-time comparison content
Subscription versus one-time comparison content converts subscription commitments at 3 to 6 percent because it addresses the price-sensitivity concern head-on with a specific math table. The piece covers the discount structure (15 percent lifetime), the skip-a-month mechanic, the pause-anytime rule, the cancellation policy, and the specific yearly savings for the brand’s average consumption cadence. Cross-reference the retention structure on our food and beverage marketing retainer page.
Content refresh cadence on food brand pillars
Content refresh cadence on food brand content pillars runs a rolling audit every 12 to 24 months by pillar. Recipes get refreshed every 12 months with new photography, updated schema, and any nutrition or ingredient adjustments. Ingredient comparison guides refresh every 18 months to update market data. Sourcing story pages refresh every 24 months to reflect farm partnership changes and new harvest angles. Buyer intent content refreshes every 12 months to update retailer availability and pricing.
Recipe refresh priority order
Recipe refresh priority runs by organic traffic rank. The top 20 recipes by monthly organic sessions get refreshed first (new photography, schema audit, related recipe internal links, updated nutrition). The next 40 get refreshed at 15 months. The remaining recipes get refreshed opportunistically when the ranking slips past position 15 in Google. Skipping the refresh cadence lets recipe rankings drift out of the top 3 inside 18 months as newer competitor recipes take the position.
Schema audit checklist per refresh
The schema audit checklist per refresh runs 8 items: Recipe schema completeness, aggregateRating count and accuracy, nutrition data accuracy, prepTime and cookTime match the recipe body, image URLs valid at CDN, related recipe internal links working, product card SKU URL live, and Google Search Console rich result eligibility validated. This checklist takes 20 minutes per recipe and prevents the schema drift that costs recipe rankings 20 to 40 positions quietly.
Reporting cadence for food brand content marketing
Reporting cadence on food brand content marketing runs a monthly executive report plus a quarterly business review. The monthly report ships in the first business week and covers organic sessions by pillar, top 10 ranking recipes with position trend, ingredient guide ranking movements, sourcing page performance, and organic-attributed DTC revenue. Every number carries a comparison to the prior month and a plain-language interpretation the founder reads in 7 minutes.
Metrics that matter for content marketing
Metrics that matter for food brand content marketing: organic sessions by pillar, recipe rich result impressions in Search Console, organic conversion rate to hero SKU pages, organic-attributed DTC revenue, and top 20 ranking positions by monthly organic sessions. Vanity metrics that do not matter: total pageviews without conversion context, average time on page without conversion attribution, and social share counts. The monthly report skips the vanity block entirely.
Quarterly business review structure
The quarterly business review runs 90 minutes with the founder, head of content, and SEO lead. Agenda: organic traffic trend by pillar, top 10 winning content pieces, top 10 losing content pieces (candidates for refresh or removal), competitive gap analysis against 5 named competitor brands, and next quarter’s content calendar with recipes and ingredient guides queued. According to Ahrefs content marketing research, brands running quarterly content audits outperform brands running annual audits by 40 to 70 percent on organic revenue over a 24-month window.
Internal linking discipline across food brand content
Internal linking discipline across food brand content moves authority from recipe pages toward hero SKU product pages and comparison guides. Every recipe links to the hero SKU it uses inline (once in the ingredient list, once in a bottom call-out card). Every ingredient comparison guide links to 3 to 6 recipes using the winning ingredient plus the hero SKU product page. Every sourcing story links to the 2 to 4 SKUs sourced from that specific farm or cooperative.
Anchor text strategy across recipe hubs
Anchor text on internal links varies across recipe hubs to avoid over-optimization patterns Google penalizes. Exact-match anchor (“single-origin Ethiopian coffee”) runs on 20 to 30 percent of internal links. Partial-match variations (“our Ethiopian roast”) run on 30 to 40 percent. Branded anchors (the SKU name) run on 20 to 30 percent. Generic anchors (“shop the coffee”) fill the remaining 10 to 20 percent. This ratio holds ranking without triggering the over-optimization penalty that shows up on brands that anchor-text-stuff every internal link with the same exact-match keyword. Cross-reference the linking layer on our food and beverage web design page.
Link equity from ingredient guides to SKU pages
Link equity from ingredient guides passes to SKU pages when the guide’s comparison table names the hero SKU in the winning column with a product card, and when the guide’s body links to 3 to 6 recipes that use the winning ingredient. This 3-hop path (guide to recipe to SKU) pushes authority from a high-traffic informational query down to a high-intent transactional page. According to Search Engine Land SEO coverage, informational content that internally links to transactional pages produces 2 to 4 times higher organic revenue than isolated content silos.
Wrapping up content marketing for food brands
Content marketing for food brands is the organic engine that turns a DTC snack, drink, or CPG storefront into a search-driven revenue channel. Recipe hub of 40 to 100 recipes. Ingredient comparison guides at 12 to 24 pieces. Sourcing story pages at 6 to 12 pieces. Buyer intent content at 8 to 16 pieces. Creator syndication calendar with 12 to 30 creators per quarter. Refresh cadence at 12 to 24 months by pillar. Reporting with organic sessions and organic revenue attribution.
If your DTC food brand is running paid social at 20,000 dollars monthly with a broken blog and zero recipe schema, professional content marketing for food brands pays for itself inside the first 90 days on organic traffic captured. Redefine Web ships content marketing inside our monthly retainer packages. Book a call and we will walk through the last three DTC food brands we built recipe hubs for, pillar by pillar.
Content marketing for food brands starts with a recipe hub because recipe queries account for 40 to 60 percent of high-intent search volume in the food category. Every hero SKU needs 4 to 12 recipes anchored to it, each targeting a specific occasion and audience.
Skip the recipe hub and the brand loses the search real estate that pulls DTC storefront traffic month over month at zero incremental paid cost. Recipe traffic converts at 2 to 4 percent because the shopper landed with usage intent, not passive discovery, which is why food brands win on recipes.
Recipe schema and Google rich result eligibility
Every recipe page ships schema.org Recipe markup including cookTime, prepTime, recipeIngredient, recipeInstructions, nutrition, and aggregateRating. Correctly marked-up recipes qualify for Google’s recipe rich result carousel that pulls 3 to 6 times higher click-through rate than a plain blue link. The schema layer takes 15 minutes per recipe to author and 30 minutes to validate in Google Search Console. Cross-reference the recipe search stack on our food and beverage SEO page.
Recipe hub structure that scales
The recipe hub structure runs 40 to 100 recipes at maturity, organized by hero SKU (4 to 12 recipes per SKU) plus occasion tags (breakfast, weeknight dinner, meal prep, brunch, holiday). Every recipe links back to the hero SKU product page with the SKU embedded in an inline card. The hub earns internal linking value from ingredient comparison guides and the sourcing story pages, which feeds recipe ranking on Google. According to Google Search Central recipe structured data guidance, complete Recipe schema markup is required for eligibility in the recipe carousel and the ingredient search filter.
Pillar structure for food brand content marketing
The pillar structure on content marketing for food brands runs 4 content pillars concurrently: recipe hub (40 to 100 recipes), ingredient comparison guides (12 to 24 guides), sourcing story pages (6 to 12 pages), and buyer intent content (where to buy, subscription vs. one-time, gift bundle guides). Every pillar covers a distinct search intent and every pillar links back to the hero SKU product pages.
Ingredient comparison guide format
Ingredient comparison guides run 1,800 to 3,200 words comparing 2 to 4 ingredient types on 6 to 10 attributes with a comparison table, real-world use case examples, and links to the hero SKU that uses the specific ingredient. Example: organic vs. conventional oats compares nutritional profile, sourcing chain, cost, environmental impact, and taste on a 6-column table. The brand’s SKU appears in the winning column with a product card. These guides rank 3 to 8 months after publication and pull steady-state organic traffic.
Sourcing story pages that build trust
Sourcing story pages name the specific farms, cooperatives, or suppliers the brand sources from, with photos of the farms, farmer quotes, and specific harvest windows. A coffee brand’s Ethiopian farm page ranks for “single-origin Ethiopian coffee” and “Yirgacheffe coffee origin” plus 40 long-tail variations. The sourcing page pulls trust-building traffic that converts at 4 to 6 percent because the shopper landed pattern-matching on transparency and named provenance. Every sourcing page includes farmer or cooperative quotes, harvest dates, and a link back to 3 to 5 hero SKU pages that source from the named supplier.
Vejrø hospitality content case study
Vejrø Resort, a Danish private-island destination with an on-site restaurant focused on organic, locally sourced cuisine, joined us with strong social engagement and no organic-search real estate. Guests found the resort on Instagram but never in Google search for terms like “private island resort Denmark,” “farm-to-table hospitality Denmark,” or “Vejrø restaurant.” The same organic-search gap shows up on DTC food brands running paid social at 20,000 dollars monthly with a broken blog and zero recipe schema.
We built the conversion-focused website with on-site and off-site SEO tuned to the travel-niche keyword clusters, competitor analysis against comparable boutique resorts, and mobile-first design prioritizing guest discovery. Every page carried the structured data qualifying it for Google’s rich results in the hospitality category. Every internal link pushed authority toward the direct-booking conversion path.
Three months later, Vejrø hit 10,000 plus organic visitors, ranked for 200 plus first-page keywords, and pulled a 2.2 percent booking conversion rate from organic traffic. The same pattern applies to content marketing for food brands: recipe schema, ingredient comparison guides, and sourcing story pages pull organic traffic at 20 to 40 percent conversion into hero SKU pages inside 6 months when the content quality matches search intent and every page carries the right structured data markup. Vejrø also proved out the reporting discipline: every monthly report named the exact page, the exact keyword cluster, and the exact search feature (rich result, sitelinks, image pack) driving the incremental organic revenue instead of hiding behind aggregate traffic charts.
Recipe cadence and content calendar for food brands
Recipe cadence on a working food brand content calendar ships 2 to 4 new recipes per week during the first 6 months and drops to 1 per week at maturity. Each recipe takes 4 to 6 hours to produce (write, test in the kitchen, photograph, schema author, publish). At 3 recipes per week, the brand hits 78 recipes inside 6 months plus a backlog of ingredient comparison and sourcing content queued behind the recipe production line.
| Content pillar | Target volume year 1 | Production cost per piece | Refresh cadence |
|---|---|---|---|
| Recipe hub | 40 to 100 recipes | $180 to $320 | Every 12 months |
| Ingredient comparison guides | 12 to 24 guides | $450 to $780 | Every 18 months |
| Sourcing story pages | 6 to 12 pages | $680 to $1,200 | Every 24 months |
| Buyer intent content | 8 to 16 pieces | $220 to $420 | Every 12 months |
Photography as a content calendar constraint
Photography is the actual constraint on recipe cadence, not writing. Every recipe needs 6 to 12 photos: hero shot, ingredient flat lay, prep in progress, plated result, storage, and step shots for the schema markup. A working food brand batches photography 8 recipes at a time to keep the cost per recipe under 200 dollars. Skip the batching and the per-recipe cost climbs to 400 to 600 dollars, which caps recipe cadence at 1 per week and slows organic ranking timeline by 6 months.
Seasonal content calendar planning
Seasonal content calendar planning maps recipes and comparison guides to the seasonal windows they need to rank in. A Christmas cookie recipe needs to publish in September to rank by early December. A Valentine’s chocolate guide needs to publish in November to rank by early February. A back-to-school lunchbox recipe needs to publish in June to rank by late August. The 60-to-90-day ranking curve dictates the calendar.
Creator syndication inside food brand content
Creator syndication on food brand content marketing amplifies the recipe hub through Instagram Reels, TikTok, and YouTube Shorts creators paid to post their own version of the brand’s hero recipes. The creator content pulls net-new audiences into the recipe hub through the creator’s Link in Bio or Amazon Storefront tag. The syndication calendar names 12 to 30 creators per quarter with specific recipes assigned to each.
One brand we picked up had a spreadsheet titled “creator outreach 2023” with 47 rows and 3 responses. All 3 responses were auto-replies. The spreadsheet named zero recipes and offered flat rates below 100 dollars per post. Nobody posts a 30-second video for 87 dollars flat. Nobody.
Creator content commercial terms that work
Working creator content commercial terms run 350 to 1,500 dollars flat per post plus a 12 to 25 percent commission on tagged sales across a 30-day window. The commission mechanic pulls creators into follow-up posts because the incremental revenue continues past the initial fee. Mid-tier creators (30k to 150k followers) hit the sweet spot for food brand content because their engagement rate typically runs 4 to 8 percent versus 0.8 to 1.6 percent on mega-creators.
Content brief structure for creator partnerships
The content brief structure for creator partnerships runs a single page: the SKU, the specific recipe or usage occasion, 3 required brand mentions, 3 restricted claims (no health claims on non-medical SKUs), the pricing angle, the affiliate link, and 3 example videos that hit the tone. The brief avoids over-scripting because over-scripted creator content underperforms native creator voice by 40 to 60 percent on engagement rate.
Buyer intent content for food brand blogs
Buyer intent content on food brand blogs covers 8 to 16 pieces targeting explicit purchase-decision queries: “where to buy [brand],” “[brand] subscription vs. one-time,” “best [category] for [use case],” and “[brand] gift bundle.” Every buyer intent piece runs 1,400 to 2,400 words with a comparison table, product cards, and a clear conversion path to the specific SKU that matches the query intent. Buyer intent content converts at 3 to 6 percent versus 1 to 2 percent on recipe content because the shopper landed already planning to buy, not exploring a usage occasion.
Where-to-buy content structure
Where-to-buy content structure covers online (DTC storefront, Amazon, Target.com, Whole Foods online), retail (specific chain locators with the store finder embedded), and international (customs limitations, retailer partners abroad). Every piece names specific retailers, links to the store locator, and includes an FAQ block covering shipping availability, subscription options, and gift card compatibility. Where-to-buy content ranks for branded discovery queries the DTC storefront otherwise loses to competitor affiliate reviews.
Subscription versus one-time comparison content
Subscription versus one-time comparison content converts subscription commitments at 3 to 6 percent because it addresses the price-sensitivity concern head-on with a specific math table. The piece covers the discount structure (15 percent lifetime), the skip-a-month mechanic, the pause-anytime rule, the cancellation policy, and the specific yearly savings for the brand’s average consumption cadence. Cross-reference the retention structure on our food and beverage marketing retainer page.
Content refresh cadence on food brand pillars
Content refresh cadence on food brand content pillars runs a rolling audit every 12 to 24 months by pillar. Recipes get refreshed every 12 months with new photography, updated schema, and any nutrition or ingredient adjustments. Ingredient comparison guides refresh every 18 months to update market data. Sourcing story pages refresh every 24 months to reflect farm partnership changes and new harvest angles. Buyer intent content refreshes every 12 months to update retailer availability and pricing.
Recipe refresh priority order
Recipe refresh priority runs by organic traffic rank. The top 20 recipes by monthly organic sessions get refreshed first (new photography, schema audit, related recipe internal links, updated nutrition). The next 40 get refreshed at 15 months. The remaining recipes get refreshed opportunistically when the ranking slips past position 15 in Google. Skipping the refresh cadence lets recipe rankings drift out of the top 3 inside 18 months as newer competitor recipes take the position.
Schema audit checklist per refresh
The schema audit checklist per refresh runs 8 items: Recipe schema completeness, aggregateRating count and accuracy, nutrition data accuracy, prepTime and cookTime match the recipe body, image URLs valid at CDN, related recipe internal links working, product card SKU URL live, and Google Search Console rich result eligibility validated. This checklist takes 20 minutes per recipe and prevents the schema drift that costs recipe rankings 20 to 40 positions quietly.
Reporting cadence for food brand content marketing
Reporting cadence on food brand content marketing runs a monthly executive report plus a quarterly business review. The monthly report ships in the first business week and covers organic sessions by pillar, top 10 ranking recipes with position trend, ingredient guide ranking movements, sourcing page performance, and organic-attributed DTC revenue. Every number carries a comparison to the prior month and a plain-language interpretation the founder reads in 7 minutes.
Metrics that matter for content marketing
Metrics that matter for food brand content marketing: organic sessions by pillar, recipe rich result impressions in Search Console, organic conversion rate to hero SKU pages, organic-attributed DTC revenue, and top 20 ranking positions by monthly organic sessions. Vanity metrics that do not matter: total pageviews without conversion context, average time on page without conversion attribution, and social share counts. The monthly report skips the vanity block entirely.
Quarterly business review structure
The quarterly business review runs 90 minutes with the founder, head of content, and SEO lead. Agenda: organic traffic trend by pillar, top 10 winning content pieces, top 10 losing content pieces (candidates for refresh or removal), competitive gap analysis against 5 named competitor brands, and next quarter’s content calendar with recipes and ingredient guides queued. According to Ahrefs content marketing research, brands running quarterly content audits outperform brands running annual audits by 40 to 70 percent on organic revenue over a 24-month window.
Internal linking discipline across food brand content
Internal linking discipline across food brand content moves authority from recipe pages toward hero SKU product pages and comparison guides. Every recipe links to the hero SKU it uses inline (once in the ingredient list, once in a bottom call-out card). Every ingredient comparison guide links to 3 to 6 recipes using the winning ingredient plus the hero SKU product page. Every sourcing story links to the 2 to 4 SKUs sourced from that specific farm or cooperative.
Anchor text strategy across recipe hubs
Anchor text on internal links varies across recipe hubs to avoid over-optimization patterns Google penalizes. Exact-match anchor (“single-origin Ethiopian coffee”) runs on 20 to 30 percent of internal links. Partial-match variations (“our Ethiopian roast”) run on 30 to 40 percent. Branded anchors (the SKU name) run on 20 to 30 percent. Generic anchors (“shop the coffee”) fill the remaining 10 to 20 percent. This ratio holds ranking without triggering the over-optimization penalty that shows up on brands that anchor-text-stuff every internal link with the same exact-match keyword. Cross-reference the linking layer on our food and beverage web design page.
Link equity from ingredient guides to SKU pages
Link equity from ingredient guides passes to SKU pages when the guide’s comparison table names the hero SKU in the winning column with a product card, and when the guide’s body links to 3 to 6 recipes that use the winning ingredient. This 3-hop path (guide to recipe to SKU) pushes authority from a high-traffic informational query down to a high-intent transactional page. According to Search Engine Land SEO coverage, informational content that internally links to transactional pages produces 2 to 4 times higher organic revenue than isolated content silos.
Wrapping up content marketing for food brands
Content marketing for food brands is the organic engine that turns a DTC snack, drink, or CPG storefront into a search-driven revenue channel. Recipe hub of 40 to 100 recipes. Ingredient comparison guides at 12 to 24 pieces. Sourcing story pages at 6 to 12 pieces. Buyer intent content at 8 to 16 pieces. Creator syndication calendar with 12 to 30 creators per quarter. Refresh cadence at 12 to 24 months by pillar. Reporting with organic sessions and organic revenue attribution.
If your DTC food brand is running paid social at 20,000 dollars monthly with a broken blog and zero recipe schema, professional content marketing for food brands pays for itself inside the first 90 days on organic traffic captured. Redefine Web ships content marketing inside our monthly retainer packages. Book a call and we will walk through the last three DTC food brands we built recipe hubs for, pillar by pillar.
Anchor text on internal links varies across recipe hubs to avoid over-optimization patterns Google penalizes. Exact-match anchor (“single-origin Ethiopian coffee”) runs on 20 to 30 percent of internal links. Partial-match variations (“our Ethiopian roast”) run on 30 to 40 percent. Branded anchors (the SKU name) run on 20 to 30 percent. Generic anchors (“shop the coffee”) fill the remaining 10 to 20 percent. This ratio holds ranking without triggering the over-optimization penalty that shows up on brands that anchor-text-stuff every internal link with the same exact-match keyword. Cross-reference the linking layer on our food and beverage web design page.
Link equity from ingredient guides to SKU pages
Link equity from ingredient guides passes to SKU pages when the guide’s comparison table names the hero SKU in the winning column with a product card, and when the guide’s body links to 3 to 6 recipes that use the winning ingredient. This 3-hop path (guide to recipe to SKU) pushes authority from a high-traffic informational query down to a high-intent transactional page. According to Search Engine Land SEO coverage, informational content that internally links to transactional pages produces 2 to 4 times higher organic revenue than isolated content silos.
Wrapping up content marketing for food brands
Content marketing for food brands is the organic engine that turns a DTC snack, drink, or CPG storefront into a search-driven revenue channel. Recipe hub of 40 to 100 recipes. Ingredient comparison guides at 12 to 24 pieces. Sourcing story pages at 6 to 12 pieces. Buyer intent content at 8 to 16 pieces. Creator syndication calendar with 12 to 30 creators per quarter. Refresh cadence at 12 to 24 months by pillar. Reporting with organic sessions and organic revenue attribution.
If your DTC food brand is running paid social at 20,000 dollars monthly with a broken blog and zero recipe schema, professional content marketing for food brands pays for itself inside the first 90 days on organic traffic captured. Redefine Web ships content marketing inside our monthly retainer packages. Book a call and we will walk through the last three DTC food brands we built recipe hubs for, pillar by pillar.
Internal linking discipline across food brand content moves authority from recipe pages toward hero SKU product pages and comparison guides. Every recipe links to the hero SKU it uses inline (once in the ingredient list, once in a bottom call-out card). Every ingredient comparison guide links to 3 to 6 recipes using the winning ingredient plus the hero SKU product page. Every sourcing story links to the 2 to 4 SKUs sourced from that specific farm or cooperative.
Anchor text strategy across recipe hubs
Anchor text on internal links varies across recipe hubs to avoid over-optimization patterns Google penalizes. Exact-match anchor (“single-origin Ethiopian coffee”) runs on 20 to 30 percent of internal links. Partial-match variations (“our Ethiopian roast”) run on 30 to 40 percent. Branded anchors (the SKU name) run on 20 to 30 percent. Generic anchors (“shop the coffee”) fill the remaining 10 to 20 percent. This ratio holds ranking without triggering the over-optimization penalty that shows up on brands that anchor-text-stuff every internal link with the same exact-match keyword. Cross-reference the linking layer on our food and beverage web design page.
Link equity from ingredient guides to SKU pages
Link equity from ingredient guides passes to SKU pages when the guide’s comparison table names the hero SKU in the winning column with a product card, and when the guide’s body links to 3 to 6 recipes that use the winning ingredient. This 3-hop path (guide to recipe to SKU) pushes authority from a high-traffic informational query down to a high-intent transactional page. According to Search Engine Land SEO coverage, informational content that internally links to transactional pages produces 2 to 4 times higher organic revenue than isolated content silos.
Wrapping up content marketing for food brands
Content marketing for food brands is the organic engine that turns a DTC snack, drink, or CPG storefront into a search-driven revenue channel. Recipe hub of 40 to 100 recipes. Ingredient comparison guides at 12 to 24 pieces. Sourcing story pages at 6 to 12 pieces. Buyer intent content at 8 to 16 pieces. Creator syndication calendar with 12 to 30 creators per quarter. Refresh cadence at 12 to 24 months by pillar. Reporting with organic sessions and organic revenue attribution.
If your DTC food brand is running paid social at 20,000 dollars monthly with a broken blog and zero recipe schema, professional content marketing for food brands pays for itself inside the first 90 days on organic traffic captured. Redefine Web ships content marketing inside our monthly retainer packages. Book a call and we will walk through the last three DTC food brands we built recipe hubs for, pillar by pillar.
Content marketing for food brands starts with a recipe hub because recipe queries account for 40 to 60 percent of high-intent search volume in the food category. Every hero SKU needs 4 to 12 recipes anchored to it, each targeting a specific occasion and audience.
Skip the recipe hub and the brand loses the search real estate that pulls DTC storefront traffic month over month at zero incremental paid cost. Recipe traffic converts at 2 to 4 percent because the shopper landed with usage intent, not passive discovery, which is why food brands win on recipes.
Recipe schema and Google rich result eligibility
Every recipe page ships schema.org Recipe markup including cookTime, prepTime, recipeIngredient, recipeInstructions, nutrition, and aggregateRating. Correctly marked-up recipes qualify for Google’s recipe rich result carousel that pulls 3 to 6 times higher click-through rate than a plain blue link. The schema layer takes 15 minutes per recipe to author and 30 minutes to validate in Google Search Console. Cross-reference the recipe search stack on our food and beverage SEO page.
Recipe hub structure that scales
The recipe hub structure runs 40 to 100 recipes at maturity, organized by hero SKU (4 to 12 recipes per SKU) plus occasion tags (breakfast, weeknight dinner, meal prep, brunch, holiday). Every recipe links back to the hero SKU product page with the SKU embedded in an inline card. The hub earns internal linking value from ingredient comparison guides and the sourcing story pages, which feeds recipe ranking on Google. According to Google Search Central recipe structured data guidance, complete Recipe schema markup is required for eligibility in the recipe carousel and the ingredient search filter.
Pillar structure for food brand content marketing
The pillar structure on content marketing for food brands runs 4 content pillars concurrently: recipe hub (40 to 100 recipes), ingredient comparison guides (12 to 24 guides), sourcing story pages (6 to 12 pages), and buyer intent content (where to buy, subscription vs. one-time, gift bundle guides). Every pillar covers a distinct search intent and every pillar links back to the hero SKU product pages.
Ingredient comparison guide format
Ingredient comparison guides run 1,800 to 3,200 words comparing 2 to 4 ingredient types on 6 to 10 attributes with a comparison table, real-world use case examples, and links to the hero SKU that uses the specific ingredient. Example: organic vs. conventional oats compares nutritional profile, sourcing chain, cost, environmental impact, and taste on a 6-column table. The brand’s SKU appears in the winning column with a product card. These guides rank 3 to 8 months after publication and pull steady-state organic traffic.
Sourcing story pages that build trust
Sourcing story pages name the specific farms, cooperatives, or suppliers the brand sources from, with photos of the farms, farmer quotes, and specific harvest windows. A coffee brand’s Ethiopian farm page ranks for “single-origin Ethiopian coffee” and “Yirgacheffe coffee origin” plus 40 long-tail variations. The sourcing page pulls trust-building traffic that converts at 4 to 6 percent because the shopper landed pattern-matching on transparency and named provenance. Every sourcing page includes farmer or cooperative quotes, harvest dates, and a link back to 3 to 5 hero SKU pages that source from the named supplier.
Vejrø hospitality content case study
Vejrø Resort, a Danish private-island destination with an on-site restaurant focused on organic, locally sourced cuisine, joined us with strong social engagement and no organic-search real estate. Guests found the resort on Instagram but never in Google search for terms like “private island resort Denmark,” “farm-to-table hospitality Denmark,” or “Vejrø restaurant.” The same organic-search gap shows up on DTC food brands running paid social at 20,000 dollars monthly with a broken blog and zero recipe schema.
We built the conversion-focused website with on-site and off-site SEO tuned to the travel-niche keyword clusters, competitor analysis against comparable boutique resorts, and mobile-first design prioritizing guest discovery. Every page carried the structured data qualifying it for Google’s rich results in the hospitality category. Every internal link pushed authority toward the direct-booking conversion path.
Three months later, Vejrø hit 10,000 plus organic visitors, ranked for 200 plus first-page keywords, and pulled a 2.2 percent booking conversion rate from organic traffic. The same pattern applies to content marketing for food brands: recipe schema, ingredient comparison guides, and sourcing story pages pull organic traffic at 20 to 40 percent conversion into hero SKU pages inside 6 months when the content quality matches search intent and every page carries the right structured data markup. Vejrø also proved out the reporting discipline: every monthly report named the exact page, the exact keyword cluster, and the exact search feature (rich result, sitelinks, image pack) driving the incremental organic revenue instead of hiding behind aggregate traffic charts.
Recipe cadence and content calendar for food brands
Recipe cadence on a working food brand content calendar ships 2 to 4 new recipes per week during the first 6 months and drops to 1 per week at maturity. Each recipe takes 4 to 6 hours to produce (write, test in the kitchen, photograph, schema author, publish). At 3 recipes per week, the brand hits 78 recipes inside 6 months plus a backlog of ingredient comparison and sourcing content queued behind the recipe production line.
| Content pillar | Target volume year 1 | Production cost per piece | Refresh cadence |
|---|---|---|---|
| Recipe hub | 40 to 100 recipes | $180 to $320 | Every 12 months |
| Ingredient comparison guides | 12 to 24 guides | $450 to $780 | Every 18 months |
| Sourcing story pages | 6 to 12 pages | $680 to $1,200 | Every 24 months |
| Buyer intent content | 8 to 16 pieces | $220 to $420 | Every 12 months |
Photography as a content calendar constraint
Photography is the actual constraint on recipe cadence, not writing. Every recipe needs 6 to 12 photos: hero shot, ingredient flat lay, prep in progress, plated result, storage, and step shots for the schema markup. A working food brand batches photography 8 recipes at a time to keep the cost per recipe under 200 dollars. Skip the batching and the per-recipe cost climbs to 400 to 600 dollars, which caps recipe cadence at 1 per week and slows organic ranking timeline by 6 months.
Seasonal content calendar planning
Seasonal content calendar planning maps recipes and comparison guides to the seasonal windows they need to rank in. A Christmas cookie recipe needs to publish in September to rank by early December. A Valentine’s chocolate guide needs to publish in November to rank by early February. A back-to-school lunchbox recipe needs to publish in June to rank by late August. The 60-to-90-day ranking curve dictates the calendar.
Creator syndication inside food brand content
Creator syndication on food brand content marketing amplifies the recipe hub through Instagram Reels, TikTok, and YouTube Shorts creators paid to post their own version of the brand’s hero recipes. The creator content pulls net-new audiences into the recipe hub through the creator’s Link in Bio or Amazon Storefront tag. The syndication calendar names 12 to 30 creators per quarter with specific recipes assigned to each.
One brand we picked up had a spreadsheet titled “creator outreach 2023” with 47 rows and 3 responses. All 3 responses were auto-replies. The spreadsheet named zero recipes and offered flat rates below 100 dollars per post. Nobody posts a 30-second video for 87 dollars flat. Nobody.
Creator content commercial terms that work
Working creator content commercial terms run 350 to 1,500 dollars flat per post plus a 12 to 25 percent commission on tagged sales across a 30-day window. The commission mechanic pulls creators into follow-up posts because the incremental revenue continues past the initial fee. Mid-tier creators (30k to 150k followers) hit the sweet spot for food brand content because their engagement rate typically runs 4 to 8 percent versus 0.8 to 1.6 percent on mega-creators.
Content brief structure for creator partnerships
The content brief structure for creator partnerships runs a single page: the SKU, the specific recipe or usage occasion, 3 required brand mentions, 3 restricted claims (no health claims on non-medical SKUs), the pricing angle, the affiliate link, and 3 example videos that hit the tone. The brief avoids over-scripting because over-scripted creator content underperforms native creator voice by 40 to 60 percent on engagement rate.
Buyer intent content for food brand blogs
Buyer intent content on food brand blogs covers 8 to 16 pieces targeting explicit purchase-decision queries: “where to buy [brand],” “[brand] subscription vs. one-time,” “best [category] for [use case],” and “[brand] gift bundle.” Every buyer intent piece runs 1,400 to 2,400 words with a comparison table, product cards, and a clear conversion path to the specific SKU that matches the query intent. Buyer intent content converts at 3 to 6 percent versus 1 to 2 percent on recipe content because the shopper landed already planning to buy, not exploring a usage occasion.
Where-to-buy content structure
Where-to-buy content structure covers online (DTC storefront, Amazon, Target.com, Whole Foods online), retail (specific chain locators with the store finder embedded), and international (customs limitations, retailer partners abroad). Every piece names specific retailers, links to the store locator, and includes an FAQ block covering shipping availability, subscription options, and gift card compatibility. Where-to-buy content ranks for branded discovery queries the DTC storefront otherwise loses to competitor affiliate reviews.
Subscription versus one-time comparison content
Subscription versus one-time comparison content converts subscription commitments at 3 to 6 percent because it addresses the price-sensitivity concern head-on with a specific math table. The piece covers the discount structure (15 percent lifetime), the skip-a-month mechanic, the pause-anytime rule, the cancellation policy, and the specific yearly savings for the brand’s average consumption cadence. Cross-reference the retention structure on our food and beverage marketing retainer page.
Content refresh cadence on food brand pillars
Content refresh cadence on food brand content pillars runs a rolling audit every 12 to 24 months by pillar. Recipes get refreshed every 12 months with new photography, updated schema, and any nutrition or ingredient adjustments. Ingredient comparison guides refresh every 18 months to update market data. Sourcing story pages refresh every 24 months to reflect farm partnership changes and new harvest angles. Buyer intent content refreshes every 12 months to update retailer availability and pricing.
Recipe refresh priority order
Recipe refresh priority runs by organic traffic rank. The top 20 recipes by monthly organic sessions get refreshed first (new photography, schema audit, related recipe internal links, updated nutrition). The next 40 get refreshed at 15 months. The remaining recipes get refreshed opportunistically when the ranking slips past position 15 in Google. Skipping the refresh cadence lets recipe rankings drift out of the top 3 inside 18 months as newer competitor recipes take the position.
Schema audit checklist per refresh
The schema audit checklist per refresh runs 8 items: Recipe schema completeness, aggregateRating count and accuracy, nutrition data accuracy, prepTime and cookTime match the recipe body, image URLs valid at CDN, related recipe internal links working, product card SKU URL live, and Google Search Console rich result eligibility validated. This checklist takes 20 minutes per recipe and prevents the schema drift that costs recipe rankings 20 to 40 positions quietly.
Reporting cadence for food brand content marketing
Reporting cadence on food brand content marketing runs a monthly executive report plus a quarterly business review. The monthly report ships in the first business week and covers organic sessions by pillar, top 10 ranking recipes with position trend, ingredient guide ranking movements, sourcing page performance, and organic-attributed DTC revenue. Every number carries a comparison to the prior month and a plain-language interpretation the founder reads in 7 minutes.
Metrics that matter for content marketing
Metrics that matter for food brand content marketing: organic sessions by pillar, recipe rich result impressions in Search Console, organic conversion rate to hero SKU pages, organic-attributed DTC revenue, and top 20 ranking positions by monthly organic sessions. Vanity metrics that do not matter: total pageviews without conversion context, average time on page without conversion attribution, and social share counts. The monthly report skips the vanity block entirely.
Quarterly business review structure
The quarterly business review runs 90 minutes with the founder, head of content, and SEO lead. Agenda: organic traffic trend by pillar, top 10 winning content pieces, top 10 losing content pieces (candidates for refresh or removal), competitive gap analysis against 5 named competitor brands, and next quarter’s content calendar with recipes and ingredient guides queued. According to Ahrefs content marketing research, brands running quarterly content audits outperform brands running annual audits by 40 to 70 percent on organic revenue over a 24-month window.
Internal linking discipline across food brand content
Internal linking discipline across food brand content moves authority from recipe pages toward hero SKU product pages and comparison guides. Every recipe links to the hero SKU it uses inline (once in the ingredient list, once in a bottom call-out card). Every ingredient comparison guide links to 3 to 6 recipes using the winning ingredient plus the hero SKU product page. Every sourcing story links to the 2 to 4 SKUs sourced from that specific farm or cooperative.
Anchor text strategy across recipe hubs
Anchor text on internal links varies across recipe hubs to avoid over-optimization patterns Google penalizes. Exact-match anchor (“single-origin Ethiopian coffee”) runs on 20 to 30 percent of internal links. Partial-match variations (“our Ethiopian roast”) run on 30 to 40 percent. Branded anchors (the SKU name) run on 20 to 30 percent. Generic anchors (“shop the coffee”) fill the remaining 10 to 20 percent. This ratio holds ranking without triggering the over-optimization penalty that shows up on brands that anchor-text-stuff every internal link with the same exact-match keyword. Cross-reference the linking layer on our food and beverage web design page.
Link equity from ingredient guides to SKU pages
Link equity from ingredient guides passes to SKU pages when the guide’s comparison table names the hero SKU in the winning column with a product card, and when the guide’s body links to 3 to 6 recipes that use the winning ingredient. This 3-hop path (guide to recipe to SKU) pushes authority from a high-traffic informational query down to a high-intent transactional page. According to Search Engine Land SEO coverage, informational content that internally links to transactional pages produces 2 to 4 times higher organic revenue than isolated content silos.
Wrapping up content marketing for food brands
Content marketing for food brands is the organic engine that turns a DTC snack, drink, or CPG storefront into a search-driven revenue channel. Recipe hub of 40 to 100 recipes. Ingredient comparison guides at 12 to 24 pieces. Sourcing story pages at 6 to 12 pieces. Buyer intent content at 8 to 16 pieces. Creator syndication calendar with 12 to 30 creators per quarter. Refresh cadence at 12 to 24 months by pillar. Reporting with organic sessions and organic revenue attribution.
If your DTC food brand is running paid social at 20,000 dollars monthly with a broken blog and zero recipe schema, professional content marketing for food brands pays for itself inside the first 90 days on organic traffic captured. Redefine Web ships content marketing inside our monthly retainer packages. Book a call and we will walk through the last three DTC food brands we built recipe hubs for, pillar by pillar.
Content marketing for food brands starts with a recipe hub because recipe queries account for 40 to 60 percent of high-intent search volume in the food category. Every hero SKU needs 4 to 12 recipes anchored to it, each targeting a specific occasion and audience.
Skip the recipe hub and the brand loses the search real estate that pulls DTC storefront traffic month over month at zero incremental paid cost. Recipe traffic converts at 2 to 4 percent because the shopper landed with usage intent, not passive discovery, which is why food brands win on recipes.
Recipe schema and Google rich result eligibility
Every recipe page ships schema.org Recipe markup including cookTime, prepTime, recipeIngredient, recipeInstructions, nutrition, and aggregateRating. Correctly marked-up recipes qualify for Google’s recipe rich result carousel that pulls 3 to 6 times higher click-through rate than a plain blue link. The schema layer takes 15 minutes per recipe to author and 30 minutes to validate in Google Search Console. Cross-reference the recipe search stack on our food and beverage SEO page.
Recipe hub structure that scales
The recipe hub structure runs 40 to 100 recipes at maturity, organized by hero SKU (4 to 12 recipes per SKU) plus occasion tags (breakfast, weeknight dinner, meal prep, brunch, holiday). Every recipe links back to the hero SKU product page with the SKU embedded in an inline card. The hub earns internal linking value from ingredient comparison guides and the sourcing story pages, which feeds recipe ranking on Google. According to Google Search Central recipe structured data guidance, complete Recipe schema markup is required for eligibility in the recipe carousel and the ingredient search filter.
Pillar structure for food brand content marketing
The pillar structure on content marketing for food brands runs 4 content pillars concurrently: recipe hub (40 to 100 recipes), ingredient comparison guides (12 to 24 guides), sourcing story pages (6 to 12 pages), and buyer intent content (where to buy, subscription vs. one-time, gift bundle guides). Every pillar covers a distinct search intent and every pillar links back to the hero SKU product pages.
Ingredient comparison guide format
Ingredient comparison guides run 1,800 to 3,200 words comparing 2 to 4 ingredient types on 6 to 10 attributes with a comparison table, real-world use case examples, and links to the hero SKU that uses the specific ingredient. Example: organic vs. conventional oats compares nutritional profile, sourcing chain, cost, environmental impact, and taste on a 6-column table. The brand’s SKU appears in the winning column with a product card. These guides rank 3 to 8 months after publication and pull steady-state organic traffic.
Sourcing story pages that build trust
Sourcing story pages name the specific farms, cooperatives, or suppliers the brand sources from, with photos of the farms, farmer quotes, and specific harvest windows. A coffee brand’s Ethiopian farm page ranks for “single-origin Ethiopian coffee” and “Yirgacheffe coffee origin” plus 40 long-tail variations. The sourcing page pulls trust-building traffic that converts at 4 to 6 percent because the shopper landed pattern-matching on transparency and named provenance. Every sourcing page includes farmer or cooperative quotes, harvest dates, and a link back to 3 to 5 hero SKU pages that source from the named supplier.
Vejrø hospitality content case study
Vejrø Resort, a Danish private-island destination with an on-site restaurant focused on organic, locally sourced cuisine, joined us with strong social engagement and no organic-search real estate. Guests found the resort on Instagram but never in Google search for terms like “private island resort Denmark,” “farm-to-table hospitality Denmark,” or “Vejrø restaurant.” The same organic-search gap shows up on DTC food brands running paid social at 20,000 dollars monthly with a broken blog and zero recipe schema.
We built the conversion-focused website with on-site and off-site SEO tuned to the travel-niche keyword clusters, competitor analysis against comparable boutique resorts, and mobile-first design prioritizing guest discovery. Every page carried the structured data qualifying it for Google’s rich results in the hospitality category. Every internal link pushed authority toward the direct-booking conversion path.
Three months later, Vejrø hit 10,000 plus organic visitors, ranked for 200 plus first-page keywords, and pulled a 2.2 percent booking conversion rate from organic traffic. The same pattern applies to content marketing for food brands: recipe schema, ingredient comparison guides, and sourcing story pages pull organic traffic at 20 to 40 percent conversion into hero SKU pages inside 6 months when the content quality matches search intent and every page carries the right structured data markup. Vejrø also proved out the reporting discipline: every monthly report named the exact page, the exact keyword cluster, and the exact search feature (rich result, sitelinks, image pack) driving the incremental organic revenue instead of hiding behind aggregate traffic charts.
Recipe cadence and content calendar for food brands
Recipe cadence on a working food brand content calendar ships 2 to 4 new recipes per week during the first 6 months and drops to 1 per week at maturity. Each recipe takes 4 to 6 hours to produce (write, test in the kitchen, photograph, schema author, publish). At 3 recipes per week, the brand hits 78 recipes inside 6 months plus a backlog of ingredient comparison and sourcing content queued behind the recipe production line.
| Content pillar | Target volume year 1 | Production cost per piece | Refresh cadence |
|---|---|---|---|
| Recipe hub | 40 to 100 recipes | $180 to $320 | Every 12 months |
| Ingredient comparison guides | 12 to 24 guides | $450 to $780 | Every 18 months |
| Sourcing story pages | 6 to 12 pages | $680 to $1,200 | Every 24 months |
| Buyer intent content | 8 to 16 pieces | $220 to $420 | Every 12 months |
Photography as a content calendar constraint
Photography is the actual constraint on recipe cadence, not writing. Every recipe needs 6 to 12 photos: hero shot, ingredient flat lay, prep in progress, plated result, storage, and step shots for the schema markup. A working food brand batches photography 8 recipes at a time to keep the cost per recipe under 200 dollars. Skip the batching and the per-recipe cost climbs to 400 to 600 dollars, which caps recipe cadence at 1 per week and slows organic ranking timeline by 6 months.
Seasonal content calendar planning
Seasonal content calendar planning maps recipes and comparison guides to the seasonal windows they need to rank in. A Christmas cookie recipe needs to publish in September to rank by early December. A Valentine’s chocolate guide needs to publish in November to rank by early February. A back-to-school lunchbox recipe needs to publish in June to rank by late August. The 60-to-90-day ranking curve dictates the calendar.
Creator syndication inside food brand content
Creator syndication on food brand content marketing amplifies the recipe hub through Instagram Reels, TikTok, and YouTube Shorts creators paid to post their own version of the brand’s hero recipes. The creator content pulls net-new audiences into the recipe hub through the creator’s Link in Bio or Amazon Storefront tag. The syndication calendar names 12 to 30 creators per quarter with specific recipes assigned to each.
One brand we picked up had a spreadsheet titled “creator outreach 2023” with 47 rows and 3 responses. All 3 responses were auto-replies. The spreadsheet named zero recipes and offered flat rates below 100 dollars per post. Nobody posts a 30-second video for 87 dollars flat. Nobody.
Creator content commercial terms that work
Working creator content commercial terms run 350 to 1,500 dollars flat per post plus a 12 to 25 percent commission on tagged sales across a 30-day window. The commission mechanic pulls creators into follow-up posts because the incremental revenue continues past the initial fee. Mid-tier creators (30k to 150k followers) hit the sweet spot for food brand content because their engagement rate typically runs 4 to 8 percent versus 0.8 to 1.6 percent on mega-creators.
Content brief structure for creator partnerships
The content brief structure for creator partnerships runs a single page: the SKU, the specific recipe or usage occasion, 3 required brand mentions, 3 restricted claims (no health claims on non-medical SKUs), the pricing angle, the affiliate link, and 3 example videos that hit the tone. The brief avoids over-scripting because over-scripted creator content underperforms native creator voice by 40 to 60 percent on engagement rate.
Buyer intent content for food brand blogs
Buyer intent content on food brand blogs covers 8 to 16 pieces targeting explicit purchase-decision queries: “where to buy [brand],” “[brand] subscription vs. one-time,” “best [category] for [use case],” and “[brand] gift bundle.” Every buyer intent piece runs 1,400 to 2,400 words with a comparison table, product cards, and a clear conversion path to the specific SKU that matches the query intent. Buyer intent content converts at 3 to 6 percent versus 1 to 2 percent on recipe content because the shopper landed already planning to buy, not exploring a usage occasion.
Where-to-buy content structure
Where-to-buy content structure covers online (DTC storefront, Amazon, Target.com, Whole Foods online), retail (specific chain locators with the store finder embedded), and international (customs limitations, retailer partners abroad). Every piece names specific retailers, links to the store locator, and includes an FAQ block covering shipping availability, subscription options, and gift card compatibility. Where-to-buy content ranks for branded discovery queries the DTC storefront otherwise loses to competitor affiliate reviews.
Subscription versus one-time comparison content
Subscription versus one-time comparison content converts subscription commitments at 3 to 6 percent because it addresses the price-sensitivity concern head-on with a specific math table. The piece covers the discount structure (15 percent lifetime), the skip-a-month mechanic, the pause-anytime rule, the cancellation policy, and the specific yearly savings for the brand’s average consumption cadence. Cross-reference the retention structure on our food and beverage marketing retainer page.
Content refresh cadence on food brand pillars
Content refresh cadence on food brand content pillars runs a rolling audit every 12 to 24 months by pillar. Recipes get refreshed every 12 months with new photography, updated schema, and any nutrition or ingredient adjustments. Ingredient comparison guides refresh every 18 months to update market data. Sourcing story pages refresh every 24 months to reflect farm partnership changes and new harvest angles. Buyer intent content refreshes every 12 months to update retailer availability and pricing.
Recipe refresh priority order
Recipe refresh priority runs by organic traffic rank. The top 20 recipes by monthly organic sessions get refreshed first (new photography, schema audit, related recipe internal links, updated nutrition). The next 40 get refreshed at 15 months. The remaining recipes get refreshed opportunistically when the ranking slips past position 15 in Google. Skipping the refresh cadence lets recipe rankings drift out of the top 3 inside 18 months as newer competitor recipes take the position.
Schema audit checklist per refresh
The schema audit checklist per refresh runs 8 items: Recipe schema completeness, aggregateRating count and accuracy, nutrition data accuracy, prepTime and cookTime match the recipe body, image URLs valid at CDN, related recipe internal links working, product card SKU URL live, and Google Search Console rich result eligibility validated. This checklist takes 20 minutes per recipe and prevents the schema drift that costs recipe rankings 20 to 40 positions quietly.
Reporting cadence for food brand content marketing
Reporting cadence on food brand content marketing runs a monthly executive report plus a quarterly business review. The monthly report ships in the first business week and covers organic sessions by pillar, top 10 ranking recipes with position trend, ingredient guide ranking movements, sourcing page performance, and organic-attributed DTC revenue. Every number carries a comparison to the prior month and a plain-language interpretation the founder reads in 7 minutes.
Metrics that matter for content marketing
Metrics that matter for food brand content marketing: organic sessions by pillar, recipe rich result impressions in Search Console, organic conversion rate to hero SKU pages, organic-attributed DTC revenue, and top 20 ranking positions by monthly organic sessions. Vanity metrics that do not matter: total pageviews without conversion context, average time on page without conversion attribution, and social share counts. The monthly report skips the vanity block entirely.
Quarterly business review structure
The quarterly business review runs 90 minutes with the founder, head of content, and SEO lead. Agenda: organic traffic trend by pillar, top 10 winning content pieces, top 10 losing content pieces (candidates for refresh or removal), competitive gap analysis against 5 named competitor brands, and next quarter’s content calendar with recipes and ingredient guides queued. According to Ahrefs content marketing research, brands running quarterly content audits outperform brands running annual audits by 40 to 70 percent on organic revenue over a 24-month window.
Internal linking discipline across food brand content
Internal linking discipline across food brand content moves authority from recipe pages toward hero SKU product pages and comparison guides. Every recipe links to the hero SKU it uses inline (once in the ingredient list, once in a bottom call-out card). Every ingredient comparison guide links to 3 to 6 recipes using the winning ingredient plus the hero SKU product page. Every sourcing story links to the 2 to 4 SKUs sourced from that specific farm or cooperative.
Anchor text strategy across recipe hubs
Anchor text on internal links varies across recipe hubs to avoid over-optimization patterns Google penalizes. Exact-match anchor (“single-origin Ethiopian coffee”) runs on 20 to 30 percent of internal links. Partial-match variations (“our Ethiopian roast”) run on 30 to 40 percent. Branded anchors (the SKU name) run on 20 to 30 percent. Generic anchors (“shop the coffee”) fill the remaining 10 to 20 percent. This ratio holds ranking without triggering the over-optimization penalty that shows up on brands that anchor-text-stuff every internal link with the same exact-match keyword. Cross-reference the linking layer on our food and beverage web design page.
Link equity from ingredient guides to SKU pages
Link equity from ingredient guides passes to SKU pages when the guide’s comparison table names the hero SKU in the winning column with a product card, and when the guide’s body links to 3 to 6 recipes that use the winning ingredient. This 3-hop path (guide to recipe to SKU) pushes authority from a high-traffic informational query down to a high-intent transactional page. According to Search Engine Land SEO coverage, informational content that internally links to transactional pages produces 2 to 4 times higher organic revenue than isolated content silos.
Wrapping up content marketing for food brands
Content marketing for food brands is the organic engine that turns a DTC snack, drink, or CPG storefront into a search-driven revenue channel. Recipe hub of 40 to 100 recipes. Ingredient comparison guides at 12 to 24 pieces. Sourcing story pages at 6 to 12 pieces. Buyer intent content at 8 to 16 pieces. Creator syndication calendar with 12 to 30 creators per quarter. Refresh cadence at 12 to 24 months by pillar. Reporting with organic sessions and organic revenue attribution.
If your DTC food brand is running paid social at 20,000 dollars monthly with a broken blog and zero recipe schema, professional content marketing for food brands pays for itself inside the first 90 days on organic traffic captured. Redefine Web ships content marketing inside our monthly retainer packages. Book a call and we will walk through the last three DTC food brands we built recipe hubs for, pillar by pillar.
Internal linking discipline across food brand content moves authority from recipe pages toward hero SKU product pages and comparison guides. Every recipe links to the hero SKU it uses inline (once in the ingredient list, once in a bottom call-out card). Every ingredient comparison guide links to 3 to 6 recipes using the winning ingredient plus the hero SKU product page. Every sourcing story links to the 2 to 4 SKUs sourced from that specific farm or cooperative.
Anchor text strategy across recipe hubs
Anchor text on internal links varies across recipe hubs to avoid over-optimization patterns Google penalizes. Exact-match anchor (“single-origin Ethiopian coffee”) runs on 20 to 30 percent of internal links. Partial-match variations (“our Ethiopian roast”) run on 30 to 40 percent. Branded anchors (the SKU name) run on 20 to 30 percent. Generic anchors (“shop the coffee”) fill the remaining 10 to 20 percent. This ratio holds ranking without triggering the over-optimization penalty that shows up on brands that anchor-text-stuff every internal link with the same exact-match keyword. Cross-reference the linking layer on our food and beverage web design page.
Link equity from ingredient guides to SKU pages
Link equity from ingredient guides passes to SKU pages when the guide’s comparison table names the hero SKU in the winning column with a product card, and when the guide’s body links to 3 to 6 recipes that use the winning ingredient. This 3-hop path (guide to recipe to SKU) pushes authority from a high-traffic informational query down to a high-intent transactional page. According to Search Engine Land SEO coverage, informational content that internally links to transactional pages produces 2 to 4 times higher organic revenue than isolated content silos.
Wrapping up content marketing for food brands
Content marketing for food brands is the organic engine that turns a DTC snack, drink, or CPG storefront into a search-driven revenue channel. Recipe hub of 40 to 100 recipes. Ingredient comparison guides at 12 to 24 pieces. Sourcing story pages at 6 to 12 pieces. Buyer intent content at 8 to 16 pieces. Creator syndication calendar with 12 to 30 creators per quarter. Refresh cadence at 12 to 24 months by pillar. Reporting with organic sessions and organic revenue attribution.
If your DTC food brand is running paid social at 20,000 dollars monthly with a broken blog and zero recipe schema, professional content marketing for food brands pays for itself inside the first 90 days on organic traffic captured. Redefine Web ships content marketing inside our monthly retainer packages. Book a call and we will walk through the last three DTC food brands we built recipe hubs for, pillar by pillar.
Anchor text on internal links varies across recipe hubs to avoid over-optimization patterns Google penalizes. Exact-match anchor (“single-origin Ethiopian coffee”) runs on 20 to 30 percent of internal links. Partial-match variations (“our Ethiopian roast”) run on 30 to 40 percent. Branded anchors (the SKU name) run on 20 to 30 percent. Generic anchors (“shop the coffee”) fill the remaining 10 to 20 percent. This ratio holds ranking without triggering the over-optimization penalty that shows up on brands that anchor-text-stuff every internal link with the same exact-match keyword. Cross-reference the linking layer on our food and beverage web design page.
Link equity from ingredient guides to SKU pages
Link equity from ingredient guides passes to SKU pages when the guide’s comparison table names the hero SKU in the winning column with a product card, and when the guide’s body links to 3 to 6 recipes that use the winning ingredient. This 3-hop path (guide to recipe to SKU) pushes authority from a high-traffic informational query down to a high-intent transactional page. According to Search Engine Land SEO coverage, informational content that internally links to transactional pages produces 2 to 4 times higher organic revenue than isolated content silos.
Wrapping up content marketing for food brands
Content marketing for food brands is the organic engine that turns a DTC snack, drink, or CPG storefront into a search-driven revenue channel. Recipe hub of 40 to 100 recipes. Ingredient comparison guides at 12 to 24 pieces. Sourcing story pages at 6 to 12 pieces. Buyer intent content at 8 to 16 pieces. Creator syndication calendar with 12 to 30 creators per quarter. Refresh cadence at 12 to 24 months by pillar. Reporting with organic sessions and organic revenue attribution.
If your DTC food brand is running paid social at 20,000 dollars monthly with a broken blog and zero recipe schema, professional content marketing for food brands pays for itself inside the first 90 days on organic traffic captured. Redefine Web ships content marketing inside our monthly retainer packages. Book a call and we will walk through the last three DTC food brands we built recipe hubs for, pillar by pillar.
Content marketing for food brands starts with a recipe hub because recipe queries account for 40 to 60 percent of high-intent search volume in the food category. Every hero SKU needs 4 to 12 recipes anchored to it, each targeting a specific occasion and audience.
Skip the recipe hub and the brand loses the search real estate that pulls DTC storefront traffic month over month at zero incremental paid cost. Recipe traffic converts at 2 to 4 percent because the shopper landed with usage intent, not passive discovery, which is why food brands win on recipes.
Recipe schema and Google rich result eligibility
Every recipe page ships schema.org Recipe markup including cookTime, prepTime, recipeIngredient, recipeInstructions, nutrition, and aggregateRating. Correctly marked-up recipes qualify for Google’s recipe rich result carousel that pulls 3 to 6 times higher click-through rate than a plain blue link. The schema layer takes 15 minutes per recipe to author and 30 minutes to validate in Google Search Console. Cross-reference the recipe search stack on our food and beverage SEO page.
Recipe hub structure that scales
The recipe hub structure runs 40 to 100 recipes at maturity, organized by hero SKU (4 to 12 recipes per SKU) plus occasion tags (breakfast, weeknight dinner, meal prep, brunch, holiday). Every recipe links back to the hero SKU product page with the SKU embedded in an inline card. The hub earns internal linking value from ingredient comparison guides and the sourcing story pages, which feeds recipe ranking on Google. According to Google Search Central recipe structured data guidance, complete Recipe schema markup is required for eligibility in the recipe carousel and the ingredient search filter.
Pillar structure for food brand content marketing
The pillar structure on content marketing for food brands runs 4 content pillars concurrently: recipe hub (40 to 100 recipes), ingredient comparison guides (12 to 24 guides), sourcing story pages (6 to 12 pages), and buyer intent content (where to buy, subscription vs. one-time, gift bundle guides). Every pillar covers a distinct search intent and every pillar links back to the hero SKU product pages.
Ingredient comparison guide format
Ingredient comparison guides run 1,800 to 3,200 words comparing 2 to 4 ingredient types on 6 to 10 attributes with a comparison table, real-world use case examples, and links to the hero SKU that uses the specific ingredient. Example: organic vs. conventional oats compares nutritional profile, sourcing chain, cost, environmental impact, and taste on a 6-column table. The brand’s SKU appears in the winning column with a product card. These guides rank 3 to 8 months after publication and pull steady-state organic traffic.
Sourcing story pages that build trust
Sourcing story pages name the specific farms, cooperatives, or suppliers the brand sources from, with photos of the farms, farmer quotes, and specific harvest windows. A coffee brand’s Ethiopian farm page ranks for “single-origin Ethiopian coffee” and “Yirgacheffe coffee origin” plus 40 long-tail variations. The sourcing page pulls trust-building traffic that converts at 4 to 6 percent because the shopper landed pattern-matching on transparency and named provenance. Every sourcing page includes farmer or cooperative quotes, harvest dates, and a link back to 3 to 5 hero SKU pages that source from the named supplier.
Vejrø hospitality content case study
Vejrø Resort, a Danish private-island destination with an on-site restaurant focused on organic, locally sourced cuisine, joined us with strong social engagement and no organic-search real estate. Guests found the resort on Instagram but never in Google search for terms like “private island resort Denmark,” “farm-to-table hospitality Denmark,” or “Vejrø restaurant.” The same organic-search gap shows up on DTC food brands running paid social at 20,000 dollars monthly with a broken blog and zero recipe schema.
We built the conversion-focused website with on-site and off-site SEO tuned to the travel-niche keyword clusters, competitor analysis against comparable boutique resorts, and mobile-first design prioritizing guest discovery. Every page carried the structured data qualifying it for Google’s rich results in the hospitality category. Every internal link pushed authority toward the direct-booking conversion path.
Three months later, Vejrø hit 10,000 plus organic visitors, ranked for 200 plus first-page keywords, and pulled a 2.2 percent booking conversion rate from organic traffic. The same pattern applies to content marketing for food brands: recipe schema, ingredient comparison guides, and sourcing story pages pull organic traffic at 20 to 40 percent conversion into hero SKU pages inside 6 months when the content quality matches search intent and every page carries the right structured data markup. Vejrø also proved out the reporting discipline: every monthly report named the exact page, the exact keyword cluster, and the exact search feature (rich result, sitelinks, image pack) driving the incremental organic revenue instead of hiding behind aggregate traffic charts.
Recipe cadence and content calendar for food brands
Recipe cadence on a working food brand content calendar ships 2 to 4 new recipes per week during the first 6 months and drops to 1 per week at maturity. Each recipe takes 4 to 6 hours to produce (write, test in the kitchen, photograph, schema author, publish). At 3 recipes per week, the brand hits 78 recipes inside 6 months plus a backlog of ingredient comparison and sourcing content queued behind the recipe production line.
| Content pillar | Target volume year 1 | Production cost per piece | Refresh cadence |
|---|---|---|---|
| Recipe hub | 40 to 100 recipes | $180 to $320 | Every 12 months |
| Ingredient comparison guides | 12 to 24 guides | $450 to $780 | Every 18 months |
| Sourcing story pages | 6 to 12 pages | $680 to $1,200 | Every 24 months |
| Buyer intent content | 8 to 16 pieces | $220 to $420 | Every 12 months |
Photography as a content calendar constraint
Photography is the actual constraint on recipe cadence, not writing. Every recipe needs 6 to 12 photos: hero shot, ingredient flat lay, prep in progress, plated result, storage, and step shots for the schema markup. A working food brand batches photography 8 recipes at a time to keep the cost per recipe under 200 dollars. Skip the batching and the per-recipe cost climbs to 400 to 600 dollars, which caps recipe cadence at 1 per week and slows organic ranking timeline by 6 months.
Seasonal content calendar planning
Seasonal content calendar planning maps recipes and comparison guides to the seasonal windows they need to rank in. A Christmas cookie recipe needs to publish in September to rank by early December. A Valentine’s chocolate guide needs to publish in November to rank by early February. A back-to-school lunchbox recipe needs to publish in June to rank by late August. The 60-to-90-day ranking curve dictates the calendar.
Creator syndication inside food brand content
Creator syndication on food brand content marketing amplifies the recipe hub through Instagram Reels, TikTok, and YouTube Shorts creators paid to post their own version of the brand’s hero recipes. The creator content pulls net-new audiences into the recipe hub through the creator’s Link in Bio or Amazon Storefront tag. The syndication calendar names 12 to 30 creators per quarter with specific recipes assigned to each.
One brand we picked up had a spreadsheet titled “creator outreach 2023” with 47 rows and 3 responses. All 3 responses were auto-replies. The spreadsheet named zero recipes and offered flat rates below 100 dollars per post. Nobody posts a 30-second video for 87 dollars flat. Nobody.
Creator content commercial terms that work
Working creator content commercial terms run 350 to 1,500 dollars flat per post plus a 12 to 25 percent commission on tagged sales across a 30-day window. The commission mechanic pulls creators into follow-up posts because the incremental revenue continues past the initial fee. Mid-tier creators (30k to 150k followers) hit the sweet spot for food brand content because their engagement rate typically runs 4 to 8 percent versus 0.8 to 1.6 percent on mega-creators.
Content brief structure for creator partnerships
The content brief structure for creator partnerships runs a single page: the SKU, the specific recipe or usage occasion, 3 required brand mentions, 3 restricted claims (no health claims on non-medical SKUs), the pricing angle, the affiliate link, and 3 example videos that hit the tone. The brief avoids over-scripting because over-scripted creator content underperforms native creator voice by 40 to 60 percent on engagement rate.
Buyer intent content for food brand blogs
Buyer intent content on food brand blogs covers 8 to 16 pieces targeting explicit purchase-decision queries: “where to buy [brand],” “[brand] subscription vs. one-time,” “best [category] for [use case],” and “[brand] gift bundle.” Every buyer intent piece runs 1,400 to 2,400 words with a comparison table, product cards, and a clear conversion path to the specific SKU that matches the query intent. Buyer intent content converts at 3 to 6 percent versus 1 to 2 percent on recipe content because the shopper landed already planning to buy, not exploring a usage occasion.
Where-to-buy content structure
Where-to-buy content structure covers online (DTC storefront, Amazon, Target.com, Whole Foods online), retail (specific chain locators with the store finder embedded), and international (customs limitations, retailer partners abroad). Every piece names specific retailers, links to the store locator, and includes an FAQ block covering shipping availability, subscription options, and gift card compatibility. Where-to-buy content ranks for branded discovery queries the DTC storefront otherwise loses to competitor affiliate reviews.
Subscription versus one-time comparison content
Subscription versus one-time comparison content converts subscription commitments at 3 to 6 percent because it addresses the price-sensitivity concern head-on with a specific math table. The piece covers the discount structure (15 percent lifetime), the skip-a-month mechanic, the pause-anytime rule, the cancellation policy, and the specific yearly savings for the brand’s average consumption cadence. Cross-reference the retention structure on our food and beverage marketing retainer page.
Content refresh cadence on food brand pillars
Content refresh cadence on food brand content pillars runs a rolling audit every 12 to 24 months by pillar. Recipes get refreshed every 12 months with new photography, updated schema, and any nutrition or ingredient adjustments. Ingredient comparison guides refresh every 18 months to update market data. Sourcing story pages refresh every 24 months to reflect farm partnership changes and new harvest angles. Buyer intent content refreshes every 12 months to update retailer availability and pricing.
Recipe refresh priority order
Recipe refresh priority runs by organic traffic rank. The top 20 recipes by monthly organic sessions get refreshed first (new photography, schema audit, related recipe internal links, updated nutrition). The next 40 get refreshed at 15 months. The remaining recipes get refreshed opportunistically when the ranking slips past position 15 in Google. Skipping the refresh cadence lets recipe rankings drift out of the top 3 inside 18 months as newer competitor recipes take the position.
Schema audit checklist per refresh
The schema audit checklist per refresh runs 8 items: Recipe schema completeness, aggregateRating count and accuracy, nutrition data accuracy, prepTime and cookTime match the recipe body, image URLs valid at CDN, related recipe internal links working, product card SKU URL live, and Google Search Console rich result eligibility validated. This checklist takes 20 minutes per recipe and prevents the schema drift that costs recipe rankings 20 to 40 positions quietly.
Reporting cadence for food brand content marketing
Reporting cadence on food brand content marketing runs a monthly executive report plus a quarterly business review. The monthly report ships in the first business week and covers organic sessions by pillar, top 10 ranking recipes with position trend, ingredient guide ranking movements, sourcing page performance, and organic-attributed DTC revenue. Every number carries a comparison to the prior month and a plain-language interpretation the founder reads in 7 minutes.
Metrics that matter for content marketing
Metrics that matter for food brand content marketing: organic sessions by pillar, recipe rich result impressions in Search Console, organic conversion rate to hero SKU pages, organic-attributed DTC revenue, and top 20 ranking positions by monthly organic sessions. Vanity metrics that do not matter: total pageviews without conversion context, average time on page without conversion attribution, and social share counts. The monthly report skips the vanity block entirely.
Quarterly business review structure
The quarterly business review runs 90 minutes with the founder, head of content, and SEO lead. Agenda: organic traffic trend by pillar, top 10 winning content pieces, top 10 losing content pieces (candidates for refresh or removal), competitive gap analysis against 5 named competitor brands, and next quarter’s content calendar with recipes and ingredient guides queued. According to Ahrefs content marketing research, brands running quarterly content audits outperform brands running annual audits by 40 to 70 percent on organic revenue over a 24-month window.
Internal linking discipline across food brand content
Internal linking discipline across food brand content moves authority from recipe pages toward hero SKU product pages and comparison guides. Every recipe links to the hero SKU it uses inline (once in the ingredient list, once in a bottom call-out card). Every ingredient comparison guide links to 3 to 6 recipes using the winning ingredient plus the hero SKU product page. Every sourcing story links to the 2 to 4 SKUs sourced from that specific farm or cooperative.
Anchor text strategy across recipe hubs
Anchor text on internal links varies across recipe hubs to avoid over-optimization patterns Google penalizes. Exact-match anchor (“single-origin Ethiopian coffee”) runs on 20 to 30 percent of internal links. Partial-match variations (“our Ethiopian roast”) run on 30 to 40 percent. Branded anchors (the SKU name) run on 20 to 30 percent. Generic anchors (“shop the coffee”) fill the remaining 10 to 20 percent. This ratio holds ranking without triggering the over-optimization penalty that shows up on brands that anchor-text-stuff every internal link with the same exact-match keyword. Cross-reference the linking layer on our food and beverage web design page.
Link equity from ingredient guides to SKU pages
Link equity from ingredient guides passes to SKU pages when the guide’s comparison table names the hero SKU in the winning column with a product card, and when the guide’s body links to 3 to 6 recipes that use the winning ingredient. This 3-hop path (guide to recipe to SKU) pushes authority from a high-traffic informational query down to a high-intent transactional page. According to Search Engine Land SEO coverage, informational content that internally links to transactional pages produces 2 to 4 times higher organic revenue than isolated content silos.
Wrapping up content marketing for food brands
Content marketing for food brands is the organic engine that turns a DTC snack, drink, or CPG storefront into a search-driven revenue channel. Recipe hub of 40 to 100 recipes. Ingredient comparison guides at 12 to 24 pieces. Sourcing story pages at 6 to 12 pieces. Buyer intent content at 8 to 16 pieces. Creator syndication calendar with 12 to 30 creators per quarter. Refresh cadence at 12 to 24 months by pillar. Reporting with organic sessions and organic revenue attribution.
If your DTC food brand is running paid social at 20,000 dollars monthly with a broken blog and zero recipe schema, professional content marketing for food brands pays for itself inside the first 90 days on organic traffic captured. Redefine Web ships content marketing inside our monthly retainer packages. Book a call and we will walk through the last three DTC food brands we built recipe hubs for, pillar by pillar.
Content marketing for food brands starts with a recipe hub because recipe queries account for 40 to 60 percent of high-intent search volume in the food category. Every hero SKU needs 4 to 12 recipes anchored to it, each targeting a specific occasion and audience.
Skip the recipe hub and the brand loses the search real estate that pulls DTC storefront traffic month over month at zero incremental paid cost. Recipe traffic converts at 2 to 4 percent because the shopper landed with usage intent, not passive discovery, which is why food brands win on recipes.
Recipe schema and Google rich result eligibility
Every recipe page ships schema.org Recipe markup including cookTime, prepTime, recipeIngredient, recipeInstructions, nutrition, and aggregateRating. Correctly marked-up recipes qualify for Google’s recipe rich result carousel that pulls 3 to 6 times higher click-through rate than a plain blue link. The schema layer takes 15 minutes per recipe to author and 30 minutes to validate in Google Search Console. Cross-reference the recipe search stack on our food and beverage SEO page.
Recipe hub structure that scales
The recipe hub structure runs 40 to 100 recipes at maturity, organized by hero SKU (4 to 12 recipes per SKU) plus occasion tags (breakfast, weeknight dinner, meal prep, brunch, holiday). Every recipe links back to the hero SKU product page with the SKU embedded in an inline card. The hub earns internal linking value from ingredient comparison guides and the sourcing story pages, which feeds recipe ranking on Google. According to Google Search Central recipe structured data guidance, complete Recipe schema markup is required for eligibility in the recipe carousel and the ingredient search filter.
Pillar structure for food brand content marketing
The pillar structure on content marketing for food brands runs 4 content pillars concurrently: recipe hub (40 to 100 recipes), ingredient comparison guides (12 to 24 guides), sourcing story pages (6 to 12 pages), and buyer intent content (where to buy, subscription vs. one-time, gift bundle guides). Every pillar covers a distinct search intent and every pillar links back to the hero SKU product pages.
Ingredient comparison guide format
Ingredient comparison guides run 1,800 to 3,200 words comparing 2 to 4 ingredient types on 6 to 10 attributes with a comparison table, real-world use case examples, and links to the hero SKU that uses the specific ingredient. Example: organic vs. conventional oats compares nutritional profile, sourcing chain, cost, environmental impact, and taste on a 6-column table. The brand’s SKU appears in the winning column with a product card. These guides rank 3 to 8 months after publication and pull steady-state organic traffic.
Sourcing story pages that build trust
Sourcing story pages name the specific farms, cooperatives, or suppliers the brand sources from, with photos of the farms, farmer quotes, and specific harvest windows. A coffee brand’s Ethiopian farm page ranks for “single-origin Ethiopian coffee” and “Yirgacheffe coffee origin” plus 40 long-tail variations. The sourcing page pulls trust-building traffic that converts at 4 to 6 percent because the shopper landed pattern-matching on transparency and named provenance. Every sourcing page includes farmer or cooperative quotes, harvest dates, and a link back to 3 to 5 hero SKU pages that source from the named supplier.
Vejrø hospitality content case study
Vejrø Resort, a Danish private-island destination with an on-site restaurant focused on organic, locally sourced cuisine, joined us with strong social engagement and no organic-search real estate. Guests found the resort on Instagram but never in Google search for terms like “private island resort Denmark,” “farm-to-table hospitality Denmark,” or “Vejrø restaurant.” The same organic-search gap shows up on DTC food brands running paid social at 20,000 dollars monthly with a broken blog and zero recipe schema.
We built the conversion-focused website with on-site and off-site SEO tuned to the travel-niche keyword clusters, competitor analysis against comparable boutique resorts, and mobile-first design prioritizing guest discovery. Every page carried the structured data qualifying it for Google’s rich results in the hospitality category. Every internal link pushed authority toward the direct-booking conversion path.
Three months later, Vejrø hit 10,000 plus organic visitors, ranked for 200 plus first-page keywords, and pulled a 2.2 percent booking conversion rate from organic traffic. The same pattern applies to content marketing for food brands: recipe schema, ingredient comparison guides, and sourcing story pages pull organic traffic at 20 to 40 percent conversion into hero SKU pages inside 6 months when the content quality matches search intent and every page carries the right structured data markup. Vejrø also proved out the reporting discipline: every monthly report named the exact page, the exact keyword cluster, and the exact search feature (rich result, sitelinks, image pack) driving the incremental organic revenue instead of hiding behind aggregate traffic charts.
Recipe cadence and content calendar for food brands
Recipe cadence on a working food brand content calendar ships 2 to 4 new recipes per week during the first 6 months and drops to 1 per week at maturity. Each recipe takes 4 to 6 hours to produce (write, test in the kitchen, photograph, schema author, publish). At 3 recipes per week, the brand hits 78 recipes inside 6 months plus a backlog of ingredient comparison and sourcing content queued behind the recipe production line.
| Content pillar | Target volume year 1 | Production cost per piece | Refresh cadence |
|---|---|---|---|
| Recipe hub | 40 to 100 recipes | $180 to $320 | Every 12 months |
| Ingredient comparison guides | 12 to 24 guides | $450 to $780 | Every 18 months |
| Sourcing story pages | 6 to 12 pages | $680 to $1,200 | Every 24 months |
| Buyer intent content | 8 to 16 pieces | $220 to $420 | Every 12 months |
Photography as a content calendar constraint
Photography is the actual constraint on recipe cadence, not writing. Every recipe needs 6 to 12 photos: hero shot, ingredient flat lay, prep in progress, plated result, storage, and step shots for the schema markup. A working food brand batches photography 8 recipes at a time to keep the cost per recipe under 200 dollars. Skip the batching and the per-recipe cost climbs to 400 to 600 dollars, which caps recipe cadence at 1 per week and slows organic ranking timeline by 6 months.
Seasonal content calendar planning
Seasonal content calendar planning maps recipes and comparison guides to the seasonal windows they need to rank in. A Christmas cookie recipe needs to publish in September to rank by early December. A Valentine’s chocolate guide needs to publish in November to rank by early February. A back-to-school lunchbox recipe needs to publish in June to rank by late August. The 60-to-90-day ranking curve dictates the calendar.
Creator syndication inside food brand content
Creator syndication on food brand content marketing amplifies the recipe hub through Instagram Reels, TikTok, and YouTube Shorts creators paid to post their own version of the brand’s hero recipes. The creator content pulls net-new audiences into the recipe hub through the creator’s Link in Bio or Amazon Storefront tag. The syndication calendar names 12 to 30 creators per quarter with specific recipes assigned to each.
One brand we picked up had a spreadsheet titled “creator outreach 2023” with 47 rows and 3 responses. All 3 responses were auto-replies. The spreadsheet named zero recipes and offered flat rates below 100 dollars per post. Nobody posts a 30-second video for 87 dollars flat. Nobody.
Creator content commercial terms that work
Working creator content commercial terms run 350 to 1,500 dollars flat per post plus a 12 to 25 percent commission on tagged sales across a 30-day window. The commission mechanic pulls creators into follow-up posts because the incremental revenue continues past the initial fee. Mid-tier creators (30k to 150k followers) hit the sweet spot for food brand content because their engagement rate typically runs 4 to 8 percent versus 0.8 to 1.6 percent on mega-creators.
Content brief structure for creator partnerships
The content brief structure for creator partnerships runs a single page: the SKU, the specific recipe or usage occasion, 3 required brand mentions, 3 restricted claims (no health claims on non-medical SKUs), the pricing angle, the affiliate link, and 3 example videos that hit the tone. The brief avoids over-scripting because over-scripted creator content underperforms native creator voice by 40 to 60 percent on engagement rate.
Buyer intent content for food brand blogs
Buyer intent content on food brand blogs covers 8 to 16 pieces targeting explicit purchase-decision queries: “where to buy [brand],” “[brand] subscription vs. one-time,” “best [category] for [use case],” and “[brand] gift bundle.” Every buyer intent piece runs 1,400 to 2,400 words with a comparison table, product cards, and a clear conversion path to the specific SKU that matches the query intent. Buyer intent content converts at 3 to 6 percent versus 1 to 2 percent on recipe content because the shopper landed already planning to buy, not exploring a usage occasion.
Where-to-buy content structure
Where-to-buy content structure covers online (DTC storefront, Amazon, Target.com, Whole Foods online), retail (specific chain locators with the store finder embedded), and international (customs limitations, retailer partners abroad). Every piece names specific retailers, links to the store locator, and includes an FAQ block covering shipping availability, subscription options, and gift card compatibility. Where-to-buy content ranks for branded discovery queries the DTC storefront otherwise loses to competitor affiliate reviews.
Subscription versus one-time comparison content
Subscription versus one-time comparison content converts subscription commitments at 3 to 6 percent because it addresses the price-sensitivity concern head-on with a specific math table. The piece covers the discount structure (15 percent lifetime), the skip-a-month mechanic, the pause-anytime rule, the cancellation policy, and the specific yearly savings for the brand’s average consumption cadence. Cross-reference the retention structure on our food and beverage marketing retainer page.
Content refresh cadence on food brand pillars
Content refresh cadence on food brand content pillars runs a rolling audit every 12 to 24 months by pillar. Recipes get refreshed every 12 months with new photography, updated schema, and any nutrition or ingredient adjustments. Ingredient comparison guides refresh every 18 months to update market data. Sourcing story pages refresh every 24 months to reflect farm partnership changes and new harvest angles. Buyer intent content refreshes every 12 months to update retailer availability and pricing.
Recipe refresh priority order
Recipe refresh priority runs by organic traffic rank. The top 20 recipes by monthly organic sessions get refreshed first (new photography, schema audit, related recipe internal links, updated nutrition). The next 40 get refreshed at 15 months. The remaining recipes get refreshed opportunistically when the ranking slips past position 15 in Google. Skipping the refresh cadence lets recipe rankings drift out of the top 3 inside 18 months as newer competitor recipes take the position.
Schema audit checklist per refresh
The schema audit checklist per refresh runs 8 items: Recipe schema completeness, aggregateRating count and accuracy, nutrition data accuracy, prepTime and cookTime match the recipe body, image URLs valid at CDN, related recipe internal links working, product card SKU URL live, and Google Search Console rich result eligibility validated. This checklist takes 20 minutes per recipe and prevents the schema drift that costs recipe rankings 20 to 40 positions quietly.
Reporting cadence for food brand content marketing
Reporting cadence on food brand content marketing runs a monthly executive report plus a quarterly business review. The monthly report ships in the first business week and covers organic sessions by pillar, top 10 ranking recipes with position trend, ingredient guide ranking movements, sourcing page performance, and organic-attributed DTC revenue. Every number carries a comparison to the prior month and a plain-language interpretation the founder reads in 7 minutes.
Metrics that matter for content marketing
Metrics that matter for food brand content marketing: organic sessions by pillar, recipe rich result impressions in Search Console, organic conversion rate to hero SKU pages, organic-attributed DTC revenue, and top 20 ranking positions by monthly organic sessions. Vanity metrics that do not matter: total pageviews without conversion context, average time on page without conversion attribution, and social share counts. The monthly report skips the vanity block entirely.
Quarterly business review structure
The quarterly business review runs 90 minutes with the founder, head of content, and SEO lead. Agenda: organic traffic trend by pillar, top 10 winning content pieces, top 10 losing content pieces (candidates for refresh or removal), competitive gap analysis against 5 named competitor brands, and next quarter’s content calendar with recipes and ingredient guides queued. According to Ahrefs content marketing research, brands running quarterly content audits outperform brands running annual audits by 40 to 70 percent on organic revenue over a 24-month window.
Internal linking discipline across food brand content
Internal linking discipline across food brand content moves authority from recipe pages toward hero SKU product pages and comparison guides. Every recipe links to the hero SKU it uses inline (once in the ingredient list, once in a bottom call-out card). Every ingredient comparison guide links to 3 to 6 recipes using the winning ingredient plus the hero SKU product page. Every sourcing story links to the 2 to 4 SKUs sourced from that specific farm or cooperative.
Anchor text strategy across recipe hubs
Anchor text on internal links varies across recipe hubs to avoid over-optimization patterns Google penalizes. Exact-match anchor (“single-origin Ethiopian coffee”) runs on 20 to 30 percent of internal links. Partial-match variations (“our Ethiopian roast”) run on 30 to 40 percent. Branded anchors (the SKU name) run on 20 to 30 percent. Generic anchors (“shop the coffee”) fill the remaining 10 to 20 percent. This ratio holds ranking without triggering the over-optimization penalty that shows up on brands that anchor-text-stuff every internal link with the same exact-match keyword. Cross-reference the linking layer on our food and beverage web design page.
Link equity from ingredient guides to SKU pages
Link equity from ingredient guides passes to SKU pages when the guide’s comparison table names the hero SKU in the winning column with a product card, and when the guide’s body links to 3 to 6 recipes that use the winning ingredient. This 3-hop path (guide to recipe to SKU) pushes authority from a high-traffic informational query down to a high-intent transactional page. According to Search Engine Land SEO coverage, informational content that internally links to transactional pages produces 2 to 4 times higher organic revenue than isolated content silos.
Wrapping up content marketing for food brands
Content marketing for food brands is the organic engine that turns a DTC snack, drink, or CPG storefront into a search-driven revenue channel. Recipe hub of 40 to 100 recipes. Ingredient comparison guides at 12 to 24 pieces. Sourcing story pages at 6 to 12 pieces. Buyer intent content at 8 to 16 pieces. Creator syndication calendar with 12 to 30 creators per quarter. Refresh cadence at 12 to 24 months by pillar. Reporting with organic sessions and organic revenue attribution.
If your DTC food brand is running paid social at 20,000 dollars monthly with a broken blog and zero recipe schema, professional content marketing for food brands pays for itself inside the first 90 days on organic traffic captured. Redefine Web ships content marketing inside our monthly retainer packages. Book a call and we will walk through the last three DTC food brands we built recipe hubs for, pillar by pillar.
Internal linking discipline across food brand content moves authority from recipe pages toward hero SKU product pages and comparison guides. Every recipe links to the hero SKU it uses inline (once in the ingredient list, once in a bottom call-out card). Every ingredient comparison guide links to 3 to 6 recipes using the winning ingredient plus the hero SKU product page. Every sourcing story links to the 2 to 4 SKUs sourced from that specific farm or cooperative.
Anchor text strategy across recipe hubs
Anchor text on internal links varies across recipe hubs to avoid over-optimization patterns Google penalizes. Exact-match anchor (“single-origin Ethiopian coffee”) runs on 20 to 30 percent of internal links. Partial-match variations (“our Ethiopian roast”) run on 30 to 40 percent. Branded anchors (the SKU name) run on 20 to 30 percent. Generic anchors (“shop the coffee”) fill the remaining 10 to 20 percent. This ratio holds ranking without triggering the over-optimization penalty that shows up on brands that anchor-text-stuff every internal link with the same exact-match keyword. Cross-reference the linking layer on our food and beverage web design page.
Link equity from ingredient guides to SKU pages
Link equity from ingredient guides passes to SKU pages when the guide’s comparison table names the hero SKU in the winning column with a product card, and when the guide’s body links to 3 to 6 recipes that use the winning ingredient. This 3-hop path (guide to recipe to SKU) pushes authority from a high-traffic informational query down to a high-intent transactional page. According to Search Engine Land SEO coverage, informational content that internally links to transactional pages produces 2 to 4 times higher organic revenue than isolated content silos.
Wrapping up content marketing for food brands
Content marketing for food brands is the organic engine that turns a DTC snack, drink, or CPG storefront into a search-driven revenue channel. Recipe hub of 40 to 100 recipes. Ingredient comparison guides at 12 to 24 pieces. Sourcing story pages at 6 to 12 pieces. Buyer intent content at 8 to 16 pieces. Creator syndication calendar with 12 to 30 creators per quarter. Refresh cadence at 12 to 24 months by pillar. Reporting with organic sessions and organic revenue attribution.
If your DTC food brand is running paid social at 20,000 dollars monthly with a broken blog and zero recipe schema, professional content marketing for food brands pays for itself inside the first 90 days on organic traffic captured. Redefine Web ships content marketing inside our monthly retainer packages. Book a call and we will walk through the last three DTC food brands we built recipe hubs for, pillar by pillar.
Content marketing for food brands starts with a recipe hub because recipe queries account for 40 to 60 percent of high-intent search volume in the food category. Every hero SKU needs 4 to 12 recipes anchored to it, each targeting a specific occasion and audience.
Skip the recipe hub and the brand loses the search real estate that pulls DTC storefront traffic month over month at zero incremental paid cost. Recipe traffic converts at 2 to 4 percent because the shopper landed with usage intent, not passive discovery, which is why food brands win on recipes.
Recipe schema and Google rich result eligibility
Every recipe page ships schema.org Recipe markup including cookTime, prepTime, recipeIngredient, recipeInstructions, nutrition, and aggregateRating. Correctly marked-up recipes qualify for Google’s recipe rich result carousel that pulls 3 to 6 times higher click-through rate than a plain blue link. The schema layer takes 15 minutes per recipe to author and 30 minutes to validate in Google Search Console. Cross-reference the recipe search stack on our food and beverage SEO page.
Recipe hub structure that scales
The recipe hub structure runs 40 to 100 recipes at maturity, organized by hero SKU (4 to 12 recipes per SKU) plus occasion tags (breakfast, weeknight dinner, meal prep, brunch, holiday). Every recipe links back to the hero SKU product page with the SKU embedded in an inline card. The hub earns internal linking value from ingredient comparison guides and the sourcing story pages, which feeds recipe ranking on Google. According to Google Search Central recipe structured data guidance, complete Recipe schema markup is required for eligibility in the recipe carousel and the ingredient search filter.
Pillar structure for food brand content marketing
The pillar structure on content marketing for food brands runs 4 content pillars concurrently: recipe hub (40 to 100 recipes), ingredient comparison guides (12 to 24 guides), sourcing story pages (6 to 12 pages), and buyer intent content (where to buy, subscription vs. one-time, gift bundle guides). Every pillar covers a distinct search intent and every pillar links back to the hero SKU product pages.
Ingredient comparison guide format
Ingredient comparison guides run 1,800 to 3,200 words comparing 2 to 4 ingredient types on 6 to 10 attributes with a comparison table, real-world use case examples, and links to the hero SKU that uses the specific ingredient. Example: organic vs. conventional oats compares nutritional profile, sourcing chain, cost, environmental impact, and taste on a 6-column table. The brand’s SKU appears in the winning column with a product card. These guides rank 3 to 8 months after publication and pull steady-state organic traffic.
Sourcing story pages that build trust
Sourcing story pages name the specific farms, cooperatives, or suppliers the brand sources from, with photos of the farms, farmer quotes, and specific harvest windows. A coffee brand’s Ethiopian farm page ranks for “single-origin Ethiopian coffee” and “Yirgacheffe coffee origin” plus 40 long-tail variations. The sourcing page pulls trust-building traffic that converts at 4 to 6 percent because the shopper landed pattern-matching on transparency and named provenance. Every sourcing page includes farmer or cooperative quotes, harvest dates, and a link back to 3 to 5 hero SKU pages that source from the named supplier.
Vejrø hospitality content case study
Vejrø Resort, a Danish private-island destination with an on-site restaurant focused on organic, locally sourced cuisine, joined us with strong social engagement and no organic-search real estate. Guests found the resort on Instagram but never in Google search for terms like “private island resort Denmark,” “farm-to-table hospitality Denmark,” or “Vejrø restaurant.” The same organic-search gap shows up on DTC food brands running paid social at 20,000 dollars monthly with a broken blog and zero recipe schema.
We built the conversion-focused website with on-site and off-site SEO tuned to the travel-niche keyword clusters, competitor analysis against comparable boutique resorts, and mobile-first design prioritizing guest discovery. Every page carried the structured data qualifying it for Google’s rich results in the hospitality category. Every internal link pushed authority toward the direct-booking conversion path.
Three months later, Vejrø hit 10,000 plus organic visitors, ranked for 200 plus first-page keywords, and pulled a 2.2 percent booking conversion rate from organic traffic. The same pattern applies to content marketing for food brands: recipe schema, ingredient comparison guides, and sourcing story pages pull organic traffic at 20 to 40 percent conversion into hero SKU pages inside 6 months when the content quality matches search intent and every page carries the right structured data markup. Vejrø also proved out the reporting discipline: every monthly report named the exact page, the exact keyword cluster, and the exact search feature (rich result, sitelinks, image pack) driving the incremental organic revenue instead of hiding behind aggregate traffic charts.
Recipe cadence and content calendar for food brands
Recipe cadence on a working food brand content calendar ships 2 to 4 new recipes per week during the first 6 months and drops to 1 per week at maturity. Each recipe takes 4 to 6 hours to produce (write, test in the kitchen, photograph, schema author, publish). At 3 recipes per week, the brand hits 78 recipes inside 6 months plus a backlog of ingredient comparison and sourcing content queued behind the recipe production line.
| Content pillar | Target volume year 1 | Production cost per piece | Refresh cadence |
|---|---|---|---|
| Recipe hub | 40 to 100 recipes | $180 to $320 | Every 12 months |
| Ingredient comparison guides | 12 to 24 guides | $450 to $780 | Every 18 months |
| Sourcing story pages | 6 to 12 pages | $680 to $1,200 | Every 24 months |
| Buyer intent content | 8 to 16 pieces | $220 to $420 | Every 12 months |
Photography as a content calendar constraint
Photography is the actual constraint on recipe cadence, not writing. Every recipe needs 6 to 12 photos: hero shot, ingredient flat lay, prep in progress, plated result, storage, and step shots for the schema markup. A working food brand batches photography 8 recipes at a time to keep the cost per recipe under 200 dollars. Skip the batching and the per-recipe cost climbs to 400 to 600 dollars, which caps recipe cadence at 1 per week and slows organic ranking timeline by 6 months.
Seasonal content calendar planning
Seasonal content calendar planning maps recipes and comparison guides to the seasonal windows they need to rank in. A Christmas cookie recipe needs to publish in September to rank by early December. A Valentine’s chocolate guide needs to publish in November to rank by early February. A back-to-school lunchbox recipe needs to publish in June to rank by late August. The 60-to-90-day ranking curve dictates the calendar.
Creator syndication inside food brand content
Creator syndication on food brand content marketing amplifies the recipe hub through Instagram Reels, TikTok, and YouTube Shorts creators paid to post their own version of the brand’s hero recipes. The creator content pulls net-new audiences into the recipe hub through the creator’s Link in Bio or Amazon Storefront tag. The syndication calendar names 12 to 30 creators per quarter with specific recipes assigned to each.
One brand we picked up had a spreadsheet titled “creator outreach 2023” with 47 rows and 3 responses. All 3 responses were auto-replies. The spreadsheet named zero recipes and offered flat rates below 100 dollars per post. Nobody posts a 30-second video for 87 dollars flat. Nobody.
Creator content commercial terms that work
Working creator content commercial terms run 350 to 1,500 dollars flat per post plus a 12 to 25 percent commission on tagged sales across a 30-day window. The commission mechanic pulls creators into follow-up posts because the incremental revenue continues past the initial fee. Mid-tier creators (30k to 150k followers) hit the sweet spot for food brand content because their engagement rate typically runs 4 to 8 percent versus 0.8 to 1.6 percent on mega-creators.
Content brief structure for creator partnerships
The content brief structure for creator partnerships runs a single page: the SKU, the specific recipe or usage occasion, 3 required brand mentions, 3 restricted claims (no health claims on non-medical SKUs), the pricing angle, the affiliate link, and 3 example videos that hit the tone. The brief avoids over-scripting because over-scripted creator content underperforms native creator voice by 40 to 60 percent on engagement rate.
Buyer intent content for food brand blogs
Buyer intent content on food brand blogs covers 8 to 16 pieces targeting explicit purchase-decision queries: “where to buy [brand],” “[brand] subscription vs. one-time,” “best [category] for [use case],” and “[brand] gift bundle.” Every buyer intent piece runs 1,400 to 2,400 words with a comparison table, product cards, and a clear conversion path to the specific SKU that matches the query intent. Buyer intent content converts at 3 to 6 percent versus 1 to 2 percent on recipe content because the shopper landed already planning to buy, not exploring a usage occasion.
Where-to-buy content structure
Where-to-buy content structure covers online (DTC storefront, Amazon, Target.com, Whole Foods online), retail (specific chain locators with the store finder embedded), and international (customs limitations, retailer partners abroad). Every piece names specific retailers, links to the store locator, and includes an FAQ block covering shipping availability, subscription options, and gift card compatibility. Where-to-buy content ranks for branded discovery queries the DTC storefront otherwise loses to competitor affiliate reviews.
Subscription versus one-time comparison content
Subscription versus one-time comparison content converts subscription commitments at 3 to 6 percent because it addresses the price-sensitivity concern head-on with a specific math table. The piece covers the discount structure (15 percent lifetime), the skip-a-month mechanic, the pause-anytime rule, the cancellation policy, and the specific yearly savings for the brand’s average consumption cadence. Cross-reference the retention structure on our food and beverage marketing retainer page.
Content refresh cadence on food brand pillars
Content refresh cadence on food brand content pillars runs a rolling audit every 12 to 24 months by pillar. Recipes get refreshed every 12 months with new photography, updated schema, and any nutrition or ingredient adjustments. Ingredient comparison guides refresh every 18 months to update market data. Sourcing story pages refresh every 24 months to reflect farm partnership changes and new harvest angles. Buyer intent content refreshes every 12 months to update retailer availability and pricing.
Recipe refresh priority order
Recipe refresh priority runs by organic traffic rank. The top 20 recipes by monthly organic sessions get refreshed first (new photography, schema audit, related recipe internal links, updated nutrition). The next 40 get refreshed at 15 months. The remaining recipes get refreshed opportunistically when the ranking slips past position 15 in Google. Skipping the refresh cadence lets recipe rankings drift out of the top 3 inside 18 months as newer competitor recipes take the position.
Schema audit checklist per refresh
The schema audit checklist per refresh runs 8 items: Recipe schema completeness, aggregateRating count and accuracy, nutrition data accuracy, prepTime and cookTime match the recipe body, image URLs valid at CDN, related recipe internal links working, product card SKU URL live, and Google Search Console rich result eligibility validated. This checklist takes 20 minutes per recipe and prevents the schema drift that costs recipe rankings 20 to 40 positions quietly.
Reporting cadence for food brand content marketing
Reporting cadence on food brand content marketing runs a monthly executive report plus a quarterly business review. The monthly report ships in the first business week and covers organic sessions by pillar, top 10 ranking recipes with position trend, ingredient guide ranking movements, sourcing page performance, and organic-attributed DTC revenue. Every number carries a comparison to the prior month and a plain-language interpretation the founder reads in 7 minutes.
Metrics that matter for content marketing
Metrics that matter for food brand content marketing: organic sessions by pillar, recipe rich result impressions in Search Console, organic conversion rate to hero SKU pages, organic-attributed DTC revenue, and top 20 ranking positions by monthly organic sessions. Vanity metrics that do not matter: total pageviews without conversion context, average time on page without conversion attribution, and social share counts. The monthly report skips the vanity block entirely.
Quarterly business review structure
The quarterly business review runs 90 minutes with the founder, head of content, and SEO lead. Agenda: organic traffic trend by pillar, top 10 winning content pieces, top 10 losing content pieces (candidates for refresh or removal), competitive gap analysis against 5 named competitor brands, and next quarter’s content calendar with recipes and ingredient guides queued. According to Ahrefs content marketing research, brands running quarterly content audits outperform brands running annual audits by 40 to 70 percent on organic revenue over a 24-month window.
Internal linking discipline across food brand content
Internal linking discipline across food brand content moves authority from recipe pages toward hero SKU product pages and comparison guides. Every recipe links to the hero SKU it uses inline (once in the ingredient list, once in a bottom call-out card). Every ingredient comparison guide links to 3 to 6 recipes using the winning ingredient plus the hero SKU product page. Every sourcing story links to the 2 to 4 SKUs sourced from that specific farm or cooperative.
Anchor text strategy across recipe hubs
Anchor text on internal links varies across recipe hubs to avoid over-optimization patterns Google penalizes. Exact-match anchor (“single-origin Ethiopian coffee”) runs on 20 to 30 percent of internal links. Partial-match variations (“our Ethiopian roast”) run on 30 to 40 percent. Branded anchors (the SKU name) run on 20 to 30 percent. Generic anchors (“shop the coffee”) fill the remaining 10 to 20 percent. This ratio holds ranking without triggering the over-optimization penalty that shows up on brands that anchor-text-stuff every internal link with the same exact-match keyword. Cross-reference the linking layer on our food and beverage web design page.
Link equity from ingredient guides to SKU pages
Link equity from ingredient guides passes to SKU pages when the guide’s comparison table names the hero SKU in the winning column with a product card, and when the guide’s body links to 3 to 6 recipes that use the winning ingredient. This 3-hop path (guide to recipe to SKU) pushes authority from a high-traffic informational query down to a high-intent transactional page. According to Search Engine Land SEO coverage, informational content that internally links to transactional pages produces 2 to 4 times higher organic revenue than isolated content silos.
Wrapping up content marketing for food brands
Content marketing for food brands is the organic engine that turns a DTC snack, drink, or CPG storefront into a search-driven revenue channel. Recipe hub of 40 to 100 recipes. Ingredient comparison guides at 12 to 24 pieces. Sourcing story pages at 6 to 12 pieces. Buyer intent content at 8 to 16 pieces. Creator syndication calendar with 12 to 30 creators per quarter. Refresh cadence at 12 to 24 months by pillar. Reporting with organic sessions and organic revenue attribution.
If your DTC food brand is running paid social at 20,000 dollars monthly with a broken blog and zero recipe schema, professional content marketing for food brands pays for itself inside the first 90 days on organic traffic captured. Redefine Web ships content marketing inside our monthly retainer packages. Book a call and we will walk through the last three DTC food brands we built recipe hubs for, pillar by pillar.
Content marketing for food brands starts with a recipe hub because recipe queries account for 40 to 60 percent of high-intent search volume in the food category. Every hero SKU needs 4 to 12 recipes anchored to it, each targeting a specific occasion and audience.
Skip the recipe hub and the brand loses the search real estate that pulls DTC storefront traffic month over month at zero incremental paid cost. Recipe traffic converts at 2 to 4 percent because the shopper landed with usage intent, not passive discovery, which is why food brands win on recipes.
Recipe schema and Google rich result eligibility
Every recipe page ships schema.org Recipe markup including cookTime, prepTime, recipeIngredient, recipeInstructions, nutrition, and aggregateRating. Correctly marked-up recipes qualify for Google’s recipe rich result carousel that pulls 3 to 6 times higher click-through rate than a plain blue link. The schema layer takes 15 minutes per recipe to author and 30 minutes to validate in Google Search Console. Cross-reference the recipe search stack on our food and beverage SEO page.
Recipe hub structure that scales
The recipe hub structure runs 40 to 100 recipes at maturity, organized by hero SKU (4 to 12 recipes per SKU) plus occasion tags (breakfast, weeknight dinner, meal prep, brunch, holiday). Every recipe links back to the hero SKU product page with the SKU embedded in an inline card. The hub earns internal linking value from ingredient comparison guides and the sourcing story pages, which feeds recipe ranking on Google. According to Google Search Central recipe structured data guidance, complete Recipe schema markup is required for eligibility in the recipe carousel and the ingredient search filter.
Pillar structure for food brand content marketing
The pillar structure on content marketing for food brands runs 4 content pillars concurrently: recipe hub (40 to 100 recipes), ingredient comparison guides (12 to 24 guides), sourcing story pages (6 to 12 pages), and buyer intent content (where to buy, subscription vs. one-time, gift bundle guides). Every pillar covers a distinct search intent and every pillar links back to the hero SKU product pages.
Ingredient comparison guide format
Ingredient comparison guides run 1,800 to 3,200 words comparing 2 to 4 ingredient types on 6 to 10 attributes with a comparison table, real-world use case examples, and links to the hero SKU that uses the specific ingredient. Example: organic vs. conventional oats compares nutritional profile, sourcing chain, cost, environmental impact, and taste on a 6-column table. The brand’s SKU appears in the winning column with a product card. These guides rank 3 to 8 months after publication and pull steady-state organic traffic.
Sourcing story pages that build trust
Sourcing story pages name the specific farms, cooperatives, or suppliers the brand sources from, with photos of the farms, farmer quotes, and specific harvest windows. A coffee brand’s Ethiopian farm page ranks for “single-origin Ethiopian coffee” and “Yirgacheffe coffee origin” plus 40 long-tail variations. The sourcing page pulls trust-building traffic that converts at 4 to 6 percent because the shopper landed pattern-matching on transparency and named provenance. Every sourcing page includes farmer or cooperative quotes, harvest dates, and a link back to 3 to 5 hero SKU pages that source from the named supplier.
Vejrø hospitality content case study
Vejrø Resort, a Danish private-island destination with an on-site restaurant focused on organic, locally sourced cuisine, joined us with strong social engagement and no organic-search real estate. Guests found the resort on Instagram but never in Google search for terms like “private island resort Denmark,” “farm-to-table hospitality Denmark,” or “Vejrø restaurant.” The same organic-search gap shows up on DTC food brands running paid social at 20,000 dollars monthly with a broken blog and zero recipe schema.
We built the conversion-focused website with on-site and off-site SEO tuned to the travel-niche keyword clusters, competitor analysis against comparable boutique resorts, and mobile-first design prioritizing guest discovery. Every page carried the structured data qualifying it for Google’s rich results in the hospitality category. Every internal link pushed authority toward the direct-booking conversion path.
Three months later, Vejrø hit 10,000 plus organic visitors, ranked for 200 plus first-page keywords, and pulled a 2.2 percent booking conversion rate from organic traffic. The same pattern applies to content marketing for food brands: recipe schema, ingredient comparison guides, and sourcing story pages pull organic traffic at 20 to 40 percent conversion into hero SKU pages inside 6 months when the content quality matches search intent and every page carries the right structured data markup. Vejrø also proved out the reporting discipline: every monthly report named the exact page, the exact keyword cluster, and the exact search feature (rich result, sitelinks, image pack) driving the incremental organic revenue instead of hiding behind aggregate traffic charts.
Recipe cadence and content calendar for food brands
Recipe cadence on a working food brand content calendar ships 2 to 4 new recipes per week during the first 6 months and drops to 1 per week at maturity. Each recipe takes 4 to 6 hours to produce (write, test in the kitchen, photograph, schema author, publish). At 3 recipes per week, the brand hits 78 recipes inside 6 months plus a backlog of ingredient comparison and sourcing content queued behind the recipe production line.
| Content pillar | Target volume year 1 | Production cost per piece | Refresh cadence |
|---|---|---|---|
| Recipe hub | 40 to 100 recipes | $180 to $320 | Every 12 months |
| Ingredient comparison guides | 12 to 24 guides | $450 to $780 | Every 18 months |
| Sourcing story pages | 6 to 12 pages | $680 to $1,200 | Every 24 months |
| Buyer intent content | 8 to 16 pieces | $220 to $420 | Every 12 months |
Photography as a content calendar constraint
Photography is the actual constraint on recipe cadence, not writing. Every recipe needs 6 to 12 photos: hero shot, ingredient flat lay, prep in progress, plated result, storage, and step shots for the schema markup. A working food brand batches photography 8 recipes at a time to keep the cost per recipe under 200 dollars. Skip the batching and the per-recipe cost climbs to 400 to 600 dollars, which caps recipe cadence at 1 per week and slows organic ranking timeline by 6 months.
Seasonal content calendar planning
Seasonal content calendar planning maps recipes and comparison guides to the seasonal windows they need to rank in. A Christmas cookie recipe needs to publish in September to rank by early December. A Valentine’s chocolate guide needs to publish in November to rank by early February. A back-to-school lunchbox recipe needs to publish in June to rank by late August. The 60-to-90-day ranking curve dictates the calendar.
Creator syndication inside food brand content
Creator syndication on food brand content marketing amplifies the recipe hub through Instagram Reels, TikTok, and YouTube Shorts creators paid to post their own version of the brand’s hero recipes. The creator content pulls net-new audiences into the recipe hub through the creator’s Link in Bio or Amazon Storefront tag. The syndication calendar names 12 to 30 creators per quarter with specific recipes assigned to each.
One brand we picked up had a spreadsheet titled “creator outreach 2023” with 47 rows and 3 responses. All 3 responses were auto-replies. The spreadsheet named zero recipes and offered flat rates below 100 dollars per post. Nobody posts a 30-second video for 87 dollars flat. Nobody.
Creator content commercial terms that work
Working creator content commercial terms run 350 to 1,500 dollars flat per post plus a 12 to 25 percent commission on tagged sales across a 30-day window. The commission mechanic pulls creators into follow-up posts because the incremental revenue continues past the initial fee. Mid-tier creators (30k to 150k followers) hit the sweet spot for food brand content because their engagement rate typically runs 4 to 8 percent versus 0.8 to 1.6 percent on mega-creators.
Content brief structure for creator partnerships
The content brief structure for creator partnerships runs a single page: the SKU, the specific recipe or usage occasion, 3 required brand mentions, 3 restricted claims (no health claims on non-medical SKUs), the pricing angle, the affiliate link, and 3 example videos that hit the tone. The brief avoids over-scripting because over-scripted creator content underperforms native creator voice by 40 to 60 percent on engagement rate.
Buyer intent content for food brand blogs
Buyer intent content on food brand blogs covers 8 to 16 pieces targeting explicit purchase-decision queries: “where to buy [brand],” “[brand] subscription vs. one-time,” “best [category] for [use case],” and “[brand] gift bundle.” Every buyer intent piece runs 1,400 to 2,400 words with a comparison table, product cards, and a clear conversion path to the specific SKU that matches the query intent. Buyer intent content converts at 3 to 6 percent versus 1 to 2 percent on recipe content because the shopper landed already planning to buy, not exploring a usage occasion.
Where-to-buy content structure
Where-to-buy content structure covers online (DTC storefront, Amazon, Target.com, Whole Foods online), retail (specific chain locators with the store finder embedded), and international (customs limitations, retailer partners abroad). Every piece names specific retailers, links to the store locator, and includes an FAQ block covering shipping availability, subscription options, and gift card compatibility. Where-to-buy content ranks for branded discovery queries the DTC storefront otherwise loses to competitor affiliate reviews.
Subscription versus one-time comparison content
Subscription versus one-time comparison content converts subscription commitments at 3 to 6 percent because it addresses the price-sensitivity concern head-on with a specific math table. The piece covers the discount structure (15 percent lifetime), the skip-a-month mechanic, the pause-anytime rule, the cancellation policy, and the specific yearly savings for the brand’s average consumption cadence. Cross-reference the retention structure on our food and beverage marketing retainer page.
Content refresh cadence on food brand pillars
Content refresh cadence on food brand content pillars runs a rolling audit every 12 to 24 months by pillar. Recipes get refreshed every 12 months with new photography, updated schema, and any nutrition or ingredient adjustments. Ingredient comparison guides refresh every 18 months to update market data. Sourcing story pages refresh every 24 months to reflect farm partnership changes and new harvest angles. Buyer intent content refreshes every 12 months to update retailer availability and pricing.
Recipe refresh priority order
Recipe refresh priority runs by organic traffic rank. The top 20 recipes by monthly organic sessions get refreshed first (new photography, schema audit, related recipe internal links, updated nutrition). The next 40 get refreshed at 15 months. The remaining recipes get refreshed opportunistically when the ranking slips past position 15 in Google. Skipping the refresh cadence lets recipe rankings drift out of the top 3 inside 18 months as newer competitor recipes take the position.
Schema audit checklist per refresh
The schema audit checklist per refresh runs 8 items: Recipe schema completeness, aggregateRating count and accuracy, nutrition data accuracy, prepTime and cookTime match the recipe body, image URLs valid at CDN, related recipe internal links working, product card SKU URL live, and Google Search Console rich result eligibility validated. This checklist takes 20 minutes per recipe and prevents the schema drift that costs recipe rankings 20 to 40 positions quietly.
Reporting cadence for food brand content marketing
Reporting cadence on food brand content marketing runs a monthly executive report plus a quarterly business review. The monthly report ships in the first business week and covers organic sessions by pillar, top 10 ranking recipes with position trend, ingredient guide ranking movements, sourcing page performance, and organic-attributed DTC revenue. Every number carries a comparison to the prior month and a plain-language interpretation the founder reads in 7 minutes.
Metrics that matter for content marketing
Metrics that matter for food brand content marketing: organic sessions by pillar, recipe rich result impressions in Search Console, organic conversion rate to hero SKU pages, organic-attributed DTC revenue, and top 20 ranking positions by monthly organic sessions. Vanity metrics that do not matter: total pageviews without conversion context, average time on page without conversion attribution, and social share counts. The monthly report skips the vanity block entirely.
Quarterly business review structure
The quarterly business review runs 90 minutes with the founder, head of content, and SEO lead. Agenda: organic traffic trend by pillar, top 10 winning content pieces, top 10 losing content pieces (candidates for refresh or removal), competitive gap analysis against 5 named competitor brands, and next quarter’s content calendar with recipes and ingredient guides queued. According to Ahrefs content marketing research, brands running quarterly content audits outperform brands running annual audits by 40 to 70 percent on organic revenue over a 24-month window.
Internal linking discipline across food brand content
Internal linking discipline across food brand content moves authority from recipe pages toward hero SKU product pages and comparison guides. Every recipe links to the hero SKU it uses inline (once in the ingredient list, once in a bottom call-out card). Every ingredient comparison guide links to 3 to 6 recipes using the winning ingredient plus the hero SKU product page. Every sourcing story links to the 2 to 4 SKUs sourced from that specific farm or cooperative.
Anchor text strategy across recipe hubs
Anchor text on internal links varies across recipe hubs to avoid over-optimization patterns Google penalizes. Exact-match anchor (“single-origin Ethiopian coffee”) runs on 20 to 30 percent of internal links. Partial-match variations (“our Ethiopian roast”) run on 30 to 40 percent. Branded anchors (the SKU name) run on 20 to 30 percent. Generic anchors (“shop the coffee”) fill the remaining 10 to 20 percent. This ratio holds ranking without triggering the over-optimization penalty that shows up on brands that anchor-text-stuff every internal link with the same exact-match keyword. Cross-reference the linking layer on our food and beverage web design page.
Link equity from ingredient guides to SKU pages
Link equity from ingredient guides passes to SKU pages when the guide’s comparison table names the hero SKU in the winning column with a product card, and when the guide’s body links to 3 to 6 recipes that use the winning ingredient. This 3-hop path (guide to recipe to SKU) pushes authority from a high-traffic informational query down to a high-intent transactional page. According to Search Engine Land SEO coverage, informational content that internally links to transactional pages produces 2 to 4 times higher organic revenue than isolated content silos.
Wrapping up content marketing for food brands
Content marketing for food brands is the organic engine that turns a DTC snack, drink, or CPG storefront into a search-driven revenue channel. Recipe hub of 40 to 100 recipes. Ingredient comparison guides at 12 to 24 pieces. Sourcing story pages at 6 to 12 pieces. Buyer intent content at 8 to 16 pieces. Creator syndication calendar with 12 to 30 creators per quarter. Refresh cadence at 12 to 24 months by pillar. Reporting with organic sessions and organic revenue attribution.
If your DTC food brand is running paid social at 20,000 dollars monthly with a broken blog and zero recipe schema, professional content marketing for food brands pays for itself inside the first 90 days on organic traffic captured. Redefine Web ships content marketing inside our monthly retainer packages. Book a call and we will walk through the last three DTC food brands we built recipe hubs for, pillar by pillar.
Anchor text on internal links varies across recipe hubs to avoid over-optimization patterns Google penalizes. Exact-match anchor (“single-origin Ethiopian coffee”) runs on 20 to 30 percent of internal links. Partial-match variations (“our Ethiopian roast”) run on 30 to 40 percent. Branded anchors (the SKU name) run on 20 to 30 percent. Generic anchors (“shop the coffee”) fill the remaining 10 to 20 percent. This ratio holds ranking without triggering the over-optimization penalty that shows up on brands that anchor-text-stuff every internal link with the same exact-match keyword. Cross-reference the linking layer on our food and beverage web design page.
Link equity from ingredient guides to SKU pages
Link equity from ingredient guides passes to SKU pages when the guide’s comparison table names the hero SKU in the winning column with a product card, and when the guide’s body links to 3 to 6 recipes that use the winning ingredient. This 3-hop path (guide to recipe to SKU) pushes authority from a high-traffic informational query down to a high-intent transactional page. According to Search Engine Land SEO coverage, informational content that internally links to transactional pages produces 2 to 4 times higher organic revenue than isolated content silos.
Wrapping up content marketing for food brands
Content marketing for food brands is the organic engine that turns a DTC snack, drink, or CPG storefront into a search-driven revenue channel. Recipe hub of 40 to 100 recipes. Ingredient comparison guides at 12 to 24 pieces. Sourcing story pages at 6 to 12 pieces. Buyer intent content at 8 to 16 pieces. Creator syndication calendar with 12 to 30 creators per quarter. Refresh cadence at 12 to 24 months by pillar. Reporting with organic sessions and organic revenue attribution.
If your DTC food brand is running paid social at 20,000 dollars monthly with a broken blog and zero recipe schema, professional content marketing for food brands pays for itself inside the first 90 days on organic traffic captured. Redefine Web ships content marketing inside our monthly retainer packages. Book a call and we will walk through the last three DTC food brands we built recipe hubs for, pillar by pillar.
Internal linking discipline across food brand content moves authority from recipe pages toward hero SKU product pages and comparison guides. Every recipe links to the hero SKU it uses inline (once in the ingredient list, once in a bottom call-out card). Every ingredient comparison guide links to 3 to 6 recipes using the winning ingredient plus the hero SKU product page. Every sourcing story links to the 2 to 4 SKUs sourced from that specific farm or cooperative.
Anchor text strategy across recipe hubs
Anchor text on internal links varies across recipe hubs to avoid over-optimization patterns Google penalizes. Exact-match anchor (“single-origin Ethiopian coffee”) runs on 20 to 30 percent of internal links. Partial-match variations (“our Ethiopian roast”) run on 30 to 40 percent. Branded anchors (the SKU name) run on 20 to 30 percent. Generic anchors (“shop the coffee”) fill the remaining 10 to 20 percent. This ratio holds ranking without triggering the over-optimization penalty that shows up on brands that anchor-text-stuff every internal link with the same exact-match keyword. Cross-reference the linking layer on our food and beverage web design page.
Link equity from ingredient guides to SKU pages
Link equity from ingredient guides passes to SKU pages when the guide’s comparison table names the hero SKU in the winning column with a product card, and when the guide’s body links to 3 to 6 recipes that use the winning ingredient. This 3-hop path (guide to recipe to SKU) pushes authority from a high-traffic informational query down to a high-intent transactional page. According to Search Engine Land SEO coverage, informational content that internally links to transactional pages produces 2 to 4 times higher organic revenue than isolated content silos.
Wrapping up content marketing for food brands
Content marketing for food brands is the organic engine that turns a DTC snack, drink, or CPG storefront into a search-driven revenue channel. Recipe hub of 40 to 100 recipes. Ingredient comparison guides at 12 to 24 pieces. Sourcing story pages at 6 to 12 pieces. Buyer intent content at 8 to 16 pieces. Creator syndication calendar with 12 to 30 creators per quarter. Refresh cadence at 12 to 24 months by pillar. Reporting with organic sessions and organic revenue attribution.
If your DTC food brand is running paid social at 20,000 dollars monthly with a broken blog and zero recipe schema, professional content marketing for food brands pays for itself inside the first 90 days on organic traffic captured. Redefine Web ships content marketing inside our monthly retainer packages. Book a call and we will walk through the last three DTC food brands we built recipe hubs for, pillar by pillar.
Content marketing for food brands starts with a recipe hub because recipe queries account for 40 to 60 percent of high-intent search volume in the food category. Every hero SKU needs 4 to 12 recipes anchored to it, each targeting a specific occasion and audience.
Skip the recipe hub and the brand loses the search real estate that pulls DTC storefront traffic month over month at zero incremental paid cost. Recipe traffic converts at 2 to 4 percent because the shopper landed with usage intent, not passive discovery, which is why food brands win on recipes.
Recipe schema and Google rich result eligibility
Every recipe page ships schema.org Recipe markup including cookTime, prepTime, recipeIngredient, recipeInstructions, nutrition, and aggregateRating. Correctly marked-up recipes qualify for Google’s recipe rich result carousel that pulls 3 to 6 times higher click-through rate than a plain blue link. The schema layer takes 15 minutes per recipe to author and 30 minutes to validate in Google Search Console. Cross-reference the recipe search stack on our food and beverage SEO page.
Recipe hub structure that scales
The recipe hub structure runs 40 to 100 recipes at maturity, organized by hero SKU (4 to 12 recipes per SKU) plus occasion tags (breakfast, weeknight dinner, meal prep, brunch, holiday). Every recipe links back to the hero SKU product page with the SKU embedded in an inline card. The hub earns internal linking value from ingredient comparison guides and the sourcing story pages, which feeds recipe ranking on Google. According to Google Search Central recipe structured data guidance, complete Recipe schema markup is required for eligibility in the recipe carousel and the ingredient search filter.
Pillar structure for food brand content marketing
The pillar structure on content marketing for food brands runs 4 content pillars concurrently: recipe hub (40 to 100 recipes), ingredient comparison guides (12 to 24 guides), sourcing story pages (6 to 12 pages), and buyer intent content (where to buy, subscription vs. one-time, gift bundle guides). Every pillar covers a distinct search intent and every pillar links back to the hero SKU product pages.
Ingredient comparison guide format
Ingredient comparison guides run 1,800 to 3,200 words comparing 2 to 4 ingredient types on 6 to 10 attributes with a comparison table, real-world use case examples, and links to the hero SKU that uses the specific ingredient. Example: organic vs. conventional oats compares nutritional profile, sourcing chain, cost, environmental impact, and taste on a 6-column table. The brand’s SKU appears in the winning column with a product card. These guides rank 3 to 8 months after publication and pull steady-state organic traffic.
Sourcing story pages that build trust
Sourcing story pages name the specific farms, cooperatives, or suppliers the brand sources from, with photos of the farms, farmer quotes, and specific harvest windows. A coffee brand’s Ethiopian farm page ranks for “single-origin Ethiopian coffee” and “Yirgacheffe coffee origin” plus 40 long-tail variations. The sourcing page pulls trust-building traffic that converts at 4 to 6 percent because the shopper landed pattern-matching on transparency and named provenance. Every sourcing page includes farmer or cooperative quotes, harvest dates, and a link back to 3 to 5 hero SKU pages that source from the named supplier.
Vejrø hospitality content case study
Vejrø Resort, a Danish private-island destination with an on-site restaurant focused on organic, locally sourced cuisine, joined us with strong social engagement and no organic-search real estate. Guests found the resort on Instagram but never in Google search for terms like “private island resort Denmark,” “farm-to-table hospitality Denmark,” or “Vejrø restaurant.” The same organic-search gap shows up on DTC food brands running paid social at 20,000 dollars monthly with a broken blog and zero recipe schema.
We built the conversion-focused website with on-site and off-site SEO tuned to the travel-niche keyword clusters, competitor analysis against comparable boutique resorts, and mobile-first design prioritizing guest discovery. Every page carried the structured data qualifying it for Google’s rich results in the hospitality category. Every internal link pushed authority toward the direct-booking conversion path.
Three months later, Vejrø hit 10,000 plus organic visitors, ranked for 200 plus first-page keywords, and pulled a 2.2 percent booking conversion rate from organic traffic. The same pattern applies to content marketing for food brands: recipe schema, ingredient comparison guides, and sourcing story pages pull organic traffic at 20 to 40 percent conversion into hero SKU pages inside 6 months when the content quality matches search intent and every page carries the right structured data markup. Vejrø also proved out the reporting discipline: every monthly report named the exact page, the exact keyword cluster, and the exact search feature (rich result, sitelinks, image pack) driving the incremental organic revenue instead of hiding behind aggregate traffic charts.
Recipe cadence and content calendar for food brands
Recipe cadence on a working food brand content calendar ships 2 to 4 new recipes per week during the first 6 months and drops to 1 per week at maturity. Each recipe takes 4 to 6 hours to produce (write, test in the kitchen, photograph, schema author, publish). At 3 recipes per week, the brand hits 78 recipes inside 6 months plus a backlog of ingredient comparison and sourcing content queued behind the recipe production line.
| Content pillar | Target volume year 1 | Production cost per piece | Refresh cadence |
|---|---|---|---|
| Recipe hub | 40 to 100 recipes | $180 to $320 | Every 12 months |
| Ingredient comparison guides | 12 to 24 guides | $450 to $780 | Every 18 months |
| Sourcing story pages | 6 to 12 pages | $680 to $1,200 | Every 24 months |
| Buyer intent content | 8 to 16 pieces | $220 to $420 | Every 12 months |
Photography as a content calendar constraint
Photography is the actual constraint on recipe cadence, not writing. Every recipe needs 6 to 12 photos: hero shot, ingredient flat lay, prep in progress, plated result, storage, and step shots for the schema markup. A working food brand batches photography 8 recipes at a time to keep the cost per recipe under 200 dollars. Skip the batching and the per-recipe cost climbs to 400 to 600 dollars, which caps recipe cadence at 1 per week and slows organic ranking timeline by 6 months.
Seasonal content calendar planning
Seasonal content calendar planning maps recipes and comparison guides to the seasonal windows they need to rank in. A Christmas cookie recipe needs to publish in September to rank by early December. A Valentine’s chocolate guide needs to publish in November to rank by early February. A back-to-school lunchbox recipe needs to publish in June to rank by late August. The 60-to-90-day ranking curve dictates the calendar.
Creator syndication inside food brand content
Creator syndication on food brand content marketing amplifies the recipe hub through Instagram Reels, TikTok, and YouTube Shorts creators paid to post their own version of the brand’s hero recipes. The creator content pulls net-new audiences into the recipe hub through the creator’s Link in Bio or Amazon Storefront tag. The syndication calendar names 12 to 30 creators per quarter with specific recipes assigned to each.
One brand we picked up had a spreadsheet titled “creator outreach 2023” with 47 rows and 3 responses. All 3 responses were auto-replies. The spreadsheet named zero recipes and offered flat rates below 100 dollars per post. Nobody posts a 30-second video for 87 dollars flat. Nobody.
Creator content commercial terms that work
Working creator content commercial terms run 350 to 1,500 dollars flat per post plus a 12 to 25 percent commission on tagged sales across a 30-day window. The commission mechanic pulls creators into follow-up posts because the incremental revenue continues past the initial fee. Mid-tier creators (30k to 150k followers) hit the sweet spot for food brand content because their engagement rate typically runs 4 to 8 percent versus 0.8 to 1.6 percent on mega-creators.
Content brief structure for creator partnerships
The content brief structure for creator partnerships runs a single page: the SKU, the specific recipe or usage occasion, 3 required brand mentions, 3 restricted claims (no health claims on non-medical SKUs), the pricing angle, the affiliate link, and 3 example videos that hit the tone. The brief avoids over-scripting because over-scripted creator content underperforms native creator voice by 40 to 60 percent on engagement rate.
Buyer intent content for food brand blogs
Buyer intent content on food brand blogs covers 8 to 16 pieces targeting explicit purchase-decision queries: “where to buy [brand],” “[brand] subscription vs. one-time,” “best [category] for [use case],” and “[brand] gift bundle.” Every buyer intent piece runs 1,400 to 2,400 words with a comparison table, product cards, and a clear conversion path to the specific SKU that matches the query intent. Buyer intent content converts at 3 to 6 percent versus 1 to 2 percent on recipe content because the shopper landed already planning to buy, not exploring a usage occasion.
Where-to-buy content structure
Where-to-buy content structure covers online (DTC storefront, Amazon, Target.com, Whole Foods online), retail (specific chain locators with the store finder embedded), and international (customs limitations, retailer partners abroad). Every piece names specific retailers, links to the store locator, and includes an FAQ block covering shipping availability, subscription options, and gift card compatibility. Where-to-buy content ranks for branded discovery queries the DTC storefront otherwise loses to competitor affiliate reviews.
Subscription versus one-time comparison content
Subscription versus one-time comparison content converts subscription commitments at 3 to 6 percent because it addresses the price-sensitivity concern head-on with a specific math table. The piece covers the discount structure (15 percent lifetime), the skip-a-month mechanic, the pause-anytime rule, the cancellation policy, and the specific yearly savings for the brand’s average consumption cadence. Cross-reference the retention structure on our food and beverage marketing retainer page.
Content refresh cadence on food brand pillars
Content refresh cadence on food brand content pillars runs a rolling audit every 12 to 24 months by pillar. Recipes get refreshed every 12 months with new photography, updated schema, and any nutrition or ingredient adjustments. Ingredient comparison guides refresh every 18 months to update market data. Sourcing story pages refresh every 24 months to reflect farm partnership changes and new harvest angles. Buyer intent content refreshes every 12 months to update retailer availability and pricing.
Recipe refresh priority order
Recipe refresh priority runs by organic traffic rank. The top 20 recipes by monthly organic sessions get refreshed first (new photography, schema audit, related recipe internal links, updated nutrition). The next 40 get refreshed at 15 months. The remaining recipes get refreshed opportunistically when the ranking slips past position 15 in Google. Skipping the refresh cadence lets recipe rankings drift out of the top 3 inside 18 months as newer competitor recipes take the position.
Schema audit checklist per refresh
The schema audit checklist per refresh runs 8 items: Recipe schema completeness, aggregateRating count and accuracy, nutrition data accuracy, prepTime and cookTime match the recipe body, image URLs valid at CDN, related recipe internal links working, product card SKU URL live, and Google Search Console rich result eligibility validated. This checklist takes 20 minutes per recipe and prevents the schema drift that costs recipe rankings 20 to 40 positions quietly.
Reporting cadence for food brand content marketing
Reporting cadence on food brand content marketing runs a monthly executive report plus a quarterly business review. The monthly report ships in the first business week and covers organic sessions by pillar, top 10 ranking recipes with position trend, ingredient guide ranking movements, sourcing page performance, and organic-attributed DTC revenue. Every number carries a comparison to the prior month and a plain-language interpretation the founder reads in 7 minutes.
Metrics that matter for content marketing
Metrics that matter for food brand content marketing: organic sessions by pillar, recipe rich result impressions in Search Console, organic conversion rate to hero SKU pages, organic-attributed DTC revenue, and top 20 ranking positions by monthly organic sessions. Vanity metrics that do not matter: total pageviews without conversion context, average time on page without conversion attribution, and social share counts. The monthly report skips the vanity block entirely.
Quarterly business review structure
The quarterly business review runs 90 minutes with the founder, head of content, and SEO lead. Agenda: organic traffic trend by pillar, top 10 winning content pieces, top 10 losing content pieces (candidates for refresh or removal), competitive gap analysis against 5 named competitor brands, and next quarter’s content calendar with recipes and ingredient guides queued. According to Ahrefs content marketing research, brands running quarterly content audits outperform brands running annual audits by 40 to 70 percent on organic revenue over a 24-month window.
Internal linking discipline across food brand content
Internal linking discipline across food brand content moves authority from recipe pages toward hero SKU product pages and comparison guides. Every recipe links to the hero SKU it uses inline (once in the ingredient list, once in a bottom call-out card). Every ingredient comparison guide links to 3 to 6 recipes using the winning ingredient plus the hero SKU product page. Every sourcing story links to the 2 to 4 SKUs sourced from that specific farm or cooperative.
Anchor text strategy across recipe hubs
Anchor text on internal links varies across recipe hubs to avoid over-optimization patterns Google penalizes. Exact-match anchor (“single-origin Ethiopian coffee”) runs on 20 to 30 percent of internal links. Partial-match variations (“our Ethiopian roast”) run on 30 to 40 percent. Branded anchors (the SKU name) run on 20 to 30 percent. Generic anchors (“shop the coffee”) fill the remaining 10 to 20 percent. This ratio holds ranking without triggering the over-optimization penalty that shows up on brands that anchor-text-stuff every internal link with the same exact-match keyword. Cross-reference the linking layer on our food and beverage web design page.
Link equity from ingredient guides to SKU pages
Link equity from ingredient guides passes to SKU pages when the guide’s comparison table names the hero SKU in the winning column with a product card, and when the guide’s body links to 3 to 6 recipes that use the winning ingredient. This 3-hop path (guide to recipe to SKU) pushes authority from a high-traffic informational query down to a high-intent transactional page. According to Search Engine Land SEO coverage, informational content that internally links to transactional pages produces 2 to 4 times higher organic revenue than isolated content silos.
Wrapping up content marketing for food brands
Content marketing for food brands is the organic engine that turns a DTC snack, drink, or CPG storefront into a search-driven revenue channel. Recipe hub of 40 to 100 recipes. Ingredient comparison guides at 12 to 24 pieces. Sourcing story pages at 6 to 12 pieces. Buyer intent content at 8 to 16 pieces. Creator syndication calendar with 12 to 30 creators per quarter. Refresh cadence at 12 to 24 months by pillar. Reporting with organic sessions and organic revenue attribution.
If your DTC food brand is running paid social at 20,000 dollars monthly with a broken blog and zero recipe schema, professional content marketing for food brands pays for itself inside the first 90 days on organic traffic captured. Redefine Web ships content marketing inside our monthly retainer packages. Book a call and we will walk through the last three DTC food brands we built recipe hubs for, pillar by pillar.
Content marketing for food brands starts with a recipe hub because recipe queries account for 40 to 60 percent of high-intent search volume in the food category. Every hero SKU needs 4 to 12 recipes anchored to it, each targeting a specific occasion and audience.
Skip the recipe hub and the brand loses the search real estate that pulls DTC storefront traffic month over month at zero incremental paid cost. Recipe traffic converts at 2 to 4 percent because the shopper landed with usage intent, not passive discovery, which is why food brands win on recipes.
Recipe schema and Google rich result eligibility
Every recipe page ships schema.org Recipe markup including cookTime, prepTime, recipeIngredient, recipeInstructions, nutrition, and aggregateRating. Correctly marked-up recipes qualify for Google’s recipe rich result carousel that pulls 3 to 6 times higher click-through rate than a plain blue link. The schema layer takes 15 minutes per recipe to author and 30 minutes to validate in Google Search Console. Cross-reference the recipe search stack on our food and beverage SEO page.
Recipe hub structure that scales
The recipe hub structure runs 40 to 100 recipes at maturity, organized by hero SKU (4 to 12 recipes per SKU) plus occasion tags (breakfast, weeknight dinner, meal prep, brunch, holiday). Every recipe links back to the hero SKU product page with the SKU embedded in an inline card. The hub earns internal linking value from ingredient comparison guides and the sourcing story pages, which feeds recipe ranking on Google. According to Google Search Central recipe structured data guidance, complete Recipe schema markup is required for eligibility in the recipe carousel and the ingredient search filter.
Pillar structure for food brand content marketing
The pillar structure on content marketing for food brands runs 4 content pillars concurrently: recipe hub (40 to 100 recipes), ingredient comparison guides (12 to 24 guides), sourcing story pages (6 to 12 pages), and buyer intent content (where to buy, subscription vs. one-time, gift bundle guides). Every pillar covers a distinct search intent and every pillar links back to the hero SKU product pages.
Ingredient comparison guide format
Ingredient comparison guides run 1,800 to 3,200 words comparing 2 to 4 ingredient types on 6 to 10 attributes with a comparison table, real-world use case examples, and links to the hero SKU that uses the specific ingredient. Example: organic vs. conventional oats compares nutritional profile, sourcing chain, cost, environmental impact, and taste on a 6-column table. The brand’s SKU appears in the winning column with a product card. These guides rank 3 to 8 months after publication and pull steady-state organic traffic.
Sourcing story pages that build trust
Sourcing story pages name the specific farms, cooperatives, or suppliers the brand sources from, with photos of the farms, farmer quotes, and specific harvest windows. A coffee brand’s Ethiopian farm page ranks for “single-origin Ethiopian coffee” and “Yirgacheffe coffee origin” plus 40 long-tail variations. The sourcing page pulls trust-building traffic that converts at 4 to 6 percent because the shopper landed pattern-matching on transparency and named provenance. Every sourcing page includes farmer or cooperative quotes, harvest dates, and a link back to 3 to 5 hero SKU pages that source from the named supplier.
Vejrø hospitality content case study
Vejrø Resort, a Danish private-island destination with an on-site restaurant focused on organic, locally sourced cuisine, joined us with strong social engagement and no organic-search real estate. Guests found the resort on Instagram but never in Google search for terms like “private island resort Denmark,” “farm-to-table hospitality Denmark,” or “Vejrø restaurant.” The same organic-search gap shows up on DTC food brands running paid social at 20,000 dollars monthly with a broken blog and zero recipe schema.
We built the conversion-focused website with on-site and off-site SEO tuned to the travel-niche keyword clusters, competitor analysis against comparable boutique resorts, and mobile-first design prioritizing guest discovery. Every page carried the structured data qualifying it for Google’s rich results in the hospitality category. Every internal link pushed authority toward the direct-booking conversion path.
Three months later, Vejrø hit 10,000 plus organic visitors, ranked for 200 plus first-page keywords, and pulled a 2.2 percent booking conversion rate from organic traffic. The same pattern applies to content marketing for food brands: recipe schema, ingredient comparison guides, and sourcing story pages pull organic traffic at 20 to 40 percent conversion into hero SKU pages inside 6 months when the content quality matches search intent and every page carries the right structured data markup. Vejrø also proved out the reporting discipline: every monthly report named the exact page, the exact keyword cluster, and the exact search feature (rich result, sitelinks, image pack) driving the incremental organic revenue instead of hiding behind aggregate traffic charts.
Recipe cadence and content calendar for food brands
Recipe cadence on a working food brand content calendar ships 2 to 4 new recipes per week during the first 6 months and drops to 1 per week at maturity. Each recipe takes 4 to 6 hours to produce (write, test in the kitchen, photograph, schema author, publish). At 3 recipes per week, the brand hits 78 recipes inside 6 months plus a backlog of ingredient comparison and sourcing content queued behind the recipe production line.
| Content pillar | Target volume year 1 | Production cost per piece | Refresh cadence |
|---|---|---|---|
| Recipe hub | 40 to 100 recipes | $180 to $320 | Every 12 months |
| Ingredient comparison guides | 12 to 24 guides | $450 to $780 | Every 18 months |
| Sourcing story pages | 6 to 12 pages | $680 to $1,200 | Every 24 months |
| Buyer intent content | 8 to 16 pieces | $220 to $420 | Every 12 months |
Photography as a content calendar constraint
Photography is the actual constraint on recipe cadence, not writing. Every recipe needs 6 to 12 photos: hero shot, ingredient flat lay, prep in progress, plated result, storage, and step shots for the schema markup. A working food brand batches photography 8 recipes at a time to keep the cost per recipe under 200 dollars. Skip the batching and the per-recipe cost climbs to 400 to 600 dollars, which caps recipe cadence at 1 per week and slows organic ranking timeline by 6 months.
Seasonal content calendar planning
Seasonal content calendar planning maps recipes and comparison guides to the seasonal windows they need to rank in. A Christmas cookie recipe needs to publish in September to rank by early December. A Valentine’s chocolate guide needs to publish in November to rank by early February. A back-to-school lunchbox recipe needs to publish in June to rank by late August. The 60-to-90-day ranking curve dictates the calendar.
Creator syndication inside food brand content
Creator syndication on food brand content marketing amplifies the recipe hub through Instagram Reels, TikTok, and YouTube Shorts creators paid to post their own version of the brand’s hero recipes. The creator content pulls net-new audiences into the recipe hub through the creator’s Link in Bio or Amazon Storefront tag. The syndication calendar names 12 to 30 creators per quarter with specific recipes assigned to each.
One brand we picked up had a spreadsheet titled “creator outreach 2023” with 47 rows and 3 responses. All 3 responses were auto-replies. The spreadsheet named zero recipes and offered flat rates below 100 dollars per post. Nobody posts a 30-second video for 87 dollars flat. Nobody.
Creator content commercial terms that work
Working creator content commercial terms run 350 to 1,500 dollars flat per post plus a 12 to 25 percent commission on tagged sales across a 30-day window. The commission mechanic pulls creators into follow-up posts because the incremental revenue continues past the initial fee. Mid-tier creators (30k to 150k followers) hit the sweet spot for food brand content because their engagement rate typically runs 4 to 8 percent versus 0.8 to 1.6 percent on mega-creators.
Content brief structure for creator partnerships
The content brief structure for creator partnerships runs a single page: the SKU, the specific recipe or usage occasion, 3 required brand mentions, 3 restricted claims (no health claims on non-medical SKUs), the pricing angle, the affiliate link, and 3 example videos that hit the tone. The brief avoids over-scripting because over-scripted creator content underperforms native creator voice by 40 to 60 percent on engagement rate.
Buyer intent content for food brand blogs
Buyer intent content on food brand blogs covers 8 to 16 pieces targeting explicit purchase-decision queries: “where to buy [brand],” “[brand] subscription vs. one-time,” “best [category] for [use case],” and “[brand] gift bundle.” Every buyer intent piece runs 1,400 to 2,400 words with a comparison table, product cards, and a clear conversion path to the specific SKU that matches the query intent. Buyer intent content converts at 3 to 6 percent versus 1 to 2 percent on recipe content because the shopper landed already planning to buy, not exploring a usage occasion.
Where-to-buy content structure
Where-to-buy content structure covers online (DTC storefront, Amazon, Target.com, Whole Foods online), retail (specific chain locators with the store finder embedded), and international (customs limitations, retailer partners abroad). Every piece names specific retailers, links to the store locator, and includes an FAQ block covering shipping availability, subscription options, and gift card compatibility. Where-to-buy content ranks for branded discovery queries the DTC storefront otherwise loses to competitor affiliate reviews.
Subscription versus one-time comparison content
Subscription versus one-time comparison content converts subscription commitments at 3 to 6 percent because it addresses the price-sensitivity concern head-on with a specific math table. The piece covers the discount structure (15 percent lifetime), the skip-a-month mechanic, the pause-anytime rule, the cancellation policy, and the specific yearly savings for the brand’s average consumption cadence. Cross-reference the retention structure on our food and beverage marketing retainer page.
Content refresh cadence on food brand pillars
Content refresh cadence on food brand content pillars runs a rolling audit every 12 to 24 months by pillar. Recipes get refreshed every 12 months with new photography, updated schema, and any nutrition or ingredient adjustments. Ingredient comparison guides refresh every 18 months to update market data. Sourcing story pages refresh every 24 months to reflect farm partnership changes and new harvest angles. Buyer intent content refreshes every 12 months to update retailer availability and pricing.
Recipe refresh priority order
Recipe refresh priority runs by organic traffic rank. The top 20 recipes by monthly organic sessions get refreshed first (new photography, schema audit, related recipe internal links, updated nutrition). The next 40 get refreshed at 15 months. The remaining recipes get refreshed opportunistically when the ranking slips past position 15 in Google. Skipping the refresh cadence lets recipe rankings drift out of the top 3 inside 18 months as newer competitor recipes take the position.
Schema audit checklist per refresh
The schema audit checklist per refresh runs 8 items: Recipe schema completeness, aggregateRating count and accuracy, nutrition data accuracy, prepTime and cookTime match the recipe body, image URLs valid at CDN, related recipe internal links working, product card SKU URL live, and Google Search Console rich result eligibility validated. This checklist takes 20 minutes per recipe and prevents the schema drift that costs recipe rankings 20 to 40 positions quietly.
Reporting cadence for food brand content marketing
Reporting cadence on food brand content marketing runs a monthly executive report plus a quarterly business review. The monthly report ships in the first business week and covers organic sessions by pillar, top 10 ranking recipes with position trend, ingredient guide ranking movements, sourcing page performance, and organic-attributed DTC revenue. Every number carries a comparison to the prior month and a plain-language interpretation the founder reads in 7 minutes.
Metrics that matter for content marketing
Metrics that matter for food brand content marketing: organic sessions by pillar, recipe rich result impressions in Search Console, organic conversion rate to hero SKU pages, organic-attributed DTC revenue, and top 20 ranking positions by monthly organic sessions. Vanity metrics that do not matter: total pageviews without conversion context, average time on page without conversion attribution, and social share counts. The monthly report skips the vanity block entirely.
Quarterly business review structure
The quarterly business review runs 90 minutes with the founder, head of content, and SEO lead. Agenda: organic traffic trend by pillar, top 10 winning content pieces, top 10 losing content pieces (candidates for refresh or removal), competitive gap analysis against 5 named competitor brands, and next quarter’s content calendar with recipes and ingredient guides queued. According to Ahrefs content marketing research, brands running quarterly content audits outperform brands running annual audits by 40 to 70 percent on organic revenue over a 24-month window.
Internal linking discipline across food brand content
Internal linking discipline across food brand content moves authority from recipe pages toward hero SKU product pages and comparison guides. Every recipe links to the hero SKU it uses inline (once in the ingredient list, once in a bottom call-out card). Every ingredient comparison guide links to 3 to 6 recipes using the winning ingredient plus the hero SKU product page. Every sourcing story links to the 2 to 4 SKUs sourced from that specific farm or cooperative.
Anchor text strategy across recipe hubs
Anchor text on internal links varies across recipe hubs to avoid over-optimization patterns Google penalizes. Exact-match anchor (“single-origin Ethiopian coffee”) runs on 20 to 30 percent of internal links. Partial-match variations (“our Ethiopian roast”) run on 30 to 40 percent. Branded anchors (the SKU name) run on 20 to 30 percent. Generic anchors (“shop the coffee”) fill the remaining 10 to 20 percent. This ratio holds ranking without triggering the over-optimization penalty that shows up on brands that anchor-text-stuff every internal link with the same exact-match keyword. Cross-reference the linking layer on our food and beverage web design page.
Link equity from ingredient guides to SKU pages
Link equity from ingredient guides passes to SKU pages when the guide’s comparison table names the hero SKU in the winning column with a product card, and when the guide’s body links to 3 to 6 recipes that use the winning ingredient. This 3-hop path (guide to recipe to SKU) pushes authority from a high-traffic informational query down to a high-intent transactional page. According to Search Engine Land SEO coverage, informational content that internally links to transactional pages produces 2 to 4 times higher organic revenue than isolated content silos.
Wrapping up content marketing for food brands
Content marketing for food brands is the organic engine that turns a DTC snack, drink, or CPG storefront into a search-driven revenue channel. Recipe hub of 40 to 100 recipes. Ingredient comparison guides at 12 to 24 pieces. Sourcing story pages at 6 to 12 pieces. Buyer intent content at 8 to 16 pieces. Creator syndication calendar with 12 to 30 creators per quarter. Refresh cadence at 12 to 24 months by pillar. Reporting with organic sessions and organic revenue attribution.
If your DTC food brand is running paid social at 20,000 dollars monthly with a broken blog and zero recipe schema, professional content marketing for food brands pays for itself inside the first 90 days on organic traffic captured. Redefine Web ships content marketing inside our monthly retainer packages. Book a call and we will walk through the last three DTC food brands we built recipe hubs for, pillar by pillar.
Content marketing for food brands starts with a recipe hub because recipe queries account for 40 to 60 percent of high-intent search volume in the food category. Every hero SKU needs 4 to 12 recipes anchored to it, each targeting a specific occasion and audience.
Skip the recipe hub and the brand loses the search real estate that pulls DTC storefront traffic month over month at zero incremental paid cost. Recipe traffic converts at 2 to 4 percent because the shopper landed with usage intent, not passive discovery, which is why food brands win on recipes.
Recipe schema and Google rich result eligibility
Every recipe page ships schema.org Recipe markup including cookTime, prepTime, recipeIngredient, recipeInstructions, nutrition, and aggregateRating. Correctly marked-up recipes qualify for Google’s recipe rich result carousel that pulls 3 to 6 times higher click-through rate than a plain blue link. The schema layer takes 15 minutes per recipe to author and 30 minutes to validate in Google Search Console. Cross-reference the recipe search stack on our food and beverage SEO page.
Recipe hub structure that scales
The recipe hub structure runs 40 to 100 recipes at maturity, organized by hero SKU (4 to 12 recipes per SKU) plus occasion tags (breakfast, weeknight dinner, meal prep, brunch, holiday). Every recipe links back to the hero SKU product page with the SKU embedded in an inline card. The hub earns internal linking value from ingredient comparison guides and the sourcing story pages, which feeds recipe ranking on Google. According to Google Search Central recipe structured data guidance, complete Recipe schema markup is required for eligibility in the recipe carousel and the ingredient search filter.
Pillar structure for food brand content marketing
The pillar structure on content marketing for food brands runs 4 content pillars concurrently: recipe hub (40 to 100 recipes), ingredient comparison guides (12 to 24 guides), sourcing story pages (6 to 12 pages), and buyer intent content (where to buy, subscription vs. one-time, gift bundle guides). Every pillar covers a distinct search intent and every pillar links back to the hero SKU product pages.
Ingredient comparison guide format
Ingredient comparison guides run 1,800 to 3,200 words comparing 2 to 4 ingredient types on 6 to 10 attributes with a comparison table, real-world use case examples, and links to the hero SKU that uses the specific ingredient. Example: organic vs. conventional oats compares nutritional profile, sourcing chain, cost, environmental impact, and taste on a 6-column table. The brand’s SKU appears in the winning column with a product card. These guides rank 3 to 8 months after publication and pull steady-state organic traffic.
Sourcing story pages that build trust
Sourcing story pages name the specific farms, cooperatives, or suppliers the brand sources from, with photos of the farms, farmer quotes, and specific harvest windows. A coffee brand’s Ethiopian farm page ranks for “single-origin Ethiopian coffee” and “Yirgacheffe coffee origin” plus 40 long-tail variations. The sourcing page pulls trust-building traffic that converts at 4 to 6 percent because the shopper landed pattern-matching on transparency and named provenance. Every sourcing page includes farmer or cooperative quotes, harvest dates, and a link back to 3 to 5 hero SKU pages that source from the named supplier.
Vejrø hospitality content case study
Vejrø Resort, a Danish private-island destination with an on-site restaurant focused on organic, locally sourced cuisine, joined us with strong social engagement and no organic-search real estate. Guests found the resort on Instagram but never in Google search for terms like “private island resort Denmark,” “farm-to-table hospitality Denmark,” or “Vejrø restaurant.” The same organic-search gap shows up on DTC food brands running paid social at 20,000 dollars monthly with a broken blog and zero recipe schema.
We built the conversion-focused website with on-site and off-site SEO tuned to the travel-niche keyword clusters, competitor analysis against comparable boutique resorts, and mobile-first design prioritizing guest discovery. Every page carried the structured data qualifying it for Google’s rich results in the hospitality category. Every internal link pushed authority toward the direct-booking conversion path.
Three months later, Vejrø hit 10,000 plus organic visitors, ranked for 200 plus first-page keywords, and pulled a 2.2 percent booking conversion rate from organic traffic. The same pattern applies to content marketing for food brands: recipe schema, ingredient comparison guides, and sourcing story pages pull organic traffic at 20 to 40 percent conversion into hero SKU pages inside 6 months when the content quality matches search intent and every page carries the right structured data markup. Vejrø also proved out the reporting discipline: every monthly report named the exact page, the exact keyword cluster, and the exact search feature (rich result, sitelinks, image pack) driving the incremental organic revenue instead of hiding behind aggregate traffic charts.
Recipe cadence and content calendar for food brands
Recipe cadence on a working food brand content calendar ships 2 to 4 new recipes per week during the first 6 months and drops to 1 per week at maturity. Each recipe takes 4 to 6 hours to produce (write, test in the kitchen, photograph, schema author, publish). At 3 recipes per week, the brand hits 78 recipes inside 6 months plus a backlog of ingredient comparison and sourcing content queued behind the recipe production line.
| Content pillar | Target volume year 1 | Production cost per piece | Refresh cadence |
|---|---|---|---|
| Recipe hub | 40 to 100 recipes | $180 to $320 | Every 12 months |
| Ingredient comparison guides | 12 to 24 guides | $450 to $780 | Every 18 months |
| Sourcing story pages | 6 to 12 pages | $680 to $1,200 | Every 24 months |
| Buyer intent content | 8 to 16 pieces | $220 to $420 | Every 12 months |
Photography as a content calendar constraint
Photography is the actual constraint on recipe cadence, not writing. Every recipe needs 6 to 12 photos: hero shot, ingredient flat lay, prep in progress, plated result, storage, and step shots for the schema markup. A working food brand batches photography 8 recipes at a time to keep the cost per recipe under 200 dollars. Skip the batching and the per-recipe cost climbs to 400 to 600 dollars, which caps recipe cadence at 1 per week and slows organic ranking timeline by 6 months.
Seasonal content calendar planning
Seasonal content calendar planning maps recipes and comparison guides to the seasonal windows they need to rank in. A Christmas cookie recipe needs to publish in September to rank by early December. A Valentine’s chocolate guide needs to publish in November to rank by early February. A back-to-school lunchbox recipe needs to publish in June to rank by late August. The 60-to-90-day ranking curve dictates the calendar.
Creator syndication inside food brand content
Creator syndication on food brand content marketing amplifies the recipe hub through Instagram Reels, TikTok, and YouTube Shorts creators paid to post their own version of the brand’s hero recipes. The creator content pulls net-new audiences into the recipe hub through the creator’s Link in Bio or Amazon Storefront tag. The syndication calendar names 12 to 30 creators per quarter with specific recipes assigned to each.
One brand we picked up had a spreadsheet titled “creator outreach 2023” with 47 rows and 3 responses. All 3 responses were auto-replies. The spreadsheet named zero recipes and offered flat rates below 100 dollars per post. Nobody posts a 30-second video for 87 dollars flat. Nobody.
Creator content commercial terms that work
Working creator content commercial terms run 350 to 1,500 dollars flat per post plus a 12 to 25 percent commission on tagged sales across a 30-day window. The commission mechanic pulls creators into follow-up posts because the incremental revenue continues past the initial fee. Mid-tier creators (30k to 150k followers) hit the sweet spot for food brand content because their engagement rate typically runs 4 to 8 percent versus 0.8 to 1.6 percent on mega-creators.
Content brief structure for creator partnerships
The content brief structure for creator partnerships runs a single page: the SKU, the specific recipe or usage occasion, 3 required brand mentions, 3 restricted claims (no health claims on non-medical SKUs), the pricing angle, the affiliate link, and 3 example videos that hit the tone. The brief avoids over-scripting because over-scripted creator content underperforms native creator voice by 40 to 60 percent on engagement rate.
Buyer intent content for food brand blogs
Buyer intent content on food brand blogs covers 8 to 16 pieces targeting explicit purchase-decision queries: “where to buy [brand],” “[brand] subscription vs. one-time,” “best [category] for [use case],” and “[brand] gift bundle.” Every buyer intent piece runs 1,400 to 2,400 words with a comparison table, product cards, and a clear conversion path to the specific SKU that matches the query intent. Buyer intent content converts at 3 to 6 percent versus 1 to 2 percent on recipe content because the shopper landed already planning to buy, not exploring a usage occasion.
Where-to-buy content structure
Where-to-buy content structure covers online (DTC storefront, Amazon, Target.com, Whole Foods online), retail (specific chain locators with the store finder embedded), and international (customs limitations, retailer partners abroad). Every piece names specific retailers, links to the store locator, and includes an FAQ block covering shipping availability, subscription options, and gift card compatibility. Where-to-buy content ranks for branded discovery queries the DTC storefront otherwise loses to competitor affiliate reviews.
Subscription versus one-time comparison content
Subscription versus one-time comparison content converts subscription commitments at 3 to 6 percent because it addresses the price-sensitivity concern head-on with a specific math table. The piece covers the discount structure (15 percent lifetime), the skip-a-month mechanic, the pause-anytime rule, the cancellation policy, and the specific yearly savings for the brand’s average consumption cadence. Cross-reference the retention structure on our food and beverage marketing retainer page.
Content refresh cadence on food brand pillars
Content refresh cadence on food brand content pillars runs a rolling audit every 12 to 24 months by pillar. Recipes get refreshed every 12 months with new photography, updated schema, and any nutrition or ingredient adjustments. Ingredient comparison guides refresh every 18 months to update market data. Sourcing story pages refresh every 24 months to reflect farm partnership changes and new harvest angles. Buyer intent content refreshes every 12 months to update retailer availability and pricing.
Recipe refresh priority order
Recipe refresh priority runs by organic traffic rank. The top 20 recipes by monthly organic sessions get refreshed first (new photography, schema audit, related recipe internal links, updated nutrition). The next 40 get refreshed at 15 months. The remaining recipes get refreshed opportunistically when the ranking slips past position 15 in Google. Skipping the refresh cadence lets recipe rankings drift out of the top 3 inside 18 months as newer competitor recipes take the position.
Schema audit checklist per refresh
The schema audit checklist per refresh runs 8 items: Recipe schema completeness, aggregateRating count and accuracy, nutrition data accuracy, prepTime and cookTime match the recipe body, image URLs valid at CDN, related recipe internal links working, product card SKU URL live, and Google Search Console rich result eligibility validated. This checklist takes 20 minutes per recipe and prevents the schema drift that costs recipe rankings 20 to 40 positions quietly.
Reporting cadence for food brand content marketing
Reporting cadence on food brand content marketing runs a monthly executive report plus a quarterly business review. The monthly report ships in the first business week and covers organic sessions by pillar, top 10 ranking recipes with position trend, ingredient guide ranking movements, sourcing page performance, and organic-attributed DTC revenue. Every number carries a comparison to the prior month and a plain-language interpretation the founder reads in 7 minutes.
Metrics that matter for content marketing
Metrics that matter for food brand content marketing: organic sessions by pillar, recipe rich result impressions in Search Console, organic conversion rate to hero SKU pages, organic-attributed DTC revenue, and top 20 ranking positions by monthly organic sessions. Vanity metrics that do not matter: total pageviews without conversion context, average time on page without conversion attribution, and social share counts. The monthly report skips the vanity block entirely.
Quarterly business review structure
The quarterly business review runs 90 minutes with the founder, head of content, and SEO lead. Agenda: organic traffic trend by pillar, top 10 winning content pieces, top 10 losing content pieces (candidates for refresh or removal), competitive gap analysis against 5 named competitor brands, and next quarter’s content calendar with recipes and ingredient guides queued. According to Ahrefs content marketing research, brands running quarterly content audits outperform brands running annual audits by 40 to 70 percent on organic revenue over a 24-month window.
Internal linking discipline across food brand content
Internal linking discipline across food brand content moves authority from recipe pages toward hero SKU product pages and comparison guides. Every recipe links to the hero SKU it uses inline (once in the ingredient list, once in a bottom call-out card). Every ingredient comparison guide links to 3 to 6 recipes using the winning ingredient plus the hero SKU product page. Every sourcing story links to the 2 to 4 SKUs sourced from that specific farm or cooperative.
Anchor text strategy across recipe hubs
Anchor text on internal links varies across recipe hubs to avoid over-optimization patterns Google penalizes. Exact-match anchor (“single-origin Ethiopian coffee”) runs on 20 to 30 percent of internal links. Partial-match variations (“our Ethiopian roast”) run on 30 to 40 percent. Branded anchors (the SKU name) run on 20 to 30 percent. Generic anchors (“shop the coffee”) fill the remaining 10 to 20 percent. This ratio holds ranking without triggering the over-optimization penalty that shows up on brands that anchor-text-stuff every internal link with the same exact-match keyword. Cross-reference the linking layer on our food and beverage web design page.
Link equity from ingredient guides to SKU pages
Link equity from ingredient guides passes to SKU pages when the guide’s comparison table names the hero SKU in the winning column with a product card, and when the guide’s body links to 3 to 6 recipes that use the winning ingredient. This 3-hop path (guide to recipe to SKU) pushes authority from a high-traffic informational query down to a high-intent transactional page. According to Search Engine Land SEO coverage, informational content that internally links to transactional pages produces 2 to 4 times higher organic revenue than isolated content silos.
Wrapping up content marketing for food brands
Content marketing for food brands is the organic engine that turns a DTC snack, drink, or CPG storefront into a search-driven revenue channel. Recipe hub of 40 to 100 recipes. Ingredient comparison guides at 12 to 24 pieces. Sourcing story pages at 6 to 12 pieces. Buyer intent content at 8 to 16 pieces. Creator syndication calendar with 12 to 30 creators per quarter. Refresh cadence at 12 to 24 months by pillar. Reporting with organic sessions and organic revenue attribution.
If your DTC food brand is running paid social at 20,000 dollars monthly with a broken blog and zero recipe schema, professional content marketing for food brands pays for itself inside the first 90 days on organic traffic captured. Redefine Web ships content marketing inside our monthly retainer packages. Book a call and we will walk through the last three DTC food brands we built recipe hubs for, pillar by pillar.
Anchor text on internal links varies across recipe hubs to avoid over-optimization patterns Google penalizes. Exact-match anchor (“single-origin Ethiopian coffee”) runs on 20 to 30 percent of internal links. Partial-match variations (“our Ethiopian roast”) run on 30 to 40 percent. Branded anchors (the SKU name) run on 20 to 30 percent. Generic anchors (“shop the coffee”) fill the remaining 10 to 20 percent. This ratio holds ranking without triggering the over-optimization penalty that shows up on brands that anchor-text-stuff every internal link with the same exact-match keyword. Cross-reference the linking layer on our food and beverage web design page.
Link equity from ingredient guides to SKU pages
Link equity from ingredient guides passes to SKU pages when the guide’s comparison table names the hero SKU in the winning column with a product card, and when the guide’s body links to 3 to 6 recipes that use the winning ingredient. This 3-hop path (guide to recipe to SKU) pushes authority from a high-traffic informational query down to a high-intent transactional page. According to Search Engine Land SEO coverage, informational content that internally links to transactional pages produces 2 to 4 times higher organic revenue than isolated content silos.
Wrapping up content marketing for food brands
Content marketing for food brands is the organic engine that turns a DTC snack, drink, or CPG storefront into a search-driven revenue channel. Recipe hub of 40 to 100 recipes. Ingredient comparison guides at 12 to 24 pieces. Sourcing story pages at 6 to 12 pieces. Buyer intent content at 8 to 16 pieces. Creator syndication calendar with 12 to 30 creators per quarter. Refresh cadence at 12 to 24 months by pillar. Reporting with organic sessions and organic revenue attribution.
If your DTC food brand is running paid social at 20,000 dollars monthly with a broken blog and zero recipe schema, professional content marketing for food brands pays for itself inside the first 90 days on organic traffic captured. Redefine Web ships content marketing inside our monthly retainer packages. Book a call and we will walk through the last three DTC food brands we built recipe hubs for, pillar by pillar.
Content marketing for food brands starts with a recipe hub because recipe queries account for 40 to 60 percent of high-intent search volume in the food category. Every hero SKU needs 4 to 12 recipes anchored to it, each targeting a specific occasion and audience.
Skip the recipe hub and the brand loses the search real estate that pulls DTC storefront traffic month over month at zero incremental paid cost. Recipe traffic converts at 2 to 4 percent because the shopper landed with usage intent, not passive discovery, which is why food brands win on recipes.
Recipe schema and Google rich result eligibility
Every recipe page ships schema.org Recipe markup including cookTime, prepTime, recipeIngredient, recipeInstructions, nutrition, and aggregateRating. Correctly marked-up recipes qualify for Google’s recipe rich result carousel that pulls 3 to 6 times higher click-through rate than a plain blue link. The schema layer takes 15 minutes per recipe to author and 30 minutes to validate in Google Search Console. Cross-reference the recipe search stack on our food and beverage SEO page.
Recipe hub structure that scales
The recipe hub structure runs 40 to 100 recipes at maturity, organized by hero SKU (4 to 12 recipes per SKU) plus occasion tags (breakfast, weeknight dinner, meal prep, brunch, holiday). Every recipe links back to the hero SKU product page with the SKU embedded in an inline card. The hub earns internal linking value from ingredient comparison guides and the sourcing story pages, which feeds recipe ranking on Google. According to Google Search Central recipe structured data guidance, complete Recipe schema markup is required for eligibility in the recipe carousel and the ingredient search filter.
Pillar structure for food brand content marketing
The pillar structure on content marketing for food brands runs 4 content pillars concurrently: recipe hub (40 to 100 recipes), ingredient comparison guides (12 to 24 guides), sourcing story pages (6 to 12 pages), and buyer intent content (where to buy, subscription vs. one-time, gift bundle guides). Every pillar covers a distinct search intent and every pillar links back to the hero SKU product pages.
Ingredient comparison guide format
Ingredient comparison guides run 1,800 to 3,200 words comparing 2 to 4 ingredient types on 6 to 10 attributes with a comparison table, real-world use case examples, and links to the hero SKU that uses the specific ingredient. Example: organic vs. conventional oats compares nutritional profile, sourcing chain, cost, environmental impact, and taste on a 6-column table. The brand’s SKU appears in the winning column with a product card. These guides rank 3 to 8 months after publication and pull steady-state organic traffic.
Sourcing story pages that build trust
Sourcing story pages name the specific farms, cooperatives, or suppliers the brand sources from, with photos of the farms, farmer quotes, and specific harvest windows. A coffee brand’s Ethiopian farm page ranks for “single-origin Ethiopian coffee” and “Yirgacheffe coffee origin” plus 40 long-tail variations. The sourcing page pulls trust-building traffic that converts at 4 to 6 percent because the shopper landed pattern-matching on transparency and named provenance. Every sourcing page includes farmer or cooperative quotes, harvest dates, and a link back to 3 to 5 hero SKU pages that source from the named supplier.
Vejrø hospitality content case study
Vejrø Resort, a Danish private-island destination with an on-site restaurant focused on organic, locally sourced cuisine, joined us with strong social engagement and no organic-search real estate. Guests found the resort on Instagram but never in Google search for terms like “private island resort Denmark,” “farm-to-table hospitality Denmark,” or “Vejrø restaurant.” The same organic-search gap shows up on DTC food brands running paid social at 20,000 dollars monthly with a broken blog and zero recipe schema.
We built the conversion-focused website with on-site and off-site SEO tuned to the travel-niche keyword clusters, competitor analysis against comparable boutique resorts, and mobile-first design prioritizing guest discovery. Every page carried the structured data qualifying it for Google’s rich results in the hospitality category. Every internal link pushed authority toward the direct-booking conversion path.
Three months later, Vejrø hit 10,000 plus organic visitors, ranked for 200 plus first-page keywords, and pulled a 2.2 percent booking conversion rate from organic traffic. The same pattern applies to content marketing for food brands: recipe schema, ingredient comparison guides, and sourcing story pages pull organic traffic at 20 to 40 percent conversion into hero SKU pages inside 6 months when the content quality matches search intent and every page carries the right structured data markup. Vejrø also proved out the reporting discipline: every monthly report named the exact page, the exact keyword cluster, and the exact search feature (rich result, sitelinks, image pack) driving the incremental organic revenue instead of hiding behind aggregate traffic charts.
Recipe cadence and content calendar for food brands
Recipe cadence on a working food brand content calendar ships 2 to 4 new recipes per week during the first 6 months and drops to 1 per week at maturity. Each recipe takes 4 to 6 hours to produce (write, test in the kitchen, photograph, schema author, publish). At 3 recipes per week, the brand hits 78 recipes inside 6 months plus a backlog of ingredient comparison and sourcing content queued behind the recipe production line.
| Content pillar | Target volume year 1 | Production cost per piece | Refresh cadence |
|---|---|---|---|
| Recipe hub | 40 to 100 recipes | $180 to $320 | Every 12 months |
| Ingredient comparison guides | 12 to 24 guides | $450 to $780 | Every 18 months |
| Sourcing story pages | 6 to 12 pages | $680 to $1,200 | Every 24 months |
| Buyer intent content | 8 to 16 pieces | $220 to $420 | Every 12 months |
Photography as a content calendar constraint
Photography is the actual constraint on recipe cadence, not writing. Every recipe needs 6 to 12 photos: hero shot, ingredient flat lay, prep in progress, plated result, storage, and step shots for the schema markup. A working food brand batches photography 8 recipes at a time to keep the cost per recipe under 200 dollars. Skip the batching and the per-recipe cost climbs to 400 to 600 dollars, which caps recipe cadence at 1 per week and slows organic ranking timeline by 6 months.
Seasonal content calendar planning
Seasonal content calendar planning maps recipes and comparison guides to the seasonal windows they need to rank in. A Christmas cookie recipe needs to publish in September to rank by early December. A Valentine’s chocolate guide needs to publish in November to rank by early February. A back-to-school lunchbox recipe needs to publish in June to rank by late August. The 60-to-90-day ranking curve dictates the calendar.
Creator syndication inside food brand content
Creator syndication on food brand content marketing amplifies the recipe hub through Instagram Reels, TikTok, and YouTube Shorts creators paid to post their own version of the brand’s hero recipes. The creator content pulls net-new audiences into the recipe hub through the creator’s Link in Bio or Amazon Storefront tag. The syndication calendar names 12 to 30 creators per quarter with specific recipes assigned to each.
One brand we picked up had a spreadsheet titled “creator outreach 2023” with 47 rows and 3 responses. All 3 responses were auto-replies. The spreadsheet named zero recipes and offered flat rates below 100 dollars per post. Nobody posts a 30-second video for 87 dollars flat. Nobody.
Creator content commercial terms that work
Working creator content commercial terms run 350 to 1,500 dollars flat per post plus a 12 to 25 percent commission on tagged sales across a 30-day window. The commission mechanic pulls creators into follow-up posts because the incremental revenue continues past the initial fee. Mid-tier creators (30k to 150k followers) hit the sweet spot for food brand content because their engagement rate typically runs 4 to 8 percent versus 0.8 to 1.6 percent on mega-creators.
Content brief structure for creator partnerships
The content brief structure for creator partnerships runs a single page: the SKU, the specific recipe or usage occasion, 3 required brand mentions, 3 restricted claims (no health claims on non-medical SKUs), the pricing angle, the affiliate link, and 3 example videos that hit the tone. The brief avoids over-scripting because over-scripted creator content underperforms native creator voice by 40 to 60 percent on engagement rate.
Buyer intent content for food brand blogs
Buyer intent content on food brand blogs covers 8 to 16 pieces targeting explicit purchase-decision queries: “where to buy [brand],” “[brand] subscription vs. one-time,” “best [category] for [use case],” and “[brand] gift bundle.” Every buyer intent piece runs 1,400 to 2,400 words with a comparison table, product cards, and a clear conversion path to the specific SKU that matches the query intent. Buyer intent content converts at 3 to 6 percent versus 1 to 2 percent on recipe content because the shopper landed already planning to buy, not exploring a usage occasion.
Where-to-buy content structure
Where-to-buy content structure covers online (DTC storefront, Amazon, Target.com, Whole Foods online), retail (specific chain locators with the store finder embedded), and international (customs limitations, retailer partners abroad). Every piece names specific retailers, links to the store locator, and includes an FAQ block covering shipping availability, subscription options, and gift card compatibility. Where-to-buy content ranks for branded discovery queries the DTC storefront otherwise loses to competitor affiliate reviews.
Subscription versus one-time comparison content
Subscription versus one-time comparison content converts subscription commitments at 3 to 6 percent because it addresses the price-sensitivity concern head-on with a specific math table. The piece covers the discount structure (15 percent lifetime), the skip-a-month mechanic, the pause-anytime rule, the cancellation policy, and the specific yearly savings for the brand’s average consumption cadence. Cross-reference the retention structure on our food and beverage marketing retainer page.
Content refresh cadence on food brand pillars
Content refresh cadence on food brand content pillars runs a rolling audit every 12 to 24 months by pillar. Recipes get refreshed every 12 months with new photography, updated schema, and any nutrition or ingredient adjustments. Ingredient comparison guides refresh every 18 months to update market data. Sourcing story pages refresh every 24 months to reflect farm partnership changes and new harvest angles. Buyer intent content refreshes every 12 months to update retailer availability and pricing.
Recipe refresh priority order
Recipe refresh priority runs by organic traffic rank. The top 20 recipes by monthly organic sessions get refreshed first (new photography, schema audit, related recipe internal links, updated nutrition). The next 40 get refreshed at 15 months. The remaining recipes get refreshed opportunistically when the ranking slips past position 15 in Google. Skipping the refresh cadence lets recipe rankings drift out of the top 3 inside 18 months as newer competitor recipes take the position.
Schema audit checklist per refresh
The schema audit checklist per refresh runs 8 items: Recipe schema completeness, aggregateRating count and accuracy, nutrition data accuracy, prepTime and cookTime match the recipe body, image URLs valid at CDN, related recipe internal links working, product card SKU URL live, and Google Search Console rich result eligibility validated. This checklist takes 20 minutes per recipe and prevents the schema drift that costs recipe rankings 20 to 40 positions quietly.
Reporting cadence for food brand content marketing
Reporting cadence on food brand content marketing runs a monthly executive report plus a quarterly business review. The monthly report ships in the first business week and covers organic sessions by pillar, top 10 ranking recipes with position trend, ingredient guide ranking movements, sourcing page performance, and organic-attributed DTC revenue. Every number carries a comparison to the prior month and a plain-language interpretation the founder reads in 7 minutes.
Metrics that matter for content marketing
Metrics that matter for food brand content marketing: organic sessions by pillar, recipe rich result impressions in Search Console, organic conversion rate to hero SKU pages, organic-attributed DTC revenue, and top 20 ranking positions by monthly organic sessions. Vanity metrics that do not matter: total pageviews without conversion context, average time on page without conversion attribution, and social share counts. The monthly report skips the vanity block entirely.
Quarterly business review structure
The quarterly business review runs 90 minutes with the founder, head of content, and SEO lead. Agenda: organic traffic trend by pillar, top 10 winning content pieces, top 10 losing content pieces (candidates for refresh or removal), competitive gap analysis against 5 named competitor brands, and next quarter’s content calendar with recipes and ingredient guides queued. According to Ahrefs content marketing research, brands running quarterly content audits outperform brands running annual audits by 40 to 70 percent on organic revenue over a 24-month window.
Internal linking discipline across food brand content
Internal linking discipline across food brand content moves authority from recipe pages toward hero SKU product pages and comparison guides. Every recipe links to the hero SKU it uses inline (once in the ingredient list, once in a bottom call-out card). Every ingredient comparison guide links to 3 to 6 recipes using the winning ingredient plus the hero SKU product page. Every sourcing story links to the 2 to 4 SKUs sourced from that specific farm or cooperative.
Anchor text strategy across recipe hubs
Anchor text on internal links varies across recipe hubs to avoid over-optimization patterns Google penalizes. Exact-match anchor (“single-origin Ethiopian coffee”) runs on 20 to 30 percent of internal links. Partial-match variations (“our Ethiopian roast”) run on 30 to 40 percent. Branded anchors (the SKU name) run on 20 to 30 percent. Generic anchors (“shop the coffee”) fill the remaining 10 to 20 percent. This ratio holds ranking without triggering the over-optimization penalty that shows up on brands that anchor-text-stuff every internal link with the same exact-match keyword. Cross-reference the linking layer on our food and beverage web design page.
Link equity from ingredient guides to SKU pages
Link equity from ingredient guides passes to SKU pages when the guide’s comparison table names the hero SKU in the winning column with a product card, and when the guide’s body links to 3 to 6 recipes that use the winning ingredient. This 3-hop path (guide to recipe to SKU) pushes authority from a high-traffic informational query down to a high-intent transactional page. According to Search Engine Land SEO coverage, informational content that internally links to transactional pages produces 2 to 4 times higher organic revenue than isolated content silos.
Wrapping up content marketing for food brands
Content marketing for food brands is the organic engine that turns a DTC snack, drink, or CPG storefront into a search-driven revenue channel. Recipe hub of 40 to 100 recipes. Ingredient comparison guides at 12 to 24 pieces. Sourcing story pages at 6 to 12 pieces. Buyer intent content at 8 to 16 pieces. Creator syndication calendar with 12 to 30 creators per quarter. Refresh cadence at 12 to 24 months by pillar. Reporting with organic sessions and organic revenue attribution.
If your DTC food brand is running paid social at 20,000 dollars monthly with a broken blog and zero recipe schema, professional content marketing for food brands pays for itself inside the first 90 days on organic traffic captured. Redefine Web ships content marketing inside our monthly retainer packages. Book a call and we will walk through the last three DTC food brands we built recipe hubs for, pillar by pillar.
Content marketing for food brands starts with a recipe hub because recipe queries account for 40 to 60 percent of high-intent search volume in the food category. Every hero SKU needs 4 to 12 recipes anchored to it, each targeting a specific occasion and audience.
Skip the recipe hub and the brand loses the search real estate that pulls DTC storefront traffic month over month at zero incremental paid cost. Recipe traffic converts at 2 to 4 percent because the shopper landed with usage intent, not passive discovery, which is why food brands win on recipes.
Recipe schema and Google rich result eligibility
Every recipe page ships schema.org Recipe markup including cookTime, prepTime, recipeIngredient, recipeInstructions, nutrition, and aggregateRating. Correctly marked-up recipes qualify for Google’s recipe rich result carousel that pulls 3 to 6 times higher click-through rate than a plain blue link. The schema layer takes 15 minutes per recipe to author and 30 minutes to validate in Google Search Console. Cross-reference the recipe search stack on our food and beverage SEO page.
Recipe hub structure that scales
The recipe hub structure runs 40 to 100 recipes at maturity, organized by hero SKU (4 to 12 recipes per SKU) plus occasion tags (breakfast, weeknight dinner, meal prep, brunch, holiday). Every recipe links back to the hero SKU product page with the SKU embedded in an inline card. The hub earns internal linking value from ingredient comparison guides and the sourcing story pages, which feeds recipe ranking on Google. According to Google Search Central recipe structured data guidance, complete Recipe schema markup is required for eligibility in the recipe carousel and the ingredient search filter.
Pillar structure for food brand content marketing
The pillar structure on content marketing for food brands runs 4 content pillars concurrently: recipe hub (40 to 100 recipes), ingredient comparison guides (12 to 24 guides), sourcing story pages (6 to 12 pages), and buyer intent content (where to buy, subscription vs. one-time, gift bundle guides). Every pillar covers a distinct search intent and every pillar links back to the hero SKU product pages.
Ingredient comparison guide format
Ingredient comparison guides run 1,800 to 3,200 words comparing 2 to 4 ingredient types on 6 to 10 attributes with a comparison table, real-world use case examples, and links to the hero SKU that uses the specific ingredient. Example: organic vs. conventional oats compares nutritional profile, sourcing chain, cost, environmental impact, and taste on a 6-column table. The brand’s SKU appears in the winning column with a product card. These guides rank 3 to 8 months after publication and pull steady-state organic traffic.
Sourcing story pages that build trust
Sourcing story pages name the specific farms, cooperatives, or suppliers the brand sources from, with photos of the farms, farmer quotes, and specific harvest windows. A coffee brand’s Ethiopian farm page ranks for “single-origin Ethiopian coffee” and “Yirgacheffe coffee origin” plus 40 long-tail variations. The sourcing page pulls trust-building traffic that converts at 4 to 6 percent because the shopper landed pattern-matching on transparency and named provenance. Every sourcing page includes farmer or cooperative quotes, harvest dates, and a link back to 3 to 5 hero SKU pages that source from the named supplier.
Vejrø hospitality content case study
Vejrø Resort, a Danish private-island destination with an on-site restaurant focused on organic, locally sourced cuisine, joined us with strong social engagement and no organic-search real estate. Guests found the resort on Instagram but never in Google search for terms like “private island resort Denmark,” “farm-to-table hospitality Denmark,” or “Vejrø restaurant.” The same organic-search gap shows up on DTC food brands running paid social at 20,000 dollars monthly with a broken blog and zero recipe schema.
We built the conversion-focused website with on-site and off-site SEO tuned to the travel-niche keyword clusters, competitor analysis against comparable boutique resorts, and mobile-first design prioritizing guest discovery. Every page carried the structured data qualifying it for Google’s rich results in the hospitality category. Every internal link pushed authority toward the direct-booking conversion path.
Three months later, Vejrø hit 10,000 plus organic visitors, ranked for 200 plus first-page keywords, and pulled a 2.2 percent booking conversion rate from organic traffic. The same pattern applies to content marketing for food brands: recipe schema, ingredient comparison guides, and sourcing story pages pull organic traffic at 20 to 40 percent conversion into hero SKU pages inside 6 months when the content quality matches search intent and every page carries the right structured data markup. Vejrø also proved out the reporting discipline: every monthly report named the exact page, the exact keyword cluster, and the exact search feature (rich result, sitelinks, image pack) driving the incremental organic revenue instead of hiding behind aggregate traffic charts.
Recipe cadence and content calendar for food brands
Recipe cadence on a working food brand content calendar ships 2 to 4 new recipes per week during the first 6 months and drops to 1 per week at maturity. Each recipe takes 4 to 6 hours to produce (write, test in the kitchen, photograph, schema author, publish). At 3 recipes per week, the brand hits 78 recipes inside 6 months plus a backlog of ingredient comparison and sourcing content queued behind the recipe production line.
| Content pillar | Target volume year 1 | Production cost per piece | Refresh cadence |
|---|---|---|---|
| Recipe hub | 40 to 100 recipes | $180 to $320 | Every 12 months |
| Ingredient comparison guides | 12 to 24 guides | $450 to $780 | Every 18 months |
| Sourcing story pages | 6 to 12 pages | $680 to $1,200 | Every 24 months |
| Buyer intent content | 8 to 16 pieces | $220 to $420 | Every 12 months |
Photography as a content calendar constraint
Photography is the actual constraint on recipe cadence, not writing. Every recipe needs 6 to 12 photos: hero shot, ingredient flat lay, prep in progress, plated result, storage, and step shots for the schema markup. A working food brand batches photography 8 recipes at a time to keep the cost per recipe under 200 dollars. Skip the batching and the per-recipe cost climbs to 400 to 600 dollars, which caps recipe cadence at 1 per week and slows organic ranking timeline by 6 months.
Seasonal content calendar planning
Seasonal content calendar planning maps recipes and comparison guides to the seasonal windows they need to rank in. A Christmas cookie recipe needs to publish in September to rank by early December. A Valentine’s chocolate guide needs to publish in November to rank by early February. A back-to-school lunchbox recipe needs to publish in June to rank by late August. The 60-to-90-day ranking curve dictates the calendar.
Creator syndication inside food brand content
Creator syndication on food brand content marketing amplifies the recipe hub through Instagram Reels, TikTok, and YouTube Shorts creators paid to post their own version of the brand’s hero recipes. The creator content pulls net-new audiences into the recipe hub through the creator’s Link in Bio or Amazon Storefront tag. The syndication calendar names 12 to 30 creators per quarter with specific recipes assigned to each.
One brand we picked up had a spreadsheet titled “creator outreach 2023” with 47 rows and 3 responses. All 3 responses were auto-replies. The spreadsheet named zero recipes and offered flat rates below 100 dollars per post. Nobody posts a 30-second video for 87 dollars flat. Nobody.
Creator content commercial terms that work
Working creator content commercial terms run 350 to 1,500 dollars flat per post plus a 12 to 25 percent commission on tagged sales across a 30-day window. The commission mechanic pulls creators into follow-up posts because the incremental revenue continues past the initial fee. Mid-tier creators (30k to 150k followers) hit the sweet spot for food brand content because their engagement rate typically runs 4 to 8 percent versus 0.8 to 1.6 percent on mega-creators.
Content brief structure for creator partnerships
The content brief structure for creator partnerships runs a single page: the SKU, the specific recipe or usage occasion, 3 required brand mentions, 3 restricted claims (no health claims on non-medical SKUs), the pricing angle, the affiliate link, and 3 example videos that hit the tone. The brief avoids over-scripting because over-scripted creator content underperforms native creator voice by 40 to 60 percent on engagement rate.
Buyer intent content for food brand blogs
Buyer intent content on food brand blogs covers 8 to 16 pieces targeting explicit purchase-decision queries: “where to buy [brand],” “[brand] subscription vs. one-time,” “best [category] for [use case],” and “[brand] gift bundle.” Every buyer intent piece runs 1,400 to 2,400 words with a comparison table, product cards, and a clear conversion path to the specific SKU that matches the query intent. Buyer intent content converts at 3 to 6 percent versus 1 to 2 percent on recipe content because the shopper landed already planning to buy, not exploring a usage occasion.
Where-to-buy content structure
Where-to-buy content structure covers online (DTC storefront, Amazon, Target.com, Whole Foods online), retail (specific chain locators with the store finder embedded), and international (customs limitations, retailer partners abroad). Every piece names specific retailers, links to the store locator, and includes an FAQ block covering shipping availability, subscription options, and gift card compatibility. Where-to-buy content ranks for branded discovery queries the DTC storefront otherwise loses to competitor affiliate reviews.
Subscription versus one-time comparison content
Subscription versus one-time comparison content converts subscription commitments at 3 to 6 percent because it addresses the price-sensitivity concern head-on with a specific math table. The piece covers the discount structure (15 percent lifetime), the skip-a-month mechanic, the pause-anytime rule, the cancellation policy, and the specific yearly savings for the brand’s average consumption cadence. Cross-reference the retention structure on our food and beverage marketing retainer page.
Content refresh cadence on food brand pillars
Content refresh cadence on food brand content pillars runs a rolling audit every 12 to 24 months by pillar. Recipes get refreshed every 12 months with new photography, updated schema, and any nutrition or ingredient adjustments. Ingredient comparison guides refresh every 18 months to update market data. Sourcing story pages refresh every 24 months to reflect farm partnership changes and new harvest angles. Buyer intent content refreshes every 12 months to update retailer availability and pricing.
Recipe refresh priority order
Recipe refresh priority runs by organic traffic rank. The top 20 recipes by monthly organic sessions get refreshed first (new photography, schema audit, related recipe internal links, updated nutrition). The next 40 get refreshed at 15 months. The remaining recipes get refreshed opportunistically when the ranking slips past position 15 in Google. Skipping the refresh cadence lets recipe rankings drift out of the top 3 inside 18 months as newer competitor recipes take the position.
Schema audit checklist per refresh
The schema audit checklist per refresh runs 8 items: Recipe schema completeness, aggregateRating count and accuracy, nutrition data accuracy, prepTime and cookTime match the recipe body, image URLs valid at CDN, related recipe internal links working, product card SKU URL live, and Google Search Console rich result eligibility validated. This checklist takes 20 minutes per recipe and prevents the schema drift that costs recipe rankings 20 to 40 positions quietly.
Reporting cadence for food brand content marketing
Reporting cadence on food brand content marketing runs a monthly executive report plus a quarterly business review. The monthly report ships in the first business week and covers organic sessions by pillar, top 10 ranking recipes with position trend, ingredient guide ranking movements, sourcing page performance, and organic-attributed DTC revenue. Every number carries a comparison to the prior month and a plain-language interpretation the founder reads in 7 minutes.
Metrics that matter for content marketing
Metrics that matter for food brand content marketing: organic sessions by pillar, recipe rich result impressions in Search Console, organic conversion rate to hero SKU pages, organic-attributed DTC revenue, and top 20 ranking positions by monthly organic sessions. Vanity metrics that do not matter: total pageviews without conversion context, average time on page without conversion attribution, and social share counts. The monthly report skips the vanity block entirely.
Quarterly business review structure
The quarterly business review runs 90 minutes with the founder, head of content, and SEO lead. Agenda: organic traffic trend by pillar, top 10 winning content pieces, top 10 losing content pieces (candidates for refresh or removal), competitive gap analysis against 5 named competitor brands, and next quarter’s content calendar with recipes and ingredient guides queued. According to Ahrefs content marketing research, brands running quarterly content audits outperform brands running annual audits by 40 to 70 percent on organic revenue over a 24-month window.
Internal linking discipline across food brand content
Internal linking discipline across food brand content moves authority from recipe pages toward hero SKU product pages and comparison guides. Every recipe links to the hero SKU it uses inline (once in the ingredient list, once in a bottom call-out card). Every ingredient comparison guide links to 3 to 6 recipes using the winning ingredient plus the hero SKU product page. Every sourcing story links to the 2 to 4 SKUs sourced from that specific farm or cooperative.
Anchor text strategy across recipe hubs
Anchor text on internal links varies across recipe hubs to avoid over-optimization patterns Google penalizes. Exact-match anchor (“single-origin Ethiopian coffee”) runs on 20 to 30 percent of internal links. Partial-match variations (“our Ethiopian roast”) run on 30 to 40 percent. Branded anchors (the SKU name) run on 20 to 30 percent. Generic anchors (“shop the coffee”) fill the remaining 10 to 20 percent. This ratio holds ranking without triggering the over-optimization penalty that shows up on brands that anchor-text-stuff every internal link with the same exact-match keyword. Cross-reference the linking layer on our food and beverage web design page.
Link equity from ingredient guides to SKU pages
Link equity from ingredient guides passes to SKU pages when the guide’s comparison table names the hero SKU in the winning column with a product card, and when the guide’s body links to 3 to 6 recipes that use the winning ingredient. This 3-hop path (guide to recipe to SKU) pushes authority from a high-traffic informational query down to a high-intent transactional page. According to Search Engine Land SEO coverage, informational content that internally links to transactional pages produces 2 to 4 times higher organic revenue than isolated content silos.
Wrapping up content marketing for food brands
Content marketing for food brands is the organic engine that turns a DTC snack, drink, or CPG storefront into a search-driven revenue channel. Recipe hub of 40 to 100 recipes. Ingredient comparison guides at 12 to 24 pieces. Sourcing story pages at 6 to 12 pieces. Buyer intent content at 8 to 16 pieces. Creator syndication calendar with 12 to 30 creators per quarter. Refresh cadence at 12 to 24 months by pillar. Reporting with organic sessions and organic revenue attribution.
If your DTC food brand is running paid social at 20,000 dollars monthly with a broken blog and zero recipe schema, professional content marketing for food brands pays for itself inside the first 90 days on organic traffic captured. Redefine Web ships content marketing inside our monthly retainer packages. Book a call and we will walk through the last three DTC food brands we built recipe hubs for, pillar by pillar.
Internal linking discipline across food brand content moves authority from recipe pages toward hero SKU product pages and comparison guides. Every recipe links to the hero SKU it uses inline (once in the ingredient list, once in a bottom call-out card). Every ingredient comparison guide links to 3 to 6 recipes using the winning ingredient plus the hero SKU product page. Every sourcing story links to the 2 to 4 SKUs sourced from that specific farm or cooperative.
Anchor text strategy across recipe hubs
Anchor text on internal links varies across recipe hubs to avoid over-optimization patterns Google penalizes. Exact-match anchor (“single-origin Ethiopian coffee”) runs on 20 to 30 percent of internal links. Partial-match variations (“our Ethiopian roast”) run on 30 to 40 percent. Branded anchors (the SKU name) run on 20 to 30 percent. Generic anchors (“shop the coffee”) fill the remaining 10 to 20 percent. This ratio holds ranking without triggering the over-optimization penalty that shows up on brands that anchor-text-stuff every internal link with the same exact-match keyword. Cross-reference the linking layer on our food and beverage web design page.
Link equity from ingredient guides to SKU pages
Link equity from ingredient guides passes to SKU pages when the guide’s comparison table names the hero SKU in the winning column with a product card, and when the guide’s body links to 3 to 6 recipes that use the winning ingredient. This 3-hop path (guide to recipe to SKU) pushes authority from a high-traffic informational query down to a high-intent transactional page. According to Search Engine Land SEO coverage, informational content that internally links to transactional pages produces 2 to 4 times higher organic revenue than isolated content silos.
Wrapping up content marketing for food brands
Content marketing for food brands is the organic engine that turns a DTC snack, drink, or CPG storefront into a search-driven revenue channel. Recipe hub of 40 to 100 recipes. Ingredient comparison guides at 12 to 24 pieces. Sourcing story pages at 6 to 12 pieces. Buyer intent content at 8 to 16 pieces. Creator syndication calendar with 12 to 30 creators per quarter. Refresh cadence at 12 to 24 months by pillar. Reporting with organic sessions and organic revenue attribution.
If your DTC food brand is running paid social at 20,000 dollars monthly with a broken blog and zero recipe schema, professional content marketing for food brands pays for itself inside the first 90 days on organic traffic captured. Redefine Web ships content marketing inside our monthly retainer packages. Book a call and we will walk through the last three DTC food brands we built recipe hubs for, pillar by pillar.
Content marketing for food brands starts with a recipe hub because recipe queries account for 40 to 60 percent of high-intent search volume in the food category. Every hero SKU needs 4 to 12 recipes anchored to it, each targeting a specific occasion and audience.
Skip the recipe hub and the brand loses the search real estate that pulls DTC storefront traffic month over month at zero incremental paid cost. Recipe traffic converts at 2 to 4 percent because the shopper landed with usage intent, not passive discovery, which is why food brands win on recipes.
Recipe schema and Google rich result eligibility
Every recipe page ships schema.org Recipe markup including cookTime, prepTime, recipeIngredient, recipeInstructions, nutrition, and aggregateRating. Correctly marked-up recipes qualify for Google’s recipe rich result carousel that pulls 3 to 6 times higher click-through rate than a plain blue link. The schema layer takes 15 minutes per recipe to author and 30 minutes to validate in Google Search Console. Cross-reference the recipe search stack on our food and beverage SEO page.
Recipe hub structure that scales
The recipe hub structure runs 40 to 100 recipes at maturity, organized by hero SKU (4 to 12 recipes per SKU) plus occasion tags (breakfast, weeknight dinner, meal prep, brunch, holiday). Every recipe links back to the hero SKU product page with the SKU embedded in an inline card. The hub earns internal linking value from ingredient comparison guides and the sourcing story pages, which feeds recipe ranking on Google. According to Google Search Central recipe structured data guidance, complete Recipe schema markup is required for eligibility in the recipe carousel and the ingredient search filter.
Pillar structure for food brand content marketing
The pillar structure on content marketing for food brands runs 4 content pillars concurrently: recipe hub (40 to 100 recipes), ingredient comparison guides (12 to 24 guides), sourcing story pages (6 to 12 pages), and buyer intent content (where to buy, subscription vs. one-time, gift bundle guides). Every pillar covers a distinct search intent and every pillar links back to the hero SKU product pages.
Ingredient comparison guide format
Ingredient comparison guides run 1,800 to 3,200 words comparing 2 to 4 ingredient types on 6 to 10 attributes with a comparison table, real-world use case examples, and links to the hero SKU that uses the specific ingredient. Example: organic vs. conventional oats compares nutritional profile, sourcing chain, cost, environmental impact, and taste on a 6-column table. The brand’s SKU appears in the winning column with a product card. These guides rank 3 to 8 months after publication and pull steady-state organic traffic.
Sourcing story pages that build trust
Sourcing story pages name the specific farms, cooperatives, or suppliers the brand sources from, with photos of the farms, farmer quotes, and specific harvest windows. A coffee brand’s Ethiopian farm page ranks for “single-origin Ethiopian coffee” and “Yirgacheffe coffee origin” plus 40 long-tail variations. The sourcing page pulls trust-building traffic that converts at 4 to 6 percent because the shopper landed pattern-matching on transparency and named provenance. Every sourcing page includes farmer or cooperative quotes, harvest dates, and a link back to 3 to 5 hero SKU pages that source from the named supplier.
Vejrø hospitality content case study
Vejrø Resort, a Danish private-island destination with an on-site restaurant focused on organic, locally sourced cuisine, joined us with strong social engagement and no organic-search real estate. Guests found the resort on Instagram but never in Google search for terms like “private island resort Denmark,” “farm-to-table hospitality Denmark,” or “Vejrø restaurant.” The same organic-search gap shows up on DTC food brands running paid social at 20,000 dollars monthly with a broken blog and zero recipe schema.
We built the conversion-focused website with on-site and off-site SEO tuned to the travel-niche keyword clusters, competitor analysis against comparable boutique resorts, and mobile-first design prioritizing guest discovery. Every page carried the structured data qualifying it for Google’s rich results in the hospitality category. Every internal link pushed authority toward the direct-booking conversion path.
Three months later, Vejrø hit 10,000 plus organic visitors, ranked for 200 plus first-page keywords, and pulled a 2.2 percent booking conversion rate from organic traffic. The same pattern applies to content marketing for food brands: recipe schema, ingredient comparison guides, and sourcing story pages pull organic traffic at 20 to 40 percent conversion into hero SKU pages inside 6 months when the content quality matches search intent and every page carries the right structured data markup. Vejrø also proved out the reporting discipline: every monthly report named the exact page, the exact keyword cluster, and the exact search feature (rich result, sitelinks, image pack) driving the incremental organic revenue instead of hiding behind aggregate traffic charts.
Recipe cadence and content calendar for food brands
Recipe cadence on a working food brand content calendar ships 2 to 4 new recipes per week during the first 6 months and drops to 1 per week at maturity. Each recipe takes 4 to 6 hours to produce (write, test in the kitchen, photograph, schema author, publish). At 3 recipes per week, the brand hits 78 recipes inside 6 months plus a backlog of ingredient comparison and sourcing content queued behind the recipe production line.
| Content pillar | Target volume year 1 | Production cost per piece | Refresh cadence |
|---|---|---|---|
| Recipe hub | 40 to 100 recipes | $180 to $320 | Every 12 months |
| Ingredient comparison guides | 12 to 24 guides | $450 to $780 | Every 18 months |
| Sourcing story pages | 6 to 12 pages | $680 to $1,200 | Every 24 months |
| Buyer intent content | 8 to 16 pieces | $220 to $420 | Every 12 months |
Photography as a content calendar constraint
Photography is the actual constraint on recipe cadence, not writing. Every recipe needs 6 to 12 photos: hero shot, ingredient flat lay, prep in progress, plated result, storage, and step shots for the schema markup. A working food brand batches photography 8 recipes at a time to keep the cost per recipe under 200 dollars. Skip the batching and the per-recipe cost climbs to 400 to 600 dollars, which caps recipe cadence at 1 per week and slows organic ranking timeline by 6 months.
Seasonal content calendar planning
Seasonal content calendar planning maps recipes and comparison guides to the seasonal windows they need to rank in. A Christmas cookie recipe needs to publish in September to rank by early December. A Valentine’s chocolate guide needs to publish in November to rank by early February. A back-to-school lunchbox recipe needs to publish in June to rank by late August. The 60-to-90-day ranking curve dictates the calendar.
Creator syndication inside food brand content
Creator syndication on food brand content marketing amplifies the recipe hub through Instagram Reels, TikTok, and YouTube Shorts creators paid to post their own version of the brand’s hero recipes. The creator content pulls net-new audiences into the recipe hub through the creator’s Link in Bio or Amazon Storefront tag. The syndication calendar names 12 to 30 creators per quarter with specific recipes assigned to each.
One brand we picked up had a spreadsheet titled “creator outreach 2023” with 47 rows and 3 responses. All 3 responses were auto-replies. The spreadsheet named zero recipes and offered flat rates below 100 dollars per post. Nobody posts a 30-second video for 87 dollars flat. Nobody.
Creator content commercial terms that work
Working creator content commercial terms run 350 to 1,500 dollars flat per post plus a 12 to 25 percent commission on tagged sales across a 30-day window. The commission mechanic pulls creators into follow-up posts because the incremental revenue continues past the initial fee. Mid-tier creators (30k to 150k followers) hit the sweet spot for food brand content because their engagement rate typically runs 4 to 8 percent versus 0.8 to 1.6 percent on mega-creators.
Content brief structure for creator partnerships
The content brief structure for creator partnerships runs a single page: the SKU, the specific recipe or usage occasion, 3 required brand mentions, 3 restricted claims (no health claims on non-medical SKUs), the pricing angle, the affiliate link, and 3 example videos that hit the tone. The brief avoids over-scripting because over-scripted creator content underperforms native creator voice by 40 to 60 percent on engagement rate.
Buyer intent content for food brand blogs
Buyer intent content on food brand blogs covers 8 to 16 pieces targeting explicit purchase-decision queries: “where to buy [brand],” “[brand] subscription vs. one-time,” “best [category] for [use case],” and “[brand] gift bundle.” Every buyer intent piece runs 1,400 to 2,400 words with a comparison table, product cards, and a clear conversion path to the specific SKU that matches the query intent. Buyer intent content converts at 3 to 6 percent versus 1 to 2 percent on recipe content because the shopper landed already planning to buy, not exploring a usage occasion.
Where-to-buy content structure
Where-to-buy content structure covers online (DTC storefront, Amazon, Target.com, Whole Foods online), retail (specific chain locators with the store finder embedded), and international (customs limitations, retailer partners abroad). Every piece names specific retailers, links to the store locator, and includes an FAQ block covering shipping availability, subscription options, and gift card compatibility. Where-to-buy content ranks for branded discovery queries the DTC storefront otherwise loses to competitor affiliate reviews.
Subscription versus one-time comparison content
Subscription versus one-time comparison content converts subscription commitments at 3 to 6 percent because it addresses the price-sensitivity concern head-on with a specific math table. The piece covers the discount structure (15 percent lifetime), the skip-a-month mechanic, the pause-anytime rule, the cancellation policy, and the specific yearly savings for the brand’s average consumption cadence. Cross-reference the retention structure on our food and beverage marketing retainer page.
Content refresh cadence on food brand pillars
Content refresh cadence on food brand content pillars runs a rolling audit every 12 to 24 months by pillar. Recipes get refreshed every 12 months with new photography, updated schema, and any nutrition or ingredient adjustments. Ingredient comparison guides refresh every 18 months to update market data. Sourcing story pages refresh every 24 months to reflect farm partnership changes and new harvest angles. Buyer intent content refreshes every 12 months to update retailer availability and pricing.
Recipe refresh priority order
Recipe refresh priority runs by organic traffic rank. The top 20 recipes by monthly organic sessions get refreshed first (new photography, schema audit, related recipe internal links, updated nutrition). The next 40 get refreshed at 15 months. The remaining recipes get refreshed opportunistically when the ranking slips past position 15 in Google. Skipping the refresh cadence lets recipe rankings drift out of the top 3 inside 18 months as newer competitor recipes take the position.
Schema audit checklist per refresh
The schema audit checklist per refresh runs 8 items: Recipe schema completeness, aggregateRating count and accuracy, nutrition data accuracy, prepTime and cookTime match the recipe body, image URLs valid at CDN, related recipe internal links working, product card SKU URL live, and Google Search Console rich result eligibility validated. This checklist takes 20 minutes per recipe and prevents the schema drift that costs recipe rankings 20 to 40 positions quietly.
Reporting cadence for food brand content marketing
Reporting cadence on food brand content marketing runs a monthly executive report plus a quarterly business review. The monthly report ships in the first business week and covers organic sessions by pillar, top 10 ranking recipes with position trend, ingredient guide ranking movements, sourcing page performance, and organic-attributed DTC revenue. Every number carries a comparison to the prior month and a plain-language interpretation the founder reads in 7 minutes.
Metrics that matter for content marketing
Metrics that matter for food brand content marketing: organic sessions by pillar, recipe rich result impressions in Search Console, organic conversion rate to hero SKU pages, organic-attributed DTC revenue, and top 20 ranking positions by monthly organic sessions. Vanity metrics that do not matter: total pageviews without conversion context, average time on page without conversion attribution, and social share counts. The monthly report skips the vanity block entirely.
Quarterly business review structure
The quarterly business review runs 90 minutes with the founder, head of content, and SEO lead. Agenda: organic traffic trend by pillar, top 10 winning content pieces, top 10 losing content pieces (candidates for refresh or removal), competitive gap analysis against 5 named competitor brands, and next quarter’s content calendar with recipes and ingredient guides queued. According to Ahrefs content marketing research, brands running quarterly content audits outperform brands running annual audits by 40 to 70 percent on organic revenue over a 24-month window.
Internal linking discipline across food brand content
Internal linking discipline across food brand content moves authority from recipe pages toward hero SKU product pages and comparison guides. Every recipe links to the hero SKU it uses inline (once in the ingredient list, once in a bottom call-out card). Every ingredient comparison guide links to 3 to 6 recipes using the winning ingredient plus the hero SKU product page. Every sourcing story links to the 2 to 4 SKUs sourced from that specific farm or cooperative.
Anchor text strategy across recipe hubs
Anchor text on internal links varies across recipe hubs to avoid over-optimization patterns Google penalizes. Exact-match anchor (“single-origin Ethiopian coffee”) runs on 20 to 30 percent of internal links. Partial-match variations (“our Ethiopian roast”) run on 30 to 40 percent. Branded anchors (the SKU name) run on 20 to 30 percent. Generic anchors (“shop the coffee”) fill the remaining 10 to 20 percent. This ratio holds ranking without triggering the over-optimization penalty that shows up on brands that anchor-text-stuff every internal link with the same exact-match keyword. Cross-reference the linking layer on our food and beverage web design page.
Link equity from ingredient guides to SKU pages
Link equity from ingredient guides passes to SKU pages when the guide’s comparison table names the hero SKU in the winning column with a product card, and when the guide’s body links to 3 to 6 recipes that use the winning ingredient. This 3-hop path (guide to recipe to SKU) pushes authority from a high-traffic informational query down to a high-intent transactional page. According to Search Engine Land SEO coverage, informational content that internally links to transactional pages produces 2 to 4 times higher organic revenue than isolated content silos.
Wrapping up content marketing for food brands
Content marketing for food brands is the organic engine that turns a DTC snack, drink, or CPG storefront into a search-driven revenue channel. Recipe hub of 40 to 100 recipes. Ingredient comparison guides at 12 to 24 pieces. Sourcing story pages at 6 to 12 pieces. Buyer intent content at 8 to 16 pieces. Creator syndication calendar with 12 to 30 creators per quarter. Refresh cadence at 12 to 24 months by pillar. Reporting with organic sessions and organic revenue attribution.
If your DTC food brand is running paid social at 20,000 dollars monthly with a broken blog and zero recipe schema, professional content marketing for food brands pays for itself inside the first 90 days on organic traffic captured. Redefine Web ships content marketing inside our monthly retainer packages. Book a call and we will walk through the last three DTC food brands we built recipe hubs for, pillar by pillar.
Content marketing for food brands starts with a recipe hub because recipe queries account for 40 to 60 percent of high-intent search volume in the food category. Every hero SKU needs 4 to 12 recipes anchored to it, each targeting a specific occasion and audience.
Skip the recipe hub and the brand loses the search real estate that pulls DTC storefront traffic month over month at zero incremental paid cost. Recipe traffic converts at 2 to 4 percent because the shopper landed with usage intent, not passive discovery, which is why food brands win on recipes.
Recipe schema and Google rich result eligibility
Every recipe page ships schema.org Recipe markup including cookTime, prepTime, recipeIngredient, recipeInstructions, nutrition, and aggregateRating. Correctly marked-up recipes qualify for Google’s recipe rich result carousel that pulls 3 to 6 times higher click-through rate than a plain blue link. The schema layer takes 15 minutes per recipe to author and 30 minutes to validate in Google Search Console. Cross-reference the recipe search stack on our food and beverage SEO page.
Recipe hub structure that scales
The recipe hub structure runs 40 to 100 recipes at maturity, organized by hero SKU (4 to 12 recipes per SKU) plus occasion tags (breakfast, weeknight dinner, meal prep, brunch, holiday). Every recipe links back to the hero SKU product page with the SKU embedded in an inline card. The hub earns internal linking value from ingredient comparison guides and the sourcing story pages, which feeds recipe ranking on Google. According to Google Search Central recipe structured data guidance, complete Recipe schema markup is required for eligibility in the recipe carousel and the ingredient search filter.
Pillar structure for food brand content marketing
The pillar structure on content marketing for food brands runs 4 content pillars concurrently: recipe hub (40 to 100 recipes), ingredient comparison guides (12 to 24 guides), sourcing story pages (6 to 12 pages), and buyer intent content (where to buy, subscription vs. one-time, gift bundle guides). Every pillar covers a distinct search intent and every pillar links back to the hero SKU product pages.
Ingredient comparison guide format
Ingredient comparison guides run 1,800 to 3,200 words comparing 2 to 4 ingredient types on 6 to 10 attributes with a comparison table, real-world use case examples, and links to the hero SKU that uses the specific ingredient. Example: organic vs. conventional oats compares nutritional profile, sourcing chain, cost, environmental impact, and taste on a 6-column table. The brand’s SKU appears in the winning column with a product card. These guides rank 3 to 8 months after publication and pull steady-state organic traffic.
Sourcing story pages that build trust
Sourcing story pages name the specific farms, cooperatives, or suppliers the brand sources from, with photos of the farms, farmer quotes, and specific harvest windows. A coffee brand’s Ethiopian farm page ranks for “single-origin Ethiopian coffee” and “Yirgacheffe coffee origin” plus 40 long-tail variations. The sourcing page pulls trust-building traffic that converts at 4 to 6 percent because the shopper landed pattern-matching on transparency and named provenance. Every sourcing page includes farmer or cooperative quotes, harvest dates, and a link back to 3 to 5 hero SKU pages that source from the named supplier.
Vejrø hospitality content case study
Vejrø Resort, a Danish private-island destination with an on-site restaurant focused on organic, locally sourced cuisine, joined us with strong social engagement and no organic-search real estate. Guests found the resort on Instagram but never in Google search for terms like “private island resort Denmark,” “farm-to-table hospitality Denmark,” or “Vejrø restaurant.” The same organic-search gap shows up on DTC food brands running paid social at 20,000 dollars monthly with a broken blog and zero recipe schema.
We built the conversion-focused website with on-site and off-site SEO tuned to the travel-niche keyword clusters, competitor analysis against comparable boutique resorts, and mobile-first design prioritizing guest discovery. Every page carried the structured data qualifying it for Google’s rich results in the hospitality category. Every internal link pushed authority toward the direct-booking conversion path.
Three months later, Vejrø hit 10,000 plus organic visitors, ranked for 200 plus first-page keywords, and pulled a 2.2 percent booking conversion rate from organic traffic. The same pattern applies to content marketing for food brands: recipe schema, ingredient comparison guides, and sourcing story pages pull organic traffic at 20 to 40 percent conversion into hero SKU pages inside 6 months when the content quality matches search intent and every page carries the right structured data markup. Vejrø also proved out the reporting discipline: every monthly report named the exact page, the exact keyword cluster, and the exact search feature (rich result, sitelinks, image pack) driving the incremental organic revenue instead of hiding behind aggregate traffic charts.
Recipe cadence and content calendar for food brands
Recipe cadence on a working food brand content calendar ships 2 to 4 new recipes per week during the first 6 months and drops to 1 per week at maturity. Each recipe takes 4 to 6 hours to produce (write, test in the kitchen, photograph, schema author, publish). At 3 recipes per week, the brand hits 78 recipes inside 6 months plus a backlog of ingredient comparison and sourcing content queued behind the recipe production line.
| Content pillar | Target volume year 1 | Production cost per piece | Refresh cadence |
|---|---|---|---|
| Recipe hub | 40 to 100 recipes | $180 to $320 | Every 12 months |
| Ingredient comparison guides | 12 to 24 guides | $450 to $780 | Every 18 months |
| Sourcing story pages | 6 to 12 pages | $680 to $1,200 | Every 24 months |
| Buyer intent content | 8 to 16 pieces | $220 to $420 | Every 12 months |
Photography as a content calendar constraint
Photography is the actual constraint on recipe cadence, not writing. Every recipe needs 6 to 12 photos: hero shot, ingredient flat lay, prep in progress, plated result, storage, and step shots for the schema markup. A working food brand batches photography 8 recipes at a time to keep the cost per recipe under 200 dollars. Skip the batching and the per-recipe cost climbs to 400 to 600 dollars, which caps recipe cadence at 1 per week and slows organic ranking timeline by 6 months.
Seasonal content calendar planning
Seasonal content calendar planning maps recipes and comparison guides to the seasonal windows they need to rank in. A Christmas cookie recipe needs to publish in September to rank by early December. A Valentine’s chocolate guide needs to publish in November to rank by early February. A back-to-school lunchbox recipe needs to publish in June to rank by late August. The 60-to-90-day ranking curve dictates the calendar.
Creator syndication inside food brand content
Creator syndication on food brand content marketing amplifies the recipe hub through Instagram Reels, TikTok, and YouTube Shorts creators paid to post their own version of the brand’s hero recipes. The creator content pulls net-new audiences into the recipe hub through the creator’s Link in Bio or Amazon Storefront tag. The syndication calendar names 12 to 30 creators per quarter with specific recipes assigned to each.
One brand we picked up had a spreadsheet titled “creator outreach 2023” with 47 rows and 3 responses. All 3 responses were auto-replies. The spreadsheet named zero recipes and offered flat rates below 100 dollars per post. Nobody posts a 30-second video for 87 dollars flat. Nobody.
Creator content commercial terms that work
Working creator content commercial terms run 350 to 1,500 dollars flat per post plus a 12 to 25 percent commission on tagged sales across a 30-day window. The commission mechanic pulls creators into follow-up posts because the incremental revenue continues past the initial fee. Mid-tier creators (30k to 150k followers) hit the sweet spot for food brand content because their engagement rate typically runs 4 to 8 percent versus 0.8 to 1.6 percent on mega-creators.
Content brief structure for creator partnerships
The content brief structure for creator partnerships runs a single page: the SKU, the specific recipe or usage occasion, 3 required brand mentions, 3 restricted claims (no health claims on non-medical SKUs), the pricing angle, the affiliate link, and 3 example videos that hit the tone. The brief avoids over-scripting because over-scripted creator content underperforms native creator voice by 40 to 60 percent on engagement rate.
Buyer intent content for food brand blogs
Buyer intent content on food brand blogs covers 8 to 16 pieces targeting explicit purchase-decision queries: “where to buy [brand],” “[brand] subscription vs. one-time,” “best [category] for [use case],” and “[brand] gift bundle.” Every buyer intent piece runs 1,400 to 2,400 words with a comparison table, product cards, and a clear conversion path to the specific SKU that matches the query intent. Buyer intent content converts at 3 to 6 percent versus 1 to 2 percent on recipe content because the shopper landed already planning to buy, not exploring a usage occasion.
Where-to-buy content structure
Where-to-buy content structure covers online (DTC storefront, Amazon, Target.com, Whole Foods online), retail (specific chain locators with the store finder embedded), and international (customs limitations, retailer partners abroad). Every piece names specific retailers, links to the store locator, and includes an FAQ block covering shipping availability, subscription options, and gift card compatibility. Where-to-buy content ranks for branded discovery queries the DTC storefront otherwise loses to competitor affiliate reviews.
Subscription versus one-time comparison content
Subscription versus one-time comparison content converts subscription commitments at 3 to 6 percent because it addresses the price-sensitivity concern head-on with a specific math table. The piece covers the discount structure (15 percent lifetime), the skip-a-month mechanic, the pause-anytime rule, the cancellation policy, and the specific yearly savings for the brand’s average consumption cadence. Cross-reference the retention structure on our food and beverage marketing retainer page.
Content refresh cadence on food brand pillars
Content refresh cadence on food brand content pillars runs a rolling audit every 12 to 24 months by pillar. Recipes get refreshed every 12 months with new photography, updated schema, and any nutrition or ingredient adjustments. Ingredient comparison guides refresh every 18 months to update market data. Sourcing story pages refresh every 24 months to reflect farm partnership changes and new harvest angles. Buyer intent content refreshes every 12 months to update retailer availability and pricing.
Recipe refresh priority order
Recipe refresh priority runs by organic traffic rank. The top 20 recipes by monthly organic sessions get refreshed first (new photography, schema audit, related recipe internal links, updated nutrition). The next 40 get refreshed at 15 months. The remaining recipes get refreshed opportunistically when the ranking slips past position 15 in Google. Skipping the refresh cadence lets recipe rankings drift out of the top 3 inside 18 months as newer competitor recipes take the position.
Schema audit checklist per refresh
The schema audit checklist per refresh runs 8 items: Recipe schema completeness, aggregateRating count and accuracy, nutrition data accuracy, prepTime and cookTime match the recipe body, image URLs valid at CDN, related recipe internal links working, product card SKU URL live, and Google Search Console rich result eligibility validated. This checklist takes 20 minutes per recipe and prevents the schema drift that costs recipe rankings 20 to 40 positions quietly.
Reporting cadence for food brand content marketing
Reporting cadence on food brand content marketing runs a monthly executive report plus a quarterly business review. The monthly report ships in the first business week and covers organic sessions by pillar, top 10 ranking recipes with position trend, ingredient guide ranking movements, sourcing page performance, and organic-attributed DTC revenue. Every number carries a comparison to the prior month and a plain-language interpretation the founder reads in 7 minutes.
Metrics that matter for content marketing
Metrics that matter for food brand content marketing: organic sessions by pillar, recipe rich result impressions in Search Console, organic conversion rate to hero SKU pages, organic-attributed DTC revenue, and top 20 ranking positions by monthly organic sessions. Vanity metrics that do not matter: total pageviews without conversion context, average time on page without conversion attribution, and social share counts. The monthly report skips the vanity block entirely.
Quarterly business review structure
The quarterly business review runs 90 minutes with the founder, head of content, and SEO lead. Agenda: organic traffic trend by pillar, top 10 winning content pieces, top 10 losing content pieces (candidates for refresh or removal), competitive gap analysis against 5 named competitor brands, and next quarter’s content calendar with recipes and ingredient guides queued. According to Ahrefs content marketing research, brands running quarterly content audits outperform brands running annual audits by 40 to 70 percent on organic revenue over a 24-month window.
Internal linking discipline across food brand content
Internal linking discipline across food brand content moves authority from recipe pages toward hero SKU product pages and comparison guides. Every recipe links to the hero SKU it uses inline (once in the ingredient list, once in a bottom call-out card). Every ingredient comparison guide links to 3 to 6 recipes using the winning ingredient plus the hero SKU product page. Every sourcing story links to the 2 to 4 SKUs sourced from that specific farm or cooperative.
Anchor text strategy across recipe hubs
Anchor text on internal links varies across recipe hubs to avoid over-optimization patterns Google penalizes. Exact-match anchor (“single-origin Ethiopian coffee”) runs on 20 to 30 percent of internal links. Partial-match variations (“our Ethiopian roast”) run on 30 to 40 percent. Branded anchors (the SKU name) run on 20 to 30 percent. Generic anchors (“shop the coffee”) fill the remaining 10 to 20 percent. This ratio holds ranking without triggering the over-optimization penalty that shows up on brands that anchor-text-stuff every internal link with the same exact-match keyword. Cross-reference the linking layer on our food and beverage web design page.
Link equity from ingredient guides to SKU pages
Link equity from ingredient guides passes to SKU pages when the guide’s comparison table names the hero SKU in the winning column with a product card, and when the guide’s body links to 3 to 6 recipes that use the winning ingredient. This 3-hop path (guide to recipe to SKU) pushes authority from a high-traffic informational query down to a high-intent transactional page. According to Search Engine Land SEO coverage, informational content that internally links to transactional pages produces 2 to 4 times higher organic revenue than isolated content silos.
Wrapping up content marketing for food brands
Content marketing for food brands is the organic engine that turns a DTC snack, drink, or CPG storefront into a search-driven revenue channel. Recipe hub of 40 to 100 recipes. Ingredient comparison guides at 12 to 24 pieces. Sourcing story pages at 6 to 12 pieces. Buyer intent content at 8 to 16 pieces. Creator syndication calendar with 12 to 30 creators per quarter. Refresh cadence at 12 to 24 months by pillar. Reporting with organic sessions and organic revenue attribution.
If your DTC food brand is running paid social at 20,000 dollars monthly with a broken blog and zero recipe schema, professional content marketing for food brands pays for itself inside the first 90 days on organic traffic captured. Redefine Web ships content marketing inside our monthly retainer packages. Book a call and we will walk through the last three DTC food brands we built recipe hubs for, pillar by pillar.
Anchor text on internal links varies across recipe hubs to avoid over-optimization patterns Google penalizes. Exact-match anchor (“single-origin Ethiopian coffee”) runs on 20 to 30 percent of internal links. Partial-match variations (“our Ethiopian roast”) run on 30 to 40 percent. Branded anchors (the SKU name) run on 20 to 30 percent. Generic anchors (“shop the coffee”) fill the remaining 10 to 20 percent. This ratio holds ranking without triggering the over-optimization penalty that shows up on brands that anchor-text-stuff every internal link with the same exact-match keyword. Cross-reference the linking layer on our food and beverage web design page.
Link equity from ingredient guides to SKU pages
Link equity from ingredient guides passes to SKU pages when the guide’s comparison table names the hero SKU in the winning column with a product card, and when the guide’s body links to 3 to 6 recipes that use the winning ingredient. This 3-hop path (guide to recipe to SKU) pushes authority from a high-traffic informational query down to a high-intent transactional page. According to Search Engine Land SEO coverage, informational content that internally links to transactional pages produces 2 to 4 times higher organic revenue than isolated content silos.
Wrapping up content marketing for food brands
Content marketing for food brands is the organic engine that turns a DTC snack, drink, or CPG storefront into a search-driven revenue channel. Recipe hub of 40 to 100 recipes. Ingredient comparison guides at 12 to 24 pieces. Sourcing story pages at 6 to 12 pieces. Buyer intent content at 8 to 16 pieces. Creator syndication calendar with 12 to 30 creators per quarter. Refresh cadence at 12 to 24 months by pillar. Reporting with organic sessions and organic revenue attribution.
If your DTC food brand is running paid social at 20,000 dollars monthly with a broken blog and zero recipe schema, professional content marketing for food brands pays for itself inside the first 90 days on organic traffic captured. Redefine Web ships content marketing inside our monthly retainer packages. Book a call and we will walk through the last three DTC food brands we built recipe hubs for, pillar by pillar.
Internal linking discipline across food brand content moves authority from recipe pages toward hero SKU product pages and comparison guides. Every recipe links to the hero SKU it uses inline (once in the ingredient list, once in a bottom call-out card). Every ingredient comparison guide links to 3 to 6 recipes using the winning ingredient plus the hero SKU product page. Every sourcing story links to the 2 to 4 SKUs sourced from that specific farm or cooperative.
Anchor text strategy across recipe hubs
Anchor text on internal links varies across recipe hubs to avoid over-optimization patterns Google penalizes. Exact-match anchor (“single-origin Ethiopian coffee”) runs on 20 to 30 percent of internal links. Partial-match variations (“our Ethiopian roast”) run on 30 to 40 percent. Branded anchors (the SKU name) run on 20 to 30 percent. Generic anchors (“shop the coffee”) fill the remaining 10 to 20 percent. This ratio holds ranking without triggering the over-optimization penalty that shows up on brands that anchor-text-stuff every internal link with the same exact-match keyword. Cross-reference the linking layer on our food and beverage web design page.
Link equity from ingredient guides to SKU pages
Link equity from ingredient guides passes to SKU pages when the guide’s comparison table names the hero SKU in the winning column with a product card, and when the guide’s body links to 3 to 6 recipes that use the winning ingredient. This 3-hop path (guide to recipe to SKU) pushes authority from a high-traffic informational query down to a high-intent transactional page. According to Search Engine Land SEO coverage, informational content that internally links to transactional pages produces 2 to 4 times higher organic revenue than isolated content silos.
Wrapping up content marketing for food brands
Content marketing for food brands is the organic engine that turns a DTC snack, drink, or CPG storefront into a search-driven revenue channel. Recipe hub of 40 to 100 recipes. Ingredient comparison guides at 12 to 24 pieces. Sourcing story pages at 6 to 12 pieces. Buyer intent content at 8 to 16 pieces. Creator syndication calendar with 12 to 30 creators per quarter. Refresh cadence at 12 to 24 months by pillar. Reporting with organic sessions and organic revenue attribution.
If your DTC food brand is running paid social at 20,000 dollars monthly with a broken blog and zero recipe schema, professional content marketing for food brands pays for itself inside the first 90 days on organic traffic captured. Redefine Web ships content marketing inside our monthly retainer packages. Book a call and we will walk through the last three DTC food brands we built recipe hubs for, pillar by pillar.
Content marketing for food brands starts with a recipe hub because recipe queries account for 40 to 60 percent of high-intent search volume in the food category. Every hero SKU needs 4 to 12 recipes anchored to it, each targeting a specific occasion and audience.
Skip the recipe hub and the brand loses the search real estate that pulls DTC storefront traffic month over month at zero incremental paid cost. Recipe traffic converts at 2 to 4 percent because the shopper landed with usage intent, not passive discovery, which is why food brands win on recipes.
Recipe schema and Google rich result eligibility
Every recipe page ships schema.org Recipe markup including cookTime, prepTime, recipeIngredient, recipeInstructions, nutrition, and aggregateRating. Correctly marked-up recipes qualify for Google’s recipe rich result carousel that pulls 3 to 6 times higher click-through rate than a plain blue link. The schema layer takes 15 minutes per recipe to author and 30 minutes to validate in Google Search Console. Cross-reference the recipe search stack on our food and beverage SEO page.
Recipe hub structure that scales
The recipe hub structure runs 40 to 100 recipes at maturity, organized by hero SKU (4 to 12 recipes per SKU) plus occasion tags (breakfast, weeknight dinner, meal prep, brunch, holiday). Every recipe links back to the hero SKU product page with the SKU embedded in an inline card. The hub earns internal linking value from ingredient comparison guides and the sourcing story pages, which feeds recipe ranking on Google. According to Google Search Central recipe structured data guidance, complete Recipe schema markup is required for eligibility in the recipe carousel and the ingredient search filter.
Pillar structure for food brand content marketing
The pillar structure on content marketing for food brands runs 4 content pillars concurrently: recipe hub (40 to 100 recipes), ingredient comparison guides (12 to 24 guides), sourcing story pages (6 to 12 pages), and buyer intent content (where to buy, subscription vs. one-time, gift bundle guides). Every pillar covers a distinct search intent and every pillar links back to the hero SKU product pages.
Ingredient comparison guide format
Ingredient comparison guides run 1,800 to 3,200 words comparing 2 to 4 ingredient types on 6 to 10 attributes with a comparison table, real-world use case examples, and links to the hero SKU that uses the specific ingredient. Example: organic vs. conventional oats compares nutritional profile, sourcing chain, cost, environmental impact, and taste on a 6-column table. The brand’s SKU appears in the winning column with a product card. These guides rank 3 to 8 months after publication and pull steady-state organic traffic.
Sourcing story pages that build trust
Sourcing story pages name the specific farms, cooperatives, or suppliers the brand sources from, with photos of the farms, farmer quotes, and specific harvest windows. A coffee brand’s Ethiopian farm page ranks for “single-origin Ethiopian coffee” and “Yirgacheffe coffee origin” plus 40 long-tail variations. The sourcing page pulls trust-building traffic that converts at 4 to 6 percent because the shopper landed pattern-matching on transparency and named provenance. Every sourcing page includes farmer or cooperative quotes, harvest dates, and a link back to 3 to 5 hero SKU pages that source from the named supplier.
Vejrø hospitality content case study
Vejrø Resort, a Danish private-island destination with an on-site restaurant focused on organic, locally sourced cuisine, joined us with strong social engagement and no organic-search real estate. Guests found the resort on Instagram but never in Google search for terms like “private island resort Denmark,” “farm-to-table hospitality Denmark,” or “Vejrø restaurant.” The same organic-search gap shows up on DTC food brands running paid social at 20,000 dollars monthly with a broken blog and zero recipe schema.
We built the conversion-focused website with on-site and off-site SEO tuned to the travel-niche keyword clusters, competitor analysis against comparable boutique resorts, and mobile-first design prioritizing guest discovery. Every page carried the structured data qualifying it for Google’s rich results in the hospitality category. Every internal link pushed authority toward the direct-booking conversion path.
Three months later, Vejrø hit 10,000 plus organic visitors, ranked for 200 plus first-page keywords, and pulled a 2.2 percent booking conversion rate from organic traffic. The same pattern applies to content marketing for food brands: recipe schema, ingredient comparison guides, and sourcing story pages pull organic traffic at 20 to 40 percent conversion into hero SKU pages inside 6 months when the content quality matches search intent and every page carries the right structured data markup. Vejrø also proved out the reporting discipline: every monthly report named the exact page, the exact keyword cluster, and the exact search feature (rich result, sitelinks, image pack) driving the incremental organic revenue instead of hiding behind aggregate traffic charts.
Recipe cadence and content calendar for food brands
Recipe cadence on a working food brand content calendar ships 2 to 4 new recipes per week during the first 6 months and drops to 1 per week at maturity. Each recipe takes 4 to 6 hours to produce (write, test in the kitchen, photograph, schema author, publish). At 3 recipes per week, the brand hits 78 recipes inside 6 months plus a backlog of ingredient comparison and sourcing content queued behind the recipe production line.
| Content pillar | Target volume year 1 | Production cost per piece | Refresh cadence |
|---|---|---|---|
| Recipe hub | 40 to 100 recipes | $180 to $320 | Every 12 months |
| Ingredient comparison guides | 12 to 24 guides | $450 to $780 | Every 18 months |
| Sourcing story pages | 6 to 12 pages | $680 to $1,200 | Every 24 months |
| Buyer intent content | 8 to 16 pieces | $220 to $420 | Every 12 months |
Photography as a content calendar constraint
Photography is the actual constraint on recipe cadence, not writing. Every recipe needs 6 to 12 photos: hero shot, ingredient flat lay, prep in progress, plated result, storage, and step shots for the schema markup. A working food brand batches photography 8 recipes at a time to keep the cost per recipe under 200 dollars. Skip the batching and the per-recipe cost climbs to 400 to 600 dollars, which caps recipe cadence at 1 per week and slows organic ranking timeline by 6 months.
Seasonal content calendar planning
Seasonal content calendar planning maps recipes and comparison guides to the seasonal windows they need to rank in. A Christmas cookie recipe needs to publish in September to rank by early December. A Valentine’s chocolate guide needs to publish in November to rank by early February. A back-to-school lunchbox recipe needs to publish in June to rank by late August. The 60-to-90-day ranking curve dictates the calendar.
Creator syndication inside food brand content
Creator syndication on food brand content marketing amplifies the recipe hub through Instagram Reels, TikTok, and YouTube Shorts creators paid to post their own version of the brand’s hero recipes. The creator content pulls net-new audiences into the recipe hub through the creator’s Link in Bio or Amazon Storefront tag. The syndication calendar names 12 to 30 creators per quarter with specific recipes assigned to each.
One brand we picked up had a spreadsheet titled “creator outreach 2023” with 47 rows and 3 responses. All 3 responses were auto-replies. The spreadsheet named zero recipes and offered flat rates below 100 dollars per post. Nobody posts a 30-second video for 87 dollars flat. Nobody.
Creator content commercial terms that work
Working creator content commercial terms run 350 to 1,500 dollars flat per post plus a 12 to 25 percent commission on tagged sales across a 30-day window. The commission mechanic pulls creators into follow-up posts because the incremental revenue continues past the initial fee. Mid-tier creators (30k to 150k followers) hit the sweet spot for food brand content because their engagement rate typically runs 4 to 8 percent versus 0.8 to 1.6 percent on mega-creators.
Content brief structure for creator partnerships
The content brief structure for creator partnerships runs a single page: the SKU, the specific recipe or usage occasion, 3 required brand mentions, 3 restricted claims (no health claims on non-medical SKUs), the pricing angle, the affiliate link, and 3 example videos that hit the tone. The brief avoids over-scripting because over-scripted creator content underperforms native creator voice by 40 to 60 percent on engagement rate.
Buyer intent content for food brand blogs
Buyer intent content on food brand blogs covers 8 to 16 pieces targeting explicit purchase-decision queries: “where to buy [brand],” “[brand] subscription vs. one-time,” “best [category] for [use case],” and “[brand] gift bundle.” Every buyer intent piece runs 1,400 to 2,400 words with a comparison table, product cards, and a clear conversion path to the specific SKU that matches the query intent. Buyer intent content converts at 3 to 6 percent versus 1 to 2 percent on recipe content because the shopper landed already planning to buy, not exploring a usage occasion.
Where-to-buy content structure
Where-to-buy content structure covers online (DTC storefront, Amazon, Target.com, Whole Foods online), retail (specific chain locators with the store finder embedded), and international (customs limitations, retailer partners abroad). Every piece names specific retailers, links to the store locator, and includes an FAQ block covering shipping availability, subscription options, and gift card compatibility. Where-to-buy content ranks for branded discovery queries the DTC storefront otherwise loses to competitor affiliate reviews.
Subscription versus one-time comparison content
Subscription versus one-time comparison content converts subscription commitments at 3 to 6 percent because it addresses the price-sensitivity concern head-on with a specific math table. The piece covers the discount structure (15 percent lifetime), the skip-a-month mechanic, the pause-anytime rule, the cancellation policy, and the specific yearly savings for the brand’s average consumption cadence. Cross-reference the retention structure on our food and beverage marketing retainer page.
Content refresh cadence on food brand pillars
Content refresh cadence on food brand content pillars runs a rolling audit every 12 to 24 months by pillar. Recipes get refreshed every 12 months with new photography, updated schema, and any nutrition or ingredient adjustments. Ingredient comparison guides refresh every 18 months to update market data. Sourcing story pages refresh every 24 months to reflect farm partnership changes and new harvest angles. Buyer intent content refreshes every 12 months to update retailer availability and pricing.
Recipe refresh priority order
Recipe refresh priority runs by organic traffic rank. The top 20 recipes by monthly organic sessions get refreshed first (new photography, schema audit, related recipe internal links, updated nutrition). The next 40 get refreshed at 15 months. The remaining recipes get refreshed opportunistically when the ranking slips past position 15 in Google. Skipping the refresh cadence lets recipe rankings drift out of the top 3 inside 18 months as newer competitor recipes take the position.
Schema audit checklist per refresh
The schema audit checklist per refresh runs 8 items: Recipe schema completeness, aggregateRating count and accuracy, nutrition data accuracy, prepTime and cookTime match the recipe body, image URLs valid at CDN, related recipe internal links working, product card SKU URL live, and Google Search Console rich result eligibility validated. This checklist takes 20 minutes per recipe and prevents the schema drift that costs recipe rankings 20 to 40 positions quietly.
Reporting cadence for food brand content marketing
Reporting cadence on food brand content marketing runs a monthly executive report plus a quarterly business review. The monthly report ships in the first business week and covers organic sessions by pillar, top 10 ranking recipes with position trend, ingredient guide ranking movements, sourcing page performance, and organic-attributed DTC revenue. Every number carries a comparison to the prior month and a plain-language interpretation the founder reads in 7 minutes.
Metrics that matter for content marketing
Metrics that matter for food brand content marketing: organic sessions by pillar, recipe rich result impressions in Search Console, organic conversion rate to hero SKU pages, organic-attributed DTC revenue, and top 20 ranking positions by monthly organic sessions. Vanity metrics that do not matter: total pageviews without conversion context, average time on page without conversion attribution, and social share counts. The monthly report skips the vanity block entirely.
Quarterly business review structure
The quarterly business review runs 90 minutes with the founder, head of content, and SEO lead. Agenda: organic traffic trend by pillar, top 10 winning content pieces, top 10 losing content pieces (candidates for refresh or removal), competitive gap analysis against 5 named competitor brands, and next quarter’s content calendar with recipes and ingredient guides queued. According to Ahrefs content marketing research, brands running quarterly content audits outperform brands running annual audits by 40 to 70 percent on organic revenue over a 24-month window.
Internal linking discipline across food brand content
Internal linking discipline across food brand content moves authority from recipe pages toward hero SKU product pages and comparison guides. Every recipe links to the hero SKU it uses inline (once in the ingredient list, once in a bottom call-out card). Every ingredient comparison guide links to 3 to 6 recipes using the winning ingredient plus the hero SKU product page. Every sourcing story links to the 2 to 4 SKUs sourced from that specific farm or cooperative.
Anchor text strategy across recipe hubs
Anchor text on internal links varies across recipe hubs to avoid over-optimization patterns Google penalizes. Exact-match anchor (“single-origin Ethiopian coffee”) runs on 20 to 30 percent of internal links. Partial-match variations (“our Ethiopian roast”) run on 30 to 40 percent. Branded anchors (the SKU name) run on 20 to 30 percent. Generic anchors (“shop the coffee”) fill the remaining 10 to 20 percent. This ratio holds ranking without triggering the over-optimization penalty that shows up on brands that anchor-text-stuff every internal link with the same exact-match keyword. Cross-reference the linking layer on our food and beverage web design page.
Link equity from ingredient guides to SKU pages
Link equity from ingredient guides passes to SKU pages when the guide’s comparison table names the hero SKU in the winning column with a product card, and when the guide’s body links to 3 to 6 recipes that use the winning ingredient. This 3-hop path (guide to recipe to SKU) pushes authority from a high-traffic informational query down to a high-intent transactional page. According to Search Engine Land SEO coverage, informational content that internally links to transactional pages produces 2 to 4 times higher organic revenue than isolated content silos.
Wrapping up content marketing for food brands
Content marketing for food brands is the organic engine that turns a DTC snack, drink, or CPG storefront into a search-driven revenue channel. Recipe hub of 40 to 100 recipes. Ingredient comparison guides at 12 to 24 pieces. Sourcing story pages at 6 to 12 pieces. Buyer intent content at 8 to 16 pieces. Creator syndication calendar with 12 to 30 creators per quarter. Refresh cadence at 12 to 24 months by pillar. Reporting with organic sessions and organic revenue attribution.
If your DTC food brand is running paid social at 20,000 dollars monthly with a broken blog and zero recipe schema, professional content marketing for food brands pays for itself inside the first 90 days on organic traffic captured. Redefine Web ships content marketing inside our monthly retainer packages. Book a call and we will walk through the last three DTC food brands we built recipe hubs for, pillar by pillar.
Content marketing for food brands starts with a recipe hub because recipe queries account for 40 to 60 percent of high-intent search volume in the food category. Every hero SKU needs 4 to 12 recipes anchored to it, each targeting a specific occasion and audience.
Skip the recipe hub and the brand loses the search real estate that pulls DTC storefront traffic month over month at zero incremental paid cost. Recipe traffic converts at 2 to 4 percent because the shopper landed with usage intent, not passive discovery, which is why food brands win on recipes.
Recipe schema and Google rich result eligibility
Every recipe page ships schema.org Recipe markup including cookTime, prepTime, recipeIngredient, recipeInstructions, nutrition, and aggregateRating. Correctly marked-up recipes qualify for Google’s recipe rich result carousel that pulls 3 to 6 times higher click-through rate than a plain blue link. The schema layer takes 15 minutes per recipe to author and 30 minutes to validate in Google Search Console. Cross-reference the recipe search stack on our food and beverage SEO page.
Recipe hub structure that scales
The recipe hub structure runs 40 to 100 recipes at maturity, organized by hero SKU (4 to 12 recipes per SKU) plus occasion tags (breakfast, weeknight dinner, meal prep, brunch, holiday). Every recipe links back to the hero SKU product page with the SKU embedded in an inline card. The hub earns internal linking value from ingredient comparison guides and the sourcing story pages, which feeds recipe ranking on Google. According to Google Search Central recipe structured data guidance, complete Recipe schema markup is required for eligibility in the recipe carousel and the ingredient search filter.
Pillar structure for food brand content marketing
The pillar structure on content marketing for food brands runs 4 content pillars concurrently: recipe hub (40 to 100 recipes), ingredient comparison guides (12 to 24 guides), sourcing story pages (6 to 12 pages), and buyer intent content (where to buy, subscription vs. one-time, gift bundle guides). Every pillar covers a distinct search intent and every pillar links back to the hero SKU product pages.
Ingredient comparison guide format
Ingredient comparison guides run 1,800 to 3,200 words comparing 2 to 4 ingredient types on 6 to 10 attributes with a comparison table, real-world use case examples, and links to the hero SKU that uses the specific ingredient. Example: organic vs. conventional oats compares nutritional profile, sourcing chain, cost, environmental impact, and taste on a 6-column table. The brand’s SKU appears in the winning column with a product card. These guides rank 3 to 8 months after publication and pull steady-state organic traffic.
Sourcing story pages that build trust
Sourcing story pages name the specific farms, cooperatives, or suppliers the brand sources from, with photos of the farms, farmer quotes, and specific harvest windows. A coffee brand’s Ethiopian farm page ranks for “single-origin Ethiopian coffee” and “Yirgacheffe coffee origin” plus 40 long-tail variations. The sourcing page pulls trust-building traffic that converts at 4 to 6 percent because the shopper landed pattern-matching on transparency and named provenance. Every sourcing page includes farmer or cooperative quotes, harvest dates, and a link back to 3 to 5 hero SKU pages that source from the named supplier.
Vejrø hospitality content case study
Vejrø Resort, a Danish private-island destination with an on-site restaurant focused on organic, locally sourced cuisine, joined us with strong social engagement and no organic-search real estate. Guests found the resort on Instagram but never in Google search for terms like “private island resort Denmark,” “farm-to-table hospitality Denmark,” or “Vejrø restaurant.” The same organic-search gap shows up on DTC food brands running paid social at 20,000 dollars monthly with a broken blog and zero recipe schema.
We built the conversion-focused website with on-site and off-site SEO tuned to the travel-niche keyword clusters, competitor analysis against comparable boutique resorts, and mobile-first design prioritizing guest discovery. Every page carried the structured data qualifying it for Google’s rich results in the hospitality category. Every internal link pushed authority toward the direct-booking conversion path.
Three months later, Vejrø hit 10,000 plus organic visitors, ranked for 200 plus first-page keywords, and pulled a 2.2 percent booking conversion rate from organic traffic. The same pattern applies to content marketing for food brands: recipe schema, ingredient comparison guides, and sourcing story pages pull organic traffic at 20 to 40 percent conversion into hero SKU pages inside 6 months when the content quality matches search intent and every page carries the right structured data markup. Vejrø also proved out the reporting discipline: every monthly report named the exact page, the exact keyword cluster, and the exact search feature (rich result, sitelinks, image pack) driving the incremental organic revenue instead of hiding behind aggregate traffic charts.
Recipe cadence and content calendar for food brands
Recipe cadence on a working food brand content calendar ships 2 to 4 new recipes per week during the first 6 months and drops to 1 per week at maturity. Each recipe takes 4 to 6 hours to produce (write, test in the kitchen, photograph, schema author, publish). At 3 recipes per week, the brand hits 78 recipes inside 6 months plus a backlog of ingredient comparison and sourcing content queued behind the recipe production line.
| Content pillar | Target volume year 1 | Production cost per piece | Refresh cadence |
|---|---|---|---|
| Recipe hub | 40 to 100 recipes | $180 to $320 | Every 12 months |
| Ingredient comparison guides | 12 to 24 guides | $450 to $780 | Every 18 months |
| Sourcing story pages | 6 to 12 pages | $680 to $1,200 | Every 24 months |
| Buyer intent content | 8 to 16 pieces | $220 to $420 | Every 12 months |
Photography as a content calendar constraint
Photography is the actual constraint on recipe cadence, not writing. Every recipe needs 6 to 12 photos: hero shot, ingredient flat lay, prep in progress, plated result, storage, and step shots for the schema markup. A working food brand batches photography 8 recipes at a time to keep the cost per recipe under 200 dollars. Skip the batching and the per-recipe cost climbs to 400 to 600 dollars, which caps recipe cadence at 1 per week and slows organic ranking timeline by 6 months.
Seasonal content calendar planning
Seasonal content calendar planning maps recipes and comparison guides to the seasonal windows they need to rank in. A Christmas cookie recipe needs to publish in September to rank by early December. A Valentine’s chocolate guide needs to publish in November to rank by early February. A back-to-school lunchbox recipe needs to publish in June to rank by late August. The 60-to-90-day ranking curve dictates the calendar.
Creator syndication inside food brand content
Creator syndication on food brand content marketing amplifies the recipe hub through Instagram Reels, TikTok, and YouTube Shorts creators paid to post their own version of the brand’s hero recipes. The creator content pulls net-new audiences into the recipe hub through the creator’s Link in Bio or Amazon Storefront tag. The syndication calendar names 12 to 30 creators per quarter with specific recipes assigned to each.
One brand we picked up had a spreadsheet titled “creator outreach 2023” with 47 rows and 3 responses. All 3 responses were auto-replies. The spreadsheet named zero recipes and offered flat rates below 100 dollars per post. Nobody posts a 30-second video for 87 dollars flat. Nobody.
Creator content commercial terms that work
Working creator content commercial terms run 350 to 1,500 dollars flat per post plus a 12 to 25 percent commission on tagged sales across a 30-day window. The commission mechanic pulls creators into follow-up posts because the incremental revenue continues past the initial fee. Mid-tier creators (30k to 150k followers) hit the sweet spot for food brand content because their engagement rate typically runs 4 to 8 percent versus 0.8 to 1.6 percent on mega-creators.
Content brief structure for creator partnerships
The content brief structure for creator partnerships runs a single page: the SKU, the specific recipe or usage occasion, 3 required brand mentions, 3 restricted claims (no health claims on non-medical SKUs), the pricing angle, the affiliate link, and 3 example videos that hit the tone. The brief avoids over-scripting because over-scripted creator content underperforms native creator voice by 40 to 60 percent on engagement rate.
Buyer intent content for food brand blogs
Buyer intent content on food brand blogs covers 8 to 16 pieces targeting explicit purchase-decision queries: “where to buy [brand],” “[brand] subscription vs. one-time,” “best [category] for [use case],” and “[brand] gift bundle.” Every buyer intent piece runs 1,400 to 2,400 words with a comparison table, product cards, and a clear conversion path to the specific SKU that matches the query intent. Buyer intent content converts at 3 to 6 percent versus 1 to 2 percent on recipe content because the shopper landed already planning to buy, not exploring a usage occasion.
Where-to-buy content structure
Where-to-buy content structure covers online (DTC storefront, Amazon, Target.com, Whole Foods online), retail (specific chain locators with the store finder embedded), and international (customs limitations, retailer partners abroad). Every piece names specific retailers, links to the store locator, and includes an FAQ block covering shipping availability, subscription options, and gift card compatibility. Where-to-buy content ranks for branded discovery queries the DTC storefront otherwise loses to competitor affiliate reviews.
Subscription versus one-time comparison content
Subscription versus one-time comparison content converts subscription commitments at 3 to 6 percent because it addresses the price-sensitivity concern head-on with a specific math table. The piece covers the discount structure (15 percent lifetime), the skip-a-month mechanic, the pause-anytime rule, the cancellation policy, and the specific yearly savings for the brand’s average consumption cadence. Cross-reference the retention structure on our food and beverage marketing retainer page.
Content refresh cadence on food brand pillars
Content refresh cadence on food brand content pillars runs a rolling audit every 12 to 24 months by pillar. Recipes get refreshed every 12 months with new photography, updated schema, and any nutrition or ingredient adjustments. Ingredient comparison guides refresh every 18 months to update market data. Sourcing story pages refresh every 24 months to reflect farm partnership changes and new harvest angles. Buyer intent content refreshes every 12 months to update retailer availability and pricing.
Recipe refresh priority order
Recipe refresh priority runs by organic traffic rank. The top 20 recipes by monthly organic sessions get refreshed first (new photography, schema audit, related recipe internal links, updated nutrition). The next 40 get refreshed at 15 months. The remaining recipes get refreshed opportunistically when the ranking slips past position 15 in Google. Skipping the refresh cadence lets recipe rankings drift out of the top 3 inside 18 months as newer competitor recipes take the position.
Schema audit checklist per refresh
The schema audit checklist per refresh runs 8 items: Recipe schema completeness, aggregateRating count and accuracy, nutrition data accuracy, prepTime and cookTime match the recipe body, image URLs valid at CDN, related recipe internal links working, product card SKU URL live, and Google Search Console rich result eligibility validated. This checklist takes 20 minutes per recipe and prevents the schema drift that costs recipe rankings 20 to 40 positions quietly.
Reporting cadence for food brand content marketing
Reporting cadence on food brand content marketing runs a monthly executive report plus a quarterly business review. The monthly report ships in the first business week and covers organic sessions by pillar, top 10 ranking recipes with position trend, ingredient guide ranking movements, sourcing page performance, and organic-attributed DTC revenue. Every number carries a comparison to the prior month and a plain-language interpretation the founder reads in 7 minutes.
Metrics that matter for content marketing
Metrics that matter for food brand content marketing: organic sessions by pillar, recipe rich result impressions in Search Console, organic conversion rate to hero SKU pages, organic-attributed DTC revenue, and top 20 ranking positions by monthly organic sessions. Vanity metrics that do not matter: total pageviews without conversion context, average time on page without conversion attribution, and social share counts. The monthly report skips the vanity block entirely.
Quarterly business review structure
The quarterly business review runs 90 minutes with the founder, head of content, and SEO lead. Agenda: organic traffic trend by pillar, top 10 winning content pieces, top 10 losing content pieces (candidates for refresh or removal), competitive gap analysis against 5 named competitor brands, and next quarter’s content calendar with recipes and ingredient guides queued. According to Ahrefs content marketing research, brands running quarterly content audits outperform brands running annual audits by 40 to 70 percent on organic revenue over a 24-month window.
Internal linking discipline across food brand content
Internal linking discipline across food brand content moves authority from recipe pages toward hero SKU product pages and comparison guides. Every recipe links to the hero SKU it uses inline (once in the ingredient list, once in a bottom call-out card). Every ingredient comparison guide links to 3 to 6 recipes using the winning ingredient plus the hero SKU product page. Every sourcing story links to the 2 to 4 SKUs sourced from that specific farm or cooperative.
Anchor text strategy across recipe hubs
Anchor text on internal links varies across recipe hubs to avoid over-optimization patterns Google penalizes. Exact-match anchor (“single-origin Ethiopian coffee”) runs on 20 to 30 percent of internal links. Partial-match variations (“our Ethiopian roast”) run on 30 to 40 percent. Branded anchors (the SKU name) run on 20 to 30 percent. Generic anchors (“shop the coffee”) fill the remaining 10 to 20 percent. This ratio holds ranking without triggering the over-optimization penalty that shows up on brands that anchor-text-stuff every internal link with the same exact-match keyword. Cross-reference the linking layer on our food and beverage web design page.
Link equity from ingredient guides to SKU pages
Link equity from ingredient guides passes to SKU pages when the guide’s comparison table names the hero SKU in the winning column with a product card, and when the guide’s body links to 3 to 6 recipes that use the winning ingredient. This 3-hop path (guide to recipe to SKU) pushes authority from a high-traffic informational query down to a high-intent transactional page. According to Search Engine Land SEO coverage, informational content that internally links to transactional pages produces 2 to 4 times higher organic revenue than isolated content silos.
Wrapping up content marketing for food brands
Content marketing for food brands is the organic engine that turns a DTC snack, drink, or CPG storefront into a search-driven revenue channel. Recipe hub of 40 to 100 recipes. Ingredient comparison guides at 12 to 24 pieces. Sourcing story pages at 6 to 12 pieces. Buyer intent content at 8 to 16 pieces. Creator syndication calendar with 12 to 30 creators per quarter. Refresh cadence at 12 to 24 months by pillar. Reporting with organic sessions and organic revenue attribution.
If your DTC food brand is running paid social at 20,000 dollars monthly with a broken blog and zero recipe schema, professional content marketing for food brands pays for itself inside the first 90 days on organic traffic captured. Redefine Web ships content marketing inside our monthly retainer packages. Book a call and we will walk through the last three DTC food brands we built recipe hubs for, pillar by pillar.
Content marketing for food brands starts with a recipe hub because recipe queries account for 40 to 60 percent of high-intent search volume in the food category. Every hero SKU needs 4 to 12 recipes anchored to it, each targeting a specific occasion and audience.
Skip the recipe hub and the brand loses the search real estate that pulls DTC storefront traffic month over month at zero incremental paid cost. Recipe traffic converts at 2 to 4 percent because the shopper landed with usage intent, not passive discovery, which is why food brands win on recipes.
Recipe schema and Google rich result eligibility
Every recipe page ships schema.org Recipe markup including cookTime, prepTime, recipeIngredient, recipeInstructions, nutrition, and aggregateRating. Correctly marked-up recipes qualify for Google’s recipe rich result carousel that pulls 3 to 6 times higher click-through rate than a plain blue link. The schema layer takes 15 minutes per recipe to author and 30 minutes to validate in Google Search Console. Cross-reference the recipe search stack on our food and beverage SEO page.
Recipe hub structure that scales
The recipe hub structure runs 40 to 100 recipes at maturity, organized by hero SKU (4 to 12 recipes per SKU) plus occasion tags (breakfast, weeknight dinner, meal prep, brunch, holiday). Every recipe links back to the hero SKU product page with the SKU embedded in an inline card. The hub earns internal linking value from ingredient comparison guides and the sourcing story pages, which feeds recipe ranking on Google. According to Google Search Central recipe structured data guidance, complete Recipe schema markup is required for eligibility in the recipe carousel and the ingredient search filter.
Pillar structure for food brand content marketing
The pillar structure on content marketing for food brands runs 4 content pillars concurrently: recipe hub (40 to 100 recipes), ingredient comparison guides (12 to 24 guides), sourcing story pages (6 to 12 pages), and buyer intent content (where to buy, subscription vs. one-time, gift bundle guides). Every pillar covers a distinct search intent and every pillar links back to the hero SKU product pages.
Ingredient comparison guide format
Ingredient comparison guides run 1,800 to 3,200 words comparing 2 to 4 ingredient types on 6 to 10 attributes with a comparison table, real-world use case examples, and links to the hero SKU that uses the specific ingredient. Example: organic vs. conventional oats compares nutritional profile, sourcing chain, cost, environmental impact, and taste on a 6-column table. The brand’s SKU appears in the winning column with a product card. These guides rank 3 to 8 months after publication and pull steady-state organic traffic.
Sourcing story pages that build trust
Sourcing story pages name the specific farms, cooperatives, or suppliers the brand sources from, with photos of the farms, farmer quotes, and specific harvest windows. A coffee brand’s Ethiopian farm page ranks for “single-origin Ethiopian coffee” and “Yirgacheffe coffee origin” plus 40 long-tail variations. The sourcing page pulls trust-building traffic that converts at 4 to 6 percent because the shopper landed pattern-matching on transparency and named provenance. Every sourcing page includes farmer or cooperative quotes, harvest dates, and a link back to 3 to 5 hero SKU pages that source from the named supplier.
Vejrø hospitality content case study
Vejrø Resort, a Danish private-island destination with an on-site restaurant focused on organic, locally sourced cuisine, joined us with strong social engagement and no organic-search real estate. Guests found the resort on Instagram but never in Google search for terms like “private island resort Denmark,” “farm-to-table hospitality Denmark,” or “Vejrø restaurant.” The same organic-search gap shows up on DTC food brands running paid social at 20,000 dollars monthly with a broken blog and zero recipe schema.
We built the conversion-focused website with on-site and off-site SEO tuned to the travel-niche keyword clusters, competitor analysis against comparable boutique resorts, and mobile-first design prioritizing guest discovery. Every page carried the structured data qualifying it for Google’s rich results in the hospitality category. Every internal link pushed authority toward the direct-booking conversion path.
Three months later, Vejrø hit 10,000 plus organic visitors, ranked for 200 plus first-page keywords, and pulled a 2.2 percent booking conversion rate from organic traffic. The same pattern applies to content marketing for food brands: recipe schema, ingredient comparison guides, and sourcing story pages pull organic traffic at 20 to 40 percent conversion into hero SKU pages inside 6 months when the content quality matches search intent and every page carries the right structured data markup. Vejrø also proved out the reporting discipline: every monthly report named the exact page, the exact keyword cluster, and the exact search feature (rich result, sitelinks, image pack) driving the incremental organic revenue instead of hiding behind aggregate traffic charts.
Recipe cadence and content calendar for food brands
Recipe cadence on a working food brand content calendar ships 2 to 4 new recipes per week during the first 6 months and drops to 1 per week at maturity. Each recipe takes 4 to 6 hours to produce (write, test in the kitchen, photograph, schema author, publish). At 3 recipes per week, the brand hits 78 recipes inside 6 months plus a backlog of ingredient comparison and sourcing content queued behind the recipe production line.
| Content pillar | Target volume year 1 | Production cost per piece | Refresh cadence |
|---|---|---|---|
| Recipe hub | 40 to 100 recipes | $180 to $320 | Every 12 months |
| Ingredient comparison guides | 12 to 24 guides | $450 to $780 | Every 18 months |
| Sourcing story pages | 6 to 12 pages | $680 to $1,200 | Every 24 months |
| Buyer intent content | 8 to 16 pieces | $220 to $420 | Every 12 months |
Photography as a content calendar constraint
Photography is the actual constraint on recipe cadence, not writing. Every recipe needs 6 to 12 photos: hero shot, ingredient flat lay, prep in progress, plated result, storage, and step shots for the schema markup. A working food brand batches photography 8 recipes at a time to keep the cost per recipe under 200 dollars. Skip the batching and the per-recipe cost climbs to 400 to 600 dollars, which caps recipe cadence at 1 per week and slows organic ranking timeline by 6 months.
Seasonal content calendar planning
Seasonal content calendar planning maps recipes and comparison guides to the seasonal windows they need to rank in. A Christmas cookie recipe needs to publish in September to rank by early December. A Valentine’s chocolate guide needs to publish in November to rank by early February. A back-to-school lunchbox recipe needs to publish in June to rank by late August. The 60-to-90-day ranking curve dictates the calendar.
Creator syndication inside food brand content
Creator syndication on food brand content marketing amplifies the recipe hub through Instagram Reels, TikTok, and YouTube Shorts creators paid to post their own version of the brand’s hero recipes. The creator content pulls net-new audiences into the recipe hub through the creator’s Link in Bio or Amazon Storefront tag. The syndication calendar names 12 to 30 creators per quarter with specific recipes assigned to each.
One brand we picked up had a spreadsheet titled “creator outreach 2023” with 47 rows and 3 responses. All 3 responses were auto-replies. The spreadsheet named zero recipes and offered flat rates below 100 dollars per post. Nobody posts a 30-second video for 87 dollars flat. Nobody.
Creator content commercial terms that work
Working creator content commercial terms run 350 to 1,500 dollars flat per post plus a 12 to 25 percent commission on tagged sales across a 30-day window. The commission mechanic pulls creators into follow-up posts because the incremental revenue continues past the initial fee. Mid-tier creators (30k to 150k followers) hit the sweet spot for food brand content because their engagement rate typically runs 4 to 8 percent versus 0.8 to 1.6 percent on mega-creators.
Content brief structure for creator partnerships
The content brief structure for creator partnerships runs a single page: the SKU, the specific recipe or usage occasion, 3 required brand mentions, 3 restricted claims (no health claims on non-medical SKUs), the pricing angle, the affiliate link, and 3 example videos that hit the tone. The brief avoids over-scripting because over-scripted creator content underperforms native creator voice by 40 to 60 percent on engagement rate.
Buyer intent content for food brand blogs
Buyer intent content on food brand blogs covers 8 to 16 pieces targeting explicit purchase-decision queries: “where to buy [brand],” “[brand] subscription vs. one-time,” “best [category] for [use case],” and “[brand] gift bundle.” Every buyer intent piece runs 1,400 to 2,400 words with a comparison table, product cards, and a clear conversion path to the specific SKU that matches the query intent. Buyer intent content converts at 3 to 6 percent versus 1 to 2 percent on recipe content because the shopper landed already planning to buy, not exploring a usage occasion.
Where-to-buy content structure
Where-to-buy content structure covers online (DTC storefront, Amazon, Target.com, Whole Foods online), retail (specific chain locators with the store finder embedded), and international (customs limitations, retailer partners abroad). Every piece names specific retailers, links to the store locator, and includes an FAQ block covering shipping availability, subscription options, and gift card compatibility. Where-to-buy content ranks for branded discovery queries the DTC storefront otherwise loses to competitor affiliate reviews.
Subscription versus one-time comparison content
Subscription versus one-time comparison content converts subscription commitments at 3 to 6 percent because it addresses the price-sensitivity concern head-on with a specific math table. The piece covers the discount structure (15 percent lifetime), the skip-a-month mechanic, the pause-anytime rule, the cancellation policy, and the specific yearly savings for the brand’s average consumption cadence. Cross-reference the retention structure on our food and beverage marketing retainer page.
Content refresh cadence on food brand pillars
Content refresh cadence on food brand content pillars runs a rolling audit every 12 to 24 months by pillar. Recipes get refreshed every 12 months with new photography, updated schema, and any nutrition or ingredient adjustments. Ingredient comparison guides refresh every 18 months to update market data. Sourcing story pages refresh every 24 months to reflect farm partnership changes and new harvest angles. Buyer intent content refreshes every 12 months to update retailer availability and pricing.
Recipe refresh priority order
Recipe refresh priority runs by organic traffic rank. The top 20 recipes by monthly organic sessions get refreshed first (new photography, schema audit, related recipe internal links, updated nutrition). The next 40 get refreshed at 15 months. The remaining recipes get refreshed opportunistically when the ranking slips past position 15 in Google. Skipping the refresh cadence lets recipe rankings drift out of the top 3 inside 18 months as newer competitor recipes take the position.
Schema audit checklist per refresh
The schema audit checklist per refresh runs 8 items: Recipe schema completeness, aggregateRating count and accuracy, nutrition data accuracy, prepTime and cookTime match the recipe body, image URLs valid at CDN, related recipe internal links working, product card SKU URL live, and Google Search Console rich result eligibility validated. This checklist takes 20 minutes per recipe and prevents the schema drift that costs recipe rankings 20 to 40 positions quietly.
Reporting cadence for food brand content marketing
Reporting cadence on food brand content marketing runs a monthly executive report plus a quarterly business review. The monthly report ships in the first business week and covers organic sessions by pillar, top 10 ranking recipes with position trend, ingredient guide ranking movements, sourcing page performance, and organic-attributed DTC revenue. Every number carries a comparison to the prior month and a plain-language interpretation the founder reads in 7 minutes.
Metrics that matter for content marketing
Metrics that matter for food brand content marketing: organic sessions by pillar, recipe rich result impressions in Search Console, organic conversion rate to hero SKU pages, organic-attributed DTC revenue, and top 20 ranking positions by monthly organic sessions. Vanity metrics that do not matter: total pageviews without conversion context, average time on page without conversion attribution, and social share counts. The monthly report skips the vanity block entirely.
Quarterly business review structure
The quarterly business review runs 90 minutes with the founder, head of content, and SEO lead. Agenda: organic traffic trend by pillar, top 10 winning content pieces, top 10 losing content pieces (candidates for refresh or removal), competitive gap analysis against 5 named competitor brands, and next quarter’s content calendar with recipes and ingredient guides queued. According to Ahrefs content marketing research, brands running quarterly content audits outperform brands running annual audits by 40 to 70 percent on organic revenue over a 24-month window.
Internal linking discipline across food brand content
Internal linking discipline across food brand content moves authority from recipe pages toward hero SKU product pages and comparison guides. Every recipe links to the hero SKU it uses inline (once in the ingredient list, once in a bottom call-out card). Every ingredient comparison guide links to 3 to 6 recipes using the winning ingredient plus the hero SKU product page. Every sourcing story links to the 2 to 4 SKUs sourced from that specific farm or cooperative.
Anchor text strategy across recipe hubs
Anchor text on internal links varies across recipe hubs to avoid over-optimization patterns Google penalizes. Exact-match anchor (“single-origin Ethiopian coffee”) runs on 20 to 30 percent of internal links. Partial-match variations (“our Ethiopian roast”) run on 30 to 40 percent. Branded anchors (the SKU name) run on 20 to 30 percent. Generic anchors (“shop the coffee”) fill the remaining 10 to 20 percent. This ratio holds ranking without triggering the over-optimization penalty that shows up on brands that anchor-text-stuff every internal link with the same exact-match keyword. Cross-reference the linking layer on our food and beverage web design page.
Link equity from ingredient guides to SKU pages
Link equity from ingredient guides passes to SKU pages when the guide’s comparison table names the hero SKU in the winning column with a product card, and when the guide’s body links to 3 to 6 recipes that use the winning ingredient. This 3-hop path (guide to recipe to SKU) pushes authority from a high-traffic informational query down to a high-intent transactional page. According to Search Engine Land SEO coverage, informational content that internally links to transactional pages produces 2 to 4 times higher organic revenue than isolated content silos.
Wrapping up content marketing for food brands
Content marketing for food brands is the organic engine that turns a DTC snack, drink, or CPG storefront into a search-driven revenue channel. Recipe hub of 40 to 100 recipes. Ingredient comparison guides at 12 to 24 pieces. Sourcing story pages at 6 to 12 pieces. Buyer intent content at 8 to 16 pieces. Creator syndication calendar with 12 to 30 creators per quarter. Refresh cadence at 12 to 24 months by pillar. Reporting with organic sessions and organic revenue attribution.
If your DTC food brand is running paid social at 20,000 dollars monthly with a broken blog and zero recipe schema, professional content marketing for food brands pays for itself inside the first 90 days on organic traffic captured. Redefine Web ships content marketing inside our monthly retainer packages. Book a call and we will walk through the last three DTC food brands we built recipe hubs for, pillar by pillar.
Anchor text on internal links varies across recipe hubs to avoid over-optimization patterns Google penalizes. Exact-match anchor (“single-origin Ethiopian coffee”) runs on 20 to 30 percent of internal links. Partial-match variations (“our Ethiopian roast”) run on 30 to 40 percent. Branded anchors (the SKU name) run on 20 to 30 percent. Generic anchors (“shop the coffee”) fill the remaining 10 to 20 percent. This ratio holds ranking without triggering the over-optimization penalty that shows up on brands that anchor-text-stuff every internal link with the same exact-match keyword. Cross-reference the linking layer on our food and beverage web design page.
Link equity from ingredient guides to SKU pages
Link equity from ingredient guides passes to SKU pages when the guide’s comparison table names the hero SKU in the winning column with a product card, and when the guide’s body links to 3 to 6 recipes that use the winning ingredient. This 3-hop path (guide to recipe to SKU) pushes authority from a high-traffic informational query down to a high-intent transactional page. According to Search Engine Land SEO coverage, informational content that internally links to transactional pages produces 2 to 4 times higher organic revenue than isolated content silos.
Wrapping up content marketing for food brands
Content marketing for food brands is the organic engine that turns a DTC snack, drink, or CPG storefront into a search-driven revenue channel. Recipe hub of 40 to 100 recipes. Ingredient comparison guides at 12 to 24 pieces. Sourcing story pages at 6 to 12 pieces. Buyer intent content at 8 to 16 pieces. Creator syndication calendar with 12 to 30 creators per quarter. Refresh cadence at 12 to 24 months by pillar. Reporting with organic sessions and organic revenue attribution.
If your DTC food brand is running paid social at 20,000 dollars monthly with a broken blog and zero recipe schema, professional content marketing for food brands pays for itself inside the first 90 days on organic traffic captured. Redefine Web ships content marketing inside our monthly retainer packages. Book a call and we will walk through the last three DTC food brands we built recipe hubs for, pillar by pillar.
Content marketing for food brands starts with a recipe hub because recipe queries account for 40 to 60 percent of high-intent search volume in the food category. Every hero SKU needs 4 to 12 recipes anchored to it, each targeting a specific occasion and audience.
Skip the recipe hub and the brand loses the search real estate that pulls DTC storefront traffic month over month at zero incremental paid cost. Recipe traffic converts at 2 to 4 percent because the shopper landed with usage intent, not passive discovery, which is why food brands win on recipes.
Recipe schema and Google rich result eligibility
Every recipe page ships schema.org Recipe markup including cookTime, prepTime, recipeIngredient, recipeInstructions, nutrition, and aggregateRating. Correctly marked-up recipes qualify for Google’s recipe rich result carousel that pulls 3 to 6 times higher click-through rate than a plain blue link. The schema layer takes 15 minutes per recipe to author and 30 minutes to validate in Google Search Console. Cross-reference the recipe search stack on our food and beverage SEO page.
Recipe hub structure that scales
The recipe hub structure runs 40 to 100 recipes at maturity, organized by hero SKU (4 to 12 recipes per SKU) plus occasion tags (breakfast, weeknight dinner, meal prep, brunch, holiday). Every recipe links back to the hero SKU product page with the SKU embedded in an inline card. The hub earns internal linking value from ingredient comparison guides and the sourcing story pages, which feeds recipe ranking on Google. According to Google Search Central recipe structured data guidance, complete Recipe schema markup is required for eligibility in the recipe carousel and the ingredient search filter.
Pillar structure for food brand content marketing
The pillar structure on content marketing for food brands runs 4 content pillars concurrently: recipe hub (40 to 100 recipes), ingredient comparison guides (12 to 24 guides), sourcing story pages (6 to 12 pages), and buyer intent content (where to buy, subscription vs. one-time, gift bundle guides). Every pillar covers a distinct search intent and every pillar links back to the hero SKU product pages.
Ingredient comparison guide format
Ingredient comparison guides run 1,800 to 3,200 words comparing 2 to 4 ingredient types on 6 to 10 attributes with a comparison table, real-world use case examples, and links to the hero SKU that uses the specific ingredient. Example: organic vs. conventional oats compares nutritional profile, sourcing chain, cost, environmental impact, and taste on a 6-column table. The brand’s SKU appears in the winning column with a product card. These guides rank 3 to 8 months after publication and pull steady-state organic traffic.
Sourcing story pages that build trust
Sourcing story pages name the specific farms, cooperatives, or suppliers the brand sources from, with photos of the farms, farmer quotes, and specific harvest windows. A coffee brand’s Ethiopian farm page ranks for “single-origin Ethiopian coffee” and “Yirgacheffe coffee origin” plus 40 long-tail variations. The sourcing page pulls trust-building traffic that converts at 4 to 6 percent because the shopper landed pattern-matching on transparency and named provenance. Every sourcing page includes farmer or cooperative quotes, harvest dates, and a link back to 3 to 5 hero SKU pages that source from the named supplier.
Vejrø hospitality content case study
Vejrø Resort, a Danish private-island destination with an on-site restaurant focused on organic, locally sourced cuisine, joined us with strong social engagement and no organic-search real estate. Guests found the resort on Instagram but never in Google search for terms like “private island resort Denmark,” “farm-to-table hospitality Denmark,” or “Vejrø restaurant.” The same organic-search gap shows up on DTC food brands running paid social at 20,000 dollars monthly with a broken blog and zero recipe schema.
We built the conversion-focused website with on-site and off-site SEO tuned to the travel-niche keyword clusters, competitor analysis against comparable boutique resorts, and mobile-first design prioritizing guest discovery. Every page carried the structured data qualifying it for Google’s rich results in the hospitality category. Every internal link pushed authority toward the direct-booking conversion path.
Three months later, Vejrø hit 10,000 plus organic visitors, ranked for 200 plus first-page keywords, and pulled a 2.2 percent booking conversion rate from organic traffic. The same pattern applies to content marketing for food brands: recipe schema, ingredient comparison guides, and sourcing story pages pull organic traffic at 20 to 40 percent conversion into hero SKU pages inside 6 months when the content quality matches search intent and every page carries the right structured data markup. Vejrø also proved out the reporting discipline: every monthly report named the exact page, the exact keyword cluster, and the exact search feature (rich result, sitelinks, image pack) driving the incremental organic revenue instead of hiding behind aggregate traffic charts.
Recipe cadence and content calendar for food brands
Recipe cadence on a working food brand content calendar ships 2 to 4 new recipes per week during the first 6 months and drops to 1 per week at maturity. Each recipe takes 4 to 6 hours to produce (write, test in the kitchen, photograph, schema author, publish). At 3 recipes per week, the brand hits 78 recipes inside 6 months plus a backlog of ingredient comparison and sourcing content queued behind the recipe production line.
| Content pillar | Target volume year 1 | Production cost per piece | Refresh cadence |
|---|---|---|---|
| Recipe hub | 40 to 100 recipes | $180 to $320 | Every 12 months |
| Ingredient comparison guides | 12 to 24 guides | $450 to $780 | Every 18 months |
| Sourcing story pages | 6 to 12 pages | $680 to $1,200 | Every 24 months |
| Buyer intent content | 8 to 16 pieces | $220 to $420 | Every 12 months |
Photography as a content calendar constraint
Photography is the actual constraint on recipe cadence, not writing. Every recipe needs 6 to 12 photos: hero shot, ingredient flat lay, prep in progress, plated result, storage, and step shots for the schema markup. A working food brand batches photography 8 recipes at a time to keep the cost per recipe under 200 dollars. Skip the batching and the per-recipe cost climbs to 400 to 600 dollars, which caps recipe cadence at 1 per week and slows organic ranking timeline by 6 months.
Seasonal content calendar planning
Seasonal content calendar planning maps recipes and comparison guides to the seasonal windows they need to rank in. A Christmas cookie recipe needs to publish in September to rank by early December. A Valentine’s chocolate guide needs to publish in November to rank by early February. A back-to-school lunchbox recipe needs to publish in June to rank by late August. The 60-to-90-day ranking curve dictates the calendar.
Creator syndication inside food brand content
Creator syndication on food brand content marketing amplifies the recipe hub through Instagram Reels, TikTok, and YouTube Shorts creators paid to post their own version of the brand’s hero recipes. The creator content pulls net-new audiences into the recipe hub through the creator’s Link in Bio or Amazon Storefront tag. The syndication calendar names 12 to 30 creators per quarter with specific recipes assigned to each.
One brand we picked up had a spreadsheet titled “creator outreach 2023” with 47 rows and 3 responses. All 3 responses were auto-replies. The spreadsheet named zero recipes and offered flat rates below 100 dollars per post. Nobody posts a 30-second video for 87 dollars flat. Nobody.
Creator content commercial terms that work
Working creator content commercial terms run 350 to 1,500 dollars flat per post plus a 12 to 25 percent commission on tagged sales across a 30-day window. The commission mechanic pulls creators into follow-up posts because the incremental revenue continues past the initial fee. Mid-tier creators (30k to 150k followers) hit the sweet spot for food brand content because their engagement rate typically runs 4 to 8 percent versus 0.8 to 1.6 percent on mega-creators.
Content brief structure for creator partnerships
The content brief structure for creator partnerships runs a single page: the SKU, the specific recipe or usage occasion, 3 required brand mentions, 3 restricted claims (no health claims on non-medical SKUs), the pricing angle, the affiliate link, and 3 example videos that hit the tone. The brief avoids over-scripting because over-scripted creator content underperforms native creator voice by 40 to 60 percent on engagement rate.
Buyer intent content for food brand blogs
Buyer intent content on food brand blogs covers 8 to 16 pieces targeting explicit purchase-decision queries: “where to buy [brand],” “[brand] subscription vs. one-time,” “best [category] for [use case],” and “[brand] gift bundle.” Every buyer intent piece runs 1,400 to 2,400 words with a comparison table, product cards, and a clear conversion path to the specific SKU that matches the query intent. Buyer intent content converts at 3 to 6 percent versus 1 to 2 percent on recipe content because the shopper landed already planning to buy, not exploring a usage occasion.
Where-to-buy content structure
Where-to-buy content structure covers online (DTC storefront, Amazon, Target.com, Whole Foods online), retail (specific chain locators with the store finder embedded), and international (customs limitations, retailer partners abroad). Every piece names specific retailers, links to the store locator, and includes an FAQ block covering shipping availability, subscription options, and gift card compatibility. Where-to-buy content ranks for branded discovery queries the DTC storefront otherwise loses to competitor affiliate reviews.
Subscription versus one-time comparison content
Subscription versus one-time comparison content converts subscription commitments at 3 to 6 percent because it addresses the price-sensitivity concern head-on with a specific math table. The piece covers the discount structure (15 percent lifetime), the skip-a-month mechanic, the pause-anytime rule, the cancellation policy, and the specific yearly savings for the brand’s average consumption cadence. Cross-reference the retention structure on our food and beverage marketing retainer page.
Content refresh cadence on food brand pillars
Content refresh cadence on food brand content pillars runs a rolling audit every 12 to 24 months by pillar. Recipes get refreshed every 12 months with new photography, updated schema, and any nutrition or ingredient adjustments. Ingredient comparison guides refresh every 18 months to update market data. Sourcing story pages refresh every 24 months to reflect farm partnership changes and new harvest angles. Buyer intent content refreshes every 12 months to update retailer availability and pricing.
Recipe refresh priority order
Recipe refresh priority runs by organic traffic rank. The top 20 recipes by monthly organic sessions get refreshed first (new photography, schema audit, related recipe internal links, updated nutrition). The next 40 get refreshed at 15 months. The remaining recipes get refreshed opportunistically when the ranking slips past position 15 in Google. Skipping the refresh cadence lets recipe rankings drift out of the top 3 inside 18 months as newer competitor recipes take the position.
Schema audit checklist per refresh
The schema audit checklist per refresh runs 8 items: Recipe schema completeness, aggregateRating count and accuracy, nutrition data accuracy, prepTime and cookTime match the recipe body, image URLs valid at CDN, related recipe internal links working, product card SKU URL live, and Google Search Console rich result eligibility validated. This checklist takes 20 minutes per recipe and prevents the schema drift that costs recipe rankings 20 to 40 positions quietly.
Reporting cadence for food brand content marketing
Reporting cadence on food brand content marketing runs a monthly executive report plus a quarterly business review. The monthly report ships in the first business week and covers organic sessions by pillar, top 10 ranking recipes with position trend, ingredient guide ranking movements, sourcing page performance, and organic-attributed DTC revenue. Every number carries a comparison to the prior month and a plain-language interpretation the founder reads in 7 minutes.
Metrics that matter for content marketing
Metrics that matter for food brand content marketing: organic sessions by pillar, recipe rich result impressions in Search Console, organic conversion rate to hero SKU pages, organic-attributed DTC revenue, and top 20 ranking positions by monthly organic sessions. Vanity metrics that do not matter: total pageviews without conversion context, average time on page without conversion attribution, and social share counts. The monthly report skips the vanity block entirely.
Quarterly business review structure
The quarterly business review runs 90 minutes with the founder, head of content, and SEO lead. Agenda: organic traffic trend by pillar, top 10 winning content pieces, top 10 losing content pieces (candidates for refresh or removal), competitive gap analysis against 5 named competitor brands, and next quarter’s content calendar with recipes and ingredient guides queued. According to Ahrefs content marketing research, brands running quarterly content audits outperform brands running annual audits by 40 to 70 percent on organic revenue over a 24-month window.
Internal linking discipline across food brand content
Internal linking discipline across food brand content moves authority from recipe pages toward hero SKU product pages and comparison guides. Every recipe links to the hero SKU it uses inline (once in the ingredient list, once in a bottom call-out card). Every ingredient comparison guide links to 3 to 6 recipes using the winning ingredient plus the hero SKU product page. Every sourcing story links to the 2 to 4 SKUs sourced from that specific farm or cooperative.
Anchor text strategy across recipe hubs
Anchor text on internal links varies across recipe hubs to avoid over-optimization patterns Google penalizes. Exact-match anchor (“single-origin Ethiopian coffee”) runs on 20 to 30 percent of internal links. Partial-match variations (“our Ethiopian roast”) run on 30 to 40 percent. Branded anchors (the SKU name) run on 20 to 30 percent. Generic anchors (“shop the coffee”) fill the remaining 10 to 20 percent. This ratio holds ranking without triggering the over-optimization penalty that shows up on brands that anchor-text-stuff every internal link with the same exact-match keyword. Cross-reference the linking layer on our food and beverage web design page.
Link equity from ingredient guides to SKU pages
Link equity from ingredient guides passes to SKU pages when the guide’s comparison table names the hero SKU in the winning column with a product card, and when the guide’s body links to 3 to 6 recipes that use the winning ingredient. This 3-hop path (guide to recipe to SKU) pushes authority from a high-traffic informational query down to a high-intent transactional page. According to Search Engine Land SEO coverage, informational content that internally links to transactional pages produces 2 to 4 times higher organic revenue than isolated content silos.
Wrapping up content marketing for food brands
Content marketing for food brands is the organic engine that turns a DTC snack, drink, or CPG storefront into a search-driven revenue channel. Recipe hub of 40 to 100 recipes. Ingredient comparison guides at 12 to 24 pieces. Sourcing story pages at 6 to 12 pieces. Buyer intent content at 8 to 16 pieces. Creator syndication calendar with 12 to 30 creators per quarter. Refresh cadence at 12 to 24 months by pillar. Reporting with organic sessions and organic revenue attribution.
If your DTC food brand is running paid social at 20,000 dollars monthly with a broken blog and zero recipe schema, professional content marketing for food brands pays for itself inside the first 90 days on organic traffic captured. Redefine Web ships content marketing inside our monthly retainer packages. Book a call and we will walk through the last three DTC food brands we built recipe hubs for, pillar by pillar.
Content marketing for food brands starts with a recipe hub because recipe queries account for 40 to 60 percent of high-intent search volume in the food category. Every hero SKU needs 4 to 12 recipes anchored to it, each targeting a specific occasion and audience.
Skip the recipe hub and the brand loses the search real estate that pulls DTC storefront traffic month over month at zero incremental paid cost. Recipe traffic converts at 2 to 4 percent because the shopper landed with usage intent, not passive discovery, which is why food brands win on recipes.
Recipe schema and Google rich result eligibility
Every recipe page ships schema.org Recipe markup including cookTime, prepTime, recipeIngredient, recipeInstructions, nutrition, and aggregateRating. Correctly marked-up recipes qualify for Google’s recipe rich result carousel that pulls 3 to 6 times higher click-through rate than a plain blue link. The schema layer takes 15 minutes per recipe to author and 30 minutes to validate in Google Search Console. Cross-reference the recipe search stack on our food and beverage SEO page.
Recipe hub structure that scales
The recipe hub structure runs 40 to 100 recipes at maturity, organized by hero SKU (4 to 12 recipes per SKU) plus occasion tags (breakfast, weeknight dinner, meal prep, brunch, holiday). Every recipe links back to the hero SKU product page with the SKU embedded in an inline card. The hub earns internal linking value from ingredient comparison guides and the sourcing story pages, which feeds recipe ranking on Google. According to Google Search Central recipe structured data guidance, complete Recipe schema markup is required for eligibility in the recipe carousel and the ingredient search filter.
Pillar structure for food brand content marketing
The pillar structure on content marketing for food brands runs 4 content pillars concurrently: recipe hub (40 to 100 recipes), ingredient comparison guides (12 to 24 guides), sourcing story pages (6 to 12 pages), and buyer intent content (where to buy, subscription vs. one-time, gift bundle guides). Every pillar covers a distinct search intent and every pillar links back to the hero SKU product pages.
Ingredient comparison guide format
Ingredient comparison guides run 1,800 to 3,200 words comparing 2 to 4 ingredient types on 6 to 10 attributes with a comparison table, real-world use case examples, and links to the hero SKU that uses the specific ingredient. Example: organic vs. conventional oats compares nutritional profile, sourcing chain, cost, environmental impact, and taste on a 6-column table. The brand’s SKU appears in the winning column with a product card. These guides rank 3 to 8 months after publication and pull steady-state organic traffic.
Sourcing story pages that build trust
Sourcing story pages name the specific farms, cooperatives, or suppliers the brand sources from, with photos of the farms, farmer quotes, and specific harvest windows. A coffee brand’s Ethiopian farm page ranks for “single-origin Ethiopian coffee” and “Yirgacheffe coffee origin” plus 40 long-tail variations. The sourcing page pulls trust-building traffic that converts at 4 to 6 percent because the shopper landed pattern-matching on transparency and named provenance. Every sourcing page includes farmer or cooperative quotes, harvest dates, and a link back to 3 to 5 hero SKU pages that source from the named supplier.
Vejrø hospitality content case study
Vejrø Resort, a Danish private-island destination with an on-site restaurant focused on organic, locally sourced cuisine, joined us with strong social engagement and no organic-search real estate. Guests found the resort on Instagram but never in Google search for terms like “private island resort Denmark,” “farm-to-table hospitality Denmark,” or “Vejrø restaurant.” The same organic-search gap shows up on DTC food brands running paid social at 20,000 dollars monthly with a broken blog and zero recipe schema.
We built the conversion-focused website with on-site and off-site SEO tuned to the travel-niche keyword clusters, competitor analysis against comparable boutique resorts, and mobile-first design prioritizing guest discovery. Every page carried the structured data qualifying it for Google’s rich results in the hospitality category. Every internal link pushed authority toward the direct-booking conversion path.
Three months later, Vejrø hit 10,000 plus organic visitors, ranked for 200 plus first-page keywords, and pulled a 2.2 percent booking conversion rate from organic traffic. The same pattern applies to content marketing for food brands: recipe schema, ingredient comparison guides, and sourcing story pages pull organic traffic at 20 to 40 percent conversion into hero SKU pages inside 6 months when the content quality matches search intent and every page carries the right structured data markup. Vejrø also proved out the reporting discipline: every monthly report named the exact page, the exact keyword cluster, and the exact search feature (rich result, sitelinks, image pack) driving the incremental organic revenue instead of hiding behind aggregate traffic charts.
Recipe cadence and content calendar for food brands
Recipe cadence on a working food brand content calendar ships 2 to 4 new recipes per week during the first 6 months and drops to 1 per week at maturity. Each recipe takes 4 to 6 hours to produce (write, test in the kitchen, photograph, schema author, publish). At 3 recipes per week, the brand hits 78 recipes inside 6 months plus a backlog of ingredient comparison and sourcing content queued behind the recipe production line.
| Content pillar | Target volume year 1 | Production cost per piece | Refresh cadence |
|---|---|---|---|
| Recipe hub | 40 to 100 recipes | $180 to $320 | Every 12 months |
| Ingredient comparison guides | 12 to 24 guides | $450 to $780 | Every 18 months |
| Sourcing story pages | 6 to 12 pages | $680 to $1,200 | Every 24 months |
| Buyer intent content | 8 to 16 pieces | $220 to $420 | Every 12 months |
Photography as a content calendar constraint
Photography is the actual constraint on recipe cadence, not writing. Every recipe needs 6 to 12 photos: hero shot, ingredient flat lay, prep in progress, plated result, storage, and step shots for the schema markup. A working food brand batches photography 8 recipes at a time to keep the cost per recipe under 200 dollars. Skip the batching and the per-recipe cost climbs to 400 to 600 dollars, which caps recipe cadence at 1 per week and slows organic ranking timeline by 6 months.
Seasonal content calendar planning
Seasonal content calendar planning maps recipes and comparison guides to the seasonal windows they need to rank in. A Christmas cookie recipe needs to publish in September to rank by early December. A Valentine’s chocolate guide needs to publish in November to rank by early February. A back-to-school lunchbox recipe needs to publish in June to rank by late August. The 60-to-90-day ranking curve dictates the calendar.
Creator syndication inside food brand content
Creator syndication on food brand content marketing amplifies the recipe hub through Instagram Reels, TikTok, and YouTube Shorts creators paid to post their own version of the brand’s hero recipes. The creator content pulls net-new audiences into the recipe hub through the creator’s Link in Bio or Amazon Storefront tag. The syndication calendar names 12 to 30 creators per quarter with specific recipes assigned to each.
One brand we picked up had a spreadsheet titled “creator outreach 2023” with 47 rows and 3 responses. All 3 responses were auto-replies. The spreadsheet named zero recipes and offered flat rates below 100 dollars per post. Nobody posts a 30-second video for 87 dollars flat. Nobody.
Creator content commercial terms that work
Working creator content commercial terms run 350 to 1,500 dollars flat per post plus a 12 to 25 percent commission on tagged sales across a 30-day window. The commission mechanic pulls creators into follow-up posts because the incremental revenue continues past the initial fee. Mid-tier creators (30k to 150k followers) hit the sweet spot for food brand content because their engagement rate typically runs 4 to 8 percent versus 0.8 to 1.6 percent on mega-creators.
Content brief structure for creator partnerships
The content brief structure for creator partnerships runs a single page: the SKU, the specific recipe or usage occasion, 3 required brand mentions, 3 restricted claims (no health claims on non-medical SKUs), the pricing angle, the affiliate link, and 3 example videos that hit the tone. The brief avoids over-scripting because over-scripted creator content underperforms native creator voice by 40 to 60 percent on engagement rate.
Buyer intent content for food brand blogs
Buyer intent content on food brand blogs covers 8 to 16 pieces targeting explicit purchase-decision queries: “where to buy [brand],” “[brand] subscription vs. one-time,” “best [category] for [use case],” and “[brand] gift bundle.” Every buyer intent piece runs 1,400 to 2,400 words with a comparison table, product cards, and a clear conversion path to the specific SKU that matches the query intent. Buyer intent content converts at 3 to 6 percent versus 1 to 2 percent on recipe content because the shopper landed already planning to buy, not exploring a usage occasion.
Where-to-buy content structure
Where-to-buy content structure covers online (DTC storefront, Amazon, Target.com, Whole Foods online), retail (specific chain locators with the store finder embedded), and international (customs limitations, retailer partners abroad). Every piece names specific retailers, links to the store locator, and includes an FAQ block covering shipping availability, subscription options, and gift card compatibility. Where-to-buy content ranks for branded discovery queries the DTC storefront otherwise loses to competitor affiliate reviews.
Subscription versus one-time comparison content
Subscription versus one-time comparison content converts subscription commitments at 3 to 6 percent because it addresses the price-sensitivity concern head-on with a specific math table. The piece covers the discount structure (15 percent lifetime), the skip-a-month mechanic, the pause-anytime rule, the cancellation policy, and the specific yearly savings for the brand’s average consumption cadence. Cross-reference the retention structure on our food and beverage marketing retainer page.
Content refresh cadence on food brand pillars
Content refresh cadence on food brand content pillars runs a rolling audit every 12 to 24 months by pillar. Recipes get refreshed every 12 months with new photography, updated schema, and any nutrition or ingredient adjustments. Ingredient comparison guides refresh every 18 months to update market data. Sourcing story pages refresh every 24 months to reflect farm partnership changes and new harvest angles. Buyer intent content refreshes every 12 months to update retailer availability and pricing.
Recipe refresh priority order
Recipe refresh priority runs by organic traffic rank. The top 20 recipes by monthly organic sessions get refreshed first (new photography, schema audit, related recipe internal links, updated nutrition). The next 40 get refreshed at 15 months. The remaining recipes get refreshed opportunistically when the ranking slips past position 15 in Google. Skipping the refresh cadence lets recipe rankings drift out of the top 3 inside 18 months as newer competitor recipes take the position.
Schema audit checklist per refresh
The schema audit checklist per refresh runs 8 items: Recipe schema completeness, aggregateRating count and accuracy, nutrition data accuracy, prepTime and cookTime match the recipe body, image URLs valid at CDN, related recipe internal links working, product card SKU URL live, and Google Search Console rich result eligibility validated. This checklist takes 20 minutes per recipe and prevents the schema drift that costs recipe rankings 20 to 40 positions quietly.
Reporting cadence for food brand content marketing
Reporting cadence on food brand content marketing runs a monthly executive report plus a quarterly business review. The monthly report ships in the first business week and covers organic sessions by pillar, top 10 ranking recipes with position trend, ingredient guide ranking movements, sourcing page performance, and organic-attributed DTC revenue. Every number carries a comparison to the prior month and a plain-language interpretation the founder reads in 7 minutes.
Metrics that matter for content marketing
Metrics that matter for food brand content marketing: organic sessions by pillar, recipe rich result impressions in Search Console, organic conversion rate to hero SKU pages, organic-attributed DTC revenue, and top 20 ranking positions by monthly organic sessions. Vanity metrics that do not matter: total pageviews without conversion context, average time on page without conversion attribution, and social share counts. The monthly report skips the vanity block entirely.
Quarterly business review structure
The quarterly business review runs 90 minutes with the founder, head of content, and SEO lead. Agenda: organic traffic trend by pillar, top 10 winning content pieces, top 10 losing content pieces (candidates for refresh or removal), competitive gap analysis against 5 named competitor brands, and next quarter’s content calendar with recipes and ingredient guides queued. According to Ahrefs content marketing research, brands running quarterly content audits outperform brands running annual audits by 40 to 70 percent on organic revenue over a 24-month window.
Internal linking discipline across food brand content
Internal linking discipline across food brand content moves authority from recipe pages toward hero SKU product pages and comparison guides. Every recipe links to the hero SKU it uses inline (once in the ingredient list, once in a bottom call-out card). Every ingredient comparison guide links to 3 to 6 recipes using the winning ingredient plus the hero SKU product page. Every sourcing story links to the 2 to 4 SKUs sourced from that specific farm or cooperative.
Anchor text strategy across recipe hubs
Anchor text on internal links varies across recipe hubs to avoid over-optimization patterns Google penalizes. Exact-match anchor (“single-origin Ethiopian coffee”) runs on 20 to 30 percent of internal links. Partial-match variations (“our Ethiopian roast”) run on 30 to 40 percent. Branded anchors (the SKU name) run on 20 to 30 percent. Generic anchors (“shop the coffee”) fill the remaining 10 to 20 percent. This ratio holds ranking without triggering the over-optimization penalty that shows up on brands that anchor-text-stuff every internal link with the same exact-match keyword. Cross-reference the linking layer on our food and beverage web design page.
Link equity from ingredient guides to SKU pages
Link equity from ingredient guides passes to SKU pages when the guide’s comparison table names the hero SKU in the winning column with a product card, and when the guide’s body links to 3 to 6 recipes that use the winning ingredient. This 3-hop path (guide to recipe to SKU) pushes authority from a high-traffic informational query down to a high-intent transactional page. According to Search Engine Land SEO coverage, informational content that internally links to transactional pages produces 2 to 4 times higher organic revenue than isolated content silos.
Wrapping up content marketing for food brands
Content marketing for food brands is the organic engine that turns a DTC snack, drink, or CPG storefront into a search-driven revenue channel. Recipe hub of 40 to 100 recipes. Ingredient comparison guides at 12 to 24 pieces. Sourcing story pages at 6 to 12 pieces. Buyer intent content at 8 to 16 pieces. Creator syndication calendar with 12 to 30 creators per quarter. Refresh cadence at 12 to 24 months by pillar. Reporting with organic sessions and organic revenue attribution.
If your DTC food brand is running paid social at 20,000 dollars monthly with a broken blog and zero recipe schema, professional content marketing for food brands pays for itself inside the first 90 days on organic traffic captured. Redefine Web ships content marketing inside our monthly retainer packages. Book a call and we will walk through the last three DTC food brands we built recipe hubs for, pillar by pillar.
Internal linking discipline across food brand content moves authority from recipe pages toward hero SKU product pages and comparison guides. Every recipe links to the hero SKU it uses inline (once in the ingredient list, once in a bottom call-out card). Every ingredient comparison guide links to 3 to 6 recipes using the winning ingredient plus the hero SKU product page. Every sourcing story links to the 2 to 4 SKUs sourced from that specific farm or cooperative.
Anchor text strategy across recipe hubs
Anchor text on internal links varies across recipe hubs to avoid over-optimization patterns Google penalizes. Exact-match anchor (“single-origin Ethiopian coffee”) runs on 20 to 30 percent of internal links. Partial-match variations (“our Ethiopian roast”) run on 30 to 40 percent. Branded anchors (the SKU name) run on 20 to 30 percent. Generic anchors (“shop the coffee”) fill the remaining 10 to 20 percent. This ratio holds ranking without triggering the over-optimization penalty that shows up on brands that anchor-text-stuff every internal link with the same exact-match keyword. Cross-reference the linking layer on our food and beverage web design page.
Link equity from ingredient guides to SKU pages
Link equity from ingredient guides passes to SKU pages when the guide’s comparison table names the hero SKU in the winning column with a product card, and when the guide’s body links to 3 to 6 recipes that use the winning ingredient. This 3-hop path (guide to recipe to SKU) pushes authority from a high-traffic informational query down to a high-intent transactional page. According to Search Engine Land SEO coverage, informational content that internally links to transactional pages produces 2 to 4 times higher organic revenue than isolated content silos.
Wrapping up content marketing for food brands
Content marketing for food brands is the organic engine that turns a DTC snack, drink, or CPG storefront into a search-driven revenue channel. Recipe hub of 40 to 100 recipes. Ingredient comparison guides at 12 to 24 pieces. Sourcing story pages at 6 to 12 pieces. Buyer intent content at 8 to 16 pieces. Creator syndication calendar with 12 to 30 creators per quarter. Refresh cadence at 12 to 24 months by pillar. Reporting with organic sessions and organic revenue attribution.
If your DTC food brand is running paid social at 20,000 dollars monthly with a broken blog and zero recipe schema, professional content marketing for food brands pays for itself inside the first 90 days on organic traffic captured. Redefine Web ships content marketing inside our monthly retainer packages. Book a call and we will walk through the last three DTC food brands we built recipe hubs for, pillar by pillar.
Content marketing for food brands starts with a recipe hub because recipe queries account for 40 to 60 percent of high-intent search volume in the food category. Every hero SKU needs 4 to 12 recipes anchored to it, each targeting a specific occasion and audience.
Skip the recipe hub and the brand loses the search real estate that pulls DTC storefront traffic month over month at zero incremental paid cost. Recipe traffic converts at 2 to 4 percent because the shopper landed with usage intent, not passive discovery, which is why food brands win on recipes.
Recipe schema and Google rich result eligibility
Every recipe page ships schema.org Recipe markup including cookTime, prepTime, recipeIngredient, recipeInstructions, nutrition, and aggregateRating. Correctly marked-up recipes qualify for Google’s recipe rich result carousel that pulls 3 to 6 times higher click-through rate than a plain blue link. The schema layer takes 15 minutes per recipe to author and 30 minutes to validate in Google Search Console. Cross-reference the recipe search stack on our food and beverage SEO page.
Recipe hub structure that scales
The recipe hub structure runs 40 to 100 recipes at maturity, organized by hero SKU (4 to 12 recipes per SKU) plus occasion tags (breakfast, weeknight dinner, meal prep, brunch, holiday). Every recipe links back to the hero SKU product page with the SKU embedded in an inline card. The hub earns internal linking value from ingredient comparison guides and the sourcing story pages, which feeds recipe ranking on Google. According to Google Search Central recipe structured data guidance, complete Recipe schema markup is required for eligibility in the recipe carousel and the ingredient search filter.
Pillar structure for food brand content marketing
The pillar structure on content marketing for food brands runs 4 content pillars concurrently: recipe hub (40 to 100 recipes), ingredient comparison guides (12 to 24 guides), sourcing story pages (6 to 12 pages), and buyer intent content (where to buy, subscription vs. one-time, gift bundle guides). Every pillar covers a distinct search intent and every pillar links back to the hero SKU product pages.
Ingredient comparison guide format
Ingredient comparison guides run 1,800 to 3,200 words comparing 2 to 4 ingredient types on 6 to 10 attributes with a comparison table, real-world use case examples, and links to the hero SKU that uses the specific ingredient. Example: organic vs. conventional oats compares nutritional profile, sourcing chain, cost, environmental impact, and taste on a 6-column table. The brand’s SKU appears in the winning column with a product card. These guides rank 3 to 8 months after publication and pull steady-state organic traffic.
Sourcing story pages that build trust
Sourcing story pages name the specific farms, cooperatives, or suppliers the brand sources from, with photos of the farms, farmer quotes, and specific harvest windows. A coffee brand’s Ethiopian farm page ranks for “single-origin Ethiopian coffee” and “Yirgacheffe coffee origin” plus 40 long-tail variations. The sourcing page pulls trust-building traffic that converts at 4 to 6 percent because the shopper landed pattern-matching on transparency and named provenance. Every sourcing page includes farmer or cooperative quotes, harvest dates, and a link back to 3 to 5 hero SKU pages that source from the named supplier.
Vejrø hospitality content case study
Vejrø Resort, a Danish private-island destination with an on-site restaurant focused on organic, locally sourced cuisine, joined us with strong social engagement and no organic-search real estate. Guests found the resort on Instagram but never in Google search for terms like “private island resort Denmark,” “farm-to-table hospitality Denmark,” or “Vejrø restaurant.” The same organic-search gap shows up on DTC food brands running paid social at 20,000 dollars monthly with a broken blog and zero recipe schema.
We built the conversion-focused website with on-site and off-site SEO tuned to the travel-niche keyword clusters, competitor analysis against comparable boutique resorts, and mobile-first design prioritizing guest discovery. Every page carried the structured data qualifying it for Google’s rich results in the hospitality category. Every internal link pushed authority toward the direct-booking conversion path.
Three months later, Vejrø hit 10,000 plus organic visitors, ranked for 200 plus first-page keywords, and pulled a 2.2 percent booking conversion rate from organic traffic. The same pattern applies to content marketing for food brands: recipe schema, ingredient comparison guides, and sourcing story pages pull organic traffic at 20 to 40 percent conversion into hero SKU pages inside 6 months when the content quality matches search intent and every page carries the right structured data markup. Vejrø also proved out the reporting discipline: every monthly report named the exact page, the exact keyword cluster, and the exact search feature (rich result, sitelinks, image pack) driving the incremental organic revenue instead of hiding behind aggregate traffic charts.
Recipe cadence and content calendar for food brands
Recipe cadence on a working food brand content calendar ships 2 to 4 new recipes per week during the first 6 months and drops to 1 per week at maturity. Each recipe takes 4 to 6 hours to produce (write, test in the kitchen, photograph, schema author, publish). At 3 recipes per week, the brand hits 78 recipes inside 6 months plus a backlog of ingredient comparison and sourcing content queued behind the recipe production line.
| Content pillar | Target volume year 1 | Production cost per piece | Refresh cadence |
|---|---|---|---|
| Recipe hub | 40 to 100 recipes | $180 to $320 | Every 12 months |
| Ingredient comparison guides | 12 to 24 guides | $450 to $780 | Every 18 months |
| Sourcing story pages | 6 to 12 pages | $680 to $1,200 | Every 24 months |
| Buyer intent content | 8 to 16 pieces | $220 to $420 | Every 12 months |
Photography as a content calendar constraint
Photography is the actual constraint on recipe cadence, not writing. Every recipe needs 6 to 12 photos: hero shot, ingredient flat lay, prep in progress, plated result, storage, and step shots for the schema markup. A working food brand batches photography 8 recipes at a time to keep the cost per recipe under 200 dollars. Skip the batching and the per-recipe cost climbs to 400 to 600 dollars, which caps recipe cadence at 1 per week and slows organic ranking timeline by 6 months.
Seasonal content calendar planning
Seasonal content calendar planning maps recipes and comparison guides to the seasonal windows they need to rank in. A Christmas cookie recipe needs to publish in September to rank by early December. A Valentine’s chocolate guide needs to publish in November to rank by early February. A back-to-school lunchbox recipe needs to publish in June to rank by late August. The 60-to-90-day ranking curve dictates the calendar.
Creator syndication inside food brand content
Creator syndication on food brand content marketing amplifies the recipe hub through Instagram Reels, TikTok, and YouTube Shorts creators paid to post their own version of the brand’s hero recipes. The creator content pulls net-new audiences into the recipe hub through the creator’s Link in Bio or Amazon Storefront tag. The syndication calendar names 12 to 30 creators per quarter with specific recipes assigned to each.
One brand we picked up had a spreadsheet titled “creator outreach 2023” with 47 rows and 3 responses. All 3 responses were auto-replies. The spreadsheet named zero recipes and offered flat rates below 100 dollars per post. Nobody posts a 30-second video for 87 dollars flat. Nobody.
Creator content commercial terms that work
Working creator content commercial terms run 350 to 1,500 dollars flat per post plus a 12 to 25 percent commission on tagged sales across a 30-day window. The commission mechanic pulls creators into follow-up posts because the incremental revenue continues past the initial fee. Mid-tier creators (30k to 150k followers) hit the sweet spot for food brand content because their engagement rate typically runs 4 to 8 percent versus 0.8 to 1.6 percent on mega-creators.
Content brief structure for creator partnerships
The content brief structure for creator partnerships runs a single page: the SKU, the specific recipe or usage occasion, 3 required brand mentions, 3 restricted claims (no health claims on non-medical SKUs), the pricing angle, the affiliate link, and 3 example videos that hit the tone. The brief avoids over-scripting because over-scripted creator content underperforms native creator voice by 40 to 60 percent on engagement rate.
Buyer intent content for food brand blogs
Buyer intent content on food brand blogs covers 8 to 16 pieces targeting explicit purchase-decision queries: “where to buy [brand],” “[brand] subscription vs. one-time,” “best [category] for [use case],” and “[brand] gift bundle.” Every buyer intent piece runs 1,400 to 2,400 words with a comparison table, product cards, and a clear conversion path to the specific SKU that matches the query intent. Buyer intent content converts at 3 to 6 percent versus 1 to 2 percent on recipe content because the shopper landed already planning to buy, not exploring a usage occasion.
Where-to-buy content structure
Where-to-buy content structure covers online (DTC storefront, Amazon, Target.com, Whole Foods online), retail (specific chain locators with the store finder embedded), and international (customs limitations, retailer partners abroad). Every piece names specific retailers, links to the store locator, and includes an FAQ block covering shipping availability, subscription options, and gift card compatibility. Where-to-buy content ranks for branded discovery queries the DTC storefront otherwise loses to competitor affiliate reviews.
Subscription versus one-time comparison content
Subscription versus one-time comparison content converts subscription commitments at 3 to 6 percent because it addresses the price-sensitivity concern head-on with a specific math table. The piece covers the discount structure (15 percent lifetime), the skip-a-month mechanic, the pause-anytime rule, the cancellation policy, and the specific yearly savings for the brand’s average consumption cadence. Cross-reference the retention structure on our food and beverage marketing retainer page.
Content refresh cadence on food brand pillars
Content refresh cadence on food brand content pillars runs a rolling audit every 12 to 24 months by pillar. Recipes get refreshed every 12 months with new photography, updated schema, and any nutrition or ingredient adjustments. Ingredient comparison guides refresh every 18 months to update market data. Sourcing story pages refresh every 24 months to reflect farm partnership changes and new harvest angles. Buyer intent content refreshes every 12 months to update retailer availability and pricing.
Recipe refresh priority order
Recipe refresh priority runs by organic traffic rank. The top 20 recipes by monthly organic sessions get refreshed first (new photography, schema audit, related recipe internal links, updated nutrition). The next 40 get refreshed at 15 months. The remaining recipes get refreshed opportunistically when the ranking slips past position 15 in Google. Skipping the refresh cadence lets recipe rankings drift out of the top 3 inside 18 months as newer competitor recipes take the position.
Schema audit checklist per refresh
The schema audit checklist per refresh runs 8 items: Recipe schema completeness, aggregateRating count and accuracy, nutrition data accuracy, prepTime and cookTime match the recipe body, image URLs valid at CDN, related recipe internal links working, product card SKU URL live, and Google Search Console rich result eligibility validated. This checklist takes 20 minutes per recipe and prevents the schema drift that costs recipe rankings 20 to 40 positions quietly.
Reporting cadence for food brand content marketing
Reporting cadence on food brand content marketing runs a monthly executive report plus a quarterly business review. The monthly report ships in the first business week and covers organic sessions by pillar, top 10 ranking recipes with position trend, ingredient guide ranking movements, sourcing page performance, and organic-attributed DTC revenue. Every number carries a comparison to the prior month and a plain-language interpretation the founder reads in 7 minutes.
Metrics that matter for content marketing
Metrics that matter for food brand content marketing: organic sessions by pillar, recipe rich result impressions in Search Console, organic conversion rate to hero SKU pages, organic-attributed DTC revenue, and top 20 ranking positions by monthly organic sessions. Vanity metrics that do not matter: total pageviews without conversion context, average time on page without conversion attribution, and social share counts. The monthly report skips the vanity block entirely.
Quarterly business review structure
The quarterly business review runs 90 minutes with the founder, head of content, and SEO lead. Agenda: organic traffic trend by pillar, top 10 winning content pieces, top 10 losing content pieces (candidates for refresh or removal), competitive gap analysis against 5 named competitor brands, and next quarter’s content calendar with recipes and ingredient guides queued. According to Ahrefs content marketing research, brands running quarterly content audits outperform brands running annual audits by 40 to 70 percent on organic revenue over a 24-month window.
Internal linking discipline across food brand content
Internal linking discipline across food brand content moves authority from recipe pages toward hero SKU product pages and comparison guides. Every recipe links to the hero SKU it uses inline (once in the ingredient list, once in a bottom call-out card). Every ingredient comparison guide links to 3 to 6 recipes using the winning ingredient plus the hero SKU product page. Every sourcing story links to the 2 to 4 SKUs sourced from that specific farm or cooperative.
Anchor text strategy across recipe hubs
Anchor text on internal links varies across recipe hubs to avoid over-optimization patterns Google penalizes. Exact-match anchor (“single-origin Ethiopian coffee”) runs on 20 to 30 percent of internal links. Partial-match variations (“our Ethiopian roast”) run on 30 to 40 percent. Branded anchors (the SKU name) run on 20 to 30 percent. Generic anchors (“shop the coffee”) fill the remaining 10 to 20 percent. This ratio holds ranking without triggering the over-optimization penalty that shows up on brands that anchor-text-stuff every internal link with the same exact-match keyword. Cross-reference the linking layer on our food and beverage web design page.
Link equity from ingredient guides to SKU pages
Link equity from ingredient guides passes to SKU pages when the guide’s comparison table names the hero SKU in the winning column with a product card, and when the guide’s body links to 3 to 6 recipes that use the winning ingredient. This 3-hop path (guide to recipe to SKU) pushes authority from a high-traffic informational query down to a high-intent transactional page. According to Search Engine Land SEO coverage, informational content that internally links to transactional pages produces 2 to 4 times higher organic revenue than isolated content silos.
Wrapping up content marketing for food brands
Content marketing for food brands is the organic engine that turns a DTC snack, drink, or CPG storefront into a search-driven revenue channel. Recipe hub of 40 to 100 recipes. Ingredient comparison guides at 12 to 24 pieces. Sourcing story pages at 6 to 12 pieces. Buyer intent content at 8 to 16 pieces. Creator syndication calendar with 12 to 30 creators per quarter. Refresh cadence at 12 to 24 months by pillar. Reporting with organic sessions and organic revenue attribution.
If your DTC food brand is running paid social at 20,000 dollars monthly with a broken blog and zero recipe schema, professional content marketing for food brands pays for itself inside the first 90 days on organic traffic captured. Redefine Web ships content marketing inside our monthly retainer packages. Book a call and we will walk through the last three DTC food brands we built recipe hubs for, pillar by pillar.
Content marketing for food brands starts with a recipe hub because recipe queries account for 40 to 60 percent of high-intent search volume in the food category. Every hero SKU needs 4 to 12 recipes anchored to it, each targeting a specific occasion and audience.
Skip the recipe hub and the brand loses the search real estate that pulls DTC storefront traffic month over month at zero incremental paid cost. Recipe traffic converts at 2 to 4 percent because the shopper landed with usage intent, not passive discovery, which is why food brands win on recipes.
Recipe schema and Google rich result eligibility
Every recipe page ships schema.org Recipe markup including cookTime, prepTime, recipeIngredient, recipeInstructions, nutrition, and aggregateRating. Correctly marked-up recipes qualify for Google’s recipe rich result carousel that pulls 3 to 6 times higher click-through rate than a plain blue link. The schema layer takes 15 minutes per recipe to author and 30 minutes to validate in Google Search Console. Cross-reference the recipe search stack on our food and beverage SEO page.
Recipe hub structure that scales
The recipe hub structure runs 40 to 100 recipes at maturity, organized by hero SKU (4 to 12 recipes per SKU) plus occasion tags (breakfast, weeknight dinner, meal prep, brunch, holiday). Every recipe links back to the hero SKU product page with the SKU embedded in an inline card. The hub earns internal linking value from ingredient comparison guides and the sourcing story pages, which feeds recipe ranking on Google. According to Google Search Central recipe structured data guidance, complete Recipe schema markup is required for eligibility in the recipe carousel and the ingredient search filter.
Pillar structure for food brand content marketing
The pillar structure on content marketing for food brands runs 4 content pillars concurrently: recipe hub (40 to 100 recipes), ingredient comparison guides (12 to 24 guides), sourcing story pages (6 to 12 pages), and buyer intent content (where to buy, subscription vs. one-time, gift bundle guides). Every pillar covers a distinct search intent and every pillar links back to the hero SKU product pages.
Ingredient comparison guide format
Ingredient comparison guides run 1,800 to 3,200 words comparing 2 to 4 ingredient types on 6 to 10 attributes with a comparison table, real-world use case examples, and links to the hero SKU that uses the specific ingredient. Example: organic vs. conventional oats compares nutritional profile, sourcing chain, cost, environmental impact, and taste on a 6-column table. The brand’s SKU appears in the winning column with a product card. These guides rank 3 to 8 months after publication and pull steady-state organic traffic.
Sourcing story pages that build trust
Sourcing story pages name the specific farms, cooperatives, or suppliers the brand sources from, with photos of the farms, farmer quotes, and specific harvest windows. A coffee brand’s Ethiopian farm page ranks for “single-origin Ethiopian coffee” and “Yirgacheffe coffee origin” plus 40 long-tail variations. The sourcing page pulls trust-building traffic that converts at 4 to 6 percent because the shopper landed pattern-matching on transparency and named provenance. Every sourcing page includes farmer or cooperative quotes, harvest dates, and a link back to 3 to 5 hero SKU pages that source from the named supplier.
Vejrø hospitality content case study
Vejrø Resort, a Danish private-island destination with an on-site restaurant focused on organic, locally sourced cuisine, joined us with strong social engagement and no organic-search real estate. Guests found the resort on Instagram but never in Google search for terms like “private island resort Denmark,” “farm-to-table hospitality Denmark,” or “Vejrø restaurant.” The same organic-search gap shows up on DTC food brands running paid social at 20,000 dollars monthly with a broken blog and zero recipe schema.
We built the conversion-focused website with on-site and off-site SEO tuned to the travel-niche keyword clusters, competitor analysis against comparable boutique resorts, and mobile-first design prioritizing guest discovery. Every page carried the structured data qualifying it for Google’s rich results in the hospitality category. Every internal link pushed authority toward the direct-booking conversion path.
Three months later, Vejrø hit 10,000 plus organic visitors, ranked for 200 plus first-page keywords, and pulled a 2.2 percent booking conversion rate from organic traffic. The same pattern applies to content marketing for food brands: recipe schema, ingredient comparison guides, and sourcing story pages pull organic traffic at 20 to 40 percent conversion into hero SKU pages inside 6 months when the content quality matches search intent and every page carries the right structured data markup. Vejrø also proved out the reporting discipline: every monthly report named the exact page, the exact keyword cluster, and the exact search feature (rich result, sitelinks, image pack) driving the incremental organic revenue instead of hiding behind aggregate traffic charts.
Recipe cadence and content calendar for food brands
Recipe cadence on a working food brand content calendar ships 2 to 4 new recipes per week during the first 6 months and drops to 1 per week at maturity. Each recipe takes 4 to 6 hours to produce (write, test in the kitchen, photograph, schema author, publish). At 3 recipes per week, the brand hits 78 recipes inside 6 months plus a backlog of ingredient comparison and sourcing content queued behind the recipe production line.
| Content pillar | Target volume year 1 | Production cost per piece | Refresh cadence |
|---|---|---|---|
| Recipe hub | 40 to 100 recipes | $180 to $320 | Every 12 months |
| Ingredient comparison guides | 12 to 24 guides | $450 to $780 | Every 18 months |
| Sourcing story pages | 6 to 12 pages | $680 to $1,200 | Every 24 months |
| Buyer intent content | 8 to 16 pieces | $220 to $420 | Every 12 months |
Photography as a content calendar constraint
Photography is the actual constraint on recipe cadence, not writing. Every recipe needs 6 to 12 photos: hero shot, ingredient flat lay, prep in progress, plated result, storage, and step shots for the schema markup. A working food brand batches photography 8 recipes at a time to keep the cost per recipe under 200 dollars. Skip the batching and the per-recipe cost climbs to 400 to 600 dollars, which caps recipe cadence at 1 per week and slows organic ranking timeline by 6 months.
Seasonal content calendar planning
Seasonal content calendar planning maps recipes and comparison guides to the seasonal windows they need to rank in. A Christmas cookie recipe needs to publish in September to rank by early December. A Valentine’s chocolate guide needs to publish in November to rank by early February. A back-to-school lunchbox recipe needs to publish in June to rank by late August. The 60-to-90-day ranking curve dictates the calendar.
Creator syndication inside food brand content
Creator syndication on food brand content marketing amplifies the recipe hub through Instagram Reels, TikTok, and YouTube Shorts creators paid to post their own version of the brand’s hero recipes. The creator content pulls net-new audiences into the recipe hub through the creator’s Link in Bio or Amazon Storefront tag. The syndication calendar names 12 to 30 creators per quarter with specific recipes assigned to each.
One brand we picked up had a spreadsheet titled “creator outreach 2023” with 47 rows and 3 responses. All 3 responses were auto-replies. The spreadsheet named zero recipes and offered flat rates below 100 dollars per post. Nobody posts a 30-second video for 87 dollars flat. Nobody.
Creator content commercial terms that work
Working creator content commercial terms run 350 to 1,500 dollars flat per post plus a 12 to 25 percent commission on tagged sales across a 30-day window. The commission mechanic pulls creators into follow-up posts because the incremental revenue continues past the initial fee. Mid-tier creators (30k to 150k followers) hit the sweet spot for food brand content because their engagement rate typically runs 4 to 8 percent versus 0.8 to 1.6 percent on mega-creators.
Content brief structure for creator partnerships
The content brief structure for creator partnerships runs a single page: the SKU, the specific recipe or usage occasion, 3 required brand mentions, 3 restricted claims (no health claims on non-medical SKUs), the pricing angle, the affiliate link, and 3 example videos that hit the tone. The brief avoids over-scripting because over-scripted creator content underperforms native creator voice by 40 to 60 percent on engagement rate.
Buyer intent content for food brand blogs
Buyer intent content on food brand blogs covers 8 to 16 pieces targeting explicit purchase-decision queries: “where to buy [brand],” “[brand] subscription vs. one-time,” “best [category] for [use case],” and “[brand] gift bundle.” Every buyer intent piece runs 1,400 to 2,400 words with a comparison table, product cards, and a clear conversion path to the specific SKU that matches the query intent. Buyer intent content converts at 3 to 6 percent versus 1 to 2 percent on recipe content because the shopper landed already planning to buy, not exploring a usage occasion.
Where-to-buy content structure
Where-to-buy content structure covers online (DTC storefront, Amazon, Target.com, Whole Foods online), retail (specific chain locators with the store finder embedded), and international (customs limitations, retailer partners abroad). Every piece names specific retailers, links to the store locator, and includes an FAQ block covering shipping availability, subscription options, and gift card compatibility. Where-to-buy content ranks for branded discovery queries the DTC storefront otherwise loses to competitor affiliate reviews.
Subscription versus one-time comparison content
Subscription versus one-time comparison content converts subscription commitments at 3 to 6 percent because it addresses the price-sensitivity concern head-on with a specific math table. The piece covers the discount structure (15 percent lifetime), the skip-a-month mechanic, the pause-anytime rule, the cancellation policy, and the specific yearly savings for the brand’s average consumption cadence. Cross-reference the retention structure on our food and beverage marketing retainer page.
Content refresh cadence on food brand pillars
Content refresh cadence on food brand content pillars runs a rolling audit every 12 to 24 months by pillar. Recipes get refreshed every 12 months with new photography, updated schema, and any nutrition or ingredient adjustments. Ingredient comparison guides refresh every 18 months to update market data. Sourcing story pages refresh every 24 months to reflect farm partnership changes and new harvest angles. Buyer intent content refreshes every 12 months to update retailer availability and pricing.
Recipe refresh priority order
Recipe refresh priority runs by organic traffic rank. The top 20 recipes by monthly organic sessions get refreshed first (new photography, schema audit, related recipe internal links, updated nutrition). The next 40 get refreshed at 15 months. The remaining recipes get refreshed opportunistically when the ranking slips past position 15 in Google. Skipping the refresh cadence lets recipe rankings drift out of the top 3 inside 18 months as newer competitor recipes take the position.
Schema audit checklist per refresh
The schema audit checklist per refresh runs 8 items: Recipe schema completeness, aggregateRating count and accuracy, nutrition data accuracy, prepTime and cookTime match the recipe body, image URLs valid at CDN, related recipe internal links working, product card SKU URL live, and Google Search Console rich result eligibility validated. This checklist takes 20 minutes per recipe and prevents the schema drift that costs recipe rankings 20 to 40 positions quietly.
Reporting cadence for food brand content marketing
Reporting cadence on food brand content marketing runs a monthly executive report plus a quarterly business review. The monthly report ships in the first business week and covers organic sessions by pillar, top 10 ranking recipes with position trend, ingredient guide ranking movements, sourcing page performance, and organic-attributed DTC revenue. Every number carries a comparison to the prior month and a plain-language interpretation the founder reads in 7 minutes.
Metrics that matter for content marketing
Metrics that matter for food brand content marketing: organic sessions by pillar, recipe rich result impressions in Search Console, organic conversion rate to hero SKU pages, organic-attributed DTC revenue, and top 20 ranking positions by monthly organic sessions. Vanity metrics that do not matter: total pageviews without conversion context, average time on page without conversion attribution, and social share counts. The monthly report skips the vanity block entirely.
Quarterly business review structure
The quarterly business review runs 90 minutes with the founder, head of content, and SEO lead. Agenda: organic traffic trend by pillar, top 10 winning content pieces, top 10 losing content pieces (candidates for refresh or removal), competitive gap analysis against 5 named competitor brands, and next quarter’s content calendar with recipes and ingredient guides queued. According to Ahrefs content marketing research, brands running quarterly content audits outperform brands running annual audits by 40 to 70 percent on organic revenue over a 24-month window.
Internal linking discipline across food brand content
Internal linking discipline across food brand content moves authority from recipe pages toward hero SKU product pages and comparison guides. Every recipe links to the hero SKU it uses inline (once in the ingredient list, once in a bottom call-out card). Every ingredient comparison guide links to 3 to 6 recipes using the winning ingredient plus the hero SKU product page. Every sourcing story links to the 2 to 4 SKUs sourced from that specific farm or cooperative.
Anchor text strategy across recipe hubs
Anchor text on internal links varies across recipe hubs to avoid over-optimization patterns Google penalizes. Exact-match anchor (“single-origin Ethiopian coffee”) runs on 20 to 30 percent of internal links. Partial-match variations (“our Ethiopian roast”) run on 30 to 40 percent. Branded anchors (the SKU name) run on 20 to 30 percent. Generic anchors (“shop the coffee”) fill the remaining 10 to 20 percent. This ratio holds ranking without triggering the over-optimization penalty that shows up on brands that anchor-text-stuff every internal link with the same exact-match keyword. Cross-reference the linking layer on our food and beverage web design page.
Link equity from ingredient guides to SKU pages
Link equity from ingredient guides passes to SKU pages when the guide’s comparison table names the hero SKU in the winning column with a product card, and when the guide’s body links to 3 to 6 recipes that use the winning ingredient. This 3-hop path (guide to recipe to SKU) pushes authority from a high-traffic informational query down to a high-intent transactional page. According to Search Engine Land SEO coverage, informational content that internally links to transactional pages produces 2 to 4 times higher organic revenue than isolated content silos.
Wrapping up content marketing for food brands
Content marketing for food brands is the organic engine that turns a DTC snack, drink, or CPG storefront into a search-driven revenue channel. Recipe hub of 40 to 100 recipes. Ingredient comparison guides at 12 to 24 pieces. Sourcing story pages at 6 to 12 pieces. Buyer intent content at 8 to 16 pieces. Creator syndication calendar with 12 to 30 creators per quarter. Refresh cadence at 12 to 24 months by pillar. Reporting with organic sessions and organic revenue attribution.
If your DTC food brand is running paid social at 20,000 dollars monthly with a broken blog and zero recipe schema, professional content marketing for food brands pays for itself inside the first 90 days on organic traffic captured. Redefine Web ships content marketing inside our monthly retainer packages. Book a call and we will walk through the last three DTC food brands we built recipe hubs for, pillar by pillar.
Anchor text on internal links varies across recipe hubs to avoid over-optimization patterns Google penalizes. Exact-match anchor (“single-origin Ethiopian coffee”) runs on 20 to 30 percent of internal links. Partial-match variations (“our Ethiopian roast”) run on 30 to 40 percent. Branded anchors (the SKU name) run on 20 to 30 percent. Generic anchors (“shop the coffee”) fill the remaining 10 to 20 percent. This ratio holds ranking without triggering the over-optimization penalty that shows up on brands that anchor-text-stuff every internal link with the same exact-match keyword. Cross-reference the linking layer on our food and beverage web design page.
Link equity from ingredient guides to SKU pages
Link equity from ingredient guides passes to SKU pages when the guide’s comparison table names the hero SKU in the winning column with a product card, and when the guide’s body links to 3 to 6 recipes that use the winning ingredient. This 3-hop path (guide to recipe to SKU) pushes authority from a high-traffic informational query down to a high-intent transactional page. According to Search Engine Land SEO coverage, informational content that internally links to transactional pages produces 2 to 4 times higher organic revenue than isolated content silos.
Wrapping up content marketing for food brands
Content marketing for food brands is the organic engine that turns a DTC snack, drink, or CPG storefront into a search-driven revenue channel. Recipe hub of 40 to 100 recipes. Ingredient comparison guides at 12 to 24 pieces. Sourcing story pages at 6 to 12 pieces. Buyer intent content at 8 to 16 pieces. Creator syndication calendar with 12 to 30 creators per quarter. Refresh cadence at 12 to 24 months by pillar. Reporting with organic sessions and organic revenue attribution.
If your DTC food brand is running paid social at 20,000 dollars monthly with a broken blog and zero recipe schema, professional content marketing for food brands pays for itself inside the first 90 days on organic traffic captured. Redefine Web ships content marketing inside our monthly retainer packages. Book a call and we will walk through the last three DTC food brands we built recipe hubs for, pillar by pillar.
Internal linking discipline across food brand content moves authority from recipe pages toward hero SKU product pages and comparison guides. Every recipe links to the hero SKU it uses inline (once in the ingredient list, once in a bottom call-out card). Every ingredient comparison guide links to 3 to 6 recipes using the winning ingredient plus the hero SKU product page. Every sourcing story links to the 2 to 4 SKUs sourced from that specific farm or cooperative.
Anchor text strategy across recipe hubs
Anchor text on internal links varies across recipe hubs to avoid over-optimization patterns Google penalizes. Exact-match anchor (“single-origin Ethiopian coffee”) runs on 20 to 30 percent of internal links. Partial-match variations (“our Ethiopian roast”) run on 30 to 40 percent. Branded anchors (the SKU name) run on 20 to 30 percent. Generic anchors (“shop the coffee”) fill the remaining 10 to 20 percent. This ratio holds ranking without triggering the over-optimization penalty that shows up on brands that anchor-text-stuff every internal link with the same exact-match keyword. Cross-reference the linking layer on our food and beverage web design page.
Link equity from ingredient guides to SKU pages
Link equity from ingredient guides passes to SKU pages when the guide’s comparison table names the hero SKU in the winning column with a product card, and when the guide’s body links to 3 to 6 recipes that use the winning ingredient. This 3-hop path (guide to recipe to SKU) pushes authority from a high-traffic informational query down to a high-intent transactional page. According to Search Engine Land SEO coverage, informational content that internally links to transactional pages produces 2 to 4 times higher organic revenue than isolated content silos.
Wrapping up content marketing for food brands
Content marketing for food brands is the organic engine that turns a DTC snack, drink, or CPG storefront into a search-driven revenue channel. Recipe hub of 40 to 100 recipes. Ingredient comparison guides at 12 to 24 pieces. Sourcing story pages at 6 to 12 pieces. Buyer intent content at 8 to 16 pieces. Creator syndication calendar with 12 to 30 creators per quarter. Refresh cadence at 12 to 24 months by pillar. Reporting with organic sessions and organic revenue attribution.
If your DTC food brand is running paid social at 20,000 dollars monthly with a broken blog and zero recipe schema, professional content marketing for food brands pays for itself inside the first 90 days on organic traffic captured. Redefine Web ships content marketing inside our monthly retainer packages. Book a call and we will walk through the last three DTC food brands we built recipe hubs for, pillar by pillar.
Content marketing for food brands starts with a recipe hub because recipe queries account for 40 to 60 percent of high-intent search volume in the food category. Every hero SKU needs 4 to 12 recipes anchored to it, each targeting a specific occasion and audience.
Skip the recipe hub and the brand loses the search real estate that pulls DTC storefront traffic month over month at zero incremental paid cost. Recipe traffic converts at 2 to 4 percent because the shopper landed with usage intent, not passive discovery, which is why food brands win on recipes.
Recipe schema and Google rich result eligibility
Every recipe page ships schema.org Recipe markup including cookTime, prepTime, recipeIngredient, recipeInstructions, nutrition, and aggregateRating. Correctly marked-up recipes qualify for Google’s recipe rich result carousel that pulls 3 to 6 times higher click-through rate than a plain blue link. The schema layer takes 15 minutes per recipe to author and 30 minutes to validate in Google Search Console. Cross-reference the recipe search stack on our food and beverage SEO page.
Recipe hub structure that scales
The recipe hub structure runs 40 to 100 recipes at maturity, organized by hero SKU (4 to 12 recipes per SKU) plus occasion tags (breakfast, weeknight dinner, meal prep, brunch, holiday). Every recipe links back to the hero SKU product page with the SKU embedded in an inline card. The hub earns internal linking value from ingredient comparison guides and the sourcing story pages, which feeds recipe ranking on Google. According to Google Search Central recipe structured data guidance, complete Recipe schema markup is required for eligibility in the recipe carousel and the ingredient search filter.
Pillar structure for food brand content marketing
The pillar structure on content marketing for food brands runs 4 content pillars concurrently: recipe hub (40 to 100 recipes), ingredient comparison guides (12 to 24 guides), sourcing story pages (6 to 12 pages), and buyer intent content (where to buy, subscription vs. one-time, gift bundle guides). Every pillar covers a distinct search intent and every pillar links back to the hero SKU product pages.
Ingredient comparison guide format
Ingredient comparison guides run 1,800 to 3,200 words comparing 2 to 4 ingredient types on 6 to 10 attributes with a comparison table, real-world use case examples, and links to the hero SKU that uses the specific ingredient. Example: organic vs. conventional oats compares nutritional profile, sourcing chain, cost, environmental impact, and taste on a 6-column table. The brand’s SKU appears in the winning column with a product card. These guides rank 3 to 8 months after publication and pull steady-state organic traffic.
Sourcing story pages that build trust
Sourcing story pages name the specific farms, cooperatives, or suppliers the brand sources from, with photos of the farms, farmer quotes, and specific harvest windows. A coffee brand’s Ethiopian farm page ranks for “single-origin Ethiopian coffee” and “Yirgacheffe coffee origin” plus 40 long-tail variations. The sourcing page pulls trust-building traffic that converts at 4 to 6 percent because the shopper landed pattern-matching on transparency and named provenance. Every sourcing page includes farmer or cooperative quotes, harvest dates, and a link back to 3 to 5 hero SKU pages that source from the named supplier.
Vejrø hospitality content case study
Vejrø Resort, a Danish private-island destination with an on-site restaurant focused on organic, locally sourced cuisine, joined us with strong social engagement and no organic-search real estate. Guests found the resort on Instagram but never in Google search for terms like “private island resort Denmark,” “farm-to-table hospitality Denmark,” or “Vejrø restaurant.” The same organic-search gap shows up on DTC food brands running paid social at 20,000 dollars monthly with a broken blog and zero recipe schema.
We built the conversion-focused website with on-site and off-site SEO tuned to the travel-niche keyword clusters, competitor analysis against comparable boutique resorts, and mobile-first design prioritizing guest discovery. Every page carried the structured data qualifying it for Google’s rich results in the hospitality category. Every internal link pushed authority toward the direct-booking conversion path.
Three months later, Vejrø hit 10,000 plus organic visitors, ranked for 200 plus first-page keywords, and pulled a 2.2 percent booking conversion rate from organic traffic. The same pattern applies to content marketing for food brands: recipe schema, ingredient comparison guides, and sourcing story pages pull organic traffic at 20 to 40 percent conversion into hero SKU pages inside 6 months when the content quality matches search intent and every page carries the right structured data markup. Vejrø also proved out the reporting discipline: every monthly report named the exact page, the exact keyword cluster, and the exact search feature (rich result, sitelinks, image pack) driving the incremental organic revenue instead of hiding behind aggregate traffic charts.
Recipe cadence and content calendar for food brands
Recipe cadence on a working food brand content calendar ships 2 to 4 new recipes per week during the first 6 months and drops to 1 per week at maturity. Each recipe takes 4 to 6 hours to produce (write, test in the kitchen, photograph, schema author, publish). At 3 recipes per week, the brand hits 78 recipes inside 6 months plus a backlog of ingredient comparison and sourcing content queued behind the recipe production line.
| Content pillar | Target volume year 1 | Production cost per piece | Refresh cadence |
|---|---|---|---|
| Recipe hub | 40 to 100 recipes | $180 to $320 | Every 12 months |
| Ingredient comparison guides | 12 to 24 guides | $450 to $780 | Every 18 months |
| Sourcing story pages | 6 to 12 pages | $680 to $1,200 | Every 24 months |
| Buyer intent content | 8 to 16 pieces | $220 to $420 | Every 12 months |
Photography as a content calendar constraint
Photography is the actual constraint on recipe cadence, not writing. Every recipe needs 6 to 12 photos: hero shot, ingredient flat lay, prep in progress, plated result, storage, and step shots for the schema markup. A working food brand batches photography 8 recipes at a time to keep the cost per recipe under 200 dollars. Skip the batching and the per-recipe cost climbs to 400 to 600 dollars, which caps recipe cadence at 1 per week and slows organic ranking timeline by 6 months.
Seasonal content calendar planning
Seasonal content calendar planning maps recipes and comparison guides to the seasonal windows they need to rank in. A Christmas cookie recipe needs to publish in September to rank by early December. A Valentine’s chocolate guide needs to publish in November to rank by early February. A back-to-school lunchbox recipe needs to publish in June to rank by late August. The 60-to-90-day ranking curve dictates the calendar.
Creator syndication inside food brand content
Creator syndication on food brand content marketing amplifies the recipe hub through Instagram Reels, TikTok, and YouTube Shorts creators paid to post their own version of the brand’s hero recipes. The creator content pulls net-new audiences into the recipe hub through the creator’s Link in Bio or Amazon Storefront tag. The syndication calendar names 12 to 30 creators per quarter with specific recipes assigned to each.
One brand we picked up had a spreadsheet titled “creator outreach 2023” with 47 rows and 3 responses. All 3 responses were auto-replies. The spreadsheet named zero recipes and offered flat rates below 100 dollars per post. Nobody posts a 30-second video for 87 dollars flat. Nobody.
Creator content commercial terms that work
Working creator content commercial terms run 350 to 1,500 dollars flat per post plus a 12 to 25 percent commission on tagged sales across a 30-day window. The commission mechanic pulls creators into follow-up posts because the incremental revenue continues past the initial fee. Mid-tier creators (30k to 150k followers) hit the sweet spot for food brand content because their engagement rate typically runs 4 to 8 percent versus 0.8 to 1.6 percent on mega-creators.
Content brief structure for creator partnerships
The content brief structure for creator partnerships runs a single page: the SKU, the specific recipe or usage occasion, 3 required brand mentions, 3 restricted claims (no health claims on non-medical SKUs), the pricing angle, the affiliate link, and 3 example videos that hit the tone. The brief avoids over-scripting because over-scripted creator content underperforms native creator voice by 40 to 60 percent on engagement rate.
Buyer intent content for food brand blogs
Buyer intent content on food brand blogs covers 8 to 16 pieces targeting explicit purchase-decision queries: “where to buy [brand],” “[brand] subscription vs. one-time,” “best [category] for [use case],” and “[brand] gift bundle.” Every buyer intent piece runs 1,400 to 2,400 words with a comparison table, product cards, and a clear conversion path to the specific SKU that matches the query intent. Buyer intent content converts at 3 to 6 percent versus 1 to 2 percent on recipe content because the shopper landed already planning to buy, not exploring a usage occasion.
Where-to-buy content structure
Where-to-buy content structure covers online (DTC storefront, Amazon, Target.com, Whole Foods online), retail (specific chain locators with the store finder embedded), and international (customs limitations, retailer partners abroad). Every piece names specific retailers, links to the store locator, and includes an FAQ block covering shipping availability, subscription options, and gift card compatibility. Where-to-buy content ranks for branded discovery queries the DTC storefront otherwise loses to competitor affiliate reviews.
Subscription versus one-time comparison content
Subscription versus one-time comparison content converts subscription commitments at 3 to 6 percent because it addresses the price-sensitivity concern head-on with a specific math table. The piece covers the discount structure (15 percent lifetime), the skip-a-month mechanic, the pause-anytime rule, the cancellation policy, and the specific yearly savings for the brand’s average consumption cadence. Cross-reference the retention structure on our food and beverage marketing retainer page.
Content refresh cadence on food brand pillars
Content refresh cadence on food brand content pillars runs a rolling audit every 12 to 24 months by pillar. Recipes get refreshed every 12 months with new photography, updated schema, and any nutrition or ingredient adjustments. Ingredient comparison guides refresh every 18 months to update market data. Sourcing story pages refresh every 24 months to reflect farm partnership changes and new harvest angles. Buyer intent content refreshes every 12 months to update retailer availability and pricing.
Recipe refresh priority order
Recipe refresh priority runs by organic traffic rank. The top 20 recipes by monthly organic sessions get refreshed first (new photography, schema audit, related recipe internal links, updated nutrition). The next 40 get refreshed at 15 months. The remaining recipes get refreshed opportunistically when the ranking slips past position 15 in Google. Skipping the refresh cadence lets recipe rankings drift out of the top 3 inside 18 months as newer competitor recipes take the position.
Schema audit checklist per refresh
The schema audit checklist per refresh runs 8 items: Recipe schema completeness, aggregateRating count and accuracy, nutrition data accuracy, prepTime and cookTime match the recipe body, image URLs valid at CDN, related recipe internal links working, product card SKU URL live, and Google Search Console rich result eligibility validated. This checklist takes 20 minutes per recipe and prevents the schema drift that costs recipe rankings 20 to 40 positions quietly.
Reporting cadence for food brand content marketing
Reporting cadence on food brand content marketing runs a monthly executive report plus a quarterly business review. The monthly report ships in the first business week and covers organic sessions by pillar, top 10 ranking recipes with position trend, ingredient guide ranking movements, sourcing page performance, and organic-attributed DTC revenue. Every number carries a comparison to the prior month and a plain-language interpretation the founder reads in 7 minutes.
Metrics that matter for content marketing
Metrics that matter for food brand content marketing: organic sessions by pillar, recipe rich result impressions in Search Console, organic conversion rate to hero SKU pages, organic-attributed DTC revenue, and top 20 ranking positions by monthly organic sessions. Vanity metrics that do not matter: total pageviews without conversion context, average time on page without conversion attribution, and social share counts. The monthly report skips the vanity block entirely.
Quarterly business review structure
The quarterly business review runs 90 minutes with the founder, head of content, and SEO lead. Agenda: organic traffic trend by pillar, top 10 winning content pieces, top 10 losing content pieces (candidates for refresh or removal), competitive gap analysis against 5 named competitor brands, and next quarter’s content calendar with recipes and ingredient guides queued. According to Ahrefs content marketing research, brands running quarterly content audits outperform brands running annual audits by 40 to 70 percent on organic revenue over a 24-month window.
Internal linking discipline across food brand content
Internal linking discipline across food brand content moves authority from recipe pages toward hero SKU product pages and comparison guides. Every recipe links to the hero SKU it uses inline (once in the ingredient list, once in a bottom call-out card). Every ingredient comparison guide links to 3 to 6 recipes using the winning ingredient plus the hero SKU product page. Every sourcing story links to the 2 to 4 SKUs sourced from that specific farm or cooperative.
Anchor text strategy across recipe hubs
Anchor text on internal links varies across recipe hubs to avoid over-optimization patterns Google penalizes. Exact-match anchor (“single-origin Ethiopian coffee”) runs on 20 to 30 percent of internal links. Partial-match variations (“our Ethiopian roast”) run on 30 to 40 percent. Branded anchors (the SKU name) run on 20 to 30 percent. Generic anchors (“shop the coffee”) fill the remaining 10 to 20 percent. This ratio holds ranking without triggering the over-optimization penalty that shows up on brands that anchor-text-stuff every internal link with the same exact-match keyword. Cross-reference the linking layer on our food and beverage web design page.
Link equity from ingredient guides to SKU pages
Link equity from ingredient guides passes to SKU pages when the guide’s comparison table names the hero SKU in the winning column with a product card, and when the guide’s body links to 3 to 6 recipes that use the winning ingredient. This 3-hop path (guide to recipe to SKU) pushes authority from a high-traffic informational query down to a high-intent transactional page. According to Search Engine Land SEO coverage, informational content that internally links to transactional pages produces 2 to 4 times higher organic revenue than isolated content silos.
Wrapping up content marketing for food brands
Content marketing for food brands is the organic engine that turns a DTC snack, drink, or CPG storefront into a search-driven revenue channel. Recipe hub of 40 to 100 recipes. Ingredient comparison guides at 12 to 24 pieces. Sourcing story pages at 6 to 12 pieces. Buyer intent content at 8 to 16 pieces. Creator syndication calendar with 12 to 30 creators per quarter. Refresh cadence at 12 to 24 months by pillar. Reporting with organic sessions and organic revenue attribution.
If your DTC food brand is running paid social at 20,000 dollars monthly with a broken blog and zero recipe schema, professional content marketing for food brands pays for itself inside the first 90 days on organic traffic captured. Redefine Web ships content marketing inside our monthly retainer packages. Book a call and we will walk through the last three DTC food brands we built recipe hubs for, pillar by pillar.
Content marketing for food brands starts with a recipe hub because recipe queries account for 40 to 60 percent of high-intent search volume in the food category. Every hero SKU needs 4 to 12 recipes anchored to it, each targeting a specific occasion and audience.
Skip the recipe hub and the brand loses the search real estate that pulls DTC storefront traffic month over month at zero incremental paid cost. Recipe traffic converts at 2 to 4 percent because the shopper landed with usage intent, not passive discovery, which is why food brands win on recipes.
Recipe schema and Google rich result eligibility
Every recipe page ships schema.org Recipe markup including cookTime, prepTime, recipeIngredient, recipeInstructions, nutrition, and aggregateRating. Correctly marked-up recipes qualify for Google’s recipe rich result carousel that pulls 3 to 6 times higher click-through rate than a plain blue link. The schema layer takes 15 minutes per recipe to author and 30 minutes to validate in Google Search Console. Cross-reference the recipe search stack on our food and beverage SEO page.
Recipe hub structure that scales
The recipe hub structure runs 40 to 100 recipes at maturity, organized by hero SKU (4 to 12 recipes per SKU) plus occasion tags (breakfast, weeknight dinner, meal prep, brunch, holiday). Every recipe links back to the hero SKU product page with the SKU embedded in an inline card. The hub earns internal linking value from ingredient comparison guides and the sourcing story pages, which feeds recipe ranking on Google. According to Google Search Central recipe structured data guidance, complete Recipe schema markup is required for eligibility in the recipe carousel and the ingredient search filter.
Pillar structure for food brand content marketing
The pillar structure on content marketing for food brands runs 4 content pillars concurrently: recipe hub (40 to 100 recipes), ingredient comparison guides (12 to 24 guides), sourcing story pages (6 to 12 pages), and buyer intent content (where to buy, subscription vs. one-time, gift bundle guides). Every pillar covers a distinct search intent and every pillar links back to the hero SKU product pages.
Ingredient comparison guide format
Ingredient comparison guides run 1,800 to 3,200 words comparing 2 to 4 ingredient types on 6 to 10 attributes with a comparison table, real-world use case examples, and links to the hero SKU that uses the specific ingredient. Example: organic vs. conventional oats compares nutritional profile, sourcing chain, cost, environmental impact, and taste on a 6-column table. The brand’s SKU appears in the winning column with a product card. These guides rank 3 to 8 months after publication and pull steady-state organic traffic.
Sourcing story pages that build trust
Sourcing story pages name the specific farms, cooperatives, or suppliers the brand sources from, with photos of the farms, farmer quotes, and specific harvest windows. A coffee brand’s Ethiopian farm page ranks for “single-origin Ethiopian coffee” and “Yirgacheffe coffee origin” plus 40 long-tail variations. The sourcing page pulls trust-building traffic that converts at 4 to 6 percent because the shopper landed pattern-matching on transparency and named provenance. Every sourcing page includes farmer or cooperative quotes, harvest dates, and a link back to 3 to 5 hero SKU pages that source from the named supplier.
Vejrø hospitality content case study
Vejrø Resort, a Danish private-island destination with an on-site restaurant focused on organic, locally sourced cuisine, joined us with strong social engagement and no organic-search real estate. Guests found the resort on Instagram but never in Google search for terms like “private island resort Denmark,” “farm-to-table hospitality Denmark,” or “Vejrø restaurant.” The same organic-search gap shows up on DTC food brands running paid social at 20,000 dollars monthly with a broken blog and zero recipe schema.
We built the conversion-focused website with on-site and off-site SEO tuned to the travel-niche keyword clusters, competitor analysis against comparable boutique resorts, and mobile-first design prioritizing guest discovery. Every page carried the structured data qualifying it for Google’s rich results in the hospitality category. Every internal link pushed authority toward the direct-booking conversion path.
Three months later, Vejrø hit 10,000 plus organic visitors, ranked for 200 plus first-page keywords, and pulled a 2.2 percent booking conversion rate from organic traffic. The same pattern applies to content marketing for food brands: recipe schema, ingredient comparison guides, and sourcing story pages pull organic traffic at 20 to 40 percent conversion into hero SKU pages inside 6 months when the content quality matches search intent and every page carries the right structured data markup. Vejrø also proved out the reporting discipline: every monthly report named the exact page, the exact keyword cluster, and the exact search feature (rich result, sitelinks, image pack) driving the incremental organic revenue instead of hiding behind aggregate traffic charts.
Recipe cadence and content calendar for food brands
Recipe cadence on a working food brand content calendar ships 2 to 4 new recipes per week during the first 6 months and drops to 1 per week at maturity. Each recipe takes 4 to 6 hours to produce (write, test in the kitchen, photograph, schema author, publish). At 3 recipes per week, the brand hits 78 recipes inside 6 months plus a backlog of ingredient comparison and sourcing content queued behind the recipe production line.
| Content pillar | Target volume year 1 | Production cost per piece | Refresh cadence |
|---|---|---|---|
| Recipe hub | 40 to 100 recipes | $180 to $320 | Every 12 months |
| Ingredient comparison guides | 12 to 24 guides | $450 to $780 | Every 18 months |
| Sourcing story pages | 6 to 12 pages | $680 to $1,200 | Every 24 months |
| Buyer intent content | 8 to 16 pieces | $220 to $420 | Every 12 months |
Photography as a content calendar constraint
Photography is the actual constraint on recipe cadence, not writing. Every recipe needs 6 to 12 photos: hero shot, ingredient flat lay, prep in progress, plated result, storage, and step shots for the schema markup. A working food brand batches photography 8 recipes at a time to keep the cost per recipe under 200 dollars. Skip the batching and the per-recipe cost climbs to 400 to 600 dollars, which caps recipe cadence at 1 per week and slows organic ranking timeline by 6 months.
Seasonal content calendar planning
Seasonal content calendar planning maps recipes and comparison guides to the seasonal windows they need to rank in. A Christmas cookie recipe needs to publish in September to rank by early December. A Valentine’s chocolate guide needs to publish in November to rank by early February. A back-to-school lunchbox recipe needs to publish in June to rank by late August. The 60-to-90-day ranking curve dictates the calendar.
Creator syndication inside food brand content
Creator syndication on food brand content marketing amplifies the recipe hub through Instagram Reels, TikTok, and YouTube Shorts creators paid to post their own version of the brand’s hero recipes. The creator content pulls net-new audiences into the recipe hub through the creator’s Link in Bio or Amazon Storefront tag. The syndication calendar names 12 to 30 creators per quarter with specific recipes assigned to each.
One brand we picked up had a spreadsheet titled “creator outreach 2023” with 47 rows and 3 responses. All 3 responses were auto-replies. The spreadsheet named zero recipes and offered flat rates below 100 dollars per post. Nobody posts a 30-second video for 87 dollars flat. Nobody.
Creator content commercial terms that work
Working creator content commercial terms run 350 to 1,500 dollars flat per post plus a 12 to 25 percent commission on tagged sales across a 30-day window. The commission mechanic pulls creators into follow-up posts because the incremental revenue continues past the initial fee. Mid-tier creators (30k to 150k followers) hit the sweet spot for food brand content because their engagement rate typically runs 4 to 8 percent versus 0.8 to 1.6 percent on mega-creators.
Content brief structure for creator partnerships
The content brief structure for creator partnerships runs a single page: the SKU, the specific recipe or usage occasion, 3 required brand mentions, 3 restricted claims (no health claims on non-medical SKUs), the pricing angle, the affiliate link, and 3 example videos that hit the tone. The brief avoids over-scripting because over-scripted creator content underperforms native creator voice by 40 to 60 percent on engagement rate.
Buyer intent content for food brand blogs
Buyer intent content on food brand blogs covers 8 to 16 pieces targeting explicit purchase-decision queries: “where to buy [brand],” “[brand] subscription vs. one-time,” “best [category] for [use case],” and “[brand] gift bundle.” Every buyer intent piece runs 1,400 to 2,400 words with a comparison table, product cards, and a clear conversion path to the specific SKU that matches the query intent. Buyer intent content converts at 3 to 6 percent versus 1 to 2 percent on recipe content because the shopper landed already planning to buy, not exploring a usage occasion.
Where-to-buy content structure
Where-to-buy content structure covers online (DTC storefront, Amazon, Target.com, Whole Foods online), retail (specific chain locators with the store finder embedded), and international (customs limitations, retailer partners abroad). Every piece names specific retailers, links to the store locator, and includes an FAQ block covering shipping availability, subscription options, and gift card compatibility. Where-to-buy content ranks for branded discovery queries the DTC storefront otherwise loses to competitor affiliate reviews.
Subscription versus one-time comparison content
Subscription versus one-time comparison content converts subscription commitments at 3 to 6 percent because it addresses the price-sensitivity concern head-on with a specific math table. The piece covers the discount structure (15 percent lifetime), the skip-a-month mechanic, the pause-anytime rule, the cancellation policy, and the specific yearly savings for the brand’s average consumption cadence. Cross-reference the retention structure on our food and beverage marketing retainer page.
Content refresh cadence on food brand pillars
Content refresh cadence on food brand content pillars runs a rolling audit every 12 to 24 months by pillar. Recipes get refreshed every 12 months with new photography, updated schema, and any nutrition or ingredient adjustments. Ingredient comparison guides refresh every 18 months to update market data. Sourcing story pages refresh every 24 months to reflect farm partnership changes and new harvest angles. Buyer intent content refreshes every 12 months to update retailer availability and pricing.
Recipe refresh priority order
Recipe refresh priority runs by organic traffic rank. The top 20 recipes by monthly organic sessions get refreshed first (new photography, schema audit, related recipe internal links, updated nutrition). The next 40 get refreshed at 15 months. The remaining recipes get refreshed opportunistically when the ranking slips past position 15 in Google. Skipping the refresh cadence lets recipe rankings drift out of the top 3 inside 18 months as newer competitor recipes take the position.
Schema audit checklist per refresh
The schema audit checklist per refresh runs 8 items: Recipe schema completeness, aggregateRating count and accuracy, nutrition data accuracy, prepTime and cookTime match the recipe body, image URLs valid at CDN, related recipe internal links working, product card SKU URL live, and Google Search Console rich result eligibility validated. This checklist takes 20 minutes per recipe and prevents the schema drift that costs recipe rankings 20 to 40 positions quietly.
Reporting cadence for food brand content marketing
Reporting cadence on food brand content marketing runs a monthly executive report plus a quarterly business review. The monthly report ships in the first business week and covers organic sessions by pillar, top 10 ranking recipes with position trend, ingredient guide ranking movements, sourcing page performance, and organic-attributed DTC revenue. Every number carries a comparison to the prior month and a plain-language interpretation the founder reads in 7 minutes.
Metrics that matter for content marketing
Metrics that matter for food brand content marketing: organic sessions by pillar, recipe rich result impressions in Search Console, organic conversion rate to hero SKU pages, organic-attributed DTC revenue, and top 20 ranking positions by monthly organic sessions. Vanity metrics that do not matter: total pageviews without conversion context, average time on page without conversion attribution, and social share counts. The monthly report skips the vanity block entirely.
Quarterly business review structure
The quarterly business review runs 90 minutes with the founder, head of content, and SEO lead. Agenda: organic traffic trend by pillar, top 10 winning content pieces, top 10 losing content pieces (candidates for refresh or removal), competitive gap analysis against 5 named competitor brands, and next quarter’s content calendar with recipes and ingredient guides queued. According to Ahrefs content marketing research, brands running quarterly content audits outperform brands running annual audits by 40 to 70 percent on organic revenue over a 24-month window.
Internal linking discipline across food brand content
Internal linking discipline across food brand content moves authority from recipe pages toward hero SKU product pages and comparison guides. Every recipe links to the hero SKU it uses inline (once in the ingredient list, once in a bottom call-out card). Every ingredient comparison guide links to 3 to 6 recipes using the winning ingredient plus the hero SKU product page. Every sourcing story links to the 2 to 4 SKUs sourced from that specific farm or cooperative.
Anchor text strategy across recipe hubs
Anchor text on internal links varies across recipe hubs to avoid over-optimization patterns Google penalizes. Exact-match anchor (“single-origin Ethiopian coffee”) runs on 20 to 30 percent of internal links. Partial-match variations (“our Ethiopian roast”) run on 30 to 40 percent. Branded anchors (the SKU name) run on 20 to 30 percent. Generic anchors (“shop the coffee”) fill the remaining 10 to 20 percent. This ratio holds ranking without triggering the over-optimization penalty that shows up on brands that anchor-text-stuff every internal link with the same exact-match keyword. Cross-reference the linking layer on our food and beverage web design page.
Link equity from ingredient guides to SKU pages
Link equity from ingredient guides passes to SKU pages when the guide’s comparison table names the hero SKU in the winning column with a product card, and when the guide’s body links to 3 to 6 recipes that use the winning ingredient. This 3-hop path (guide to recipe to SKU) pushes authority from a high-traffic informational query down to a high-intent transactional page. According to Search Engine Land SEO coverage, informational content that internally links to transactional pages produces 2 to 4 times higher organic revenue than isolated content silos.
Wrapping up content marketing for food brands
Content marketing for food brands is the organic engine that turns a DTC snack, drink, or CPG storefront into a search-driven revenue channel. Recipe hub of 40 to 100 recipes. Ingredient comparison guides at 12 to 24 pieces. Sourcing story pages at 6 to 12 pieces. Buyer intent content at 8 to 16 pieces. Creator syndication calendar with 12 to 30 creators per quarter. Refresh cadence at 12 to 24 months by pillar. Reporting with organic sessions and organic revenue attribution.
If your DTC food brand is running paid social at 20,000 dollars monthly with a broken blog and zero recipe schema, professional content marketing for food brands pays for itself inside the first 90 days on organic traffic captured. Redefine Web ships content marketing inside our monthly retainer packages. Book a call and we will walk through the last three DTC food brands we built recipe hubs for, pillar by pillar.
Anchor text on internal links varies across recipe hubs to avoid over-optimization patterns Google penalizes. Exact-match anchor (“single-origin Ethiopian coffee”) runs on 20 to 30 percent of internal links. Partial-match variations (“our Ethiopian roast”) run on 30 to 40 percent. Branded anchors (the SKU name) run on 20 to 30 percent. Generic anchors (“shop the coffee”) fill the remaining 10 to 20 percent. This ratio holds ranking without triggering the over-optimization penalty that shows up on brands that anchor-text-stuff every internal link with the same exact-match keyword. Cross-reference the linking layer on our food and beverage web design page.
Link equity from ingredient guides to SKU pages
Link equity from ingredient guides passes to SKU pages when the guide’s comparison table names the hero SKU in the winning column with a product card, and when the guide’s body links to 3 to 6 recipes that use the winning ingredient. This 3-hop path (guide to recipe to SKU) pushes authority from a high-traffic informational query down to a high-intent transactional page. According to Search Engine Land SEO coverage, informational content that internally links to transactional pages produces 2 to 4 times higher organic revenue than isolated content silos.
Wrapping up content marketing for food brands
Content marketing for food brands is the organic engine that turns a DTC snack, drink, or CPG storefront into a search-driven revenue channel. Recipe hub of 40 to 100 recipes. Ingredient comparison guides at 12 to 24 pieces. Sourcing story pages at 6 to 12 pieces. Buyer intent content at 8 to 16 pieces. Creator syndication calendar with 12 to 30 creators per quarter. Refresh cadence at 12 to 24 months by pillar. Reporting with organic sessions and organic revenue attribution.
If your DTC food brand is running paid social at 20,000 dollars monthly with a broken blog and zero recipe schema, professional content marketing for food brands pays for itself inside the first 90 days on organic traffic captured. Redefine Web ships content marketing inside our monthly retainer packages. Book a call and we will walk through the last three DTC food brands we built recipe hubs for, pillar by pillar.
Content marketing for food brands starts with a recipe hub because recipe queries account for 40 to 60 percent of high-intent search volume in the food category. Every hero SKU needs 4 to 12 recipes anchored to it, each targeting a specific occasion and audience.
Skip the recipe hub and the brand loses the search real estate that pulls DTC storefront traffic month over month at zero incremental paid cost. Recipe traffic converts at 2 to 4 percent because the shopper landed with usage intent, not passive discovery, which is why food brands win on recipes.
Recipe schema and Google rich result eligibility
Every recipe page ships schema.org Recipe markup including cookTime, prepTime, recipeIngredient, recipeInstructions, nutrition, and aggregateRating. Correctly marked-up recipes qualify for Google’s recipe rich result carousel that pulls 3 to 6 times higher click-through rate than a plain blue link. The schema layer takes 15 minutes per recipe to author and 30 minutes to validate in Google Search Console. Cross-reference the recipe search stack on our food and beverage SEO page.
Recipe hub structure that scales
The recipe hub structure runs 40 to 100 recipes at maturity, organized by hero SKU (4 to 12 recipes per SKU) plus occasion tags (breakfast, weeknight dinner, meal prep, brunch, holiday). Every recipe links back to the hero SKU product page with the SKU embedded in an inline card. The hub earns internal linking value from ingredient comparison guides and the sourcing story pages, which feeds recipe ranking on Google. According to Google Search Central recipe structured data guidance, complete Recipe schema markup is required for eligibility in the recipe carousel and the ingredient search filter.
Pillar structure for food brand content marketing
The pillar structure on content marketing for food brands runs 4 content pillars concurrently: recipe hub (40 to 100 recipes), ingredient comparison guides (12 to 24 guides), sourcing story pages (6 to 12 pages), and buyer intent content (where to buy, subscription vs. one-time, gift bundle guides). Every pillar covers a distinct search intent and every pillar links back to the hero SKU product pages.
Ingredient comparison guide format
Ingredient comparison guides run 1,800 to 3,200 words comparing 2 to 4 ingredient types on 6 to 10 attributes with a comparison table, real-world use case examples, and links to the hero SKU that uses the specific ingredient. Example: organic vs. conventional oats compares nutritional profile, sourcing chain, cost, environmental impact, and taste on a 6-column table. The brand’s SKU appears in the winning column with a product card. These guides rank 3 to 8 months after publication and pull steady-state organic traffic.
Sourcing story pages that build trust
Sourcing story pages name the specific farms, cooperatives, or suppliers the brand sources from, with photos of the farms, farmer quotes, and specific harvest windows. A coffee brand’s Ethiopian farm page ranks for “single-origin Ethiopian coffee” and “Yirgacheffe coffee origin” plus 40 long-tail variations. The sourcing page pulls trust-building traffic that converts at 4 to 6 percent because the shopper landed pattern-matching on transparency and named provenance. Every sourcing page includes farmer or cooperative quotes, harvest dates, and a link back to 3 to 5 hero SKU pages that source from the named supplier.
Vejrø hospitality content case study
Vejrø Resort, a Danish private-island destination with an on-site restaurant focused on organic, locally sourced cuisine, joined us with strong social engagement and no organic-search real estate. Guests found the resort on Instagram but never in Google search for terms like “private island resort Denmark,” “farm-to-table hospitality Denmark,” or “Vejrø restaurant.” The same organic-search gap shows up on DTC food brands running paid social at 20,000 dollars monthly with a broken blog and zero recipe schema.
We built the conversion-focused website with on-site and off-site SEO tuned to the travel-niche keyword clusters, competitor analysis against comparable boutique resorts, and mobile-first design prioritizing guest discovery. Every page carried the structured data qualifying it for Google’s rich results in the hospitality category. Every internal link pushed authority toward the direct-booking conversion path.
Three months later, Vejrø hit 10,000 plus organic visitors, ranked for 200 plus first-page keywords, and pulled a 2.2 percent booking conversion rate from organic traffic. The same pattern applies to content marketing for food brands: recipe schema, ingredient comparison guides, and sourcing story pages pull organic traffic at 20 to 40 percent conversion into hero SKU pages inside 6 months when the content quality matches search intent and every page carries the right structured data markup. Vejrø also proved out the reporting discipline: every monthly report named the exact page, the exact keyword cluster, and the exact search feature (rich result, sitelinks, image pack) driving the incremental organic revenue instead of hiding behind aggregate traffic charts.
Recipe cadence and content calendar for food brands
Recipe cadence on a working food brand content calendar ships 2 to 4 new recipes per week during the first 6 months and drops to 1 per week at maturity. Each recipe takes 4 to 6 hours to produce (write, test in the kitchen, photograph, schema author, publish). At 3 recipes per week, the brand hits 78 recipes inside 6 months plus a backlog of ingredient comparison and sourcing content queued behind the recipe production line.
| Content pillar | Target volume year 1 | Production cost per piece | Refresh cadence |
|---|---|---|---|
| Recipe hub | 40 to 100 recipes | $180 to $320 | Every 12 months |
| Ingredient comparison guides | 12 to 24 guides | $450 to $780 | Every 18 months |
| Sourcing story pages | 6 to 12 pages | $680 to $1,200 | Every 24 months |
| Buyer intent content | 8 to 16 pieces | $220 to $420 | Every 12 months |
Photography as a content calendar constraint
Photography is the actual constraint on recipe cadence, not writing. Every recipe needs 6 to 12 photos: hero shot, ingredient flat lay, prep in progress, plated result, storage, and step shots for the schema markup. A working food brand batches photography 8 recipes at a time to keep the cost per recipe under 200 dollars. Skip the batching and the per-recipe cost climbs to 400 to 600 dollars, which caps recipe cadence at 1 per week and slows organic ranking timeline by 6 months.
Seasonal content calendar planning
Seasonal content calendar planning maps recipes and comparison guides to the seasonal windows they need to rank in. A Christmas cookie recipe needs to publish in September to rank by early December. A Valentine’s chocolate guide needs to publish in November to rank by early February. A back-to-school lunchbox recipe needs to publish in June to rank by late August. The 60-to-90-day ranking curve dictates the calendar.
Creator syndication inside food brand content
Creator syndication on food brand content marketing amplifies the recipe hub through Instagram Reels, TikTok, and YouTube Shorts creators paid to post their own version of the brand’s hero recipes. The creator content pulls net-new audiences into the recipe hub through the creator’s Link in Bio or Amazon Storefront tag. The syndication calendar names 12 to 30 creators per quarter with specific recipes assigned to each.
One brand we picked up had a spreadsheet titled “creator outreach 2023” with 47 rows and 3 responses. All 3 responses were auto-replies. The spreadsheet named zero recipes and offered flat rates below 100 dollars per post. Nobody posts a 30-second video for 87 dollars flat. Nobody.
Creator content commercial terms that work
Working creator content commercial terms run 350 to 1,500 dollars flat per post plus a 12 to 25 percent commission on tagged sales across a 30-day window. The commission mechanic pulls creators into follow-up posts because the incremental revenue continues past the initial fee. Mid-tier creators (30k to 150k followers) hit the sweet spot for food brand content because their engagement rate typically runs 4 to 8 percent versus 0.8 to 1.6 percent on mega-creators.
Content brief structure for creator partnerships
The content brief structure for creator partnerships runs a single page: the SKU, the specific recipe or usage occasion, 3 required brand mentions, 3 restricted claims (no health claims on non-medical SKUs), the pricing angle, the affiliate link, and 3 example videos that hit the tone. The brief avoids over-scripting because over-scripted creator content underperforms native creator voice by 40 to 60 percent on engagement rate.
Buyer intent content for food brand blogs
Buyer intent content on food brand blogs covers 8 to 16 pieces targeting explicit purchase-decision queries: “where to buy [brand],” “[brand] subscription vs. one-time,” “best [category] for [use case],” and “[brand] gift bundle.” Every buyer intent piece runs 1,400 to 2,400 words with a comparison table, product cards, and a clear conversion path to the specific SKU that matches the query intent. Buyer intent content converts at 3 to 6 percent versus 1 to 2 percent on recipe content because the shopper landed already planning to buy, not exploring a usage occasion.
Where-to-buy content structure
Where-to-buy content structure covers online (DTC storefront, Amazon, Target.com, Whole Foods online), retail (specific chain locators with the store finder embedded), and international (customs limitations, retailer partners abroad). Every piece names specific retailers, links to the store locator, and includes an FAQ block covering shipping availability, subscription options, and gift card compatibility. Where-to-buy content ranks for branded discovery queries the DTC storefront otherwise loses to competitor affiliate reviews.
Subscription versus one-time comparison content
Subscription versus one-time comparison content converts subscription commitments at 3 to 6 percent because it addresses the price-sensitivity concern head-on with a specific math table. The piece covers the discount structure (15 percent lifetime), the skip-a-month mechanic, the pause-anytime rule, the cancellation policy, and the specific yearly savings for the brand’s average consumption cadence. Cross-reference the retention structure on our food and beverage marketing retainer page.
Content refresh cadence on food brand pillars
Content refresh cadence on food brand content pillars runs a rolling audit every 12 to 24 months by pillar. Recipes get refreshed every 12 months with new photography, updated schema, and any nutrition or ingredient adjustments. Ingredient comparison guides refresh every 18 months to update market data. Sourcing story pages refresh every 24 months to reflect farm partnership changes and new harvest angles. Buyer intent content refreshes every 12 months to update retailer availability and pricing.
Recipe refresh priority order
Recipe refresh priority runs by organic traffic rank. The top 20 recipes by monthly organic sessions get refreshed first (new photography, schema audit, related recipe internal links, updated nutrition). The next 40 get refreshed at 15 months. The remaining recipes get refreshed opportunistically when the ranking slips past position 15 in Google. Skipping the refresh cadence lets recipe rankings drift out of the top 3 inside 18 months as newer competitor recipes take the position.
Schema audit checklist per refresh
The schema audit checklist per refresh runs 8 items: Recipe schema completeness, aggregateRating count and accuracy, nutrition data accuracy, prepTime and cookTime match the recipe body, image URLs valid at CDN, related recipe internal links working, product card SKU URL live, and Google Search Console rich result eligibility validated. This checklist takes 20 minutes per recipe and prevents the schema drift that costs recipe rankings 20 to 40 positions quietly.
Reporting cadence for food brand content marketing
Reporting cadence on food brand content marketing runs a monthly executive report plus a quarterly business review. The monthly report ships in the first business week and covers organic sessions by pillar, top 10 ranking recipes with position trend, ingredient guide ranking movements, sourcing page performance, and organic-attributed DTC revenue. Every number carries a comparison to the prior month and a plain-language interpretation the founder reads in 7 minutes.
Metrics that matter for content marketing
Metrics that matter for food brand content marketing: organic sessions by pillar, recipe rich result impressions in Search Console, organic conversion rate to hero SKU pages, organic-attributed DTC revenue, and top 20 ranking positions by monthly organic sessions. Vanity metrics that do not matter: total pageviews without conversion context, average time on page without conversion attribution, and social share counts. The monthly report skips the vanity block entirely.
Quarterly business review structure
The quarterly business review runs 90 minutes with the founder, head of content, and SEO lead. Agenda: organic traffic trend by pillar, top 10 winning content pieces, top 10 losing content pieces (candidates for refresh or removal), competitive gap analysis against 5 named competitor brands, and next quarter’s content calendar with recipes and ingredient guides queued. According to Ahrefs content marketing research, brands running quarterly content audits outperform brands running annual audits by 40 to 70 percent on organic revenue over a 24-month window.
Internal linking discipline across food brand content
Internal linking discipline across food brand content moves authority from recipe pages toward hero SKU product pages and comparison guides. Every recipe links to the hero SKU it uses inline (once in the ingredient list, once in a bottom call-out card). Every ingredient comparison guide links to 3 to 6 recipes using the winning ingredient plus the hero SKU product page. Every sourcing story links to the 2 to 4 SKUs sourced from that specific farm or cooperative.
Anchor text strategy across recipe hubs
Anchor text on internal links varies across recipe hubs to avoid over-optimization patterns Google penalizes. Exact-match anchor (“single-origin Ethiopian coffee”) runs on 20 to 30 percent of internal links. Partial-match variations (“our Ethiopian roast”) run on 30 to 40 percent. Branded anchors (the SKU name) run on 20 to 30 percent. Generic anchors (“shop the coffee”) fill the remaining 10 to 20 percent. This ratio holds ranking without triggering the over-optimization penalty that shows up on brands that anchor-text-stuff every internal link with the same exact-match keyword. Cross-reference the linking layer on our food and beverage web design page.
Link equity from ingredient guides to SKU pages
Link equity from ingredient guides passes to SKU pages when the guide’s comparison table names the hero SKU in the winning column with a product card, and when the guide’s body links to 3 to 6 recipes that use the winning ingredient. This 3-hop path (guide to recipe to SKU) pushes authority from a high-traffic informational query down to a high-intent transactional page. According to Search Engine Land SEO coverage, informational content that internally links to transactional pages produces 2 to 4 times higher organic revenue than isolated content silos.
Wrapping up content marketing for food brands
Content marketing for food brands is the organic engine that turns a DTC snack, drink, or CPG storefront into a search-driven revenue channel. Recipe hub of 40 to 100 recipes. Ingredient comparison guides at 12 to 24 pieces. Sourcing story pages at 6 to 12 pieces. Buyer intent content at 8 to 16 pieces. Creator syndication calendar with 12 to 30 creators per quarter. Refresh cadence at 12 to 24 months by pillar. Reporting with organic sessions and organic revenue attribution.
If your DTC food brand is running paid social at 20,000 dollars monthly with a broken blog and zero recipe schema, professional content marketing for food brands pays for itself inside the first 90 days on organic traffic captured. Redefine Web ships content marketing inside our monthly retainer packages. Book a call and we will walk through the last three DTC food brands we built recipe hubs for, pillar by pillar.
Anchor text on internal links varies across recipe hubs to avoid over-optimization patterns Google penalizes. Exact-match anchor (“single-origin Ethiopian coffee”) runs on 20 to 30 percent of internal links. Partial-match variations (“our Ethiopian roast”) run on 30 to 40 percent. Branded anchors (the SKU name) run on 20 to 30 percent. Generic anchors (“shop the coffee”) fill the remaining 10 to 20 percent. This ratio holds ranking without triggering the over-optimization penalty that shows up on brands that anchor-text-stuff every internal link with the same exact-match keyword. Cross-reference the linking layer on our food and beverage web design page.
Link equity from ingredient guides to SKU pages
Link equity from ingredient guides passes to SKU pages when the guide’s comparison table names the hero SKU in the winning column with a product card, and when the guide’s body links to 3 to 6 recipes that use the winning ingredient. This 3-hop path (guide to recipe to SKU) pushes authority from a high-traffic informational query down to a high-intent transactional page. According to Search Engine Land SEO coverage, informational content that internally links to transactional pages produces 2 to 4 times higher organic revenue than isolated content silos.
Wrapping up content marketing for food brands
Content marketing for food brands is the organic engine that turns a DTC snack, drink, or CPG storefront into a search-driven revenue channel. Recipe hub of 40 to 100 recipes. Ingredient comparison guides at 12 to 24 pieces. Sourcing story pages at 6 to 12 pieces. Buyer intent content at 8 to 16 pieces. Creator syndication calendar with 12 to 30 creators per quarter. Refresh cadence at 12 to 24 months by pillar. Reporting with organic sessions and organic revenue attribution.
If your DTC food brand is running paid social at 20,000 dollars monthly with a broken blog and zero recipe schema, professional content marketing for food brands pays for itself inside the first 90 days on organic traffic captured. Redefine Web ships content marketing inside our monthly retainer packages. Book a call and we will walk through the last three DTC food brands we built recipe hubs for, pillar by pillar.
Content marketing for food brands starts with a recipe hub because recipe queries account for 40 to 60 percent of high-intent search volume in the food category. Every hero SKU needs 4 to 12 recipes anchored to it, each targeting a specific occasion and audience.
Skip the recipe hub and the brand loses the search real estate that pulls DTC storefront traffic month over month at zero incremental paid cost. Recipe traffic converts at 2 to 4 percent because the shopper landed with usage intent, not passive discovery, which is why food brands win on recipes.
Recipe schema and Google rich result eligibility
Every recipe page ships schema.org Recipe markup including cookTime, prepTime, recipeIngredient, recipeInstructions, nutrition, and aggregateRating. Correctly marked-up recipes qualify for Google’s recipe rich result carousel that pulls 3 to 6 times higher click-through rate than a plain blue link. The schema layer takes 15 minutes per recipe to author and 30 minutes to validate in Google Search Console. Cross-reference the recipe search stack on our food and beverage SEO page.
Recipe hub structure that scales
The recipe hub structure runs 40 to 100 recipes at maturity, organized by hero SKU (4 to 12 recipes per SKU) plus occasion tags (breakfast, weeknight dinner, meal prep, brunch, holiday). Every recipe links back to the hero SKU product page with the SKU embedded in an inline card. The hub earns internal linking value from ingredient comparison guides and the sourcing story pages, which feeds recipe ranking on Google. According to Google Search Central recipe structured data guidance, complete Recipe schema markup is required for eligibility in the recipe carousel and the ingredient search filter.
Pillar structure for food brand content marketing
The pillar structure on content marketing for food brands runs 4 content pillars concurrently: recipe hub (40 to 100 recipes), ingredient comparison guides (12 to 24 guides), sourcing story pages (6 to 12 pages), and buyer intent content (where to buy, subscription vs. one-time, gift bundle guides). Every pillar covers a distinct search intent and every pillar links back to the hero SKU product pages.
Ingredient comparison guide format
Ingredient comparison guides run 1,800 to 3,200 words comparing 2 to 4 ingredient types on 6 to 10 attributes with a comparison table, real-world use case examples, and links to the hero SKU that uses the specific ingredient. Example: organic vs. conventional oats compares nutritional profile, sourcing chain, cost, environmental impact, and taste on a 6-column table. The brand’s SKU appears in the winning column with a product card. These guides rank 3 to 8 months after publication and pull steady-state organic traffic.
Sourcing story pages that build trust
Sourcing story pages name the specific farms, cooperatives, or suppliers the brand sources from, with photos of the farms, farmer quotes, and specific harvest windows. A coffee brand’s Ethiopian farm page ranks for “single-origin Ethiopian coffee” and “Yirgacheffe coffee origin” plus 40 long-tail variations. The sourcing page pulls trust-building traffic that converts at 4 to 6 percent because the shopper landed pattern-matching on transparency and named provenance. Every sourcing page includes farmer or cooperative quotes, harvest dates, and a link back to 3 to 5 hero SKU pages that source from the named supplier.
Vejrø hospitality content case study
Vejrø Resort, a Danish private-island destination with an on-site restaurant focused on organic, locally sourced cuisine, joined us with strong social engagement and no organic-search real estate. Guests found the resort on Instagram but never in Google search for terms like “private island resort Denmark,” “farm-to-table hospitality Denmark,” or “Vejrø restaurant.” The same organic-search gap shows up on DTC food brands running paid social at 20,000 dollars monthly with a broken blog and zero recipe schema.
We built the conversion-focused website with on-site and off-site SEO tuned to the travel-niche keyword clusters, competitor analysis against comparable boutique resorts, and mobile-first design prioritizing guest discovery. Every page carried the structured data qualifying it for Google’s rich results in the hospitality category. Every internal link pushed authority toward the direct-booking conversion path.
Three months later, Vejrø hit 10,000 plus organic visitors, ranked for 200 plus first-page keywords, and pulled a 2.2 percent booking conversion rate from organic traffic. The same pattern applies to content marketing for food brands: recipe schema, ingredient comparison guides, and sourcing story pages pull organic traffic at 20 to 40 percent conversion into hero SKU pages inside 6 months when the content quality matches search intent and every page carries the right structured data markup. Vejrø also proved out the reporting discipline: every monthly report named the exact page, the exact keyword cluster, and the exact search feature (rich result, sitelinks, image pack) driving the incremental organic revenue instead of hiding behind aggregate traffic charts.
Recipe cadence and content calendar for food brands
Recipe cadence on a working food brand content calendar ships 2 to 4 new recipes per week during the first 6 months and drops to 1 per week at maturity. Each recipe takes 4 to 6 hours to produce (write, test in the kitchen, photograph, schema author, publish). At 3 recipes per week, the brand hits 78 recipes inside 6 months plus a backlog of ingredient comparison and sourcing content queued behind the recipe production line.
| Content pillar | Target volume year 1 | Production cost per piece | Refresh cadence |
|---|---|---|---|
| Recipe hub | 40 to 100 recipes | $180 to $320 | Every 12 months |
| Ingredient comparison guides | 12 to 24 guides | $450 to $780 | Every 18 months |
| Sourcing story pages | 6 to 12 pages | $680 to $1,200 | Every 24 months |
| Buyer intent content | 8 to 16 pieces | $220 to $420 | Every 12 months |
Photography as a content calendar constraint
Photography is the actual constraint on recipe cadence, not writing. Every recipe needs 6 to 12 photos: hero shot, ingredient flat lay, prep in progress, plated result, storage, and step shots for the schema markup. A working food brand batches photography 8 recipes at a time to keep the cost per recipe under 200 dollars. Skip the batching and the per-recipe cost climbs to 400 to 600 dollars, which caps recipe cadence at 1 per week and slows organic ranking timeline by 6 months.
Seasonal content calendar planning
Seasonal content calendar planning maps recipes and comparison guides to the seasonal windows they need to rank in. A Christmas cookie recipe needs to publish in September to rank by early December. A Valentine’s chocolate guide needs to publish in November to rank by early February. A back-to-school lunchbox recipe needs to publish in June to rank by late August. The 60-to-90-day ranking curve dictates the calendar.
Creator syndication inside food brand content
Creator syndication on food brand content marketing amplifies the recipe hub through Instagram Reels, TikTok, and YouTube Shorts creators paid to post their own version of the brand’s hero recipes. The creator content pulls net-new audiences into the recipe hub through the creator’s Link in Bio or Amazon Storefront tag. The syndication calendar names 12 to 30 creators per quarter with specific recipes assigned to each.
One brand we picked up had a spreadsheet titled “creator outreach 2023” with 47 rows and 3 responses. All 3 responses were auto-replies. The spreadsheet named zero recipes and offered flat rates below 100 dollars per post. Nobody posts a 30-second video for 87 dollars flat. Nobody.
Creator content commercial terms that work
Working creator content commercial terms run 350 to 1,500 dollars flat per post plus a 12 to 25 percent commission on tagged sales across a 30-day window. The commission mechanic pulls creators into follow-up posts because the incremental revenue continues past the initial fee. Mid-tier creators (30k to 150k followers) hit the sweet spot for food brand content because their engagement rate typically runs 4 to 8 percent versus 0.8 to 1.6 percent on mega-creators.
Content brief structure for creator partnerships
The content brief structure for creator partnerships runs a single page: the SKU, the specific recipe or usage occasion, 3 required brand mentions, 3 restricted claims (no health claims on non-medical SKUs), the pricing angle, the affiliate link, and 3 example videos that hit the tone. The brief avoids over-scripting because over-scripted creator content underperforms native creator voice by 40 to 60 percent on engagement rate.
Buyer intent content for food brand blogs
Buyer intent content on food brand blogs covers 8 to 16 pieces targeting explicit purchase-decision queries: “where to buy [brand],” “[brand] subscription vs. one-time,” “best [category] for [use case],” and “[brand] gift bundle.” Every buyer intent piece runs 1,400 to 2,400 words with a comparison table, product cards, and a clear conversion path to the specific SKU that matches the query intent. Buyer intent content converts at 3 to 6 percent versus 1 to 2 percent on recipe content because the shopper landed already planning to buy, not exploring a usage occasion.
Where-to-buy content structure
Where-to-buy content structure covers online (DTC storefront, Amazon, Target.com, Whole Foods online), retail (specific chain locators with the store finder embedded), and international (customs limitations, retailer partners abroad). Every piece names specific retailers, links to the store locator, and includes an FAQ block covering shipping availability, subscription options, and gift card compatibility. Where-to-buy content ranks for branded discovery queries the DTC storefront otherwise loses to competitor affiliate reviews.
Subscription versus one-time comparison content
Subscription versus one-time comparison content converts subscription commitments at 3 to 6 percent because it addresses the price-sensitivity concern head-on with a specific math table. The piece covers the discount structure (15 percent lifetime), the skip-a-month mechanic, the pause-anytime rule, the cancellation policy, and the specific yearly savings for the brand’s average consumption cadence. Cross-reference the retention structure on our food and beverage marketing retainer page.
Content refresh cadence on food brand pillars
Content refresh cadence on food brand content pillars runs a rolling audit every 12 to 24 months by pillar. Recipes get refreshed every 12 months with new photography, updated schema, and any nutrition or ingredient adjustments. Ingredient comparison guides refresh every 18 months to update market data. Sourcing story pages refresh every 24 months to reflect farm partnership changes and new harvest angles. Buyer intent content refreshes every 12 months to update retailer availability and pricing.
Recipe refresh priority order
Recipe refresh priority runs by organic traffic rank. The top 20 recipes by monthly organic sessions get refreshed first (new photography, schema audit, related recipe internal links, updated nutrition). The next 40 get refreshed at 15 months. The remaining recipes get refreshed opportunistically when the ranking slips past position 15 in Google. Skipping the refresh cadence lets recipe rankings drift out of the top 3 inside 18 months as newer competitor recipes take the position.
Schema audit checklist per refresh
The schema audit checklist per refresh runs 8 items: Recipe schema completeness, aggregateRating count and accuracy, nutrition data accuracy, prepTime and cookTime match the recipe body, image URLs valid at CDN, related recipe internal links working, product card SKU URL live, and Google Search Console rich result eligibility validated. This checklist takes 20 minutes per recipe and prevents the schema drift that costs recipe rankings 20 to 40 positions quietly.
Reporting cadence for food brand content marketing
Reporting cadence on food brand content marketing runs a monthly executive report plus a quarterly business review. The monthly report ships in the first business week and covers organic sessions by pillar, top 10 ranking recipes with position trend, ingredient guide ranking movements, sourcing page performance, and organic-attributed DTC revenue. Every number carries a comparison to the prior month and a plain-language interpretation the founder reads in 7 minutes.
Metrics that matter for content marketing
Metrics that matter for food brand content marketing: organic sessions by pillar, recipe rich result impressions in Search Console, organic conversion rate to hero SKU pages, organic-attributed DTC revenue, and top 20 ranking positions by monthly organic sessions. Vanity metrics that do not matter: total pageviews without conversion context, average time on page without conversion attribution, and social share counts. The monthly report skips the vanity block entirely.
Quarterly business review structure
The quarterly business review runs 90 minutes with the founder, head of content, and SEO lead. Agenda: organic traffic trend by pillar, top 10 winning content pieces, top 10 losing content pieces (candidates for refresh or removal), competitive gap analysis against 5 named competitor brands, and next quarter’s content calendar with recipes and ingredient guides queued. According to Ahrefs content marketing research, brands running quarterly content audits outperform brands running annual audits by 40 to 70 percent on organic revenue over a 24-month window.
Internal linking discipline across food brand content
Internal linking discipline across food brand content moves authority from recipe pages toward hero SKU product pages and comparison guides. Every recipe links to the hero SKU it uses inline (once in the ingredient list, once in a bottom call-out card). Every ingredient comparison guide links to 3 to 6 recipes using the winning ingredient plus the hero SKU product page. Every sourcing story links to the 2 to 4 SKUs sourced from that specific farm or cooperative.
Anchor text strategy across recipe hubs
Anchor text on internal links varies across recipe hubs to avoid over-optimization patterns Google penalizes. Exact-match anchor (“single-origin Ethiopian coffee”) runs on 20 to 30 percent of internal links. Partial-match variations (“our Ethiopian roast”) run on 30 to 40 percent. Branded anchors (the SKU name) run on 20 to 30 percent. Generic anchors (“shop the coffee”) fill the remaining 10 to 20 percent. This ratio holds ranking without triggering the over-optimization penalty that shows up on brands that anchor-text-stuff every internal link with the same exact-match keyword. Cross-reference the linking layer on our food and beverage web design page.
Link equity from ingredient guides to SKU pages
Link equity from ingredient guides passes to SKU pages when the guide’s comparison table names the hero SKU in the winning column with a product card, and when the guide’s body links to 3 to 6 recipes that use the winning ingredient. This 3-hop path (guide to recipe to SKU) pushes authority from a high-traffic informational query down to a high-intent transactional page. According to Search Engine Land SEO coverage, informational content that internally links to transactional pages produces 2 to 4 times higher organic revenue than isolated content silos.
Wrapping up content marketing for food brands
Content marketing for food brands is the organic engine that turns a DTC snack, drink, or CPG storefront into a search-driven revenue channel. Recipe hub of 40 to 100 recipes. Ingredient comparison guides at 12 to 24 pieces. Sourcing story pages at 6 to 12 pieces. Buyer intent content at 8 to 16 pieces. Creator syndication calendar with 12 to 30 creators per quarter. Refresh cadence at 12 to 24 months by pillar. Reporting with organic sessions and organic revenue attribution.
If your DTC food brand is running paid social at 20,000 dollars monthly with a broken blog and zero recipe schema, professional content marketing for food brands pays for itself inside the first 90 days on organic traffic captured. Redefine Web ships content marketing inside our monthly retainer packages. Book a call and we will walk through the last three DTC food brands we built recipe hubs for, pillar by pillar.
Content marketing for food brands starts with a recipe hub because recipe queries account for 40 to 60 percent of high-intent search volume in the food category. Every hero SKU needs 4 to 12 recipes anchored to it, each targeting a specific occasion and audience.
Skip the recipe hub and the brand loses the search real estate that pulls DTC storefront traffic month over month at zero incremental paid cost. Recipe traffic converts at 2 to 4 percent because the shopper landed with usage intent, not passive discovery, which is why food brands win on recipes.
Recipe schema and Google rich result eligibility
Every recipe page ships schema.org Recipe markup including cookTime, prepTime, recipeIngredient, recipeInstructions, nutrition, and aggregateRating. Correctly marked-up recipes qualify for Google’s recipe rich result carousel that pulls 3 to 6 times higher click-through rate than a plain blue link. The schema layer takes 15 minutes per recipe to author and 30 minutes to validate in Google Search Console. Cross-reference the recipe search stack on our food and beverage SEO page.
Recipe hub structure that scales
The recipe hub structure runs 40 to 100 recipes at maturity, organized by hero SKU (4 to 12 recipes per SKU) plus occasion tags (breakfast, weeknight dinner, meal prep, brunch, holiday). Every recipe links back to the hero SKU product page with the SKU embedded in an inline card. The hub earns internal linking value from ingredient comparison guides and the sourcing story pages, which feeds recipe ranking on Google. According to Google Search Central recipe structured data guidance, complete Recipe schema markup is required for eligibility in the recipe carousel and the ingredient search filter.
Pillar structure for food brand content marketing
The pillar structure on content marketing for food brands runs 4 content pillars concurrently: recipe hub (40 to 100 recipes), ingredient comparison guides (12 to 24 guides), sourcing story pages (6 to 12 pages), and buyer intent content (where to buy, subscription vs. one-time, gift bundle guides). Every pillar covers a distinct search intent and every pillar links back to the hero SKU product pages.
Ingredient comparison guide format
Ingredient comparison guides run 1,800 to 3,200 words comparing 2 to 4 ingredient types on 6 to 10 attributes with a comparison table, real-world use case examples, and links to the hero SKU that uses the specific ingredient. Example: organic vs. conventional oats compares nutritional profile, sourcing chain, cost, environmental impact, and taste on a 6-column table. The brand’s SKU appears in the winning column with a product card. These guides rank 3 to 8 months after publication and pull steady-state organic traffic.
Sourcing story pages that build trust
Sourcing story pages name the specific farms, cooperatives, or suppliers the brand sources from, with photos of the farms, farmer quotes, and specific harvest windows. A coffee brand’s Ethiopian farm page ranks for “single-origin Ethiopian coffee” and “Yirgacheffe coffee origin” plus 40 long-tail variations. The sourcing page pulls trust-building traffic that converts at 4 to 6 percent because the shopper landed pattern-matching on transparency and named provenance. Every sourcing page includes farmer or cooperative quotes, harvest dates, and a link back to 3 to 5 hero SKU pages that source from the named supplier.
Vejrø hospitality content case study
Vejrø Resort, a Danish private-island destination with an on-site restaurant focused on organic, locally sourced cuisine, joined us with strong social engagement and no organic-search real estate. Guests found the resort on Instagram but never in Google search for terms like “private island resort Denmark,” “farm-to-table hospitality Denmark,” or “Vejrø restaurant.” The same organic-search gap shows up on DTC food brands running paid social at 20,000 dollars monthly with a broken blog and zero recipe schema.
We built the conversion-focused website with on-site and off-site SEO tuned to the travel-niche keyword clusters, competitor analysis against comparable boutique resorts, and mobile-first design prioritizing guest discovery. Every page carried the structured data qualifying it for Google’s rich results in the hospitality category. Every internal link pushed authority toward the direct-booking conversion path.
Three months later, Vejrø hit 10,000 plus organic visitors, ranked for 200 plus first-page keywords, and pulled a 2.2 percent booking conversion rate from organic traffic. The same pattern applies to content marketing for food brands: recipe schema, ingredient comparison guides, and sourcing story pages pull organic traffic at 20 to 40 percent conversion into hero SKU pages inside 6 months when the content quality matches search intent and every page carries the right structured data markup. Vejrø also proved out the reporting discipline: every monthly report named the exact page, the exact keyword cluster, and the exact search feature (rich result, sitelinks, image pack) driving the incremental organic revenue instead of hiding behind aggregate traffic charts.
Recipe cadence and content calendar for food brands
Recipe cadence on a working food brand content calendar ships 2 to 4 new recipes per week during the first 6 months and drops to 1 per week at maturity. Each recipe takes 4 to 6 hours to produce (write, test in the kitchen, photograph, schema author, publish). At 3 recipes per week, the brand hits 78 recipes inside 6 months plus a backlog of ingredient comparison and sourcing content queued behind the recipe production line.
| Content pillar | Target volume year 1 | Production cost per piece | Refresh cadence |
|---|---|---|---|
| Recipe hub | 40 to 100 recipes | $180 to $320 | Every 12 months |
| Ingredient comparison guides | 12 to 24 guides | $450 to $780 | Every 18 months |
| Sourcing story pages | 6 to 12 pages | $680 to $1,200 | Every 24 months |
| Buyer intent content | 8 to 16 pieces | $220 to $420 | Every 12 months |
Photography as a content calendar constraint
Photography is the actual constraint on recipe cadence, not writing. Every recipe needs 6 to 12 photos: hero shot, ingredient flat lay, prep in progress, plated result, storage, and step shots for the schema markup. A working food brand batches photography 8 recipes at a time to keep the cost per recipe under 200 dollars. Skip the batching and the per-recipe cost climbs to 400 to 600 dollars, which caps recipe cadence at 1 per week and slows organic ranking timeline by 6 months.
Seasonal content calendar planning
Seasonal content calendar planning maps recipes and comparison guides to the seasonal windows they need to rank in. A Christmas cookie recipe needs to publish in September to rank by early December. A Valentine’s chocolate guide needs to publish in November to rank by early February. A back-to-school lunchbox recipe needs to publish in June to rank by late August. The 60-to-90-day ranking curve dictates the calendar.
Creator syndication inside food brand content
Creator syndication on food brand content marketing amplifies the recipe hub through Instagram Reels, TikTok, and YouTube Shorts creators paid to post their own version of the brand’s hero recipes. The creator content pulls net-new audiences into the recipe hub through the creator’s Link in Bio or Amazon Storefront tag. The syndication calendar names 12 to 30 creators per quarter with specific recipes assigned to each.
One brand we picked up had a spreadsheet titled “creator outreach 2023” with 47 rows and 3 responses. All 3 responses were auto-replies. The spreadsheet named zero recipes and offered flat rates below 100 dollars per post. Nobody posts a 30-second video for 87 dollars flat. Nobody.
Creator content commercial terms that work
Working creator content commercial terms run 350 to 1,500 dollars flat per post plus a 12 to 25 percent commission on tagged sales across a 30-day window. The commission mechanic pulls creators into follow-up posts because the incremental revenue continues past the initial fee. Mid-tier creators (30k to 150k followers) hit the sweet spot for food brand content because their engagement rate typically runs 4 to 8 percent versus 0.8 to 1.6 percent on mega-creators.
Content brief structure for creator partnerships
The content brief structure for creator partnerships runs a single page: the SKU, the specific recipe or usage occasion, 3 required brand mentions, 3 restricted claims (no health claims on non-medical SKUs), the pricing angle, the affiliate link, and 3 example videos that hit the tone. The brief avoids over-scripting because over-scripted creator content underperforms native creator voice by 40 to 60 percent on engagement rate.
Buyer intent content for food brand blogs
Buyer intent content on food brand blogs covers 8 to 16 pieces targeting explicit purchase-decision queries: “where to buy [brand],” “[brand] subscription vs. one-time,” “best [category] for [use case],” and “[brand] gift bundle.” Every buyer intent piece runs 1,400 to 2,400 words with a comparison table, product cards, and a clear conversion path to the specific SKU that matches the query intent. Buyer intent content converts at 3 to 6 percent versus 1 to 2 percent on recipe content because the shopper landed already planning to buy, not exploring a usage occasion.
Where-to-buy content structure
Where-to-buy content structure covers online (DTC storefront, Amazon, Target.com, Whole Foods online), retail (specific chain locators with the store finder embedded), and international (customs limitations, retailer partners abroad). Every piece names specific retailers, links to the store locator, and includes an FAQ block covering shipping availability, subscription options, and gift card compatibility. Where-to-buy content ranks for branded discovery queries the DTC storefront otherwise loses to competitor affiliate reviews.
Subscription versus one-time comparison content
Subscription versus one-time comparison content converts subscription commitments at 3 to 6 percent because it addresses the price-sensitivity concern head-on with a specific math table. The piece covers the discount structure (15 percent lifetime), the skip-a-month mechanic, the pause-anytime rule, the cancellation policy, and the specific yearly savings for the brand’s average consumption cadence. Cross-reference the retention structure on our food and beverage marketing retainer page.
Content refresh cadence on food brand pillars
Content refresh cadence on food brand content pillars runs a rolling audit every 12 to 24 months by pillar. Recipes get refreshed every 12 months with new photography, updated schema, and any nutrition or ingredient adjustments. Ingredient comparison guides refresh every 18 months to update market data. Sourcing story pages refresh every 24 months to reflect farm partnership changes and new harvest angles. Buyer intent content refreshes every 12 months to update retailer availability and pricing.
Recipe refresh priority order
Recipe refresh priority runs by organic traffic rank. The top 20 recipes by monthly organic sessions get refreshed first (new photography, schema audit, related recipe internal links, updated nutrition). The next 40 get refreshed at 15 months. The remaining recipes get refreshed opportunistically when the ranking slips past position 15 in Google. Skipping the refresh cadence lets recipe rankings drift out of the top 3 inside 18 months as newer competitor recipes take the position.
Schema audit checklist per refresh
The schema audit checklist per refresh runs 8 items: Recipe schema completeness, aggregateRating count and accuracy, nutrition data accuracy, prepTime and cookTime match the recipe body, image URLs valid at CDN, related recipe internal links working, product card SKU URL live, and Google Search Console rich result eligibility validated. This checklist takes 20 minutes per recipe and prevents the schema drift that costs recipe rankings 20 to 40 positions quietly.
Reporting cadence for food brand content marketing
Reporting cadence on food brand content marketing runs a monthly executive report plus a quarterly business review. The monthly report ships in the first business week and covers organic sessions by pillar, top 10 ranking recipes with position trend, ingredient guide ranking movements, sourcing page performance, and organic-attributed DTC revenue. Every number carries a comparison to the prior month and a plain-language interpretation the founder reads in 7 minutes.
Metrics that matter for content marketing
Metrics that matter for food brand content marketing: organic sessions by pillar, recipe rich result impressions in Search Console, organic conversion rate to hero SKU pages, organic-attributed DTC revenue, and top 20 ranking positions by monthly organic sessions. Vanity metrics that do not matter: total pageviews without conversion context, average time on page without conversion attribution, and social share counts. The monthly report skips the vanity block entirely.
Quarterly business review structure
The quarterly business review runs 90 minutes with the founder, head of content, and SEO lead. Agenda: organic traffic trend by pillar, top 10 winning content pieces, top 10 losing content pieces (candidates for refresh or removal), competitive gap analysis against 5 named competitor brands, and next quarter’s content calendar with recipes and ingredient guides queued. According to Ahrefs content marketing research, brands running quarterly content audits outperform brands running annual audits by 40 to 70 percent on organic revenue over a 24-month window.
Internal linking discipline across food brand content
Internal linking discipline across food brand content moves authority from recipe pages toward hero SKU product pages and comparison guides. Every recipe links to the hero SKU it uses inline (once in the ingredient list, once in a bottom call-out card). Every ingredient comparison guide links to 3 to 6 recipes using the winning ingredient plus the hero SKU product page. Every sourcing story links to the 2 to 4 SKUs sourced from that specific farm or cooperative.
Anchor text strategy across recipe hubs
Anchor text on internal links varies across recipe hubs to avoid over-optimization patterns Google penalizes. Exact-match anchor (“single-origin Ethiopian coffee”) runs on 20 to 30 percent of internal links. Partial-match variations (“our Ethiopian roast”) run on 30 to 40 percent. Branded anchors (the SKU name) run on 20 to 30 percent. Generic anchors (“shop the coffee”) fill the remaining 10 to 20 percent. This ratio holds ranking without triggering the over-optimization penalty that shows up on brands that anchor-text-stuff every internal link with the same exact-match keyword. Cross-reference the linking layer on our food and beverage web design page.
Link equity from ingredient guides to SKU pages
Link equity from ingredient guides passes to SKU pages when the guide’s comparison table names the hero SKU in the winning column with a product card, and when the guide’s body links to 3 to 6 recipes that use the winning ingredient. This 3-hop path (guide to recipe to SKU) pushes authority from a high-traffic informational query down to a high-intent transactional page. According to Search Engine Land SEO coverage, informational content that internally links to transactional pages produces 2 to 4 times higher organic revenue than isolated content silos.
Wrapping up content marketing for food brands
Content marketing for food brands is the organic engine that turns a DTC snack, drink, or CPG storefront into a search-driven revenue channel. Recipe hub of 40 to 100 recipes. Ingredient comparison guides at 12 to 24 pieces. Sourcing story pages at 6 to 12 pieces. Buyer intent content at 8 to 16 pieces. Creator syndication calendar with 12 to 30 creators per quarter. Refresh cadence at 12 to 24 months by pillar. Reporting with organic sessions and organic revenue attribution.
If your DTC food brand is running paid social at 20,000 dollars monthly with a broken blog and zero recipe schema, professional content marketing for food brands pays for itself inside the first 90 days on organic traffic captured. Redefine Web ships content marketing inside our monthly retainer packages. Book a call and we will walk through the last three DTC food brands we built recipe hubs for, pillar by pillar.
Internal linking discipline across food brand content moves authority from recipe pages toward hero SKU product pages and comparison guides. Every recipe links to the hero SKU it uses inline (once in the ingredient list, once in a bottom call-out card). Every ingredient comparison guide links to 3 to 6 recipes using the winning ingredient plus the hero SKU product page. Every sourcing story links to the 2 to 4 SKUs sourced from that specific farm or cooperative.
Anchor text strategy across recipe hubs
Anchor text on internal links varies across recipe hubs to avoid over-optimization patterns Google penalizes. Exact-match anchor (“single-origin Ethiopian coffee”) runs on 20 to 30 percent of internal links. Partial-match variations (“our Ethiopian roast”) run on 30 to 40 percent. Branded anchors (the SKU name) run on 20 to 30 percent. Generic anchors (“shop the coffee”) fill the remaining 10 to 20 percent. This ratio holds ranking without triggering the over-optimization penalty that shows up on brands that anchor-text-stuff every internal link with the same exact-match keyword. Cross-reference the linking layer on our food and beverage web design page.
Link equity from ingredient guides to SKU pages
Link equity from ingredient guides passes to SKU pages when the guide’s comparison table names the hero SKU in the winning column with a product card, and when the guide’s body links to 3 to 6 recipes that use the winning ingredient. This 3-hop path (guide to recipe to SKU) pushes authority from a high-traffic informational query down to a high-intent transactional page. According to Search Engine Land SEO coverage, informational content that internally links to transactional pages produces 2 to 4 times higher organic revenue than isolated content silos.
Wrapping up content marketing for food brands
Content marketing for food brands is the organic engine that turns a DTC snack, drink, or CPG storefront into a search-driven revenue channel. Recipe hub of 40 to 100 recipes. Ingredient comparison guides at 12 to 24 pieces. Sourcing story pages at 6 to 12 pieces. Buyer intent content at 8 to 16 pieces. Creator syndication calendar with 12 to 30 creators per quarter. Refresh cadence at 12 to 24 months by pillar. Reporting with organic sessions and organic revenue attribution.
If your DTC food brand is running paid social at 20,000 dollars monthly with a broken blog and zero recipe schema, professional content marketing for food brands pays for itself inside the first 90 days on organic traffic captured. Redefine Web ships content marketing inside our monthly retainer packages. Book a call and we will walk through the last three DTC food brands we built recipe hubs for, pillar by pillar.
Content marketing for food brands starts with a recipe hub because recipe queries account for 40 to 60 percent of high-intent search volume in the food category. Every hero SKU needs 4 to 12 recipes anchored to it, each targeting a specific occasion and audience.
Skip the recipe hub and the brand loses the search real estate that pulls DTC storefront traffic month over month at zero incremental paid cost. Recipe traffic converts at 2 to 4 percent because the shopper landed with usage intent, not passive discovery, which is why food brands win on recipes.
Recipe schema and Google rich result eligibility
Every recipe page ships schema.org Recipe markup including cookTime, prepTime, recipeIngredient, recipeInstructions, nutrition, and aggregateRating. Correctly marked-up recipes qualify for Google’s recipe rich result carousel that pulls 3 to 6 times higher click-through rate than a plain blue link. The schema layer takes 15 minutes per recipe to author and 30 minutes to validate in Google Search Console. Cross-reference the recipe search stack on our food and beverage SEO page.
Recipe hub structure that scales
The recipe hub structure runs 40 to 100 recipes at maturity, organized by hero SKU (4 to 12 recipes per SKU) plus occasion tags (breakfast, weeknight dinner, meal prep, brunch, holiday). Every recipe links back to the hero SKU product page with the SKU embedded in an inline card. The hub earns internal linking value from ingredient comparison guides and the sourcing story pages, which feeds recipe ranking on Google. According to Google Search Central recipe structured data guidance, complete Recipe schema markup is required for eligibility in the recipe carousel and the ingredient search filter.
Pillar structure for food brand content marketing
The pillar structure on content marketing for food brands runs 4 content pillars concurrently: recipe hub (40 to 100 recipes), ingredient comparison guides (12 to 24 guides), sourcing story pages (6 to 12 pages), and buyer intent content (where to buy, subscription vs. one-time, gift bundle guides). Every pillar covers a distinct search intent and every pillar links back to the hero SKU product pages.
Ingredient comparison guide format
Ingredient comparison guides run 1,800 to 3,200 words comparing 2 to 4 ingredient types on 6 to 10 attributes with a comparison table, real-world use case examples, and links to the hero SKU that uses the specific ingredient. Example: organic vs. conventional oats compares nutritional profile, sourcing chain, cost, environmental impact, and taste on a 6-column table. The brand’s SKU appears in the winning column with a product card. These guides rank 3 to 8 months after publication and pull steady-state organic traffic.
Sourcing story pages that build trust
Sourcing story pages name the specific farms, cooperatives, or suppliers the brand sources from, with photos of the farms, farmer quotes, and specific harvest windows. A coffee brand’s Ethiopian farm page ranks for “single-origin Ethiopian coffee” and “Yirgacheffe coffee origin” plus 40 long-tail variations. The sourcing page pulls trust-building traffic that converts at 4 to 6 percent because the shopper landed pattern-matching on transparency and named provenance. Every sourcing page includes farmer or cooperative quotes, harvest dates, and a link back to 3 to 5 hero SKU pages that source from the named supplier.
Vejrø hospitality content case study
Vejrø Resort, a Danish private-island destination with an on-site restaurant focused on organic, locally sourced cuisine, joined us with strong social engagement and no organic-search real estate. Guests found the resort on Instagram but never in Google search for terms like “private island resort Denmark,” “farm-to-table hospitality Denmark,” or “Vejrø restaurant.” The same organic-search gap shows up on DTC food brands running paid social at 20,000 dollars monthly with a broken blog and zero recipe schema.
We built the conversion-focused website with on-site and off-site SEO tuned to the travel-niche keyword clusters, competitor analysis against comparable boutique resorts, and mobile-first design prioritizing guest discovery. Every page carried the structured data qualifying it for Google’s rich results in the hospitality category. Every internal link pushed authority toward the direct-booking conversion path.
Three months later, Vejrø hit 10,000 plus organic visitors, ranked for 200 plus first-page keywords, and pulled a 2.2 percent booking conversion rate from organic traffic. The same pattern applies to content marketing for food brands: recipe schema, ingredient comparison guides, and sourcing story pages pull organic traffic at 20 to 40 percent conversion into hero SKU pages inside 6 months when the content quality matches search intent and every page carries the right structured data markup. Vejrø also proved out the reporting discipline: every monthly report named the exact page, the exact keyword cluster, and the exact search feature (rich result, sitelinks, image pack) driving the incremental organic revenue instead of hiding behind aggregate traffic charts.
Recipe cadence and content calendar for food brands
Recipe cadence on a working food brand content calendar ships 2 to 4 new recipes per week during the first 6 months and drops to 1 per week at maturity. Each recipe takes 4 to 6 hours to produce (write, test in the kitchen, photograph, schema author, publish). At 3 recipes per week, the brand hits 78 recipes inside 6 months plus a backlog of ingredient comparison and sourcing content queued behind the recipe production line.
| Content pillar | Target volume year 1 | Production cost per piece | Refresh cadence |
|---|---|---|---|
| Recipe hub | 40 to 100 recipes | $180 to $320 | Every 12 months |
| Ingredient comparison guides | 12 to 24 guides | $450 to $780 | Every 18 months |
| Sourcing story pages | 6 to 12 pages | $680 to $1,200 | Every 24 months |
| Buyer intent content | 8 to 16 pieces | $220 to $420 | Every 12 months |
Photography as a content calendar constraint
Photography is the actual constraint on recipe cadence, not writing. Every recipe needs 6 to 12 photos: hero shot, ingredient flat lay, prep in progress, plated result, storage, and step shots for the schema markup. A working food brand batches photography 8 recipes at a time to keep the cost per recipe under 200 dollars. Skip the batching and the per-recipe cost climbs to 400 to 600 dollars, which caps recipe cadence at 1 per week and slows organic ranking timeline by 6 months.
Seasonal content calendar planning
Seasonal content calendar planning maps recipes and comparison guides to the seasonal windows they need to rank in. A Christmas cookie recipe needs to publish in September to rank by early December. A Valentine’s chocolate guide needs to publish in November to rank by early February. A back-to-school lunchbox recipe needs to publish in June to rank by late August. The 60-to-90-day ranking curve dictates the calendar.
Creator syndication inside food brand content
Creator syndication on food brand content marketing amplifies the recipe hub through Instagram Reels, TikTok, and YouTube Shorts creators paid to post their own version of the brand’s hero recipes. The creator content pulls net-new audiences into the recipe hub through the creator’s Link in Bio or Amazon Storefront tag. The syndication calendar names 12 to 30 creators per quarter with specific recipes assigned to each.
One brand we picked up had a spreadsheet titled “creator outreach 2023” with 47 rows and 3 responses. All 3 responses were auto-replies. The spreadsheet named zero recipes and offered flat rates below 100 dollars per post. Nobody posts a 30-second video for 87 dollars flat. Nobody.
Creator content commercial terms that work
Working creator content commercial terms run 350 to 1,500 dollars flat per post plus a 12 to 25 percent commission on tagged sales across a 30-day window. The commission mechanic pulls creators into follow-up posts because the incremental revenue continues past the initial fee. Mid-tier creators (30k to 150k followers) hit the sweet spot for food brand content because their engagement rate typically runs 4 to 8 percent versus 0.8 to 1.6 percent on mega-creators.
Content brief structure for creator partnerships
The content brief structure for creator partnerships runs a single page: the SKU, the specific recipe or usage occasion, 3 required brand mentions, 3 restricted claims (no health claims on non-medical SKUs), the pricing angle, the affiliate link, and 3 example videos that hit the tone. The brief avoids over-scripting because over-scripted creator content underperforms native creator voice by 40 to 60 percent on engagement rate.
Buyer intent content for food brand blogs
Buyer intent content on food brand blogs covers 8 to 16 pieces targeting explicit purchase-decision queries: “where to buy [brand],” “[brand] subscription vs. one-time,” “best [category] for [use case],” and “[brand] gift bundle.” Every buyer intent piece runs 1,400 to 2,400 words with a comparison table, product cards, and a clear conversion path to the specific SKU that matches the query intent. Buyer intent content converts at 3 to 6 percent versus 1 to 2 percent on recipe content because the shopper landed already planning to buy, not exploring a usage occasion.
Where-to-buy content structure
Where-to-buy content structure covers online (DTC storefront, Amazon, Target.com, Whole Foods online), retail (specific chain locators with the store finder embedded), and international (customs limitations, retailer partners abroad). Every piece names specific retailers, links to the store locator, and includes an FAQ block covering shipping availability, subscription options, and gift card compatibility. Where-to-buy content ranks for branded discovery queries the DTC storefront otherwise loses to competitor affiliate reviews.
Subscription versus one-time comparison content
Subscription versus one-time comparison content converts subscription commitments at 3 to 6 percent because it addresses the price-sensitivity concern head-on with a specific math table. The piece covers the discount structure (15 percent lifetime), the skip-a-month mechanic, the pause-anytime rule, the cancellation policy, and the specific yearly savings for the brand’s average consumption cadence. Cross-reference the retention structure on our food and beverage marketing retainer page.
Content refresh cadence on food brand pillars
Content refresh cadence on food brand content pillars runs a rolling audit every 12 to 24 months by pillar. Recipes get refreshed every 12 months with new photography, updated schema, and any nutrition or ingredient adjustments. Ingredient comparison guides refresh every 18 months to update market data. Sourcing story pages refresh every 24 months to reflect farm partnership changes and new harvest angles. Buyer intent content refreshes every 12 months to update retailer availability and pricing.
Recipe refresh priority order
Recipe refresh priority runs by organic traffic rank. The top 20 recipes by monthly organic sessions get refreshed first (new photography, schema audit, related recipe internal links, updated nutrition). The next 40 get refreshed at 15 months. The remaining recipes get refreshed opportunistically when the ranking slips past position 15 in Google. Skipping the refresh cadence lets recipe rankings drift out of the top 3 inside 18 months as newer competitor recipes take the position.
Schema audit checklist per refresh
The schema audit checklist per refresh runs 8 items: Recipe schema completeness, aggregateRating count and accuracy, nutrition data accuracy, prepTime and cookTime match the recipe body, image URLs valid at CDN, related recipe internal links working, product card SKU URL live, and Google Search Console rich result eligibility validated. This checklist takes 20 minutes per recipe and prevents the schema drift that costs recipe rankings 20 to 40 positions quietly.
Reporting cadence for food brand content marketing
Reporting cadence on food brand content marketing runs a monthly executive report plus a quarterly business review. The monthly report ships in the first business week and covers organic sessions by pillar, top 10 ranking recipes with position trend, ingredient guide ranking movements, sourcing page performance, and organic-attributed DTC revenue. Every number carries a comparison to the prior month and a plain-language interpretation the founder reads in 7 minutes.
Metrics that matter for content marketing
Metrics that matter for food brand content marketing: organic sessions by pillar, recipe rich result impressions in Search Console, organic conversion rate to hero SKU pages, organic-attributed DTC revenue, and top 20 ranking positions by monthly organic sessions. Vanity metrics that do not matter: total pageviews without conversion context, average time on page without conversion attribution, and social share counts. The monthly report skips the vanity block entirely.
Quarterly business review structure
The quarterly business review runs 90 minutes with the founder, head of content, and SEO lead. Agenda: organic traffic trend by pillar, top 10 winning content pieces, top 10 losing content pieces (candidates for refresh or removal), competitive gap analysis against 5 named competitor brands, and next quarter’s content calendar with recipes and ingredient guides queued. According to Ahrefs content marketing research, brands running quarterly content audits outperform brands running annual audits by 40 to 70 percent on organic revenue over a 24-month window.
Internal linking discipline across food brand content
Internal linking discipline across food brand content moves authority from recipe pages toward hero SKU product pages and comparison guides. Every recipe links to the hero SKU it uses inline (once in the ingredient list, once in a bottom call-out card). Every ingredient comparison guide links to 3 to 6 recipes using the winning ingredient plus the hero SKU product page. Every sourcing story links to the 2 to 4 SKUs sourced from that specific farm or cooperative.
Anchor text strategy across recipe hubs
Anchor text on internal links varies across recipe hubs to avoid over-optimization patterns Google penalizes. Exact-match anchor (“single-origin Ethiopian coffee”) runs on 20 to 30 percent of internal links. Partial-match variations (“our Ethiopian roast”) run on 30 to 40 percent. Branded anchors (the SKU name) run on 20 to 30 percent. Generic anchors (“shop the coffee”) fill the remaining 10 to 20 percent. This ratio holds ranking without triggering the over-optimization penalty that shows up on brands that anchor-text-stuff every internal link with the same exact-match keyword. Cross-reference the linking layer on our food and beverage web design page.
Link equity from ingredient guides to SKU pages
Link equity from ingredient guides passes to SKU pages when the guide’s comparison table names the hero SKU in the winning column with a product card, and when the guide’s body links to 3 to 6 recipes that use the winning ingredient. This 3-hop path (guide to recipe to SKU) pushes authority from a high-traffic informational query down to a high-intent transactional page. According to Search Engine Land SEO coverage, informational content that internally links to transactional pages produces 2 to 4 times higher organic revenue than isolated content silos.
Wrapping up content marketing for food brands
Content marketing for food brands is the organic engine that turns a DTC snack, drink, or CPG storefront into a search-driven revenue channel. Recipe hub of 40 to 100 recipes. Ingredient comparison guides at 12 to 24 pieces. Sourcing story pages at 6 to 12 pieces. Buyer intent content at 8 to 16 pieces. Creator syndication calendar with 12 to 30 creators per quarter. Refresh cadence at 12 to 24 months by pillar. Reporting with organic sessions and organic revenue attribution.
If your DTC food brand is running paid social at 20,000 dollars monthly with a broken blog and zero recipe schema, professional content marketing for food brands pays for itself inside the first 90 days on organic traffic captured. Redefine Web ships content marketing inside our monthly retainer packages. Book a call and we will walk through the last three DTC food brands we built recipe hubs for, pillar by pillar.
Content marketing for food brands starts with a recipe hub because recipe queries account for 40 to 60 percent of high-intent search volume in the food category. Every hero SKU needs 4 to 12 recipes anchored to it, each targeting a specific occasion and audience.
Skip the recipe hub and the brand loses the search real estate that pulls DTC storefront traffic month over month at zero incremental paid cost. Recipe traffic converts at 2 to 4 percent because the shopper landed with usage intent, not passive discovery, which is why food brands win on recipes.
Recipe schema and Google rich result eligibility
Every recipe page ships schema.org Recipe markup including cookTime, prepTime, recipeIngredient, recipeInstructions, nutrition, and aggregateRating. Correctly marked-up recipes qualify for Google’s recipe rich result carousel that pulls 3 to 6 times higher click-through rate than a plain blue link. The schema layer takes 15 minutes per recipe to author and 30 minutes to validate in Google Search Console. Cross-reference the recipe search stack on our food and beverage SEO page.
Recipe hub structure that scales
The recipe hub structure runs 40 to 100 recipes at maturity, organized by hero SKU (4 to 12 recipes per SKU) plus occasion tags (breakfast, weeknight dinner, meal prep, brunch, holiday). Every recipe links back to the hero SKU product page with the SKU embedded in an inline card. The hub earns internal linking value from ingredient comparison guides and the sourcing story pages, which feeds recipe ranking on Google. According to Google Search Central recipe structured data guidance, complete Recipe schema markup is required for eligibility in the recipe carousel and the ingredient search filter.
Pillar structure for food brand content marketing
The pillar structure on content marketing for food brands runs 4 content pillars concurrently: recipe hub (40 to 100 recipes), ingredient comparison guides (12 to 24 guides), sourcing story pages (6 to 12 pages), and buyer intent content (where to buy, subscription vs. one-time, gift bundle guides). Every pillar covers a distinct search intent and every pillar links back to the hero SKU product pages.
Ingredient comparison guide format
Ingredient comparison guides run 1,800 to 3,200 words comparing 2 to 4 ingredient types on 6 to 10 attributes with a comparison table, real-world use case examples, and links to the hero SKU that uses the specific ingredient. Example: organic vs. conventional oats compares nutritional profile, sourcing chain, cost, environmental impact, and taste on a 6-column table. The brand’s SKU appears in the winning column with a product card. These guides rank 3 to 8 months after publication and pull steady-state organic traffic.
Sourcing story pages that build trust
Sourcing story pages name the specific farms, cooperatives, or suppliers the brand sources from, with photos of the farms, farmer quotes, and specific harvest windows. A coffee brand’s Ethiopian farm page ranks for “single-origin Ethiopian coffee” and “Yirgacheffe coffee origin” plus 40 long-tail variations. The sourcing page pulls trust-building traffic that converts at 4 to 6 percent because the shopper landed pattern-matching on transparency and named provenance. Every sourcing page includes farmer or cooperative quotes, harvest dates, and a link back to 3 to 5 hero SKU pages that source from the named supplier.
Vejrø hospitality content case study
Vejrø Resort, a Danish private-island destination with an on-site restaurant focused on organic, locally sourced cuisine, joined us with strong social engagement and no organic-search real estate. Guests found the resort on Instagram but never in Google search for terms like “private island resort Denmark,” “farm-to-table hospitality Denmark,” or “Vejrø restaurant.” The same organic-search gap shows up on DTC food brands running paid social at 20,000 dollars monthly with a broken blog and zero recipe schema.
We built the conversion-focused website with on-site and off-site SEO tuned to the travel-niche keyword clusters, competitor analysis against comparable boutique resorts, and mobile-first design prioritizing guest discovery. Every page carried the structured data qualifying it for Google’s rich results in the hospitality category. Every internal link pushed authority toward the direct-booking conversion path.
Three months later, Vejrø hit 10,000 plus organic visitors, ranked for 200 plus first-page keywords, and pulled a 2.2 percent booking conversion rate from organic traffic. The same pattern applies to content marketing for food brands: recipe schema, ingredient comparison guides, and sourcing story pages pull organic traffic at 20 to 40 percent conversion into hero SKU pages inside 6 months when the content quality matches search intent and every page carries the right structured data markup. Vejrø also proved out the reporting discipline: every monthly report named the exact page, the exact keyword cluster, and the exact search feature (rich result, sitelinks, image pack) driving the incremental organic revenue instead of hiding behind aggregate traffic charts.
Recipe cadence and content calendar for food brands
Recipe cadence on a working food brand content calendar ships 2 to 4 new recipes per week during the first 6 months and drops to 1 per week at maturity. Each recipe takes 4 to 6 hours to produce (write, test in the kitchen, photograph, schema author, publish). At 3 recipes per week, the brand hits 78 recipes inside 6 months plus a backlog of ingredient comparison and sourcing content queued behind the recipe production line.
| Content pillar | Target volume year 1 | Production cost per piece | Refresh cadence |
|---|---|---|---|
| Recipe hub | 40 to 100 recipes | $180 to $320 | Every 12 months |
| Ingredient comparison guides | 12 to 24 guides | $450 to $780 | Every 18 months |
| Sourcing story pages | 6 to 12 pages | $680 to $1,200 | Every 24 months |
| Buyer intent content | 8 to 16 pieces | $220 to $420 | Every 12 months |
Photography as a content calendar constraint
Photography is the actual constraint on recipe cadence, not writing. Every recipe needs 6 to 12 photos: hero shot, ingredient flat lay, prep in progress, plated result, storage, and step shots for the schema markup. A working food brand batches photography 8 recipes at a time to keep the cost per recipe under 200 dollars. Skip the batching and the per-recipe cost climbs to 400 to 600 dollars, which caps recipe cadence at 1 per week and slows organic ranking timeline by 6 months.
Seasonal content calendar planning
Seasonal content calendar planning maps recipes and comparison guides to the seasonal windows they need to rank in. A Christmas cookie recipe needs to publish in September to rank by early December. A Valentine’s chocolate guide needs to publish in November to rank by early February. A back-to-school lunchbox recipe needs to publish in June to rank by late August. The 60-to-90-day ranking curve dictates the calendar.
Creator syndication inside food brand content
Creator syndication on food brand content marketing amplifies the recipe hub through Instagram Reels, TikTok, and YouTube Shorts creators paid to post their own version of the brand’s hero recipes. The creator content pulls net-new audiences into the recipe hub through the creator’s Link in Bio or Amazon Storefront tag. The syndication calendar names 12 to 30 creators per quarter with specific recipes assigned to each.
One brand we picked up had a spreadsheet titled “creator outreach 2023” with 47 rows and 3 responses. All 3 responses were auto-replies. The spreadsheet named zero recipes and offered flat rates below 100 dollars per post. Nobody posts a 30-second video for 87 dollars flat. Nobody.
Creator content commercial terms that work
Working creator content commercial terms run 350 to 1,500 dollars flat per post plus a 12 to 25 percent commission on tagged sales across a 30-day window. The commission mechanic pulls creators into follow-up posts because the incremental revenue continues past the initial fee. Mid-tier creators (30k to 150k followers) hit the sweet spot for food brand content because their engagement rate typically runs 4 to 8 percent versus 0.8 to 1.6 percent on mega-creators.
Content brief structure for creator partnerships
The content brief structure for creator partnerships runs a single page: the SKU, the specific recipe or usage occasion, 3 required brand mentions, 3 restricted claims (no health claims on non-medical SKUs), the pricing angle, the affiliate link, and 3 example videos that hit the tone. The brief avoids over-scripting because over-scripted creator content underperforms native creator voice by 40 to 60 percent on engagement rate.
Buyer intent content for food brand blogs
Buyer intent content on food brand blogs covers 8 to 16 pieces targeting explicit purchase-decision queries: “where to buy [brand],” “[brand] subscription vs. one-time,” “best [category] for [use case],” and “[brand] gift bundle.” Every buyer intent piece runs 1,400 to 2,400 words with a comparison table, product cards, and a clear conversion path to the specific SKU that matches the query intent. Buyer intent content converts at 3 to 6 percent versus 1 to 2 percent on recipe content because the shopper landed already planning to buy, not exploring a usage occasion.
Where-to-buy content structure
Where-to-buy content structure covers online (DTC storefront, Amazon, Target.com, Whole Foods online), retail (specific chain locators with the store finder embedded), and international (customs limitations, retailer partners abroad). Every piece names specific retailers, links to the store locator, and includes an FAQ block covering shipping availability, subscription options, and gift card compatibility. Where-to-buy content ranks for branded discovery queries the DTC storefront otherwise loses to competitor affiliate reviews.
Subscription versus one-time comparison content
Subscription versus one-time comparison content converts subscription commitments at 3 to 6 percent because it addresses the price-sensitivity concern head-on with a specific math table. The piece covers the discount structure (15 percent lifetime), the skip-a-month mechanic, the pause-anytime rule, the cancellation policy, and the specific yearly savings for the brand’s average consumption cadence. Cross-reference the retention structure on our food and beverage marketing retainer page.
Content refresh cadence on food brand pillars
Content refresh cadence on food brand content pillars runs a rolling audit every 12 to 24 months by pillar. Recipes get refreshed every 12 months with new photography, updated schema, and any nutrition or ingredient adjustments. Ingredient comparison guides refresh every 18 months to update market data. Sourcing story pages refresh every 24 months to reflect farm partnership changes and new harvest angles. Buyer intent content refreshes every 12 months to update retailer availability and pricing.
Recipe refresh priority order
Recipe refresh priority runs by organic traffic rank. The top 20 recipes by monthly organic sessions get refreshed first (new photography, schema audit, related recipe internal links, updated nutrition). The next 40 get refreshed at 15 months. The remaining recipes get refreshed opportunistically when the ranking slips past position 15 in Google. Skipping the refresh cadence lets recipe rankings drift out of the top 3 inside 18 months as newer competitor recipes take the position.
Schema audit checklist per refresh
The schema audit checklist per refresh runs 8 items: Recipe schema completeness, aggregateRating count and accuracy, nutrition data accuracy, prepTime and cookTime match the recipe body, image URLs valid at CDN, related recipe internal links working, product card SKU URL live, and Google Search Console rich result eligibility validated. This checklist takes 20 minutes per recipe and prevents the schema drift that costs recipe rankings 20 to 40 positions quietly.
Reporting cadence for food brand content marketing
Reporting cadence on food brand content marketing runs a monthly executive report plus a quarterly business review. The monthly report ships in the first business week and covers organic sessions by pillar, top 10 ranking recipes with position trend, ingredient guide ranking movements, sourcing page performance, and organic-attributed DTC revenue. Every number carries a comparison to the prior month and a plain-language interpretation the founder reads in 7 minutes.
Metrics that matter for content marketing
Metrics that matter for food brand content marketing: organic sessions by pillar, recipe rich result impressions in Search Console, organic conversion rate to hero SKU pages, organic-attributed DTC revenue, and top 20 ranking positions by monthly organic sessions. Vanity metrics that do not matter: total pageviews without conversion context, average time on page without conversion attribution, and social share counts. The monthly report skips the vanity block entirely.
Quarterly business review structure
The quarterly business review runs 90 minutes with the founder, head of content, and SEO lead. Agenda: organic traffic trend by pillar, top 10 winning content pieces, top 10 losing content pieces (candidates for refresh or removal), competitive gap analysis against 5 named competitor brands, and next quarter’s content calendar with recipes and ingredient guides queued. According to Ahrefs content marketing research, brands running quarterly content audits outperform brands running annual audits by 40 to 70 percent on organic revenue over a 24-month window.
Internal linking discipline across food brand content
Internal linking discipline across food brand content moves authority from recipe pages toward hero SKU product pages and comparison guides. Every recipe links to the hero SKU it uses inline (once in the ingredient list, once in a bottom call-out card). Every ingredient comparison guide links to 3 to 6 recipes using the winning ingredient plus the hero SKU product page. Every sourcing story links to the 2 to 4 SKUs sourced from that specific farm or cooperative.
Anchor text strategy across recipe hubs
Anchor text on internal links varies across recipe hubs to avoid over-optimization patterns Google penalizes. Exact-match anchor (“single-origin Ethiopian coffee”) runs on 20 to 30 percent of internal links. Partial-match variations (“our Ethiopian roast”) run on 30 to 40 percent. Branded anchors (the SKU name) run on 20 to 30 percent. Generic anchors (“shop the coffee”) fill the remaining 10 to 20 percent. This ratio holds ranking without triggering the over-optimization penalty that shows up on brands that anchor-text-stuff every internal link with the same exact-match keyword. Cross-reference the linking layer on our food and beverage web design page.
Link equity from ingredient guides to SKU pages
Link equity from ingredient guides passes to SKU pages when the guide’s comparison table names the hero SKU in the winning column with a product card, and when the guide’s body links to 3 to 6 recipes that use the winning ingredient. This 3-hop path (guide to recipe to SKU) pushes authority from a high-traffic informational query down to a high-intent transactional page. According to Search Engine Land SEO coverage, informational content that internally links to transactional pages produces 2 to 4 times higher organic revenue than isolated content silos.
Wrapping up content marketing for food brands
Content marketing for food brands is the organic engine that turns a DTC snack, drink, or CPG storefront into a search-driven revenue channel. Recipe hub of 40 to 100 recipes. Ingredient comparison guides at 12 to 24 pieces. Sourcing story pages at 6 to 12 pieces. Buyer intent content at 8 to 16 pieces. Creator syndication calendar with 12 to 30 creators per quarter. Refresh cadence at 12 to 24 months by pillar. Reporting with organic sessions and organic revenue attribution.
If your DTC food brand is running paid social at 20,000 dollars monthly with a broken blog and zero recipe schema, professional content marketing for food brands pays for itself inside the first 90 days on organic traffic captured. Redefine Web ships content marketing inside our monthly retainer packages. Book a call and we will walk through the last three DTC food brands we built recipe hubs for, pillar by pillar.
Anchor text on internal links varies across recipe hubs to avoid over-optimization patterns Google penalizes. Exact-match anchor (“single-origin Ethiopian coffee”) runs on 20 to 30 percent of internal links. Partial-match variations (“our Ethiopian roast”) run on 30 to 40 percent. Branded anchors (the SKU name) run on 20 to 30 percent. Generic anchors (“shop the coffee”) fill the remaining 10 to 20 percent. This ratio holds ranking without triggering the over-optimization penalty that shows up on brands that anchor-text-stuff every internal link with the same exact-match keyword. Cross-reference the linking layer on our food and beverage web design page.
Link equity from ingredient guides to SKU pages
Link equity from ingredient guides passes to SKU pages when the guide’s comparison table names the hero SKU in the winning column with a product card, and when the guide’s body links to 3 to 6 recipes that use the winning ingredient. This 3-hop path (guide to recipe to SKU) pushes authority from a high-traffic informational query down to a high-intent transactional page. According to Search Engine Land SEO coverage, informational content that internally links to transactional pages produces 2 to 4 times higher organic revenue than isolated content silos.
Wrapping up content marketing for food brands
Content marketing for food brands is the organic engine that turns a DTC snack, drink, or CPG storefront into a search-driven revenue channel. Recipe hub of 40 to 100 recipes. Ingredient comparison guides at 12 to 24 pieces. Sourcing story pages at 6 to 12 pieces. Buyer intent content at 8 to 16 pieces. Creator syndication calendar with 12 to 30 creators per quarter. Refresh cadence at 12 to 24 months by pillar. Reporting with organic sessions and organic revenue attribution.
If your DTC food brand is running paid social at 20,000 dollars monthly with a broken blog and zero recipe schema, professional content marketing for food brands pays for itself inside the first 90 days on organic traffic captured. Redefine Web ships content marketing inside our monthly retainer packages. Book a call and we will walk through the last three DTC food brands we built recipe hubs for, pillar by pillar.
Internal linking discipline across food brand content moves authority from recipe pages toward hero SKU product pages and comparison guides. Every recipe links to the hero SKU it uses inline (once in the ingredient list, once in a bottom call-out card). Every ingredient comparison guide links to 3 to 6 recipes using the winning ingredient plus the hero SKU product page. Every sourcing story links to the 2 to 4 SKUs sourced from that specific farm or cooperative.
Anchor text strategy across recipe hubs
Anchor text on internal links varies across recipe hubs to avoid over-optimization patterns Google penalizes. Exact-match anchor (“single-origin Ethiopian coffee”) runs on 20 to 30 percent of internal links. Partial-match variations (“our Ethiopian roast”) run on 30 to 40 percent. Branded anchors (the SKU name) run on 20 to 30 percent. Generic anchors (“shop the coffee”) fill the remaining 10 to 20 percent. This ratio holds ranking without triggering the over-optimization penalty that shows up on brands that anchor-text-stuff every internal link with the same exact-match keyword. Cross-reference the linking layer on our food and beverage web design page.
Link equity from ingredient guides to SKU pages
Link equity from ingredient guides passes to SKU pages when the guide’s comparison table names the hero SKU in the winning column with a product card, and when the guide’s body links to 3 to 6 recipes that use the winning ingredient. This 3-hop path (guide to recipe to SKU) pushes authority from a high-traffic informational query down to a high-intent transactional page. According to Search Engine Land SEO coverage, informational content that internally links to transactional pages produces 2 to 4 times higher organic revenue than isolated content silos.
Wrapping up content marketing for food brands
Content marketing for food brands is the organic engine that turns a DTC snack, drink, or CPG storefront into a search-driven revenue channel. Recipe hub of 40 to 100 recipes. Ingredient comparison guides at 12 to 24 pieces. Sourcing story pages at 6 to 12 pieces. Buyer intent content at 8 to 16 pieces. Creator syndication calendar with 12 to 30 creators per quarter. Refresh cadence at 12 to 24 months by pillar. Reporting with organic sessions and organic revenue attribution.
If your DTC food brand is running paid social at 20,000 dollars monthly with a broken blog and zero recipe schema, professional content marketing for food brands pays for itself inside the first 90 days on organic traffic captured. Redefine Web ships content marketing inside our monthly retainer packages. Book a call and we will walk through the last three DTC food brands we built recipe hubs for, pillar by pillar.
Content marketing for food brands starts with a recipe hub because recipe queries account for 40 to 60 percent of high-intent search volume in the food category. Every hero SKU needs 4 to 12 recipes anchored to it, each targeting a specific occasion and audience.
Skip the recipe hub and the brand loses the search real estate that pulls DTC storefront traffic month over month at zero incremental paid cost. Recipe traffic converts at 2 to 4 percent because the shopper landed with usage intent, not passive discovery, which is why food brands win on recipes.
Recipe schema and Google rich result eligibility
Every recipe page ships schema.org Recipe markup including cookTime, prepTime, recipeIngredient, recipeInstructions, nutrition, and aggregateRating. Correctly marked-up recipes qualify for Google’s recipe rich result carousel that pulls 3 to 6 times higher click-through rate than a plain blue link. The schema layer takes 15 minutes per recipe to author and 30 minutes to validate in Google Search Console. Cross-reference the recipe search stack on our food and beverage SEO page.
Recipe hub structure that scales
The recipe hub structure runs 40 to 100 recipes at maturity, organized by hero SKU (4 to 12 recipes per SKU) plus occasion tags (breakfast, weeknight dinner, meal prep, brunch, holiday). Every recipe links back to the hero SKU product page with the SKU embedded in an inline card. The hub earns internal linking value from ingredient comparison guides and the sourcing story pages, which feeds recipe ranking on Google. According to Google Search Central recipe structured data guidance, complete Recipe schema markup is required for eligibility in the recipe carousel and the ingredient search filter.
Pillar structure for food brand content marketing
The pillar structure on content marketing for food brands runs 4 content pillars concurrently: recipe hub (40 to 100 recipes), ingredient comparison guides (12 to 24 guides), sourcing story pages (6 to 12 pages), and buyer intent content (where to buy, subscription vs. one-time, gift bundle guides). Every pillar covers a distinct search intent and every pillar links back to the hero SKU product pages.
Ingredient comparison guide format
Ingredient comparison guides run 1,800 to 3,200 words comparing 2 to 4 ingredient types on 6 to 10 attributes with a comparison table, real-world use case examples, and links to the hero SKU that uses the specific ingredient. Example: organic vs. conventional oats compares nutritional profile, sourcing chain, cost, environmental impact, and taste on a 6-column table. The brand’s SKU appears in the winning column with a product card. These guides rank 3 to 8 months after publication and pull steady-state organic traffic.
Sourcing story pages that build trust
Sourcing story pages name the specific farms, cooperatives, or suppliers the brand sources from, with photos of the farms, farmer quotes, and specific harvest windows. A coffee brand’s Ethiopian farm page ranks for “single-origin Ethiopian coffee” and “Yirgacheffe coffee origin” plus 40 long-tail variations. The sourcing page pulls trust-building traffic that converts at 4 to 6 percent because the shopper landed pattern-matching on transparency and named provenance. Every sourcing page includes farmer or cooperative quotes, harvest dates, and a link back to 3 to 5 hero SKU pages that source from the named supplier.
Vejrø hospitality content case study
Vejrø Resort, a Danish private-island destination with an on-site restaurant focused on organic, locally sourced cuisine, joined us with strong social engagement and no organic-search real estate. Guests found the resort on Instagram but never in Google search for terms like “private island resort Denmark,” “farm-to-table hospitality Denmark,” or “Vejrø restaurant.” The same organic-search gap shows up on DTC food brands running paid social at 20,000 dollars monthly with a broken blog and zero recipe schema.
We built the conversion-focused website with on-site and off-site SEO tuned to the travel-niche keyword clusters, competitor analysis against comparable boutique resorts, and mobile-first design prioritizing guest discovery. Every page carried the structured data qualifying it for Google’s rich results in the hospitality category. Every internal link pushed authority toward the direct-booking conversion path.
Three months later, Vejrø hit 10,000 plus organic visitors, ranked for 200 plus first-page keywords, and pulled a 2.2 percent booking conversion rate from organic traffic. The same pattern applies to content marketing for food brands: recipe schema, ingredient comparison guides, and sourcing story pages pull organic traffic at 20 to 40 percent conversion into hero SKU pages inside 6 months when the content quality matches search intent and every page carries the right structured data markup. Vejrø also proved out the reporting discipline: every monthly report named the exact page, the exact keyword cluster, and the exact search feature (rich result, sitelinks, image pack) driving the incremental organic revenue instead of hiding behind aggregate traffic charts.
Recipe cadence and content calendar for food brands
Recipe cadence on a working food brand content calendar ships 2 to 4 new recipes per week during the first 6 months and drops to 1 per week at maturity. Each recipe takes 4 to 6 hours to produce (write, test in the kitchen, photograph, schema author, publish). At 3 recipes per week, the brand hits 78 recipes inside 6 months plus a backlog of ingredient comparison and sourcing content queued behind the recipe production line.
| Content pillar | Target volume year 1 | Production cost per piece | Refresh cadence |
|---|---|---|---|
| Recipe hub | 40 to 100 recipes | $180 to $320 | Every 12 months |
| Ingredient comparison guides | 12 to 24 guides | $450 to $780 | Every 18 months |
| Sourcing story pages | 6 to 12 pages | $680 to $1,200 | Every 24 months |
| Buyer intent content | 8 to 16 pieces | $220 to $420 | Every 12 months |
Photography as a content calendar constraint
Photography is the actual constraint on recipe cadence, not writing. Every recipe needs 6 to 12 photos: hero shot, ingredient flat lay, prep in progress, plated result, storage, and step shots for the schema markup. A working food brand batches photography 8 recipes at a time to keep the cost per recipe under 200 dollars. Skip the batching and the per-recipe cost climbs to 400 to 600 dollars, which caps recipe cadence at 1 per week and slows organic ranking timeline by 6 months.
Seasonal content calendar planning
Seasonal content calendar planning maps recipes and comparison guides to the seasonal windows they need to rank in. A Christmas cookie recipe needs to publish in September to rank by early December. A Valentine’s chocolate guide needs to publish in November to rank by early February. A back-to-school lunchbox recipe needs to publish in June to rank by late August. The 60-to-90-day ranking curve dictates the calendar.
Creator syndication inside food brand content
Creator syndication on food brand content marketing amplifies the recipe hub through Instagram Reels, TikTok, and YouTube Shorts creators paid to post their own version of the brand’s hero recipes. The creator content pulls net-new audiences into the recipe hub through the creator’s Link in Bio or Amazon Storefront tag. The syndication calendar names 12 to 30 creators per quarter with specific recipes assigned to each.
One brand we picked up had a spreadsheet titled “creator outreach 2023” with 47 rows and 3 responses. All 3 responses were auto-replies. The spreadsheet named zero recipes and offered flat rates below 100 dollars per post. Nobody posts a 30-second video for 87 dollars flat. Nobody.
Creator content commercial terms that work
Working creator content commercial terms run 350 to 1,500 dollars flat per post plus a 12 to 25 percent commission on tagged sales across a 30-day window. The commission mechanic pulls creators into follow-up posts because the incremental revenue continues past the initial fee. Mid-tier creators (30k to 150k followers) hit the sweet spot for food brand content because their engagement rate typically runs 4 to 8 percent versus 0.8 to 1.6 percent on mega-creators.
Content brief structure for creator partnerships
The content brief structure for creator partnerships runs a single page: the SKU, the specific recipe or usage occasion, 3 required brand mentions, 3 restricted claims (no health claims on non-medical SKUs), the pricing angle, the affiliate link, and 3 example videos that hit the tone. The brief avoids over-scripting because over-scripted creator content underperforms native creator voice by 40 to 60 percent on engagement rate.
Buyer intent content for food brand blogs
Buyer intent content on food brand blogs covers 8 to 16 pieces targeting explicit purchase-decision queries: “where to buy [brand],” “[brand] subscription vs. one-time,” “best [category] for [use case],” and “[brand] gift bundle.” Every buyer intent piece runs 1,400 to 2,400 words with a comparison table, product cards, and a clear conversion path to the specific SKU that matches the query intent. Buyer intent content converts at 3 to 6 percent versus 1 to 2 percent on recipe content because the shopper landed already planning to buy, not exploring a usage occasion.
Where-to-buy content structure
Where-to-buy content structure covers online (DTC storefront, Amazon, Target.com, Whole Foods online), retail (specific chain locators with the store finder embedded), and international (customs limitations, retailer partners abroad). Every piece names specific retailers, links to the store locator, and includes an FAQ block covering shipping availability, subscription options, and gift card compatibility. Where-to-buy content ranks for branded discovery queries the DTC storefront otherwise loses to competitor affiliate reviews.
Subscription versus one-time comparison content
Subscription versus one-time comparison content converts subscription commitments at 3 to 6 percent because it addresses the price-sensitivity concern head-on with a specific math table. The piece covers the discount structure (15 percent lifetime), the skip-a-month mechanic, the pause-anytime rule, the cancellation policy, and the specific yearly savings for the brand’s average consumption cadence. Cross-reference the retention structure on our food and beverage marketing retainer page.
Content refresh cadence on food brand pillars
Content refresh cadence on food brand content pillars runs a rolling audit every 12 to 24 months by pillar. Recipes get refreshed every 12 months with new photography, updated schema, and any nutrition or ingredient adjustments. Ingredient comparison guides refresh every 18 months to update market data. Sourcing story pages refresh every 24 months to reflect farm partnership changes and new harvest angles. Buyer intent content refreshes every 12 months to update retailer availability and pricing.
Recipe refresh priority order
Recipe refresh priority runs by organic traffic rank. The top 20 recipes by monthly organic sessions get refreshed first (new photography, schema audit, related recipe internal links, updated nutrition). The next 40 get refreshed at 15 months. The remaining recipes get refreshed opportunistically when the ranking slips past position 15 in Google. Skipping the refresh cadence lets recipe rankings drift out of the top 3 inside 18 months as newer competitor recipes take the position.
Schema audit checklist per refresh
The schema audit checklist per refresh runs 8 items: Recipe schema completeness, aggregateRating count and accuracy, nutrition data accuracy, prepTime and cookTime match the recipe body, image URLs valid at CDN, related recipe internal links working, product card SKU URL live, and Google Search Console rich result eligibility validated. This checklist takes 20 minutes per recipe and prevents the schema drift that costs recipe rankings 20 to 40 positions quietly.
Reporting cadence for food brand content marketing
Reporting cadence on food brand content marketing runs a monthly executive report plus a quarterly business review. The monthly report ships in the first business week and covers organic sessions by pillar, top 10 ranking recipes with position trend, ingredient guide ranking movements, sourcing page performance, and organic-attributed DTC revenue. Every number carries a comparison to the prior month and a plain-language interpretation the founder reads in 7 minutes.
Metrics that matter for content marketing
Metrics that matter for food brand content marketing: organic sessions by pillar, recipe rich result impressions in Search Console, organic conversion rate to hero SKU pages, organic-attributed DTC revenue, and top 20 ranking positions by monthly organic sessions. Vanity metrics that do not matter: total pageviews without conversion context, average time on page without conversion attribution, and social share counts. The monthly report skips the vanity block entirely.
Quarterly business review structure
The quarterly business review runs 90 minutes with the founder, head of content, and SEO lead. Agenda: organic traffic trend by pillar, top 10 winning content pieces, top 10 losing content pieces (candidates for refresh or removal), competitive gap analysis against 5 named competitor brands, and next quarter’s content calendar with recipes and ingredient guides queued. According to Ahrefs content marketing research, brands running quarterly content audits outperform brands running annual audits by 40 to 70 percent on organic revenue over a 24-month window.
Internal linking discipline across food brand content
Internal linking discipline across food brand content moves authority from recipe pages toward hero SKU product pages and comparison guides. Every recipe links to the hero SKU it uses inline (once in the ingredient list, once in a bottom call-out card). Every ingredient comparison guide links to 3 to 6 recipes using the winning ingredient plus the hero SKU product page. Every sourcing story links to the 2 to 4 SKUs sourced from that specific farm or cooperative.
Anchor text strategy across recipe hubs
Anchor text on internal links varies across recipe hubs to avoid over-optimization patterns Google penalizes. Exact-match anchor (“single-origin Ethiopian coffee”) runs on 20 to 30 percent of internal links. Partial-match variations (“our Ethiopian roast”) run on 30 to 40 percent. Branded anchors (the SKU name) run on 20 to 30 percent. Generic anchors (“shop the coffee”) fill the remaining 10 to 20 percent. This ratio holds ranking without triggering the over-optimization penalty that shows up on brands that anchor-text-stuff every internal link with the same exact-match keyword. Cross-reference the linking layer on our food and beverage web design page.
Link equity from ingredient guides to SKU pages
Link equity from ingredient guides passes to SKU pages when the guide’s comparison table names the hero SKU in the winning column with a product card, and when the guide’s body links to 3 to 6 recipes that use the winning ingredient. This 3-hop path (guide to recipe to SKU) pushes authority from a high-traffic informational query down to a high-intent transactional page. According to Search Engine Land SEO coverage, informational content that internally links to transactional pages produces 2 to 4 times higher organic revenue than isolated content silos.
Wrapping up content marketing for food brands
Content marketing for food brands is the organic engine that turns a DTC snack, drink, or CPG storefront into a search-driven revenue channel. Recipe hub of 40 to 100 recipes. Ingredient comparison guides at 12 to 24 pieces. Sourcing story pages at 6 to 12 pieces. Buyer intent content at 8 to 16 pieces. Creator syndication calendar with 12 to 30 creators per quarter. Refresh cadence at 12 to 24 months by pillar. Reporting with organic sessions and organic revenue attribution.
If your DTC food brand is running paid social at 20,000 dollars monthly with a broken blog and zero recipe schema, professional content marketing for food brands pays for itself inside the first 90 days on organic traffic captured. Redefine Web ships content marketing inside our monthly retainer packages. Book a call and we will walk through the last three DTC food brands we built recipe hubs for, pillar by pillar.
Content marketing for food brands starts with a recipe hub because recipe queries account for 40 to 60 percent of high-intent search volume in the food category. Every hero SKU needs 4 to 12 recipes anchored to it, each targeting a specific occasion and audience.
Skip the recipe hub and the brand loses the search real estate that pulls DTC storefront traffic month over month at zero incremental paid cost. Recipe traffic converts at 2 to 4 percent because the shopper landed with usage intent, not passive discovery, which is why food brands win on recipes.
Recipe schema and Google rich result eligibility
Every recipe page ships schema.org Recipe markup including cookTime, prepTime, recipeIngredient, recipeInstructions, nutrition, and aggregateRating. Correctly marked-up recipes qualify for Google’s recipe rich result carousel that pulls 3 to 6 times higher click-through rate than a plain blue link. The schema layer takes 15 minutes per recipe to author and 30 minutes to validate in Google Search Console. Cross-reference the recipe search stack on our food and beverage SEO page.
Recipe hub structure that scales
The recipe hub structure runs 40 to 100 recipes at maturity, organized by hero SKU (4 to 12 recipes per SKU) plus occasion tags (breakfast, weeknight dinner, meal prep, brunch, holiday). Every recipe links back to the hero SKU product page with the SKU embedded in an inline card. The hub earns internal linking value from ingredient comparison guides and the sourcing story pages, which feeds recipe ranking on Google. According to Google Search Central recipe structured data guidance, complete Recipe schema markup is required for eligibility in the recipe carousel and the ingredient search filter.
Pillar structure for food brand content marketing
The pillar structure on content marketing for food brands runs 4 content pillars concurrently: recipe hub (40 to 100 recipes), ingredient comparison guides (12 to 24 guides), sourcing story pages (6 to 12 pages), and buyer intent content (where to buy, subscription vs. one-time, gift bundle guides). Every pillar covers a distinct search intent and every pillar links back to the hero SKU product pages.
Ingredient comparison guide format
Ingredient comparison guides run 1,800 to 3,200 words comparing 2 to 4 ingredient types on 6 to 10 attributes with a comparison table, real-world use case examples, and links to the hero SKU that uses the specific ingredient. Example: organic vs. conventional oats compares nutritional profile, sourcing chain, cost, environmental impact, and taste on a 6-column table. The brand’s SKU appears in the winning column with a product card. These guides rank 3 to 8 months after publication and pull steady-state organic traffic.
Sourcing story pages that build trust
Sourcing story pages name the specific farms, cooperatives, or suppliers the brand sources from, with photos of the farms, farmer quotes, and specific harvest windows. A coffee brand’s Ethiopian farm page ranks for “single-origin Ethiopian coffee” and “Yirgacheffe coffee origin” plus 40 long-tail variations. The sourcing page pulls trust-building traffic that converts at 4 to 6 percent because the shopper landed pattern-matching on transparency and named provenance. Every sourcing page includes farmer or cooperative quotes, harvest dates, and a link back to 3 to 5 hero SKU pages that source from the named supplier.
Vejrø hospitality content case study
Vejrø Resort, a Danish private-island destination with an on-site restaurant focused on organic, locally sourced cuisine, joined us with strong social engagement and no organic-search real estate. Guests found the resort on Instagram but never in Google search for terms like “private island resort Denmark,” “farm-to-table hospitality Denmark,” or “Vejrø restaurant.” The same organic-search gap shows up on DTC food brands running paid social at 20,000 dollars monthly with a broken blog and zero recipe schema.
We built the conversion-focused website with on-site and off-site SEO tuned to the travel-niche keyword clusters, competitor analysis against comparable boutique resorts, and mobile-first design prioritizing guest discovery. Every page carried the structured data qualifying it for Google’s rich results in the hospitality category. Every internal link pushed authority toward the direct-booking conversion path.
Three months later, Vejrø hit 10,000 plus organic visitors, ranked for 200 plus first-page keywords, and pulled a 2.2 percent booking conversion rate from organic traffic. The same pattern applies to content marketing for food brands: recipe schema, ingredient comparison guides, and sourcing story pages pull organic traffic at 20 to 40 percent conversion into hero SKU pages inside 6 months when the content quality matches search intent and every page carries the right structured data markup. Vejrø also proved out the reporting discipline: every monthly report named the exact page, the exact keyword cluster, and the exact search feature (rich result, sitelinks, image pack) driving the incremental organic revenue instead of hiding behind aggregate traffic charts.
Recipe cadence and content calendar for food brands
Recipe cadence on a working food brand content calendar ships 2 to 4 new recipes per week during the first 6 months and drops to 1 per week at maturity. Each recipe takes 4 to 6 hours to produce (write, test in the kitchen, photograph, schema author, publish). At 3 recipes per week, the brand hits 78 recipes inside 6 months plus a backlog of ingredient comparison and sourcing content queued behind the recipe production line.
| Content pillar | Target volume year 1 | Production cost per piece | Refresh cadence |
|---|---|---|---|
| Recipe hub | 40 to 100 recipes | $180 to $320 | Every 12 months |
| Ingredient comparison guides | 12 to 24 guides | $450 to $780 | Every 18 months |
| Sourcing story pages | 6 to 12 pages | $680 to $1,200 | Every 24 months |
| Buyer intent content | 8 to 16 pieces | $220 to $420 | Every 12 months |
Photography as a content calendar constraint
Photography is the actual constraint on recipe cadence, not writing. Every recipe needs 6 to 12 photos: hero shot, ingredient flat lay, prep in progress, plated result, storage, and step shots for the schema markup. A working food brand batches photography 8 recipes at a time to keep the cost per recipe under 200 dollars. Skip the batching and the per-recipe cost climbs to 400 to 600 dollars, which caps recipe cadence at 1 per week and slows organic ranking timeline by 6 months.
Seasonal content calendar planning
Seasonal content calendar planning maps recipes and comparison guides to the seasonal windows they need to rank in. A Christmas cookie recipe needs to publish in September to rank by early December. A Valentine’s chocolate guide needs to publish in November to rank by early February. A back-to-school lunchbox recipe needs to publish in June to rank by late August. The 60-to-90-day ranking curve dictates the calendar.
Creator syndication inside food brand content
Creator syndication on food brand content marketing amplifies the recipe hub through Instagram Reels, TikTok, and YouTube Shorts creators paid to post their own version of the brand’s hero recipes. The creator content pulls net-new audiences into the recipe hub through the creator’s Link in Bio or Amazon Storefront tag. The syndication calendar names 12 to 30 creators per quarter with specific recipes assigned to each.
One brand we picked up had a spreadsheet titled “creator outreach 2023” with 47 rows and 3 responses. All 3 responses were auto-replies. The spreadsheet named zero recipes and offered flat rates below 100 dollars per post. Nobody posts a 30-second video for 87 dollars flat. Nobody.
Creator content commercial terms that work
Working creator content commercial terms run 350 to 1,500 dollars flat per post plus a 12 to 25 percent commission on tagged sales across a 30-day window. The commission mechanic pulls creators into follow-up posts because the incremental revenue continues past the initial fee. Mid-tier creators (30k to 150k followers) hit the sweet spot for food brand content because their engagement rate typically runs 4 to 8 percent versus 0.8 to 1.6 percent on mega-creators.
Content brief structure for creator partnerships
The content brief structure for creator partnerships runs a single page: the SKU, the specific recipe or usage occasion, 3 required brand mentions, 3 restricted claims (no health claims on non-medical SKUs), the pricing angle, the affiliate link, and 3 example videos that hit the tone. The brief avoids over-scripting because over-scripted creator content underperforms native creator voice by 40 to 60 percent on engagement rate.
Buyer intent content for food brand blogs
Buyer intent content on food brand blogs covers 8 to 16 pieces targeting explicit purchase-decision queries: “where to buy [brand],” “[brand] subscription vs. one-time,” “best [category] for [use case],” and “[brand] gift bundle.” Every buyer intent piece runs 1,400 to 2,400 words with a comparison table, product cards, and a clear conversion path to the specific SKU that matches the query intent. Buyer intent content converts at 3 to 6 percent versus 1 to 2 percent on recipe content because the shopper landed already planning to buy, not exploring a usage occasion.
Where-to-buy content structure
Where-to-buy content structure covers online (DTC storefront, Amazon, Target.com, Whole Foods online), retail (specific chain locators with the store finder embedded), and international (customs limitations, retailer partners abroad). Every piece names specific retailers, links to the store locator, and includes an FAQ block covering shipping availability, subscription options, and gift card compatibility. Where-to-buy content ranks for branded discovery queries the DTC storefront otherwise loses to competitor affiliate reviews.
Subscription versus one-time comparison content
Subscription versus one-time comparison content converts subscription commitments at 3 to 6 percent because it addresses the price-sensitivity concern head-on with a specific math table. The piece covers the discount structure (15 percent lifetime), the skip-a-month mechanic, the pause-anytime rule, the cancellation policy, and the specific yearly savings for the brand’s average consumption cadence. Cross-reference the retention structure on our food and beverage marketing retainer page.
Content refresh cadence on food brand pillars
Content refresh cadence on food brand content pillars runs a rolling audit every 12 to 24 months by pillar. Recipes get refreshed every 12 months with new photography, updated schema, and any nutrition or ingredient adjustments. Ingredient comparison guides refresh every 18 months to update market data. Sourcing story pages refresh every 24 months to reflect farm partnership changes and new harvest angles. Buyer intent content refreshes every 12 months to update retailer availability and pricing.
Recipe refresh priority order
Recipe refresh priority runs by organic traffic rank. The top 20 recipes by monthly organic sessions get refreshed first (new photography, schema audit, related recipe internal links, updated nutrition). The next 40 get refreshed at 15 months. The remaining recipes get refreshed opportunistically when the ranking slips past position 15 in Google. Skipping the refresh cadence lets recipe rankings drift out of the top 3 inside 18 months as newer competitor recipes take the position.
Schema audit checklist per refresh
The schema audit checklist per refresh runs 8 items: Recipe schema completeness, aggregateRating count and accuracy, nutrition data accuracy, prepTime and cookTime match the recipe body, image URLs valid at CDN, related recipe internal links working, product card SKU URL live, and Google Search Console rich result eligibility validated. This checklist takes 20 minutes per recipe and prevents the schema drift that costs recipe rankings 20 to 40 positions quietly.
Reporting cadence for food brand content marketing
Reporting cadence on food brand content marketing runs a monthly executive report plus a quarterly business review. The monthly report ships in the first business week and covers organic sessions by pillar, top 10 ranking recipes with position trend, ingredient guide ranking movements, sourcing page performance, and organic-attributed DTC revenue. Every number carries a comparison to the prior month and a plain-language interpretation the founder reads in 7 minutes.
Metrics that matter for content marketing
Metrics that matter for food brand content marketing: organic sessions by pillar, recipe rich result impressions in Search Console, organic conversion rate to hero SKU pages, organic-attributed DTC revenue, and top 20 ranking positions by monthly organic sessions. Vanity metrics that do not matter: total pageviews without conversion context, average time on page without conversion attribution, and social share counts. The monthly report skips the vanity block entirely.
Quarterly business review structure
The quarterly business review runs 90 minutes with the founder, head of content, and SEO lead. Agenda: organic traffic trend by pillar, top 10 winning content pieces, top 10 losing content pieces (candidates for refresh or removal), competitive gap analysis against 5 named competitor brands, and next quarter’s content calendar with recipes and ingredient guides queued. According to Ahrefs content marketing research, brands running quarterly content audits outperform brands running annual audits by 40 to 70 percent on organic revenue over a 24-month window.
Internal linking discipline across food brand content
Internal linking discipline across food brand content moves authority from recipe pages toward hero SKU product pages and comparison guides. Every recipe links to the hero SKU it uses inline (once in the ingredient list, once in a bottom call-out card). Every ingredient comparison guide links to 3 to 6 recipes using the winning ingredient plus the hero SKU product page. Every sourcing story links to the 2 to 4 SKUs sourced from that specific farm or cooperative.
Anchor text strategy across recipe hubs
Anchor text on internal links varies across recipe hubs to avoid over-optimization patterns Google penalizes. Exact-match anchor (“single-origin Ethiopian coffee”) runs on 20 to 30 percent of internal links. Partial-match variations (“our Ethiopian roast”) run on 30 to 40 percent. Branded anchors (the SKU name) run on 20 to 30 percent. Generic anchors (“shop the coffee”) fill the remaining 10 to 20 percent. This ratio holds ranking without triggering the over-optimization penalty that shows up on brands that anchor-text-stuff every internal link with the same exact-match keyword. Cross-reference the linking layer on our food and beverage web design page.
Link equity from ingredient guides to SKU pages
Link equity from ingredient guides passes to SKU pages when the guide’s comparison table names the hero SKU in the winning column with a product card, and when the guide’s body links to 3 to 6 recipes that use the winning ingredient. This 3-hop path (guide to recipe to SKU) pushes authority from a high-traffic informational query down to a high-intent transactional page. According to Search Engine Land SEO coverage, informational content that internally links to transactional pages produces 2 to 4 times higher organic revenue than isolated content silos.
Wrapping up content marketing for food brands
Content marketing for food brands is the organic engine that turns a DTC snack, drink, or CPG storefront into a search-driven revenue channel. Recipe hub of 40 to 100 recipes. Ingredient comparison guides at 12 to 24 pieces. Sourcing story pages at 6 to 12 pieces. Buyer intent content at 8 to 16 pieces. Creator syndication calendar with 12 to 30 creators per quarter. Refresh cadence at 12 to 24 months by pillar. Reporting with organic sessions and organic revenue attribution.
If your DTC food brand is running paid social at 20,000 dollars monthly with a broken blog and zero recipe schema, professional content marketing for food brands pays for itself inside the first 90 days on organic traffic captured. Redefine Web ships content marketing inside our monthly retainer packages. Book a call and we will walk through the last three DTC food brands we built recipe hubs for, pillar by pillar.
Internal linking discipline across food brand content moves authority from recipe pages toward hero SKU product pages and comparison guides. Every recipe links to the hero SKU it uses inline (once in the ingredient list, once in a bottom call-out card). Every ingredient comparison guide links to 3 to 6 recipes using the winning ingredient plus the hero SKU product page. Every sourcing story links to the 2 to 4 SKUs sourced from that specific farm or cooperative.
Anchor text strategy across recipe hubs
Anchor text on internal links varies across recipe hubs to avoid over-optimization patterns Google penalizes. Exact-match anchor (“single-origin Ethiopian coffee”) runs on 20 to 30 percent of internal links. Partial-match variations (“our Ethiopian roast”) run on 30 to 40 percent. Branded anchors (the SKU name) run on 20 to 30 percent. Generic anchors (“shop the coffee”) fill the remaining 10 to 20 percent. This ratio holds ranking without triggering the over-optimization penalty that shows up on brands that anchor-text-stuff every internal link with the same exact-match keyword. Cross-reference the linking layer on our food and beverage web design page.
Link equity from ingredient guides to SKU pages
Link equity from ingredient guides passes to SKU pages when the guide’s comparison table names the hero SKU in the winning column with a product card, and when the guide’s body links to 3 to 6 recipes that use the winning ingredient. This 3-hop path (guide to recipe to SKU) pushes authority from a high-traffic informational query down to a high-intent transactional page. According to Search Engine Land SEO coverage, informational content that internally links to transactional pages produces 2 to 4 times higher organic revenue than isolated content silos.
Wrapping up content marketing for food brands
Content marketing for food brands is the organic engine that turns a DTC snack, drink, or CPG storefront into a search-driven revenue channel. Recipe hub of 40 to 100 recipes. Ingredient comparison guides at 12 to 24 pieces. Sourcing story pages at 6 to 12 pieces. Buyer intent content at 8 to 16 pieces. Creator syndication calendar with 12 to 30 creators per quarter. Refresh cadence at 12 to 24 months by pillar. Reporting with organic sessions and organic revenue attribution.
If your DTC food brand is running paid social at 20,000 dollars monthly with a broken blog and zero recipe schema, professional content marketing for food brands pays for itself inside the first 90 days on organic traffic captured. Redefine Web ships content marketing inside our monthly retainer packages. Book a call and we will walk through the last three DTC food brands we built recipe hubs for, pillar by pillar.
Content marketing for food brands starts with a recipe hub because recipe queries account for 40 to 60 percent of high-intent search volume in the food category. Every hero SKU needs 4 to 12 recipes anchored to it, each targeting a specific occasion and audience.
Skip the recipe hub and the brand loses the search real estate that pulls DTC storefront traffic month over month at zero incremental paid cost. Recipe traffic converts at 2 to 4 percent because the shopper landed with usage intent, not passive discovery, which is why food brands win on recipes.
Recipe schema and Google rich result eligibility
Every recipe page ships schema.org Recipe markup including cookTime, prepTime, recipeIngredient, recipeInstructions, nutrition, and aggregateRating. Correctly marked-up recipes qualify for Google’s recipe rich result carousel that pulls 3 to 6 times higher click-through rate than a plain blue link. The schema layer takes 15 minutes per recipe to author and 30 minutes to validate in Google Search Console. Cross-reference the recipe search stack on our food and beverage SEO page.
Recipe hub structure that scales
The recipe hub structure runs 40 to 100 recipes at maturity, organized by hero SKU (4 to 12 recipes per SKU) plus occasion tags (breakfast, weeknight dinner, meal prep, brunch, holiday). Every recipe links back to the hero SKU product page with the SKU embedded in an inline card. The hub earns internal linking value from ingredient comparison guides and the sourcing story pages, which feeds recipe ranking on Google. According to Google Search Central recipe structured data guidance, complete Recipe schema markup is required for eligibility in the recipe carousel and the ingredient search filter.
Pillar structure for food brand content marketing
The pillar structure on content marketing for food brands runs 4 content pillars concurrently: recipe hub (40 to 100 recipes), ingredient comparison guides (12 to 24 guides), sourcing story pages (6 to 12 pages), and buyer intent content (where to buy, subscription vs. one-time, gift bundle guides). Every pillar covers a distinct search intent and every pillar links back to the hero SKU product pages.
Ingredient comparison guide format
Ingredient comparison guides run 1,800 to 3,200 words comparing 2 to 4 ingredient types on 6 to 10 attributes with a comparison table, real-world use case examples, and links to the hero SKU that uses the specific ingredient. Example: organic vs. conventional oats compares nutritional profile, sourcing chain, cost, environmental impact, and taste on a 6-column table. The brand’s SKU appears in the winning column with a product card. These guides rank 3 to 8 months after publication and pull steady-state organic traffic.
Sourcing story pages that build trust
Sourcing story pages name the specific farms, cooperatives, or suppliers the brand sources from, with photos of the farms, farmer quotes, and specific harvest windows. A coffee brand’s Ethiopian farm page ranks for “single-origin Ethiopian coffee” and “Yirgacheffe coffee origin” plus 40 long-tail variations. The sourcing page pulls trust-building traffic that converts at 4 to 6 percent because the shopper landed pattern-matching on transparency and named provenance. Every sourcing page includes farmer or cooperative quotes, harvest dates, and a link back to 3 to 5 hero SKU pages that source from the named supplier.
Vejrø hospitality content case study
Vejrø Resort, a Danish private-island destination with an on-site restaurant focused on organic, locally sourced cuisine, joined us with strong social engagement and no organic-search real estate. Guests found the resort on Instagram but never in Google search for terms like “private island resort Denmark,” “farm-to-table hospitality Denmark,” or “Vejrø restaurant.” The same organic-search gap shows up on DTC food brands running paid social at 20,000 dollars monthly with a broken blog and zero recipe schema.
We built the conversion-focused website with on-site and off-site SEO tuned to the travel-niche keyword clusters, competitor analysis against comparable boutique resorts, and mobile-first design prioritizing guest discovery. Every page carried the structured data qualifying it for Google’s rich results in the hospitality category. Every internal link pushed authority toward the direct-booking conversion path.
Three months later, Vejrø hit 10,000 plus organic visitors, ranked for 200 plus first-page keywords, and pulled a 2.2 percent booking conversion rate from organic traffic. The same pattern applies to content marketing for food brands: recipe schema, ingredient comparison guides, and sourcing story pages pull organic traffic at 20 to 40 percent conversion into hero SKU pages inside 6 months when the content quality matches search intent and every page carries the right structured data markup. Vejrø also proved out the reporting discipline: every monthly report named the exact page, the exact keyword cluster, and the exact search feature (rich result, sitelinks, image pack) driving the incremental organic revenue instead of hiding behind aggregate traffic charts.
Recipe cadence and content calendar for food brands
Recipe cadence on a working food brand content calendar ships 2 to 4 new recipes per week during the first 6 months and drops to 1 per week at maturity. Each recipe takes 4 to 6 hours to produce (write, test in the kitchen, photograph, schema author, publish). At 3 recipes per week, the brand hits 78 recipes inside 6 months plus a backlog of ingredient comparison and sourcing content queued behind the recipe production line.
| Content pillar | Target volume year 1 | Production cost per piece | Refresh cadence |
|---|---|---|---|
| Recipe hub | 40 to 100 recipes | $180 to $320 | Every 12 months |
| Ingredient comparison guides | 12 to 24 guides | $450 to $780 | Every 18 months |
| Sourcing story pages | 6 to 12 pages | $680 to $1,200 | Every 24 months |
| Buyer intent content | 8 to 16 pieces | $220 to $420 | Every 12 months |
Photography as a content calendar constraint
Photography is the actual constraint on recipe cadence, not writing. Every recipe needs 6 to 12 photos: hero shot, ingredient flat lay, prep in progress, plated result, storage, and step shots for the schema markup. A working food brand batches photography 8 recipes at a time to keep the cost per recipe under 200 dollars. Skip the batching and the per-recipe cost climbs to 400 to 600 dollars, which caps recipe cadence at 1 per week and slows organic ranking timeline by 6 months.
Seasonal content calendar planning
Seasonal content calendar planning maps recipes and comparison guides to the seasonal windows they need to rank in. A Christmas cookie recipe needs to publish in September to rank by early December. A Valentine’s chocolate guide needs to publish in November to rank by early February. A back-to-school lunchbox recipe needs to publish in June to rank by late August. The 60-to-90-day ranking curve dictates the calendar.
Creator syndication inside food brand content
Creator syndication on food brand content marketing amplifies the recipe hub through Instagram Reels, TikTok, and YouTube Shorts creators paid to post their own version of the brand’s hero recipes. The creator content pulls net-new audiences into the recipe hub through the creator’s Link in Bio or Amazon Storefront tag. The syndication calendar names 12 to 30 creators per quarter with specific recipes assigned to each.
One brand we picked up had a spreadsheet titled “creator outreach 2023” with 47 rows and 3 responses. All 3 responses were auto-replies. The spreadsheet named zero recipes and offered flat rates below 100 dollars per post. Nobody posts a 30-second video for 87 dollars flat. Nobody.
Creator content commercial terms that work
Working creator content commercial terms run 350 to 1,500 dollars flat per post plus a 12 to 25 percent commission on tagged sales across a 30-day window. The commission mechanic pulls creators into follow-up posts because the incremental revenue continues past the initial fee. Mid-tier creators (30k to 150k followers) hit the sweet spot for food brand content because their engagement rate typically runs 4 to 8 percent versus 0.8 to 1.6 percent on mega-creators.
Content brief structure for creator partnerships
The content brief structure for creator partnerships runs a single page: the SKU, the specific recipe or usage occasion, 3 required brand mentions, 3 restricted claims (no health claims on non-medical SKUs), the pricing angle, the affiliate link, and 3 example videos that hit the tone. The brief avoids over-scripting because over-scripted creator content underperforms native creator voice by 40 to 60 percent on engagement rate.
Buyer intent content for food brand blogs
Buyer intent content on food brand blogs covers 8 to 16 pieces targeting explicit purchase-decision queries: “where to buy [brand],” “[brand] subscription vs. one-time,” “best [category] for [use case],” and “[brand] gift bundle.” Every buyer intent piece runs 1,400 to 2,400 words with a comparison table, product cards, and a clear conversion path to the specific SKU that matches the query intent. Buyer intent content converts at 3 to 6 percent versus 1 to 2 percent on recipe content because the shopper landed already planning to buy, not exploring a usage occasion.
Where-to-buy content structure
Where-to-buy content structure covers online (DTC storefront, Amazon, Target.com, Whole Foods online), retail (specific chain locators with the store finder embedded), and international (customs limitations, retailer partners abroad). Every piece names specific retailers, links to the store locator, and includes an FAQ block covering shipping availability, subscription options, and gift card compatibility. Where-to-buy content ranks for branded discovery queries the DTC storefront otherwise loses to competitor affiliate reviews.
Subscription versus one-time comparison content
Subscription versus one-time comparison content converts subscription commitments at 3 to 6 percent because it addresses the price-sensitivity concern head-on with a specific math table. The piece covers the discount structure (15 percent lifetime), the skip-a-month mechanic, the pause-anytime rule, the cancellation policy, and the specific yearly savings for the brand’s average consumption cadence. Cross-reference the retention structure on our food and beverage marketing retainer page.
Content refresh cadence on food brand pillars
Content refresh cadence on food brand content pillars runs a rolling audit every 12 to 24 months by pillar. Recipes get refreshed every 12 months with new photography, updated schema, and any nutrition or ingredient adjustments. Ingredient comparison guides refresh every 18 months to update market data. Sourcing story pages refresh every 24 months to reflect farm partnership changes and new harvest angles. Buyer intent content refreshes every 12 months to update retailer availability and pricing.
Recipe refresh priority order
Recipe refresh priority runs by organic traffic rank. The top 20 recipes by monthly organic sessions get refreshed first (new photography, schema audit, related recipe internal links, updated nutrition). The next 40 get refreshed at 15 months. The remaining recipes get refreshed opportunistically when the ranking slips past position 15 in Google. Skipping the refresh cadence lets recipe rankings drift out of the top 3 inside 18 months as newer competitor recipes take the position.
Schema audit checklist per refresh
The schema audit checklist per refresh runs 8 items: Recipe schema completeness, aggregateRating count and accuracy, nutrition data accuracy, prepTime and cookTime match the recipe body, image URLs valid at CDN, related recipe internal links working, product card SKU URL live, and Google Search Console rich result eligibility validated. This checklist takes 20 minutes per recipe and prevents the schema drift that costs recipe rankings 20 to 40 positions quietly.
Reporting cadence for food brand content marketing
Reporting cadence on food brand content marketing runs a monthly executive report plus a quarterly business review. The monthly report ships in the first business week and covers organic sessions by pillar, top 10 ranking recipes with position trend, ingredient guide ranking movements, sourcing page performance, and organic-attributed DTC revenue. Every number carries a comparison to the prior month and a plain-language interpretation the founder reads in 7 minutes.
Metrics that matter for content marketing
Metrics that matter for food brand content marketing: organic sessions by pillar, recipe rich result impressions in Search Console, organic conversion rate to hero SKU pages, organic-attributed DTC revenue, and top 20 ranking positions by monthly organic sessions. Vanity metrics that do not matter: total pageviews without conversion context, average time on page without conversion attribution, and social share counts. The monthly report skips the vanity block entirely.
Quarterly business review structure
The quarterly business review runs 90 minutes with the founder, head of content, and SEO lead. Agenda: organic traffic trend by pillar, top 10 winning content pieces, top 10 losing content pieces (candidates for refresh or removal), competitive gap analysis against 5 named competitor brands, and next quarter’s content calendar with recipes and ingredient guides queued. According to Ahrefs content marketing research, brands running quarterly content audits outperform brands running annual audits by 40 to 70 percent on organic revenue over a 24-month window.
Internal linking discipline across food brand content
Internal linking discipline across food brand content moves authority from recipe pages toward hero SKU product pages and comparison guides. Every recipe links to the hero SKU it uses inline (once in the ingredient list, once in a bottom call-out card). Every ingredient comparison guide links to 3 to 6 recipes using the winning ingredient plus the hero SKU product page. Every sourcing story links to the 2 to 4 SKUs sourced from that specific farm or cooperative.
Anchor text strategy across recipe hubs
Anchor text on internal links varies across recipe hubs to avoid over-optimization patterns Google penalizes. Exact-match anchor (“single-origin Ethiopian coffee”) runs on 20 to 30 percent of internal links. Partial-match variations (“our Ethiopian roast”) run on 30 to 40 percent. Branded anchors (the SKU name) run on 20 to 30 percent. Generic anchors (“shop the coffee”) fill the remaining 10 to 20 percent. This ratio holds ranking without triggering the over-optimization penalty that shows up on brands that anchor-text-stuff every internal link with the same exact-match keyword. Cross-reference the linking layer on our food and beverage web design page.
Link equity from ingredient guides to SKU pages
Link equity from ingredient guides passes to SKU pages when the guide’s comparison table names the hero SKU in the winning column with a product card, and when the guide’s body links to 3 to 6 recipes that use the winning ingredient. This 3-hop path (guide to recipe to SKU) pushes authority from a high-traffic informational query down to a high-intent transactional page. According to Search Engine Land SEO coverage, informational content that internally links to transactional pages produces 2 to 4 times higher organic revenue than isolated content silos.
Wrapping up content marketing for food brands
Content marketing for food brands is the organic engine that turns a DTC snack, drink, or CPG storefront into a search-driven revenue channel. Recipe hub of 40 to 100 recipes. Ingredient comparison guides at 12 to 24 pieces. Sourcing story pages at 6 to 12 pieces. Buyer intent content at 8 to 16 pieces. Creator syndication calendar with 12 to 30 creators per quarter. Refresh cadence at 12 to 24 months by pillar. Reporting with organic sessions and organic revenue attribution.
If your DTC food brand is running paid social at 20,000 dollars monthly with a broken blog and zero recipe schema, professional content marketing for food brands pays for itself inside the first 90 days on organic traffic captured. Redefine Web ships content marketing inside our monthly retainer packages. Book a call and we will walk through the last three DTC food brands we built recipe hubs for, pillar by pillar.
Anchor text on internal links varies across recipe hubs to avoid over-optimization patterns Google penalizes. Exact-match anchor (“single-origin Ethiopian coffee”) runs on 20 to 30 percent of internal links. Partial-match variations (“our Ethiopian roast”) run on 30 to 40 percent. Branded anchors (the SKU name) run on 20 to 30 percent. Generic anchors (“shop the coffee”) fill the remaining 10 to 20 percent. This ratio holds ranking without triggering the over-optimization penalty that shows up on brands that anchor-text-stuff every internal link with the same exact-match keyword. Cross-reference the linking layer on our food and beverage web design page.
Link equity from ingredient guides to SKU pages
Link equity from ingredient guides passes to SKU pages when the guide’s comparison table names the hero SKU in the winning column with a product card, and when the guide’s body links to 3 to 6 recipes that use the winning ingredient. This 3-hop path (guide to recipe to SKU) pushes authority from a high-traffic informational query down to a high-intent transactional page. According to Search Engine Land SEO coverage, informational content that internally links to transactional pages produces 2 to 4 times higher organic revenue than isolated content silos.
Wrapping up content marketing for food brands
Content marketing for food brands is the organic engine that turns a DTC snack, drink, or CPG storefront into a search-driven revenue channel. Recipe hub of 40 to 100 recipes. Ingredient comparison guides at 12 to 24 pieces. Sourcing story pages at 6 to 12 pieces. Buyer intent content at 8 to 16 pieces. Creator syndication calendar with 12 to 30 creators per quarter. Refresh cadence at 12 to 24 months by pillar. Reporting with organic sessions and organic revenue attribution.
If your DTC food brand is running paid social at 20,000 dollars monthly with a broken blog and zero recipe schema, professional content marketing for food brands pays for itself inside the first 90 days on organic traffic captured. Redefine Web ships content marketing inside our monthly retainer packages. Book a call and we will walk through the last three DTC food brands we built recipe hubs for, pillar by pillar.
Content marketing for food brands starts with a recipe hub because recipe queries account for 40 to 60 percent of high-intent search volume in the food category. Every hero SKU needs 4 to 12 recipes anchored to it, each targeting a specific occasion and audience.
Skip the recipe hub and the brand loses the search real estate that pulls DTC storefront traffic month over month at zero incremental paid cost. Recipe traffic converts at 2 to 4 percent because the shopper landed with usage intent, not passive discovery, which is why food brands win on recipes.
Recipe schema and Google rich result eligibility
Every recipe page ships schema.org Recipe markup including cookTime, prepTime, recipeIngredient, recipeInstructions, nutrition, and aggregateRating. Correctly marked-up recipes qualify for Google’s recipe rich result carousel that pulls 3 to 6 times higher click-through rate than a plain blue link. The schema layer takes 15 minutes per recipe to author and 30 minutes to validate in Google Search Console. Cross-reference the recipe search stack on our food and beverage SEO page.
Recipe hub structure that scales
The recipe hub structure runs 40 to 100 recipes at maturity, organized by hero SKU (4 to 12 recipes per SKU) plus occasion tags (breakfast, weeknight dinner, meal prep, brunch, holiday). Every recipe links back to the hero SKU product page with the SKU embedded in an inline card. The hub earns internal linking value from ingredient comparison guides and the sourcing story pages, which feeds recipe ranking on Google. According to Google Search Central recipe structured data guidance, complete Recipe schema markup is required for eligibility in the recipe carousel and the ingredient search filter.
Pillar structure for food brand content marketing
The pillar structure on content marketing for food brands runs 4 content pillars concurrently: recipe hub (40 to 100 recipes), ingredient comparison guides (12 to 24 guides), sourcing story pages (6 to 12 pages), and buyer intent content (where to buy, subscription vs. one-time, gift bundle guides). Every pillar covers a distinct search intent and every pillar links back to the hero SKU product pages.
Ingredient comparison guide format
Ingredient comparison guides run 1,800 to 3,200 words comparing 2 to 4 ingredient types on 6 to 10 attributes with a comparison table, real-world use case examples, and links to the hero SKU that uses the specific ingredient. Example: organic vs. conventional oats compares nutritional profile, sourcing chain, cost, environmental impact, and taste on a 6-column table. The brand’s SKU appears in the winning column with a product card. These guides rank 3 to 8 months after publication and pull steady-state organic traffic.
Sourcing story pages that build trust
Sourcing story pages name the specific farms, cooperatives, or suppliers the brand sources from, with photos of the farms, farmer quotes, and specific harvest windows. A coffee brand’s Ethiopian farm page ranks for “single-origin Ethiopian coffee” and “Yirgacheffe coffee origin” plus 40 long-tail variations. The sourcing page pulls trust-building traffic that converts at 4 to 6 percent because the shopper landed pattern-matching on transparency and named provenance. Every sourcing page includes farmer or cooperative quotes, harvest dates, and a link back to 3 to 5 hero SKU pages that source from the named supplier.
Vejrø hospitality content case study
Vejrø Resort, a Danish private-island destination with an on-site restaurant focused on organic, locally sourced cuisine, joined us with strong social engagement and no organic-search real estate. Guests found the resort on Instagram but never in Google search for terms like “private island resort Denmark,” “farm-to-table hospitality Denmark,” or “Vejrø restaurant.” The same organic-search gap shows up on DTC food brands running paid social at 20,000 dollars monthly with a broken blog and zero recipe schema.
We built the conversion-focused website with on-site and off-site SEO tuned to the travel-niche keyword clusters, competitor analysis against comparable boutique resorts, and mobile-first design prioritizing guest discovery. Every page carried the structured data qualifying it for Google’s rich results in the hospitality category. Every internal link pushed authority toward the direct-booking conversion path.
Three months later, Vejrø hit 10,000 plus organic visitors, ranked for 200 plus first-page keywords, and pulled a 2.2 percent booking conversion rate from organic traffic. The same pattern applies to content marketing for food brands: recipe schema, ingredient comparison guides, and sourcing story pages pull organic traffic at 20 to 40 percent conversion into hero SKU pages inside 6 months when the content quality matches search intent and every page carries the right structured data markup. Vejrø also proved out the reporting discipline: every monthly report named the exact page, the exact keyword cluster, and the exact search feature (rich result, sitelinks, image pack) driving the incremental organic revenue instead of hiding behind aggregate traffic charts.
Recipe cadence and content calendar for food brands
Recipe cadence on a working food brand content calendar ships 2 to 4 new recipes per week during the first 6 months and drops to 1 per week at maturity. Each recipe takes 4 to 6 hours to produce (write, test in the kitchen, photograph, schema author, publish). At 3 recipes per week, the brand hits 78 recipes inside 6 months plus a backlog of ingredient comparison and sourcing content queued behind the recipe production line.
| Content pillar | Target volume year 1 | Production cost per piece | Refresh cadence |
|---|---|---|---|
| Recipe hub | 40 to 100 recipes | $180 to $320 | Every 12 months |
| Ingredient comparison guides | 12 to 24 guides | $450 to $780 | Every 18 months |
| Sourcing story pages | 6 to 12 pages | $680 to $1,200 | Every 24 months |
| Buyer intent content | 8 to 16 pieces | $220 to $420 | Every 12 months |
Photography as a content calendar constraint
Photography is the actual constraint on recipe cadence, not writing. Every recipe needs 6 to 12 photos: hero shot, ingredient flat lay, prep in progress, plated result, storage, and step shots for the schema markup. A working food brand batches photography 8 recipes at a time to keep the cost per recipe under 200 dollars. Skip the batching and the per-recipe cost climbs to 400 to 600 dollars, which caps recipe cadence at 1 per week and slows organic ranking timeline by 6 months.
Seasonal content calendar planning
Seasonal content calendar planning maps recipes and comparison guides to the seasonal windows they need to rank in. A Christmas cookie recipe needs to publish in September to rank by early December. A Valentine’s chocolate guide needs to publish in November to rank by early February. A back-to-school lunchbox recipe needs to publish in June to rank by late August. The 60-to-90-day ranking curve dictates the calendar.
Creator syndication inside food brand content
Creator syndication on food brand content marketing amplifies the recipe hub through Instagram Reels, TikTok, and YouTube Shorts creators paid to post their own version of the brand’s hero recipes. The creator content pulls net-new audiences into the recipe hub through the creator’s Link in Bio or Amazon Storefront tag. The syndication calendar names 12 to 30 creators per quarter with specific recipes assigned to each.
One brand we picked up had a spreadsheet titled “creator outreach 2023” with 47 rows and 3 responses. All 3 responses were auto-replies. The spreadsheet named zero recipes and offered flat rates below 100 dollars per post. Nobody posts a 30-second video for 87 dollars flat. Nobody.
Creator content commercial terms that work
Working creator content commercial terms run 350 to 1,500 dollars flat per post plus a 12 to 25 percent commission on tagged sales across a 30-day window. The commission mechanic pulls creators into follow-up posts because the incremental revenue continues past the initial fee. Mid-tier creators (30k to 150k followers) hit the sweet spot for food brand content because their engagement rate typically runs 4 to 8 percent versus 0.8 to 1.6 percent on mega-creators.
Content brief structure for creator partnerships
The content brief structure for creator partnerships runs a single page: the SKU, the specific recipe or usage occasion, 3 required brand mentions, 3 restricted claims (no health claims on non-medical SKUs), the pricing angle, the affiliate link, and 3 example videos that hit the tone. The brief avoids over-scripting because over-scripted creator content underperforms native creator voice by 40 to 60 percent on engagement rate.
Buyer intent content for food brand blogs
Buyer intent content on food brand blogs covers 8 to 16 pieces targeting explicit purchase-decision queries: “where to buy [brand],” “[brand] subscription vs. one-time,” “best [category] for [use case],” and “[brand] gift bundle.” Every buyer intent piece runs 1,400 to 2,400 words with a comparison table, product cards, and a clear conversion path to the specific SKU that matches the query intent. Buyer intent content converts at 3 to 6 percent versus 1 to 2 percent on recipe content because the shopper landed already planning to buy, not exploring a usage occasion.
Where-to-buy content structure
Where-to-buy content structure covers online (DTC storefront, Amazon, Target.com, Whole Foods online), retail (specific chain locators with the store finder embedded), and international (customs limitations, retailer partners abroad). Every piece names specific retailers, links to the store locator, and includes an FAQ block covering shipping availability, subscription options, and gift card compatibility. Where-to-buy content ranks for branded discovery queries the DTC storefront otherwise loses to competitor affiliate reviews.
Subscription versus one-time comparison content
Subscription versus one-time comparison content converts subscription commitments at 3 to 6 percent because it addresses the price-sensitivity concern head-on with a specific math table. The piece covers the discount structure (15 percent lifetime), the skip-a-month mechanic, the pause-anytime rule, the cancellation policy, and the specific yearly savings for the brand’s average consumption cadence. Cross-reference the retention structure on our food and beverage marketing retainer page.
Content refresh cadence on food brand pillars
Content refresh cadence on food brand content pillars runs a rolling audit every 12 to 24 months by pillar. Recipes get refreshed every 12 months with new photography, updated schema, and any nutrition or ingredient adjustments. Ingredient comparison guides refresh every 18 months to update market data. Sourcing story pages refresh every 24 months to reflect farm partnership changes and new harvest angles. Buyer intent content refreshes every 12 months to update retailer availability and pricing.
Recipe refresh priority order
Recipe refresh priority runs by organic traffic rank. The top 20 recipes by monthly organic sessions get refreshed first (new photography, schema audit, related recipe internal links, updated nutrition). The next 40 get refreshed at 15 months. The remaining recipes get refreshed opportunistically when the ranking slips past position 15 in Google. Skipping the refresh cadence lets recipe rankings drift out of the top 3 inside 18 months as newer competitor recipes take the position.
Schema audit checklist per refresh
The schema audit checklist per refresh runs 8 items: Recipe schema completeness, aggregateRating count and accuracy, nutrition data accuracy, prepTime and cookTime match the recipe body, image URLs valid at CDN, related recipe internal links working, product card SKU URL live, and Google Search Console rich result eligibility validated. This checklist takes 20 minutes per recipe and prevents the schema drift that costs recipe rankings 20 to 40 positions quietly.
Reporting cadence for food brand content marketing
Reporting cadence on food brand content marketing runs a monthly executive report plus a quarterly business review. The monthly report ships in the first business week and covers organic sessions by pillar, top 10 ranking recipes with position trend, ingredient guide ranking movements, sourcing page performance, and organic-attributed DTC revenue. Every number carries a comparison to the prior month and a plain-language interpretation the founder reads in 7 minutes.
Metrics that matter for content marketing
Metrics that matter for food brand content marketing: organic sessions by pillar, recipe rich result impressions in Search Console, organic conversion rate to hero SKU pages, organic-attributed DTC revenue, and top 20 ranking positions by monthly organic sessions. Vanity metrics that do not matter: total pageviews without conversion context, average time on page without conversion attribution, and social share counts. The monthly report skips the vanity block entirely.
Quarterly business review structure
The quarterly business review runs 90 minutes with the founder, head of content, and SEO lead. Agenda: organic traffic trend by pillar, top 10 winning content pieces, top 10 losing content pieces (candidates for refresh or removal), competitive gap analysis against 5 named competitor brands, and next quarter’s content calendar with recipes and ingredient guides queued. According to Ahrefs content marketing research, brands running quarterly content audits outperform brands running annual audits by 40 to 70 percent on organic revenue over a 24-month window.
Internal linking discipline across food brand content
Internal linking discipline across food brand content moves authority from recipe pages toward hero SKU product pages and comparison guides. Every recipe links to the hero SKU it uses inline (once in the ingredient list, once in a bottom call-out card). Every ingredient comparison guide links to 3 to 6 recipes using the winning ingredient plus the hero SKU product page. Every sourcing story links to the 2 to 4 SKUs sourced from that specific farm or cooperative.
Anchor text strategy across recipe hubs
Anchor text on internal links varies across recipe hubs to avoid over-optimization patterns Google penalizes. Exact-match anchor (“single-origin Ethiopian coffee”) runs on 20 to 30 percent of internal links. Partial-match variations (“our Ethiopian roast”) run on 30 to 40 percent. Branded anchors (the SKU name) run on 20 to 30 percent. Generic anchors (“shop the coffee”) fill the remaining 10 to 20 percent. This ratio holds ranking without triggering the over-optimization penalty that shows up on brands that anchor-text-stuff every internal link with the same exact-match keyword. Cross-reference the linking layer on our food and beverage web design page.
Link equity from ingredient guides to SKU pages
Link equity from ingredient guides passes to SKU pages when the guide’s comparison table names the hero SKU in the winning column with a product card, and when the guide’s body links to 3 to 6 recipes that use the winning ingredient. This 3-hop path (guide to recipe to SKU) pushes authority from a high-traffic informational query down to a high-intent transactional page. According to Search Engine Land SEO coverage, informational content that internally links to transactional pages produces 2 to 4 times higher organic revenue than isolated content silos.
Wrapping up content marketing for food brands
Content marketing for food brands is the organic engine that turns a DTC snack, drink, or CPG storefront into a search-driven revenue channel. Recipe hub of 40 to 100 recipes. Ingredient comparison guides at 12 to 24 pieces. Sourcing story pages at 6 to 12 pieces. Buyer intent content at 8 to 16 pieces. Creator syndication calendar with 12 to 30 creators per quarter. Refresh cadence at 12 to 24 months by pillar. Reporting with organic sessions and organic revenue attribution.
If your DTC food brand is running paid social at 20,000 dollars monthly with a broken blog and zero recipe schema, professional content marketing for food brands pays for itself inside the first 90 days on organic traffic captured. Redefine Web ships content marketing inside our monthly retainer packages. Book a call and we will walk through the last three DTC food brands we built recipe hubs for, pillar by pillar.
Content marketing for food brands starts with a recipe hub because recipe queries account for 40 to 60 percent of high-intent search volume in the food category. Every hero SKU needs 4 to 12 recipes anchored to it, each targeting a specific occasion and audience.
Skip the recipe hub and the brand loses the search real estate that pulls DTC storefront traffic month over month at zero incremental paid cost. Recipe traffic converts at 2 to 4 percent because the shopper landed with usage intent, not passive discovery, which is why food brands win on recipes.
Recipe schema and Google rich result eligibility
Every recipe page ships schema.org Recipe markup including cookTime, prepTime, recipeIngredient, recipeInstructions, nutrition, and aggregateRating. Correctly marked-up recipes qualify for Google’s recipe rich result carousel that pulls 3 to 6 times higher click-through rate than a plain blue link. The schema layer takes 15 minutes per recipe to author and 30 minutes to validate in Google Search Console. Cross-reference the recipe search stack on our food and beverage SEO page.
Recipe hub structure that scales
The recipe hub structure runs 40 to 100 recipes at maturity, organized by hero SKU (4 to 12 recipes per SKU) plus occasion tags (breakfast, weeknight dinner, meal prep, brunch, holiday). Every recipe links back to the hero SKU product page with the SKU embedded in an inline card. The hub earns internal linking value from ingredient comparison guides and the sourcing story pages, which feeds recipe ranking on Google. According to Google Search Central recipe structured data guidance, complete Recipe schema markup is required for eligibility in the recipe carousel and the ingredient search filter.
Pillar structure for food brand content marketing
The pillar structure on content marketing for food brands runs 4 content pillars concurrently: recipe hub (40 to 100 recipes), ingredient comparison guides (12 to 24 guides), sourcing story pages (6 to 12 pages), and buyer intent content (where to buy, subscription vs. one-time, gift bundle guides). Every pillar covers a distinct search intent and every pillar links back to the hero SKU product pages.
Ingredient comparison guide format
Ingredient comparison guides run 1,800 to 3,200 words comparing 2 to 4 ingredient types on 6 to 10 attributes with a comparison table, real-world use case examples, and links to the hero SKU that uses the specific ingredient. Example: organic vs. conventional oats compares nutritional profile, sourcing chain, cost, environmental impact, and taste on a 6-column table. The brand’s SKU appears in the winning column with a product card. These guides rank 3 to 8 months after publication and pull steady-state organic traffic.
Sourcing story pages that build trust
Sourcing story pages name the specific farms, cooperatives, or suppliers the brand sources from, with photos of the farms, farmer quotes, and specific harvest windows. A coffee brand’s Ethiopian farm page ranks for “single-origin Ethiopian coffee” and “Yirgacheffe coffee origin” plus 40 long-tail variations. The sourcing page pulls trust-building traffic that converts at 4 to 6 percent because the shopper landed pattern-matching on transparency and named provenance. Every sourcing page includes farmer or cooperative quotes, harvest dates, and a link back to 3 to 5 hero SKU pages that source from the named supplier.
Vejrø hospitality content case study
Vejrø Resort, a Danish private-island destination with an on-site restaurant focused on organic, locally sourced cuisine, joined us with strong social engagement and no organic-search real estate. Guests found the resort on Instagram but never in Google search for terms like “private island resort Denmark,” “farm-to-table hospitality Denmark,” or “Vejrø restaurant.” The same organic-search gap shows up on DTC food brands running paid social at 20,000 dollars monthly with a broken blog and zero recipe schema.
We built the conversion-focused website with on-site and off-site SEO tuned to the travel-niche keyword clusters, competitor analysis against comparable boutique resorts, and mobile-first design prioritizing guest discovery. Every page carried the structured data qualifying it for Google’s rich results in the hospitality category. Every internal link pushed authority toward the direct-booking conversion path.
Three months later, Vejrø hit 10,000 plus organic visitors, ranked for 200 plus first-page keywords, and pulled a 2.2 percent booking conversion rate from organic traffic. The same pattern applies to content marketing for food brands: recipe schema, ingredient comparison guides, and sourcing story pages pull organic traffic at 20 to 40 percent conversion into hero SKU pages inside 6 months when the content quality matches search intent and every page carries the right structured data markup. Vejrø also proved out the reporting discipline: every monthly report named the exact page, the exact keyword cluster, and the exact search feature (rich result, sitelinks, image pack) driving the incremental organic revenue instead of hiding behind aggregate traffic charts.
Recipe cadence and content calendar for food brands
Recipe cadence on a working food brand content calendar ships 2 to 4 new recipes per week during the first 6 months and drops to 1 per week at maturity. Each recipe takes 4 to 6 hours to produce (write, test in the kitchen, photograph, schema author, publish). At 3 recipes per week, the brand hits 78 recipes inside 6 months plus a backlog of ingredient comparison and sourcing content queued behind the recipe production line.
| Content pillar | Target volume year 1 | Production cost per piece | Refresh cadence |
|---|---|---|---|
| Recipe hub | 40 to 100 recipes | $180 to $320 | Every 12 months |
| Ingredient comparison guides | 12 to 24 guides | $450 to $780 | Every 18 months |
| Sourcing story pages | 6 to 12 pages | $680 to $1,200 | Every 24 months |
| Buyer intent content | 8 to 16 pieces | $220 to $420 | Every 12 months |
Photography as a content calendar constraint
Photography is the actual constraint on recipe cadence, not writing. Every recipe needs 6 to 12 photos: hero shot, ingredient flat lay, prep in progress, plated result, storage, and step shots for the schema markup. A working food brand batches photography 8 recipes at a time to keep the cost per recipe under 200 dollars. Skip the batching and the per-recipe cost climbs to 400 to 600 dollars, which caps recipe cadence at 1 per week and slows organic ranking timeline by 6 months.
Seasonal content calendar planning
Seasonal content calendar planning maps recipes and comparison guides to the seasonal windows they need to rank in. A Christmas cookie recipe needs to publish in September to rank by early December. A Valentine’s chocolate guide needs to publish in November to rank by early February. A back-to-school lunchbox recipe needs to publish in June to rank by late August. The 60-to-90-day ranking curve dictates the calendar.
Creator syndication inside food brand content
Creator syndication on food brand content marketing amplifies the recipe hub through Instagram Reels, TikTok, and YouTube Shorts creators paid to post their own version of the brand’s hero recipes. The creator content pulls net-new audiences into the recipe hub through the creator’s Link in Bio or Amazon Storefront tag. The syndication calendar names 12 to 30 creators per quarter with specific recipes assigned to each.
One brand we picked up had a spreadsheet titled “creator outreach 2023” with 47 rows and 3 responses. All 3 responses were auto-replies. The spreadsheet named zero recipes and offered flat rates below 100 dollars per post. Nobody posts a 30-second video for 87 dollars flat. Nobody.
Creator content commercial terms that work
Working creator content commercial terms run 350 to 1,500 dollars flat per post plus a 12 to 25 percent commission on tagged sales across a 30-day window. The commission mechanic pulls creators into follow-up posts because the incremental revenue continues past the initial fee. Mid-tier creators (30k to 150k followers) hit the sweet spot for food brand content because their engagement rate typically runs 4 to 8 percent versus 0.8 to 1.6 percent on mega-creators.
Content brief structure for creator partnerships
The content brief structure for creator partnerships runs a single page: the SKU, the specific recipe or usage occasion, 3 required brand mentions, 3 restricted claims (no health claims on non-medical SKUs), the pricing angle, the affiliate link, and 3 example videos that hit the tone. The brief avoids over-scripting because over-scripted creator content underperforms native creator voice by 40 to 60 percent on engagement rate.
Buyer intent content for food brand blogs
Buyer intent content on food brand blogs covers 8 to 16 pieces targeting explicit purchase-decision queries: “where to buy [brand],” “[brand] subscription vs. one-time,” “best [category] for [use case],” and “[brand] gift bundle.” Every buyer intent piece runs 1,400 to 2,400 words with a comparison table, product cards, and a clear conversion path to the specific SKU that matches the query intent. Buyer intent content converts at 3 to 6 percent versus 1 to 2 percent on recipe content because the shopper landed already planning to buy, not exploring a usage occasion.
Where-to-buy content structure
Where-to-buy content structure covers online (DTC storefront, Amazon, Target.com, Whole Foods online), retail (specific chain locators with the store finder embedded), and international (customs limitations, retailer partners abroad). Every piece names specific retailers, links to the store locator, and includes an FAQ block covering shipping availability, subscription options, and gift card compatibility. Where-to-buy content ranks for branded discovery queries the DTC storefront otherwise loses to competitor affiliate reviews.
Subscription versus one-time comparison content
Subscription versus one-time comparison content converts subscription commitments at 3 to 6 percent because it addresses the price-sensitivity concern head-on with a specific math table. The piece covers the discount structure (15 percent lifetime), the skip-a-month mechanic, the pause-anytime rule, the cancellation policy, and the specific yearly savings for the brand’s average consumption cadence. Cross-reference the retention structure on our food and beverage marketing retainer page.
Content refresh cadence on food brand pillars
Content refresh cadence on food brand content pillars runs a rolling audit every 12 to 24 months by pillar. Recipes get refreshed every 12 months with new photography, updated schema, and any nutrition or ingredient adjustments. Ingredient comparison guides refresh every 18 months to update market data. Sourcing story pages refresh every 24 months to reflect farm partnership changes and new harvest angles. Buyer intent content refreshes every 12 months to update retailer availability and pricing.
Recipe refresh priority order
Recipe refresh priority runs by organic traffic rank. The top 20 recipes by monthly organic sessions get refreshed first (new photography, schema audit, related recipe internal links, updated nutrition). The next 40 get refreshed at 15 months. The remaining recipes get refreshed opportunistically when the ranking slips past position 15 in Google. Skipping the refresh cadence lets recipe rankings drift out of the top 3 inside 18 months as newer competitor recipes take the position.
Schema audit checklist per refresh
The schema audit checklist per refresh runs 8 items: Recipe schema completeness, aggregateRating count and accuracy, nutrition data accuracy, prepTime and cookTime match the recipe body, image URLs valid at CDN, related recipe internal links working, product card SKU URL live, and Google Search Console rich result eligibility validated. This checklist takes 20 minutes per recipe and prevents the schema drift that costs recipe rankings 20 to 40 positions quietly.
Reporting cadence for food brand content marketing
Reporting cadence on food brand content marketing runs a monthly executive report plus a quarterly business review. The monthly report ships in the first business week and covers organic sessions by pillar, top 10 ranking recipes with position trend, ingredient guide ranking movements, sourcing page performance, and organic-attributed DTC revenue. Every number carries a comparison to the prior month and a plain-language interpretation the founder reads in 7 minutes.
Metrics that matter for content marketing
Metrics that matter for food brand content marketing: organic sessions by pillar, recipe rich result impressions in Search Console, organic conversion rate to hero SKU pages, organic-attributed DTC revenue, and top 20 ranking positions by monthly organic sessions. Vanity metrics that do not matter: total pageviews without conversion context, average time on page without conversion attribution, and social share counts. The monthly report skips the vanity block entirely.
Quarterly business review structure
The quarterly business review runs 90 minutes with the founder, head of content, and SEO lead. Agenda: organic traffic trend by pillar, top 10 winning content pieces, top 10 losing content pieces (candidates for refresh or removal), competitive gap analysis against 5 named competitor brands, and next quarter’s content calendar with recipes and ingredient guides queued. According to Ahrefs content marketing research, brands running quarterly content audits outperform brands running annual audits by 40 to 70 percent on organic revenue over a 24-month window.
Internal linking discipline across food brand content
Internal linking discipline across food brand content moves authority from recipe pages toward hero SKU product pages and comparison guides. Every recipe links to the hero SKU it uses inline (once in the ingredient list, once in a bottom call-out card). Every ingredient comparison guide links to 3 to 6 recipes using the winning ingredient plus the hero SKU product page. Every sourcing story links to the 2 to 4 SKUs sourced from that specific farm or cooperative.
Anchor text strategy across recipe hubs
Anchor text on internal links varies across recipe hubs to avoid over-optimization patterns Google penalizes. Exact-match anchor (“single-origin Ethiopian coffee”) runs on 20 to 30 percent of internal links. Partial-match variations (“our Ethiopian roast”) run on 30 to 40 percent. Branded anchors (the SKU name) run on 20 to 30 percent. Generic anchors (“shop the coffee”) fill the remaining 10 to 20 percent. This ratio holds ranking without triggering the over-optimization penalty that shows up on brands that anchor-text-stuff every internal link with the same exact-match keyword. Cross-reference the linking layer on our food and beverage web design page.
Link equity from ingredient guides to SKU pages
Link equity from ingredient guides passes to SKU pages when the guide’s comparison table names the hero SKU in the winning column with a product card, and when the guide’s body links to 3 to 6 recipes that use the winning ingredient. This 3-hop path (guide to recipe to SKU) pushes authority from a high-traffic informational query down to a high-intent transactional page. According to Search Engine Land SEO coverage, informational content that internally links to transactional pages produces 2 to 4 times higher organic revenue than isolated content silos.
Wrapping up content marketing for food brands
Content marketing for food brands is the organic engine that turns a DTC snack, drink, or CPG storefront into a search-driven revenue channel. Recipe hub of 40 to 100 recipes. Ingredient comparison guides at 12 to 24 pieces. Sourcing story pages at 6 to 12 pieces. Buyer intent content at 8 to 16 pieces. Creator syndication calendar with 12 to 30 creators per quarter. Refresh cadence at 12 to 24 months by pillar. Reporting with organic sessions and organic revenue attribution.
If your DTC food brand is running paid social at 20,000 dollars monthly with a broken blog and zero recipe schema, professional content marketing for food brands pays for itself inside the first 90 days on organic traffic captured. Redefine Web ships content marketing inside our monthly retainer packages. Book a call and we will walk through the last three DTC food brands we built recipe hubs for, pillar by pillar.
Internal linking discipline across food brand content moves authority from recipe pages toward hero SKU product pages and comparison guides. Every recipe links to the hero SKU it uses inline (once in the ingredient list, once in a bottom call-out card). Every ingredient comparison guide links to 3 to 6 recipes using the winning ingredient plus the hero SKU product page. Every sourcing story links to the 2 to 4 SKUs sourced from that specific farm or cooperative.
Anchor text strategy across recipe hubs
Anchor text on internal links varies across recipe hubs to avoid over-optimization patterns Google penalizes. Exact-match anchor (“single-origin Ethiopian coffee”) runs on 20 to 30 percent of internal links. Partial-match variations (“our Ethiopian roast”) run on 30 to 40 percent. Branded anchors (the SKU name) run on 20 to 30 percent. Generic anchors (“shop the coffee”) fill the remaining 10 to 20 percent. This ratio holds ranking without triggering the over-optimization penalty that shows up on brands that anchor-text-stuff every internal link with the same exact-match keyword. Cross-reference the linking layer on our food and beverage web design page.
Link equity from ingredient guides to SKU pages
Link equity from ingredient guides passes to SKU pages when the guide’s comparison table names the hero SKU in the winning column with a product card, and when the guide’s body links to 3 to 6 recipes that use the winning ingredient. This 3-hop path (guide to recipe to SKU) pushes authority from a high-traffic informational query down to a high-intent transactional page. According to Search Engine Land SEO coverage, informational content that internally links to transactional pages produces 2 to 4 times higher organic revenue than isolated content silos.
Wrapping up content marketing for food brands
Content marketing for food brands is the organic engine that turns a DTC snack, drink, or CPG storefront into a search-driven revenue channel. Recipe hub of 40 to 100 recipes. Ingredient comparison guides at 12 to 24 pieces. Sourcing story pages at 6 to 12 pieces. Buyer intent content at 8 to 16 pieces. Creator syndication calendar with 12 to 30 creators per quarter. Refresh cadence at 12 to 24 months by pillar. Reporting with organic sessions and organic revenue attribution.
If your DTC food brand is running paid social at 20,000 dollars monthly with a broken blog and zero recipe schema, professional content marketing for food brands pays for itself inside the first 90 days on organic traffic captured. Redefine Web ships content marketing inside our monthly retainer packages. Book a call and we will walk through the last three DTC food brands we built recipe hubs for, pillar by pillar.
Content marketing for food brands starts with a recipe hub because recipe queries account for 40 to 60 percent of high-intent search volume in the food category. Every hero SKU needs 4 to 12 recipes anchored to it, each targeting a specific occasion and audience.
Skip the recipe hub and the brand loses the search real estate that pulls DTC storefront traffic month over month at zero incremental paid cost. Recipe traffic converts at 2 to 4 percent because the shopper landed with usage intent, not passive discovery, which is why food brands win on recipes.
Recipe schema and Google rich result eligibility
Every recipe page ships schema.org Recipe markup including cookTime, prepTime, recipeIngredient, recipeInstructions, nutrition, and aggregateRating. Correctly marked-up recipes qualify for Google’s recipe rich result carousel that pulls 3 to 6 times higher click-through rate than a plain blue link. The schema layer takes 15 minutes per recipe to author and 30 minutes to validate in Google Search Console. Cross-reference the recipe search stack on our food and beverage SEO page.
Recipe hub structure that scales
The recipe hub structure runs 40 to 100 recipes at maturity, organized by hero SKU (4 to 12 recipes per SKU) plus occasion tags (breakfast, weeknight dinner, meal prep, brunch, holiday). Every recipe links back to the hero SKU product page with the SKU embedded in an inline card. The hub earns internal linking value from ingredient comparison guides and the sourcing story pages, which feeds recipe ranking on Google. According to Google Search Central recipe structured data guidance, complete Recipe schema markup is required for eligibility in the recipe carousel and the ingredient search filter.
Pillar structure for food brand content marketing
The pillar structure on content marketing for food brands runs 4 content pillars concurrently: recipe hub (40 to 100 recipes), ingredient comparison guides (12 to 24 guides), sourcing story pages (6 to 12 pages), and buyer intent content (where to buy, subscription vs. one-time, gift bundle guides). Every pillar covers a distinct search intent and every pillar links back to the hero SKU product pages.
Ingredient comparison guide format
Ingredient comparison guides run 1,800 to 3,200 words comparing 2 to 4 ingredient types on 6 to 10 attributes with a comparison table, real-world use case examples, and links to the hero SKU that uses the specific ingredient. Example: organic vs. conventional oats compares nutritional profile, sourcing chain, cost, environmental impact, and taste on a 6-column table. The brand’s SKU appears in the winning column with a product card. These guides rank 3 to 8 months after publication and pull steady-state organic traffic.
Sourcing story pages that build trust
Sourcing story pages name the specific farms, cooperatives, or suppliers the brand sources from, with photos of the farms, farmer quotes, and specific harvest windows. A coffee brand’s Ethiopian farm page ranks for “single-origin Ethiopian coffee” and “Yirgacheffe coffee origin” plus 40 long-tail variations. The sourcing page pulls trust-building traffic that converts at 4 to 6 percent because the shopper landed pattern-matching on transparency and named provenance. Every sourcing page includes farmer or cooperative quotes, harvest dates, and a link back to 3 to 5 hero SKU pages that source from the named supplier.
Vejrø hospitality content case study
Vejrø Resort, a Danish private-island destination with an on-site restaurant focused on organic, locally sourced cuisine, joined us with strong social engagement and no organic-search real estate. Guests found the resort on Instagram but never in Google search for terms like “private island resort Denmark,” “farm-to-table hospitality Denmark,” or “Vejrø restaurant.” The same organic-search gap shows up on DTC food brands running paid social at 20,000 dollars monthly with a broken blog and zero recipe schema.
We built the conversion-focused website with on-site and off-site SEO tuned to the travel-niche keyword clusters, competitor analysis against comparable boutique resorts, and mobile-first design prioritizing guest discovery. Every page carried the structured data qualifying it for Google’s rich results in the hospitality category. Every internal link pushed authority toward the direct-booking conversion path.
Three months later, Vejrø hit 10,000 plus organic visitors, ranked for 200 plus first-page keywords, and pulled a 2.2 percent booking conversion rate from organic traffic. The same pattern applies to content marketing for food brands: recipe schema, ingredient comparison guides, and sourcing story pages pull organic traffic at 20 to 40 percent conversion into hero SKU pages inside 6 months when the content quality matches search intent and every page carries the right structured data markup. Vejrø also proved out the reporting discipline: every monthly report named the exact page, the exact keyword cluster, and the exact search feature (rich result, sitelinks, image pack) driving the incremental organic revenue instead of hiding behind aggregate traffic charts.
Recipe cadence and content calendar for food brands
Recipe cadence on a working food brand content calendar ships 2 to 4 new recipes per week during the first 6 months and drops to 1 per week at maturity. Each recipe takes 4 to 6 hours to produce (write, test in the kitchen, photograph, schema author, publish). At 3 recipes per week, the brand hits 78 recipes inside 6 months plus a backlog of ingredient comparison and sourcing content queued behind the recipe production line.
| Content pillar | Target volume year 1 | Production cost per piece | Refresh cadence |
|---|---|---|---|
| Recipe hub | 40 to 100 recipes | $180 to $320 | Every 12 months |
| Ingredient comparison guides | 12 to 24 guides | $450 to $780 | Every 18 months |
| Sourcing story pages | 6 to 12 pages | $680 to $1,200 | Every 24 months |
| Buyer intent content | 8 to 16 pieces | $220 to $420 | Every 12 months |
Photography as a content calendar constraint
Photography is the actual constraint on recipe cadence, not writing. Every recipe needs 6 to 12 photos: hero shot, ingredient flat lay, prep in progress, plated result, storage, and step shots for the schema markup. A working food brand batches photography 8 recipes at a time to keep the cost per recipe under 200 dollars. Skip the batching and the per-recipe cost climbs to 400 to 600 dollars, which caps recipe cadence at 1 per week and slows organic ranking timeline by 6 months.
Seasonal content calendar planning
Seasonal content calendar planning maps recipes and comparison guides to the seasonal windows they need to rank in. A Christmas cookie recipe needs to publish in September to rank by early December. A Valentine’s chocolate guide needs to publish in November to rank by early February. A back-to-school lunchbox recipe needs to publish in June to rank by late August. The 60-to-90-day ranking curve dictates the calendar.
Creator syndication inside food brand content
Creator syndication on food brand content marketing amplifies the recipe hub through Instagram Reels, TikTok, and YouTube Shorts creators paid to post their own version of the brand’s hero recipes. The creator content pulls net-new audiences into the recipe hub through the creator’s Link in Bio or Amazon Storefront tag. The syndication calendar names 12 to 30 creators per quarter with specific recipes assigned to each.
One brand we picked up had a spreadsheet titled “creator outreach 2023” with 47 rows and 3 responses. All 3 responses were auto-replies. The spreadsheet named zero recipes and offered flat rates below 100 dollars per post. Nobody posts a 30-second video for 87 dollars flat. Nobody.
Creator content commercial terms that work
Working creator content commercial terms run 350 to 1,500 dollars flat per post plus a 12 to 25 percent commission on tagged sales across a 30-day window. The commission mechanic pulls creators into follow-up posts because the incremental revenue continues past the initial fee. Mid-tier creators (30k to 150k followers) hit the sweet spot for food brand content because their engagement rate typically runs 4 to 8 percent versus 0.8 to 1.6 percent on mega-creators.
Content brief structure for creator partnerships
The content brief structure for creator partnerships runs a single page: the SKU, the specific recipe or usage occasion, 3 required brand mentions, 3 restricted claims (no health claims on non-medical SKUs), the pricing angle, the affiliate link, and 3 example videos that hit the tone. The brief avoids over-scripting because over-scripted creator content underperforms native creator voice by 40 to 60 percent on engagement rate.
Buyer intent content for food brand blogs
Buyer intent content on food brand blogs covers 8 to 16 pieces targeting explicit purchase-decision queries: “where to buy [brand],” “[brand] subscription vs. one-time,” “best [category] for [use case],” and “[brand] gift bundle.” Every buyer intent piece runs 1,400 to 2,400 words with a comparison table, product cards, and a clear conversion path to the specific SKU that matches the query intent. Buyer intent content converts at 3 to 6 percent versus 1 to 2 percent on recipe content because the shopper landed already planning to buy, not exploring a usage occasion.
Where-to-buy content structure
Where-to-buy content structure covers online (DTC storefront, Amazon, Target.com, Whole Foods online), retail (specific chain locators with the store finder embedded), and international (customs limitations, retailer partners abroad). Every piece names specific retailers, links to the store locator, and includes an FAQ block covering shipping availability, subscription options, and gift card compatibility. Where-to-buy content ranks for branded discovery queries the DTC storefront otherwise loses to competitor affiliate reviews.
Subscription versus one-time comparison content
Subscription versus one-time comparison content converts subscription commitments at 3 to 6 percent because it addresses the price-sensitivity concern head-on with a specific math table. The piece covers the discount structure (15 percent lifetime), the skip-a-month mechanic, the pause-anytime rule, the cancellation policy, and the specific yearly savings for the brand’s average consumption cadence. Cross-reference the retention structure on our food and beverage marketing retainer page.
Content refresh cadence on food brand pillars
Content refresh cadence on food brand content pillars runs a rolling audit every 12 to 24 months by pillar. Recipes get refreshed every 12 months with new photography, updated schema, and any nutrition or ingredient adjustments. Ingredient comparison guides refresh every 18 months to update market data. Sourcing story pages refresh every 24 months to reflect farm partnership changes and new harvest angles. Buyer intent content refreshes every 12 months to update retailer availability and pricing.
Recipe refresh priority order
Recipe refresh priority runs by organic traffic rank. The top 20 recipes by monthly organic sessions get refreshed first (new photography, schema audit, related recipe internal links, updated nutrition). The next 40 get refreshed at 15 months. The remaining recipes get refreshed opportunistically when the ranking slips past position 15 in Google. Skipping the refresh cadence lets recipe rankings drift out of the top 3 inside 18 months as newer competitor recipes take the position.
Schema audit checklist per refresh
The schema audit checklist per refresh runs 8 items: Recipe schema completeness, aggregateRating count and accuracy, nutrition data accuracy, prepTime and cookTime match the recipe body, image URLs valid at CDN, related recipe internal links working, product card SKU URL live, and Google Search Console rich result eligibility validated. This checklist takes 20 minutes per recipe and prevents the schema drift that costs recipe rankings 20 to 40 positions quietly.
Reporting cadence for food brand content marketing
Reporting cadence on food brand content marketing runs a monthly executive report plus a quarterly business review. The monthly report ships in the first business week and covers organic sessions by pillar, top 10 ranking recipes with position trend, ingredient guide ranking movements, sourcing page performance, and organic-attributed DTC revenue. Every number carries a comparison to the prior month and a plain-language interpretation the founder reads in 7 minutes.
Metrics that matter for content marketing
Metrics that matter for food brand content marketing: organic sessions by pillar, recipe rich result impressions in Search Console, organic conversion rate to hero SKU pages, organic-attributed DTC revenue, and top 20 ranking positions by monthly organic sessions. Vanity metrics that do not matter: total pageviews without conversion context, average time on page without conversion attribution, and social share counts. The monthly report skips the vanity block entirely.
Quarterly business review structure
The quarterly business review runs 90 minutes with the founder, head of content, and SEO lead. Agenda: organic traffic trend by pillar, top 10 winning content pieces, top 10 losing content pieces (candidates for refresh or removal), competitive gap analysis against 5 named competitor brands, and next quarter’s content calendar with recipes and ingredient guides queued. According to Ahrefs content marketing research, brands running quarterly content audits outperform brands running annual audits by 40 to 70 percent on organic revenue over a 24-month window.
Internal linking discipline across food brand content
Internal linking discipline across food brand content moves authority from recipe pages toward hero SKU product pages and comparison guides. Every recipe links to the hero SKU it uses inline (once in the ingredient list, once in a bottom call-out card). Every ingredient comparison guide links to 3 to 6 recipes using the winning ingredient plus the hero SKU product page. Every sourcing story links to the 2 to 4 SKUs sourced from that specific farm or cooperative.
Anchor text strategy across recipe hubs
Anchor text on internal links varies across recipe hubs to avoid over-optimization patterns Google penalizes. Exact-match anchor (“single-origin Ethiopian coffee”) runs on 20 to 30 percent of internal links. Partial-match variations (“our Ethiopian roast”) run on 30 to 40 percent. Branded anchors (the SKU name) run on 20 to 30 percent. Generic anchors (“shop the coffee”) fill the remaining 10 to 20 percent. This ratio holds ranking without triggering the over-optimization penalty that shows up on brands that anchor-text-stuff every internal link with the same exact-match keyword. Cross-reference the linking layer on our food and beverage web design page.
Link equity from ingredient guides to SKU pages
Link equity from ingredient guides passes to SKU pages when the guide’s comparison table names the hero SKU in the winning column with a product card, and when the guide’s body links to 3 to 6 recipes that use the winning ingredient. This 3-hop path (guide to recipe to SKU) pushes authority from a high-traffic informational query down to a high-intent transactional page. According to Search Engine Land SEO coverage, informational content that internally links to transactional pages produces 2 to 4 times higher organic revenue than isolated content silos.
Wrapping up content marketing for food brands
Content marketing for food brands is the organic engine that turns a DTC snack, drink, or CPG storefront into a search-driven revenue channel. Recipe hub of 40 to 100 recipes. Ingredient comparison guides at 12 to 24 pieces. Sourcing story pages at 6 to 12 pieces. Buyer intent content at 8 to 16 pieces. Creator syndication calendar with 12 to 30 creators per quarter. Refresh cadence at 12 to 24 months by pillar. Reporting with organic sessions and organic revenue attribution.
If your DTC food brand is running paid social at 20,000 dollars monthly with a broken blog and zero recipe schema, professional content marketing for food brands pays for itself inside the first 90 days on organic traffic captured. Redefine Web ships content marketing inside our monthly retainer packages. Book a call and we will walk through the last three DTC food brands we built recipe hubs for, pillar by pillar.
Content marketing for food brands starts with a recipe hub because recipe queries account for 40 to 60 percent of high-intent search volume in the food category. Every hero SKU needs 4 to 12 recipes anchored to it, each targeting a specific occasion and audience.
Skip the recipe hub and the brand loses the search real estate that pulls DTC storefront traffic month over month at zero incremental paid cost. Recipe traffic converts at 2 to 4 percent because the shopper landed with usage intent, not passive discovery, which is why food brands win on recipes.
Recipe schema and Google rich result eligibility
Every recipe page ships schema.org Recipe markup including cookTime, prepTime, recipeIngredient, recipeInstructions, nutrition, and aggregateRating. Correctly marked-up recipes qualify for Google’s recipe rich result carousel that pulls 3 to 6 times higher click-through rate than a plain blue link. The schema layer takes 15 minutes per recipe to author and 30 minutes to validate in Google Search Console. Cross-reference the recipe search stack on our food and beverage SEO page.
Recipe hub structure that scales
The recipe hub structure runs 40 to 100 recipes at maturity, organized by hero SKU (4 to 12 recipes per SKU) plus occasion tags (breakfast, weeknight dinner, meal prep, brunch, holiday). Every recipe links back to the hero SKU product page with the SKU embedded in an inline card. The hub earns internal linking value from ingredient comparison guides and the sourcing story pages, which feeds recipe ranking on Google. According to Google Search Central recipe structured data guidance, complete Recipe schema markup is required for eligibility in the recipe carousel and the ingredient search filter.
Pillar structure for food brand content marketing
The pillar structure on content marketing for food brands runs 4 content pillars concurrently: recipe hub (40 to 100 recipes), ingredient comparison guides (12 to 24 guides), sourcing story pages (6 to 12 pages), and buyer intent content (where to buy, subscription vs. one-time, gift bundle guides). Every pillar covers a distinct search intent and every pillar links back to the hero SKU product pages.
Ingredient comparison guide format
Ingredient comparison guides run 1,800 to 3,200 words comparing 2 to 4 ingredient types on 6 to 10 attributes with a comparison table, real-world use case examples, and links to the hero SKU that uses the specific ingredient. Example: organic vs. conventional oats compares nutritional profile, sourcing chain, cost, environmental impact, and taste on a 6-column table. The brand’s SKU appears in the winning column with a product card. These guides rank 3 to 8 months after publication and pull steady-state organic traffic.
Sourcing story pages that build trust
Sourcing story pages name the specific farms, cooperatives, or suppliers the brand sources from, with photos of the farms, farmer quotes, and specific harvest windows. A coffee brand’s Ethiopian farm page ranks for “single-origin Ethiopian coffee” and “Yirgacheffe coffee origin” plus 40 long-tail variations. The sourcing page pulls trust-building traffic that converts at 4 to 6 percent because the shopper landed pattern-matching on transparency and named provenance. Every sourcing page includes farmer or cooperative quotes, harvest dates, and a link back to 3 to 5 hero SKU pages that source from the named supplier.
Vejrø hospitality content case study
Vejrø Resort, a Danish private-island destination with an on-site restaurant focused on organic, locally sourced cuisine, joined us with strong social engagement and no organic-search real estate. Guests found the resort on Instagram but never in Google search for terms like “private island resort Denmark,” “farm-to-table hospitality Denmark,” or “Vejrø restaurant.” The same organic-search gap shows up on DTC food brands running paid social at 20,000 dollars monthly with a broken blog and zero recipe schema.
We built the conversion-focused website with on-site and off-site SEO tuned to the travel-niche keyword clusters, competitor analysis against comparable boutique resorts, and mobile-first design prioritizing guest discovery. Every page carried the structured data qualifying it for Google’s rich results in the hospitality category. Every internal link pushed authority toward the direct-booking conversion path.
Three months later, Vejrø hit 10,000 plus organic visitors, ranked for 200 plus first-page keywords, and pulled a 2.2 percent booking conversion rate from organic traffic. The same pattern applies to content marketing for food brands: recipe schema, ingredient comparison guides, and sourcing story pages pull organic traffic at 20 to 40 percent conversion into hero SKU pages inside 6 months when the content quality matches search intent and every page carries the right structured data markup. Vejrø also proved out the reporting discipline: every monthly report named the exact page, the exact keyword cluster, and the exact search feature (rich result, sitelinks, image pack) driving the incremental organic revenue instead of hiding behind aggregate traffic charts.
Recipe cadence and content calendar for food brands
Recipe cadence on a working food brand content calendar ships 2 to 4 new recipes per week during the first 6 months and drops to 1 per week at maturity. Each recipe takes 4 to 6 hours to produce (write, test in the kitchen, photograph, schema author, publish). At 3 recipes per week, the brand hits 78 recipes inside 6 months plus a backlog of ingredient comparison and sourcing content queued behind the recipe production line.
| Content pillar | Target volume year 1 | Production cost per piece | Refresh cadence |
|---|---|---|---|
| Recipe hub | 40 to 100 recipes | $180 to $320 | Every 12 months |
| Ingredient comparison guides | 12 to 24 guides | $450 to $780 | Every 18 months |
| Sourcing story pages | 6 to 12 pages | $680 to $1,200 | Every 24 months |
| Buyer intent content | 8 to 16 pieces | $220 to $420 | Every 12 months |
Photography as a content calendar constraint
Photography is the actual constraint on recipe cadence, not writing. Every recipe needs 6 to 12 photos: hero shot, ingredient flat lay, prep in progress, plated result, storage, and step shots for the schema markup. A working food brand batches photography 8 recipes at a time to keep the cost per recipe under 200 dollars. Skip the batching and the per-recipe cost climbs to 400 to 600 dollars, which caps recipe cadence at 1 per week and slows organic ranking timeline by 6 months.
Seasonal content calendar planning
Seasonal content calendar planning maps recipes and comparison guides to the seasonal windows they need to rank in. A Christmas cookie recipe needs to publish in September to rank by early December. A Valentine’s chocolate guide needs to publish in November to rank by early February. A back-to-school lunchbox recipe needs to publish in June to rank by late August. The 60-to-90-day ranking curve dictates the calendar.
Creator syndication inside food brand content
Creator syndication on food brand content marketing amplifies the recipe hub through Instagram Reels, TikTok, and YouTube Shorts creators paid to post their own version of the brand’s hero recipes. The creator content pulls net-new audiences into the recipe hub through the creator’s Link in Bio or Amazon Storefront tag. The syndication calendar names 12 to 30 creators per quarter with specific recipes assigned to each.
One brand we picked up had a spreadsheet titled “creator outreach 2023” with 47 rows and 3 responses. All 3 responses were auto-replies. The spreadsheet named zero recipes and offered flat rates below 100 dollars per post. Nobody posts a 30-second video for 87 dollars flat. Nobody.
Creator content commercial terms that work
Working creator content commercial terms run 350 to 1,500 dollars flat per post plus a 12 to 25 percent commission on tagged sales across a 30-day window. The commission mechanic pulls creators into follow-up posts because the incremental revenue continues past the initial fee. Mid-tier creators (30k to 150k followers) hit the sweet spot for food brand content because their engagement rate typically runs 4 to 8 percent versus 0.8 to 1.6 percent on mega-creators.
Content brief structure for creator partnerships
The content brief structure for creator partnerships runs a single page: the SKU, the specific recipe or usage occasion, 3 required brand mentions, 3 restricted claims (no health claims on non-medical SKUs), the pricing angle, the affiliate link, and 3 example videos that hit the tone. The brief avoids over-scripting because over-scripted creator content underperforms native creator voice by 40 to 60 percent on engagement rate.
Buyer intent content for food brand blogs
Buyer intent content on food brand blogs covers 8 to 16 pieces targeting explicit purchase-decision queries: “where to buy [brand],” “[brand] subscription vs. one-time,” “best [category] for [use case],” and “[brand] gift bundle.” Every buyer intent piece runs 1,400 to 2,400 words with a comparison table, product cards, and a clear conversion path to the specific SKU that matches the query intent. Buyer intent content converts at 3 to 6 percent versus 1 to 2 percent on recipe content because the shopper landed already planning to buy, not exploring a usage occasion.
Where-to-buy content structure
Where-to-buy content structure covers online (DTC storefront, Amazon, Target.com, Whole Foods online), retail (specific chain locators with the store finder embedded), and international (customs limitations, retailer partners abroad). Every piece names specific retailers, links to the store locator, and includes an FAQ block covering shipping availability, subscription options, and gift card compatibility. Where-to-buy content ranks for branded discovery queries the DTC storefront otherwise loses to competitor affiliate reviews.
Subscription versus one-time comparison content
Subscription versus one-time comparison content converts subscription commitments at 3 to 6 percent because it addresses the price-sensitivity concern head-on with a specific math table. The piece covers the discount structure (15 percent lifetime), the skip-a-month mechanic, the pause-anytime rule, the cancellation policy, and the specific yearly savings for the brand’s average consumption cadence. Cross-reference the retention structure on our food and beverage marketing retainer page.
Content refresh cadence on food brand pillars
Content refresh cadence on food brand content pillars runs a rolling audit every 12 to 24 months by pillar. Recipes get refreshed every 12 months with new photography, updated schema, and any nutrition or ingredient adjustments. Ingredient comparison guides refresh every 18 months to update market data. Sourcing story pages refresh every 24 months to reflect farm partnership changes and new harvest angles. Buyer intent content refreshes every 12 months to update retailer availability and pricing.
Recipe refresh priority order
Recipe refresh priority runs by organic traffic rank. The top 20 recipes by monthly organic sessions get refreshed first (new photography, schema audit, related recipe internal links, updated nutrition). The next 40 get refreshed at 15 months. The remaining recipes get refreshed opportunistically when the ranking slips past position 15 in Google. Skipping the refresh cadence lets recipe rankings drift out of the top 3 inside 18 months as newer competitor recipes take the position.
Schema audit checklist per refresh
The schema audit checklist per refresh runs 8 items: Recipe schema completeness, aggregateRating count and accuracy, nutrition data accuracy, prepTime and cookTime match the recipe body, image URLs valid at CDN, related recipe internal links working, product card SKU URL live, and Google Search Console rich result eligibility validated. This checklist takes 20 minutes per recipe and prevents the schema drift that costs recipe rankings 20 to 40 positions quietly.
Reporting cadence for food brand content marketing
Reporting cadence on food brand content marketing runs a monthly executive report plus a quarterly business review. The monthly report ships in the first business week and covers organic sessions by pillar, top 10 ranking recipes with position trend, ingredient guide ranking movements, sourcing page performance, and organic-attributed DTC revenue. Every number carries a comparison to the prior month and a plain-language interpretation the founder reads in 7 minutes.
Metrics that matter for content marketing
Metrics that matter for food brand content marketing: organic sessions by pillar, recipe rich result impressions in Search Console, organic conversion rate to hero SKU pages, organic-attributed DTC revenue, and top 20 ranking positions by monthly organic sessions. Vanity metrics that do not matter: total pageviews without conversion context, average time on page without conversion attribution, and social share counts. The monthly report skips the vanity block entirely.
Quarterly business review structure
The quarterly business review runs 90 minutes with the founder, head of content, and SEO lead. Agenda: organic traffic trend by pillar, top 10 winning content pieces, top 10 losing content pieces (candidates for refresh or removal), competitive gap analysis against 5 named competitor brands, and next quarter’s content calendar with recipes and ingredient guides queued. According to Ahrefs content marketing research, brands running quarterly content audits outperform brands running annual audits by 40 to 70 percent on organic revenue over a 24-month window.
Internal linking discipline across food brand content
Internal linking discipline across food brand content moves authority from recipe pages toward hero SKU product pages and comparison guides. Every recipe links to the hero SKU it uses inline (once in the ingredient list, once in a bottom call-out card). Every ingredient comparison guide links to 3 to 6 recipes using the winning ingredient plus the hero SKU product page. Every sourcing story links to the 2 to 4 SKUs sourced from that specific farm or cooperative.
Anchor text strategy across recipe hubs
Anchor text on internal links varies across recipe hubs to avoid over-optimization patterns Google penalizes. Exact-match anchor (“single-origin Ethiopian coffee”) runs on 20 to 30 percent of internal links. Partial-match variations (“our Ethiopian roast”) run on 30 to 40 percent. Branded anchors (the SKU name) run on 20 to 30 percent. Generic anchors (“shop the coffee”) fill the remaining 10 to 20 percent. This ratio holds ranking without triggering the over-optimization penalty that shows up on brands that anchor-text-stuff every internal link with the same exact-match keyword. Cross-reference the linking layer on our food and beverage web design page.
Link equity from ingredient guides to SKU pages
Link equity from ingredient guides passes to SKU pages when the guide’s comparison table names the hero SKU in the winning column with a product card, and when the guide’s body links to 3 to 6 recipes that use the winning ingredient. This 3-hop path (guide to recipe to SKU) pushes authority from a high-traffic informational query down to a high-intent transactional page. According to Search Engine Land SEO coverage, informational content that internally links to transactional pages produces 2 to 4 times higher organic revenue than isolated content silos.
Wrapping up content marketing for food brands
Content marketing for food brands is the organic engine that turns a DTC snack, drink, or CPG storefront into a search-driven revenue channel. Recipe hub of 40 to 100 recipes. Ingredient comparison guides at 12 to 24 pieces. Sourcing story pages at 6 to 12 pieces. Buyer intent content at 8 to 16 pieces. Creator syndication calendar with 12 to 30 creators per quarter. Refresh cadence at 12 to 24 months by pillar. Reporting with organic sessions and organic revenue attribution.
If your DTC food brand is running paid social at 20,000 dollars monthly with a broken blog and zero recipe schema, professional content marketing for food brands pays for itself inside the first 90 days on organic traffic captured. Redefine Web ships content marketing inside our monthly retainer packages. Book a call and we will walk through the last three DTC food brands we built recipe hubs for, pillar by pillar.
Anchor text on internal links varies across recipe hubs to avoid over-optimization patterns Google penalizes. Exact-match anchor (“single-origin Ethiopian coffee”) runs on 20 to 30 percent of internal links. Partial-match variations (“our Ethiopian roast”) run on 30 to 40 percent. Branded anchors (the SKU name) run on 20 to 30 percent. Generic anchors (“shop the coffee”) fill the remaining 10 to 20 percent. This ratio holds ranking without triggering the over-optimization penalty that shows up on brands that anchor-text-stuff every internal link with the same exact-match keyword. Cross-reference the linking layer on our food and beverage web design page.
Link equity from ingredient guides to SKU pages
Link equity from ingredient guides passes to SKU pages when the guide’s comparison table names the hero SKU in the winning column with a product card, and when the guide’s body links to 3 to 6 recipes that use the winning ingredient. This 3-hop path (guide to recipe to SKU) pushes authority from a high-traffic informational query down to a high-intent transactional page. According to Search Engine Land SEO coverage, informational content that internally links to transactional pages produces 2 to 4 times higher organic revenue than isolated content silos.
Wrapping up content marketing for food brands
Content marketing for food brands is the organic engine that turns a DTC snack, drink, or CPG storefront into a search-driven revenue channel. Recipe hub of 40 to 100 recipes. Ingredient comparison guides at 12 to 24 pieces. Sourcing story pages at 6 to 12 pieces. Buyer intent content at 8 to 16 pieces. Creator syndication calendar with 12 to 30 creators per quarter. Refresh cadence at 12 to 24 months by pillar. Reporting with organic sessions and organic revenue attribution.
If your DTC food brand is running paid social at 20,000 dollars monthly with a broken blog and zero recipe schema, professional content marketing for food brands pays for itself inside the first 90 days on organic traffic captured. Redefine Web ships content marketing inside our monthly retainer packages. Book a call and we will walk through the last three DTC food brands we built recipe hubs for, pillar by pillar.
Internal linking discipline across food brand content moves authority from recipe pages toward hero SKU product pages and comparison guides. Every recipe links to the hero SKU it uses inline (once in the ingredient list, once in a bottom call-out card). Every ingredient comparison guide links to 3 to 6 recipes using the winning ingredient plus the hero SKU product page. Every sourcing story links to the 2 to 4 SKUs sourced from that specific farm or cooperative.
Anchor text strategy across recipe hubs
Anchor text on internal links varies across recipe hubs to avoid over-optimization patterns Google penalizes. Exact-match anchor (“single-origin Ethiopian coffee”) runs on 20 to 30 percent of internal links. Partial-match variations (“our Ethiopian roast”) run on 30 to 40 percent. Branded anchors (the SKU name) run on 20 to 30 percent. Generic anchors (“shop the coffee”) fill the remaining 10 to 20 percent. This ratio holds ranking without triggering the over-optimization penalty that shows up on brands that anchor-text-stuff every internal link with the same exact-match keyword. Cross-reference the linking layer on our food and beverage web design page.
Link equity from ingredient guides to SKU pages
Link equity from ingredient guides passes to SKU pages when the guide’s comparison table names the hero SKU in the winning column with a product card, and when the guide’s body links to 3 to 6 recipes that use the winning ingredient. This 3-hop path (guide to recipe to SKU) pushes authority from a high-traffic informational query down to a high-intent transactional page. According to Search Engine Land SEO coverage, informational content that internally links to transactional pages produces 2 to 4 times higher organic revenue than isolated content silos.
Wrapping up content marketing for food brands
Content marketing for food brands is the organic engine that turns a DTC snack, drink, or CPG storefront into a search-driven revenue channel. Recipe hub of 40 to 100 recipes. Ingredient comparison guides at 12 to 24 pieces. Sourcing story pages at 6 to 12 pieces. Buyer intent content at 8 to 16 pieces. Creator syndication calendar with 12 to 30 creators per quarter. Refresh cadence at 12 to 24 months by pillar. Reporting with organic sessions and organic revenue attribution.
If your DTC food brand is running paid social at 20,000 dollars monthly with a broken blog and zero recipe schema, professional content marketing for food brands pays for itself inside the first 90 days on organic traffic captured. Redefine Web ships content marketing inside our monthly retainer packages. Book a call and we will walk through the last three DTC food brands we built recipe hubs for, pillar by pillar.
Content marketing for food brands starts with a recipe hub because recipe queries account for 40 to 60 percent of high-intent search volume in the food category. Every hero SKU needs 4 to 12 recipes anchored to it, each targeting a specific occasion and audience.
Skip the recipe hub and the brand loses the search real estate that pulls DTC storefront traffic month over month at zero incremental paid cost. Recipe traffic converts at 2 to 4 percent because the shopper landed with usage intent, not passive discovery, which is why food brands win on recipes.
Recipe schema and Google rich result eligibility
Every recipe page ships schema.org Recipe markup including cookTime, prepTime, recipeIngredient, recipeInstructions, nutrition, and aggregateRating. Correctly marked-up recipes qualify for Google’s recipe rich result carousel that pulls 3 to 6 times higher click-through rate than a plain blue link. The schema layer takes 15 minutes per recipe to author and 30 minutes to validate in Google Search Console. Cross-reference the recipe search stack on our food and beverage SEO page.
Recipe hub structure that scales
The recipe hub structure runs 40 to 100 recipes at maturity, organized by hero SKU (4 to 12 recipes per SKU) plus occasion tags (breakfast, weeknight dinner, meal prep, brunch, holiday). Every recipe links back to the hero SKU product page with the SKU embedded in an inline card. The hub earns internal linking value from ingredient comparison guides and the sourcing story pages, which feeds recipe ranking on Google. According to Google Search Central recipe structured data guidance, complete Recipe schema markup is required for eligibility in the recipe carousel and the ingredient search filter.
Pillar structure for food brand content marketing
The pillar structure on content marketing for food brands runs 4 content pillars concurrently: recipe hub (40 to 100 recipes), ingredient comparison guides (12 to 24 guides), sourcing story pages (6 to 12 pages), and buyer intent content (where to buy, subscription vs. one-time, gift bundle guides). Every pillar covers a distinct search intent and every pillar links back to the hero SKU product pages.
Ingredient comparison guide format
Ingredient comparison guides run 1,800 to 3,200 words comparing 2 to 4 ingredient types on 6 to 10 attributes with a comparison table, real-world use case examples, and links to the hero SKU that uses the specific ingredient. Example: organic vs. conventional oats compares nutritional profile, sourcing chain, cost, environmental impact, and taste on a 6-column table. The brand’s SKU appears in the winning column with a product card. These guides rank 3 to 8 months after publication and pull steady-state organic traffic.
Sourcing story pages that build trust
Sourcing story pages name the specific farms, cooperatives, or suppliers the brand sources from, with photos of the farms, farmer quotes, and specific harvest windows. A coffee brand’s Ethiopian farm page ranks for “single-origin Ethiopian coffee” and “Yirgacheffe coffee origin” plus 40 long-tail variations. The sourcing page pulls trust-building traffic that converts at 4 to 6 percent because the shopper landed pattern-matching on transparency and named provenance. Every sourcing page includes farmer or cooperative quotes, harvest dates, and a link back to 3 to 5 hero SKU pages that source from the named supplier.
Vejrø hospitality content case study
Vejrø Resort, a Danish private-island destination with an on-site restaurant focused on organic, locally sourced cuisine, joined us with strong social engagement and no organic-search real estate. Guests found the resort on Instagram but never in Google search for terms like “private island resort Denmark,” “farm-to-table hospitality Denmark,” or “Vejrø restaurant.” The same organic-search gap shows up on DTC food brands running paid social at 20,000 dollars monthly with a broken blog and zero recipe schema.
We built the conversion-focused website with on-site and off-site SEO tuned to the travel-niche keyword clusters, competitor analysis against comparable boutique resorts, and mobile-first design prioritizing guest discovery. Every page carried the structured data qualifying it for Google’s rich results in the hospitality category. Every internal link pushed authority toward the direct-booking conversion path.
Three months later, Vejrø hit 10,000 plus organic visitors, ranked for 200 plus first-page keywords, and pulled a 2.2 percent booking conversion rate from organic traffic. The same pattern applies to content marketing for food brands: recipe schema, ingredient comparison guides, and sourcing story pages pull organic traffic at 20 to 40 percent conversion into hero SKU pages inside 6 months when the content quality matches search intent and every page carries the right structured data markup. Vejrø also proved out the reporting discipline: every monthly report named the exact page, the exact keyword cluster, and the exact search feature (rich result, sitelinks, image pack) driving the incremental organic revenue instead of hiding behind aggregate traffic charts.
Recipe cadence and content calendar for food brands
Recipe cadence on a working food brand content calendar ships 2 to 4 new recipes per week during the first 6 months and drops to 1 per week at maturity. Each recipe takes 4 to 6 hours to produce (write, test in the kitchen, photograph, schema author, publish). At 3 recipes per week, the brand hits 78 recipes inside 6 months plus a backlog of ingredient comparison and sourcing content queued behind the recipe production line.
| Content pillar | Target volume year 1 | Production cost per piece | Refresh cadence |
|---|---|---|---|
| Recipe hub | 40 to 100 recipes | $180 to $320 | Every 12 months |
| Ingredient comparison guides | 12 to 24 guides | $450 to $780 | Every 18 months |
| Sourcing story pages | 6 to 12 pages | $680 to $1,200 | Every 24 months |
| Buyer intent content | 8 to 16 pieces | $220 to $420 | Every 12 months |
Photography as a content calendar constraint
Photography is the actual constraint on recipe cadence, not writing. Every recipe needs 6 to 12 photos: hero shot, ingredient flat lay, prep in progress, plated result, storage, and step shots for the schema markup. A working food brand batches photography 8 recipes at a time to keep the cost per recipe under 200 dollars. Skip the batching and the per-recipe cost climbs to 400 to 600 dollars, which caps recipe cadence at 1 per week and slows organic ranking timeline by 6 months.
Seasonal content calendar planning
Seasonal content calendar planning maps recipes and comparison guides to the seasonal windows they need to rank in. A Christmas cookie recipe needs to publish in September to rank by early December. A Valentine’s chocolate guide needs to publish in November to rank by early February. A back-to-school lunchbox recipe needs to publish in June to rank by late August. The 60-to-90-day ranking curve dictates the calendar.
Creator syndication inside food brand content
Creator syndication on food brand content marketing amplifies the recipe hub through Instagram Reels, TikTok, and YouTube Shorts creators paid to post their own version of the brand’s hero recipes. The creator content pulls net-new audiences into the recipe hub through the creator’s Link in Bio or Amazon Storefront tag. The syndication calendar names 12 to 30 creators per quarter with specific recipes assigned to each.
One brand we picked up had a spreadsheet titled “creator outreach 2023” with 47 rows and 3 responses. All 3 responses were auto-replies. The spreadsheet named zero recipes and offered flat rates below 100 dollars per post. Nobody posts a 30-second video for 87 dollars flat. Nobody.
Creator content commercial terms that work
Working creator content commercial terms run 350 to 1,500 dollars flat per post plus a 12 to 25 percent commission on tagged sales across a 30-day window. The commission mechanic pulls creators into follow-up posts because the incremental revenue continues past the initial fee. Mid-tier creators (30k to 150k followers) hit the sweet spot for food brand content because their engagement rate typically runs 4 to 8 percent versus 0.8 to 1.6 percent on mega-creators.
Content brief structure for creator partnerships
The content brief structure for creator partnerships runs a single page: the SKU, the specific recipe or usage occasion, 3 required brand mentions, 3 restricted claims (no health claims on non-medical SKUs), the pricing angle, the affiliate link, and 3 example videos that hit the tone. The brief avoids over-scripting because over-scripted creator content underperforms native creator voice by 40 to 60 percent on engagement rate.
Buyer intent content for food brand blogs
Buyer intent content on food brand blogs covers 8 to 16 pieces targeting explicit purchase-decision queries: “where to buy [brand],” “[brand] subscription vs. one-time,” “best [category] for [use case],” and “[brand] gift bundle.” Every buyer intent piece runs 1,400 to 2,400 words with a comparison table, product cards, and a clear conversion path to the specific SKU that matches the query intent. Buyer intent content converts at 3 to 6 percent versus 1 to 2 percent on recipe content because the shopper landed already planning to buy, not exploring a usage occasion.
Where-to-buy content structure
Where-to-buy content structure covers online (DTC storefront, Amazon, Target.com, Whole Foods online), retail (specific chain locators with the store finder embedded), and international (customs limitations, retailer partners abroad). Every piece names specific retailers, links to the store locator, and includes an FAQ block covering shipping availability, subscription options, and gift card compatibility. Where-to-buy content ranks for branded discovery queries the DTC storefront otherwise loses to competitor affiliate reviews.
Subscription versus one-time comparison content
Subscription versus one-time comparison content converts subscription commitments at 3 to 6 percent because it addresses the price-sensitivity concern head-on with a specific math table. The piece covers the discount structure (15 percent lifetime), the skip-a-month mechanic, the pause-anytime rule, the cancellation policy, and the specific yearly savings for the brand’s average consumption cadence. Cross-reference the retention structure on our food and beverage marketing retainer page.
Content refresh cadence on food brand pillars
Content refresh cadence on food brand content pillars runs a rolling audit every 12 to 24 months by pillar. Recipes get refreshed every 12 months with new photography, updated schema, and any nutrition or ingredient adjustments. Ingredient comparison guides refresh every 18 months to update market data. Sourcing story pages refresh every 24 months to reflect farm partnership changes and new harvest angles. Buyer intent content refreshes every 12 months to update retailer availability and pricing.
Recipe refresh priority order
Recipe refresh priority runs by organic traffic rank. The top 20 recipes by monthly organic sessions get refreshed first (new photography, schema audit, related recipe internal links, updated nutrition). The next 40 get refreshed at 15 months. The remaining recipes get refreshed opportunistically when the ranking slips past position 15 in Google. Skipping the refresh cadence lets recipe rankings drift out of the top 3 inside 18 months as newer competitor recipes take the position.
Schema audit checklist per refresh
The schema audit checklist per refresh runs 8 items: Recipe schema completeness, aggregateRating count and accuracy, nutrition data accuracy, prepTime and cookTime match the recipe body, image URLs valid at CDN, related recipe internal links working, product card SKU URL live, and Google Search Console rich result eligibility validated. This checklist takes 20 minutes per recipe and prevents the schema drift that costs recipe rankings 20 to 40 positions quietly.
Reporting cadence for food brand content marketing
Reporting cadence on food brand content marketing runs a monthly executive report plus a quarterly business review. The monthly report ships in the first business week and covers organic sessions by pillar, top 10 ranking recipes with position trend, ingredient guide ranking movements, sourcing page performance, and organic-attributed DTC revenue. Every number carries a comparison to the prior month and a plain-language interpretation the founder reads in 7 minutes.
Metrics that matter for content marketing
Metrics that matter for food brand content marketing: organic sessions by pillar, recipe rich result impressions in Search Console, organic conversion rate to hero SKU pages, organic-attributed DTC revenue, and top 20 ranking positions by monthly organic sessions. Vanity metrics that do not matter: total pageviews without conversion context, average time on page without conversion attribution, and social share counts. The monthly report skips the vanity block entirely.
Quarterly business review structure
The quarterly business review runs 90 minutes with the founder, head of content, and SEO lead. Agenda: organic traffic trend by pillar, top 10 winning content pieces, top 10 losing content pieces (candidates for refresh or removal), competitive gap analysis against 5 named competitor brands, and next quarter’s content calendar with recipes and ingredient guides queued. According to Ahrefs content marketing research, brands running quarterly content audits outperform brands running annual audits by 40 to 70 percent on organic revenue over a 24-month window.
Internal linking discipline across food brand content
Internal linking discipline across food brand content moves authority from recipe pages toward hero SKU product pages and comparison guides. Every recipe links to the hero SKU it uses inline (once in the ingredient list, once in a bottom call-out card). Every ingredient comparison guide links to 3 to 6 recipes using the winning ingredient plus the hero SKU product page. Every sourcing story links to the 2 to 4 SKUs sourced from that specific farm or cooperative.
Anchor text strategy across recipe hubs
Anchor text on internal links varies across recipe hubs to avoid over-optimization patterns Google penalizes. Exact-match anchor (“single-origin Ethiopian coffee”) runs on 20 to 30 percent of internal links. Partial-match variations (“our Ethiopian roast”) run on 30 to 40 percent. Branded anchors (the SKU name) run on 20 to 30 percent. Generic anchors (“shop the coffee”) fill the remaining 10 to 20 percent. This ratio holds ranking without triggering the over-optimization penalty that shows up on brands that anchor-text-stuff every internal link with the same exact-match keyword. Cross-reference the linking layer on our food and beverage web design page.
Link equity from ingredient guides to SKU pages
Link equity from ingredient guides passes to SKU pages when the guide’s comparison table names the hero SKU in the winning column with a product card, and when the guide’s body links to 3 to 6 recipes that use the winning ingredient. This 3-hop path (guide to recipe to SKU) pushes authority from a high-traffic informational query down to a high-intent transactional page. According to Search Engine Land SEO coverage, informational content that internally links to transactional pages produces 2 to 4 times higher organic revenue than isolated content silos.
Wrapping up content marketing for food brands
Content marketing for food brands is the organic engine that turns a DTC snack, drink, or CPG storefront into a search-driven revenue channel. Recipe hub of 40 to 100 recipes. Ingredient comparison guides at 12 to 24 pieces. Sourcing story pages at 6 to 12 pieces. Buyer intent content at 8 to 16 pieces. Creator syndication calendar with 12 to 30 creators per quarter. Refresh cadence at 12 to 24 months by pillar. Reporting with organic sessions and organic revenue attribution.
If your DTC food brand is running paid social at 20,000 dollars monthly with a broken blog and zero recipe schema, professional content marketing for food brands pays for itself inside the first 90 days on organic traffic captured. Redefine Web ships content marketing inside our monthly retainer packages. Book a call and we will walk through the last three DTC food brands we built recipe hubs for, pillar by pillar.
Content marketing for food brands starts with a recipe hub because recipe queries account for 40 to 60 percent of high-intent search volume in the food category. Every hero SKU needs 4 to 12 recipes anchored to it, each targeting a specific occasion and audience.
Skip the recipe hub and the brand loses the search real estate that pulls DTC storefront traffic month over month at zero incremental paid cost. Recipe traffic converts at 2 to 4 percent because the shopper landed with usage intent, not passive discovery, which is why food brands win on recipes.
Recipe schema and Google rich result eligibility
Every recipe page ships schema.org Recipe markup including cookTime, prepTime, recipeIngredient, recipeInstructions, nutrition, and aggregateRating. Correctly marked-up recipes qualify for Google’s recipe rich result carousel that pulls 3 to 6 times higher click-through rate than a plain blue link. The schema layer takes 15 minutes per recipe to author and 30 minutes to validate in Google Search Console. Cross-reference the recipe search stack on our food and beverage SEO page.
Recipe hub structure that scales
The recipe hub structure runs 40 to 100 recipes at maturity, organized by hero SKU (4 to 12 recipes per SKU) plus occasion tags (breakfast, weeknight dinner, meal prep, brunch, holiday). Every recipe links back to the hero SKU product page with the SKU embedded in an inline card. The hub earns internal linking value from ingredient comparison guides and the sourcing story pages, which feeds recipe ranking on Google. According to Google Search Central recipe structured data guidance, complete Recipe schema markup is required for eligibility in the recipe carousel and the ingredient search filter.
Pillar structure for food brand content marketing
The pillar structure on content marketing for food brands runs 4 content pillars concurrently: recipe hub (40 to 100 recipes), ingredient comparison guides (12 to 24 guides), sourcing story pages (6 to 12 pages), and buyer intent content (where to buy, subscription vs. one-time, gift bundle guides). Every pillar covers a distinct search intent and every pillar links back to the hero SKU product pages.
Ingredient comparison guide format
Ingredient comparison guides run 1,800 to 3,200 words comparing 2 to 4 ingredient types on 6 to 10 attributes with a comparison table, real-world use case examples, and links to the hero SKU that uses the specific ingredient. Example: organic vs. conventional oats compares nutritional profile, sourcing chain, cost, environmental impact, and taste on a 6-column table. The brand’s SKU appears in the winning column with a product card. These guides rank 3 to 8 months after publication and pull steady-state organic traffic.
Sourcing story pages that build trust
Sourcing story pages name the specific farms, cooperatives, or suppliers the brand sources from, with photos of the farms, farmer quotes, and specific harvest windows. A coffee brand’s Ethiopian farm page ranks for “single-origin Ethiopian coffee” and “Yirgacheffe coffee origin” plus 40 long-tail variations. The sourcing page pulls trust-building traffic that converts at 4 to 6 percent because the shopper landed pattern-matching on transparency and named provenance. Every sourcing page includes farmer or cooperative quotes, harvest dates, and a link back to 3 to 5 hero SKU pages that source from the named supplier.
Vejrø hospitality content case study
Vejrø Resort, a Danish private-island destination with an on-site restaurant focused on organic, locally sourced cuisine, joined us with strong social engagement and no organic-search real estate. Guests found the resort on Instagram but never in Google search for terms like “private island resort Denmark,” “farm-to-table hospitality Denmark,” or “Vejrø restaurant.” The same organic-search gap shows up on DTC food brands running paid social at 20,000 dollars monthly with a broken blog and zero recipe schema.
We built the conversion-focused website with on-site and off-site SEO tuned to the travel-niche keyword clusters, competitor analysis against comparable boutique resorts, and mobile-first design prioritizing guest discovery. Every page carried the structured data qualifying it for Google’s rich results in the hospitality category. Every internal link pushed authority toward the direct-booking conversion path.
Three months later, Vejrø hit 10,000 plus organic visitors, ranked for 200 plus first-page keywords, and pulled a 2.2 percent booking conversion rate from organic traffic. The same pattern applies to content marketing for food brands: recipe schema, ingredient comparison guides, and sourcing story pages pull organic traffic at 20 to 40 percent conversion into hero SKU pages inside 6 months when the content quality matches search intent and every page carries the right structured data markup. Vejrø also proved out the reporting discipline: every monthly report named the exact page, the exact keyword cluster, and the exact search feature (rich result, sitelinks, image pack) driving the incremental organic revenue instead of hiding behind aggregate traffic charts.
Recipe cadence and content calendar for food brands
Recipe cadence on a working food brand content calendar ships 2 to 4 new recipes per week during the first 6 months and drops to 1 per week at maturity. Each recipe takes 4 to 6 hours to produce (write, test in the kitchen, photograph, schema author, publish). At 3 recipes per week, the brand hits 78 recipes inside 6 months plus a backlog of ingredient comparison and sourcing content queued behind the recipe production line.
| Content pillar | Target volume year 1 | Production cost per piece | Refresh cadence |
|---|---|---|---|
| Recipe hub | 40 to 100 recipes | $180 to $320 | Every 12 months |
| Ingredient comparison guides | 12 to 24 guides | $450 to $780 | Every 18 months |
| Sourcing story pages | 6 to 12 pages | $680 to $1,200 | Every 24 months |
| Buyer intent content | 8 to 16 pieces | $220 to $420 | Every 12 months |
Photography as a content calendar constraint
Photography is the actual constraint on recipe cadence, not writing. Every recipe needs 6 to 12 photos: hero shot, ingredient flat lay, prep in progress, plated result, storage, and step shots for the schema markup. A working food brand batches photography 8 recipes at a time to keep the cost per recipe under 200 dollars. Skip the batching and the per-recipe cost climbs to 400 to 600 dollars, which caps recipe cadence at 1 per week and slows organic ranking timeline by 6 months.
Seasonal content calendar planning
Seasonal content calendar planning maps recipes and comparison guides to the seasonal windows they need to rank in. A Christmas cookie recipe needs to publish in September to rank by early December. A Valentine’s chocolate guide needs to publish in November to rank by early February. A back-to-school lunchbox recipe needs to publish in June to rank by late August. The 60-to-90-day ranking curve dictates the calendar.
Creator syndication inside food brand content
Creator syndication on food brand content marketing amplifies the recipe hub through Instagram Reels, TikTok, and YouTube Shorts creators paid to post their own version of the brand’s hero recipes. The creator content pulls net-new audiences into the recipe hub through the creator’s Link in Bio or Amazon Storefront tag. The syndication calendar names 12 to 30 creators per quarter with specific recipes assigned to each.
One brand we picked up had a spreadsheet titled “creator outreach 2023” with 47 rows and 3 responses. All 3 responses were auto-replies. The spreadsheet named zero recipes and offered flat rates below 100 dollars per post. Nobody posts a 30-second video for 87 dollars flat. Nobody.
Creator content commercial terms that work
Working creator content commercial terms run 350 to 1,500 dollars flat per post plus a 12 to 25 percent commission on tagged sales across a 30-day window. The commission mechanic pulls creators into follow-up posts because the incremental revenue continues past the initial fee. Mid-tier creators (30k to 150k followers) hit the sweet spot for food brand content because their engagement rate typically runs 4 to 8 percent versus 0.8 to 1.6 percent on mega-creators.
Content brief structure for creator partnerships
The content brief structure for creator partnerships runs a single page: the SKU, the specific recipe or usage occasion, 3 required brand mentions, 3 restricted claims (no health claims on non-medical SKUs), the pricing angle, the affiliate link, and 3 example videos that hit the tone. The brief avoids over-scripting because over-scripted creator content underperforms native creator voice by 40 to 60 percent on engagement rate.
Buyer intent content for food brand blogs
Buyer intent content on food brand blogs covers 8 to 16 pieces targeting explicit purchase-decision queries: “where to buy [brand],” “[brand] subscription vs. one-time,” “best [category] for [use case],” and “[brand] gift bundle.” Every buyer intent piece runs 1,400 to 2,400 words with a comparison table, product cards, and a clear conversion path to the specific SKU that matches the query intent. Buyer intent content converts at 3 to 6 percent versus 1 to 2 percent on recipe content because the shopper landed already planning to buy, not exploring a usage occasion.
Where-to-buy content structure
Where-to-buy content structure covers online (DTC storefront, Amazon, Target.com, Whole Foods online), retail (specific chain locators with the store finder embedded), and international (customs limitations, retailer partners abroad). Every piece names specific retailers, links to the store locator, and includes an FAQ block covering shipping availability, subscription options, and gift card compatibility. Where-to-buy content ranks for branded discovery queries the DTC storefront otherwise loses to competitor affiliate reviews.
Subscription versus one-time comparison content
Subscription versus one-time comparison content converts subscription commitments at 3 to 6 percent because it addresses the price-sensitivity concern head-on with a specific math table. The piece covers the discount structure (15 percent lifetime), the skip-a-month mechanic, the pause-anytime rule, the cancellation policy, and the specific yearly savings for the brand’s average consumption cadence. Cross-reference the retention structure on our food and beverage marketing retainer page.
Content refresh cadence on food brand pillars
Content refresh cadence on food brand content pillars runs a rolling audit every 12 to 24 months by pillar. Recipes get refreshed every 12 months with new photography, updated schema, and any nutrition or ingredient adjustments. Ingredient comparison guides refresh every 18 months to update market data. Sourcing story pages refresh every 24 months to reflect farm partnership changes and new harvest angles. Buyer intent content refreshes every 12 months to update retailer availability and pricing.
Recipe refresh priority order
Recipe refresh priority runs by organic traffic rank. The top 20 recipes by monthly organic sessions get refreshed first (new photography, schema audit, related recipe internal links, updated nutrition). The next 40 get refreshed at 15 months. The remaining recipes get refreshed opportunistically when the ranking slips past position 15 in Google. Skipping the refresh cadence lets recipe rankings drift out of the top 3 inside 18 months as newer competitor recipes take the position.
Schema audit checklist per refresh
The schema audit checklist per refresh runs 8 items: Recipe schema completeness, aggregateRating count and accuracy, nutrition data accuracy, prepTime and cookTime match the recipe body, image URLs valid at CDN, related recipe internal links working, product card SKU URL live, and Google Search Console rich result eligibility validated. This checklist takes 20 minutes per recipe and prevents the schema drift that costs recipe rankings 20 to 40 positions quietly.
Reporting cadence for food brand content marketing
Reporting cadence on food brand content marketing runs a monthly executive report plus a quarterly business review. The monthly report ships in the first business week and covers organic sessions by pillar, top 10 ranking recipes with position trend, ingredient guide ranking movements, sourcing page performance, and organic-attributed DTC revenue. Every number carries a comparison to the prior month and a plain-language interpretation the founder reads in 7 minutes.
Metrics that matter for content marketing
Metrics that matter for food brand content marketing: organic sessions by pillar, recipe rich result impressions in Search Console, organic conversion rate to hero SKU pages, organic-attributed DTC revenue, and top 20 ranking positions by monthly organic sessions. Vanity metrics that do not matter: total pageviews without conversion context, average time on page without conversion attribution, and social share counts. The monthly report skips the vanity block entirely.
Quarterly business review structure
The quarterly business review runs 90 minutes with the founder, head of content, and SEO lead. Agenda: organic traffic trend by pillar, top 10 winning content pieces, top 10 losing content pieces (candidates for refresh or removal), competitive gap analysis against 5 named competitor brands, and next quarter’s content calendar with recipes and ingredient guides queued. According to Ahrefs content marketing research, brands running quarterly content audits outperform brands running annual audits by 40 to 70 percent on organic revenue over a 24-month window.
Internal linking discipline across food brand content
Internal linking discipline across food brand content moves authority from recipe pages toward hero SKU product pages and comparison guides. Every recipe links to the hero SKU it uses inline (once in the ingredient list, once in a bottom call-out card). Every ingredient comparison guide links to 3 to 6 recipes using the winning ingredient plus the hero SKU product page. Every sourcing story links to the 2 to 4 SKUs sourced from that specific farm or cooperative.
Anchor text strategy across recipe hubs
Anchor text on internal links varies across recipe hubs to avoid over-optimization patterns Google penalizes. Exact-match anchor (“single-origin Ethiopian coffee”) runs on 20 to 30 percent of internal links. Partial-match variations (“our Ethiopian roast”) run on 30 to 40 percent. Branded anchors (the SKU name) run on 20 to 30 percent. Generic anchors (“shop the coffee”) fill the remaining 10 to 20 percent. This ratio holds ranking without triggering the over-optimization penalty that shows up on brands that anchor-text-stuff every internal link with the same exact-match keyword. Cross-reference the linking layer on our food and beverage web design page.
Link equity from ingredient guides to SKU pages
Link equity from ingredient guides passes to SKU pages when the guide’s comparison table names the hero SKU in the winning column with a product card, and when the guide’s body links to 3 to 6 recipes that use the winning ingredient. This 3-hop path (guide to recipe to SKU) pushes authority from a high-traffic informational query down to a high-intent transactional page. According to Search Engine Land SEO coverage, informational content that internally links to transactional pages produces 2 to 4 times higher organic revenue than isolated content silos.
Wrapping up content marketing for food brands
Content marketing for food brands is the organic engine that turns a DTC snack, drink, or CPG storefront into a search-driven revenue channel. Recipe hub of 40 to 100 recipes. Ingredient comparison guides at 12 to 24 pieces. Sourcing story pages at 6 to 12 pieces. Buyer intent content at 8 to 16 pieces. Creator syndication calendar with 12 to 30 creators per quarter. Refresh cadence at 12 to 24 months by pillar. Reporting with organic sessions and organic revenue attribution.
If your DTC food brand is running paid social at 20,000 dollars monthly with a broken blog and zero recipe schema, professional content marketing for food brands pays for itself inside the first 90 days on organic traffic captured. Redefine Web ships content marketing inside our monthly retainer packages. Book a call and we will walk through the last three DTC food brands we built recipe hubs for, pillar by pillar.
Content marketing for food brands starts with a recipe hub because recipe queries account for 40 to 60 percent of high-intent search volume in the food category. Every hero SKU needs 4 to 12 recipes anchored to it, each targeting a specific occasion and audience.
Skip the recipe hub and the brand loses the search real estate that pulls DTC storefront traffic month over month at zero incremental paid cost. Recipe traffic converts at 2 to 4 percent because the shopper landed with usage intent, not passive discovery, which is why food brands win on recipes.
Recipe schema and Google rich result eligibility
Every recipe page ships schema.org Recipe markup including cookTime, prepTime, recipeIngredient, recipeInstructions, nutrition, and aggregateRating. Correctly marked-up recipes qualify for Google’s recipe rich result carousel that pulls 3 to 6 times higher click-through rate than a plain blue link. The schema layer takes 15 minutes per recipe to author and 30 minutes to validate in Google Search Console. Cross-reference the recipe search stack on our food and beverage SEO page.
Recipe hub structure that scales
The recipe hub structure runs 40 to 100 recipes at maturity, organized by hero SKU (4 to 12 recipes per SKU) plus occasion tags (breakfast, weeknight dinner, meal prep, brunch, holiday). Every recipe links back to the hero SKU product page with the SKU embedded in an inline card. The hub earns internal linking value from ingredient comparison guides and the sourcing story pages, which feeds recipe ranking on Google. According to Google Search Central recipe structured data guidance, complete Recipe schema markup is required for eligibility in the recipe carousel and the ingredient search filter.
Pillar structure for food brand content marketing
The pillar structure on content marketing for food brands runs 4 content pillars concurrently: recipe hub (40 to 100 recipes), ingredient comparison guides (12 to 24 guides), sourcing story pages (6 to 12 pages), and buyer intent content (where to buy, subscription vs. one-time, gift bundle guides). Every pillar covers a distinct search intent and every pillar links back to the hero SKU product pages.
Ingredient comparison guide format
Ingredient comparison guides run 1,800 to 3,200 words comparing 2 to 4 ingredient types on 6 to 10 attributes with a comparison table, real-world use case examples, and links to the hero SKU that uses the specific ingredient. Example: organic vs. conventional oats compares nutritional profile, sourcing chain, cost, environmental impact, and taste on a 6-column table. The brand’s SKU appears in the winning column with a product card. These guides rank 3 to 8 months after publication and pull steady-state organic traffic.
Sourcing story pages that build trust
Sourcing story pages name the specific farms, cooperatives, or suppliers the brand sources from, with photos of the farms, farmer quotes, and specific harvest windows. A coffee brand’s Ethiopian farm page ranks for “single-origin Ethiopian coffee” and “Yirgacheffe coffee origin” plus 40 long-tail variations. The sourcing page pulls trust-building traffic that converts at 4 to 6 percent because the shopper landed pattern-matching on transparency and named provenance. Every sourcing page includes farmer or cooperative quotes, harvest dates, and a link back to 3 to 5 hero SKU pages that source from the named supplier.
Vejrø hospitality content case study
Vejrø Resort, a Danish private-island destination with an on-site restaurant focused on organic, locally sourced cuisine, joined us with strong social engagement and no organic-search real estate. Guests found the resort on Instagram but never in Google search for terms like “private island resort Denmark,” “farm-to-table hospitality Denmark,” or “Vejrø restaurant.” The same organic-search gap shows up on DTC food brands running paid social at 20,000 dollars monthly with a broken blog and zero recipe schema.
We built the conversion-focused website with on-site and off-site SEO tuned to the travel-niche keyword clusters, competitor analysis against comparable boutique resorts, and mobile-first design prioritizing guest discovery. Every page carried the structured data qualifying it for Google’s rich results in the hospitality category. Every internal link pushed authority toward the direct-booking conversion path.
Three months later, Vejrø hit 10,000 plus organic visitors, ranked for 200 plus first-page keywords, and pulled a 2.2 percent booking conversion rate from organic traffic. The same pattern applies to content marketing for food brands: recipe schema, ingredient comparison guides, and sourcing story pages pull organic traffic at 20 to 40 percent conversion into hero SKU pages inside 6 months when the content quality matches search intent and every page carries the right structured data markup. Vejrø also proved out the reporting discipline: every monthly report named the exact page, the exact keyword cluster, and the exact search feature (rich result, sitelinks, image pack) driving the incremental organic revenue instead of hiding behind aggregate traffic charts.
Recipe cadence and content calendar for food brands
Recipe cadence on a working food brand content calendar ships 2 to 4 new recipes per week during the first 6 months and drops to 1 per week at maturity. Each recipe takes 4 to 6 hours to produce (write, test in the kitchen, photograph, schema author, publish). At 3 recipes per week, the brand hits 78 recipes inside 6 months plus a backlog of ingredient comparison and sourcing content queued behind the recipe production line.
| Content pillar | Target volume year 1 | Production cost per piece | Refresh cadence |
|---|---|---|---|
| Recipe hub | 40 to 100 recipes | $180 to $320 | Every 12 months |
| Ingredient comparison guides | 12 to 24 guides | $450 to $780 | Every 18 months |
| Sourcing story pages | 6 to 12 pages | $680 to $1,200 | Every 24 months |
| Buyer intent content | 8 to 16 pieces | $220 to $420 | Every 12 months |
Photography as a content calendar constraint
Photography is the actual constraint on recipe cadence, not writing. Every recipe needs 6 to 12 photos: hero shot, ingredient flat lay, prep in progress, plated result, storage, and step shots for the schema markup. A working food brand batches photography 8 recipes at a time to keep the cost per recipe under 200 dollars. Skip the batching and the per-recipe cost climbs to 400 to 600 dollars, which caps recipe cadence at 1 per week and slows organic ranking timeline by 6 months.
Seasonal content calendar planning
Seasonal content calendar planning maps recipes and comparison guides to the seasonal windows they need to rank in. A Christmas cookie recipe needs to publish in September to rank by early December. A Valentine’s chocolate guide needs to publish in November to rank by early February. A back-to-school lunchbox recipe needs to publish in June to rank by late August. The 60-to-90-day ranking curve dictates the calendar.
Creator syndication inside food brand content
Creator syndication on food brand content marketing amplifies the recipe hub through Instagram Reels, TikTok, and YouTube Shorts creators paid to post their own version of the brand’s hero recipes. The creator content pulls net-new audiences into the recipe hub through the creator’s Link in Bio or Amazon Storefront tag. The syndication calendar names 12 to 30 creators per quarter with specific recipes assigned to each.
One brand we picked up had a spreadsheet titled “creator outreach 2023” with 47 rows and 3 responses. All 3 responses were auto-replies. The spreadsheet named zero recipes and offered flat rates below 100 dollars per post. Nobody posts a 30-second video for 87 dollars flat. Nobody.
Creator content commercial terms that work
Working creator content commercial terms run 350 to 1,500 dollars flat per post plus a 12 to 25 percent commission on tagged sales across a 30-day window. The commission mechanic pulls creators into follow-up posts because the incremental revenue continues past the initial fee. Mid-tier creators (30k to 150k followers) hit the sweet spot for food brand content because their engagement rate typically runs 4 to 8 percent versus 0.8 to 1.6 percent on mega-creators.
Content brief structure for creator partnerships
The content brief structure for creator partnerships runs a single page: the SKU, the specific recipe or usage occasion, 3 required brand mentions, 3 restricted claims (no health claims on non-medical SKUs), the pricing angle, the affiliate link, and 3 example videos that hit the tone. The brief avoids over-scripting because over-scripted creator content underperforms native creator voice by 40 to 60 percent on engagement rate.
Buyer intent content for food brand blogs
Buyer intent content on food brand blogs covers 8 to 16 pieces targeting explicit purchase-decision queries: “where to buy [brand],” “[brand] subscription vs. one-time,” “best [category] for [use case],” and “[brand] gift bundle.” Every buyer intent piece runs 1,400 to 2,400 words with a comparison table, product cards, and a clear conversion path to the specific SKU that matches the query intent. Buyer intent content converts at 3 to 6 percent versus 1 to 2 percent on recipe content because the shopper landed already planning to buy, not exploring a usage occasion.
Where-to-buy content structure
Where-to-buy content structure covers online (DTC storefront, Amazon, Target.com, Whole Foods online), retail (specific chain locators with the store finder embedded), and international (customs limitations, retailer partners abroad). Every piece names specific retailers, links to the store locator, and includes an FAQ block covering shipping availability, subscription options, and gift card compatibility. Where-to-buy content ranks for branded discovery queries the DTC storefront otherwise loses to competitor affiliate reviews.
Subscription versus one-time comparison content
Subscription versus one-time comparison content converts subscription commitments at 3 to 6 percent because it addresses the price-sensitivity concern head-on with a specific math table. The piece covers the discount structure (15 percent lifetime), the skip-a-month mechanic, the pause-anytime rule, the cancellation policy, and the specific yearly savings for the brand’s average consumption cadence. Cross-reference the retention structure on our food and beverage marketing retainer page.
Content refresh cadence on food brand pillars
Content refresh cadence on food brand content pillars runs a rolling audit every 12 to 24 months by pillar. Recipes get refreshed every 12 months with new photography, updated schema, and any nutrition or ingredient adjustments. Ingredient comparison guides refresh every 18 months to update market data. Sourcing story pages refresh every 24 months to reflect farm partnership changes and new harvest angles. Buyer intent content refreshes every 12 months to update retailer availability and pricing.
Recipe refresh priority order
Recipe refresh priority runs by organic traffic rank. The top 20 recipes by monthly organic sessions get refreshed first (new photography, schema audit, related recipe internal links, updated nutrition). The next 40 get refreshed at 15 months. The remaining recipes get refreshed opportunistically when the ranking slips past position 15 in Google. Skipping the refresh cadence lets recipe rankings drift out of the top 3 inside 18 months as newer competitor recipes take the position.
Schema audit checklist per refresh
The schema audit checklist per refresh runs 8 items: Recipe schema completeness, aggregateRating count and accuracy, nutrition data accuracy, prepTime and cookTime match the recipe body, image URLs valid at CDN, related recipe internal links working, product card SKU URL live, and Google Search Console rich result eligibility validated. This checklist takes 20 minutes per recipe and prevents the schema drift that costs recipe rankings 20 to 40 positions quietly.
Reporting cadence for food brand content marketing
Reporting cadence on food brand content marketing runs a monthly executive report plus a quarterly business review. The monthly report ships in the first business week and covers organic sessions by pillar, top 10 ranking recipes with position trend, ingredient guide ranking movements, sourcing page performance, and organic-attributed DTC revenue. Every number carries a comparison to the prior month and a plain-language interpretation the founder reads in 7 minutes.
Metrics that matter for content marketing
Metrics that matter for food brand content marketing: organic sessions by pillar, recipe rich result impressions in Search Console, organic conversion rate to hero SKU pages, organic-attributed DTC revenue, and top 20 ranking positions by monthly organic sessions. Vanity metrics that do not matter: total pageviews without conversion context, average time on page without conversion attribution, and social share counts. The monthly report skips the vanity block entirely.
Quarterly business review structure
The quarterly business review runs 90 minutes with the founder, head of content, and SEO lead. Agenda: organic traffic trend by pillar, top 10 winning content pieces, top 10 losing content pieces (candidates for refresh or removal), competitive gap analysis against 5 named competitor brands, and next quarter’s content calendar with recipes and ingredient guides queued. According to Ahrefs content marketing research, brands running quarterly content audits outperform brands running annual audits by 40 to 70 percent on organic revenue over a 24-month window.
Internal linking discipline across food brand content
Internal linking discipline across food brand content moves authority from recipe pages toward hero SKU product pages and comparison guides. Every recipe links to the hero SKU it uses inline (once in the ingredient list, once in a bottom call-out card). Every ingredient comparison guide links to 3 to 6 recipes using the winning ingredient plus the hero SKU product page. Every sourcing story links to the 2 to 4 SKUs sourced from that specific farm or cooperative.
Anchor text strategy across recipe hubs
Anchor text on internal links varies across recipe hubs to avoid over-optimization patterns Google penalizes. Exact-match anchor (“single-origin Ethiopian coffee”) runs on 20 to 30 percent of internal links. Partial-match variations (“our Ethiopian roast”) run on 30 to 40 percent. Branded anchors (the SKU name) run on 20 to 30 percent. Generic anchors (“shop the coffee”) fill the remaining 10 to 20 percent. This ratio holds ranking without triggering the over-optimization penalty that shows up on brands that anchor-text-stuff every internal link with the same exact-match keyword. Cross-reference the linking layer on our food and beverage web design page.
Link equity from ingredient guides to SKU pages
Link equity from ingredient guides passes to SKU pages when the guide’s comparison table names the hero SKU in the winning column with a product card, and when the guide’s body links to 3 to 6 recipes that use the winning ingredient. This 3-hop path (guide to recipe to SKU) pushes authority from a high-traffic informational query down to a high-intent transactional page. According to Search Engine Land SEO coverage, informational content that internally links to transactional pages produces 2 to 4 times higher organic revenue than isolated content silos.
Wrapping up content marketing for food brands
Content marketing for food brands is the organic engine that turns a DTC snack, drink, or CPG storefront into a search-driven revenue channel. Recipe hub of 40 to 100 recipes. Ingredient comparison guides at 12 to 24 pieces. Sourcing story pages at 6 to 12 pieces. Buyer intent content at 8 to 16 pieces. Creator syndication calendar with 12 to 30 creators per quarter. Refresh cadence at 12 to 24 months by pillar. Reporting with organic sessions and organic revenue attribution.
If your DTC food brand is running paid social at 20,000 dollars monthly with a broken blog and zero recipe schema, professional content marketing for food brands pays for itself inside the first 90 days on organic traffic captured. Redefine Web ships content marketing inside our monthly retainer packages. Book a call and we will walk through the last three DTC food brands we built recipe hubs for, pillar by pillar.
Content marketing for food brands starts with a recipe hub because recipe queries account for 40 to 60 percent of high-intent search volume in the food category. Every hero SKU needs 4 to 12 recipes anchored to it, each targeting a specific occasion and audience.
Skip the recipe hub and the brand loses the search real estate that pulls DTC storefront traffic month over month at zero incremental paid cost. Recipe traffic converts at 2 to 4 percent because the shopper landed with usage intent, not passive discovery, which is why food brands win on recipes.
Recipe schema and Google rich result eligibility
Every recipe page ships schema.org Recipe markup including cookTime, prepTime, recipeIngredient, recipeInstructions, nutrition, and aggregateRating. Correctly marked-up recipes qualify for Google’s recipe rich result carousel that pulls 3 to 6 times higher click-through rate than a plain blue link. The schema layer takes 15 minutes per recipe to author and 30 minutes to validate in Google Search Console. Cross-reference the recipe search stack on our food and beverage SEO page.
Recipe hub structure that scales
The recipe hub structure runs 40 to 100 recipes at maturity, organized by hero SKU (4 to 12 recipes per SKU) plus occasion tags (breakfast, weeknight dinner, meal prep, brunch, holiday). Every recipe links back to the hero SKU product page with the SKU embedded in an inline card. The hub earns internal linking value from ingredient comparison guides and the sourcing story pages, which feeds recipe ranking on Google. According to Google Search Central recipe structured data guidance, complete Recipe schema markup is required for eligibility in the recipe carousel and the ingredient search filter.
Pillar structure for food brand content marketing
The pillar structure on content marketing for food brands runs 4 content pillars concurrently: recipe hub (40 to 100 recipes), ingredient comparison guides (12 to 24 guides), sourcing story pages (6 to 12 pages), and buyer intent content (where to buy, subscription vs. one-time, gift bundle guides). Every pillar covers a distinct search intent and every pillar links back to the hero SKU product pages.
Ingredient comparison guide format
Ingredient comparison guides run 1,800 to 3,200 words comparing 2 to 4 ingredient types on 6 to 10 attributes with a comparison table, real-world use case examples, and links to the hero SKU that uses the specific ingredient. Example: organic vs. conventional oats compares nutritional profile, sourcing chain, cost, environmental impact, and taste on a 6-column table. The brand’s SKU appears in the winning column with a product card. These guides rank 3 to 8 months after publication and pull steady-state organic traffic.
Sourcing story pages that build trust
Sourcing story pages name the specific farms, cooperatives, or suppliers the brand sources from, with photos of the farms, farmer quotes, and specific harvest windows. A coffee brand’s Ethiopian farm page ranks for “single-origin Ethiopian coffee” and “Yirgacheffe coffee origin” plus 40 long-tail variations. The sourcing page pulls trust-building traffic that converts at 4 to 6 percent because the shopper landed pattern-matching on transparency and named provenance. Every sourcing page includes farmer or cooperative quotes, harvest dates, and a link back to 3 to 5 hero SKU pages that source from the named supplier.
Vejrø hospitality content case study
Vejrø Resort, a Danish private-island destination with an on-site restaurant focused on organic, locally sourced cuisine, joined us with strong social engagement and no organic-search real estate. Guests found the resort on Instagram but never in Google search for terms like “private island resort Denmark,” “farm-to-table hospitality Denmark,” or “Vejrø restaurant.” The same organic-search gap shows up on DTC food brands running paid social at 20,000 dollars monthly with a broken blog and zero recipe schema.
We built the conversion-focused website with on-site and off-site SEO tuned to the travel-niche keyword clusters, competitor analysis against comparable boutique resorts, and mobile-first design prioritizing guest discovery. Every page carried the structured data qualifying it for Google’s rich results in the hospitality category. Every internal link pushed authority toward the direct-booking conversion path.
Three months later, Vejrø hit 10,000 plus organic visitors, ranked for 200 plus first-page keywords, and pulled a 2.2 percent booking conversion rate from organic traffic. The same pattern applies to content marketing for food brands: recipe schema, ingredient comparison guides, and sourcing story pages pull organic traffic at 20 to 40 percent conversion into hero SKU pages inside 6 months when the content quality matches search intent and every page carries the right structured data markup. Vejrø also proved out the reporting discipline: every monthly report named the exact page, the exact keyword cluster, and the exact search feature (rich result, sitelinks, image pack) driving the incremental organic revenue instead of hiding behind aggregate traffic charts.
Recipe cadence and content calendar for food brands
Recipe cadence on a working food brand content calendar ships 2 to 4 new recipes per week during the first 6 months and drops to 1 per week at maturity. Each recipe takes 4 to 6 hours to produce (write, test in the kitchen, photograph, schema author, publish). At 3 recipes per week, the brand hits 78 recipes inside 6 months plus a backlog of ingredient comparison and sourcing content queued behind the recipe production line.
| Content pillar | Target volume year 1 | Production cost per piece | Refresh cadence |
|---|---|---|---|
| Recipe hub | 40 to 100 recipes | $180 to $320 | Every 12 months |
| Ingredient comparison guides | 12 to 24 guides | $450 to $780 | Every 18 months |
| Sourcing story pages | 6 to 12 pages | $680 to $1,200 | Every 24 months |
| Buyer intent content | 8 to 16 pieces | $220 to $420 | Every 12 months |
Photography as a content calendar constraint
Photography is the actual constraint on recipe cadence, not writing. Every recipe needs 6 to 12 photos: hero shot, ingredient flat lay, prep in progress, plated result, storage, and step shots for the schema markup. A working food brand batches photography 8 recipes at a time to keep the cost per recipe under 200 dollars. Skip the batching and the per-recipe cost climbs to 400 to 600 dollars, which caps recipe cadence at 1 per week and slows organic ranking timeline by 6 months.
Seasonal content calendar planning
Seasonal content calendar planning maps recipes and comparison guides to the seasonal windows they need to rank in. A Christmas cookie recipe needs to publish in September to rank by early December. A Valentine’s chocolate guide needs to publish in November to rank by early February. A back-to-school lunchbox recipe needs to publish in June to rank by late August. The 60-to-90-day ranking curve dictates the calendar.
Creator syndication inside food brand content
Creator syndication on food brand content marketing amplifies the recipe hub through Instagram Reels, TikTok, and YouTube Shorts creators paid to post their own version of the brand’s hero recipes. The creator content pulls net-new audiences into the recipe hub through the creator’s Link in Bio or Amazon Storefront tag. The syndication calendar names 12 to 30 creators per quarter with specific recipes assigned to each.
One brand we picked up had a spreadsheet titled “creator outreach 2023” with 47 rows and 3 responses. All 3 responses were auto-replies. The spreadsheet named zero recipes and offered flat rates below 100 dollars per post. Nobody posts a 30-second video for 87 dollars flat. Nobody.
Creator content commercial terms that work
Working creator content commercial terms run 350 to 1,500 dollars flat per post plus a 12 to 25 percent commission on tagged sales across a 30-day window. The commission mechanic pulls creators into follow-up posts because the incremental revenue continues past the initial fee. Mid-tier creators (30k to 150k followers) hit the sweet spot for food brand content because their engagement rate typically runs 4 to 8 percent versus 0.8 to 1.6 percent on mega-creators.
Content brief structure for creator partnerships
The content brief structure for creator partnerships runs a single page: the SKU, the specific recipe or usage occasion, 3 required brand mentions, 3 restricted claims (no health claims on non-medical SKUs), the pricing angle, the affiliate link, and 3 example videos that hit the tone. The brief avoids over-scripting because over-scripted creator content underperforms native creator voice by 40 to 60 percent on engagement rate.
Buyer intent content for food brand blogs
Buyer intent content on food brand blogs covers 8 to 16 pieces targeting explicit purchase-decision queries: “where to buy [brand],” “[brand] subscription vs. one-time,” “best [category] for [use case],” and “[brand] gift bundle.” Every buyer intent piece runs 1,400 to 2,400 words with a comparison table, product cards, and a clear conversion path to the specific SKU that matches the query intent. Buyer intent content converts at 3 to 6 percent versus 1 to 2 percent on recipe content because the shopper landed already planning to buy, not exploring a usage occasion.
Where-to-buy content structure
Where-to-buy content structure covers online (DTC storefront, Amazon, Target.com, Whole Foods online), retail (specific chain locators with the store finder embedded), and international (customs limitations, retailer partners abroad). Every piece names specific retailers, links to the store locator, and includes an FAQ block covering shipping availability, subscription options, and gift card compatibility. Where-to-buy content ranks for branded discovery queries the DTC storefront otherwise loses to competitor affiliate reviews.
Subscription versus one-time comparison content
Subscription versus one-time comparison content converts subscription commitments at 3 to 6 percent because it addresses the price-sensitivity concern head-on with a specific math table. The piece covers the discount structure (15 percent lifetime), the skip-a-month mechanic, the pause-anytime rule, the cancellation policy, and the specific yearly savings for the brand’s average consumption cadence. Cross-reference the retention structure on our food and beverage marketing retainer page.
Content refresh cadence on food brand pillars
Content refresh cadence on food brand content pillars runs a rolling audit every 12 to 24 months by pillar. Recipes get refreshed every 12 months with new photography, updated schema, and any nutrition or ingredient adjustments. Ingredient comparison guides refresh every 18 months to update market data. Sourcing story pages refresh every 24 months to reflect farm partnership changes and new harvest angles. Buyer intent content refreshes every 12 months to update retailer availability and pricing.
Recipe refresh priority order
Recipe refresh priority runs by organic traffic rank. The top 20 recipes by monthly organic sessions get refreshed first (new photography, schema audit, related recipe internal links, updated nutrition). The next 40 get refreshed at 15 months. The remaining recipes get refreshed opportunistically when the ranking slips past position 15 in Google. Skipping the refresh cadence lets recipe rankings drift out of the top 3 inside 18 months as newer competitor recipes take the position.
Schema audit checklist per refresh
The schema audit checklist per refresh runs 8 items: Recipe schema completeness, aggregateRating count and accuracy, nutrition data accuracy, prepTime and cookTime match the recipe body, image URLs valid at CDN, related recipe internal links working, product card SKU URL live, and Google Search Console rich result eligibility validated. This checklist takes 20 minutes per recipe and prevents the schema drift that costs recipe rankings 20 to 40 positions quietly.
Reporting cadence for food brand content marketing
Reporting cadence on food brand content marketing runs a monthly executive report plus a quarterly business review. The monthly report ships in the first business week and covers organic sessions by pillar, top 10 ranking recipes with position trend, ingredient guide ranking movements, sourcing page performance, and organic-attributed DTC revenue. Every number carries a comparison to the prior month and a plain-language interpretation the founder reads in 7 minutes.
Metrics that matter for content marketing
Metrics that matter for food brand content marketing: organic sessions by pillar, recipe rich result impressions in Search Console, organic conversion rate to hero SKU pages, organic-attributed DTC revenue, and top 20 ranking positions by monthly organic sessions. Vanity metrics that do not matter: total pageviews without conversion context, average time on page without conversion attribution, and social share counts. The monthly report skips the vanity block entirely.
Quarterly business review structure
The quarterly business review runs 90 minutes with the founder, head of content, and SEO lead. Agenda: organic traffic trend by pillar, top 10 winning content pieces, top 10 losing content pieces (candidates for refresh or removal), competitive gap analysis against 5 named competitor brands, and next quarter’s content calendar with recipes and ingredient guides queued. According to Ahrefs content marketing research, brands running quarterly content audits outperform brands running annual audits by 40 to 70 percent on organic revenue over a 24-month window.
Internal linking discipline across food brand content
Internal linking discipline across food brand content moves authority from recipe pages toward hero SKU product pages and comparison guides. Every recipe links to the hero SKU it uses inline (once in the ingredient list, once in a bottom call-out card). Every ingredient comparison guide links to 3 to 6 recipes using the winning ingredient plus the hero SKU product page. Every sourcing story links to the 2 to 4 SKUs sourced from that specific farm or cooperative.
Anchor text strategy across recipe hubs
Anchor text on internal links varies across recipe hubs to avoid over-optimization patterns Google penalizes. Exact-match anchor (“single-origin Ethiopian coffee”) runs on 20 to 30 percent of internal links. Partial-match variations (“our Ethiopian roast”) run on 30 to 40 percent. Branded anchors (the SKU name) run on 20 to 30 percent. Generic anchors (“shop the coffee”) fill the remaining 10 to 20 percent. This ratio holds ranking without triggering the over-optimization penalty that shows up on brands that anchor-text-stuff every internal link with the same exact-match keyword. Cross-reference the linking layer on our food and beverage web design page.
Link equity from ingredient guides to SKU pages
Link equity from ingredient guides passes to SKU pages when the guide’s comparison table names the hero SKU in the winning column with a product card, and when the guide’s body links to 3 to 6 recipes that use the winning ingredient. This 3-hop path (guide to recipe to SKU) pushes authority from a high-traffic informational query down to a high-intent transactional page. According to Search Engine Land SEO coverage, informational content that internally links to transactional pages produces 2 to 4 times higher organic revenue than isolated content silos.
Wrapping up content marketing for food brands
Content marketing for food brands is the organic engine that turns a DTC snack, drink, or CPG storefront into a search-driven revenue channel. Recipe hub of 40 to 100 recipes. Ingredient comparison guides at 12 to 24 pieces. Sourcing story pages at 6 to 12 pieces. Buyer intent content at 8 to 16 pieces. Creator syndication calendar with 12 to 30 creators per quarter. Refresh cadence at 12 to 24 months by pillar. Reporting with organic sessions and organic revenue attribution.
If your DTC food brand is running paid social at 20,000 dollars monthly with a broken blog and zero recipe schema, professional content marketing for food brands pays for itself inside the first 90 days on organic traffic captured. Redefine Web ships content marketing inside our monthly retainer packages. Book a call and we will walk through the last three DTC food brands we built recipe hubs for, pillar by pillar.
Anchor text on internal links varies across recipe hubs to avoid over-optimization patterns Google penalizes. Exact-match anchor (“single-origin Ethiopian coffee”) runs on 20 to 30 percent of internal links. Partial-match variations (“our Ethiopian roast”) run on 30 to 40 percent. Branded anchors (the SKU name) run on 20 to 30 percent. Generic anchors (“shop the coffee”) fill the remaining 10 to 20 percent. This ratio holds ranking without triggering the over-optimization penalty that shows up on brands that anchor-text-stuff every internal link with the same exact-match keyword. Cross-reference the linking layer on our food and beverage web design page.
Link equity from ingredient guides to SKU pages
Link equity from ingredient guides passes to SKU pages when the guide’s comparison table names the hero SKU in the winning column with a product card, and when the guide’s body links to 3 to 6 recipes that use the winning ingredient. This 3-hop path (guide to recipe to SKU) pushes authority from a high-traffic informational query down to a high-intent transactional page. According to Search Engine Land SEO coverage, informational content that internally links to transactional pages produces 2 to 4 times higher organic revenue than isolated content silos.
Wrapping up content marketing for food brands
Content marketing for food brands is the organic engine that turns a DTC snack, drink, or CPG storefront into a search-driven revenue channel. Recipe hub of 40 to 100 recipes. Ingredient comparison guides at 12 to 24 pieces. Sourcing story pages at 6 to 12 pieces. Buyer intent content at 8 to 16 pieces. Creator syndication calendar with 12 to 30 creators per quarter. Refresh cadence at 12 to 24 months by pillar. Reporting with organic sessions and organic revenue attribution.
If your DTC food brand is running paid social at 20,000 dollars monthly with a broken blog and zero recipe schema, professional content marketing for food brands pays for itself inside the first 90 days on organic traffic captured. Redefine Web ships content marketing inside our monthly retainer packages. Book a call and we will walk through the last three DTC food brands we built recipe hubs for, pillar by pillar.
Content marketing for food brands starts with a recipe hub because recipe queries account for 40 to 60 percent of high-intent search volume in the food category. Every hero SKU needs 4 to 12 recipes anchored to it, each targeting a specific occasion and audience.
Skip the recipe hub and the brand loses the search real estate that pulls DTC storefront traffic month over month at zero incremental paid cost. Recipe traffic converts at 2 to 4 percent because the shopper landed with usage intent, not passive discovery, which is why food brands win on recipes.
Recipe schema and Google rich result eligibility
Every recipe page ships schema.org Recipe markup including cookTime, prepTime, recipeIngredient, recipeInstructions, nutrition, and aggregateRating. Correctly marked-up recipes qualify for Google’s recipe rich result carousel that pulls 3 to 6 times higher click-through rate than a plain blue link. The schema layer takes 15 minutes per recipe to author and 30 minutes to validate in Google Search Console. Cross-reference the recipe search stack on our food and beverage SEO page.
Recipe hub structure that scales
The recipe hub structure runs 40 to 100 recipes at maturity, organized by hero SKU (4 to 12 recipes per SKU) plus occasion tags (breakfast, weeknight dinner, meal prep, brunch, holiday). Every recipe links back to the hero SKU product page with the SKU embedded in an inline card. The hub earns internal linking value from ingredient comparison guides and the sourcing story pages, which feeds recipe ranking on Google. According to Google Search Central recipe structured data guidance, complete Recipe schema markup is required for eligibility in the recipe carousel and the ingredient search filter.
Pillar structure for food brand content marketing
The pillar structure on content marketing for food brands runs 4 content pillars concurrently: recipe hub (40 to 100 recipes), ingredient comparison guides (12 to 24 guides), sourcing story pages (6 to 12 pages), and buyer intent content (where to buy, subscription vs. one-time, gift bundle guides). Every pillar covers a distinct search intent and every pillar links back to the hero SKU product pages.
Ingredient comparison guide format
Ingredient comparison guides run 1,800 to 3,200 words comparing 2 to 4 ingredient types on 6 to 10 attributes with a comparison table, real-world use case examples, and links to the hero SKU that uses the specific ingredient. Example: organic vs. conventional oats compares nutritional profile, sourcing chain, cost, environmental impact, and taste on a 6-column table. The brand’s SKU appears in the winning column with a product card. These guides rank 3 to 8 months after publication and pull steady-state organic traffic.
Sourcing story pages that build trust
Sourcing story pages name the specific farms, cooperatives, or suppliers the brand sources from, with photos of the farms, farmer quotes, and specific harvest windows. A coffee brand’s Ethiopian farm page ranks for “single-origin Ethiopian coffee” and “Yirgacheffe coffee origin” plus 40 long-tail variations. The sourcing page pulls trust-building traffic that converts at 4 to 6 percent because the shopper landed pattern-matching on transparency and named provenance. Every sourcing page includes farmer or cooperative quotes, harvest dates, and a link back to 3 to 5 hero SKU pages that source from the named supplier.
Vejrø hospitality content case study
Vejrø Resort, a Danish private-island destination with an on-site restaurant focused on organic, locally sourced cuisine, joined us with strong social engagement and no organic-search real estate. Guests found the resort on Instagram but never in Google search for terms like “private island resort Denmark,” “farm-to-table hospitality Denmark,” or “Vejrø restaurant.” The same organic-search gap shows up on DTC food brands running paid social at 20,000 dollars monthly with a broken blog and zero recipe schema.
We built the conversion-focused website with on-site and off-site SEO tuned to the travel-niche keyword clusters, competitor analysis against comparable boutique resorts, and mobile-first design prioritizing guest discovery. Every page carried the structured data qualifying it for Google’s rich results in the hospitality category. Every internal link pushed authority toward the direct-booking conversion path.
Three months later, Vejrø hit 10,000 plus organic visitors, ranked for 200 plus first-page keywords, and pulled a 2.2 percent booking conversion rate from organic traffic. The same pattern applies to content marketing for food brands: recipe schema, ingredient comparison guides, and sourcing story pages pull organic traffic at 20 to 40 percent conversion into hero SKU pages inside 6 months when the content quality matches search intent and every page carries the right structured data markup. Vejrø also proved out the reporting discipline: every monthly report named the exact page, the exact keyword cluster, and the exact search feature (rich result, sitelinks, image pack) driving the incremental organic revenue instead of hiding behind aggregate traffic charts.
Recipe cadence and content calendar for food brands
Recipe cadence on a working food brand content calendar ships 2 to 4 new recipes per week during the first 6 months and drops to 1 per week at maturity. Each recipe takes 4 to 6 hours to produce (write, test in the kitchen, photograph, schema author, publish). At 3 recipes per week, the brand hits 78 recipes inside 6 months plus a backlog of ingredient comparison and sourcing content queued behind the recipe production line.
| Content pillar | Target volume year 1 | Production cost per piece | Refresh cadence |
|---|---|---|---|
| Recipe hub | 40 to 100 recipes | $180 to $320 | Every 12 months |
| Ingredient comparison guides | 12 to 24 guides | $450 to $780 | Every 18 months |
| Sourcing story pages | 6 to 12 pages | $680 to $1,200 | Every 24 months |
| Buyer intent content | 8 to 16 pieces | $220 to $420 | Every 12 months |
Photography as a content calendar constraint
Photography is the actual constraint on recipe cadence, not writing. Every recipe needs 6 to 12 photos: hero shot, ingredient flat lay, prep in progress, plated result, storage, and step shots for the schema markup. A working food brand batches photography 8 recipes at a time to keep the cost per recipe under 200 dollars. Skip the batching and the per-recipe cost climbs to 400 to 600 dollars, which caps recipe cadence at 1 per week and slows organic ranking timeline by 6 months.
Seasonal content calendar planning
Seasonal content calendar planning maps recipes and comparison guides to the seasonal windows they need to rank in. A Christmas cookie recipe needs to publish in September to rank by early December. A Valentine’s chocolate guide needs to publish in November to rank by early February. A back-to-school lunchbox recipe needs to publish in June to rank by late August. The 60-to-90-day ranking curve dictates the calendar.
Creator syndication inside food brand content
Creator syndication on food brand content marketing amplifies the recipe hub through Instagram Reels, TikTok, and YouTube Shorts creators paid to post their own version of the brand’s hero recipes. The creator content pulls net-new audiences into the recipe hub through the creator’s Link in Bio or Amazon Storefront tag. The syndication calendar names 12 to 30 creators per quarter with specific recipes assigned to each.
One brand we picked up had a spreadsheet titled “creator outreach 2023” with 47 rows and 3 responses. All 3 responses were auto-replies. The spreadsheet named zero recipes and offered flat rates below 100 dollars per post. Nobody posts a 30-second video for 87 dollars flat. Nobody.
Creator content commercial terms that work
Working creator content commercial terms run 350 to 1,500 dollars flat per post plus a 12 to 25 percent commission on tagged sales across a 30-day window. The commission mechanic pulls creators into follow-up posts because the incremental revenue continues past the initial fee. Mid-tier creators (30k to 150k followers) hit the sweet spot for food brand content because their engagement rate typically runs 4 to 8 percent versus 0.8 to 1.6 percent on mega-creators.
Content brief structure for creator partnerships
The content brief structure for creator partnerships runs a single page: the SKU, the specific recipe or usage occasion, 3 required brand mentions, 3 restricted claims (no health claims on non-medical SKUs), the pricing angle, the affiliate link, and 3 example videos that hit the tone. The brief avoids over-scripting because over-scripted creator content underperforms native creator voice by 40 to 60 percent on engagement rate.
Buyer intent content for food brand blogs
Buyer intent content on food brand blogs covers 8 to 16 pieces targeting explicit purchase-decision queries: “where to buy [brand],” “[brand] subscription vs. one-time,” “best [category] for [use case],” and “[brand] gift bundle.” Every buyer intent piece runs 1,400 to 2,400 words with a comparison table, product cards, and a clear conversion path to the specific SKU that matches the query intent. Buyer intent content converts at 3 to 6 percent versus 1 to 2 percent on recipe content because the shopper landed already planning to buy, not exploring a usage occasion.
Where-to-buy content structure
Where-to-buy content structure covers online (DTC storefront, Amazon, Target.com, Whole Foods online), retail (specific chain locators with the store finder embedded), and international (customs limitations, retailer partners abroad). Every piece names specific retailers, links to the store locator, and includes an FAQ block covering shipping availability, subscription options, and gift card compatibility. Where-to-buy content ranks for branded discovery queries the DTC storefront otherwise loses to competitor affiliate reviews.
Subscription versus one-time comparison content
Subscription versus one-time comparison content converts subscription commitments at 3 to 6 percent because it addresses the price-sensitivity concern head-on with a specific math table. The piece covers the discount structure (15 percent lifetime), the skip-a-month mechanic, the pause-anytime rule, the cancellation policy, and the specific yearly savings for the brand’s average consumption cadence. Cross-reference the retention structure on our food and beverage marketing retainer page.
Content refresh cadence on food brand pillars
Content refresh cadence on food brand content pillars runs a rolling audit every 12 to 24 months by pillar. Recipes get refreshed every 12 months with new photography, updated schema, and any nutrition or ingredient adjustments. Ingredient comparison guides refresh every 18 months to update market data. Sourcing story pages refresh every 24 months to reflect farm partnership changes and new harvest angles. Buyer intent content refreshes every 12 months to update retailer availability and pricing.
Recipe refresh priority order
Recipe refresh priority runs by organic traffic rank. The top 20 recipes by monthly organic sessions get refreshed first (new photography, schema audit, related recipe internal links, updated nutrition). The next 40 get refreshed at 15 months. The remaining recipes get refreshed opportunistically when the ranking slips past position 15 in Google. Skipping the refresh cadence lets recipe rankings drift out of the top 3 inside 18 months as newer competitor recipes take the position.
Schema audit checklist per refresh
The schema audit checklist per refresh runs 8 items: Recipe schema completeness, aggregateRating count and accuracy, nutrition data accuracy, prepTime and cookTime match the recipe body, image URLs valid at CDN, related recipe internal links working, product card SKU URL live, and Google Search Console rich result eligibility validated. This checklist takes 20 minutes per recipe and prevents the schema drift that costs recipe rankings 20 to 40 positions quietly.
Reporting cadence for food brand content marketing
Reporting cadence on food brand content marketing runs a monthly executive report plus a quarterly business review. The monthly report ships in the first business week and covers organic sessions by pillar, top 10 ranking recipes with position trend, ingredient guide ranking movements, sourcing page performance, and organic-attributed DTC revenue. Every number carries a comparison to the prior month and a plain-language interpretation the founder reads in 7 minutes.
Metrics that matter for content marketing
Metrics that matter for food brand content marketing: organic sessions by pillar, recipe rich result impressions in Search Console, organic conversion rate to hero SKU pages, organic-attributed DTC revenue, and top 20 ranking positions by monthly organic sessions. Vanity metrics that do not matter: total pageviews without conversion context, average time on page without conversion attribution, and social share counts. The monthly report skips the vanity block entirely.
Quarterly business review structure
The quarterly business review runs 90 minutes with the founder, head of content, and SEO lead. Agenda: organic traffic trend by pillar, top 10 winning content pieces, top 10 losing content pieces (candidates for refresh or removal), competitive gap analysis against 5 named competitor brands, and next quarter’s content calendar with recipes and ingredient guides queued. According to Ahrefs content marketing research, brands running quarterly content audits outperform brands running annual audits by 40 to 70 percent on organic revenue over a 24-month window.
Internal linking discipline across food brand content
Internal linking discipline across food brand content moves authority from recipe pages toward hero SKU product pages and comparison guides. Every recipe links to the hero SKU it uses inline (once in the ingredient list, once in a bottom call-out card). Every ingredient comparison guide links to 3 to 6 recipes using the winning ingredient plus the hero SKU product page. Every sourcing story links to the 2 to 4 SKUs sourced from that specific farm or cooperative.
Anchor text strategy across recipe hubs
Anchor text on internal links varies across recipe hubs to avoid over-optimization patterns Google penalizes. Exact-match anchor (“single-origin Ethiopian coffee”) runs on 20 to 30 percent of internal links. Partial-match variations (“our Ethiopian roast”) run on 30 to 40 percent. Branded anchors (the SKU name) run on 20 to 30 percent. Generic anchors (“shop the coffee”) fill the remaining 10 to 20 percent. This ratio holds ranking without triggering the over-optimization penalty that shows up on brands that anchor-text-stuff every internal link with the same exact-match keyword. Cross-reference the linking layer on our food and beverage web design page.
Link equity from ingredient guides to SKU pages
Link equity from ingredient guides passes to SKU pages when the guide’s comparison table names the hero SKU in the winning column with a product card, and when the guide’s body links to 3 to 6 recipes that use the winning ingredient. This 3-hop path (guide to recipe to SKU) pushes authority from a high-traffic informational query down to a high-intent transactional page. According to Search Engine Land SEO coverage, informational content that internally links to transactional pages produces 2 to 4 times higher organic revenue than isolated content silos.
Wrapping up content marketing for food brands
Content marketing for food brands is the organic engine that turns a DTC snack, drink, or CPG storefront into a search-driven revenue channel. Recipe hub of 40 to 100 recipes. Ingredient comparison guides at 12 to 24 pieces. Sourcing story pages at 6 to 12 pieces. Buyer intent content at 8 to 16 pieces. Creator syndication calendar with 12 to 30 creators per quarter. Refresh cadence at 12 to 24 months by pillar. Reporting with organic sessions and organic revenue attribution.
If your DTC food brand is running paid social at 20,000 dollars monthly with a broken blog and zero recipe schema, professional content marketing for food brands pays for itself inside the first 90 days on organic traffic captured. Redefine Web ships content marketing inside our monthly retainer packages. Book a call and we will walk through the last three DTC food brands we built recipe hubs for, pillar by pillar.
Content marketing for food brands starts with a recipe hub because recipe queries account for 40 to 60 percent of high-intent search volume in the food category. Every hero SKU needs 4 to 12 recipes anchored to it, each targeting a specific occasion and audience.
Skip the recipe hub and the brand loses the search real estate that pulls DTC storefront traffic month over month at zero incremental paid cost. Recipe traffic converts at 2 to 4 percent because the shopper landed with usage intent, not passive discovery, which is why food brands win on recipes.
Recipe schema and Google rich result eligibility
Every recipe page ships schema.org Recipe markup including cookTime, prepTime, recipeIngredient, recipeInstructions, nutrition, and aggregateRating. Correctly marked-up recipes qualify for Google’s recipe rich result carousel that pulls 3 to 6 times higher click-through rate than a plain blue link. The schema layer takes 15 minutes per recipe to author and 30 minutes to validate in Google Search Console. Cross-reference the recipe search stack on our food and beverage SEO page.
Recipe hub structure that scales
The recipe hub structure runs 40 to 100 recipes at maturity, organized by hero SKU (4 to 12 recipes per SKU) plus occasion tags (breakfast, weeknight dinner, meal prep, brunch, holiday). Every recipe links back to the hero SKU product page with the SKU embedded in an inline card. The hub earns internal linking value from ingredient comparison guides and the sourcing story pages, which feeds recipe ranking on Google. According to Google Search Central recipe structured data guidance, complete Recipe schema markup is required for eligibility in the recipe carousel and the ingredient search filter.
Pillar structure for food brand content marketing
The pillar structure on content marketing for food brands runs 4 content pillars concurrently: recipe hub (40 to 100 recipes), ingredient comparison guides (12 to 24 guides), sourcing story pages (6 to 12 pages), and buyer intent content (where to buy, subscription vs. one-time, gift bundle guides). Every pillar covers a distinct search intent and every pillar links back to the hero SKU product pages.
Ingredient comparison guide format
Ingredient comparison guides run 1,800 to 3,200 words comparing 2 to 4 ingredient types on 6 to 10 attributes with a comparison table, real-world use case examples, and links to the hero SKU that uses the specific ingredient. Example: organic vs. conventional oats compares nutritional profile, sourcing chain, cost, environmental impact, and taste on a 6-column table. The brand’s SKU appears in the winning column with a product card. These guides rank 3 to 8 months after publication and pull steady-state organic traffic.
Sourcing story pages that build trust
Sourcing story pages name the specific farms, cooperatives, or suppliers the brand sources from, with photos of the farms, farmer quotes, and specific harvest windows. A coffee brand’s Ethiopian farm page ranks for “single-origin Ethiopian coffee” and “Yirgacheffe coffee origin” plus 40 long-tail variations. The sourcing page pulls trust-building traffic that converts at 4 to 6 percent because the shopper landed pattern-matching on transparency and named provenance. Every sourcing page includes farmer or cooperative quotes, harvest dates, and a link back to 3 to 5 hero SKU pages that source from the named supplier.
Vejrø hospitality content case study
Vejrø Resort, a Danish private-island destination with an on-site restaurant focused on organic, locally sourced cuisine, joined us with strong social engagement and no organic-search real estate. Guests found the resort on Instagram but never in Google search for terms like “private island resort Denmark,” “farm-to-table hospitality Denmark,” or “Vejrø restaurant.” The same organic-search gap shows up on DTC food brands running paid social at 20,000 dollars monthly with a broken blog and zero recipe schema.
We built the conversion-focused website with on-site and off-site SEO tuned to the travel-niche keyword clusters, competitor analysis against comparable boutique resorts, and mobile-first design prioritizing guest discovery. Every page carried the structured data qualifying it for Google’s rich results in the hospitality category. Every internal link pushed authority toward the direct-booking conversion path.
Three months later, Vejrø hit 10,000 plus organic visitors, ranked for 200 plus first-page keywords, and pulled a 2.2 percent booking conversion rate from organic traffic. The same pattern applies to content marketing for food brands: recipe schema, ingredient comparison guides, and sourcing story pages pull organic traffic at 20 to 40 percent conversion into hero SKU pages inside 6 months when the content quality matches search intent and every page carries the right structured data markup. Vejrø also proved out the reporting discipline: every monthly report named the exact page, the exact keyword cluster, and the exact search feature (rich result, sitelinks, image pack) driving the incremental organic revenue instead of hiding behind aggregate traffic charts.
Recipe cadence and content calendar for food brands
Recipe cadence on a working food brand content calendar ships 2 to 4 new recipes per week during the first 6 months and drops to 1 per week at maturity. Each recipe takes 4 to 6 hours to produce (write, test in the kitchen, photograph, schema author, publish). At 3 recipes per week, the brand hits 78 recipes inside 6 months plus a backlog of ingredient comparison and sourcing content queued behind the recipe production line.
| Content pillar | Target volume year 1 | Production cost per piece | Refresh cadence |
|---|---|---|---|
| Recipe hub | 40 to 100 recipes | $180 to $320 | Every 12 months |
| Ingredient comparison guides | 12 to 24 guides | $450 to $780 | Every 18 months |
| Sourcing story pages | 6 to 12 pages | $680 to $1,200 | Every 24 months |
| Buyer intent content | 8 to 16 pieces | $220 to $420 | Every 12 months |
Photography as a content calendar constraint
Photography is the actual constraint on recipe cadence, not writing. Every recipe needs 6 to 12 photos: hero shot, ingredient flat lay, prep in progress, plated result, storage, and step shots for the schema markup. A working food brand batches photography 8 recipes at a time to keep the cost per recipe under 200 dollars. Skip the batching and the per-recipe cost climbs to 400 to 600 dollars, which caps recipe cadence at 1 per week and slows organic ranking timeline by 6 months.
Seasonal content calendar planning
Seasonal content calendar planning maps recipes and comparison guides to the seasonal windows they need to rank in. A Christmas cookie recipe needs to publish in September to rank by early December. A Valentine’s chocolate guide needs to publish in November to rank by early February. A back-to-school lunchbox recipe needs to publish in June to rank by late August. The 60-to-90-day ranking curve dictates the calendar.
Creator syndication inside food brand content
Creator syndication on food brand content marketing amplifies the recipe hub through Instagram Reels, TikTok, and YouTube Shorts creators paid to post their own version of the brand’s hero recipes. The creator content pulls net-new audiences into the recipe hub through the creator’s Link in Bio or Amazon Storefront tag. The syndication calendar names 12 to 30 creators per quarter with specific recipes assigned to each.
One brand we picked up had a spreadsheet titled “creator outreach 2023” with 47 rows and 3 responses. All 3 responses were auto-replies. The spreadsheet named zero recipes and offered flat rates below 100 dollars per post. Nobody posts a 30-second video for 87 dollars flat. Nobody.
Creator content commercial terms that work
Working creator content commercial terms run 350 to 1,500 dollars flat per post plus a 12 to 25 percent commission on tagged sales across a 30-day window. The commission mechanic pulls creators into follow-up posts because the incremental revenue continues past the initial fee. Mid-tier creators (30k to 150k followers) hit the sweet spot for food brand content because their engagement rate typically runs 4 to 8 percent versus 0.8 to 1.6 percent on mega-creators.
Content brief structure for creator partnerships
The content brief structure for creator partnerships runs a single page: the SKU, the specific recipe or usage occasion, 3 required brand mentions, 3 restricted claims (no health claims on non-medical SKUs), the pricing angle, the affiliate link, and 3 example videos that hit the tone. The brief avoids over-scripting because over-scripted creator content underperforms native creator voice by 40 to 60 percent on engagement rate.
Buyer intent content for food brand blogs
Buyer intent content on food brand blogs covers 8 to 16 pieces targeting explicit purchase-decision queries: “where to buy [brand],” “[brand] subscription vs. one-time,” “best [category] for [use case],” and “[brand] gift bundle.” Every buyer intent piece runs 1,400 to 2,400 words with a comparison table, product cards, and a clear conversion path to the specific SKU that matches the query intent. Buyer intent content converts at 3 to 6 percent versus 1 to 2 percent on recipe content because the shopper landed already planning to buy, not exploring a usage occasion.
Where-to-buy content structure
Where-to-buy content structure covers online (DTC storefront, Amazon, Target.com, Whole Foods online), retail (specific chain locators with the store finder embedded), and international (customs limitations, retailer partners abroad). Every piece names specific retailers, links to the store locator, and includes an FAQ block covering shipping availability, subscription options, and gift card compatibility. Where-to-buy content ranks for branded discovery queries the DTC storefront otherwise loses to competitor affiliate reviews.
Subscription versus one-time comparison content
Subscription versus one-time comparison content converts subscription commitments at 3 to 6 percent because it addresses the price-sensitivity concern head-on with a specific math table. The piece covers the discount structure (15 percent lifetime), the skip-a-month mechanic, the pause-anytime rule, the cancellation policy, and the specific yearly savings for the brand’s average consumption cadence. Cross-reference the retention structure on our food and beverage marketing retainer page.
Content refresh cadence on food brand pillars
Content refresh cadence on food brand content pillars runs a rolling audit every 12 to 24 months by pillar. Recipes get refreshed every 12 months with new photography, updated schema, and any nutrition or ingredient adjustments. Ingredient comparison guides refresh every 18 months to update market data. Sourcing story pages refresh every 24 months to reflect farm partnership changes and new harvest angles. Buyer intent content refreshes every 12 months to update retailer availability and pricing.
Recipe refresh priority order
Recipe refresh priority runs by organic traffic rank. The top 20 recipes by monthly organic sessions get refreshed first (new photography, schema audit, related recipe internal links, updated nutrition). The next 40 get refreshed at 15 months. The remaining recipes get refreshed opportunistically when the ranking slips past position 15 in Google. Skipping the refresh cadence lets recipe rankings drift out of the top 3 inside 18 months as newer competitor recipes take the position.
Schema audit checklist per refresh
The schema audit checklist per refresh runs 8 items: Recipe schema completeness, aggregateRating count and accuracy, nutrition data accuracy, prepTime and cookTime match the recipe body, image URLs valid at CDN, related recipe internal links working, product card SKU URL live, and Google Search Console rich result eligibility validated. This checklist takes 20 minutes per recipe and prevents the schema drift that costs recipe rankings 20 to 40 positions quietly.
Reporting cadence for food brand content marketing
Reporting cadence on food brand content marketing runs a monthly executive report plus a quarterly business review. The monthly report ships in the first business week and covers organic sessions by pillar, top 10 ranking recipes with position trend, ingredient guide ranking movements, sourcing page performance, and organic-attributed DTC revenue. Every number carries a comparison to the prior month and a plain-language interpretation the founder reads in 7 minutes.
Metrics that matter for content marketing
Metrics that matter for food brand content marketing: organic sessions by pillar, recipe rich result impressions in Search Console, organic conversion rate to hero SKU pages, organic-attributed DTC revenue, and top 20 ranking positions by monthly organic sessions. Vanity metrics that do not matter: total pageviews without conversion context, average time on page without conversion attribution, and social share counts. The monthly report skips the vanity block entirely.
Quarterly business review structure
The quarterly business review runs 90 minutes with the founder, head of content, and SEO lead. Agenda: organic traffic trend by pillar, top 10 winning content pieces, top 10 losing content pieces (candidates for refresh or removal), competitive gap analysis against 5 named competitor brands, and next quarter’s content calendar with recipes and ingredient guides queued. According to Ahrefs content marketing research, brands running quarterly content audits outperform brands running annual audits by 40 to 70 percent on organic revenue over a 24-month window.
Internal linking discipline across food brand content
Internal linking discipline across food brand content moves authority from recipe pages toward hero SKU product pages and comparison guides. Every recipe links to the hero SKU it uses inline (once in the ingredient list, once in a bottom call-out card). Every ingredient comparison guide links to 3 to 6 recipes using the winning ingredient plus the hero SKU product page. Every sourcing story links to the 2 to 4 SKUs sourced from that specific farm or cooperative.
Anchor text strategy across recipe hubs
Anchor text on internal links varies across recipe hubs to avoid over-optimization patterns Google penalizes. Exact-match anchor (“single-origin Ethiopian coffee”) runs on 20 to 30 percent of internal links. Partial-match variations (“our Ethiopian roast”) run on 30 to 40 percent. Branded anchors (the SKU name) run on 20 to 30 percent. Generic anchors (“shop the coffee”) fill the remaining 10 to 20 percent. This ratio holds ranking without triggering the over-optimization penalty that shows up on brands that anchor-text-stuff every internal link with the same exact-match keyword. Cross-reference the linking layer on our food and beverage web design page.
Link equity from ingredient guides to SKU pages
Link equity from ingredient guides passes to SKU pages when the guide’s comparison table names the hero SKU in the winning column with a product card, and when the guide’s body links to 3 to 6 recipes that use the winning ingredient. This 3-hop path (guide to recipe to SKU) pushes authority from a high-traffic informational query down to a high-intent transactional page. According to Search Engine Land SEO coverage, informational content that internally links to transactional pages produces 2 to 4 times higher organic revenue than isolated content silos.
Wrapping up content marketing for food brands
Content marketing for food brands is the organic engine that turns a DTC snack, drink, or CPG storefront into a search-driven revenue channel. Recipe hub of 40 to 100 recipes. Ingredient comparison guides at 12 to 24 pieces. Sourcing story pages at 6 to 12 pieces. Buyer intent content at 8 to 16 pieces. Creator syndication calendar with 12 to 30 creators per quarter. Refresh cadence at 12 to 24 months by pillar. Reporting with organic sessions and organic revenue attribution.
If your DTC food brand is running paid social at 20,000 dollars monthly with a broken blog and zero recipe schema, professional content marketing for food brands pays for itself inside the first 90 days on organic traffic captured. Redefine Web ships content marketing inside our monthly retainer packages. Book a call and we will walk through the last three DTC food brands we built recipe hubs for, pillar by pillar.
Internal linking discipline across food brand content moves authority from recipe pages toward hero SKU product pages and comparison guides. Every recipe links to the hero SKU it uses inline (once in the ingredient list, once in a bottom call-out card). Every ingredient comparison guide links to 3 to 6 recipes using the winning ingredient plus the hero SKU product page. Every sourcing story links to the 2 to 4 SKUs sourced from that specific farm or cooperative.
Anchor text strategy across recipe hubs
Anchor text on internal links varies across recipe hubs to avoid over-optimization patterns Google penalizes. Exact-match anchor (“single-origin Ethiopian coffee”) runs on 20 to 30 percent of internal links. Partial-match variations (“our Ethiopian roast”) run on 30 to 40 percent. Branded anchors (the SKU name) run on 20 to 30 percent. Generic anchors (“shop the coffee”) fill the remaining 10 to 20 percent. This ratio holds ranking without triggering the over-optimization penalty that shows up on brands that anchor-text-stuff every internal link with the same exact-match keyword. Cross-reference the linking layer on our food and beverage web design page.
Link equity from ingredient guides to SKU pages
Link equity from ingredient guides passes to SKU pages when the guide’s comparison table names the hero SKU in the winning column with a product card, and when the guide’s body links to 3 to 6 recipes that use the winning ingredient. This 3-hop path (guide to recipe to SKU) pushes authority from a high-traffic informational query down to a high-intent transactional page. According to Search Engine Land SEO coverage, informational content that internally links to transactional pages produces 2 to 4 times higher organic revenue than isolated content silos.
Wrapping up content marketing for food brands
Content marketing for food brands is the organic engine that turns a DTC snack, drink, or CPG storefront into a search-driven revenue channel. Recipe hub of 40 to 100 recipes. Ingredient comparison guides at 12 to 24 pieces. Sourcing story pages at 6 to 12 pieces. Buyer intent content at 8 to 16 pieces. Creator syndication calendar with 12 to 30 creators per quarter. Refresh cadence at 12 to 24 months by pillar. Reporting with organic sessions and organic revenue attribution.
If your DTC food brand is running paid social at 20,000 dollars monthly with a broken blog and zero recipe schema, professional content marketing for food brands pays for itself inside the first 90 days on organic traffic captured. Redefine Web ships content marketing inside our monthly retainer packages. Book a call and we will walk through the last three DTC food brands we built recipe hubs for, pillar by pillar.
Content marketing for food brands starts with a recipe hub because recipe queries account for 40 to 60 percent of high-intent search volume in the food category. Every hero SKU needs 4 to 12 recipes anchored to it, each targeting a specific occasion and audience.
Skip the recipe hub and the brand loses the search real estate that pulls DTC storefront traffic month over month at zero incremental paid cost. Recipe traffic converts at 2 to 4 percent because the shopper landed with usage intent, not passive discovery, which is why food brands win on recipes.
Recipe schema and Google rich result eligibility
Every recipe page ships schema.org Recipe markup including cookTime, prepTime, recipeIngredient, recipeInstructions, nutrition, and aggregateRating. Correctly marked-up recipes qualify for Google’s recipe rich result carousel that pulls 3 to 6 times higher click-through rate than a plain blue link. The schema layer takes 15 minutes per recipe to author and 30 minutes to validate in Google Search Console. Cross-reference the recipe search stack on our food and beverage SEO page.
Recipe hub structure that scales
The recipe hub structure runs 40 to 100 recipes at maturity, organized by hero SKU (4 to 12 recipes per SKU) plus occasion tags (breakfast, weeknight dinner, meal prep, brunch, holiday). Every recipe links back to the hero SKU product page with the SKU embedded in an inline card. The hub earns internal linking value from ingredient comparison guides and the sourcing story pages, which feeds recipe ranking on Google. According to Google Search Central recipe structured data guidance, complete Recipe schema markup is required for eligibility in the recipe carousel and the ingredient search filter.
Pillar structure for food brand content marketing
The pillar structure on content marketing for food brands runs 4 content pillars concurrently: recipe hub (40 to 100 recipes), ingredient comparison guides (12 to 24 guides), sourcing story pages (6 to 12 pages), and buyer intent content (where to buy, subscription vs. one-time, gift bundle guides). Every pillar covers a distinct search intent and every pillar links back to the hero SKU product pages.
Ingredient comparison guide format
Ingredient comparison guides run 1,800 to 3,200 words comparing 2 to 4 ingredient types on 6 to 10 attributes with a comparison table, real-world use case examples, and links to the hero SKU that uses the specific ingredient. Example: organic vs. conventional oats compares nutritional profile, sourcing chain, cost, environmental impact, and taste on a 6-column table. The brand’s SKU appears in the winning column with a product card. These guides rank 3 to 8 months after publication and pull steady-state organic traffic.
Sourcing story pages that build trust
Sourcing story pages name the specific farms, cooperatives, or suppliers the brand sources from, with photos of the farms, farmer quotes, and specific harvest windows. A coffee brand’s Ethiopian farm page ranks for “single-origin Ethiopian coffee” and “Yirgacheffe coffee origin” plus 40 long-tail variations. The sourcing page pulls trust-building traffic that converts at 4 to 6 percent because the shopper landed pattern-matching on transparency and named provenance. Every sourcing page includes farmer or cooperative quotes, harvest dates, and a link back to 3 to 5 hero SKU pages that source from the named supplier.
Vejrø hospitality content case study
Vejrø Resort, a Danish private-island destination with an on-site restaurant focused on organic, locally sourced cuisine, joined us with strong social engagement and no organic-search real estate. Guests found the resort on Instagram but never in Google search for terms like “private island resort Denmark,” “farm-to-table hospitality Denmark,” or “Vejrø restaurant.” The same organic-search gap shows up on DTC food brands running paid social at 20,000 dollars monthly with a broken blog and zero recipe schema.
We built the conversion-focused website with on-site and off-site SEO tuned to the travel-niche keyword clusters, competitor analysis against comparable boutique resorts, and mobile-first design prioritizing guest discovery. Every page carried the structured data qualifying it for Google’s rich results in the hospitality category. Every internal link pushed authority toward the direct-booking conversion path.
Three months later, Vejrø hit 10,000 plus organic visitors, ranked for 200 plus first-page keywords, and pulled a 2.2 percent booking conversion rate from organic traffic. The same pattern applies to content marketing for food brands: recipe schema, ingredient comparison guides, and sourcing story pages pull organic traffic at 20 to 40 percent conversion into hero SKU pages inside 6 months when the content quality matches search intent and every page carries the right structured data markup. Vejrø also proved out the reporting discipline: every monthly report named the exact page, the exact keyword cluster, and the exact search feature (rich result, sitelinks, image pack) driving the incremental organic revenue instead of hiding behind aggregate traffic charts.
Recipe cadence and content calendar for food brands
Recipe cadence on a working food brand content calendar ships 2 to 4 new recipes per week during the first 6 months and drops to 1 per week at maturity. Each recipe takes 4 to 6 hours to produce (write, test in the kitchen, photograph, schema author, publish). At 3 recipes per week, the brand hits 78 recipes inside 6 months plus a backlog of ingredient comparison and sourcing content queued behind the recipe production line.
| Content pillar | Target volume year 1 | Production cost per piece | Refresh cadence |
|---|---|---|---|
| Recipe hub | 40 to 100 recipes | $180 to $320 | Every 12 months |
| Ingredient comparison guides | 12 to 24 guides | $450 to $780 | Every 18 months |
| Sourcing story pages | 6 to 12 pages | $680 to $1,200 | Every 24 months |
| Buyer intent content | 8 to 16 pieces | $220 to $420 | Every 12 months |
Photography as a content calendar constraint
Photography is the actual constraint on recipe cadence, not writing. Every recipe needs 6 to 12 photos: hero shot, ingredient flat lay, prep in progress, plated result, storage, and step shots for the schema markup. A working food brand batches photography 8 recipes at a time to keep the cost per recipe under 200 dollars. Skip the batching and the per-recipe cost climbs to 400 to 600 dollars, which caps recipe cadence at 1 per week and slows organic ranking timeline by 6 months.
Seasonal content calendar planning
Seasonal content calendar planning maps recipes and comparison guides to the seasonal windows they need to rank in. A Christmas cookie recipe needs to publish in September to rank by early December. A Valentine’s chocolate guide needs to publish in November to rank by early February. A back-to-school lunchbox recipe needs to publish in June to rank by late August. The 60-to-90-day ranking curve dictates the calendar.
Creator syndication inside food brand content
Creator syndication on food brand content marketing amplifies the recipe hub through Instagram Reels, TikTok, and YouTube Shorts creators paid to post their own version of the brand’s hero recipes. The creator content pulls net-new audiences into the recipe hub through the creator’s Link in Bio or Amazon Storefront tag. The syndication calendar names 12 to 30 creators per quarter with specific recipes assigned to each.
One brand we picked up had a spreadsheet titled “creator outreach 2023” with 47 rows and 3 responses. All 3 responses were auto-replies. The spreadsheet named zero recipes and offered flat rates below 100 dollars per post. Nobody posts a 30-second video for 87 dollars flat. Nobody.
Creator content commercial terms that work
Working creator content commercial terms run 350 to 1,500 dollars flat per post plus a 12 to 25 percent commission on tagged sales across a 30-day window. The commission mechanic pulls creators into follow-up posts because the incremental revenue continues past the initial fee. Mid-tier creators (30k to 150k followers) hit the sweet spot for food brand content because their engagement rate typically runs 4 to 8 percent versus 0.8 to 1.6 percent on mega-creators.
Content brief structure for creator partnerships
The content brief structure for creator partnerships runs a single page: the SKU, the specific recipe or usage occasion, 3 required brand mentions, 3 restricted claims (no health claims on non-medical SKUs), the pricing angle, the affiliate link, and 3 example videos that hit the tone. The brief avoids over-scripting because over-scripted creator content underperforms native creator voice by 40 to 60 percent on engagement rate.
Buyer intent content for food brand blogs
Buyer intent content on food brand blogs covers 8 to 16 pieces targeting explicit purchase-decision queries: “where to buy [brand],” “[brand] subscription vs. one-time,” “best [category] for [use case],” and “[brand] gift bundle.” Every buyer intent piece runs 1,400 to 2,400 words with a comparison table, product cards, and a clear conversion path to the specific SKU that matches the query intent. Buyer intent content converts at 3 to 6 percent versus 1 to 2 percent on recipe content because the shopper landed already planning to buy, not exploring a usage occasion.
Where-to-buy content structure
Where-to-buy content structure covers online (DTC storefront, Amazon, Target.com, Whole Foods online), retail (specific chain locators with the store finder embedded), and international (customs limitations, retailer partners abroad). Every piece names specific retailers, links to the store locator, and includes an FAQ block covering shipping availability, subscription options, and gift card compatibility. Where-to-buy content ranks for branded discovery queries the DTC storefront otherwise loses to competitor affiliate reviews.
Subscription versus one-time comparison content
Subscription versus one-time comparison content converts subscription commitments at 3 to 6 percent because it addresses the price-sensitivity concern head-on with a specific math table. The piece covers the discount structure (15 percent lifetime), the skip-a-month mechanic, the pause-anytime rule, the cancellation policy, and the specific yearly savings for the brand’s average consumption cadence. Cross-reference the retention structure on our food and beverage marketing retainer page.
Content refresh cadence on food brand pillars
Content refresh cadence on food brand content pillars runs a rolling audit every 12 to 24 months by pillar. Recipes get refreshed every 12 months with new photography, updated schema, and any nutrition or ingredient adjustments. Ingredient comparison guides refresh every 18 months to update market data. Sourcing story pages refresh every 24 months to reflect farm partnership changes and new harvest angles. Buyer intent content refreshes every 12 months to update retailer availability and pricing.
Recipe refresh priority order
Recipe refresh priority runs by organic traffic rank. The top 20 recipes by monthly organic sessions get refreshed first (new photography, schema audit, related recipe internal links, updated nutrition). The next 40 get refreshed at 15 months. The remaining recipes get refreshed opportunistically when the ranking slips past position 15 in Google. Skipping the refresh cadence lets recipe rankings drift out of the top 3 inside 18 months as newer competitor recipes take the position.
Schema audit checklist per refresh
The schema audit checklist per refresh runs 8 items: Recipe schema completeness, aggregateRating count and accuracy, nutrition data accuracy, prepTime and cookTime match the recipe body, image URLs valid at CDN, related recipe internal links working, product card SKU URL live, and Google Search Console rich result eligibility validated. This checklist takes 20 minutes per recipe and prevents the schema drift that costs recipe rankings 20 to 40 positions quietly.
Reporting cadence for food brand content marketing
Reporting cadence on food brand content marketing runs a monthly executive report plus a quarterly business review. The monthly report ships in the first business week and covers organic sessions by pillar, top 10 ranking recipes with position trend, ingredient guide ranking movements, sourcing page performance, and organic-attributed DTC revenue. Every number carries a comparison to the prior month and a plain-language interpretation the founder reads in 7 minutes.
Metrics that matter for content marketing
Metrics that matter for food brand content marketing: organic sessions by pillar, recipe rich result impressions in Search Console, organic conversion rate to hero SKU pages, organic-attributed DTC revenue, and top 20 ranking positions by monthly organic sessions. Vanity metrics that do not matter: total pageviews without conversion context, average time on page without conversion attribution, and social share counts. The monthly report skips the vanity block entirely.
Quarterly business review structure
The quarterly business review runs 90 minutes with the founder, head of content, and SEO lead. Agenda: organic traffic trend by pillar, top 10 winning content pieces, top 10 losing content pieces (candidates for refresh or removal), competitive gap analysis against 5 named competitor brands, and next quarter’s content calendar with recipes and ingredient guides queued. According to Ahrefs content marketing research, brands running quarterly content audits outperform brands running annual audits by 40 to 70 percent on organic revenue over a 24-month window.
Internal linking discipline across food brand content
Internal linking discipline across food brand content moves authority from recipe pages toward hero SKU product pages and comparison guides. Every recipe links to the hero SKU it uses inline (once in the ingredient list, once in a bottom call-out card). Every ingredient comparison guide links to 3 to 6 recipes using the winning ingredient plus the hero SKU product page. Every sourcing story links to the 2 to 4 SKUs sourced from that specific farm or cooperative.
Anchor text strategy across recipe hubs
Anchor text on internal links varies across recipe hubs to avoid over-optimization patterns Google penalizes. Exact-match anchor (“single-origin Ethiopian coffee”) runs on 20 to 30 percent of internal links. Partial-match variations (“our Ethiopian roast”) run on 30 to 40 percent. Branded anchors (the SKU name) run on 20 to 30 percent. Generic anchors (“shop the coffee”) fill the remaining 10 to 20 percent. This ratio holds ranking without triggering the over-optimization penalty that shows up on brands that anchor-text-stuff every internal link with the same exact-match keyword. Cross-reference the linking layer on our food and beverage web design page.
Link equity from ingredient guides to SKU pages
Link equity from ingredient guides passes to SKU pages when the guide’s comparison table names the hero SKU in the winning column with a product card, and when the guide’s body links to 3 to 6 recipes that use the winning ingredient. This 3-hop path (guide to recipe to SKU) pushes authority from a high-traffic informational query down to a high-intent transactional page. According to Search Engine Land SEO coverage, informational content that internally links to transactional pages produces 2 to 4 times higher organic revenue than isolated content silos.
Wrapping up content marketing for food brands
Content marketing for food brands is the organic engine that turns a DTC snack, drink, or CPG storefront into a search-driven revenue channel. Recipe hub of 40 to 100 recipes. Ingredient comparison guides at 12 to 24 pieces. Sourcing story pages at 6 to 12 pieces. Buyer intent content at 8 to 16 pieces. Creator syndication calendar with 12 to 30 creators per quarter. Refresh cadence at 12 to 24 months by pillar. Reporting with organic sessions and organic revenue attribution.
If your DTC food brand is running paid social at 20,000 dollars monthly with a broken blog and zero recipe schema, professional content marketing for food brands pays for itself inside the first 90 days on organic traffic captured. Redefine Web ships content marketing inside our monthly retainer packages. Book a call and we will walk through the last three DTC food brands we built recipe hubs for, pillar by pillar.
Content marketing for food brands starts with a recipe hub because recipe queries account for 40 to 60 percent of high-intent search volume in the food category. Every hero SKU needs 4 to 12 recipes anchored to it, each targeting a specific occasion and audience.
Skip the recipe hub and the brand loses the search real estate that pulls DTC storefront traffic month over month at zero incremental paid cost. Recipe traffic converts at 2 to 4 percent because the shopper landed with usage intent, not passive discovery, which is why food brands win on recipes.
Recipe schema and Google rich result eligibility
Every recipe page ships schema.org Recipe markup including cookTime, prepTime, recipeIngredient, recipeInstructions, nutrition, and aggregateRating. Correctly marked-up recipes qualify for Google’s recipe rich result carousel that pulls 3 to 6 times higher click-through rate than a plain blue link. The schema layer takes 15 minutes per recipe to author and 30 minutes to validate in Google Search Console. Cross-reference the recipe search stack on our food and beverage SEO page.
Recipe hub structure that scales
The recipe hub structure runs 40 to 100 recipes at maturity, organized by hero SKU (4 to 12 recipes per SKU) plus occasion tags (breakfast, weeknight dinner, meal prep, brunch, holiday). Every recipe links back to the hero SKU product page with the SKU embedded in an inline card. The hub earns internal linking value from ingredient comparison guides and the sourcing story pages, which feeds recipe ranking on Google. According to Google Search Central recipe structured data guidance, complete Recipe schema markup is required for eligibility in the recipe carousel and the ingredient search filter.
Pillar structure for food brand content marketing
The pillar structure on content marketing for food brands runs 4 content pillars concurrently: recipe hub (40 to 100 recipes), ingredient comparison guides (12 to 24 guides), sourcing story pages (6 to 12 pages), and buyer intent content (where to buy, subscription vs. one-time, gift bundle guides). Every pillar covers a distinct search intent and every pillar links back to the hero SKU product pages.
Ingredient comparison guide format
Ingredient comparison guides run 1,800 to 3,200 words comparing 2 to 4 ingredient types on 6 to 10 attributes with a comparison table, real-world use case examples, and links to the hero SKU that uses the specific ingredient. Example: organic vs. conventional oats compares nutritional profile, sourcing chain, cost, environmental impact, and taste on a 6-column table. The brand’s SKU appears in the winning column with a product card. These guides rank 3 to 8 months after publication and pull steady-state organic traffic.
Sourcing story pages that build trust
Sourcing story pages name the specific farms, cooperatives, or suppliers the brand sources from, with photos of the farms, farmer quotes, and specific harvest windows. A coffee brand’s Ethiopian farm page ranks for “single-origin Ethiopian coffee” and “Yirgacheffe coffee origin” plus 40 long-tail variations. The sourcing page pulls trust-building traffic that converts at 4 to 6 percent because the shopper landed pattern-matching on transparency and named provenance. Every sourcing page includes farmer or cooperative quotes, harvest dates, and a link back to 3 to 5 hero SKU pages that source from the named supplier.
Vejrø hospitality content case study
Vejrø Resort, a Danish private-island destination with an on-site restaurant focused on organic, locally sourced cuisine, joined us with strong social engagement and no organic-search real estate. Guests found the resort on Instagram but never in Google search for terms like “private island resort Denmark,” “farm-to-table hospitality Denmark,” or “Vejrø restaurant.” The same organic-search gap shows up on DTC food brands running paid social at 20,000 dollars monthly with a broken blog and zero recipe schema.
We built the conversion-focused website with on-site and off-site SEO tuned to the travel-niche keyword clusters, competitor analysis against comparable boutique resorts, and mobile-first design prioritizing guest discovery. Every page carried the structured data qualifying it for Google’s rich results in the hospitality category. Every internal link pushed authority toward the direct-booking conversion path.
Three months later, Vejrø hit 10,000 plus organic visitors, ranked for 200 plus first-page keywords, and pulled a 2.2 percent booking conversion rate from organic traffic. The same pattern applies to content marketing for food brands: recipe schema, ingredient comparison guides, and sourcing story pages pull organic traffic at 20 to 40 percent conversion into hero SKU pages inside 6 months when the content quality matches search intent and every page carries the right structured data markup. Vejrø also proved out the reporting discipline: every monthly report named the exact page, the exact keyword cluster, and the exact search feature (rich result, sitelinks, image pack) driving the incremental organic revenue instead of hiding behind aggregate traffic charts.
Recipe cadence and content calendar for food brands
Recipe cadence on a working food brand content calendar ships 2 to 4 new recipes per week during the first 6 months and drops to 1 per week at maturity. Each recipe takes 4 to 6 hours to produce (write, test in the kitchen, photograph, schema author, publish). At 3 recipes per week, the brand hits 78 recipes inside 6 months plus a backlog of ingredient comparison and sourcing content queued behind the recipe production line.
| Content pillar | Target volume year 1 | Production cost per piece | Refresh cadence |
|---|---|---|---|
| Recipe hub | 40 to 100 recipes | $180 to $320 | Every 12 months |
| Ingredient comparison guides | 12 to 24 guides | $450 to $780 | Every 18 months |
| Sourcing story pages | 6 to 12 pages | $680 to $1,200 | Every 24 months |
| Buyer intent content | 8 to 16 pieces | $220 to $420 | Every 12 months |
Photography as a content calendar constraint
Photography is the actual constraint on recipe cadence, not writing. Every recipe needs 6 to 12 photos: hero shot, ingredient flat lay, prep in progress, plated result, storage, and step shots for the schema markup. A working food brand batches photography 8 recipes at a time to keep the cost per recipe under 200 dollars. Skip the batching and the per-recipe cost climbs to 400 to 600 dollars, which caps recipe cadence at 1 per week and slows organic ranking timeline by 6 months.
Seasonal content calendar planning
Seasonal content calendar planning maps recipes and comparison guides to the seasonal windows they need to rank in. A Christmas cookie recipe needs to publish in September to rank by early December. A Valentine’s chocolate guide needs to publish in November to rank by early February. A back-to-school lunchbox recipe needs to publish in June to rank by late August. The 60-to-90-day ranking curve dictates the calendar.
Creator syndication inside food brand content
Creator syndication on food brand content marketing amplifies the recipe hub through Instagram Reels, TikTok, and YouTube Shorts creators paid to post their own version of the brand’s hero recipes. The creator content pulls net-new audiences into the recipe hub through the creator’s Link in Bio or Amazon Storefront tag. The syndication calendar names 12 to 30 creators per quarter with specific recipes assigned to each.
One brand we picked up had a spreadsheet titled “creator outreach 2023” with 47 rows and 3 responses. All 3 responses were auto-replies. The spreadsheet named zero recipes and offered flat rates below 100 dollars per post. Nobody posts a 30-second video for 87 dollars flat. Nobody.
Creator content commercial terms that work
Working creator content commercial terms run 350 to 1,500 dollars flat per post plus a 12 to 25 percent commission on tagged sales across a 30-day window. The commission mechanic pulls creators into follow-up posts because the incremental revenue continues past the initial fee. Mid-tier creators (30k to 150k followers) hit the sweet spot for food brand content because their engagement rate typically runs 4 to 8 percent versus 0.8 to 1.6 percent on mega-creators.
Content brief structure for creator partnerships
The content brief structure for creator partnerships runs a single page: the SKU, the specific recipe or usage occasion, 3 required brand mentions, 3 restricted claims (no health claims on non-medical SKUs), the pricing angle, the affiliate link, and 3 example videos that hit the tone. The brief avoids over-scripting because over-scripted creator content underperforms native creator voice by 40 to 60 percent on engagement rate.
Buyer intent content for food brand blogs
Buyer intent content on food brand blogs covers 8 to 16 pieces targeting explicit purchase-decision queries: “where to buy [brand],” “[brand] subscription vs. one-time,” “best [category] for [use case],” and “[brand] gift bundle.” Every buyer intent piece runs 1,400 to 2,400 words with a comparison table, product cards, and a clear conversion path to the specific SKU that matches the query intent. Buyer intent content converts at 3 to 6 percent versus 1 to 2 percent on recipe content because the shopper landed already planning to buy, not exploring a usage occasion.
Where-to-buy content structure
Where-to-buy content structure covers online (DTC storefront, Amazon, Target.com, Whole Foods online), retail (specific chain locators with the store finder embedded), and international (customs limitations, retailer partners abroad). Every piece names specific retailers, links to the store locator, and includes an FAQ block covering shipping availability, subscription options, and gift card compatibility. Where-to-buy content ranks for branded discovery queries the DTC storefront otherwise loses to competitor affiliate reviews.
Subscription versus one-time comparison content
Subscription versus one-time comparison content converts subscription commitments at 3 to 6 percent because it addresses the price-sensitivity concern head-on with a specific math table. The piece covers the discount structure (15 percent lifetime), the skip-a-month mechanic, the pause-anytime rule, the cancellation policy, and the specific yearly savings for the brand’s average consumption cadence. Cross-reference the retention structure on our food and beverage marketing retainer page.
Content refresh cadence on food brand pillars
Content refresh cadence on food brand content pillars runs a rolling audit every 12 to 24 months by pillar. Recipes get refreshed every 12 months with new photography, updated schema, and any nutrition or ingredient adjustments. Ingredient comparison guides refresh every 18 months to update market data. Sourcing story pages refresh every 24 months to reflect farm partnership changes and new harvest angles. Buyer intent content refreshes every 12 months to update retailer availability and pricing.
Recipe refresh priority order
Recipe refresh priority runs by organic traffic rank. The top 20 recipes by monthly organic sessions get refreshed first (new photography, schema audit, related recipe internal links, updated nutrition). The next 40 get refreshed at 15 months. The remaining recipes get refreshed opportunistically when the ranking slips past position 15 in Google. Skipping the refresh cadence lets recipe rankings drift out of the top 3 inside 18 months as newer competitor recipes take the position.
Schema audit checklist per refresh
The schema audit checklist per refresh runs 8 items: Recipe schema completeness, aggregateRating count and accuracy, nutrition data accuracy, prepTime and cookTime match the recipe body, image URLs valid at CDN, related recipe internal links working, product card SKU URL live, and Google Search Console rich result eligibility validated. This checklist takes 20 minutes per recipe and prevents the schema drift that costs recipe rankings 20 to 40 positions quietly.
Reporting cadence for food brand content marketing
Reporting cadence on food brand content marketing runs a monthly executive report plus a quarterly business review. The monthly report ships in the first business week and covers organic sessions by pillar, top 10 ranking recipes with position trend, ingredient guide ranking movements, sourcing page performance, and organic-attributed DTC revenue. Every number carries a comparison to the prior month and a plain-language interpretation the founder reads in 7 minutes.
Metrics that matter for content marketing
Metrics that matter for food brand content marketing: organic sessions by pillar, recipe rich result impressions in Search Console, organic conversion rate to hero SKU pages, organic-attributed DTC revenue, and top 20 ranking positions by monthly organic sessions. Vanity metrics that do not matter: total pageviews without conversion context, average time on page without conversion attribution, and social share counts. The monthly report skips the vanity block entirely.
Quarterly business review structure
The quarterly business review runs 90 minutes with the founder, head of content, and SEO lead. Agenda: organic traffic trend by pillar, top 10 winning content pieces, top 10 losing content pieces (candidates for refresh or removal), competitive gap analysis against 5 named competitor brands, and next quarter’s content calendar with recipes and ingredient guides queued. According to Ahrefs content marketing research, brands running quarterly content audits outperform brands running annual audits by 40 to 70 percent on organic revenue over a 24-month window.
Internal linking discipline across food brand content
Internal linking discipline across food brand content moves authority from recipe pages toward hero SKU product pages and comparison guides. Every recipe links to the hero SKU it uses inline (once in the ingredient list, once in a bottom call-out card). Every ingredient comparison guide links to 3 to 6 recipes using the winning ingredient plus the hero SKU product page. Every sourcing story links to the 2 to 4 SKUs sourced from that specific farm or cooperative.
Anchor text strategy across recipe hubs
Anchor text on internal links varies across recipe hubs to avoid over-optimization patterns Google penalizes. Exact-match anchor (“single-origin Ethiopian coffee”) runs on 20 to 30 percent of internal links. Partial-match variations (“our Ethiopian roast”) run on 30 to 40 percent. Branded anchors (the SKU name) run on 20 to 30 percent. Generic anchors (“shop the coffee”) fill the remaining 10 to 20 percent. This ratio holds ranking without triggering the over-optimization penalty that shows up on brands that anchor-text-stuff every internal link with the same exact-match keyword. Cross-reference the linking layer on our food and beverage web design page.
Link equity from ingredient guides to SKU pages
Link equity from ingredient guides passes to SKU pages when the guide’s comparison table names the hero SKU in the winning column with a product card, and when the guide’s body links to 3 to 6 recipes that use the winning ingredient. This 3-hop path (guide to recipe to SKU) pushes authority from a high-traffic informational query down to a high-intent transactional page. According to Search Engine Land SEO coverage, informational content that internally links to transactional pages produces 2 to 4 times higher organic revenue than isolated content silos.
Wrapping up content marketing for food brands
Content marketing for food brands is the organic engine that turns a DTC snack, drink, or CPG storefront into a search-driven revenue channel. Recipe hub of 40 to 100 recipes. Ingredient comparison guides at 12 to 24 pieces. Sourcing story pages at 6 to 12 pieces. Buyer intent content at 8 to 16 pieces. Creator syndication calendar with 12 to 30 creators per quarter. Refresh cadence at 12 to 24 months by pillar. Reporting with organic sessions and organic revenue attribution.
If your DTC food brand is running paid social at 20,000 dollars monthly with a broken blog and zero recipe schema, professional content marketing for food brands pays for itself inside the first 90 days on organic traffic captured. Redefine Web ships content marketing inside our monthly retainer packages. Book a call and we will walk through the last three DTC food brands we built recipe hubs for, pillar by pillar.
Anchor text on internal links varies across recipe hubs to avoid over-optimization patterns Google penalizes. Exact-match anchor (“single-origin Ethiopian coffee”) runs on 20 to 30 percent of internal links. Partial-match variations (“our Ethiopian roast”) run on 30 to 40 percent. Branded anchors (the SKU name) run on 20 to 30 percent. Generic anchors (“shop the coffee”) fill the remaining 10 to 20 percent. This ratio holds ranking without triggering the over-optimization penalty that shows up on brands that anchor-text-stuff every internal link with the same exact-match keyword. Cross-reference the linking layer on our food and beverage web design page.
Link equity from ingredient guides to SKU pages
Link equity from ingredient guides passes to SKU pages when the guide’s comparison table names the hero SKU in the winning column with a product card, and when the guide’s body links to 3 to 6 recipes that use the winning ingredient. This 3-hop path (guide to recipe to SKU) pushes authority from a high-traffic informational query down to a high-intent transactional page. According to Search Engine Land SEO coverage, informational content that internally links to transactional pages produces 2 to 4 times higher organic revenue than isolated content silos.
Wrapping up content marketing for food brands
Content marketing for food brands is the organic engine that turns a DTC snack, drink, or CPG storefront into a search-driven revenue channel. Recipe hub of 40 to 100 recipes. Ingredient comparison guides at 12 to 24 pieces. Sourcing story pages at 6 to 12 pieces. Buyer intent content at 8 to 16 pieces. Creator syndication calendar with 12 to 30 creators per quarter. Refresh cadence at 12 to 24 months by pillar. Reporting with organic sessions and organic revenue attribution.
If your DTC food brand is running paid social at 20,000 dollars monthly with a broken blog and zero recipe schema, professional content marketing for food brands pays for itself inside the first 90 days on organic traffic captured. Redefine Web ships content marketing inside our monthly retainer packages. Book a call and we will walk through the last three DTC food brands we built recipe hubs for, pillar by pillar.
Internal linking discipline across food brand content moves authority from recipe pages toward hero SKU product pages and comparison guides. Every recipe links to the hero SKU it uses inline (once in the ingredient list, once in a bottom call-out card). Every ingredient comparison guide links to 3 to 6 recipes using the winning ingredient plus the hero SKU product page. Every sourcing story links to the 2 to 4 SKUs sourced from that specific farm or cooperative.
Anchor text strategy across recipe hubs
Anchor text on internal links varies across recipe hubs to avoid over-optimization patterns Google penalizes. Exact-match anchor (“single-origin Ethiopian coffee”) runs on 20 to 30 percent of internal links. Partial-match variations (“our Ethiopian roast”) run on 30 to 40 percent. Branded anchors (the SKU name) run on 20 to 30 percent. Generic anchors (“shop the coffee”) fill the remaining 10 to 20 percent. This ratio holds ranking without triggering the over-optimization penalty that shows up on brands that anchor-text-stuff every internal link with the same exact-match keyword. Cross-reference the linking layer on our food and beverage web design page.
Link equity from ingredient guides to SKU pages
Link equity from ingredient guides passes to SKU pages when the guide’s comparison table names the hero SKU in the winning column with a product card, and when the guide’s body links to 3 to 6 recipes that use the winning ingredient. This 3-hop path (guide to recipe to SKU) pushes authority from a high-traffic informational query down to a high-intent transactional page. According to Search Engine Land SEO coverage, informational content that internally links to transactional pages produces 2 to 4 times higher organic revenue than isolated content silos.
Wrapping up content marketing for food brands
Content marketing for food brands is the organic engine that turns a DTC snack, drink, or CPG storefront into a search-driven revenue channel. Recipe hub of 40 to 100 recipes. Ingredient comparison guides at 12 to 24 pieces. Sourcing story pages at 6 to 12 pieces. Buyer intent content at 8 to 16 pieces. Creator syndication calendar with 12 to 30 creators per quarter. Refresh cadence at 12 to 24 months by pillar. Reporting with organic sessions and organic revenue attribution.
If your DTC food brand is running paid social at 20,000 dollars monthly with a broken blog and zero recipe schema, professional content marketing for food brands pays for itself inside the first 90 days on organic traffic captured. Redefine Web ships content marketing inside our monthly retainer packages. Book a call and we will walk through the last three DTC food brands we built recipe hubs for, pillar by pillar.
Content marketing for food brands starts with a recipe hub because recipe queries account for 40 to 60 percent of high-intent search volume in the food category. Every hero SKU needs 4 to 12 recipes anchored to it, each targeting a specific occasion and audience.
Skip the recipe hub and the brand loses the search real estate that pulls DTC storefront traffic month over month at zero incremental paid cost. Recipe traffic converts at 2 to 4 percent because the shopper landed with usage intent, not passive discovery, which is why food brands win on recipes.
Recipe schema and Google rich result eligibility
Every recipe page ships schema.org Recipe markup including cookTime, prepTime, recipeIngredient, recipeInstructions, nutrition, and aggregateRating. Correctly marked-up recipes qualify for Google’s recipe rich result carousel that pulls 3 to 6 times higher click-through rate than a plain blue link. The schema layer takes 15 minutes per recipe to author and 30 minutes to validate in Google Search Console. Cross-reference the recipe search stack on our food and beverage SEO page.
Recipe hub structure that scales
The recipe hub structure runs 40 to 100 recipes at maturity, organized by hero SKU (4 to 12 recipes per SKU) plus occasion tags (breakfast, weeknight dinner, meal prep, brunch, holiday). Every recipe links back to the hero SKU product page with the SKU embedded in an inline card. The hub earns internal linking value from ingredient comparison guides and the sourcing story pages, which feeds recipe ranking on Google. According to Google Search Central recipe structured data guidance, complete Recipe schema markup is required for eligibility in the recipe carousel and the ingredient search filter.
Pillar structure for food brand content marketing
The pillar structure on content marketing for food brands runs 4 content pillars concurrently: recipe hub (40 to 100 recipes), ingredient comparison guides (12 to 24 guides), sourcing story pages (6 to 12 pages), and buyer intent content (where to buy, subscription vs. one-time, gift bundle guides). Every pillar covers a distinct search intent and every pillar links back to the hero SKU product pages.
Ingredient comparison guide format
Ingredient comparison guides run 1,800 to 3,200 words comparing 2 to 4 ingredient types on 6 to 10 attributes with a comparison table, real-world use case examples, and links to the hero SKU that uses the specific ingredient. Example: organic vs. conventional oats compares nutritional profile, sourcing chain, cost, environmental impact, and taste on a 6-column table. The brand’s SKU appears in the winning column with a product card. These guides rank 3 to 8 months after publication and pull steady-state organic traffic.
Sourcing story pages that build trust
Sourcing story pages name the specific farms, cooperatives, or suppliers the brand sources from, with photos of the farms, farmer quotes, and specific harvest windows. A coffee brand’s Ethiopian farm page ranks for “single-origin Ethiopian coffee” and “Yirgacheffe coffee origin” plus 40 long-tail variations. The sourcing page pulls trust-building traffic that converts at 4 to 6 percent because the shopper landed pattern-matching on transparency and named provenance. Every sourcing page includes farmer or cooperative quotes, harvest dates, and a link back to 3 to 5 hero SKU pages that source from the named supplier.
Vejrø hospitality content case study
Vejrø Resort, a Danish private-island destination with an on-site restaurant focused on organic, locally sourced cuisine, joined us with strong social engagement and no organic-search real estate. Guests found the resort on Instagram but never in Google search for terms like “private island resort Denmark,” “farm-to-table hospitality Denmark,” or “Vejrø restaurant.” The same organic-search gap shows up on DTC food brands running paid social at 20,000 dollars monthly with a broken blog and zero recipe schema.
We built the conversion-focused website with on-site and off-site SEO tuned to the travel-niche keyword clusters, competitor analysis against comparable boutique resorts, and mobile-first design prioritizing guest discovery. Every page carried the structured data qualifying it for Google’s rich results in the hospitality category. Every internal link pushed authority toward the direct-booking conversion path.
Three months later, Vejrø hit 10,000 plus organic visitors, ranked for 200 plus first-page keywords, and pulled a 2.2 percent booking conversion rate from organic traffic. The same pattern applies to content marketing for food brands: recipe schema, ingredient comparison guides, and sourcing story pages pull organic traffic at 20 to 40 percent conversion into hero SKU pages inside 6 months when the content quality matches search intent and every page carries the right structured data markup. Vejrø also proved out the reporting discipline: every monthly report named the exact page, the exact keyword cluster, and the exact search feature (rich result, sitelinks, image pack) driving the incremental organic revenue instead of hiding behind aggregate traffic charts.
Recipe cadence and content calendar for food brands
Recipe cadence on a working food brand content calendar ships 2 to 4 new recipes per week during the first 6 months and drops to 1 per week at maturity. Each recipe takes 4 to 6 hours to produce (write, test in the kitchen, photograph, schema author, publish). At 3 recipes per week, the brand hits 78 recipes inside 6 months plus a backlog of ingredient comparison and sourcing content queued behind the recipe production line.
| Content pillar | Target volume year 1 | Production cost per piece | Refresh cadence |
|---|---|---|---|
| Recipe hub | 40 to 100 recipes | $180 to $320 | Every 12 months |
| Ingredient comparison guides | 12 to 24 guides | $450 to $780 | Every 18 months |
| Sourcing story pages | 6 to 12 pages | $680 to $1,200 | Every 24 months |
| Buyer intent content | 8 to 16 pieces | $220 to $420 | Every 12 months |
Photography as a content calendar constraint
Photography is the actual constraint on recipe cadence, not writing. Every recipe needs 6 to 12 photos: hero shot, ingredient flat lay, prep in progress, plated result, storage, and step shots for the schema markup. A working food brand batches photography 8 recipes at a time to keep the cost per recipe under 200 dollars. Skip the batching and the per-recipe cost climbs to 400 to 600 dollars, which caps recipe cadence at 1 per week and slows organic ranking timeline by 6 months.
Seasonal content calendar planning
Seasonal content calendar planning maps recipes and comparison guides to the seasonal windows they need to rank in. A Christmas cookie recipe needs to publish in September to rank by early December. A Valentine’s chocolate guide needs to publish in November to rank by early February. A back-to-school lunchbox recipe needs to publish in June to rank by late August. The 60-to-90-day ranking curve dictates the calendar.
Creator syndication inside food brand content
Creator syndication on food brand content marketing amplifies the recipe hub through Instagram Reels, TikTok, and YouTube Shorts creators paid to post their own version of the brand’s hero recipes. The creator content pulls net-new audiences into the recipe hub through the creator’s Link in Bio or Amazon Storefront tag. The syndication calendar names 12 to 30 creators per quarter with specific recipes assigned to each.
One brand we picked up had a spreadsheet titled “creator outreach 2023” with 47 rows and 3 responses. All 3 responses were auto-replies. The spreadsheet named zero recipes and offered flat rates below 100 dollars per post. Nobody posts a 30-second video for 87 dollars flat. Nobody.
Creator content commercial terms that work
Working creator content commercial terms run 350 to 1,500 dollars flat per post plus a 12 to 25 percent commission on tagged sales across a 30-day window. The commission mechanic pulls creators into follow-up posts because the incremental revenue continues past the initial fee. Mid-tier creators (30k to 150k followers) hit the sweet spot for food brand content because their engagement rate typically runs 4 to 8 percent versus 0.8 to 1.6 percent on mega-creators.
Content brief structure for creator partnerships
The content brief structure for creator partnerships runs a single page: the SKU, the specific recipe or usage occasion, 3 required brand mentions, 3 restricted claims (no health claims on non-medical SKUs), the pricing angle, the affiliate link, and 3 example videos that hit the tone. The brief avoids over-scripting because over-scripted creator content underperforms native creator voice by 40 to 60 percent on engagement rate.
Buyer intent content for food brand blogs
Buyer intent content on food brand blogs covers 8 to 16 pieces targeting explicit purchase-decision queries: “where to buy [brand],” “[brand] subscription vs. one-time,” “best [category] for [use case],” and “[brand] gift bundle.” Every buyer intent piece runs 1,400 to 2,400 words with a comparison table, product cards, and a clear conversion path to the specific SKU that matches the query intent. Buyer intent content converts at 3 to 6 percent versus 1 to 2 percent on recipe content because the shopper landed already planning to buy, not exploring a usage occasion.
Where-to-buy content structure
Where-to-buy content structure covers online (DTC storefront, Amazon, Target.com, Whole Foods online), retail (specific chain locators with the store finder embedded), and international (customs limitations, retailer partners abroad). Every piece names specific retailers, links to the store locator, and includes an FAQ block covering shipping availability, subscription options, and gift card compatibility. Where-to-buy content ranks for branded discovery queries the DTC storefront otherwise loses to competitor affiliate reviews.
Subscription versus one-time comparison content
Subscription versus one-time comparison content converts subscription commitments at 3 to 6 percent because it addresses the price-sensitivity concern head-on with a specific math table. The piece covers the discount structure (15 percent lifetime), the skip-a-month mechanic, the pause-anytime rule, the cancellation policy, and the specific yearly savings for the brand’s average consumption cadence. Cross-reference the retention structure on our food and beverage marketing retainer page.
Content refresh cadence on food brand pillars
Content refresh cadence on food brand content pillars runs a rolling audit every 12 to 24 months by pillar. Recipes get refreshed every 12 months with new photography, updated schema, and any nutrition or ingredient adjustments. Ingredient comparison guides refresh every 18 months to update market data. Sourcing story pages refresh every 24 months to reflect farm partnership changes and new harvest angles. Buyer intent content refreshes every 12 months to update retailer availability and pricing.
Recipe refresh priority order
Recipe refresh priority runs by organic traffic rank. The top 20 recipes by monthly organic sessions get refreshed first (new photography, schema audit, related recipe internal links, updated nutrition). The next 40 get refreshed at 15 months. The remaining recipes get refreshed opportunistically when the ranking slips past position 15 in Google. Skipping the refresh cadence lets recipe rankings drift out of the top 3 inside 18 months as newer competitor recipes take the position.
Schema audit checklist per refresh
The schema audit checklist per refresh runs 8 items: Recipe schema completeness, aggregateRating count and accuracy, nutrition data accuracy, prepTime and cookTime match the recipe body, image URLs valid at CDN, related recipe internal links working, product card SKU URL live, and Google Search Console rich result eligibility validated. This checklist takes 20 minutes per recipe and prevents the schema drift that costs recipe rankings 20 to 40 positions quietly.
Reporting cadence for food brand content marketing
Reporting cadence on food brand content marketing runs a monthly executive report plus a quarterly business review. The monthly report ships in the first business week and covers organic sessions by pillar, top 10 ranking recipes with position trend, ingredient guide ranking movements, sourcing page performance, and organic-attributed DTC revenue. Every number carries a comparison to the prior month and a plain-language interpretation the founder reads in 7 minutes.
Metrics that matter for content marketing
Metrics that matter for food brand content marketing: organic sessions by pillar, recipe rich result impressions in Search Console, organic conversion rate to hero SKU pages, organic-attributed DTC revenue, and top 20 ranking positions by monthly organic sessions. Vanity metrics that do not matter: total pageviews without conversion context, average time on page without conversion attribution, and social share counts. The monthly report skips the vanity block entirely.
Quarterly business review structure
The quarterly business review runs 90 minutes with the founder, head of content, and SEO lead. Agenda: organic traffic trend by pillar, top 10 winning content pieces, top 10 losing content pieces (candidates for refresh or removal), competitive gap analysis against 5 named competitor brands, and next quarter’s content calendar with recipes and ingredient guides queued. According to Ahrefs content marketing research, brands running quarterly content audits outperform brands running annual audits by 40 to 70 percent on organic revenue over a 24-month window.
Internal linking discipline across food brand content
Internal linking discipline across food brand content moves authority from recipe pages toward hero SKU product pages and comparison guides. Every recipe links to the hero SKU it uses inline (once in the ingredient list, once in a bottom call-out card). Every ingredient comparison guide links to 3 to 6 recipes using the winning ingredient plus the hero SKU product page. Every sourcing story links to the 2 to 4 SKUs sourced from that specific farm or cooperative.
Anchor text strategy across recipe hubs
Anchor text on internal links varies across recipe hubs to avoid over-optimization patterns Google penalizes. Exact-match anchor (“single-origin Ethiopian coffee”) runs on 20 to 30 percent of internal links. Partial-match variations (“our Ethiopian roast”) run on 30 to 40 percent. Branded anchors (the SKU name) run on 20 to 30 percent. Generic anchors (“shop the coffee”) fill the remaining 10 to 20 percent. This ratio holds ranking without triggering the over-optimization penalty that shows up on brands that anchor-text-stuff every internal link with the same exact-match keyword. Cross-reference the linking layer on our food and beverage web design page.
Link equity from ingredient guides to SKU pages
Link equity from ingredient guides passes to SKU pages when the guide’s comparison table names the hero SKU in the winning column with a product card, and when the guide’s body links to 3 to 6 recipes that use the winning ingredient. This 3-hop path (guide to recipe to SKU) pushes authority from a high-traffic informational query down to a high-intent transactional page. According to Search Engine Land SEO coverage, informational content that internally links to transactional pages produces 2 to 4 times higher organic revenue than isolated content silos.
Wrapping up content marketing for food brands
Content marketing for food brands is the organic engine that turns a DTC snack, drink, or CPG storefront into a search-driven revenue channel. Recipe hub of 40 to 100 recipes. Ingredient comparison guides at 12 to 24 pieces. Sourcing story pages at 6 to 12 pieces. Buyer intent content at 8 to 16 pieces. Creator syndication calendar with 12 to 30 creators per quarter. Refresh cadence at 12 to 24 months by pillar. Reporting with organic sessions and organic revenue attribution.
If your DTC food brand is running paid social at 20,000 dollars monthly with a broken blog and zero recipe schema, professional content marketing for food brands pays for itself inside the first 90 days on organic traffic captured. Redefine Web ships content marketing inside our monthly retainer packages. Book a call and we will walk through the last three DTC food brands we built recipe hubs for, pillar by pillar.
Content marketing for food brands starts with a recipe hub because recipe queries account for 40 to 60 percent of high-intent search volume in the food category. Every hero SKU needs 4 to 12 recipes anchored to it, each targeting a specific occasion and audience.
Skip the recipe hub and the brand loses the search real estate that pulls DTC storefront traffic month over month at zero incremental paid cost. Recipe traffic converts at 2 to 4 percent because the shopper landed with usage intent, not passive discovery, which is why food brands win on recipes.
Recipe schema and Google rich result eligibility
Every recipe page ships schema.org Recipe markup including cookTime, prepTime, recipeIngredient, recipeInstructions, nutrition, and aggregateRating. Correctly marked-up recipes qualify for Google’s recipe rich result carousel that pulls 3 to 6 times higher click-through rate than a plain blue link. The schema layer takes 15 minutes per recipe to author and 30 minutes to validate in Google Search Console. Cross-reference the recipe search stack on our food and beverage SEO page.
Recipe hub structure that scales
The recipe hub structure runs 40 to 100 recipes at maturity, organized by hero SKU (4 to 12 recipes per SKU) plus occasion tags (breakfast, weeknight dinner, meal prep, brunch, holiday). Every recipe links back to the hero SKU product page with the SKU embedded in an inline card. The hub earns internal linking value from ingredient comparison guides and the sourcing story pages, which feeds recipe ranking on Google. According to Google Search Central recipe structured data guidance, complete Recipe schema markup is required for eligibility in the recipe carousel and the ingredient search filter.
Pillar structure for food brand content marketing
The pillar structure on content marketing for food brands runs 4 content pillars concurrently: recipe hub (40 to 100 recipes), ingredient comparison guides (12 to 24 guides), sourcing story pages (6 to 12 pages), and buyer intent content (where to buy, subscription vs. one-time, gift bundle guides). Every pillar covers a distinct search intent and every pillar links back to the hero SKU product pages.
Ingredient comparison guide format
Ingredient comparison guides run 1,800 to 3,200 words comparing 2 to 4 ingredient types on 6 to 10 attributes with a comparison table, real-world use case examples, and links to the hero SKU that uses the specific ingredient. Example: organic vs. conventional oats compares nutritional profile, sourcing chain, cost, environmental impact, and taste on a 6-column table. The brand’s SKU appears in the winning column with a product card. These guides rank 3 to 8 months after publication and pull steady-state organic traffic.
Sourcing story pages that build trust
Sourcing story pages name the specific farms, cooperatives, or suppliers the brand sources from, with photos of the farms, farmer quotes, and specific harvest windows. A coffee brand’s Ethiopian farm page ranks for “single-origin Ethiopian coffee” and “Yirgacheffe coffee origin” plus 40 long-tail variations. The sourcing page pulls trust-building traffic that converts at 4 to 6 percent because the shopper landed pattern-matching on transparency and named provenance. Every sourcing page includes farmer or cooperative quotes, harvest dates, and a link back to 3 to 5 hero SKU pages that source from the named supplier.
Vejrø hospitality content case study
Vejrø Resort, a Danish private-island destination with an on-site restaurant focused on organic, locally sourced cuisine, joined us with strong social engagement and no organic-search real estate. Guests found the resort on Instagram but never in Google search for terms like “private island resort Denmark,” “farm-to-table hospitality Denmark,” or “Vejrø restaurant.” The same organic-search gap shows up on DTC food brands running paid social at 20,000 dollars monthly with a broken blog and zero recipe schema.
We built the conversion-focused website with on-site and off-site SEO tuned to the travel-niche keyword clusters, competitor analysis against comparable boutique resorts, and mobile-first design prioritizing guest discovery. Every page carried the structured data qualifying it for Google’s rich results in the hospitality category. Every internal link pushed authority toward the direct-booking conversion path.
Three months later, Vejrø hit 10,000 plus organic visitors, ranked for 200 plus first-page keywords, and pulled a 2.2 percent booking conversion rate from organic traffic. The same pattern applies to content marketing for food brands: recipe schema, ingredient comparison guides, and sourcing story pages pull organic traffic at 20 to 40 percent conversion into hero SKU pages inside 6 months when the content quality matches search intent and every page carries the right structured data markup. Vejrø also proved out the reporting discipline: every monthly report named the exact page, the exact keyword cluster, and the exact search feature (rich result, sitelinks, image pack) driving the incremental organic revenue instead of hiding behind aggregate traffic charts.
Recipe cadence and content calendar for food brands
Recipe cadence on a working food brand content calendar ships 2 to 4 new recipes per week during the first 6 months and drops to 1 per week at maturity. Each recipe takes 4 to 6 hours to produce (write, test in the kitchen, photograph, schema author, publish). At 3 recipes per week, the brand hits 78 recipes inside 6 months plus a backlog of ingredient comparison and sourcing content queued behind the recipe production line.
| Content pillar | Target volume year 1 | Production cost per piece | Refresh cadence |
|---|---|---|---|
| Recipe hub | 40 to 100 recipes | $180 to $320 | Every 12 months |
| Ingredient comparison guides | 12 to 24 guides | $450 to $780 | Every 18 months |
| Sourcing story pages | 6 to 12 pages | $680 to $1,200 | Every 24 months |
| Buyer intent content | 8 to 16 pieces | $220 to $420 | Every 12 months |
Photography as a content calendar constraint
Photography is the actual constraint on recipe cadence, not writing. Every recipe needs 6 to 12 photos: hero shot, ingredient flat lay, prep in progress, plated result, storage, and step shots for the schema markup. A working food brand batches photography 8 recipes at a time to keep the cost per recipe under 200 dollars. Skip the batching and the per-recipe cost climbs to 400 to 600 dollars, which caps recipe cadence at 1 per week and slows organic ranking timeline by 6 months.
Seasonal content calendar planning
Seasonal content calendar planning maps recipes and comparison guides to the seasonal windows they need to rank in. A Christmas cookie recipe needs to publish in September to rank by early December. A Valentine’s chocolate guide needs to publish in November to rank by early February. A back-to-school lunchbox recipe needs to publish in June to rank by late August. The 60-to-90-day ranking curve dictates the calendar.
Creator syndication inside food brand content
Creator syndication on food brand content marketing amplifies the recipe hub through Instagram Reels, TikTok, and YouTube Shorts creators paid to post their own version of the brand’s hero recipes. The creator content pulls net-new audiences into the recipe hub through the creator’s Link in Bio or Amazon Storefront tag. The syndication calendar names 12 to 30 creators per quarter with specific recipes assigned to each.
One brand we picked up had a spreadsheet titled “creator outreach 2023” with 47 rows and 3 responses. All 3 responses were auto-replies. The spreadsheet named zero recipes and offered flat rates below 100 dollars per post. Nobody posts a 30-second video for 87 dollars flat. Nobody.
Creator content commercial terms that work
Working creator content commercial terms run 350 to 1,500 dollars flat per post plus a 12 to 25 percent commission on tagged sales across a 30-day window. The commission mechanic pulls creators into follow-up posts because the incremental revenue continues past the initial fee. Mid-tier creators (30k to 150k followers) hit the sweet spot for food brand content because their engagement rate typically runs 4 to 8 percent versus 0.8 to 1.6 percent on mega-creators.
Content brief structure for creator partnerships
The content brief structure for creator partnerships runs a single page: the SKU, the specific recipe or usage occasion, 3 required brand mentions, 3 restricted claims (no health claims on non-medical SKUs), the pricing angle, the affiliate link, and 3 example videos that hit the tone. The brief avoids over-scripting because over-scripted creator content underperforms native creator voice by 40 to 60 percent on engagement rate.
Buyer intent content for food brand blogs
Buyer intent content on food brand blogs covers 8 to 16 pieces targeting explicit purchase-decision queries: “where to buy [brand],” “[brand] subscription vs. one-time,” “best [category] for [use case],” and “[brand] gift bundle.” Every buyer intent piece runs 1,400 to 2,400 words with a comparison table, product cards, and a clear conversion path to the specific SKU that matches the query intent. Buyer intent content converts at 3 to 6 percent versus 1 to 2 percent on recipe content because the shopper landed already planning to buy, not exploring a usage occasion.
Where-to-buy content structure
Where-to-buy content structure covers online (DTC storefront, Amazon, Target.com, Whole Foods online), retail (specific chain locators with the store finder embedded), and international (customs limitations, retailer partners abroad). Every piece names specific retailers, links to the store locator, and includes an FAQ block covering shipping availability, subscription options, and gift card compatibility. Where-to-buy content ranks for branded discovery queries the DTC storefront otherwise loses to competitor affiliate reviews.
Subscription versus one-time comparison content
Subscription versus one-time comparison content converts subscription commitments at 3 to 6 percent because it addresses the price-sensitivity concern head-on with a specific math table. The piece covers the discount structure (15 percent lifetime), the skip-a-month mechanic, the pause-anytime rule, the cancellation policy, and the specific yearly savings for the brand’s average consumption cadence. Cross-reference the retention structure on our food and beverage marketing retainer page.
Content refresh cadence on food brand pillars
Content refresh cadence on food brand content pillars runs a rolling audit every 12 to 24 months by pillar. Recipes get refreshed every 12 months with new photography, updated schema, and any nutrition or ingredient adjustments. Ingredient comparison guides refresh every 18 months to update market data. Sourcing story pages refresh every 24 months to reflect farm partnership changes and new harvest angles. Buyer intent content refreshes every 12 months to update retailer availability and pricing.
Recipe refresh priority order
Recipe refresh priority runs by organic traffic rank. The top 20 recipes by monthly organic sessions get refreshed first (new photography, schema audit, related recipe internal links, updated nutrition). The next 40 get refreshed at 15 months. The remaining recipes get refreshed opportunistically when the ranking slips past position 15 in Google. Skipping the refresh cadence lets recipe rankings drift out of the top 3 inside 18 months as newer competitor recipes take the position.
Schema audit checklist per refresh
The schema audit checklist per refresh runs 8 items: Recipe schema completeness, aggregateRating count and accuracy, nutrition data accuracy, prepTime and cookTime match the recipe body, image URLs valid at CDN, related recipe internal links working, product card SKU URL live, and Google Search Console rich result eligibility validated. This checklist takes 20 minutes per recipe and prevents the schema drift that costs recipe rankings 20 to 40 positions quietly.
Reporting cadence for food brand content marketing
Reporting cadence on food brand content marketing runs a monthly executive report plus a quarterly business review. The monthly report ships in the first business week and covers organic sessions by pillar, top 10 ranking recipes with position trend, ingredient guide ranking movements, sourcing page performance, and organic-attributed DTC revenue. Every number carries a comparison to the prior month and a plain-language interpretation the founder reads in 7 minutes.
Metrics that matter for content marketing
Metrics that matter for food brand content marketing: organic sessions by pillar, recipe rich result impressions in Search Console, organic conversion rate to hero SKU pages, organic-attributed DTC revenue, and top 20 ranking positions by monthly organic sessions. Vanity metrics that do not matter: total pageviews without conversion context, average time on page without conversion attribution, and social share counts. The monthly report skips the vanity block entirely.
Quarterly business review structure
The quarterly business review runs 90 minutes with the founder, head of content, and SEO lead. Agenda: organic traffic trend by pillar, top 10 winning content pieces, top 10 losing content pieces (candidates for refresh or removal), competitive gap analysis against 5 named competitor brands, and next quarter’s content calendar with recipes and ingredient guides queued. According to Ahrefs content marketing research, brands running quarterly content audits outperform brands running annual audits by 40 to 70 percent on organic revenue over a 24-month window.
Internal linking discipline across food brand content
Internal linking discipline across food brand content moves authority from recipe pages toward hero SKU product pages and comparison guides. Every recipe links to the hero SKU it uses inline (once in the ingredient list, once in a bottom call-out card). Every ingredient comparison guide links to 3 to 6 recipes using the winning ingredient plus the hero SKU product page. Every sourcing story links to the 2 to 4 SKUs sourced from that specific farm or cooperative.
Anchor text strategy across recipe hubs
Anchor text on internal links varies across recipe hubs to avoid over-optimization patterns Google penalizes. Exact-match anchor (“single-origin Ethiopian coffee”) runs on 20 to 30 percent of internal links. Partial-match variations (“our Ethiopian roast”) run on 30 to 40 percent. Branded anchors (the SKU name) run on 20 to 30 percent. Generic anchors (“shop the coffee”) fill the remaining 10 to 20 percent. This ratio holds ranking without triggering the over-optimization penalty that shows up on brands that anchor-text-stuff every internal link with the same exact-match keyword. Cross-reference the linking layer on our food and beverage web design page.
Link equity from ingredient guides to SKU pages
Link equity from ingredient guides passes to SKU pages when the guide’s comparison table names the hero SKU in the winning column with a product card, and when the guide’s body links to 3 to 6 recipes that use the winning ingredient. This 3-hop path (guide to recipe to SKU) pushes authority from a high-traffic informational query down to a high-intent transactional page. According to Search Engine Land SEO coverage, informational content that internally links to transactional pages produces 2 to 4 times higher organic revenue than isolated content silos.
Wrapping up content marketing for food brands
Content marketing for food brands is the organic engine that turns a DTC snack, drink, or CPG storefront into a search-driven revenue channel. Recipe hub of 40 to 100 recipes. Ingredient comparison guides at 12 to 24 pieces. Sourcing story pages at 6 to 12 pieces. Buyer intent content at 8 to 16 pieces. Creator syndication calendar with 12 to 30 creators per quarter. Refresh cadence at 12 to 24 months by pillar. Reporting with organic sessions and organic revenue attribution.
If your DTC food brand is running paid social at 20,000 dollars monthly with a broken blog and zero recipe schema, professional content marketing for food brands pays for itself inside the first 90 days on organic traffic captured. Redefine Web ships content marketing inside our monthly retainer packages. Book a call and we will walk through the last three DTC food brands we built recipe hubs for, pillar by pillar.
Internal linking discipline across food brand content moves authority from recipe pages toward hero SKU product pages and comparison guides. Every recipe links to the hero SKU it uses inline (once in the ingredient list, once in a bottom call-out card). Every ingredient comparison guide links to 3 to 6 recipes using the winning ingredient plus the hero SKU product page. Every sourcing story links to the 2 to 4 SKUs sourced from that specific farm or cooperative.
Anchor text strategy across recipe hubs
Anchor text on internal links varies across recipe hubs to avoid over-optimization patterns Google penalizes. Exact-match anchor (“single-origin Ethiopian coffee”) runs on 20 to 30 percent of internal links. Partial-match variations (“our Ethiopian roast”) run on 30 to 40 percent. Branded anchors (the SKU name) run on 20 to 30 percent. Generic anchors (“shop the coffee”) fill the remaining 10 to 20 percent. This ratio holds ranking without triggering the over-optimization penalty that shows up on brands that anchor-text-stuff every internal link with the same exact-match keyword. Cross-reference the linking layer on our food and beverage web design page.
Link equity from ingredient guides to SKU pages
Link equity from ingredient guides passes to SKU pages when the guide’s comparison table names the hero SKU in the winning column with a product card, and when the guide’s body links to 3 to 6 recipes that use the winning ingredient. This 3-hop path (guide to recipe to SKU) pushes authority from a high-traffic informational query down to a high-intent transactional page. According to Search Engine Land SEO coverage, informational content that internally links to transactional pages produces 2 to 4 times higher organic revenue than isolated content silos.
Wrapping up content marketing for food brands
Content marketing for food brands is the organic engine that turns a DTC snack, drink, or CPG storefront into a search-driven revenue channel. Recipe hub of 40 to 100 recipes. Ingredient comparison guides at 12 to 24 pieces. Sourcing story pages at 6 to 12 pieces. Buyer intent content at 8 to 16 pieces. Creator syndication calendar with 12 to 30 creators per quarter. Refresh cadence at 12 to 24 months by pillar. Reporting with organic sessions and organic revenue attribution.
If your DTC food brand is running paid social at 20,000 dollars monthly with a broken blog and zero recipe schema, professional content marketing for food brands pays for itself inside the first 90 days on organic traffic captured. Redefine Web ships content marketing inside our monthly retainer packages. Book a call and we will walk through the last three DTC food brands we built recipe hubs for, pillar by pillar.
Content marketing for food brands starts with a recipe hub because recipe queries account for 40 to 60 percent of high-intent search volume in the food category. Every hero SKU needs 4 to 12 recipes anchored to it, each targeting a specific occasion and audience.
Skip the recipe hub and the brand loses the search real estate that pulls DTC storefront traffic month over month at zero incremental paid cost. Recipe traffic converts at 2 to 4 percent because the shopper landed with usage intent, not passive discovery, which is why food brands win on recipes.
Recipe schema and Google rich result eligibility
Every recipe page ships schema.org Recipe markup including cookTime, prepTime, recipeIngredient, recipeInstructions, nutrition, and aggregateRating. Correctly marked-up recipes qualify for Google’s recipe rich result carousel that pulls 3 to 6 times higher click-through rate than a plain blue link. The schema layer takes 15 minutes per recipe to author and 30 minutes to validate in Google Search Console. Cross-reference the recipe search stack on our food and beverage SEO page.
Recipe hub structure that scales
The recipe hub structure runs 40 to 100 recipes at maturity, organized by hero SKU (4 to 12 recipes per SKU) plus occasion tags (breakfast, weeknight dinner, meal prep, brunch, holiday). Every recipe links back to the hero SKU product page with the SKU embedded in an inline card. The hub earns internal linking value from ingredient comparison guides and the sourcing story pages, which feeds recipe ranking on Google. According to Google Search Central recipe structured data guidance, complete Recipe schema markup is required for eligibility in the recipe carousel and the ingredient search filter.
Pillar structure for food brand content marketing
The pillar structure on content marketing for food brands runs 4 content pillars concurrently: recipe hub (40 to 100 recipes), ingredient comparison guides (12 to 24 guides), sourcing story pages (6 to 12 pages), and buyer intent content (where to buy, subscription vs. one-time, gift bundle guides). Every pillar covers a distinct search intent and every pillar links back to the hero SKU product pages.
Ingredient comparison guide format
Ingredient comparison guides run 1,800 to 3,200 words comparing 2 to 4 ingredient types on 6 to 10 attributes with a comparison table, real-world use case examples, and links to the hero SKU that uses the specific ingredient. Example: organic vs. conventional oats compares nutritional profile, sourcing chain, cost, environmental impact, and taste on a 6-column table. The brand’s SKU appears in the winning column with a product card. These guides rank 3 to 8 months after publication and pull steady-state organic traffic.
Sourcing story pages that build trust
Sourcing story pages name the specific farms, cooperatives, or suppliers the brand sources from, with photos of the farms, farmer quotes, and specific harvest windows. A coffee brand’s Ethiopian farm page ranks for “single-origin Ethiopian coffee” and “Yirgacheffe coffee origin” plus 40 long-tail variations. The sourcing page pulls trust-building traffic that converts at 4 to 6 percent because the shopper landed pattern-matching on transparency and named provenance. Every sourcing page includes farmer or cooperative quotes, harvest dates, and a link back to 3 to 5 hero SKU pages that source from the named supplier.
Vejrø hospitality content case study
Vejrø Resort, a Danish private-island destination with an on-site restaurant focused on organic, locally sourced cuisine, joined us with strong social engagement and no organic-search real estate. Guests found the resort on Instagram but never in Google search for terms like “private island resort Denmark,” “farm-to-table hospitality Denmark,” or “Vejrø restaurant.” The same organic-search gap shows up on DTC food brands running paid social at 20,000 dollars monthly with a broken blog and zero recipe schema.
We built the conversion-focused website with on-site and off-site SEO tuned to the travel-niche keyword clusters, competitor analysis against comparable boutique resorts, and mobile-first design prioritizing guest discovery. Every page carried the structured data qualifying it for Google’s rich results in the hospitality category. Every internal link pushed authority toward the direct-booking conversion path.
Three months later, Vejrø hit 10,000 plus organic visitors, ranked for 200 plus first-page keywords, and pulled a 2.2 percent booking conversion rate from organic traffic. The same pattern applies to content marketing for food brands: recipe schema, ingredient comparison guides, and sourcing story pages pull organic traffic at 20 to 40 percent conversion into hero SKU pages inside 6 months when the content quality matches search intent and every page carries the right structured data markup. Vejrø also proved out the reporting discipline: every monthly report named the exact page, the exact keyword cluster, and the exact search feature (rich result, sitelinks, image pack) driving the incremental organic revenue instead of hiding behind aggregate traffic charts.
Recipe cadence and content calendar for food brands
Recipe cadence on a working food brand content calendar ships 2 to 4 new recipes per week during the first 6 months and drops to 1 per week at maturity. Each recipe takes 4 to 6 hours to produce (write, test in the kitchen, photograph, schema author, publish). At 3 recipes per week, the brand hits 78 recipes inside 6 months plus a backlog of ingredient comparison and sourcing content queued behind the recipe production line.
| Content pillar | Target volume year 1 | Production cost per piece | Refresh cadence |
|---|---|---|---|
| Recipe hub | 40 to 100 recipes | $180 to $320 | Every 12 months |
| Ingredient comparison guides | 12 to 24 guides | $450 to $780 | Every 18 months |
| Sourcing story pages | 6 to 12 pages | $680 to $1,200 | Every 24 months |
| Buyer intent content | 8 to 16 pieces | $220 to $420 | Every 12 months |
Photography as a content calendar constraint
Photography is the actual constraint on recipe cadence, not writing. Every recipe needs 6 to 12 photos: hero shot, ingredient flat lay, prep in progress, plated result, storage, and step shots for the schema markup. A working food brand batches photography 8 recipes at a time to keep the cost per recipe under 200 dollars. Skip the batching and the per-recipe cost climbs to 400 to 600 dollars, which caps recipe cadence at 1 per week and slows organic ranking timeline by 6 months.
Seasonal content calendar planning
Seasonal content calendar planning maps recipes and comparison guides to the seasonal windows they need to rank in. A Christmas cookie recipe needs to publish in September to rank by early December. A Valentine’s chocolate guide needs to publish in November to rank by early February. A back-to-school lunchbox recipe needs to publish in June to rank by late August. The 60-to-90-day ranking curve dictates the calendar.
Creator syndication inside food brand content
Creator syndication on food brand content marketing amplifies the recipe hub through Instagram Reels, TikTok, and YouTube Shorts creators paid to post their own version of the brand’s hero recipes. The creator content pulls net-new audiences into the recipe hub through the creator’s Link in Bio or Amazon Storefront tag. The syndication calendar names 12 to 30 creators per quarter with specific recipes assigned to each.
One brand we picked up had a spreadsheet titled “creator outreach 2023” with 47 rows and 3 responses. All 3 responses were auto-replies. The spreadsheet named zero recipes and offered flat rates below 100 dollars per post. Nobody posts a 30-second video for 87 dollars flat. Nobody.
Creator content commercial terms that work
Working creator content commercial terms run 350 to 1,500 dollars flat per post plus a 12 to 25 percent commission on tagged sales across a 30-day window. The commission mechanic pulls creators into follow-up posts because the incremental revenue continues past the initial fee. Mid-tier creators (30k to 150k followers) hit the sweet spot for food brand content because their engagement rate typically runs 4 to 8 percent versus 0.8 to 1.6 percent on mega-creators.
Content brief structure for creator partnerships
The content brief structure for creator partnerships runs a single page: the SKU, the specific recipe or usage occasion, 3 required brand mentions, 3 restricted claims (no health claims on non-medical SKUs), the pricing angle, the affiliate link, and 3 example videos that hit the tone. The brief avoids over-scripting because over-scripted creator content underperforms native creator voice by 40 to 60 percent on engagement rate.
Buyer intent content for food brand blogs
Buyer intent content on food brand blogs covers 8 to 16 pieces targeting explicit purchase-decision queries: “where to buy [brand],” “[brand] subscription vs. one-time,” “best [category] for [use case],” and “[brand] gift bundle.” Every buyer intent piece runs 1,400 to 2,400 words with a comparison table, product cards, and a clear conversion path to the specific SKU that matches the query intent. Buyer intent content converts at 3 to 6 percent versus 1 to 2 percent on recipe content because the shopper landed already planning to buy, not exploring a usage occasion.
Where-to-buy content structure
Where-to-buy content structure covers online (DTC storefront, Amazon, Target.com, Whole Foods online), retail (specific chain locators with the store finder embedded), and international (customs limitations, retailer partners abroad). Every piece names specific retailers, links to the store locator, and includes an FAQ block covering shipping availability, subscription options, and gift card compatibility. Where-to-buy content ranks for branded discovery queries the DTC storefront otherwise loses to competitor affiliate reviews.
Subscription versus one-time comparison content
Subscription versus one-time comparison content converts subscription commitments at 3 to 6 percent because it addresses the price-sensitivity concern head-on with a specific math table. The piece covers the discount structure (15 percent lifetime), the skip-a-month mechanic, the pause-anytime rule, the cancellation policy, and the specific yearly savings for the brand’s average consumption cadence. Cross-reference the retention structure on our food and beverage marketing retainer page.
Content refresh cadence on food brand pillars
Content refresh cadence on food brand content pillars runs a rolling audit every 12 to 24 months by pillar. Recipes get refreshed every 12 months with new photography, updated schema, and any nutrition or ingredient adjustments. Ingredient comparison guides refresh every 18 months to update market data. Sourcing story pages refresh every 24 months to reflect farm partnership changes and new harvest angles. Buyer intent content refreshes every 12 months to update retailer availability and pricing.
Recipe refresh priority order
Recipe refresh priority runs by organic traffic rank. The top 20 recipes by monthly organic sessions get refreshed first (new photography, schema audit, related recipe internal links, updated nutrition). The next 40 get refreshed at 15 months. The remaining recipes get refreshed opportunistically when the ranking slips past position 15 in Google. Skipping the refresh cadence lets recipe rankings drift out of the top 3 inside 18 months as newer competitor recipes take the position.
Schema audit checklist per refresh
The schema audit checklist per refresh runs 8 items: Recipe schema completeness, aggregateRating count and accuracy, nutrition data accuracy, prepTime and cookTime match the recipe body, image URLs valid at CDN, related recipe internal links working, product card SKU URL live, and Google Search Console rich result eligibility validated. This checklist takes 20 minutes per recipe and prevents the schema drift that costs recipe rankings 20 to 40 positions quietly.
Reporting cadence for food brand content marketing
Reporting cadence on food brand content marketing runs a monthly executive report plus a quarterly business review. The monthly report ships in the first business week and covers organic sessions by pillar, top 10 ranking recipes with position trend, ingredient guide ranking movements, sourcing page performance, and organic-attributed DTC revenue. Every number carries a comparison to the prior month and a plain-language interpretation the founder reads in 7 minutes.
Metrics that matter for content marketing
Metrics that matter for food brand content marketing: organic sessions by pillar, recipe rich result impressions in Search Console, organic conversion rate to hero SKU pages, organic-attributed DTC revenue, and top 20 ranking positions by monthly organic sessions. Vanity metrics that do not matter: total pageviews without conversion context, average time on page without conversion attribution, and social share counts. The monthly report skips the vanity block entirely.
Quarterly business review structure
The quarterly business review runs 90 minutes with the founder, head of content, and SEO lead. Agenda: organic traffic trend by pillar, top 10 winning content pieces, top 10 losing content pieces (candidates for refresh or removal), competitive gap analysis against 5 named competitor brands, and next quarter’s content calendar with recipes and ingredient guides queued. According to Ahrefs content marketing research, brands running quarterly content audits outperform brands running annual audits by 40 to 70 percent on organic revenue over a 24-month window.
Internal linking discipline across food brand content
Internal linking discipline across food brand content moves authority from recipe pages toward hero SKU product pages and comparison guides. Every recipe links to the hero SKU it uses inline (once in the ingredient list, once in a bottom call-out card). Every ingredient comparison guide links to 3 to 6 recipes using the winning ingredient plus the hero SKU product page. Every sourcing story links to the 2 to 4 SKUs sourced from that specific farm or cooperative.
Anchor text strategy across recipe hubs
Anchor text on internal links varies across recipe hubs to avoid over-optimization patterns Google penalizes. Exact-match anchor (“single-origin Ethiopian coffee”) runs on 20 to 30 percent of internal links. Partial-match variations (“our Ethiopian roast”) run on 30 to 40 percent. Branded anchors (the SKU name) run on 20 to 30 percent. Generic anchors (“shop the coffee”) fill the remaining 10 to 20 percent. This ratio holds ranking without triggering the over-optimization penalty that shows up on brands that anchor-text-stuff every internal link with the same exact-match keyword. Cross-reference the linking layer on our food and beverage web design page.
Link equity from ingredient guides to SKU pages
Link equity from ingredient guides passes to SKU pages when the guide’s comparison table names the hero SKU in the winning column with a product card, and when the guide’s body links to 3 to 6 recipes that use the winning ingredient. This 3-hop path (guide to recipe to SKU) pushes authority from a high-traffic informational query down to a high-intent transactional page. According to Search Engine Land SEO coverage, informational content that internally links to transactional pages produces 2 to 4 times higher organic revenue than isolated content silos.
Wrapping up content marketing for food brands
Content marketing for food brands is the organic engine that turns a DTC snack, drink, or CPG storefront into a search-driven revenue channel. Recipe hub of 40 to 100 recipes. Ingredient comparison guides at 12 to 24 pieces. Sourcing story pages at 6 to 12 pieces. Buyer intent content at 8 to 16 pieces. Creator syndication calendar with 12 to 30 creators per quarter. Refresh cadence at 12 to 24 months by pillar. Reporting with organic sessions and organic revenue attribution.
If your DTC food brand is running paid social at 20,000 dollars monthly with a broken blog and zero recipe schema, professional content marketing for food brands pays for itself inside the first 90 days on organic traffic captured. Redefine Web ships content marketing inside our monthly retainer packages. Book a call and we will walk through the last three DTC food brands we built recipe hubs for, pillar by pillar.
Content marketing for food brands starts with a recipe hub because recipe queries account for 40 to 60 percent of high-intent search volume in the food category. Every hero SKU needs 4 to 12 recipes anchored to it, each targeting a specific occasion and audience.
Skip the recipe hub and the brand loses the search real estate that pulls DTC storefront traffic month over month at zero incremental paid cost. Recipe traffic converts at 2 to 4 percent because the shopper landed with usage intent, not passive discovery, which is why food brands win on recipes.
Recipe schema and Google rich result eligibility
Every recipe page ships schema.org Recipe markup including cookTime, prepTime, recipeIngredient, recipeInstructions, nutrition, and aggregateRating. Correctly marked-up recipes qualify for Google’s recipe rich result carousel that pulls 3 to 6 times higher click-through rate than a plain blue link. The schema layer takes 15 minutes per recipe to author and 30 minutes to validate in Google Search Console. Cross-reference the recipe search stack on our food and beverage SEO page.
Recipe hub structure that scales
The recipe hub structure runs 40 to 100 recipes at maturity, organized by hero SKU (4 to 12 recipes per SKU) plus occasion tags (breakfast, weeknight dinner, meal prep, brunch, holiday). Every recipe links back to the hero SKU product page with the SKU embedded in an inline card. The hub earns internal linking value from ingredient comparison guides and the sourcing story pages, which feeds recipe ranking on Google. According to Google Search Central recipe structured data guidance, complete Recipe schema markup is required for eligibility in the recipe carousel and the ingredient search filter.
Pillar structure for food brand content marketing
The pillar structure on content marketing for food brands runs 4 content pillars concurrently: recipe hub (40 to 100 recipes), ingredient comparison guides (12 to 24 guides), sourcing story pages (6 to 12 pages), and buyer intent content (where to buy, subscription vs. one-time, gift bundle guides). Every pillar covers a distinct search intent and every pillar links back to the hero SKU product pages.
Ingredient comparison guide format
Ingredient comparison guides run 1,800 to 3,200 words comparing 2 to 4 ingredient types on 6 to 10 attributes with a comparison table, real-world use case examples, and links to the hero SKU that uses the specific ingredient. Example: organic vs. conventional oats compares nutritional profile, sourcing chain, cost, environmental impact, and taste on a 6-column table. The brand’s SKU appears in the winning column with a product card. These guides rank 3 to 8 months after publication and pull steady-state organic traffic.
Sourcing story pages that build trust
Sourcing story pages name the specific farms, cooperatives, or suppliers the brand sources from, with photos of the farms, farmer quotes, and specific harvest windows. A coffee brand’s Ethiopian farm page ranks for “single-origin Ethiopian coffee” and “Yirgacheffe coffee origin” plus 40 long-tail variations. The sourcing page pulls trust-building traffic that converts at 4 to 6 percent because the shopper landed pattern-matching on transparency and named provenance. Every sourcing page includes farmer or cooperative quotes, harvest dates, and a link back to 3 to 5 hero SKU pages that source from the named supplier.
Vejrø hospitality content case study
Vejrø Resort, a Danish private-island destination with an on-site restaurant focused on organic, locally sourced cuisine, joined us with strong social engagement and no organic-search real estate. Guests found the resort on Instagram but never in Google search for terms like “private island resort Denmark,” “farm-to-table hospitality Denmark,” or “Vejrø restaurant.” The same organic-search gap shows up on DTC food brands running paid social at 20,000 dollars monthly with a broken blog and zero recipe schema.
We built the conversion-focused website with on-site and off-site SEO tuned to the travel-niche keyword clusters, competitor analysis against comparable boutique resorts, and mobile-first design prioritizing guest discovery. Every page carried the structured data qualifying it for Google’s rich results in the hospitality category. Every internal link pushed authority toward the direct-booking conversion path.
Three months later, Vejrø hit 10,000 plus organic visitors, ranked for 200 plus first-page keywords, and pulled a 2.2 percent booking conversion rate from organic traffic. The same pattern applies to content marketing for food brands: recipe schema, ingredient comparison guides, and sourcing story pages pull organic traffic at 20 to 40 percent conversion into hero SKU pages inside 6 months when the content quality matches search intent and every page carries the right structured data markup. Vejrø also proved out the reporting discipline: every monthly report named the exact page, the exact keyword cluster, and the exact search feature (rich result, sitelinks, image pack) driving the incremental organic revenue instead of hiding behind aggregate traffic charts.
Recipe cadence and content calendar for food brands
Recipe cadence on a working food brand content calendar ships 2 to 4 new recipes per week during the first 6 months and drops to 1 per week at maturity. Each recipe takes 4 to 6 hours to produce (write, test in the kitchen, photograph, schema author, publish). At 3 recipes per week, the brand hits 78 recipes inside 6 months plus a backlog of ingredient comparison and sourcing content queued behind the recipe production line.
| Content pillar | Target volume year 1 | Production cost per piece | Refresh cadence |
|---|---|---|---|
| Recipe hub | 40 to 100 recipes | $180 to $320 | Every 12 months |
| Ingredient comparison guides | 12 to 24 guides | $450 to $780 | Every 18 months |
| Sourcing story pages | 6 to 12 pages | $680 to $1,200 | Every 24 months |
| Buyer intent content | 8 to 16 pieces | $220 to $420 | Every 12 months |
Photography as a content calendar constraint
Photography is the actual constraint on recipe cadence, not writing. Every recipe needs 6 to 12 photos: hero shot, ingredient flat lay, prep in progress, plated result, storage, and step shots for the schema markup. A working food brand batches photography 8 recipes at a time to keep the cost per recipe under 200 dollars. Skip the batching and the per-recipe cost climbs to 400 to 600 dollars, which caps recipe cadence at 1 per week and slows organic ranking timeline by 6 months.
Seasonal content calendar planning
Seasonal content calendar planning maps recipes and comparison guides to the seasonal windows they need to rank in. A Christmas cookie recipe needs to publish in September to rank by early December. A Valentine’s chocolate guide needs to publish in November to rank by early February. A back-to-school lunchbox recipe needs to publish in June to rank by late August. The 60-to-90-day ranking curve dictates the calendar.
Creator syndication inside food brand content
Creator syndication on food brand content marketing amplifies the recipe hub through Instagram Reels, TikTok, and YouTube Shorts creators paid to post their own version of the brand’s hero recipes. The creator content pulls net-new audiences into the recipe hub through the creator’s Link in Bio or Amazon Storefront tag. The syndication calendar names 12 to 30 creators per quarter with specific recipes assigned to each.
One brand we picked up had a spreadsheet titled “creator outreach 2023” with 47 rows and 3 responses. All 3 responses were auto-replies. The spreadsheet named zero recipes and offered flat rates below 100 dollars per post. Nobody posts a 30-second video for 87 dollars flat. Nobody.
Creator content commercial terms that work
Working creator content commercial terms run 350 to 1,500 dollars flat per post plus a 12 to 25 percent commission on tagged sales across a 30-day window. The commission mechanic pulls creators into follow-up posts because the incremental revenue continues past the initial fee. Mid-tier creators (30k to 150k followers) hit the sweet spot for food brand content because their engagement rate typically runs 4 to 8 percent versus 0.8 to 1.6 percent on mega-creators.
Content brief structure for creator partnerships
The content brief structure for creator partnerships runs a single page: the SKU, the specific recipe or usage occasion, 3 required brand mentions, 3 restricted claims (no health claims on non-medical SKUs), the pricing angle, the affiliate link, and 3 example videos that hit the tone. The brief avoids over-scripting because over-scripted creator content underperforms native creator voice by 40 to 60 percent on engagement rate.
Buyer intent content for food brand blogs
Buyer intent content on food brand blogs covers 8 to 16 pieces targeting explicit purchase-decision queries: “where to buy [brand],” “[brand] subscription vs. one-time,” “best [category] for [use case],” and “[brand] gift bundle.” Every buyer intent piece runs 1,400 to 2,400 words with a comparison table, product cards, and a clear conversion path to the specific SKU that matches the query intent. Buyer intent content converts at 3 to 6 percent versus 1 to 2 percent on recipe content because the shopper landed already planning to buy, not exploring a usage occasion.
Where-to-buy content structure
Where-to-buy content structure covers online (DTC storefront, Amazon, Target.com, Whole Foods online), retail (specific chain locators with the store finder embedded), and international (customs limitations, retailer partners abroad). Every piece names specific retailers, links to the store locator, and includes an FAQ block covering shipping availability, subscription options, and gift card compatibility. Where-to-buy content ranks for branded discovery queries the DTC storefront otherwise loses to competitor affiliate reviews.
Subscription versus one-time comparison content
Subscription versus one-time comparison content converts subscription commitments at 3 to 6 percent because it addresses the price-sensitivity concern head-on with a specific math table. The piece covers the discount structure (15 percent lifetime), the skip-a-month mechanic, the pause-anytime rule, the cancellation policy, and the specific yearly savings for the brand’s average consumption cadence. Cross-reference the retention structure on our food and beverage marketing retainer page.
Content refresh cadence on food brand pillars
Content refresh cadence on food brand content pillars runs a rolling audit every 12 to 24 months by pillar. Recipes get refreshed every 12 months with new photography, updated schema, and any nutrition or ingredient adjustments. Ingredient comparison guides refresh every 18 months to update market data. Sourcing story pages refresh every 24 months to reflect farm partnership changes and new harvest angles. Buyer intent content refreshes every 12 months to update retailer availability and pricing.
Recipe refresh priority order
Recipe refresh priority runs by organic traffic rank. The top 20 recipes by monthly organic sessions get refreshed first (new photography, schema audit, related recipe internal links, updated nutrition). The next 40 get refreshed at 15 months. The remaining recipes get refreshed opportunistically when the ranking slips past position 15 in Google. Skipping the refresh cadence lets recipe rankings drift out of the top 3 inside 18 months as newer competitor recipes take the position.
Schema audit checklist per refresh
The schema audit checklist per refresh runs 8 items: Recipe schema completeness, aggregateRating count and accuracy, nutrition data accuracy, prepTime and cookTime match the recipe body, image URLs valid at CDN, related recipe internal links working, product card SKU URL live, and Google Search Console rich result eligibility validated. This checklist takes 20 minutes per recipe and prevents the schema drift that costs recipe rankings 20 to 40 positions quietly.
Reporting cadence for food brand content marketing
Reporting cadence on food brand content marketing runs a monthly executive report plus a quarterly business review. The monthly report ships in the first business week and covers organic sessions by pillar, top 10 ranking recipes with position trend, ingredient guide ranking movements, sourcing page performance, and organic-attributed DTC revenue. Every number carries a comparison to the prior month and a plain-language interpretation the founder reads in 7 minutes.
Metrics that matter for content marketing
Metrics that matter for food brand content marketing: organic sessions by pillar, recipe rich result impressions in Search Console, organic conversion rate to hero SKU pages, organic-attributed DTC revenue, and top 20 ranking positions by monthly organic sessions. Vanity metrics that do not matter: total pageviews without conversion context, average time on page without conversion attribution, and social share counts. The monthly report skips the vanity block entirely.
Quarterly business review structure
The quarterly business review runs 90 minutes with the founder, head of content, and SEO lead. Agenda: organic traffic trend by pillar, top 10 winning content pieces, top 10 losing content pieces (candidates for refresh or removal), competitive gap analysis against 5 named competitor brands, and next quarter’s content calendar with recipes and ingredient guides queued. According to Ahrefs content marketing research, brands running quarterly content audits outperform brands running annual audits by 40 to 70 percent on organic revenue over a 24-month window.
Internal linking discipline across food brand content
Internal linking discipline across food brand content moves authority from recipe pages toward hero SKU product pages and comparison guides. Every recipe links to the hero SKU it uses inline (once in the ingredient list, once in a bottom call-out card). Every ingredient comparison guide links to 3 to 6 recipes using the winning ingredient plus the hero SKU product page. Every sourcing story links to the 2 to 4 SKUs sourced from that specific farm or cooperative.
Anchor text strategy across recipe hubs
Anchor text on internal links varies across recipe hubs to avoid over-optimization patterns Google penalizes. Exact-match anchor (“single-origin Ethiopian coffee”) runs on 20 to 30 percent of internal links. Partial-match variations (“our Ethiopian roast”) run on 30 to 40 percent. Branded anchors (the SKU name) run on 20 to 30 percent. Generic anchors (“shop the coffee”) fill the remaining 10 to 20 percent. This ratio holds ranking without triggering the over-optimization penalty that shows up on brands that anchor-text-stuff every internal link with the same exact-match keyword. Cross-reference the linking layer on our food and beverage web design page.
Link equity from ingredient guides to SKU pages
Link equity from ingredient guides passes to SKU pages when the guide’s comparison table names the hero SKU in the winning column with a product card, and when the guide’s body links to 3 to 6 recipes that use the winning ingredient. This 3-hop path (guide to recipe to SKU) pushes authority from a high-traffic informational query down to a high-intent transactional page. According to Search Engine Land SEO coverage, informational content that internally links to transactional pages produces 2 to 4 times higher organic revenue than isolated content silos.
Wrapping up content marketing for food brands
Content marketing for food brands is the organic engine that turns a DTC snack, drink, or CPG storefront into a search-driven revenue channel. Recipe hub of 40 to 100 recipes. Ingredient comparison guides at 12 to 24 pieces. Sourcing story pages at 6 to 12 pieces. Buyer intent content at 8 to 16 pieces. Creator syndication calendar with 12 to 30 creators per quarter. Refresh cadence at 12 to 24 months by pillar. Reporting with organic sessions and organic revenue attribution.
If your DTC food brand is running paid social at 20,000 dollars monthly with a broken blog and zero recipe schema, professional content marketing for food brands pays for itself inside the first 90 days on organic traffic captured. Redefine Web ships content marketing inside our monthly retainer packages. Book a call and we will walk through the last three DTC food brands we built recipe hubs for, pillar by pillar.
Anchor text on internal links varies across recipe hubs to avoid over-optimization patterns Google penalizes. Exact-match anchor (“single-origin Ethiopian coffee”) runs on 20 to 30 percent of internal links. Partial-match variations (“our Ethiopian roast”) run on 30 to 40 percent. Branded anchors (the SKU name) run on 20 to 30 percent. Generic anchors (“shop the coffee”) fill the remaining 10 to 20 percent. This ratio holds ranking without triggering the over-optimization penalty that shows up on brands that anchor-text-stuff every internal link with the same exact-match keyword. Cross-reference the linking layer on our food and beverage web design page.
Link equity from ingredient guides to SKU pages
Link equity from ingredient guides passes to SKU pages when the guide’s comparison table names the hero SKU in the winning column with a product card, and when the guide’s body links to 3 to 6 recipes that use the winning ingredient. This 3-hop path (guide to recipe to SKU) pushes authority from a high-traffic informational query down to a high-intent transactional page. According to Search Engine Land SEO coverage, informational content that internally links to transactional pages produces 2 to 4 times higher organic revenue than isolated content silos.
Wrapping up content marketing for food brands
Content marketing for food brands is the organic engine that turns a DTC snack, drink, or CPG storefront into a search-driven revenue channel. Recipe hub of 40 to 100 recipes. Ingredient comparison guides at 12 to 24 pieces. Sourcing story pages at 6 to 12 pieces. Buyer intent content at 8 to 16 pieces. Creator syndication calendar with 12 to 30 creators per quarter. Refresh cadence at 12 to 24 months by pillar. Reporting with organic sessions and organic revenue attribution.
If your DTC food brand is running paid social at 20,000 dollars monthly with a broken blog and zero recipe schema, professional content marketing for food brands pays for itself inside the first 90 days on organic traffic captured. Redefine Web ships content marketing inside our monthly retainer packages. Book a call and we will walk through the last three DTC food brands we built recipe hubs for, pillar by pillar.
Content marketing for food brands starts with a recipe hub because recipe queries account for 40 to 60 percent of high-intent search volume in the food category. Every hero SKU needs 4 to 12 recipes anchored to it, each targeting a specific occasion and audience.
Skip the recipe hub and the brand loses the search real estate that pulls DTC storefront traffic month over month at zero incremental paid cost. Recipe traffic converts at 2 to 4 percent because the shopper landed with usage intent, not passive discovery, which is why food brands win on recipes.
Recipe schema and Google rich result eligibility
Every recipe page ships schema.org Recipe markup including cookTime, prepTime, recipeIngredient, recipeInstructions, nutrition, and aggregateRating. Correctly marked-up recipes qualify for Google’s recipe rich result carousel that pulls 3 to 6 times higher click-through rate than a plain blue link. The schema layer takes 15 minutes per recipe to author and 30 minutes to validate in Google Search Console. Cross-reference the recipe search stack on our food and beverage SEO page.
Recipe hub structure that scales
The recipe hub structure runs 40 to 100 recipes at maturity, organized by hero SKU (4 to 12 recipes per SKU) plus occasion tags (breakfast, weeknight dinner, meal prep, brunch, holiday). Every recipe links back to the hero SKU product page with the SKU embedded in an inline card. The hub earns internal linking value from ingredient comparison guides and the sourcing story pages, which feeds recipe ranking on Google. According to Google Search Central recipe structured data guidance, complete Recipe schema markup is required for eligibility in the recipe carousel and the ingredient search filter.
Pillar structure for food brand content marketing
The pillar structure on content marketing for food brands runs 4 content pillars concurrently: recipe hub (40 to 100 recipes), ingredient comparison guides (12 to 24 guides), sourcing story pages (6 to 12 pages), and buyer intent content (where to buy, subscription vs. one-time, gift bundle guides). Every pillar covers a distinct search intent and every pillar links back to the hero SKU product pages.
Ingredient comparison guide format
Ingredient comparison guides run 1,800 to 3,200 words comparing 2 to 4 ingredient types on 6 to 10 attributes with a comparison table, real-world use case examples, and links to the hero SKU that uses the specific ingredient. Example: organic vs. conventional oats compares nutritional profile, sourcing chain, cost, environmental impact, and taste on a 6-column table. The brand’s SKU appears in the winning column with a product card. These guides rank 3 to 8 months after publication and pull steady-state organic traffic.
Sourcing story pages that build trust
Sourcing story pages name the specific farms, cooperatives, or suppliers the brand sources from, with photos of the farms, farmer quotes, and specific harvest windows. A coffee brand’s Ethiopian farm page ranks for “single-origin Ethiopian coffee” and “Yirgacheffe coffee origin” plus 40 long-tail variations. The sourcing page pulls trust-building traffic that converts at 4 to 6 percent because the shopper landed pattern-matching on transparency and named provenance. Every sourcing page includes farmer or cooperative quotes, harvest dates, and a link back to 3 to 5 hero SKU pages that source from the named supplier.
Vejrø hospitality content case study
Vejrø Resort, a Danish private-island destination with an on-site restaurant focused on organic, locally sourced cuisine, joined us with strong social engagement and no organic-search real estate. Guests found the resort on Instagram but never in Google search for terms like “private island resort Denmark,” “farm-to-table hospitality Denmark,” or “Vejrø restaurant.” The same organic-search gap shows up on DTC food brands running paid social at 20,000 dollars monthly with a broken blog and zero recipe schema.
We built the conversion-focused website with on-site and off-site SEO tuned to the travel-niche keyword clusters, competitor analysis against comparable boutique resorts, and mobile-first design prioritizing guest discovery. Every page carried the structured data qualifying it for Google’s rich results in the hospitality category. Every internal link pushed authority toward the direct-booking conversion path.
Three months later, Vejrø hit 10,000 plus organic visitors, ranked for 200 plus first-page keywords, and pulled a 2.2 percent booking conversion rate from organic traffic. The same pattern applies to content marketing for food brands: recipe schema, ingredient comparison guides, and sourcing story pages pull organic traffic at 20 to 40 percent conversion into hero SKU pages inside 6 months when the content quality matches search intent and every page carries the right structured data markup. Vejrø also proved out the reporting discipline: every monthly report named the exact page, the exact keyword cluster, and the exact search feature (rich result, sitelinks, image pack) driving the incremental organic revenue instead of hiding behind aggregate traffic charts.
Recipe cadence and content calendar for food brands
Recipe cadence on a working food brand content calendar ships 2 to 4 new recipes per week during the first 6 months and drops to 1 per week at maturity. Each recipe takes 4 to 6 hours to produce (write, test in the kitchen, photograph, schema author, publish). At 3 recipes per week, the brand hits 78 recipes inside 6 months plus a backlog of ingredient comparison and sourcing content queued behind the recipe production line.
| Content pillar | Target volume year 1 | Production cost per piece | Refresh cadence |
|---|---|---|---|
| Recipe hub | 40 to 100 recipes | $180 to $320 | Every 12 months |
| Ingredient comparison guides | 12 to 24 guides | $450 to $780 | Every 18 months |
| Sourcing story pages | 6 to 12 pages | $680 to $1,200 | Every 24 months |
| Buyer intent content | 8 to 16 pieces | $220 to $420 | Every 12 months |
Photography as a content calendar constraint
Photography is the actual constraint on recipe cadence, not writing. Every recipe needs 6 to 12 photos: hero shot, ingredient flat lay, prep in progress, plated result, storage, and step shots for the schema markup. A working food brand batches photography 8 recipes at a time to keep the cost per recipe under 200 dollars. Skip the batching and the per-recipe cost climbs to 400 to 600 dollars, which caps recipe cadence at 1 per week and slows organic ranking timeline by 6 months.
Seasonal content calendar planning
Seasonal content calendar planning maps recipes and comparison guides to the seasonal windows they need to rank in. A Christmas cookie recipe needs to publish in September to rank by early December. A Valentine’s chocolate guide needs to publish in November to rank by early February. A back-to-school lunchbox recipe needs to publish in June to rank by late August. The 60-to-90-day ranking curve dictates the calendar.
Creator syndication inside food brand content
Creator syndication on food brand content marketing amplifies the recipe hub through Instagram Reels, TikTok, and YouTube Shorts creators paid to post their own version of the brand’s hero recipes. The creator content pulls net-new audiences into the recipe hub through the creator’s Link in Bio or Amazon Storefront tag. The syndication calendar names 12 to 30 creators per quarter with specific recipes assigned to each.
One brand we picked up had a spreadsheet titled “creator outreach 2023” with 47 rows and 3 responses. All 3 responses were auto-replies. The spreadsheet named zero recipes and offered flat rates below 100 dollars per post. Nobody posts a 30-second video for 87 dollars flat. Nobody.
Creator content commercial terms that work
Working creator content commercial terms run 350 to 1,500 dollars flat per post plus a 12 to 25 percent commission on tagged sales across a 30-day window. The commission mechanic pulls creators into follow-up posts because the incremental revenue continues past the initial fee. Mid-tier creators (30k to 150k followers) hit the sweet spot for food brand content because their engagement rate typically runs 4 to 8 percent versus 0.8 to 1.6 percent on mega-creators.
Content brief structure for creator partnerships
The content brief structure for creator partnerships runs a single page: the SKU, the specific recipe or usage occasion, 3 required brand mentions, 3 restricted claims (no health claims on non-medical SKUs), the pricing angle, the affiliate link, and 3 example videos that hit the tone. The brief avoids over-scripting because over-scripted creator content underperforms native creator voice by 40 to 60 percent on engagement rate.
Buyer intent content for food brand blogs
Buyer intent content on food brand blogs covers 8 to 16 pieces targeting explicit purchase-decision queries: “where to buy [brand],” “[brand] subscription vs. one-time,” “best [category] for [use case],” and “[brand] gift bundle.” Every buyer intent piece runs 1,400 to 2,400 words with a comparison table, product cards, and a clear conversion path to the specific SKU that matches the query intent. Buyer intent content converts at 3 to 6 percent versus 1 to 2 percent on recipe content because the shopper landed already planning to buy, not exploring a usage occasion.
Where-to-buy content structure
Where-to-buy content structure covers online (DTC storefront, Amazon, Target.com, Whole Foods online), retail (specific chain locators with the store finder embedded), and international (customs limitations, retailer partners abroad). Every piece names specific retailers, links to the store locator, and includes an FAQ block covering shipping availability, subscription options, and gift card compatibility. Where-to-buy content ranks for branded discovery queries the DTC storefront otherwise loses to competitor affiliate reviews.
Subscription versus one-time comparison content
Subscription versus one-time comparison content converts subscription commitments at 3 to 6 percent because it addresses the price-sensitivity concern head-on with a specific math table. The piece covers the discount structure (15 percent lifetime), the skip-a-month mechanic, the pause-anytime rule, the cancellation policy, and the specific yearly savings for the brand’s average consumption cadence. Cross-reference the retention structure on our food and beverage marketing retainer page.
Content refresh cadence on food brand pillars
Content refresh cadence on food brand content pillars runs a rolling audit every 12 to 24 months by pillar. Recipes get refreshed every 12 months with new photography, updated schema, and any nutrition or ingredient adjustments. Ingredient comparison guides refresh every 18 months to update market data. Sourcing story pages refresh every 24 months to reflect farm partnership changes and new harvest angles. Buyer intent content refreshes every 12 months to update retailer availability and pricing.
Recipe refresh priority order
Recipe refresh priority runs by organic traffic rank. The top 20 recipes by monthly organic sessions get refreshed first (new photography, schema audit, related recipe internal links, updated nutrition). The next 40 get refreshed at 15 months. The remaining recipes get refreshed opportunistically when the ranking slips past position 15 in Google. Skipping the refresh cadence lets recipe rankings drift out of the top 3 inside 18 months as newer competitor recipes take the position.
Schema audit checklist per refresh
The schema audit checklist per refresh runs 8 items: Recipe schema completeness, aggregateRating count and accuracy, nutrition data accuracy, prepTime and cookTime match the recipe body, image URLs valid at CDN, related recipe internal links working, product card SKU URL live, and Google Search Console rich result eligibility validated. This checklist takes 20 minutes per recipe and prevents the schema drift that costs recipe rankings 20 to 40 positions quietly.
Reporting cadence for food brand content marketing
Reporting cadence on food brand content marketing runs a monthly executive report plus a quarterly business review. The monthly report ships in the first business week and covers organic sessions by pillar, top 10 ranking recipes with position trend, ingredient guide ranking movements, sourcing page performance, and organic-attributed DTC revenue. Every number carries a comparison to the prior month and a plain-language interpretation the founder reads in 7 minutes.
Metrics that matter for content marketing
Metrics that matter for food brand content marketing: organic sessions by pillar, recipe rich result impressions in Search Console, organic conversion rate to hero SKU pages, organic-attributed DTC revenue, and top 20 ranking positions by monthly organic sessions. Vanity metrics that do not matter: total pageviews without conversion context, average time on page without conversion attribution, and social share counts. The monthly report skips the vanity block entirely.
Quarterly business review structure
The quarterly business review runs 90 minutes with the founder, head of content, and SEO lead. Agenda: organic traffic trend by pillar, top 10 winning content pieces, top 10 losing content pieces (candidates for refresh or removal), competitive gap analysis against 5 named competitor brands, and next quarter’s content calendar with recipes and ingredient guides queued. According to Ahrefs content marketing research, brands running quarterly content audits outperform brands running annual audits by 40 to 70 percent on organic revenue over a 24-month window.
Internal linking discipline across food brand content
Internal linking discipline across food brand content moves authority from recipe pages toward hero SKU product pages and comparison guides. Every recipe links to the hero SKU it uses inline (once in the ingredient list, once in a bottom call-out card). Every ingredient comparison guide links to 3 to 6 recipes using the winning ingredient plus the hero SKU product page. Every sourcing story links to the 2 to 4 SKUs sourced from that specific farm or cooperative.
Anchor text strategy across recipe hubs
Anchor text on internal links varies across recipe hubs to avoid over-optimization patterns Google penalizes. Exact-match anchor (“single-origin Ethiopian coffee”) runs on 20 to 30 percent of internal links. Partial-match variations (“our Ethiopian roast”) run on 30 to 40 percent. Branded anchors (the SKU name) run on 20 to 30 percent. Generic anchors (“shop the coffee”) fill the remaining 10 to 20 percent. This ratio holds ranking without triggering the over-optimization penalty that shows up on brands that anchor-text-stuff every internal link with the same exact-match keyword. Cross-reference the linking layer on our food and beverage web design page.
Link equity from ingredient guides to SKU pages
Link equity from ingredient guides passes to SKU pages when the guide’s comparison table names the hero SKU in the winning column with a product card, and when the guide’s body links to 3 to 6 recipes that use the winning ingredient. This 3-hop path (guide to recipe to SKU) pushes authority from a high-traffic informational query down to a high-intent transactional page. According to Search Engine Land SEO coverage, informational content that internally links to transactional pages produces 2 to 4 times higher organic revenue than isolated content silos.
Wrapping up content marketing for food brands
Content marketing for food brands is the organic engine that turns a DTC snack, drink, or CPG storefront into a search-driven revenue channel. Recipe hub of 40 to 100 recipes. Ingredient comparison guides at 12 to 24 pieces. Sourcing story pages at 6 to 12 pieces. Buyer intent content at 8 to 16 pieces. Creator syndication calendar with 12 to 30 creators per quarter. Refresh cadence at 12 to 24 months by pillar. Reporting with organic sessions and organic revenue attribution.
If your DTC food brand is running paid social at 20,000 dollars monthly with a broken blog and zero recipe schema, professional content marketing for food brands pays for itself inside the first 90 days on organic traffic captured. Redefine Web ships content marketing inside our monthly retainer packages. Book a call and we will walk through the last three DTC food brands we built recipe hubs for, pillar by pillar.
Content marketing for food brands starts with a recipe hub because recipe queries account for 40 to 60 percent of high-intent search volume in the food category. Every hero SKU needs 4 to 12 recipes anchored to it, each targeting a specific occasion and audience.
Skip the recipe hub and the brand loses the search real estate that pulls DTC storefront traffic month over month at zero incremental paid cost. Recipe traffic converts at 2 to 4 percent because the shopper landed with usage intent, not passive discovery, which is why food brands win on recipes.
Recipe schema and Google rich result eligibility
Every recipe page ships schema.org Recipe markup including cookTime, prepTime, recipeIngredient, recipeInstructions, nutrition, and aggregateRating. Correctly marked-up recipes qualify for Google’s recipe rich result carousel that pulls 3 to 6 times higher click-through rate than a plain blue link. The schema layer takes 15 minutes per recipe to author and 30 minutes to validate in Google Search Console. Cross-reference the recipe search stack on our food and beverage SEO page.
Recipe hub structure that scales
The recipe hub structure runs 40 to 100 recipes at maturity, organized by hero SKU (4 to 12 recipes per SKU) plus occasion tags (breakfast, weeknight dinner, meal prep, brunch, holiday). Every recipe links back to the hero SKU product page with the SKU embedded in an inline card. The hub earns internal linking value from ingredient comparison guides and the sourcing story pages, which feeds recipe ranking on Google. According to Google Search Central recipe structured data guidance, complete Recipe schema markup is required for eligibility in the recipe carousel and the ingredient search filter.
Pillar structure for food brand content marketing
The pillar structure on content marketing for food brands runs 4 content pillars concurrently: recipe hub (40 to 100 recipes), ingredient comparison guides (12 to 24 guides), sourcing story pages (6 to 12 pages), and buyer intent content (where to buy, subscription vs. one-time, gift bundle guides). Every pillar covers a distinct search intent and every pillar links back to the hero SKU product pages.
Ingredient comparison guide format
Ingredient comparison guides run 1,800 to 3,200 words comparing 2 to 4 ingredient types on 6 to 10 attributes with a comparison table, real-world use case examples, and links to the hero SKU that uses the specific ingredient. Example: organic vs. conventional oats compares nutritional profile, sourcing chain, cost, environmental impact, and taste on a 6-column table. The brand’s SKU appears in the winning column with a product card. These guides rank 3 to 8 months after publication and pull steady-state organic traffic.
Sourcing story pages that build trust
Sourcing story pages name the specific farms, cooperatives, or suppliers the brand sources from, with photos of the farms, farmer quotes, and specific harvest windows. A coffee brand’s Ethiopian farm page ranks for “single-origin Ethiopian coffee” and “Yirgacheffe coffee origin” plus 40 long-tail variations. The sourcing page pulls trust-building traffic that converts at 4 to 6 percent because the shopper landed pattern-matching on transparency and named provenance. Every sourcing page includes farmer or cooperative quotes, harvest dates, and a link back to 3 to 5 hero SKU pages that source from the named supplier.
Vejrø hospitality content case study
Vejrø Resort, a Danish private-island destination with an on-site restaurant focused on organic, locally sourced cuisine, joined us with strong social engagement and no organic-search real estate. Guests found the resort on Instagram but never in Google search for terms like “private island resort Denmark,” “farm-to-table hospitality Denmark,” or “Vejrø restaurant.” The same organic-search gap shows up on DTC food brands running paid social at 20,000 dollars monthly with a broken blog and zero recipe schema.
We built the conversion-focused website with on-site and off-site SEO tuned to the travel-niche keyword clusters, competitor analysis against comparable boutique resorts, and mobile-first design prioritizing guest discovery. Every page carried the structured data qualifying it for Google’s rich results in the hospitality category. Every internal link pushed authority toward the direct-booking conversion path.
Three months later, Vejrø hit 10,000 plus organic visitors, ranked for 200 plus first-page keywords, and pulled a 2.2 percent booking conversion rate from organic traffic. The same pattern applies to content marketing for food brands: recipe schema, ingredient comparison guides, and sourcing story pages pull organic traffic at 20 to 40 percent conversion into hero SKU pages inside 6 months when the content quality matches search intent and every page carries the right structured data markup. Vejrø also proved out the reporting discipline: every monthly report named the exact page, the exact keyword cluster, and the exact search feature (rich result, sitelinks, image pack) driving the incremental organic revenue instead of hiding behind aggregate traffic charts.
Recipe cadence and content calendar for food brands
Recipe cadence on a working food brand content calendar ships 2 to 4 new recipes per week during the first 6 months and drops to 1 per week at maturity. Each recipe takes 4 to 6 hours to produce (write, test in the kitchen, photograph, schema author, publish). At 3 recipes per week, the brand hits 78 recipes inside 6 months plus a backlog of ingredient comparison and sourcing content queued behind the recipe production line.
| Content pillar | Target volume year 1 | Production cost per piece | Refresh cadence |
|---|---|---|---|
| Recipe hub | 40 to 100 recipes | $180 to $320 | Every 12 months |
| Ingredient comparison guides | 12 to 24 guides | $450 to $780 | Every 18 months |
| Sourcing story pages | 6 to 12 pages | $680 to $1,200 | Every 24 months |
| Buyer intent content | 8 to 16 pieces | $220 to $420 | Every 12 months |
Photography as a content calendar constraint
Photography is the actual constraint on recipe cadence, not writing. Every recipe needs 6 to 12 photos: hero shot, ingredient flat lay, prep in progress, plated result, storage, and step shots for the schema markup. A working food brand batches photography 8 recipes at a time to keep the cost per recipe under 200 dollars. Skip the batching and the per-recipe cost climbs to 400 to 600 dollars, which caps recipe cadence at 1 per week and slows organic ranking timeline by 6 months.
Seasonal content calendar planning
Seasonal content calendar planning maps recipes and comparison guides to the seasonal windows they need to rank in. A Christmas cookie recipe needs to publish in September to rank by early December. A Valentine’s chocolate guide needs to publish in November to rank by early February. A back-to-school lunchbox recipe needs to publish in June to rank by late August. The 60-to-90-day ranking curve dictates the calendar.
Creator syndication inside food brand content
Creator syndication on food brand content marketing amplifies the recipe hub through Instagram Reels, TikTok, and YouTube Shorts creators paid to post their own version of the brand’s hero recipes. The creator content pulls net-new audiences into the recipe hub through the creator’s Link in Bio or Amazon Storefront tag. The syndication calendar names 12 to 30 creators per quarter with specific recipes assigned to each.
One brand we picked up had a spreadsheet titled “creator outreach 2023” with 47 rows and 3 responses. All 3 responses were auto-replies. The spreadsheet named zero recipes and offered flat rates below 100 dollars per post. Nobody posts a 30-second video for 87 dollars flat. Nobody.
Creator content commercial terms that work
Working creator content commercial terms run 350 to 1,500 dollars flat per post plus a 12 to 25 percent commission on tagged sales across a 30-day window. The commission mechanic pulls creators into follow-up posts because the incremental revenue continues past the initial fee. Mid-tier creators (30k to 150k followers) hit the sweet spot for food brand content because their engagement rate typically runs 4 to 8 percent versus 0.8 to 1.6 percent on mega-creators.
Content brief structure for creator partnerships
The content brief structure for creator partnerships runs a single page: the SKU, the specific recipe or usage occasion, 3 required brand mentions, 3 restricted claims (no health claims on non-medical SKUs), the pricing angle, the affiliate link, and 3 example videos that hit the tone. The brief avoids over-scripting because over-scripted creator content underperforms native creator voice by 40 to 60 percent on engagement rate.
Buyer intent content for food brand blogs
Buyer intent content on food brand blogs covers 8 to 16 pieces targeting explicit purchase-decision queries: “where to buy [brand],” “[brand] subscription vs. one-time,” “best [category] for [use case],” and “[brand] gift bundle.” Every buyer intent piece runs 1,400 to 2,400 words with a comparison table, product cards, and a clear conversion path to the specific SKU that matches the query intent. Buyer intent content converts at 3 to 6 percent versus 1 to 2 percent on recipe content because the shopper landed already planning to buy, not exploring a usage occasion.
Where-to-buy content structure
Where-to-buy content structure covers online (DTC storefront, Amazon, Target.com, Whole Foods online), retail (specific chain locators with the store finder embedded), and international (customs limitations, retailer partners abroad). Every piece names specific retailers, links to the store locator, and includes an FAQ block covering shipping availability, subscription options, and gift card compatibility. Where-to-buy content ranks for branded discovery queries the DTC storefront otherwise loses to competitor affiliate reviews.
Subscription versus one-time comparison content
Subscription versus one-time comparison content converts subscription commitments at 3 to 6 percent because it addresses the price-sensitivity concern head-on with a specific math table. The piece covers the discount structure (15 percent lifetime), the skip-a-month mechanic, the pause-anytime rule, the cancellation policy, and the specific yearly savings for the brand’s average consumption cadence. Cross-reference the retention structure on our food and beverage marketing retainer page.
Content refresh cadence on food brand pillars
Content refresh cadence on food brand content pillars runs a rolling audit every 12 to 24 months by pillar. Recipes get refreshed every 12 months with new photography, updated schema, and any nutrition or ingredient adjustments. Ingredient comparison guides refresh every 18 months to update market data. Sourcing story pages refresh every 24 months to reflect farm partnership changes and new harvest angles. Buyer intent content refreshes every 12 months to update retailer availability and pricing.
Recipe refresh priority order
Recipe refresh priority runs by organic traffic rank. The top 20 recipes by monthly organic sessions get refreshed first (new photography, schema audit, related recipe internal links, updated nutrition). The next 40 get refreshed at 15 months. The remaining recipes get refreshed opportunistically when the ranking slips past position 15 in Google. Skipping the refresh cadence lets recipe rankings drift out of the top 3 inside 18 months as newer competitor recipes take the position.
Schema audit checklist per refresh
The schema audit checklist per refresh runs 8 items: Recipe schema completeness, aggregateRating count and accuracy, nutrition data accuracy, prepTime and cookTime match the recipe body, image URLs valid at CDN, related recipe internal links working, product card SKU URL live, and Google Search Console rich result eligibility validated. This checklist takes 20 minutes per recipe and prevents the schema drift that costs recipe rankings 20 to 40 positions quietly.
Reporting cadence for food brand content marketing
Reporting cadence on food brand content marketing runs a monthly executive report plus a quarterly business review. The monthly report ships in the first business week and covers organic sessions by pillar, top 10 ranking recipes with position trend, ingredient guide ranking movements, sourcing page performance, and organic-attributed DTC revenue. Every number carries a comparison to the prior month and a plain-language interpretation the founder reads in 7 minutes.
Metrics that matter for content marketing
Metrics that matter for food brand content marketing: organic sessions by pillar, recipe rich result impressions in Search Console, organic conversion rate to hero SKU pages, organic-attributed DTC revenue, and top 20 ranking positions by monthly organic sessions. Vanity metrics that do not matter: total pageviews without conversion context, average time on page without conversion attribution, and social share counts. The monthly report skips the vanity block entirely.
Quarterly business review structure
The quarterly business review runs 90 minutes with the founder, head of content, and SEO lead. Agenda: organic traffic trend by pillar, top 10 winning content pieces, top 10 losing content pieces (candidates for refresh or removal), competitive gap analysis against 5 named competitor brands, and next quarter’s content calendar with recipes and ingredient guides queued. According to Ahrefs content marketing research, brands running quarterly content audits outperform brands running annual audits by 40 to 70 percent on organic revenue over a 24-month window.
Internal linking discipline across food brand content
Internal linking discipline across food brand content moves authority from recipe pages toward hero SKU product pages and comparison guides. Every recipe links to the hero SKU it uses inline (once in the ingredient list, once in a bottom call-out card). Every ingredient comparison guide links to 3 to 6 recipes using the winning ingredient plus the hero SKU product page. Every sourcing story links to the 2 to 4 SKUs sourced from that specific farm or cooperative.
Anchor text strategy across recipe hubs
Anchor text on internal links varies across recipe hubs to avoid over-optimization patterns Google penalizes. Exact-match anchor (“single-origin Ethiopian coffee”) runs on 20 to 30 percent of internal links. Partial-match variations (“our Ethiopian roast”) run on 30 to 40 percent. Branded anchors (the SKU name) run on 20 to 30 percent. Generic anchors (“shop the coffee”) fill the remaining 10 to 20 percent. This ratio holds ranking without triggering the over-optimization penalty that shows up on brands that anchor-text-stuff every internal link with the same exact-match keyword. Cross-reference the linking layer on our food and beverage web design page.
Link equity from ingredient guides to SKU pages
Link equity from ingredient guides passes to SKU pages when the guide’s comparison table names the hero SKU in the winning column with a product card, and when the guide’s body links to 3 to 6 recipes that use the winning ingredient. This 3-hop path (guide to recipe to SKU) pushes authority from a high-traffic informational query down to a high-intent transactional page. According to Search Engine Land SEO coverage, informational content that internally links to transactional pages produces 2 to 4 times higher organic revenue than isolated content silos.
Wrapping up content marketing for food brands
Content marketing for food brands is the organic engine that turns a DTC snack, drink, or CPG storefront into a search-driven revenue channel. Recipe hub of 40 to 100 recipes. Ingredient comparison guides at 12 to 24 pieces. Sourcing story pages at 6 to 12 pieces. Buyer intent content at 8 to 16 pieces. Creator syndication calendar with 12 to 30 creators per quarter. Refresh cadence at 12 to 24 months by pillar. Reporting with organic sessions and organic revenue attribution.
If your DTC food brand is running paid social at 20,000 dollars monthly with a broken blog and zero recipe schema, professional content marketing for food brands pays for itself inside the first 90 days on organic traffic captured. Redefine Web ships content marketing inside our monthly retainer packages. Book a call and we will walk through the last three DTC food brands we built recipe hubs for, pillar by pillar.
Internal linking discipline across food brand content moves authority from recipe pages toward hero SKU product pages and comparison guides. Every recipe links to the hero SKU it uses inline (once in the ingredient list, once in a bottom call-out card). Every ingredient comparison guide links to 3 to 6 recipes using the winning ingredient plus the hero SKU product page. Every sourcing story links to the 2 to 4 SKUs sourced from that specific farm or cooperative.
Anchor text strategy across recipe hubs
Anchor text on internal links varies across recipe hubs to avoid over-optimization patterns Google penalizes. Exact-match anchor (“single-origin Ethiopian coffee”) runs on 20 to 30 percent of internal links. Partial-match variations (“our Ethiopian roast”) run on 30 to 40 percent. Branded anchors (the SKU name) run on 20 to 30 percent. Generic anchors (“shop the coffee”) fill the remaining 10 to 20 percent. This ratio holds ranking without triggering the over-optimization penalty that shows up on brands that anchor-text-stuff every internal link with the same exact-match keyword. Cross-reference the linking layer on our food and beverage web design page.
Link equity from ingredient guides to SKU pages
Link equity from ingredient guides passes to SKU pages when the guide’s comparison table names the hero SKU in the winning column with a product card, and when the guide’s body links to 3 to 6 recipes that use the winning ingredient. This 3-hop path (guide to recipe to SKU) pushes authority from a high-traffic informational query down to a high-intent transactional page. According to Search Engine Land SEO coverage, informational content that internally links to transactional pages produces 2 to 4 times higher organic revenue than isolated content silos.
Wrapping up content marketing for food brands
Content marketing for food brands is the organic engine that turns a DTC snack, drink, or CPG storefront into a search-driven revenue channel. Recipe hub of 40 to 100 recipes. Ingredient comparison guides at 12 to 24 pieces. Sourcing story pages at 6 to 12 pieces. Buyer intent content at 8 to 16 pieces. Creator syndication calendar with 12 to 30 creators per quarter. Refresh cadence at 12 to 24 months by pillar. Reporting with organic sessions and organic revenue attribution.
If your DTC food brand is running paid social at 20,000 dollars monthly with a broken blog and zero recipe schema, professional content marketing for food brands pays for itself inside the first 90 days on organic traffic captured. Redefine Web ships content marketing inside our monthly retainer packages. Book a call and we will walk through the last three DTC food brands we built recipe hubs for, pillar by pillar.
Content marketing for food brands starts with a recipe hub because recipe queries account for 40 to 60 percent of high-intent search volume in the food category. Every hero SKU needs 4 to 12 recipes anchored to it, each targeting a specific occasion and audience.
Skip the recipe hub and the brand loses the search real estate that pulls DTC storefront traffic month over month at zero incremental paid cost. Recipe traffic converts at 2 to 4 percent because the shopper landed with usage intent, not passive discovery, which is why food brands win on recipes.
Recipe schema and Google rich result eligibility
Every recipe page ships schema.org Recipe markup including cookTime, prepTime, recipeIngredient, recipeInstructions, nutrition, and aggregateRating. Correctly marked-up recipes qualify for Google’s recipe rich result carousel that pulls 3 to 6 times higher click-through rate than a plain blue link. The schema layer takes 15 minutes per recipe to author and 30 minutes to validate in Google Search Console. Cross-reference the recipe search stack on our food and beverage SEO page.
Recipe hub structure that scales
The recipe hub structure runs 40 to 100 recipes at maturity, organized by hero SKU (4 to 12 recipes per SKU) plus occasion tags (breakfast, weeknight dinner, meal prep, brunch, holiday). Every recipe links back to the hero SKU product page with the SKU embedded in an inline card. The hub earns internal linking value from ingredient comparison guides and the sourcing story pages, which feeds recipe ranking on Google. According to Google Search Central recipe structured data guidance, complete Recipe schema markup is required for eligibility in the recipe carousel and the ingredient search filter.
Pillar structure for food brand content marketing
The pillar structure on content marketing for food brands runs 4 content pillars concurrently: recipe hub (40 to 100 recipes), ingredient comparison guides (12 to 24 guides), sourcing story pages (6 to 12 pages), and buyer intent content (where to buy, subscription vs. one-time, gift bundle guides). Every pillar covers a distinct search intent and every pillar links back to the hero SKU product pages.
Ingredient comparison guide format
Ingredient comparison guides run 1,800 to 3,200 words comparing 2 to 4 ingredient types on 6 to 10 attributes with a comparison table, real-world use case examples, and links to the hero SKU that uses the specific ingredient. Example: organic vs. conventional oats compares nutritional profile, sourcing chain, cost, environmental impact, and taste on a 6-column table. The brand’s SKU appears in the winning column with a product card. These guides rank 3 to 8 months after publication and pull steady-state organic traffic.
Sourcing story pages that build trust
Sourcing story pages name the specific farms, cooperatives, or suppliers the brand sources from, with photos of the farms, farmer quotes, and specific harvest windows. A coffee brand’s Ethiopian farm page ranks for “single-origin Ethiopian coffee” and “Yirgacheffe coffee origin” plus 40 long-tail variations. The sourcing page pulls trust-building traffic that converts at 4 to 6 percent because the shopper landed pattern-matching on transparency and named provenance. Every sourcing page includes farmer or cooperative quotes, harvest dates, and a link back to 3 to 5 hero SKU pages that source from the named supplier.
Vejrø hospitality content case study
Vejrø Resort, a Danish private-island destination with an on-site restaurant focused on organic, locally sourced cuisine, joined us with strong social engagement and no organic-search real estate. Guests found the resort on Instagram but never in Google search for terms like “private island resort Denmark,” “farm-to-table hospitality Denmark,” or “Vejrø restaurant.” The same organic-search gap shows up on DTC food brands running paid social at 20,000 dollars monthly with a broken blog and zero recipe schema.
We built the conversion-focused website with on-site and off-site SEO tuned to the travel-niche keyword clusters, competitor analysis against comparable boutique resorts, and mobile-first design prioritizing guest discovery. Every page carried the structured data qualifying it for Google’s rich results in the hospitality category. Every internal link pushed authority toward the direct-booking conversion path.
Three months later, Vejrø hit 10,000 plus organic visitors, ranked for 200 plus first-page keywords, and pulled a 2.2 percent booking conversion rate from organic traffic. The same pattern applies to content marketing for food brands: recipe schema, ingredient comparison guides, and sourcing story pages pull organic traffic at 20 to 40 percent conversion into hero SKU pages inside 6 months when the content quality matches search intent and every page carries the right structured data markup. Vejrø also proved out the reporting discipline: every monthly report named the exact page, the exact keyword cluster, and the exact search feature (rich result, sitelinks, image pack) driving the incremental organic revenue instead of hiding behind aggregate traffic charts.
Recipe cadence and content calendar for food brands
Recipe cadence on a working food brand content calendar ships 2 to 4 new recipes per week during the first 6 months and drops to 1 per week at maturity. Each recipe takes 4 to 6 hours to produce (write, test in the kitchen, photograph, schema author, publish). At 3 recipes per week, the brand hits 78 recipes inside 6 months plus a backlog of ingredient comparison and sourcing content queued behind the recipe production line.
| Content pillar | Target volume year 1 | Production cost per piece | Refresh cadence |
|---|---|---|---|
| Recipe hub | 40 to 100 recipes | $180 to $320 | Every 12 months |
| Ingredient comparison guides | 12 to 24 guides | $450 to $780 | Every 18 months |
| Sourcing story pages | 6 to 12 pages | $680 to $1,200 | Every 24 months |
| Buyer intent content | 8 to 16 pieces | $220 to $420 | Every 12 months |
Photography as a content calendar constraint
Photography is the actual constraint on recipe cadence, not writing. Every recipe needs 6 to 12 photos: hero shot, ingredient flat lay, prep in progress, plated result, storage, and step shots for the schema markup. A working food brand batches photography 8 recipes at a time to keep the cost per recipe under 200 dollars. Skip the batching and the per-recipe cost climbs to 400 to 600 dollars, which caps recipe cadence at 1 per week and slows organic ranking timeline by 6 months.
Seasonal content calendar planning
Seasonal content calendar planning maps recipes and comparison guides to the seasonal windows they need to rank in. A Christmas cookie recipe needs to publish in September to rank by early December. A Valentine’s chocolate guide needs to publish in November to rank by early February. A back-to-school lunchbox recipe needs to publish in June to rank by late August. The 60-to-90-day ranking curve dictates the calendar.
Creator syndication inside food brand content
Creator syndication on food brand content marketing amplifies the recipe hub through Instagram Reels, TikTok, and YouTube Shorts creators paid to post their own version of the brand’s hero recipes. The creator content pulls net-new audiences into the recipe hub through the creator’s Link in Bio or Amazon Storefront tag. The syndication calendar names 12 to 30 creators per quarter with specific recipes assigned to each.
One brand we picked up had a spreadsheet titled “creator outreach 2023” with 47 rows and 3 responses. All 3 responses were auto-replies. The spreadsheet named zero recipes and offered flat rates below 100 dollars per post. Nobody posts a 30-second video for 87 dollars flat. Nobody.
Creator content commercial terms that work
Working creator content commercial terms run 350 to 1,500 dollars flat per post plus a 12 to 25 percent commission on tagged sales across a 30-day window. The commission mechanic pulls creators into follow-up posts because the incremental revenue continues past the initial fee. Mid-tier creators (30k to 150k followers) hit the sweet spot for food brand content because their engagement rate typically runs 4 to 8 percent versus 0.8 to 1.6 percent on mega-creators.
Content brief structure for creator partnerships
The content brief structure for creator partnerships runs a single page: the SKU, the specific recipe or usage occasion, 3 required brand mentions, 3 restricted claims (no health claims on non-medical SKUs), the pricing angle, the affiliate link, and 3 example videos that hit the tone. The brief avoids over-scripting because over-scripted creator content underperforms native creator voice by 40 to 60 percent on engagement rate.
Buyer intent content for food brand blogs
Buyer intent content on food brand blogs covers 8 to 16 pieces targeting explicit purchase-decision queries: “where to buy [brand],” “[brand] subscription vs. one-time,” “best [category] for [use case],” and “[brand] gift bundle.” Every buyer intent piece runs 1,400 to 2,400 words with a comparison table, product cards, and a clear conversion path to the specific SKU that matches the query intent. Buyer intent content converts at 3 to 6 percent versus 1 to 2 percent on recipe content because the shopper landed already planning to buy, not exploring a usage occasion.
Where-to-buy content structure
Where-to-buy content structure covers online (DTC storefront, Amazon, Target.com, Whole Foods online), retail (specific chain locators with the store finder embedded), and international (customs limitations, retailer partners abroad). Every piece names specific retailers, links to the store locator, and includes an FAQ block covering shipping availability, subscription options, and gift card compatibility. Where-to-buy content ranks for branded discovery queries the DTC storefront otherwise loses to competitor affiliate reviews.
Subscription versus one-time comparison content
Subscription versus one-time comparison content converts subscription commitments at 3 to 6 percent because it addresses the price-sensitivity concern head-on with a specific math table. The piece covers the discount structure (15 percent lifetime), the skip-a-month mechanic, the pause-anytime rule, the cancellation policy, and the specific yearly savings for the brand’s average consumption cadence. Cross-reference the retention structure on our food and beverage marketing retainer page.
Content refresh cadence on food brand pillars
Content refresh cadence on food brand content pillars runs a rolling audit every 12 to 24 months by pillar. Recipes get refreshed every 12 months with new photography, updated schema, and any nutrition or ingredient adjustments. Ingredient comparison guides refresh every 18 months to update market data. Sourcing story pages refresh every 24 months to reflect farm partnership changes and new harvest angles. Buyer intent content refreshes every 12 months to update retailer availability and pricing.
Recipe refresh priority order
Recipe refresh priority runs by organic traffic rank. The top 20 recipes by monthly organic sessions get refreshed first (new photography, schema audit, related recipe internal links, updated nutrition). The next 40 get refreshed at 15 months. The remaining recipes get refreshed opportunistically when the ranking slips past position 15 in Google. Skipping the refresh cadence lets recipe rankings drift out of the top 3 inside 18 months as newer competitor recipes take the position.
Schema audit checklist per refresh
The schema audit checklist per refresh runs 8 items: Recipe schema completeness, aggregateRating count and accuracy, nutrition data accuracy, prepTime and cookTime match the recipe body, image URLs valid at CDN, related recipe internal links working, product card SKU URL live, and Google Search Console rich result eligibility validated. This checklist takes 20 minutes per recipe and prevents the schema drift that costs recipe rankings 20 to 40 positions quietly.
Reporting cadence for food brand content marketing
Reporting cadence on food brand content marketing runs a monthly executive report plus a quarterly business review. The monthly report ships in the first business week and covers organic sessions by pillar, top 10 ranking recipes with position trend, ingredient guide ranking movements, sourcing page performance, and organic-attributed DTC revenue. Every number carries a comparison to the prior month and a plain-language interpretation the founder reads in 7 minutes.
Metrics that matter for content marketing
Metrics that matter for food brand content marketing: organic sessions by pillar, recipe rich result impressions in Search Console, organic conversion rate to hero SKU pages, organic-attributed DTC revenue, and top 20 ranking positions by monthly organic sessions. Vanity metrics that do not matter: total pageviews without conversion context, average time on page without conversion attribution, and social share counts. The monthly report skips the vanity block entirely.
Quarterly business review structure
The quarterly business review runs 90 minutes with the founder, head of content, and SEO lead. Agenda: organic traffic trend by pillar, top 10 winning content pieces, top 10 losing content pieces (candidates for refresh or removal), competitive gap analysis against 5 named competitor brands, and next quarter’s content calendar with recipes and ingredient guides queued. According to Ahrefs content marketing research, brands running quarterly content audits outperform brands running annual audits by 40 to 70 percent on organic revenue over a 24-month window.
Internal linking discipline across food brand content
Internal linking discipline across food brand content moves authority from recipe pages toward hero SKU product pages and comparison guides. Every recipe links to the hero SKU it uses inline (once in the ingredient list, once in a bottom call-out card). Every ingredient comparison guide links to 3 to 6 recipes using the winning ingredient plus the hero SKU product page. Every sourcing story links to the 2 to 4 SKUs sourced from that specific farm or cooperative.
Anchor text strategy across recipe hubs
Anchor text on internal links varies across recipe hubs to avoid over-optimization patterns Google penalizes. Exact-match anchor (“single-origin Ethiopian coffee”) runs on 20 to 30 percent of internal links. Partial-match variations (“our Ethiopian roast”) run on 30 to 40 percent. Branded anchors (the SKU name) run on 20 to 30 percent. Generic anchors (“shop the coffee”) fill the remaining 10 to 20 percent. This ratio holds ranking without triggering the over-optimization penalty that shows up on brands that anchor-text-stuff every internal link with the same exact-match keyword. Cross-reference the linking layer on our food and beverage web design page.
Link equity from ingredient guides to SKU pages
Link equity from ingredient guides passes to SKU pages when the guide’s comparison table names the hero SKU in the winning column with a product card, and when the guide’s body links to 3 to 6 recipes that use the winning ingredient. This 3-hop path (guide to recipe to SKU) pushes authority from a high-traffic informational query down to a high-intent transactional page. According to Search Engine Land SEO coverage, informational content that internally links to transactional pages produces 2 to 4 times higher organic revenue than isolated content silos.
Wrapping up content marketing for food brands
Content marketing for food brands is the organic engine that turns a DTC snack, drink, or CPG storefront into a search-driven revenue channel. Recipe hub of 40 to 100 recipes. Ingredient comparison guides at 12 to 24 pieces. Sourcing story pages at 6 to 12 pieces. Buyer intent content at 8 to 16 pieces. Creator syndication calendar with 12 to 30 creators per quarter. Refresh cadence at 12 to 24 months by pillar. Reporting with organic sessions and organic revenue attribution.
If your DTC food brand is running paid social at 20,000 dollars monthly with a broken blog and zero recipe schema, professional content marketing for food brands pays for itself inside the first 90 days on organic traffic captured. Redefine Web ships content marketing inside our monthly retainer packages. Book a call and we will walk through the last three DTC food brands we built recipe hubs for, pillar by pillar.
Content marketing for food brands starts with a recipe hub because recipe queries account for 40 to 60 percent of high-intent search volume in the food category. Every hero SKU needs 4 to 12 recipes anchored to it, each targeting a specific occasion and audience.
Skip the recipe hub and the brand loses the search real estate that pulls DTC storefront traffic month over month at zero incremental paid cost. Recipe traffic converts at 2 to 4 percent because the shopper landed with usage intent, not passive discovery, which is why food brands win on recipes.
Recipe schema and Google rich result eligibility
Every recipe page ships schema.org Recipe markup including cookTime, prepTime, recipeIngredient, recipeInstructions, nutrition, and aggregateRating. Correctly marked-up recipes qualify for Google’s recipe rich result carousel that pulls 3 to 6 times higher click-through rate than a plain blue link. The schema layer takes 15 minutes per recipe to author and 30 minutes to validate in Google Search Console. Cross-reference the recipe search stack on our food and beverage SEO page.
Recipe hub structure that scales
The recipe hub structure runs 40 to 100 recipes at maturity, organized by hero SKU (4 to 12 recipes per SKU) plus occasion tags (breakfast, weeknight dinner, meal prep, brunch, holiday). Every recipe links back to the hero SKU product page with the SKU embedded in an inline card. The hub earns internal linking value from ingredient comparison guides and the sourcing story pages, which feeds recipe ranking on Google. According to Google Search Central recipe structured data guidance, complete Recipe schema markup is required for eligibility in the recipe carousel and the ingredient search filter.
Pillar structure for food brand content marketing
The pillar structure on content marketing for food brands runs 4 content pillars concurrently: recipe hub (40 to 100 recipes), ingredient comparison guides (12 to 24 guides), sourcing story pages (6 to 12 pages), and buyer intent content (where to buy, subscription vs. one-time, gift bundle guides). Every pillar covers a distinct search intent and every pillar links back to the hero SKU product pages.
Ingredient comparison guide format
Ingredient comparison guides run 1,800 to 3,200 words comparing 2 to 4 ingredient types on 6 to 10 attributes with a comparison table, real-world use case examples, and links to the hero SKU that uses the specific ingredient. Example: organic vs. conventional oats compares nutritional profile, sourcing chain, cost, environmental impact, and taste on a 6-column table. The brand’s SKU appears in the winning column with a product card. These guides rank 3 to 8 months after publication and pull steady-state organic traffic.
Sourcing story pages that build trust
Sourcing story pages name the specific farms, cooperatives, or suppliers the brand sources from, with photos of the farms, farmer quotes, and specific harvest windows. A coffee brand’s Ethiopian farm page ranks for “single-origin Ethiopian coffee” and “Yirgacheffe coffee origin” plus 40 long-tail variations. The sourcing page pulls trust-building traffic that converts at 4 to 6 percent because the shopper landed pattern-matching on transparency and named provenance. Every sourcing page includes farmer or cooperative quotes, harvest dates, and a link back to 3 to 5 hero SKU pages that source from the named supplier.
Vejrø hospitality content case study
Vejrø Resort, a Danish private-island destination with an on-site restaurant focused on organic, locally sourced cuisine, joined us with strong social engagement and no organic-search real estate. Guests found the resort on Instagram but never in Google search for terms like “private island resort Denmark,” “farm-to-table hospitality Denmark,” or “Vejrø restaurant.” The same organic-search gap shows up on DTC food brands running paid social at 20,000 dollars monthly with a broken blog and zero recipe schema.
We built the conversion-focused website with on-site and off-site SEO tuned to the travel-niche keyword clusters, competitor analysis against comparable boutique resorts, and mobile-first design prioritizing guest discovery. Every page carried the structured data qualifying it for Google’s rich results in the hospitality category. Every internal link pushed authority toward the direct-booking conversion path.
Three months later, Vejrø hit 10,000 plus organic visitors, ranked for 200 plus first-page keywords, and pulled a 2.2 percent booking conversion rate from organic traffic. The same pattern applies to content marketing for food brands: recipe schema, ingredient comparison guides, and sourcing story pages pull organic traffic at 20 to 40 percent conversion into hero SKU pages inside 6 months when the content quality matches search intent and every page carries the right structured data markup. Vejrø also proved out the reporting discipline: every monthly report named the exact page, the exact keyword cluster, and the exact search feature (rich result, sitelinks, image pack) driving the incremental organic revenue instead of hiding behind aggregate traffic charts.
Recipe cadence and content calendar for food brands
Recipe cadence on a working food brand content calendar ships 2 to 4 new recipes per week during the first 6 months and drops to 1 per week at maturity. Each recipe takes 4 to 6 hours to produce (write, test in the kitchen, photograph, schema author, publish). At 3 recipes per week, the brand hits 78 recipes inside 6 months plus a backlog of ingredient comparison and sourcing content queued behind the recipe production line.
| Content pillar | Target volume year 1 | Production cost per piece | Refresh cadence |
|---|---|---|---|
| Recipe hub | 40 to 100 recipes | $180 to $320 | Every 12 months |
| Ingredient comparison guides | 12 to 24 guides | $450 to $780 | Every 18 months |
| Sourcing story pages | 6 to 12 pages | $680 to $1,200 | Every 24 months |
| Buyer intent content | 8 to 16 pieces | $220 to $420 | Every 12 months |
Photography as a content calendar constraint
Photography is the actual constraint on recipe cadence, not writing. Every recipe needs 6 to 12 photos: hero shot, ingredient flat lay, prep in progress, plated result, storage, and step shots for the schema markup. A working food brand batches photography 8 recipes at a time to keep the cost per recipe under 200 dollars. Skip the batching and the per-recipe cost climbs to 400 to 600 dollars, which caps recipe cadence at 1 per week and slows organic ranking timeline by 6 months.
Seasonal content calendar planning
Seasonal content calendar planning maps recipes and comparison guides to the seasonal windows they need to rank in. A Christmas cookie recipe needs to publish in September to rank by early December. A Valentine’s chocolate guide needs to publish in November to rank by early February. A back-to-school lunchbox recipe needs to publish in June to rank by late August. The 60-to-90-day ranking curve dictates the calendar.
Creator syndication inside food brand content
Creator syndication on food brand content marketing amplifies the recipe hub through Instagram Reels, TikTok, and YouTube Shorts creators paid to post their own version of the brand’s hero recipes. The creator content pulls net-new audiences into the recipe hub through the creator’s Link in Bio or Amazon Storefront tag. The syndication calendar names 12 to 30 creators per quarter with specific recipes assigned to each.
One brand we picked up had a spreadsheet titled “creator outreach 2023” with 47 rows and 3 responses. All 3 responses were auto-replies. The spreadsheet named zero recipes and offered flat rates below 100 dollars per post. Nobody posts a 30-second video for 87 dollars flat. Nobody.
Creator content commercial terms that work
Working creator content commercial terms run 350 to 1,500 dollars flat per post plus a 12 to 25 percent commission on tagged sales across a 30-day window. The commission mechanic pulls creators into follow-up posts because the incremental revenue continues past the initial fee. Mid-tier creators (30k to 150k followers) hit the sweet spot for food brand content because their engagement rate typically runs 4 to 8 percent versus 0.8 to 1.6 percent on mega-creators.
Content brief structure for creator partnerships
The content brief structure for creator partnerships runs a single page: the SKU, the specific recipe or usage occasion, 3 required brand mentions, 3 restricted claims (no health claims on non-medical SKUs), the pricing angle, the affiliate link, and 3 example videos that hit the tone. The brief avoids over-scripting because over-scripted creator content underperforms native creator voice by 40 to 60 percent on engagement rate.
Buyer intent content for food brand blogs
Buyer intent content on food brand blogs covers 8 to 16 pieces targeting explicit purchase-decision queries: “where to buy [brand],” “[brand] subscription vs. one-time,” “best [category] for [use case],” and “[brand] gift bundle.” Every buyer intent piece runs 1,400 to 2,400 words with a comparison table, product cards, and a clear conversion path to the specific SKU that matches the query intent. Buyer intent content converts at 3 to 6 percent versus 1 to 2 percent on recipe content because the shopper landed already planning to buy, not exploring a usage occasion.
Where-to-buy content structure
Where-to-buy content structure covers online (DTC storefront, Amazon, Target.com, Whole Foods online), retail (specific chain locators with the store finder embedded), and international (customs limitations, retailer partners abroad). Every piece names specific retailers, links to the store locator, and includes an FAQ block covering shipping availability, subscription options, and gift card compatibility. Where-to-buy content ranks for branded discovery queries the DTC storefront otherwise loses to competitor affiliate reviews.
Subscription versus one-time comparison content
Subscription versus one-time comparison content converts subscription commitments at 3 to 6 percent because it addresses the price-sensitivity concern head-on with a specific math table. The piece covers the discount structure (15 percent lifetime), the skip-a-month mechanic, the pause-anytime rule, the cancellation policy, and the specific yearly savings for the brand’s average consumption cadence. Cross-reference the retention structure on our food and beverage marketing retainer page.
Content refresh cadence on food brand pillars
Content refresh cadence on food brand content pillars runs a rolling audit every 12 to 24 months by pillar. Recipes get refreshed every 12 months with new photography, updated schema, and any nutrition or ingredient adjustments. Ingredient comparison guides refresh every 18 months to update market data. Sourcing story pages refresh every 24 months to reflect farm partnership changes and new harvest angles. Buyer intent content refreshes every 12 months to update retailer availability and pricing.
Recipe refresh priority order
Recipe refresh priority runs by organic traffic rank. The top 20 recipes by monthly organic sessions get refreshed first (new photography, schema audit, related recipe internal links, updated nutrition). The next 40 get refreshed at 15 months. The remaining recipes get refreshed opportunistically when the ranking slips past position 15 in Google. Skipping the refresh cadence lets recipe rankings drift out of the top 3 inside 18 months as newer competitor recipes take the position.
Schema audit checklist per refresh
The schema audit checklist per refresh runs 8 items: Recipe schema completeness, aggregateRating count and accuracy, nutrition data accuracy, prepTime and cookTime match the recipe body, image URLs valid at CDN, related recipe internal links working, product card SKU URL live, and Google Search Console rich result eligibility validated. This checklist takes 20 minutes per recipe and prevents the schema drift that costs recipe rankings 20 to 40 positions quietly.
Reporting cadence for food brand content marketing
Reporting cadence on food brand content marketing runs a monthly executive report plus a quarterly business review. The monthly report ships in the first business week and covers organic sessions by pillar, top 10 ranking recipes with position trend, ingredient guide ranking movements, sourcing page performance, and organic-attributed DTC revenue. Every number carries a comparison to the prior month and a plain-language interpretation the founder reads in 7 minutes.
Metrics that matter for content marketing
Metrics that matter for food brand content marketing: organic sessions by pillar, recipe rich result impressions in Search Console, organic conversion rate to hero SKU pages, organic-attributed DTC revenue, and top 20 ranking positions by monthly organic sessions. Vanity metrics that do not matter: total pageviews without conversion context, average time on page without conversion attribution, and social share counts. The monthly report skips the vanity block entirely.
Quarterly business review structure
The quarterly business review runs 90 minutes with the founder, head of content, and SEO lead. Agenda: organic traffic trend by pillar, top 10 winning content pieces, top 10 losing content pieces (candidates for refresh or removal), competitive gap analysis against 5 named competitor brands, and next quarter’s content calendar with recipes and ingredient guides queued. According to Ahrefs content marketing research, brands running quarterly content audits outperform brands running annual audits by 40 to 70 percent on organic revenue over a 24-month window.
Internal linking discipline across food brand content
Internal linking discipline across food brand content moves authority from recipe pages toward hero SKU product pages and comparison guides. Every recipe links to the hero SKU it uses inline (once in the ingredient list, once in a bottom call-out card). Every ingredient comparison guide links to 3 to 6 recipes using the winning ingredient plus the hero SKU product page. Every sourcing story links to the 2 to 4 SKUs sourced from that specific farm or cooperative.
Anchor text strategy across recipe hubs
Anchor text on internal links varies across recipe hubs to avoid over-optimization patterns Google penalizes. Exact-match anchor (“single-origin Ethiopian coffee”) runs on 20 to 30 percent of internal links. Partial-match variations (“our Ethiopian roast”) run on 30 to 40 percent. Branded anchors (the SKU name) run on 20 to 30 percent. Generic anchors (“shop the coffee”) fill the remaining 10 to 20 percent. This ratio holds ranking without triggering the over-optimization penalty that shows up on brands that anchor-text-stuff every internal link with the same exact-match keyword. Cross-reference the linking layer on our food and beverage web design page.
Link equity from ingredient guides to SKU pages
Link equity from ingredient guides passes to SKU pages when the guide’s comparison table names the hero SKU in the winning column with a product card, and when the guide’s body links to 3 to 6 recipes that use the winning ingredient. This 3-hop path (guide to recipe to SKU) pushes authority from a high-traffic informational query down to a high-intent transactional page. According to Search Engine Land SEO coverage, informational content that internally links to transactional pages produces 2 to 4 times higher organic revenue than isolated content silos.
Wrapping up content marketing for food brands
Content marketing for food brands is the organic engine that turns a DTC snack, drink, or CPG storefront into a search-driven revenue channel. Recipe hub of 40 to 100 recipes. Ingredient comparison guides at 12 to 24 pieces. Sourcing story pages at 6 to 12 pieces. Buyer intent content at 8 to 16 pieces. Creator syndication calendar with 12 to 30 creators per quarter. Refresh cadence at 12 to 24 months by pillar. Reporting with organic sessions and organic revenue attribution.
If your DTC food brand is running paid social at 20,000 dollars monthly with a broken blog and zero recipe schema, professional content marketing for food brands pays for itself inside the first 90 days on organic traffic captured. Redefine Web ships content marketing inside our monthly retainer packages. Book a call and we will walk through the last three DTC food brands we built recipe hubs for, pillar by pillar.
Anchor text on internal links varies across recipe hubs to avoid over-optimization patterns Google penalizes. Exact-match anchor (“single-origin Ethiopian coffee”) runs on 20 to 30 percent of internal links. Partial-match variations (“our Ethiopian roast”) run on 30 to 40 percent. Branded anchors (the SKU name) run on 20 to 30 percent. Generic anchors (“shop the coffee”) fill the remaining 10 to 20 percent. This ratio holds ranking without triggering the over-optimization penalty that shows up on brands that anchor-text-stuff every internal link with the same exact-match keyword. Cross-reference the linking layer on our food and beverage web design page.
Link equity from ingredient guides to SKU pages
Link equity from ingredient guides passes to SKU pages when the guide’s comparison table names the hero SKU in the winning column with a product card, and when the guide’s body links to 3 to 6 recipes that use the winning ingredient. This 3-hop path (guide to recipe to SKU) pushes authority from a high-traffic informational query down to a high-intent transactional page. According to Search Engine Land SEO coverage, informational content that internally links to transactional pages produces 2 to 4 times higher organic revenue than isolated content silos.
Wrapping up content marketing for food brands
Content marketing for food brands is the organic engine that turns a DTC snack, drink, or CPG storefront into a search-driven revenue channel. Recipe hub of 40 to 100 recipes. Ingredient comparison guides at 12 to 24 pieces. Sourcing story pages at 6 to 12 pieces. Buyer intent content at 8 to 16 pieces. Creator syndication calendar with 12 to 30 creators per quarter. Refresh cadence at 12 to 24 months by pillar. Reporting with organic sessions and organic revenue attribution.
If your DTC food brand is running paid social at 20,000 dollars monthly with a broken blog and zero recipe schema, professional content marketing for food brands pays for itself inside the first 90 days on organic traffic captured. Redefine Web ships content marketing inside our monthly retainer packages. Book a call and we will walk through the last three DTC food brands we built recipe hubs for, pillar by pillar.
Internal linking discipline across food brand content moves authority from recipe pages toward hero SKU product pages and comparison guides. Every recipe links to the hero SKU it uses inline (once in the ingredient list, once in a bottom call-out card). Every ingredient comparison guide links to 3 to 6 recipes using the winning ingredient plus the hero SKU product page. Every sourcing story links to the 2 to 4 SKUs sourced from that specific farm or cooperative.
Anchor text strategy across recipe hubs
Anchor text on internal links varies across recipe hubs to avoid over-optimization patterns Google penalizes. Exact-match anchor (“single-origin Ethiopian coffee”) runs on 20 to 30 percent of internal links. Partial-match variations (“our Ethiopian roast”) run on 30 to 40 percent. Branded anchors (the SKU name) run on 20 to 30 percent. Generic anchors (“shop the coffee”) fill the remaining 10 to 20 percent. This ratio holds ranking without triggering the over-optimization penalty that shows up on brands that anchor-text-stuff every internal link with the same exact-match keyword. Cross-reference the linking layer on our food and beverage web design page.
Link equity from ingredient guides to SKU pages
Link equity from ingredient guides passes to SKU pages when the guide’s comparison table names the hero SKU in the winning column with a product card, and when the guide’s body links to 3 to 6 recipes that use the winning ingredient. This 3-hop path (guide to recipe to SKU) pushes authority from a high-traffic informational query down to a high-intent transactional page. According to Search Engine Land SEO coverage, informational content that internally links to transactional pages produces 2 to 4 times higher organic revenue than isolated content silos.
Wrapping up content marketing for food brands
Content marketing for food brands is the organic engine that turns a DTC snack, drink, or CPG storefront into a search-driven revenue channel. Recipe hub of 40 to 100 recipes. Ingredient comparison guides at 12 to 24 pieces. Sourcing story pages at 6 to 12 pieces. Buyer intent content at 8 to 16 pieces. Creator syndication calendar with 12 to 30 creators per quarter. Refresh cadence at 12 to 24 months by pillar. Reporting with organic sessions and organic revenue attribution.
If your DTC food brand is running paid social at 20,000 dollars monthly with a broken blog and zero recipe schema, professional content marketing for food brands pays for itself inside the first 90 days on organic traffic captured. Redefine Web ships content marketing inside our monthly retainer packages. Book a call and we will walk through the last three DTC food brands we built recipe hubs for, pillar by pillar.
Content marketing for food brands starts with a recipe hub because recipe queries account for 40 to 60 percent of high-intent search volume in the food category. Every hero SKU needs 4 to 12 recipes anchored to it, each targeting a specific occasion and audience.
Skip the recipe hub and the brand loses the search real estate that pulls DTC storefront traffic month over month at zero incremental paid cost. Recipe traffic converts at 2 to 4 percent because the shopper landed with usage intent, not passive discovery, which is why food brands win on recipes.
Recipe schema and Google rich result eligibility
Every recipe page ships schema.org Recipe markup including cookTime, prepTime, recipeIngredient, recipeInstructions, nutrition, and aggregateRating. Correctly marked-up recipes qualify for Google’s recipe rich result carousel that pulls 3 to 6 times higher click-through rate than a plain blue link. The schema layer takes 15 minutes per recipe to author and 30 minutes to validate in Google Search Console. Cross-reference the recipe search stack on our food and beverage SEO page.
Recipe hub structure that scales
The recipe hub structure runs 40 to 100 recipes at maturity, organized by hero SKU (4 to 12 recipes per SKU) plus occasion tags (breakfast, weeknight dinner, meal prep, brunch, holiday). Every recipe links back to the hero SKU product page with the SKU embedded in an inline card. The hub earns internal linking value from ingredient comparison guides and the sourcing story pages, which feeds recipe ranking on Google. According to Google Search Central recipe structured data guidance, complete Recipe schema markup is required for eligibility in the recipe carousel and the ingredient search filter.
Pillar structure for food brand content marketing
The pillar structure on content marketing for food brands runs 4 content pillars concurrently: recipe hub (40 to 100 recipes), ingredient comparison guides (12 to 24 guides), sourcing story pages (6 to 12 pages), and buyer intent content (where to buy, subscription vs. one-time, gift bundle guides). Every pillar covers a distinct search intent and every pillar links back to the hero SKU product pages.
Ingredient comparison guide format
Ingredient comparison guides run 1,800 to 3,200 words comparing 2 to 4 ingredient types on 6 to 10 attributes with a comparison table, real-world use case examples, and links to the hero SKU that uses the specific ingredient. Example: organic vs. conventional oats compares nutritional profile, sourcing chain, cost, environmental impact, and taste on a 6-column table. The brand’s SKU appears in the winning column with a product card. These guides rank 3 to 8 months after publication and pull steady-state organic traffic.
Sourcing story pages that build trust
Sourcing story pages name the specific farms, cooperatives, or suppliers the brand sources from, with photos of the farms, farmer quotes, and specific harvest windows. A coffee brand’s Ethiopian farm page ranks for “single-origin Ethiopian coffee” and “Yirgacheffe coffee origin” plus 40 long-tail variations. The sourcing page pulls trust-building traffic that converts at 4 to 6 percent because the shopper landed pattern-matching on transparency and named provenance. Every sourcing page includes farmer or cooperative quotes, harvest dates, and a link back to 3 to 5 hero SKU pages that source from the named supplier.
Vejrø hospitality content case study
Vejrø Resort, a Danish private-island destination with an on-site restaurant focused on organic, locally sourced cuisine, joined us with strong social engagement and no organic-search real estate. Guests found the resort on Instagram but never in Google search for terms like “private island resort Denmark,” “farm-to-table hospitality Denmark,” or “Vejrø restaurant.” The same organic-search gap shows up on DTC food brands running paid social at 20,000 dollars monthly with a broken blog and zero recipe schema.
We built the conversion-focused website with on-site and off-site SEO tuned to the travel-niche keyword clusters, competitor analysis against comparable boutique resorts, and mobile-first design prioritizing guest discovery. Every page carried the structured data qualifying it for Google’s rich results in the hospitality category. Every internal link pushed authority toward the direct-booking conversion path.
Three months later, Vejrø hit 10,000 plus organic visitors, ranked for 200 plus first-page keywords, and pulled a 2.2 percent booking conversion rate from organic traffic. The same pattern applies to content marketing for food brands: recipe schema, ingredient comparison guides, and sourcing story pages pull organic traffic at 20 to 40 percent conversion into hero SKU pages inside 6 months when the content quality matches search intent and every page carries the right structured data markup. Vejrø also proved out the reporting discipline: every monthly report named the exact page, the exact keyword cluster, and the exact search feature (rich result, sitelinks, image pack) driving the incremental organic revenue instead of hiding behind aggregate traffic charts.
Recipe cadence and content calendar for food brands
Recipe cadence on a working food brand content calendar ships 2 to 4 new recipes per week during the first 6 months and drops to 1 per week at maturity. Each recipe takes 4 to 6 hours to produce (write, test in the kitchen, photograph, schema author, publish). At 3 recipes per week, the brand hits 78 recipes inside 6 months plus a backlog of ingredient comparison and sourcing content queued behind the recipe production line.
| Content pillar | Target volume year 1 | Production cost per piece | Refresh cadence |
|---|---|---|---|
| Recipe hub | 40 to 100 recipes | $180 to $320 | Every 12 months |
| Ingredient comparison guides | 12 to 24 guides | $450 to $780 | Every 18 months |
| Sourcing story pages | 6 to 12 pages | $680 to $1,200 | Every 24 months |
| Buyer intent content | 8 to 16 pieces | $220 to $420 | Every 12 months |
Photography as a content calendar constraint
Photography is the actual constraint on recipe cadence, not writing. Every recipe needs 6 to 12 photos: hero shot, ingredient flat lay, prep in progress, plated result, storage, and step shots for the schema markup. A working food brand batches photography 8 recipes at a time to keep the cost per recipe under 200 dollars. Skip the batching and the per-recipe cost climbs to 400 to 600 dollars, which caps recipe cadence at 1 per week and slows organic ranking timeline by 6 months.
Seasonal content calendar planning
Seasonal content calendar planning maps recipes and comparison guides to the seasonal windows they need to rank in. A Christmas cookie recipe needs to publish in September to rank by early December. A Valentine’s chocolate guide needs to publish in November to rank by early February. A back-to-school lunchbox recipe needs to publish in June to rank by late August. The 60-to-90-day ranking curve dictates the calendar.
Creator syndication inside food brand content
Creator syndication on food brand content marketing amplifies the recipe hub through Instagram Reels, TikTok, and YouTube Shorts creators paid to post their own version of the brand’s hero recipes. The creator content pulls net-new audiences into the recipe hub through the creator’s Link in Bio or Amazon Storefront tag. The syndication calendar names 12 to 30 creators per quarter with specific recipes assigned to each.
One brand we picked up had a spreadsheet titled “creator outreach 2023” with 47 rows and 3 responses. All 3 responses were auto-replies. The spreadsheet named zero recipes and offered flat rates below 100 dollars per post. Nobody posts a 30-second video for 87 dollars flat. Nobody.
Creator content commercial terms that work
Working creator content commercial terms run 350 to 1,500 dollars flat per post plus a 12 to 25 percent commission on tagged sales across a 30-day window. The commission mechanic pulls creators into follow-up posts because the incremental revenue continues past the initial fee. Mid-tier creators (30k to 150k followers) hit the sweet spot for food brand content because their engagement rate typically runs 4 to 8 percent versus 0.8 to 1.6 percent on mega-creators.
Content brief structure for creator partnerships
The content brief structure for creator partnerships runs a single page: the SKU, the specific recipe or usage occasion, 3 required brand mentions, 3 restricted claims (no health claims on non-medical SKUs), the pricing angle, the affiliate link, and 3 example videos that hit the tone. The brief avoids over-scripting because over-scripted creator content underperforms native creator voice by 40 to 60 percent on engagement rate.
Buyer intent content for food brand blogs
Buyer intent content on food brand blogs covers 8 to 16 pieces targeting explicit purchase-decision queries: “where to buy [brand],” “[brand] subscription vs. one-time,” “best [category] for [use case],” and “[brand] gift bundle.” Every buyer intent piece runs 1,400 to 2,400 words with a comparison table, product cards, and a clear conversion path to the specific SKU that matches the query intent. Buyer intent content converts at 3 to 6 percent versus 1 to 2 percent on recipe content because the shopper landed already planning to buy, not exploring a usage occasion.
Where-to-buy content structure
Where-to-buy content structure covers online (DTC storefront, Amazon, Target.com, Whole Foods online), retail (specific chain locators with the store finder embedded), and international (customs limitations, retailer partners abroad). Every piece names specific retailers, links to the store locator, and includes an FAQ block covering shipping availability, subscription options, and gift card compatibility. Where-to-buy content ranks for branded discovery queries the DTC storefront otherwise loses to competitor affiliate reviews.
Subscription versus one-time comparison content
Subscription versus one-time comparison content converts subscription commitments at 3 to 6 percent because it addresses the price-sensitivity concern head-on with a specific math table. The piece covers the discount structure (15 percent lifetime), the skip-a-month mechanic, the pause-anytime rule, the cancellation policy, and the specific yearly savings for the brand’s average consumption cadence. Cross-reference the retention structure on our food and beverage marketing retainer page.
Content refresh cadence on food brand pillars
Content refresh cadence on food brand content pillars runs a rolling audit every 12 to 24 months by pillar. Recipes get refreshed every 12 months with new photography, updated schema, and any nutrition or ingredient adjustments. Ingredient comparison guides refresh every 18 months to update market data. Sourcing story pages refresh every 24 months to reflect farm partnership changes and new harvest angles. Buyer intent content refreshes every 12 months to update retailer availability and pricing.
Recipe refresh priority order
Recipe refresh priority runs by organic traffic rank. The top 20 recipes by monthly organic sessions get refreshed first (new photography, schema audit, related recipe internal links, updated nutrition). The next 40 get refreshed at 15 months. The remaining recipes get refreshed opportunistically when the ranking slips past position 15 in Google. Skipping the refresh cadence lets recipe rankings drift out of the top 3 inside 18 months as newer competitor recipes take the position.
Schema audit checklist per refresh
The schema audit checklist per refresh runs 8 items: Recipe schema completeness, aggregateRating count and accuracy, nutrition data accuracy, prepTime and cookTime match the recipe body, image URLs valid at CDN, related recipe internal links working, product card SKU URL live, and Google Search Console rich result eligibility validated. This checklist takes 20 minutes per recipe and prevents the schema drift that costs recipe rankings 20 to 40 positions quietly.
Reporting cadence for food brand content marketing
Reporting cadence on food brand content marketing runs a monthly executive report plus a quarterly business review. The monthly report ships in the first business week and covers organic sessions by pillar, top 10 ranking recipes with position trend, ingredient guide ranking movements, sourcing page performance, and organic-attributed DTC revenue. Every number carries a comparison to the prior month and a plain-language interpretation the founder reads in 7 minutes.
Metrics that matter for content marketing
Metrics that matter for food brand content marketing: organic sessions by pillar, recipe rich result impressions in Search Console, organic conversion rate to hero SKU pages, organic-attributed DTC revenue, and top 20 ranking positions by monthly organic sessions. Vanity metrics that do not matter: total pageviews without conversion context, average time on page without conversion attribution, and social share counts. The monthly report skips the vanity block entirely.
Quarterly business review structure
The quarterly business review runs 90 minutes with the founder, head of content, and SEO lead. Agenda: organic traffic trend by pillar, top 10 winning content pieces, top 10 losing content pieces (candidates for refresh or removal), competitive gap analysis against 5 named competitor brands, and next quarter’s content calendar with recipes and ingredient guides queued. According to Ahrefs content marketing research, brands running quarterly content audits outperform brands running annual audits by 40 to 70 percent on organic revenue over a 24-month window.
Internal linking discipline across food brand content
Internal linking discipline across food brand content moves authority from recipe pages toward hero SKU product pages and comparison guides. Every recipe links to the hero SKU it uses inline (once in the ingredient list, once in a bottom call-out card). Every ingredient comparison guide links to 3 to 6 recipes using the winning ingredient plus the hero SKU product page. Every sourcing story links to the 2 to 4 SKUs sourced from that specific farm or cooperative.
Anchor text strategy across recipe hubs
Anchor text on internal links varies across recipe hubs to avoid over-optimization patterns Google penalizes. Exact-match anchor (“single-origin Ethiopian coffee”) runs on 20 to 30 percent of internal links. Partial-match variations (“our Ethiopian roast”) run on 30 to 40 percent. Branded anchors (the SKU name) run on 20 to 30 percent. Generic anchors (“shop the coffee”) fill the remaining 10 to 20 percent. This ratio holds ranking without triggering the over-optimization penalty that shows up on brands that anchor-text-stuff every internal link with the same exact-match keyword. Cross-reference the linking layer on our food and beverage web design page.
Link equity from ingredient guides to SKU pages
Link equity from ingredient guides passes to SKU pages when the guide’s comparison table names the hero SKU in the winning column with a product card, and when the guide’s body links to 3 to 6 recipes that use the winning ingredient. This 3-hop path (guide to recipe to SKU) pushes authority from a high-traffic informational query down to a high-intent transactional page. According to Search Engine Land SEO coverage, informational content that internally links to transactional pages produces 2 to 4 times higher organic revenue than isolated content silos.
Wrapping up content marketing for food brands
Content marketing for food brands is the organic engine that turns a DTC snack, drink, or CPG storefront into a search-driven revenue channel. Recipe hub of 40 to 100 recipes. Ingredient comparison guides at 12 to 24 pieces. Sourcing story pages at 6 to 12 pieces. Buyer intent content at 8 to 16 pieces. Creator syndication calendar with 12 to 30 creators per quarter. Refresh cadence at 12 to 24 months by pillar. Reporting with organic sessions and organic revenue attribution.
If your DTC food brand is running paid social at 20,000 dollars monthly with a broken blog and zero recipe schema, professional content marketing for food brands pays for itself inside the first 90 days on organic traffic captured. Redefine Web ships content marketing inside our monthly retainer packages. Book a call and we will walk through the last three DTC food brands we built recipe hubs for, pillar by pillar.
Content marketing for food brands starts with a recipe hub because recipe queries account for 40 to 60 percent of high-intent search volume in the food category. Every hero SKU needs 4 to 12 recipes anchored to it, each targeting a specific occasion and audience.
Skip the recipe hub and the brand loses the search real estate that pulls DTC storefront traffic month over month at zero incremental paid cost. Recipe traffic converts at 2 to 4 percent because the shopper landed with usage intent, not passive discovery, which is why food brands win on recipes.
Recipe schema and Google rich result eligibility
Every recipe page ships schema.org Recipe markup including cookTime, prepTime, recipeIngredient, recipeInstructions, nutrition, and aggregateRating. Correctly marked-up recipes qualify for Google’s recipe rich result carousel that pulls 3 to 6 times higher click-through rate than a plain blue link. The schema layer takes 15 minutes per recipe to author and 30 minutes to validate in Google Search Console. Cross-reference the recipe search stack on our food and beverage SEO page.
Recipe hub structure that scales
The recipe hub structure runs 40 to 100 recipes at maturity, organized by hero SKU (4 to 12 recipes per SKU) plus occasion tags (breakfast, weeknight dinner, meal prep, brunch, holiday). Every recipe links back to the hero SKU product page with the SKU embedded in an inline card. The hub earns internal linking value from ingredient comparison guides and the sourcing story pages, which feeds recipe ranking on Google. According to Google Search Central recipe structured data guidance, complete Recipe schema markup is required for eligibility in the recipe carousel and the ingredient search filter.
Pillar structure for food brand content marketing
The pillar structure on content marketing for food brands runs 4 content pillars concurrently: recipe hub (40 to 100 recipes), ingredient comparison guides (12 to 24 guides), sourcing story pages (6 to 12 pages), and buyer intent content (where to buy, subscription vs. one-time, gift bundle guides). Every pillar covers a distinct search intent and every pillar links back to the hero SKU product pages.
Ingredient comparison guide format
Ingredient comparison guides run 1,800 to 3,200 words comparing 2 to 4 ingredient types on 6 to 10 attributes with a comparison table, real-world use case examples, and links to the hero SKU that uses the specific ingredient. Example: organic vs. conventional oats compares nutritional profile, sourcing chain, cost, environmental impact, and taste on a 6-column table. The brand’s SKU appears in the winning column with a product card. These guides rank 3 to 8 months after publication and pull steady-state organic traffic.
Sourcing story pages that build trust
Sourcing story pages name the specific farms, cooperatives, or suppliers the brand sources from, with photos of the farms, farmer quotes, and specific harvest windows. A coffee brand’s Ethiopian farm page ranks for “single-origin Ethiopian coffee” and “Yirgacheffe coffee origin” plus 40 long-tail variations. The sourcing page pulls trust-building traffic that converts at 4 to 6 percent because the shopper landed pattern-matching on transparency and named provenance. Every sourcing page includes farmer or cooperative quotes, harvest dates, and a link back to 3 to 5 hero SKU pages that source from the named supplier.
Vejrø hospitality content case study
Vejrø Resort, a Danish private-island destination with an on-site restaurant focused on organic, locally sourced cuisine, joined us with strong social engagement and no organic-search real estate. Guests found the resort on Instagram but never in Google search for terms like “private island resort Denmark,” “farm-to-table hospitality Denmark,” or “Vejrø restaurant.” The same organic-search gap shows up on DTC food brands running paid social at 20,000 dollars monthly with a broken blog and zero recipe schema.
We built the conversion-focused website with on-site and off-site SEO tuned to the travel-niche keyword clusters, competitor analysis against comparable boutique resorts, and mobile-first design prioritizing guest discovery. Every page carried the structured data qualifying it for Google’s rich results in the hospitality category. Every internal link pushed authority toward the direct-booking conversion path.
Three months later, Vejrø hit 10,000 plus organic visitors, ranked for 200 plus first-page keywords, and pulled a 2.2 percent booking conversion rate from organic traffic. The same pattern applies to content marketing for food brands: recipe schema, ingredient comparison guides, and sourcing story pages pull organic traffic at 20 to 40 percent conversion into hero SKU pages inside 6 months when the content quality matches search intent and every page carries the right structured data markup. Vejrø also proved out the reporting discipline: every monthly report named the exact page, the exact keyword cluster, and the exact search feature (rich result, sitelinks, image pack) driving the incremental organic revenue instead of hiding behind aggregate traffic charts.
Recipe cadence and content calendar for food brands
Recipe cadence on a working food brand content calendar ships 2 to 4 new recipes per week during the first 6 months and drops to 1 per week at maturity. Each recipe takes 4 to 6 hours to produce (write, test in the kitchen, photograph, schema author, publish). At 3 recipes per week, the brand hits 78 recipes inside 6 months plus a backlog of ingredient comparison and sourcing content queued behind the recipe production line.
| Content pillar | Target volume year 1 | Production cost per piece | Refresh cadence |
|---|---|---|---|
| Recipe hub | 40 to 100 recipes | $180 to $320 | Every 12 months |
| Ingredient comparison guides | 12 to 24 guides | $450 to $780 | Every 18 months |
| Sourcing story pages | 6 to 12 pages | $680 to $1,200 | Every 24 months |
| Buyer intent content | 8 to 16 pieces | $220 to $420 | Every 12 months |
Photography as a content calendar constraint
Photography is the actual constraint on recipe cadence, not writing. Every recipe needs 6 to 12 photos: hero shot, ingredient flat lay, prep in progress, plated result, storage, and step shots for the schema markup. A working food brand batches photography 8 recipes at a time to keep the cost per recipe under 200 dollars. Skip the batching and the per-recipe cost climbs to 400 to 600 dollars, which caps recipe cadence at 1 per week and slows organic ranking timeline by 6 months.
Seasonal content calendar planning
Seasonal content calendar planning maps recipes and comparison guides to the seasonal windows they need to rank in. A Christmas cookie recipe needs to publish in September to rank by early December. A Valentine’s chocolate guide needs to publish in November to rank by early February. A back-to-school lunchbox recipe needs to publish in June to rank by late August. The 60-to-90-day ranking curve dictates the calendar.
Creator syndication inside food brand content
Creator syndication on food brand content marketing amplifies the recipe hub through Instagram Reels, TikTok, and YouTube Shorts creators paid to post their own version of the brand’s hero recipes. The creator content pulls net-new audiences into the recipe hub through the creator’s Link in Bio or Amazon Storefront tag. The syndication calendar names 12 to 30 creators per quarter with specific recipes assigned to each.
One brand we picked up had a spreadsheet titled “creator outreach 2023” with 47 rows and 3 responses. All 3 responses were auto-replies. The spreadsheet named zero recipes and offered flat rates below 100 dollars per post. Nobody posts a 30-second video for 87 dollars flat. Nobody.
Creator content commercial terms that work
Working creator content commercial terms run 350 to 1,500 dollars flat per post plus a 12 to 25 percent commission on tagged sales across a 30-day window. The commission mechanic pulls creators into follow-up posts because the incremental revenue continues past the initial fee. Mid-tier creators (30k to 150k followers) hit the sweet spot for food brand content because their engagement rate typically runs 4 to 8 percent versus 0.8 to 1.6 percent on mega-creators.
Content brief structure for creator partnerships
The content brief structure for creator partnerships runs a single page: the SKU, the specific recipe or usage occasion, 3 required brand mentions, 3 restricted claims (no health claims on non-medical SKUs), the pricing angle, the affiliate link, and 3 example videos that hit the tone. The brief avoids over-scripting because over-scripted creator content underperforms native creator voice by 40 to 60 percent on engagement rate.
Buyer intent content for food brand blogs
Buyer intent content on food brand blogs covers 8 to 16 pieces targeting explicit purchase-decision queries: “where to buy [brand],” “[brand] subscription vs. one-time,” “best [category] for [use case],” and “[brand] gift bundle.” Every buyer intent piece runs 1,400 to 2,400 words with a comparison table, product cards, and a clear conversion path to the specific SKU that matches the query intent. Buyer intent content converts at 3 to 6 percent versus 1 to 2 percent on recipe content because the shopper landed already planning to buy, not exploring a usage occasion.
Where-to-buy content structure
Where-to-buy content structure covers online (DTC storefront, Amazon, Target.com, Whole Foods online), retail (specific chain locators with the store finder embedded), and international (customs limitations, retailer partners abroad). Every piece names specific retailers, links to the store locator, and includes an FAQ block covering shipping availability, subscription options, and gift card compatibility. Where-to-buy content ranks for branded discovery queries the DTC storefront otherwise loses to competitor affiliate reviews.
Subscription versus one-time comparison content
Subscription versus one-time comparison content converts subscription commitments at 3 to 6 percent because it addresses the price-sensitivity concern head-on with a specific math table. The piece covers the discount structure (15 percent lifetime), the skip-a-month mechanic, the pause-anytime rule, the cancellation policy, and the specific yearly savings for the brand’s average consumption cadence. Cross-reference the retention structure on our food and beverage marketing retainer page.
Content refresh cadence on food brand pillars
Content refresh cadence on food brand content pillars runs a rolling audit every 12 to 24 months by pillar. Recipes get refreshed every 12 months with new photography, updated schema, and any nutrition or ingredient adjustments. Ingredient comparison guides refresh every 18 months to update market data. Sourcing story pages refresh every 24 months to reflect farm partnership changes and new harvest angles. Buyer intent content refreshes every 12 months to update retailer availability and pricing.
Recipe refresh priority order
Recipe refresh priority runs by organic traffic rank. The top 20 recipes by monthly organic sessions get refreshed first (new photography, schema audit, related recipe internal links, updated nutrition). The next 40 get refreshed at 15 months. The remaining recipes get refreshed opportunistically when the ranking slips past position 15 in Google. Skipping the refresh cadence lets recipe rankings drift out of the top 3 inside 18 months as newer competitor recipes take the position.
Schema audit checklist per refresh
The schema audit checklist per refresh runs 8 items: Recipe schema completeness, aggregateRating count and accuracy, nutrition data accuracy, prepTime and cookTime match the recipe body, image URLs valid at CDN, related recipe internal links working, product card SKU URL live, and Google Search Console rich result eligibility validated. This checklist takes 20 minutes per recipe and prevents the schema drift that costs recipe rankings 20 to 40 positions quietly.
Reporting cadence for food brand content marketing
Reporting cadence on food brand content marketing runs a monthly executive report plus a quarterly business review. The monthly report ships in the first business week and covers organic sessions by pillar, top 10 ranking recipes with position trend, ingredient guide ranking movements, sourcing page performance, and organic-attributed DTC revenue. Every number carries a comparison to the prior month and a plain-language interpretation the founder reads in 7 minutes.
Metrics that matter for content marketing
Metrics that matter for food brand content marketing: organic sessions by pillar, recipe rich result impressions in Search Console, organic conversion rate to hero SKU pages, organic-attributed DTC revenue, and top 20 ranking positions by monthly organic sessions. Vanity metrics that do not matter: total pageviews without conversion context, average time on page without conversion attribution, and social share counts. The monthly report skips the vanity block entirely.
Quarterly business review structure
The quarterly business review runs 90 minutes with the founder, head of content, and SEO lead. Agenda: organic traffic trend by pillar, top 10 winning content pieces, top 10 losing content pieces (candidates for refresh or removal), competitive gap analysis against 5 named competitor brands, and next quarter’s content calendar with recipes and ingredient guides queued. According to Ahrefs content marketing research, brands running quarterly content audits outperform brands running annual audits by 40 to 70 percent on organic revenue over a 24-month window.
Internal linking discipline across food brand content
Internal linking discipline across food brand content moves authority from recipe pages toward hero SKU product pages and comparison guides. Every recipe links to the hero SKU it uses inline (once in the ingredient list, once in a bottom call-out card). Every ingredient comparison guide links to 3 to 6 recipes using the winning ingredient plus the hero SKU product page. Every sourcing story links to the 2 to 4 SKUs sourced from that specific farm or cooperative.
Anchor text strategy across recipe hubs
Anchor text on internal links varies across recipe hubs to avoid over-optimization patterns Google penalizes. Exact-match anchor (“single-origin Ethiopian coffee”) runs on 20 to 30 percent of internal links. Partial-match variations (“our Ethiopian roast”) run on 30 to 40 percent. Branded anchors (the SKU name) run on 20 to 30 percent. Generic anchors (“shop the coffee”) fill the remaining 10 to 20 percent. This ratio holds ranking without triggering the over-optimization penalty that shows up on brands that anchor-text-stuff every internal link with the same exact-match keyword. Cross-reference the linking layer on our food and beverage web design page.
Link equity from ingredient guides to SKU pages
Link equity from ingredient guides passes to SKU pages when the guide’s comparison table names the hero SKU in the winning column with a product card, and when the guide’s body links to 3 to 6 recipes that use the winning ingredient. This 3-hop path (guide to recipe to SKU) pushes authority from a high-traffic informational query down to a high-intent transactional page. According to Search Engine Land SEO coverage, informational content that internally links to transactional pages produces 2 to 4 times higher organic revenue than isolated content silos.
Wrapping up content marketing for food brands
Content marketing for food brands is the organic engine that turns a DTC snack, drink, or CPG storefront into a search-driven revenue channel. Recipe hub of 40 to 100 recipes. Ingredient comparison guides at 12 to 24 pieces. Sourcing story pages at 6 to 12 pieces. Buyer intent content at 8 to 16 pieces. Creator syndication calendar with 12 to 30 creators per quarter. Refresh cadence at 12 to 24 months by pillar. Reporting with organic sessions and organic revenue attribution.
If your DTC food brand is running paid social at 20,000 dollars monthly with a broken blog and zero recipe schema, professional content marketing for food brands pays for itself inside the first 90 days on organic traffic captured. Redefine Web ships content marketing inside our monthly retainer packages. Book a call and we will walk through the last three DTC food brands we built recipe hubs for, pillar by pillar.
Content marketing for food brands starts with a recipe hub because recipe queries account for 40 to 60 percent of high-intent search volume in the food category. Every hero SKU needs 4 to 12 recipes anchored to it, each targeting a specific occasion and audience.
Skip the recipe hub and the brand loses the search real estate that pulls DTC storefront traffic month over month at zero incremental paid cost. Recipe traffic converts at 2 to 4 percent because the shopper landed with usage intent, not passive discovery, which is why food brands win on recipes.
Recipe schema and Google rich result eligibility
Every recipe page ships schema.org Recipe markup including cookTime, prepTime, recipeIngredient, recipeInstructions, nutrition, and aggregateRating. Correctly marked-up recipes qualify for Google’s recipe rich result carousel that pulls 3 to 6 times higher click-through rate than a plain blue link. The schema layer takes 15 minutes per recipe to author and 30 minutes to validate in Google Search Console. Cross-reference the recipe search stack on our food and beverage SEO page.
Recipe hub structure that scales
The recipe hub structure runs 40 to 100 recipes at maturity, organized by hero SKU (4 to 12 recipes per SKU) plus occasion tags (breakfast, weeknight dinner, meal prep, brunch, holiday). Every recipe links back to the hero SKU product page with the SKU embedded in an inline card. The hub earns internal linking value from ingredient comparison guides and the sourcing story pages, which feeds recipe ranking on Google. According to Google Search Central recipe structured data guidance, complete Recipe schema markup is required for eligibility in the recipe carousel and the ingredient search filter.
Pillar structure for food brand content marketing
The pillar structure on content marketing for food brands runs 4 content pillars concurrently: recipe hub (40 to 100 recipes), ingredient comparison guides (12 to 24 guides), sourcing story pages (6 to 12 pages), and buyer intent content (where to buy, subscription vs. one-time, gift bundle guides). Every pillar covers a distinct search intent and every pillar links back to the hero SKU product pages.
Ingredient comparison guide format
Ingredient comparison guides run 1,800 to 3,200 words comparing 2 to 4 ingredient types on 6 to 10 attributes with a comparison table, real-world use case examples, and links to the hero SKU that uses the specific ingredient. Example: organic vs. conventional oats compares nutritional profile, sourcing chain, cost, environmental impact, and taste on a 6-column table. The brand’s SKU appears in the winning column with a product card. These guides rank 3 to 8 months after publication and pull steady-state organic traffic.
Sourcing story pages that build trust
Sourcing story pages name the specific farms, cooperatives, or suppliers the brand sources from, with photos of the farms, farmer quotes, and specific harvest windows. A coffee brand’s Ethiopian farm page ranks for “single-origin Ethiopian coffee” and “Yirgacheffe coffee origin” plus 40 long-tail variations. The sourcing page pulls trust-building traffic that converts at 4 to 6 percent because the shopper landed pattern-matching on transparency and named provenance. Every sourcing page includes farmer or cooperative quotes, harvest dates, and a link back to 3 to 5 hero SKU pages that source from the named supplier.
Vejrø hospitality content case study
Vejrø Resort, a Danish private-island destination with an on-site restaurant focused on organic, locally sourced cuisine, joined us with strong social engagement and no organic-search real estate. Guests found the resort on Instagram but never in Google search for terms like “private island resort Denmark,” “farm-to-table hospitality Denmark,” or “Vejrø restaurant.” The same organic-search gap shows up on DTC food brands running paid social at 20,000 dollars monthly with a broken blog and zero recipe schema.
We built the conversion-focused website with on-site and off-site SEO tuned to the travel-niche keyword clusters, competitor analysis against comparable boutique resorts, and mobile-first design prioritizing guest discovery. Every page carried the structured data qualifying it for Google’s rich results in the hospitality category. Every internal link pushed authority toward the direct-booking conversion path.
Three months later, Vejrø hit 10,000 plus organic visitors, ranked for 200 plus first-page keywords, and pulled a 2.2 percent booking conversion rate from organic traffic. The same pattern applies to content marketing for food brands: recipe schema, ingredient comparison guides, and sourcing story pages pull organic traffic at 20 to 40 percent conversion into hero SKU pages inside 6 months when the content quality matches search intent and every page carries the right structured data markup. Vejrø also proved out the reporting discipline: every monthly report named the exact page, the exact keyword cluster, and the exact search feature (rich result, sitelinks, image pack) driving the incremental organic revenue instead of hiding behind aggregate traffic charts.
Recipe cadence and content calendar for food brands
Recipe cadence on a working food brand content calendar ships 2 to 4 new recipes per week during the first 6 months and drops to 1 per week at maturity. Each recipe takes 4 to 6 hours to produce (write, test in the kitchen, photograph, schema author, publish). At 3 recipes per week, the brand hits 78 recipes inside 6 months plus a backlog of ingredient comparison and sourcing content queued behind the recipe production line.
| Content pillar | Target volume year 1 | Production cost per piece | Refresh cadence |
|---|---|---|---|
| Recipe hub | 40 to 100 recipes | $180 to $320 | Every 12 months |
| Ingredient comparison guides | 12 to 24 guides | $450 to $780 | Every 18 months |
| Sourcing story pages | 6 to 12 pages | $680 to $1,200 | Every 24 months |
| Buyer intent content | 8 to 16 pieces | $220 to $420 | Every 12 months |
Photography as a content calendar constraint
Photography is the actual constraint on recipe cadence, not writing. Every recipe needs 6 to 12 photos: hero shot, ingredient flat lay, prep in progress, plated result, storage, and step shots for the schema markup. A working food brand batches photography 8 recipes at a time to keep the cost per recipe under 200 dollars. Skip the batching and the per-recipe cost climbs to 400 to 600 dollars, which caps recipe cadence at 1 per week and slows organic ranking timeline by 6 months.
Seasonal content calendar planning
Seasonal content calendar planning maps recipes and comparison guides to the seasonal windows they need to rank in. A Christmas cookie recipe needs to publish in September to rank by early December. A Valentine’s chocolate guide needs to publish in November to rank by early February. A back-to-school lunchbox recipe needs to publish in June to rank by late August. The 60-to-90-day ranking curve dictates the calendar.
Creator syndication inside food brand content
Creator syndication on food brand content marketing amplifies the recipe hub through Instagram Reels, TikTok, and YouTube Shorts creators paid to post their own version of the brand’s hero recipes. The creator content pulls net-new audiences into the recipe hub through the creator’s Link in Bio or Amazon Storefront tag. The syndication calendar names 12 to 30 creators per quarter with specific recipes assigned to each.
One brand we picked up had a spreadsheet titled “creator outreach 2023” with 47 rows and 3 responses. All 3 responses were auto-replies. The spreadsheet named zero recipes and offered flat rates below 100 dollars per post. Nobody posts a 30-second video for 87 dollars flat. Nobody.
Creator content commercial terms that work
Working creator content commercial terms run 350 to 1,500 dollars flat per post plus a 12 to 25 percent commission on tagged sales across a 30-day window. The commission mechanic pulls creators into follow-up posts because the incremental revenue continues past the initial fee. Mid-tier creators (30k to 150k followers) hit the sweet spot for food brand content because their engagement rate typically runs 4 to 8 percent versus 0.8 to 1.6 percent on mega-creators.
Content brief structure for creator partnerships
The content brief structure for creator partnerships runs a single page: the SKU, the specific recipe or usage occasion, 3 required brand mentions, 3 restricted claims (no health claims on non-medical SKUs), the pricing angle, the affiliate link, and 3 example videos that hit the tone. The brief avoids over-scripting because over-scripted creator content underperforms native creator voice by 40 to 60 percent on engagement rate.
Buyer intent content for food brand blogs
Buyer intent content on food brand blogs covers 8 to 16 pieces targeting explicit purchase-decision queries: “where to buy [brand],” “[brand] subscription vs. one-time,” “best [category] for [use case],” and “[brand] gift bundle.” Every buyer intent piece runs 1,400 to 2,400 words with a comparison table, product cards, and a clear conversion path to the specific SKU that matches the query intent. Buyer intent content converts at 3 to 6 percent versus 1 to 2 percent on recipe content because the shopper landed already planning to buy, not exploring a usage occasion.
Where-to-buy content structure
Where-to-buy content structure covers online (DTC storefront, Amazon, Target.com, Whole Foods online), retail (specific chain locators with the store finder embedded), and international (customs limitations, retailer partners abroad). Every piece names specific retailers, links to the store locator, and includes an FAQ block covering shipping availability, subscription options, and gift card compatibility. Where-to-buy content ranks for branded discovery queries the DTC storefront otherwise loses to competitor affiliate reviews.
Subscription versus one-time comparison content
Subscription versus one-time comparison content converts subscription commitments at 3 to 6 percent because it addresses the price-sensitivity concern head-on with a specific math table. The piece covers the discount structure (15 percent lifetime), the skip-a-month mechanic, the pause-anytime rule, the cancellation policy, and the specific yearly savings for the brand’s average consumption cadence. Cross-reference the retention structure on our food and beverage marketing retainer page.
Content refresh cadence on food brand pillars
Content refresh cadence on food brand content pillars runs a rolling audit every 12 to 24 months by pillar. Recipes get refreshed every 12 months with new photography, updated schema, and any nutrition or ingredient adjustments. Ingredient comparison guides refresh every 18 months to update market data. Sourcing story pages refresh every 24 months to reflect farm partnership changes and new harvest angles. Buyer intent content refreshes every 12 months to update retailer availability and pricing.
Recipe refresh priority order
Recipe refresh priority runs by organic traffic rank. The top 20 recipes by monthly organic sessions get refreshed first (new photography, schema audit, related recipe internal links, updated nutrition). The next 40 get refreshed at 15 months. The remaining recipes get refreshed opportunistically when the ranking slips past position 15 in Google. Skipping the refresh cadence lets recipe rankings drift out of the top 3 inside 18 months as newer competitor recipes take the position.
Schema audit checklist per refresh
The schema audit checklist per refresh runs 8 items: Recipe schema completeness, aggregateRating count and accuracy, nutrition data accuracy, prepTime and cookTime match the recipe body, image URLs valid at CDN, related recipe internal links working, product card SKU URL live, and Google Search Console rich result eligibility validated. This checklist takes 20 minutes per recipe and prevents the schema drift that costs recipe rankings 20 to 40 positions quietly.
Reporting cadence for food brand content marketing
Reporting cadence on food brand content marketing runs a monthly executive report plus a quarterly business review. The monthly report ships in the first business week and covers organic sessions by pillar, top 10 ranking recipes with position trend, ingredient guide ranking movements, sourcing page performance, and organic-attributed DTC revenue. Every number carries a comparison to the prior month and a plain-language interpretation the founder reads in 7 minutes.
Metrics that matter for content marketing
Metrics that matter for food brand content marketing: organic sessions by pillar, recipe rich result impressions in Search Console, organic conversion rate to hero SKU pages, organic-attributed DTC revenue, and top 20 ranking positions by monthly organic sessions. Vanity metrics that do not matter: total pageviews without conversion context, average time on page without conversion attribution, and social share counts. The monthly report skips the vanity block entirely.
Quarterly business review structure
The quarterly business review runs 90 minutes with the founder, head of content, and SEO lead. Agenda: organic traffic trend by pillar, top 10 winning content pieces, top 10 losing content pieces (candidates for refresh or removal), competitive gap analysis against 5 named competitor brands, and next quarter’s content calendar with recipes and ingredient guides queued. According to Ahrefs content marketing research, brands running quarterly content audits outperform brands running annual audits by 40 to 70 percent on organic revenue over a 24-month window.
Internal linking discipline across food brand content
Internal linking discipline across food brand content moves authority from recipe pages toward hero SKU product pages and comparison guides. Every recipe links to the hero SKU it uses inline (once in the ingredient list, once in a bottom call-out card). Every ingredient comparison guide links to 3 to 6 recipes using the winning ingredient plus the hero SKU product page. Every sourcing story links to the 2 to 4 SKUs sourced from that specific farm or cooperative.
Anchor text strategy across recipe hubs
Anchor text on internal links varies across recipe hubs to avoid over-optimization patterns Google penalizes. Exact-match anchor (“single-origin Ethiopian coffee”) runs on 20 to 30 percent of internal links. Partial-match variations (“our Ethiopian roast”) run on 30 to 40 percent. Branded anchors (the SKU name) run on 20 to 30 percent. Generic anchors (“shop the coffee”) fill the remaining 10 to 20 percent. This ratio holds ranking without triggering the over-optimization penalty that shows up on brands that anchor-text-stuff every internal link with the same exact-match keyword. Cross-reference the linking layer on our food and beverage web design page.
Link equity from ingredient guides to SKU pages
Link equity from ingredient guides passes to SKU pages when the guide’s comparison table names the hero SKU in the winning column with a product card, and when the guide’s body links to 3 to 6 recipes that use the winning ingredient. This 3-hop path (guide to recipe to SKU) pushes authority from a high-traffic informational query down to a high-intent transactional page. According to Search Engine Land SEO coverage, informational content that internally links to transactional pages produces 2 to 4 times higher organic revenue than isolated content silos.
Wrapping up content marketing for food brands
Content marketing for food brands is the organic engine that turns a DTC snack, drink, or CPG storefront into a search-driven revenue channel. Recipe hub of 40 to 100 recipes. Ingredient comparison guides at 12 to 24 pieces. Sourcing story pages at 6 to 12 pieces. Buyer intent content at 8 to 16 pieces. Creator syndication calendar with 12 to 30 creators per quarter. Refresh cadence at 12 to 24 months by pillar. Reporting with organic sessions and organic revenue attribution.
If your DTC food brand is running paid social at 20,000 dollars monthly with a broken blog and zero recipe schema, professional content marketing for food brands pays for itself inside the first 90 days on organic traffic captured. Redefine Web ships content marketing inside our monthly retainer packages. Book a call and we will walk through the last three DTC food brands we built recipe hubs for, pillar by pillar.
Content marketing for food brands starts with a recipe hub because recipe queries account for 40 to 60 percent of high-intent search volume in the food category. Every hero SKU needs 4 to 12 recipes anchored to it, each targeting a specific occasion and audience.
Skip the recipe hub and the brand loses the search real estate that pulls DTC storefront traffic month over month at zero incremental paid cost. Recipe traffic converts at 2 to 4 percent because the shopper landed with usage intent, not passive discovery, which is why food brands win on recipes.
Recipe schema and Google rich result eligibility
Every recipe page ships schema.org Recipe markup including cookTime, prepTime, recipeIngredient, recipeInstructions, nutrition, and aggregateRating. Correctly marked-up recipes qualify for Google’s recipe rich result carousel that pulls 3 to 6 times higher click-through rate than a plain blue link. The schema layer takes 15 minutes per recipe to author and 30 minutes to validate in Google Search Console. Cross-reference the recipe search stack on our food and beverage SEO page.
Recipe hub structure that scales
The recipe hub structure runs 40 to 100 recipes at maturity, organized by hero SKU (4 to 12 recipes per SKU) plus occasion tags (breakfast, weeknight dinner, meal prep, brunch, holiday). Every recipe links back to the hero SKU product page with the SKU embedded in an inline card. The hub earns internal linking value from ingredient comparison guides and the sourcing story pages, which feeds recipe ranking on Google. According to Google Search Central recipe structured data guidance, complete Recipe schema markup is required for eligibility in the recipe carousel and the ingredient search filter.
Pillar structure for food brand content marketing
The pillar structure on content marketing for food brands runs 4 content pillars concurrently: recipe hub (40 to 100 recipes), ingredient comparison guides (12 to 24 guides), sourcing story pages (6 to 12 pages), and buyer intent content (where to buy, subscription vs. one-time, gift bundle guides). Every pillar covers a distinct search intent and every pillar links back to the hero SKU product pages.
Ingredient comparison guide format
Ingredient comparison guides run 1,800 to 3,200 words comparing 2 to 4 ingredient types on 6 to 10 attributes with a comparison table, real-world use case examples, and links to the hero SKU that uses the specific ingredient. Example: organic vs. conventional oats compares nutritional profile, sourcing chain, cost, environmental impact, and taste on a 6-column table. The brand’s SKU appears in the winning column with a product card. These guides rank 3 to 8 months after publication and pull steady-state organic traffic.
Sourcing story pages that build trust
Sourcing story pages name the specific farms, cooperatives, or suppliers the brand sources from, with photos of the farms, farmer quotes, and specific harvest windows. A coffee brand’s Ethiopian farm page ranks for “single-origin Ethiopian coffee” and “Yirgacheffe coffee origin” plus 40 long-tail variations. The sourcing page pulls trust-building traffic that converts at 4 to 6 percent because the shopper landed pattern-matching on transparency and named provenance. Every sourcing page includes farmer or cooperative quotes, harvest dates, and a link back to 3 to 5 hero SKU pages that source from the named supplier.
Vejrø hospitality content case study
Vejrø Resort, a Danish private-island destination with an on-site restaurant focused on organic, locally sourced cuisine, joined us with strong social engagement and no organic-search real estate. Guests found the resort on Instagram but never in Google search for terms like “private island resort Denmark,” “farm-to-table hospitality Denmark,” or “Vejrø restaurant.” The same organic-search gap shows up on DTC food brands running paid social at 20,000 dollars monthly with a broken blog and zero recipe schema.
We built the conversion-focused website with on-site and off-site SEO tuned to the travel-niche keyword clusters, competitor analysis against comparable boutique resorts, and mobile-first design prioritizing guest discovery. Every page carried the structured data qualifying it for Google’s rich results in the hospitality category. Every internal link pushed authority toward the direct-booking conversion path.
Three months later, Vejrø hit 10,000 plus organic visitors, ranked for 200 plus first-page keywords, and pulled a 2.2 percent booking conversion rate from organic traffic. The same pattern applies to content marketing for food brands: recipe schema, ingredient comparison guides, and sourcing story pages pull organic traffic at 20 to 40 percent conversion into hero SKU pages inside 6 months when the content quality matches search intent and every page carries the right structured data markup. Vejrø also proved out the reporting discipline: every monthly report named the exact page, the exact keyword cluster, and the exact search feature (rich result, sitelinks, image pack) driving the incremental organic revenue instead of hiding behind aggregate traffic charts.
Recipe cadence and content calendar for food brands
Recipe cadence on a working food brand content calendar ships 2 to 4 new recipes per week during the first 6 months and drops to 1 per week at maturity. Each recipe takes 4 to 6 hours to produce (write, test in the kitchen, photograph, schema author, publish). At 3 recipes per week, the brand hits 78 recipes inside 6 months plus a backlog of ingredient comparison and sourcing content queued behind the recipe production line.
| Content pillar | Target volume year 1 | Production cost per piece | Refresh cadence |
|---|---|---|---|
| Recipe hub | 40 to 100 recipes | $180 to $320 | Every 12 months |
| Ingredient comparison guides | 12 to 24 guides | $450 to $780 | Every 18 months |
| Sourcing story pages | 6 to 12 pages | $680 to $1,200 | Every 24 months |
| Buyer intent content | 8 to 16 pieces | $220 to $420 | Every 12 months |
Photography as a content calendar constraint
Photography is the actual constraint on recipe cadence, not writing. Every recipe needs 6 to 12 photos: hero shot, ingredient flat lay, prep in progress, plated result, storage, and step shots for the schema markup. A working food brand batches photography 8 recipes at a time to keep the cost per recipe under 200 dollars. Skip the batching and the per-recipe cost climbs to 400 to 600 dollars, which caps recipe cadence at 1 per week and slows organic ranking timeline by 6 months.
Seasonal content calendar planning
Seasonal content calendar planning maps recipes and comparison guides to the seasonal windows they need to rank in. A Christmas cookie recipe needs to publish in September to rank by early December. A Valentine’s chocolate guide needs to publish in November to rank by early February. A back-to-school lunchbox recipe needs to publish in June to rank by late August. The 60-to-90-day ranking curve dictates the calendar.
Creator syndication inside food brand content
Creator syndication on food brand content marketing amplifies the recipe hub through Instagram Reels, TikTok, and YouTube Shorts creators paid to post their own version of the brand’s hero recipes. The creator content pulls net-new audiences into the recipe hub through the creator’s Link in Bio or Amazon Storefront tag. The syndication calendar names 12 to 30 creators per quarter with specific recipes assigned to each.
One brand we picked up had a spreadsheet titled “creator outreach 2023” with 47 rows and 3 responses. All 3 responses were auto-replies. The spreadsheet named zero recipes and offered flat rates below 100 dollars per post. Nobody posts a 30-second video for 87 dollars flat. Nobody.
Creator content commercial terms that work
Working creator content commercial terms run 350 to 1,500 dollars flat per post plus a 12 to 25 percent commission on tagged sales across a 30-day window. The commission mechanic pulls creators into follow-up posts because the incremental revenue continues past the initial fee. Mid-tier creators (30k to 150k followers) hit the sweet spot for food brand content because their engagement rate typically runs 4 to 8 percent versus 0.8 to 1.6 percent on mega-creators.
Content brief structure for creator partnerships
The content brief structure for creator partnerships runs a single page: the SKU, the specific recipe or usage occasion, 3 required brand mentions, 3 restricted claims (no health claims on non-medical SKUs), the pricing angle, the affiliate link, and 3 example videos that hit the tone. The brief avoids over-scripting because over-scripted creator content underperforms native creator voice by 40 to 60 percent on engagement rate.
Buyer intent content for food brand blogs
Buyer intent content on food brand blogs covers 8 to 16 pieces targeting explicit purchase-decision queries: “where to buy [brand],” “[brand] subscription vs. one-time,” “best [category] for [use case],” and “[brand] gift bundle.” Every buyer intent piece runs 1,400 to 2,400 words with a comparison table, product cards, and a clear conversion path to the specific SKU that matches the query intent. Buyer intent content converts at 3 to 6 percent versus 1 to 2 percent on recipe content because the shopper landed already planning to buy, not exploring a usage occasion.
Where-to-buy content structure
Where-to-buy content structure covers online (DTC storefront, Amazon, Target.com, Whole Foods online), retail (specific chain locators with the store finder embedded), and international (customs limitations, retailer partners abroad). Every piece names specific retailers, links to the store locator, and includes an FAQ block covering shipping availability, subscription options, and gift card compatibility. Where-to-buy content ranks for branded discovery queries the DTC storefront otherwise loses to competitor affiliate reviews.
Subscription versus one-time comparison content
Subscription versus one-time comparison content converts subscription commitments at 3 to 6 percent because it addresses the price-sensitivity concern head-on with a specific math table. The piece covers the discount structure (15 percent lifetime), the skip-a-month mechanic, the pause-anytime rule, the cancellation policy, and the specific yearly savings for the brand’s average consumption cadence. Cross-reference the retention structure on our food and beverage marketing retainer page.
Content refresh cadence on food brand pillars
Content refresh cadence on food brand content pillars runs a rolling audit every 12 to 24 months by pillar. Recipes get refreshed every 12 months with new photography, updated schema, and any nutrition or ingredient adjustments. Ingredient comparison guides refresh every 18 months to update market data. Sourcing story pages refresh every 24 months to reflect farm partnership changes and new harvest angles. Buyer intent content refreshes every 12 months to update retailer availability and pricing.
Recipe refresh priority order
Recipe refresh priority runs by organic traffic rank. The top 20 recipes by monthly organic sessions get refreshed first (new photography, schema audit, related recipe internal links, updated nutrition). The next 40 get refreshed at 15 months. The remaining recipes get refreshed opportunistically when the ranking slips past position 15 in Google. Skipping the refresh cadence lets recipe rankings drift out of the top 3 inside 18 months as newer competitor recipes take the position.
Schema audit checklist per refresh
The schema audit checklist per refresh runs 8 items: Recipe schema completeness, aggregateRating count and accuracy, nutrition data accuracy, prepTime and cookTime match the recipe body, image URLs valid at CDN, related recipe internal links working, product card SKU URL live, and Google Search Console rich result eligibility validated. This checklist takes 20 minutes per recipe and prevents the schema drift that costs recipe rankings 20 to 40 positions quietly.
Reporting cadence for food brand content marketing
Reporting cadence on food brand content marketing runs a monthly executive report plus a quarterly business review. The monthly report ships in the first business week and covers organic sessions by pillar, top 10 ranking recipes with position trend, ingredient guide ranking movements, sourcing page performance, and organic-attributed DTC revenue. Every number carries a comparison to the prior month and a plain-language interpretation the founder reads in 7 minutes.
Metrics that matter for content marketing
Metrics that matter for food brand content marketing: organic sessions by pillar, recipe rich result impressions in Search Console, organic conversion rate to hero SKU pages, organic-attributed DTC revenue, and top 20 ranking positions by monthly organic sessions. Vanity metrics that do not matter: total pageviews without conversion context, average time on page without conversion attribution, and social share counts. The monthly report skips the vanity block entirely.
Quarterly business review structure
The quarterly business review runs 90 minutes with the founder, head of content, and SEO lead. Agenda: organic traffic trend by pillar, top 10 winning content pieces, top 10 losing content pieces (candidates for refresh or removal), competitive gap analysis against 5 named competitor brands, and next quarter’s content calendar with recipes and ingredient guides queued. According to Ahrefs content marketing research, brands running quarterly content audits outperform brands running annual audits by 40 to 70 percent on organic revenue over a 24-month window.
Internal linking discipline across food brand content
Internal linking discipline across food brand content moves authority from recipe pages toward hero SKU product pages and comparison guides. Every recipe links to the hero SKU it uses inline (once in the ingredient list, once in a bottom call-out card). Every ingredient comparison guide links to 3 to 6 recipes using the winning ingredient plus the hero SKU product page. Every sourcing story links to the 2 to 4 SKUs sourced from that specific farm or cooperative.
Anchor text strategy across recipe hubs
Anchor text on internal links varies across recipe hubs to avoid over-optimization patterns Google penalizes. Exact-match anchor (“single-origin Ethiopian coffee”) runs on 20 to 30 percent of internal links. Partial-match variations (“our Ethiopian roast”) run on 30 to 40 percent. Branded anchors (the SKU name) run on 20 to 30 percent. Generic anchors (“shop the coffee”) fill the remaining 10 to 20 percent. This ratio holds ranking without triggering the over-optimization penalty that shows up on brands that anchor-text-stuff every internal link with the same exact-match keyword. Cross-reference the linking layer on our food and beverage web design page.
Link equity from ingredient guides to SKU pages
Link equity from ingredient guides passes to SKU pages when the guide’s comparison table names the hero SKU in the winning column with a product card, and when the guide’s body links to 3 to 6 recipes that use the winning ingredient. This 3-hop path (guide to recipe to SKU) pushes authority from a high-traffic informational query down to a high-intent transactional page. According to Search Engine Land SEO coverage, informational content that internally links to transactional pages produces 2 to 4 times higher organic revenue than isolated content silos.
Wrapping up content marketing for food brands
Content marketing for food brands is the organic engine that turns a DTC snack, drink, or CPG storefront into a search-driven revenue channel. Recipe hub of 40 to 100 recipes. Ingredient comparison guides at 12 to 24 pieces. Sourcing story pages at 6 to 12 pieces. Buyer intent content at 8 to 16 pieces. Creator syndication calendar with 12 to 30 creators per quarter. Refresh cadence at 12 to 24 months by pillar. Reporting with organic sessions and organic revenue attribution.
If your DTC food brand is running paid social at 20,000 dollars monthly with a broken blog and zero recipe schema, professional content marketing for food brands pays for itself inside the first 90 days on organic traffic captured. Redefine Web ships content marketing inside our monthly retainer packages. Book a call and we will walk through the last three DTC food brands we built recipe hubs for, pillar by pillar.
Content marketing for food brands starts with a recipe hub because recipe queries account for 40 to 60 percent of high-intent search volume in the food category. Every hero SKU needs 4 to 12 recipes anchored to it, each targeting a specific occasion and audience.
Skip the recipe hub and the brand loses the search real estate that pulls DTC storefront traffic month over month at zero incremental paid cost. Recipe traffic converts at 2 to 4 percent because the shopper landed with usage intent, not passive discovery, which is why food brands win on recipes.
Recipe schema and Google rich result eligibility
Every recipe page ships schema.org Recipe markup including cookTime, prepTime, recipeIngredient, recipeInstructions, nutrition, and aggregateRating. Correctly marked-up recipes qualify for Google’s recipe rich result carousel that pulls 3 to 6 times higher click-through rate than a plain blue link. The schema layer takes 15 minutes per recipe to author and 30 minutes to validate in Google Search Console. Cross-reference the recipe search stack on our food and beverage SEO page.
Recipe hub structure that scales
The recipe hub structure runs 40 to 100 recipes at maturity, organized by hero SKU (4 to 12 recipes per SKU) plus occasion tags (breakfast, weeknight dinner, meal prep, brunch, holiday). Every recipe links back to the hero SKU product page with the SKU embedded in an inline card. The hub earns internal linking value from ingredient comparison guides and the sourcing story pages, which feeds recipe ranking on Google. According to Google Search Central recipe structured data guidance, complete Recipe schema markup is required for eligibility in the recipe carousel and the ingredient search filter.
Pillar structure for food brand content marketing
The pillar structure on content marketing for food brands runs 4 content pillars concurrently: recipe hub (40 to 100 recipes), ingredient comparison guides (12 to 24 guides), sourcing story pages (6 to 12 pages), and buyer intent content (where to buy, subscription vs. one-time, gift bundle guides). Every pillar covers a distinct search intent and every pillar links back to the hero SKU product pages.
Ingredient comparison guide format
Ingredient comparison guides run 1,800 to 3,200 words comparing 2 to 4 ingredient types on 6 to 10 attributes with a comparison table, real-world use case examples, and links to the hero SKU that uses the specific ingredient. Example: organic vs. conventional oats compares nutritional profile, sourcing chain, cost, environmental impact, and taste on a 6-column table. The brand’s SKU appears in the winning column with a product card. These guides rank 3 to 8 months after publication and pull steady-state organic traffic.
Sourcing story pages that build trust
Sourcing story pages name the specific farms, cooperatives, or suppliers the brand sources from, with photos of the farms, farmer quotes, and specific harvest windows. A coffee brand’s Ethiopian farm page ranks for “single-origin Ethiopian coffee” and “Yirgacheffe coffee origin” plus 40 long-tail variations. The sourcing page pulls trust-building traffic that converts at 4 to 6 percent because the shopper landed pattern-matching on transparency and named provenance. Every sourcing page includes farmer or cooperative quotes, harvest dates, and a link back to 3 to 5 hero SKU pages that source from the named supplier.
Vejrø hospitality content case study
Vejrø Resort, a Danish private-island destination with an on-site restaurant focused on organic, locally sourced cuisine, joined us with strong social engagement and no organic-search real estate. Guests found the resort on Instagram but never in Google search for terms like “private island resort Denmark,” “farm-to-table hospitality Denmark,” or “Vejrø restaurant.” The same organic-search gap shows up on DTC food brands running paid social at 20,000 dollars monthly with a broken blog and zero recipe schema.
We built the conversion-focused website with on-site and off-site SEO tuned to the travel-niche keyword clusters, competitor analysis against comparable boutique resorts, and mobile-first design prioritizing guest discovery. Every page carried the structured data qualifying it for Google’s rich results in the hospitality category. Every internal link pushed authority toward the direct-booking conversion path.
Three months later, Vejrø hit 10,000 plus organic visitors, ranked for 200 plus first-page keywords, and pulled a 2.2 percent booking conversion rate from organic traffic. The same pattern applies to content marketing for food brands: recipe schema, ingredient comparison guides, and sourcing story pages pull organic traffic at 20 to 40 percent conversion into hero SKU pages inside 6 months when the content quality matches search intent and every page carries the right structured data markup. Vejrø also proved out the reporting discipline: every monthly report named the exact page, the exact keyword cluster, and the exact search feature (rich result, sitelinks, image pack) driving the incremental organic revenue instead of hiding behind aggregate traffic charts.
Recipe cadence and content calendar for food brands
Recipe cadence on a working food brand content calendar ships 2 to 4 new recipes per week during the first 6 months and drops to 1 per week at maturity. Each recipe takes 4 to 6 hours to produce (write, test in the kitchen, photograph, schema author, publish). At 3 recipes per week, the brand hits 78 recipes inside 6 months plus a backlog of ingredient comparison and sourcing content queued behind the recipe production line.
| Content pillar | Target volume year 1 | Production cost per piece | Refresh cadence |
|---|---|---|---|
| Recipe hub | 40 to 100 recipes | $180 to $320 | Every 12 months |
| Ingredient comparison guides | 12 to 24 guides | $450 to $780 | Every 18 months |
| Sourcing story pages | 6 to 12 pages | $680 to $1,200 | Every 24 months |
| Buyer intent content | 8 to 16 pieces | $220 to $420 | Every 12 months |
Photography as a content calendar constraint
Photography is the actual constraint on recipe cadence, not writing. Every recipe needs 6 to 12 photos: hero shot, ingredient flat lay, prep in progress, plated result, storage, and step shots for the schema markup. A working food brand batches photography 8 recipes at a time to keep the cost per recipe under 200 dollars. Skip the batching and the per-recipe cost climbs to 400 to 600 dollars, which caps recipe cadence at 1 per week and slows organic ranking timeline by 6 months.
Seasonal content calendar planning
Seasonal content calendar planning maps recipes and comparison guides to the seasonal windows they need to rank in. A Christmas cookie recipe needs to publish in September to rank by early December. A Valentine’s chocolate guide needs to publish in November to rank by early February. A back-to-school lunchbox recipe needs to publish in June to rank by late August. The 60-to-90-day ranking curve dictates the calendar.
Creator syndication inside food brand content
Creator syndication on food brand content marketing amplifies the recipe hub through Instagram Reels, TikTok, and YouTube Shorts creators paid to post their own version of the brand’s hero recipes. The creator content pulls net-new audiences into the recipe hub through the creator’s Link in Bio or Amazon Storefront tag. The syndication calendar names 12 to 30 creators per quarter with specific recipes assigned to each.
One brand we picked up had a spreadsheet titled “creator outreach 2023” with 47 rows and 3 responses. All 3 responses were auto-replies. The spreadsheet named zero recipes and offered flat rates below 100 dollars per post. Nobody posts a 30-second video for 87 dollars flat. Nobody.
Creator content commercial terms that work
Working creator content commercial terms run 350 to 1,500 dollars flat per post plus a 12 to 25 percent commission on tagged sales across a 30-day window. The commission mechanic pulls creators into follow-up posts because the incremental revenue continues past the initial fee. Mid-tier creators (30k to 150k followers) hit the sweet spot for food brand content because their engagement rate typically runs 4 to 8 percent versus 0.8 to 1.6 percent on mega-creators.
Content brief structure for creator partnerships
The content brief structure for creator partnerships runs a single page: the SKU, the specific recipe or usage occasion, 3 required brand mentions, 3 restricted claims (no health claims on non-medical SKUs), the pricing angle, the affiliate link, and 3 example videos that hit the tone. The brief avoids over-scripting because over-scripted creator content underperforms native creator voice by 40 to 60 percent on engagement rate.
Buyer intent content for food brand blogs
Buyer intent content on food brand blogs covers 8 to 16 pieces targeting explicit purchase-decision queries: “where to buy [brand],” “[brand] subscription vs. one-time,” “best [category] for [use case],” and “[brand] gift bundle.” Every buyer intent piece runs 1,400 to 2,400 words with a comparison table, product cards, and a clear conversion path to the specific SKU that matches the query intent. Buyer intent content converts at 3 to 6 percent versus 1 to 2 percent on recipe content because the shopper landed already planning to buy, not exploring a usage occasion.
Where-to-buy content structure
Where-to-buy content structure covers online (DTC storefront, Amazon, Target.com, Whole Foods online), retail (specific chain locators with the store finder embedded), and international (customs limitations, retailer partners abroad). Every piece names specific retailers, links to the store locator, and includes an FAQ block covering shipping availability, subscription options, and gift card compatibility. Where-to-buy content ranks for branded discovery queries the DTC storefront otherwise loses to competitor affiliate reviews.
Subscription versus one-time comparison content
Subscription versus one-time comparison content converts subscription commitments at 3 to 6 percent because it addresses the price-sensitivity concern head-on with a specific math table. The piece covers the discount structure (15 percent lifetime), the skip-a-month mechanic, the pause-anytime rule, the cancellation policy, and the specific yearly savings for the brand’s average consumption cadence. Cross-reference the retention structure on our food and beverage marketing retainer page.
Content refresh cadence on food brand pillars
Content refresh cadence on food brand content pillars runs a rolling audit every 12 to 24 months by pillar. Recipes get refreshed every 12 months with new photography, updated schema, and any nutrition or ingredient adjustments. Ingredient comparison guides refresh every 18 months to update market data. Sourcing story pages refresh every 24 months to reflect farm partnership changes and new harvest angles. Buyer intent content refreshes every 12 months to update retailer availability and pricing.
Recipe refresh priority order
Recipe refresh priority runs by organic traffic rank. The top 20 recipes by monthly organic sessions get refreshed first (new photography, schema audit, related recipe internal links, updated nutrition). The next 40 get refreshed at 15 months. The remaining recipes get refreshed opportunistically when the ranking slips past position 15 in Google. Skipping the refresh cadence lets recipe rankings drift out of the top 3 inside 18 months as newer competitor recipes take the position.
Schema audit checklist per refresh
The schema audit checklist per refresh runs 8 items: Recipe schema completeness, aggregateRating count and accuracy, nutrition data accuracy, prepTime and cookTime match the recipe body, image URLs valid at CDN, related recipe internal links working, product card SKU URL live, and Google Search Console rich result eligibility validated. This checklist takes 20 minutes per recipe and prevents the schema drift that costs recipe rankings 20 to 40 positions quietly.
Reporting cadence for food brand content marketing
Reporting cadence on food brand content marketing runs a monthly executive report plus a quarterly business review. The monthly report ships in the first business week and covers organic sessions by pillar, top 10 ranking recipes with position trend, ingredient guide ranking movements, sourcing page performance, and organic-attributed DTC revenue. Every number carries a comparison to the prior month and a plain-language interpretation the founder reads in 7 minutes.
Metrics that matter for content marketing
Metrics that matter for food brand content marketing: organic sessions by pillar, recipe rich result impressions in Search Console, organic conversion rate to hero SKU pages, organic-attributed DTC revenue, and top 20 ranking positions by monthly organic sessions. Vanity metrics that do not matter: total pageviews without conversion context, average time on page without conversion attribution, and social share counts. The monthly report skips the vanity block entirely.
Quarterly business review structure
The quarterly business review runs 90 minutes with the founder, head of content, and SEO lead. Agenda: organic traffic trend by pillar, top 10 winning content pieces, top 10 losing content pieces (candidates for refresh or removal), competitive gap analysis against 5 named competitor brands, and next quarter’s content calendar with recipes and ingredient guides queued. According to Ahrefs content marketing research, brands running quarterly content audits outperform brands running annual audits by 40 to 70 percent on organic revenue over a 24-month window.
Internal linking discipline across food brand content
Internal linking discipline across food brand content moves authority from recipe pages toward hero SKU product pages and comparison guides. Every recipe links to the hero SKU it uses inline (once in the ingredient list, once in a bottom call-out card). Every ingredient comparison guide links to 3 to 6 recipes using the winning ingredient plus the hero SKU product page. Every sourcing story links to the 2 to 4 SKUs sourced from that specific farm or cooperative.
Anchor text strategy across recipe hubs
Anchor text on internal links varies across recipe hubs to avoid over-optimization patterns Google penalizes. Exact-match anchor (“single-origin Ethiopian coffee”) runs on 20 to 30 percent of internal links. Partial-match variations (“our Ethiopian roast”) run on 30 to 40 percent. Branded anchors (the SKU name) run on 20 to 30 percent. Generic anchors (“shop the coffee”) fill the remaining 10 to 20 percent. This ratio holds ranking without triggering the over-optimization penalty that shows up on brands that anchor-text-stuff every internal link with the same exact-match keyword. Cross-reference the linking layer on our food and beverage web design page.
Link equity from ingredient guides to SKU pages
Link equity from ingredient guides passes to SKU pages when the guide’s comparison table names the hero SKU in the winning column with a product card, and when the guide’s body links to 3 to 6 recipes that use the winning ingredient. This 3-hop path (guide to recipe to SKU) pushes authority from a high-traffic informational query down to a high-intent transactional page. According to Search Engine Land SEO coverage, informational content that internally links to transactional pages produces 2 to 4 times higher organic revenue than isolated content silos.
Wrapping up content marketing for food brands
Content marketing for food brands is the organic engine that turns a DTC snack, drink, or CPG storefront into a search-driven revenue channel. Recipe hub of 40 to 100 recipes. Ingredient comparison guides at 12 to 24 pieces. Sourcing story pages at 6 to 12 pieces. Buyer intent content at 8 to 16 pieces. Creator syndication calendar with 12 to 30 creators per quarter. Refresh cadence at 12 to 24 months by pillar. Reporting with organic sessions and organic revenue attribution.
If your DTC food brand is running paid social at 20,000 dollars monthly with a broken blog and zero recipe schema, professional content marketing for food brands pays for itself inside the first 90 days on organic traffic captured. Redefine Web ships content marketing inside our monthly retainer packages. Book a call and we will walk through the last three DTC food brands we built recipe hubs for, pillar by pillar.
Anchor text on internal links varies across recipe hubs to avoid over-optimization patterns Google penalizes. Exact-match anchor (“single-origin Ethiopian coffee”) runs on 20 to 30 percent of internal links. Partial-match variations (“our Ethiopian roast”) run on 30 to 40 percent. Branded anchors (the SKU name) run on 20 to 30 percent. Generic anchors (“shop the coffee”) fill the remaining 10 to 20 percent. This ratio holds ranking without triggering the over-optimization penalty that shows up on brands that anchor-text-stuff every internal link with the same exact-match keyword. Cross-reference the linking layer on our food and beverage web design page.
Link equity from ingredient guides to SKU pages
Link equity from ingredient guides passes to SKU pages when the guide’s comparison table names the hero SKU in the winning column with a product card, and when the guide’s body links to 3 to 6 recipes that use the winning ingredient. This 3-hop path (guide to recipe to SKU) pushes authority from a high-traffic informational query down to a high-intent transactional page. According to Search Engine Land SEO coverage, informational content that internally links to transactional pages produces 2 to 4 times higher organic revenue than isolated content silos.
Wrapping up content marketing for food brands
Content marketing for food brands is the organic engine that turns a DTC snack, drink, or CPG storefront into a search-driven revenue channel. Recipe hub of 40 to 100 recipes. Ingredient comparison guides at 12 to 24 pieces. Sourcing story pages at 6 to 12 pieces. Buyer intent content at 8 to 16 pieces. Creator syndication calendar with 12 to 30 creators per quarter. Refresh cadence at 12 to 24 months by pillar. Reporting with organic sessions and organic revenue attribution.
If your DTC food brand is running paid social at 20,000 dollars monthly with a broken blog and zero recipe schema, professional content marketing for food brands pays for itself inside the first 90 days on organic traffic captured. Redefine Web ships content marketing inside our monthly retainer packages. Book a call and we will walk through the last three DTC food brands we built recipe hubs for, pillar by pillar.
Content marketing for food brands starts with a recipe hub because recipe queries account for 40 to 60 percent of high-intent search volume in the food category. Every hero SKU needs 4 to 12 recipes anchored to it, each targeting a specific occasion and audience.
Skip the recipe hub and the brand loses the search real estate that pulls DTC storefront traffic month over month at zero incremental paid cost. Recipe traffic converts at 2 to 4 percent because the shopper landed with usage intent, not passive discovery, which is why food brands win on recipes.
Recipe schema and Google rich result eligibility
Every recipe page ships schema.org Recipe markup including cookTime, prepTime, recipeIngredient, recipeInstructions, nutrition, and aggregateRating. Correctly marked-up recipes qualify for Google’s recipe rich result carousel that pulls 3 to 6 times higher click-through rate than a plain blue link. The schema layer takes 15 minutes per recipe to author and 30 minutes to validate in Google Search Console. Cross-reference the recipe search stack on our food and beverage SEO page.
Recipe hub structure that scales
The recipe hub structure runs 40 to 100 recipes at maturity, organized by hero SKU (4 to 12 recipes per SKU) plus occasion tags (breakfast, weeknight dinner, meal prep, brunch, holiday). Every recipe links back to the hero SKU product page with the SKU embedded in an inline card. The hub earns internal linking value from ingredient comparison guides and the sourcing story pages, which feeds recipe ranking on Google. According to Google Search Central recipe structured data guidance, complete Recipe schema markup is required for eligibility in the recipe carousel and the ingredient search filter.
Pillar structure for food brand content marketing
The pillar structure on content marketing for food brands runs 4 content pillars concurrently: recipe hub (40 to 100 recipes), ingredient comparison guides (12 to 24 guides), sourcing story pages (6 to 12 pages), and buyer intent content (where to buy, subscription vs. one-time, gift bundle guides). Every pillar covers a distinct search intent and every pillar links back to the hero SKU product pages.
Ingredient comparison guide format
Ingredient comparison guides run 1,800 to 3,200 words comparing 2 to 4 ingredient types on 6 to 10 attributes with a comparison table, real-world use case examples, and links to the hero SKU that uses the specific ingredient. Example: organic vs. conventional oats compares nutritional profile, sourcing chain, cost, environmental impact, and taste on a 6-column table. The brand’s SKU appears in the winning column with a product card. These guides rank 3 to 8 months after publication and pull steady-state organic traffic.
Sourcing story pages that build trust
Sourcing story pages name the specific farms, cooperatives, or suppliers the brand sources from, with photos of the farms, farmer quotes, and specific harvest windows. A coffee brand’s Ethiopian farm page ranks for “single-origin Ethiopian coffee” and “Yirgacheffe coffee origin” plus 40 long-tail variations. The sourcing page pulls trust-building traffic that converts at 4 to 6 percent because the shopper landed pattern-matching on transparency and named provenance. Every sourcing page includes farmer or cooperative quotes, harvest dates, and a link back to 3 to 5 hero SKU pages that source from the named supplier.
Vejrø hospitality content case study
Vejrø Resort, a Danish private-island destination with an on-site restaurant focused on organic, locally sourced cuisine, joined us with strong social engagement and no organic-search real estate. Guests found the resort on Instagram but never in Google search for terms like “private island resort Denmark,” “farm-to-table hospitality Denmark,” or “Vejrø restaurant.” The same organic-search gap shows up on DTC food brands running paid social at 20,000 dollars monthly with a broken blog and zero recipe schema.
We built the conversion-focused website with on-site and off-site SEO tuned to the travel-niche keyword clusters, competitor analysis against comparable boutique resorts, and mobile-first design prioritizing guest discovery. Every page carried the structured data qualifying it for Google’s rich results in the hospitality category. Every internal link pushed authority toward the direct-booking conversion path.
Three months later, Vejrø hit 10,000 plus organic visitors, ranked for 200 plus first-page keywords, and pulled a 2.2 percent booking conversion rate from organic traffic. The same pattern applies to content marketing for food brands: recipe schema, ingredient comparison guides, and sourcing story pages pull organic traffic at 20 to 40 percent conversion into hero SKU pages inside 6 months when the content quality matches search intent and every page carries the right structured data markup. Vejrø also proved out the reporting discipline: every monthly report named the exact page, the exact keyword cluster, and the exact search feature (rich result, sitelinks, image pack) driving the incremental organic revenue instead of hiding behind aggregate traffic charts.
Recipe cadence and content calendar for food brands
Recipe cadence on a working food brand content calendar ships 2 to 4 new recipes per week during the first 6 months and drops to 1 per week at maturity. Each recipe takes 4 to 6 hours to produce (write, test in the kitchen, photograph, schema author, publish). At 3 recipes per week, the brand hits 78 recipes inside 6 months plus a backlog of ingredient comparison and sourcing content queued behind the recipe production line.
| Content pillar | Target volume year 1 | Production cost per piece | Refresh cadence |
|---|---|---|---|
| Recipe hub | 40 to 100 recipes | $180 to $320 | Every 12 months |
| Ingredient comparison guides | 12 to 24 guides | $450 to $780 | Every 18 months |
| Sourcing story pages | 6 to 12 pages | $680 to $1,200 | Every 24 months |
| Buyer intent content | 8 to 16 pieces | $220 to $420 | Every 12 months |
Photography as a content calendar constraint
Photography is the actual constraint on recipe cadence, not writing. Every recipe needs 6 to 12 photos: hero shot, ingredient flat lay, prep in progress, plated result, storage, and step shots for the schema markup. A working food brand batches photography 8 recipes at a time to keep the cost per recipe under 200 dollars. Skip the batching and the per-recipe cost climbs to 400 to 600 dollars, which caps recipe cadence at 1 per week and slows organic ranking timeline by 6 months.
Seasonal content calendar planning
Seasonal content calendar planning maps recipes and comparison guides to the seasonal windows they need to rank in. A Christmas cookie recipe needs to publish in September to rank by early December. A Valentine’s chocolate guide needs to publish in November to rank by early February. A back-to-school lunchbox recipe needs to publish in June to rank by late August. The 60-to-90-day ranking curve dictates the calendar.
Creator syndication inside food brand content
Creator syndication on food brand content marketing amplifies the recipe hub through Instagram Reels, TikTok, and YouTube Shorts creators paid to post their own version of the brand’s hero recipes. The creator content pulls net-new audiences into the recipe hub through the creator’s Link in Bio or Amazon Storefront tag. The syndication calendar names 12 to 30 creators per quarter with specific recipes assigned to each.
One brand we picked up had a spreadsheet titled “creator outreach 2023” with 47 rows and 3 responses. All 3 responses were auto-replies. The spreadsheet named zero recipes and offered flat rates below 100 dollars per post. Nobody posts a 30-second video for 87 dollars flat. Nobody.
Creator content commercial terms that work
Working creator content commercial terms run 350 to 1,500 dollars flat per post plus a 12 to 25 percent commission on tagged sales across a 30-day window. The commission mechanic pulls creators into follow-up posts because the incremental revenue continues past the initial fee. Mid-tier creators (30k to 150k followers) hit the sweet spot for food brand content because their engagement rate typically runs 4 to 8 percent versus 0.8 to 1.6 percent on mega-creators.
Content brief structure for creator partnerships
The content brief structure for creator partnerships runs a single page: the SKU, the specific recipe or usage occasion, 3 required brand mentions, 3 restricted claims (no health claims on non-medical SKUs), the pricing angle, the affiliate link, and 3 example videos that hit the tone. The brief avoids over-scripting because over-scripted creator content underperforms native creator voice by 40 to 60 percent on engagement rate.
Buyer intent content for food brand blogs
Buyer intent content on food brand blogs covers 8 to 16 pieces targeting explicit purchase-decision queries: “where to buy [brand],” “[brand] subscription vs. one-time,” “best [category] for [use case],” and “[brand] gift bundle.” Every buyer intent piece runs 1,400 to 2,400 words with a comparison table, product cards, and a clear conversion path to the specific SKU that matches the query intent. Buyer intent content converts at 3 to 6 percent versus 1 to 2 percent on recipe content because the shopper landed already planning to buy, not exploring a usage occasion.
Where-to-buy content structure
Where-to-buy content structure covers online (DTC storefront, Amazon, Target.com, Whole Foods online), retail (specific chain locators with the store finder embedded), and international (customs limitations, retailer partners abroad). Every piece names specific retailers, links to the store locator, and includes an FAQ block covering shipping availability, subscription options, and gift card compatibility. Where-to-buy content ranks for branded discovery queries the DTC storefront otherwise loses to competitor affiliate reviews.
Subscription versus one-time comparison content
Subscription versus one-time comparison content converts subscription commitments at 3 to 6 percent because it addresses the price-sensitivity concern head-on with a specific math table. The piece covers the discount structure (15 percent lifetime), the skip-a-month mechanic, the pause-anytime rule, the cancellation policy, and the specific yearly savings for the brand’s average consumption cadence. Cross-reference the retention structure on our food and beverage marketing retainer page.
Content refresh cadence on food brand pillars
Content refresh cadence on food brand content pillars runs a rolling audit every 12 to 24 months by pillar. Recipes get refreshed every 12 months with new photography, updated schema, and any nutrition or ingredient adjustments. Ingredient comparison guides refresh every 18 months to update market data. Sourcing story pages refresh every 24 months to reflect farm partnership changes and new harvest angles. Buyer intent content refreshes every 12 months to update retailer availability and pricing.
Recipe refresh priority order
Recipe refresh priority runs by organic traffic rank. The top 20 recipes by monthly organic sessions get refreshed first (new photography, schema audit, related recipe internal links, updated nutrition). The next 40 get refreshed at 15 months. The remaining recipes get refreshed opportunistically when the ranking slips past position 15 in Google. Skipping the refresh cadence lets recipe rankings drift out of the top 3 inside 18 months as newer competitor recipes take the position.
Schema audit checklist per refresh
The schema audit checklist per refresh runs 8 items: Recipe schema completeness, aggregateRating count and accuracy, nutrition data accuracy, prepTime and cookTime match the recipe body, image URLs valid at CDN, related recipe internal links working, product card SKU URL live, and Google Search Console rich result eligibility validated. This checklist takes 20 minutes per recipe and prevents the schema drift that costs recipe rankings 20 to 40 positions quietly.
Reporting cadence for food brand content marketing
Reporting cadence on food brand content marketing runs a monthly executive report plus a quarterly business review. The monthly report ships in the first business week and covers organic sessions by pillar, top 10 ranking recipes with position trend, ingredient guide ranking movements, sourcing page performance, and organic-attributed DTC revenue. Every number carries a comparison to the prior month and a plain-language interpretation the founder reads in 7 minutes.
Metrics that matter for content marketing
Metrics that matter for food brand content marketing: organic sessions by pillar, recipe rich result impressions in Search Console, organic conversion rate to hero SKU pages, organic-attributed DTC revenue, and top 20 ranking positions by monthly organic sessions. Vanity metrics that do not matter: total pageviews without conversion context, average time on page without conversion attribution, and social share counts. The monthly report skips the vanity block entirely.
Quarterly business review structure
The quarterly business review runs 90 minutes with the founder, head of content, and SEO lead. Agenda: organic traffic trend by pillar, top 10 winning content pieces, top 10 losing content pieces (candidates for refresh or removal), competitive gap analysis against 5 named competitor brands, and next quarter’s content calendar with recipes and ingredient guides queued. According to Ahrefs content marketing research, brands running quarterly content audits outperform brands running annual audits by 40 to 70 percent on organic revenue over a 24-month window.
Internal linking discipline across food brand content
Internal linking discipline across food brand content moves authority from recipe pages toward hero SKU product pages and comparison guides. Every recipe links to the hero SKU it uses inline (once in the ingredient list, once in a bottom call-out card). Every ingredient comparison guide links to 3 to 6 recipes using the winning ingredient plus the hero SKU product page. Every sourcing story links to the 2 to 4 SKUs sourced from that specific farm or cooperative.
Anchor text strategy across recipe hubs
Anchor text on internal links varies across recipe hubs to avoid over-optimization patterns Google penalizes. Exact-match anchor (“single-origin Ethiopian coffee”) runs on 20 to 30 percent of internal links. Partial-match variations (“our Ethiopian roast”) run on 30 to 40 percent. Branded anchors (the SKU name) run on 20 to 30 percent. Generic anchors (“shop the coffee”) fill the remaining 10 to 20 percent. This ratio holds ranking without triggering the over-optimization penalty that shows up on brands that anchor-text-stuff every internal link with the same exact-match keyword. Cross-reference the linking layer on our food and beverage web design page.
Link equity from ingredient guides to SKU pages
Link equity from ingredient guides passes to SKU pages when the guide’s comparison table names the hero SKU in the winning column with a product card, and when the guide’s body links to 3 to 6 recipes that use the winning ingredient. This 3-hop path (guide to recipe to SKU) pushes authority from a high-traffic informational query down to a high-intent transactional page. According to Search Engine Land SEO coverage, informational content that internally links to transactional pages produces 2 to 4 times higher organic revenue than isolated content silos.
Wrapping up content marketing for food brands
Content marketing for food brands is the organic engine that turns a DTC snack, drink, or CPG storefront into a search-driven revenue channel. Recipe hub of 40 to 100 recipes. Ingredient comparison guides at 12 to 24 pieces. Sourcing story pages at 6 to 12 pieces. Buyer intent content at 8 to 16 pieces. Creator syndication calendar with 12 to 30 creators per quarter. Refresh cadence at 12 to 24 months by pillar. Reporting with organic sessions and organic revenue attribution.
If your DTC food brand is running paid social at 20,000 dollars monthly with a broken blog and zero recipe schema, professional content marketing for food brands pays for itself inside the first 90 days on organic traffic captured. Redefine Web ships content marketing inside our monthly retainer packages. Book a call and we will walk through the last three DTC food brands we built recipe hubs for, pillar by pillar.
Content marketing for food brands starts with a recipe hub because recipe queries account for 40 to 60 percent of high-intent search volume in the food category. Every hero SKU needs 4 to 12 recipes anchored to it, each targeting a specific occasion and audience.
Skip the recipe hub and the brand loses the search real estate that pulls DTC storefront traffic month over month at zero incremental paid cost. Recipe traffic converts at 2 to 4 percent because the shopper landed with usage intent, not passive discovery, which is why food brands win on recipes.
Recipe schema and Google rich result eligibility
Every recipe page ships schema.org Recipe markup including cookTime, prepTime, recipeIngredient, recipeInstructions, nutrition, and aggregateRating. Correctly marked-up recipes qualify for Google’s recipe rich result carousel that pulls 3 to 6 times higher click-through rate than a plain blue link. The schema layer takes 15 minutes per recipe to author and 30 minutes to validate in Google Search Console. Cross-reference the recipe search stack on our food and beverage SEO page.
Recipe hub structure that scales
The recipe hub structure runs 40 to 100 recipes at maturity, organized by hero SKU (4 to 12 recipes per SKU) plus occasion tags (breakfast, weeknight dinner, meal prep, brunch, holiday). Every recipe links back to the hero SKU product page with the SKU embedded in an inline card. The hub earns internal linking value from ingredient comparison guides and the sourcing story pages, which feeds recipe ranking on Google. According to Google Search Central recipe structured data guidance, complete Recipe schema markup is required for eligibility in the recipe carousel and the ingredient search filter.
Pillar structure for food brand content marketing
The pillar structure on content marketing for food brands runs 4 content pillars concurrently: recipe hub (40 to 100 recipes), ingredient comparison guides (12 to 24 guides), sourcing story pages (6 to 12 pages), and buyer intent content (where to buy, subscription vs. one-time, gift bundle guides). Every pillar covers a distinct search intent and every pillar links back to the hero SKU product pages.
Ingredient comparison guide format
Ingredient comparison guides run 1,800 to 3,200 words comparing 2 to 4 ingredient types on 6 to 10 attributes with a comparison table, real-world use case examples, and links to the hero SKU that uses the specific ingredient. Example: organic vs. conventional oats compares nutritional profile, sourcing chain, cost, environmental impact, and taste on a 6-column table. The brand’s SKU appears in the winning column with a product card. These guides rank 3 to 8 months after publication and pull steady-state organic traffic.
Sourcing story pages that build trust
Sourcing story pages name the specific farms, cooperatives, or suppliers the brand sources from, with photos of the farms, farmer quotes, and specific harvest windows. A coffee brand’s Ethiopian farm page ranks for “single-origin Ethiopian coffee” and “Yirgacheffe coffee origin” plus 40 long-tail variations. The sourcing page pulls trust-building traffic that converts at 4 to 6 percent because the shopper landed pattern-matching on transparency and named provenance. Every sourcing page includes farmer or cooperative quotes, harvest dates, and a link back to 3 to 5 hero SKU pages that source from the named supplier.
Vejrø hospitality content case study
Vejrø Resort, a Danish private-island destination with an on-site restaurant focused on organic, locally sourced cuisine, joined us with strong social engagement and no organic-search real estate. Guests found the resort on Instagram but never in Google search for terms like “private island resort Denmark,” “farm-to-table hospitality Denmark,” or “Vejrø restaurant.” The same organic-search gap shows up on DTC food brands running paid social at 20,000 dollars monthly with a broken blog and zero recipe schema.
We built the conversion-focused website with on-site and off-site SEO tuned to the travel-niche keyword clusters, competitor analysis against comparable boutique resorts, and mobile-first design prioritizing guest discovery. Every page carried the structured data qualifying it for Google’s rich results in the hospitality category. Every internal link pushed authority toward the direct-booking conversion path.
Three months later, Vejrø hit 10,000 plus organic visitors, ranked for 200 plus first-page keywords, and pulled a 2.2 percent booking conversion rate from organic traffic. The same pattern applies to content marketing for food brands: recipe schema, ingredient comparison guides, and sourcing story pages pull organic traffic at 20 to 40 percent conversion into hero SKU pages inside 6 months when the content quality matches search intent and every page carries the right structured data markup. Vejrø also proved out the reporting discipline: every monthly report named the exact page, the exact keyword cluster, and the exact search feature (rich result, sitelinks, image pack) driving the incremental organic revenue instead of hiding behind aggregate traffic charts.
Recipe cadence and content calendar for food brands
Recipe cadence on a working food brand content calendar ships 2 to 4 new recipes per week during the first 6 months and drops to 1 per week at maturity. Each recipe takes 4 to 6 hours to produce (write, test in the kitchen, photograph, schema author, publish). At 3 recipes per week, the brand hits 78 recipes inside 6 months plus a backlog of ingredient comparison and sourcing content queued behind the recipe production line.
| Content pillar | Target volume year 1 | Production cost per piece | Refresh cadence |
|---|---|---|---|
| Recipe hub | 40 to 100 recipes | $180 to $320 | Every 12 months |
| Ingredient comparison guides | 12 to 24 guides | $450 to $780 | Every 18 months |
| Sourcing story pages | 6 to 12 pages | $680 to $1,200 | Every 24 months |
| Buyer intent content | 8 to 16 pieces | $220 to $420 | Every 12 months |
Photography as a content calendar constraint
Photography is the actual constraint on recipe cadence, not writing. Every recipe needs 6 to 12 photos: hero shot, ingredient flat lay, prep in progress, plated result, storage, and step shots for the schema markup. A working food brand batches photography 8 recipes at a time to keep the cost per recipe under 200 dollars. Skip the batching and the per-recipe cost climbs to 400 to 600 dollars, which caps recipe cadence at 1 per week and slows organic ranking timeline by 6 months.
Seasonal content calendar planning
Seasonal content calendar planning maps recipes and comparison guides to the seasonal windows they need to rank in. A Christmas cookie recipe needs to publish in September to rank by early December. A Valentine’s chocolate guide needs to publish in November to rank by early February. A back-to-school lunchbox recipe needs to publish in June to rank by late August. The 60-to-90-day ranking curve dictates the calendar.
Creator syndication inside food brand content
Creator syndication on food brand content marketing amplifies the recipe hub through Instagram Reels, TikTok, and YouTube Shorts creators paid to post their own version of the brand’s hero recipes. The creator content pulls net-new audiences into the recipe hub through the creator’s Link in Bio or Amazon Storefront tag. The syndication calendar names 12 to 30 creators per quarter with specific recipes assigned to each.
One brand we picked up had a spreadsheet titled “creator outreach 2023” with 47 rows and 3 responses. All 3 responses were auto-replies. The spreadsheet named zero recipes and offered flat rates below 100 dollars per post. Nobody posts a 30-second video for 87 dollars flat. Nobody.
Creator content commercial terms that work
Working creator content commercial terms run 350 to 1,500 dollars flat per post plus a 12 to 25 percent commission on tagged sales across a 30-day window. The commission mechanic pulls creators into follow-up posts because the incremental revenue continues past the initial fee. Mid-tier creators (30k to 150k followers) hit the sweet spot for food brand content because their engagement rate typically runs 4 to 8 percent versus 0.8 to 1.6 percent on mega-creators.
Content brief structure for creator partnerships
The content brief structure for creator partnerships runs a single page: the SKU, the specific recipe or usage occasion, 3 required brand mentions, 3 restricted claims (no health claims on non-medical SKUs), the pricing angle, the affiliate link, and 3 example videos that hit the tone. The brief avoids over-scripting because over-scripted creator content underperforms native creator voice by 40 to 60 percent on engagement rate.
Buyer intent content for food brand blogs
Buyer intent content on food brand blogs covers 8 to 16 pieces targeting explicit purchase-decision queries: “where to buy [brand],” “[brand] subscription vs. one-time,” “best [category] for [use case],” and “[brand] gift bundle.” Every buyer intent piece runs 1,400 to 2,400 words with a comparison table, product cards, and a clear conversion path to the specific SKU that matches the query intent. Buyer intent content converts at 3 to 6 percent versus 1 to 2 percent on recipe content because the shopper landed already planning to buy, not exploring a usage occasion.
Where-to-buy content structure
Where-to-buy content structure covers online (DTC storefront, Amazon, Target.com, Whole Foods online), retail (specific chain locators with the store finder embedded), and international (customs limitations, retailer partners abroad). Every piece names specific retailers, links to the store locator, and includes an FAQ block covering shipping availability, subscription options, and gift card compatibility. Where-to-buy content ranks for branded discovery queries the DTC storefront otherwise loses to competitor affiliate reviews.
Subscription versus one-time comparison content
Subscription versus one-time comparison content converts subscription commitments at 3 to 6 percent because it addresses the price-sensitivity concern head-on with a specific math table. The piece covers the discount structure (15 percent lifetime), the skip-a-month mechanic, the pause-anytime rule, the cancellation policy, and the specific yearly savings for the brand’s average consumption cadence. Cross-reference the retention structure on our food and beverage marketing retainer page.
Content refresh cadence on food brand pillars
Content refresh cadence on food brand content pillars runs a rolling audit every 12 to 24 months by pillar. Recipes get refreshed every 12 months with new photography, updated schema, and any nutrition or ingredient adjustments. Ingredient comparison guides refresh every 18 months to update market data. Sourcing story pages refresh every 24 months to reflect farm partnership changes and new harvest angles. Buyer intent content refreshes every 12 months to update retailer availability and pricing.
Recipe refresh priority order
Recipe refresh priority runs by organic traffic rank. The top 20 recipes by monthly organic sessions get refreshed first (new photography, schema audit, related recipe internal links, updated nutrition). The next 40 get refreshed at 15 months. The remaining recipes get refreshed opportunistically when the ranking slips past position 15 in Google. Skipping the refresh cadence lets recipe rankings drift out of the top 3 inside 18 months as newer competitor recipes take the position.
Schema audit checklist per refresh
The schema audit checklist per refresh runs 8 items: Recipe schema completeness, aggregateRating count and accuracy, nutrition data accuracy, prepTime and cookTime match the recipe body, image URLs valid at CDN, related recipe internal links working, product card SKU URL live, and Google Search Console rich result eligibility validated. This checklist takes 20 minutes per recipe and prevents the schema drift that costs recipe rankings 20 to 40 positions quietly.
Reporting cadence for food brand content marketing
Reporting cadence on food brand content marketing runs a monthly executive report plus a quarterly business review. The monthly report ships in the first business week and covers organic sessions by pillar, top 10 ranking recipes with position trend, ingredient guide ranking movements, sourcing page performance, and organic-attributed DTC revenue. Every number carries a comparison to the prior month and a plain-language interpretation the founder reads in 7 minutes.
Metrics that matter for content marketing
Metrics that matter for food brand content marketing: organic sessions by pillar, recipe rich result impressions in Search Console, organic conversion rate to hero SKU pages, organic-attributed DTC revenue, and top 20 ranking positions by monthly organic sessions. Vanity metrics that do not matter: total pageviews without conversion context, average time on page without conversion attribution, and social share counts. The monthly report skips the vanity block entirely.
Quarterly business review structure
The quarterly business review runs 90 minutes with the founder, head of content, and SEO lead. Agenda: organic traffic trend by pillar, top 10 winning content pieces, top 10 losing content pieces (candidates for refresh or removal), competitive gap analysis against 5 named competitor brands, and next quarter’s content calendar with recipes and ingredient guides queued. According to Ahrefs content marketing research, brands running quarterly content audits outperform brands running annual audits by 40 to 70 percent on organic revenue over a 24-month window.
Internal linking discipline across food brand content
Internal linking discipline across food brand content moves authority from recipe pages toward hero SKU product pages and comparison guides. Every recipe links to the hero SKU it uses inline (once in the ingredient list, once in a bottom call-out card). Every ingredient comparison guide links to 3 to 6 recipes using the winning ingredient plus the hero SKU product page. Every sourcing story links to the 2 to 4 SKUs sourced from that specific farm or cooperative.
Anchor text strategy across recipe hubs
Anchor text on internal links varies across recipe hubs to avoid over-optimization patterns Google penalizes. Exact-match anchor (“single-origin Ethiopian coffee”) runs on 20 to 30 percent of internal links. Partial-match variations (“our Ethiopian roast”) run on 30 to 40 percent. Branded anchors (the SKU name) run on 20 to 30 percent. Generic anchors (“shop the coffee”) fill the remaining 10 to 20 percent. This ratio holds ranking without triggering the over-optimization penalty that shows up on brands that anchor-text-stuff every internal link with the same exact-match keyword. Cross-reference the linking layer on our food and beverage web design page.
Link equity from ingredient guides to SKU pages
Link equity from ingredient guides passes to SKU pages when the guide’s comparison table names the hero SKU in the winning column with a product card, and when the guide’s body links to 3 to 6 recipes that use the winning ingredient. This 3-hop path (guide to recipe to SKU) pushes authority from a high-traffic informational query down to a high-intent transactional page. According to Search Engine Land SEO coverage, informational content that internally links to transactional pages produces 2 to 4 times higher organic revenue than isolated content silos.
Wrapping up content marketing for food brands
Content marketing for food brands is the organic engine that turns a DTC snack, drink, or CPG storefront into a search-driven revenue channel. Recipe hub of 40 to 100 recipes. Ingredient comparison guides at 12 to 24 pieces. Sourcing story pages at 6 to 12 pieces. Buyer intent content at 8 to 16 pieces. Creator syndication calendar with 12 to 30 creators per quarter. Refresh cadence at 12 to 24 months by pillar. Reporting with organic sessions and organic revenue attribution.
If your DTC food brand is running paid social at 20,000 dollars monthly with a broken blog and zero recipe schema, professional content marketing for food brands pays for itself inside the first 90 days on organic traffic captured. Redefine Web ships content marketing inside our monthly retainer packages. Book a call and we will walk through the last three DTC food brands we built recipe hubs for, pillar by pillar.
Internal linking discipline across food brand content moves authority from recipe pages toward hero SKU product pages and comparison guides. Every recipe links to the hero SKU it uses inline (once in the ingredient list, once in a bottom call-out card). Every ingredient comparison guide links to 3 to 6 recipes using the winning ingredient plus the hero SKU product page. Every sourcing story links to the 2 to 4 SKUs sourced from that specific farm or cooperative.
Anchor text strategy across recipe hubs
Anchor text on internal links varies across recipe hubs to avoid over-optimization patterns Google penalizes. Exact-match anchor (“single-origin Ethiopian coffee”) runs on 20 to 30 percent of internal links. Partial-match variations (“our Ethiopian roast”) run on 30 to 40 percent. Branded anchors (the SKU name) run on 20 to 30 percent. Generic anchors (“shop the coffee”) fill the remaining 10 to 20 percent. This ratio holds ranking without triggering the over-optimization penalty that shows up on brands that anchor-text-stuff every internal link with the same exact-match keyword. Cross-reference the linking layer on our food and beverage web design page.
Link equity from ingredient guides to SKU pages
Link equity from ingredient guides passes to SKU pages when the guide’s comparison table names the hero SKU in the winning column with a product card, and when the guide’s body links to 3 to 6 recipes that use the winning ingredient. This 3-hop path (guide to recipe to SKU) pushes authority from a high-traffic informational query down to a high-intent transactional page. According to Search Engine Land SEO coverage, informational content that internally links to transactional pages produces 2 to 4 times higher organic revenue than isolated content silos.
Wrapping up content marketing for food brands
Content marketing for food brands is the organic engine that turns a DTC snack, drink, or CPG storefront into a search-driven revenue channel. Recipe hub of 40 to 100 recipes. Ingredient comparison guides at 12 to 24 pieces. Sourcing story pages at 6 to 12 pieces. Buyer intent content at 8 to 16 pieces. Creator syndication calendar with 12 to 30 creators per quarter. Refresh cadence at 12 to 24 months by pillar. Reporting with organic sessions and organic revenue attribution.
If your DTC food brand is running paid social at 20,000 dollars monthly with a broken blog and zero recipe schema, professional content marketing for food brands pays for itself inside the first 90 days on organic traffic captured. Redefine Web ships content marketing inside our monthly retainer packages. Book a call and we will walk through the last three DTC food brands we built recipe hubs for, pillar by pillar.
Content marketing for food brands starts with a recipe hub because recipe queries account for 40 to 60 percent of high-intent search volume in the food category. Every hero SKU needs 4 to 12 recipes anchored to it, each targeting a specific occasion and audience.
Skip the recipe hub and the brand loses the search real estate that pulls DTC storefront traffic month over month at zero incremental paid cost. Recipe traffic converts at 2 to 4 percent because the shopper landed with usage intent, not passive discovery, which is why food brands win on recipes.
Recipe schema and Google rich result eligibility
Every recipe page ships schema.org Recipe markup including cookTime, prepTime, recipeIngredient, recipeInstructions, nutrition, and aggregateRating. Correctly marked-up recipes qualify for Google’s recipe rich result carousel that pulls 3 to 6 times higher click-through rate than a plain blue link. The schema layer takes 15 minutes per recipe to author and 30 minutes to validate in Google Search Console. Cross-reference the recipe search stack on our food and beverage SEO page.
Recipe hub structure that scales
The recipe hub structure runs 40 to 100 recipes at maturity, organized by hero SKU (4 to 12 recipes per SKU) plus occasion tags (breakfast, weeknight dinner, meal prep, brunch, holiday). Every recipe links back to the hero SKU product page with the SKU embedded in an inline card. The hub earns internal linking value from ingredient comparison guides and the sourcing story pages, which feeds recipe ranking on Google. According to Google Search Central recipe structured data guidance, complete Recipe schema markup is required for eligibility in the recipe carousel and the ingredient search filter.
Pillar structure for food brand content marketing
The pillar structure on content marketing for food brands runs 4 content pillars concurrently: recipe hub (40 to 100 recipes), ingredient comparison guides (12 to 24 guides), sourcing story pages (6 to 12 pages), and buyer intent content (where to buy, subscription vs. one-time, gift bundle guides). Every pillar covers a distinct search intent and every pillar links back to the hero SKU product pages.
Ingredient comparison guide format
Ingredient comparison guides run 1,800 to 3,200 words comparing 2 to 4 ingredient types on 6 to 10 attributes with a comparison table, real-world use case examples, and links to the hero SKU that uses the specific ingredient. Example: organic vs. conventional oats compares nutritional profile, sourcing chain, cost, environmental impact, and taste on a 6-column table. The brand’s SKU appears in the winning column with a product card. These guides rank 3 to 8 months after publication and pull steady-state organic traffic.
Sourcing story pages that build trust
Sourcing story pages name the specific farms, cooperatives, or suppliers the brand sources from, with photos of the farms, farmer quotes, and specific harvest windows. A coffee brand’s Ethiopian farm page ranks for “single-origin Ethiopian coffee” and “Yirgacheffe coffee origin” plus 40 long-tail variations. The sourcing page pulls trust-building traffic that converts at 4 to 6 percent because the shopper landed pattern-matching on transparency and named provenance. Every sourcing page includes farmer or cooperative quotes, harvest dates, and a link back to 3 to 5 hero SKU pages that source from the named supplier.
Vejrø hospitality content case study
Vejrø Resort, a Danish private-island destination with an on-site restaurant focused on organic, locally sourced cuisine, joined us with strong social engagement and no organic-search real estate. Guests found the resort on Instagram but never in Google search for terms like “private island resort Denmark,” “farm-to-table hospitality Denmark,” or “Vejrø restaurant.” The same organic-search gap shows up on DTC food brands running paid social at 20,000 dollars monthly with a broken blog and zero recipe schema.
We built the conversion-focused website with on-site and off-site SEO tuned to the travel-niche keyword clusters, competitor analysis against comparable boutique resorts, and mobile-first design prioritizing guest discovery. Every page carried the structured data qualifying it for Google’s rich results in the hospitality category. Every internal link pushed authority toward the direct-booking conversion path.
Three months later, Vejrø hit 10,000 plus organic visitors, ranked for 200 plus first-page keywords, and pulled a 2.2 percent booking conversion rate from organic traffic. The same pattern applies to content marketing for food brands: recipe schema, ingredient comparison guides, and sourcing story pages pull organic traffic at 20 to 40 percent conversion into hero SKU pages inside 6 months when the content quality matches search intent and every page carries the right structured data markup. Vejrø also proved out the reporting discipline: every monthly report named the exact page, the exact keyword cluster, and the exact search feature (rich result, sitelinks, image pack) driving the incremental organic revenue instead of hiding behind aggregate traffic charts.
Recipe cadence and content calendar for food brands
Recipe cadence on a working food brand content calendar ships 2 to 4 new recipes per week during the first 6 months and drops to 1 per week at maturity. Each recipe takes 4 to 6 hours to produce (write, test in the kitchen, photograph, schema author, publish). At 3 recipes per week, the brand hits 78 recipes inside 6 months plus a backlog of ingredient comparison and sourcing content queued behind the recipe production line.
| Content pillar | Target volume year 1 | Production cost per piece | Refresh cadence |
|---|---|---|---|
| Recipe hub | 40 to 100 recipes | $180 to $320 | Every 12 months |
| Ingredient comparison guides | 12 to 24 guides | $450 to $780 | Every 18 months |
| Sourcing story pages | 6 to 12 pages | $680 to $1,200 | Every 24 months |
| Buyer intent content | 8 to 16 pieces | $220 to $420 | Every 12 months |
Photography as a content calendar constraint
Photography is the actual constraint on recipe cadence, not writing. Every recipe needs 6 to 12 photos: hero shot, ingredient flat lay, prep in progress, plated result, storage, and step shots for the schema markup. A working food brand batches photography 8 recipes at a time to keep the cost per recipe under 200 dollars. Skip the batching and the per-recipe cost climbs to 400 to 600 dollars, which caps recipe cadence at 1 per week and slows organic ranking timeline by 6 months.
Seasonal content calendar planning
Seasonal content calendar planning maps recipes and comparison guides to the seasonal windows they need to rank in. A Christmas cookie recipe needs to publish in September to rank by early December. A Valentine’s chocolate guide needs to publish in November to rank by early February. A back-to-school lunchbox recipe needs to publish in June to rank by late August. The 60-to-90-day ranking curve dictates the calendar.
Creator syndication inside food brand content
Creator syndication on food brand content marketing amplifies the recipe hub through Instagram Reels, TikTok, and YouTube Shorts creators paid to post their own version of the brand’s hero recipes. The creator content pulls net-new audiences into the recipe hub through the creator’s Link in Bio or Amazon Storefront tag. The syndication calendar names 12 to 30 creators per quarter with specific recipes assigned to each.
One brand we picked up had a spreadsheet titled “creator outreach 2023” with 47 rows and 3 responses. All 3 responses were auto-replies. The spreadsheet named zero recipes and offered flat rates below 100 dollars per post. Nobody posts a 30-second video for 87 dollars flat. Nobody.
Creator content commercial terms that work
Working creator content commercial terms run 350 to 1,500 dollars flat per post plus a 12 to 25 percent commission on tagged sales across a 30-day window. The commission mechanic pulls creators into follow-up posts because the incremental revenue continues past the initial fee. Mid-tier creators (30k to 150k followers) hit the sweet spot for food brand content because their engagement rate typically runs 4 to 8 percent versus 0.8 to 1.6 percent on mega-creators.
Content brief structure for creator partnerships
The content brief structure for creator partnerships runs a single page: the SKU, the specific recipe or usage occasion, 3 required brand mentions, 3 restricted claims (no health claims on non-medical SKUs), the pricing angle, the affiliate link, and 3 example videos that hit the tone. The brief avoids over-scripting because over-scripted creator content underperforms native creator voice by 40 to 60 percent on engagement rate.
Buyer intent content for food brand blogs
Buyer intent content on food brand blogs covers 8 to 16 pieces targeting explicit purchase-decision queries: “where to buy [brand],” “[brand] subscription vs. one-time,” “best [category] for [use case],” and “[brand] gift bundle.” Every buyer intent piece runs 1,400 to 2,400 words with a comparison table, product cards, and a clear conversion path to the specific SKU that matches the query intent. Buyer intent content converts at 3 to 6 percent versus 1 to 2 percent on recipe content because the shopper landed already planning to buy, not exploring a usage occasion.
Where-to-buy content structure
Where-to-buy content structure covers online (DTC storefront, Amazon, Target.com, Whole Foods online), retail (specific chain locators with the store finder embedded), and international (customs limitations, retailer partners abroad). Every piece names specific retailers, links to the store locator, and includes an FAQ block covering shipping availability, subscription options, and gift card compatibility. Where-to-buy content ranks for branded discovery queries the DTC storefront otherwise loses to competitor affiliate reviews.
Subscription versus one-time comparison content
Subscription versus one-time comparison content converts subscription commitments at 3 to 6 percent because it addresses the price-sensitivity concern head-on with a specific math table. The piece covers the discount structure (15 percent lifetime), the skip-a-month mechanic, the pause-anytime rule, the cancellation policy, and the specific yearly savings for the brand’s average consumption cadence. Cross-reference the retention structure on our food and beverage marketing retainer page.
Content refresh cadence on food brand pillars
Content refresh cadence on food brand content pillars runs a rolling audit every 12 to 24 months by pillar. Recipes get refreshed every 12 months with new photography, updated schema, and any nutrition or ingredient adjustments. Ingredient comparison guides refresh every 18 months to update market data. Sourcing story pages refresh every 24 months to reflect farm partnership changes and new harvest angles. Buyer intent content refreshes every 12 months to update retailer availability and pricing.
Recipe refresh priority order
Recipe refresh priority runs by organic traffic rank. The top 20 recipes by monthly organic sessions get refreshed first (new photography, schema audit, related recipe internal links, updated nutrition). The next 40 get refreshed at 15 months. The remaining recipes get refreshed opportunistically when the ranking slips past position 15 in Google. Skipping the refresh cadence lets recipe rankings drift out of the top 3 inside 18 months as newer competitor recipes take the position.
Schema audit checklist per refresh
The schema audit checklist per refresh runs 8 items: Recipe schema completeness, aggregateRating count and accuracy, nutrition data accuracy, prepTime and cookTime match the recipe body, image URLs valid at CDN, related recipe internal links working, product card SKU URL live, and Google Search Console rich result eligibility validated. This checklist takes 20 minutes per recipe and prevents the schema drift that costs recipe rankings 20 to 40 positions quietly.
Reporting cadence for food brand content marketing
Reporting cadence on food brand content marketing runs a monthly executive report plus a quarterly business review. The monthly report ships in the first business week and covers organic sessions by pillar, top 10 ranking recipes with position trend, ingredient guide ranking movements, sourcing page performance, and organic-attributed DTC revenue. Every number carries a comparison to the prior month and a plain-language interpretation the founder reads in 7 minutes.
Metrics that matter for content marketing
Metrics that matter for food brand content marketing: organic sessions by pillar, recipe rich result impressions in Search Console, organic conversion rate to hero SKU pages, organic-attributed DTC revenue, and top 20 ranking positions by monthly organic sessions. Vanity metrics that do not matter: total pageviews without conversion context, average time on page without conversion attribution, and social share counts. The monthly report skips the vanity block entirely.
Quarterly business review structure
The quarterly business review runs 90 minutes with the founder, head of content, and SEO lead. Agenda: organic traffic trend by pillar, top 10 winning content pieces, top 10 losing content pieces (candidates for refresh or removal), competitive gap analysis against 5 named competitor brands, and next quarter’s content calendar with recipes and ingredient guides queued. According to Ahrefs content marketing research, brands running quarterly content audits outperform brands running annual audits by 40 to 70 percent on organic revenue over a 24-month window.
Internal linking discipline across food brand content
Internal linking discipline across food brand content moves authority from recipe pages toward hero SKU product pages and comparison guides. Every recipe links to the hero SKU it uses inline (once in the ingredient list, once in a bottom call-out card). Every ingredient comparison guide links to 3 to 6 recipes using the winning ingredient plus the hero SKU product page. Every sourcing story links to the 2 to 4 SKUs sourced from that specific farm or cooperative.
Anchor text strategy across recipe hubs
Anchor text on internal links varies across recipe hubs to avoid over-optimization patterns Google penalizes. Exact-match anchor (“single-origin Ethiopian coffee”) runs on 20 to 30 percent of internal links. Partial-match variations (“our Ethiopian roast”) run on 30 to 40 percent. Branded anchors (the SKU name) run on 20 to 30 percent. Generic anchors (“shop the coffee”) fill the remaining 10 to 20 percent. This ratio holds ranking without triggering the over-optimization penalty that shows up on brands that anchor-text-stuff every internal link with the same exact-match keyword. Cross-reference the linking layer on our food and beverage web design page.
Link equity from ingredient guides to SKU pages
Link equity from ingredient guides passes to SKU pages when the guide’s comparison table names the hero SKU in the winning column with a product card, and when the guide’s body links to 3 to 6 recipes that use the winning ingredient. This 3-hop path (guide to recipe to SKU) pushes authority from a high-traffic informational query down to a high-intent transactional page. According to Search Engine Land SEO coverage, informational content that internally links to transactional pages produces 2 to 4 times higher organic revenue than isolated content silos.
Wrapping up content marketing for food brands
Content marketing for food brands is the organic engine that turns a DTC snack, drink, or CPG storefront into a search-driven revenue channel. Recipe hub of 40 to 100 recipes. Ingredient comparison guides at 12 to 24 pieces. Sourcing story pages at 6 to 12 pieces. Buyer intent content at 8 to 16 pieces. Creator syndication calendar with 12 to 30 creators per quarter. Refresh cadence at 12 to 24 months by pillar. Reporting with organic sessions and organic revenue attribution.
If your DTC food brand is running paid social at 20,000 dollars monthly with a broken blog and zero recipe schema, professional content marketing for food brands pays for itself inside the first 90 days on organic traffic captured. Redefine Web ships content marketing inside our monthly retainer packages. Book a call and we will walk through the last three DTC food brands we built recipe hubs for, pillar by pillar.
Content marketing for food brands starts with a recipe hub because recipe queries account for 40 to 60 percent of high-intent search volume in the food category. Every hero SKU needs 4 to 12 recipes anchored to it, each targeting a specific occasion and audience.
Skip the recipe hub and the brand loses the search real estate that pulls DTC storefront traffic month over month at zero incremental paid cost. Recipe traffic converts at 2 to 4 percent because the shopper landed with usage intent, not passive discovery, which is why food brands win on recipes.
Recipe schema and Google rich result eligibility
Every recipe page ships schema.org Recipe markup including cookTime, prepTime, recipeIngredient, recipeInstructions, nutrition, and aggregateRating. Correctly marked-up recipes qualify for Google’s recipe rich result carousel that pulls 3 to 6 times higher click-through rate than a plain blue link. The schema layer takes 15 minutes per recipe to author and 30 minutes to validate in Google Search Console. Cross-reference the recipe search stack on our food and beverage SEO page.
Recipe hub structure that scales
The recipe hub structure runs 40 to 100 recipes at maturity, organized by hero SKU (4 to 12 recipes per SKU) plus occasion tags (breakfast, weeknight dinner, meal prep, brunch, holiday). Every recipe links back to the hero SKU product page with the SKU embedded in an inline card. The hub earns internal linking value from ingredient comparison guides and the sourcing story pages, which feeds recipe ranking on Google. According to Google Search Central recipe structured data guidance, complete Recipe schema markup is required for eligibility in the recipe carousel and the ingredient search filter.
Pillar structure for food brand content marketing
The pillar structure on content marketing for food brands runs 4 content pillars concurrently: recipe hub (40 to 100 recipes), ingredient comparison guides (12 to 24 guides), sourcing story pages (6 to 12 pages), and buyer intent content (where to buy, subscription vs. one-time, gift bundle guides). Every pillar covers a distinct search intent and every pillar links back to the hero SKU product pages.
Ingredient comparison guide format
Ingredient comparison guides run 1,800 to 3,200 words comparing 2 to 4 ingredient types on 6 to 10 attributes with a comparison table, real-world use case examples, and links to the hero SKU that uses the specific ingredient. Example: organic vs. conventional oats compares nutritional profile, sourcing chain, cost, environmental impact, and taste on a 6-column table. The brand’s SKU appears in the winning column with a product card. These guides rank 3 to 8 months after publication and pull steady-state organic traffic.
Sourcing story pages that build trust
Sourcing story pages name the specific farms, cooperatives, or suppliers the brand sources from, with photos of the farms, farmer quotes, and specific harvest windows. A coffee brand’s Ethiopian farm page ranks for “single-origin Ethiopian coffee” and “Yirgacheffe coffee origin” plus 40 long-tail variations. The sourcing page pulls trust-building traffic that converts at 4 to 6 percent because the shopper landed pattern-matching on transparency and named provenance. Every sourcing page includes farmer or cooperative quotes, harvest dates, and a link back to 3 to 5 hero SKU pages that source from the named supplier.
Vejrø hospitality content case study
Vejrø Resort, a Danish private-island destination with an on-site restaurant focused on organic, locally sourced cuisine, joined us with strong social engagement and no organic-search real estate. Guests found the resort on Instagram but never in Google search for terms like “private island resort Denmark,” “farm-to-table hospitality Denmark,” or “Vejrø restaurant.” The same organic-search gap shows up on DTC food brands running paid social at 20,000 dollars monthly with a broken blog and zero recipe schema.
We built the conversion-focused website with on-site and off-site SEO tuned to the travel-niche keyword clusters, competitor analysis against comparable boutique resorts, and mobile-first design prioritizing guest discovery. Every page carried the structured data qualifying it for Google’s rich results in the hospitality category. Every internal link pushed authority toward the direct-booking conversion path.
Three months later, Vejrø hit 10,000 plus organic visitors, ranked for 200 plus first-page keywords, and pulled a 2.2 percent booking conversion rate from organic traffic. The same pattern applies to content marketing for food brands: recipe schema, ingredient comparison guides, and sourcing story pages pull organic traffic at 20 to 40 percent conversion into hero SKU pages inside 6 months when the content quality matches search intent and every page carries the right structured data markup. Vejrø also proved out the reporting discipline: every monthly report named the exact page, the exact keyword cluster, and the exact search feature (rich result, sitelinks, image pack) driving the incremental organic revenue instead of hiding behind aggregate traffic charts.
Recipe cadence and content calendar for food brands
Recipe cadence on a working food brand content calendar ships 2 to 4 new recipes per week during the first 6 months and drops to 1 per week at maturity. Each recipe takes 4 to 6 hours to produce (write, test in the kitchen, photograph, schema author, publish). At 3 recipes per week, the brand hits 78 recipes inside 6 months plus a backlog of ingredient comparison and sourcing content queued behind the recipe production line.
| Content pillar | Target volume year 1 | Production cost per piece | Refresh cadence |
|---|---|---|---|
| Recipe hub | 40 to 100 recipes | $180 to $320 | Every 12 months |
| Ingredient comparison guides | 12 to 24 guides | $450 to $780 | Every 18 months |
| Sourcing story pages | 6 to 12 pages | $680 to $1,200 | Every 24 months |
| Buyer intent content | 8 to 16 pieces | $220 to $420 | Every 12 months |
Photography as a content calendar constraint
Photography is the actual constraint on recipe cadence, not writing. Every recipe needs 6 to 12 photos: hero shot, ingredient flat lay, prep in progress, plated result, storage, and step shots for the schema markup. A working food brand batches photography 8 recipes at a time to keep the cost per recipe under 200 dollars. Skip the batching and the per-recipe cost climbs to 400 to 600 dollars, which caps recipe cadence at 1 per week and slows organic ranking timeline by 6 months.
Seasonal content calendar planning
Seasonal content calendar planning maps recipes and comparison guides to the seasonal windows they need to rank in. A Christmas cookie recipe needs to publish in September to rank by early December. A Valentine’s chocolate guide needs to publish in November to rank by early February. A back-to-school lunchbox recipe needs to publish in June to rank by late August. The 60-to-90-day ranking curve dictates the calendar.
Creator syndication inside food brand content
Creator syndication on food brand content marketing amplifies the recipe hub through Instagram Reels, TikTok, and YouTube Shorts creators paid to post their own version of the brand’s hero recipes. The creator content pulls net-new audiences into the recipe hub through the creator’s Link in Bio or Amazon Storefront tag. The syndication calendar names 12 to 30 creators per quarter with specific recipes assigned to each.
One brand we picked up had a spreadsheet titled “creator outreach 2023” with 47 rows and 3 responses. All 3 responses were auto-replies. The spreadsheet named zero recipes and offered flat rates below 100 dollars per post. Nobody posts a 30-second video for 87 dollars flat. Nobody.
Creator content commercial terms that work
Working creator content commercial terms run 350 to 1,500 dollars flat per post plus a 12 to 25 percent commission on tagged sales across a 30-day window. The commission mechanic pulls creators into follow-up posts because the incremental revenue continues past the initial fee. Mid-tier creators (30k to 150k followers) hit the sweet spot for food brand content because their engagement rate typically runs 4 to 8 percent versus 0.8 to 1.6 percent on mega-creators.
Content brief structure for creator partnerships
The content brief structure for creator partnerships runs a single page: the SKU, the specific recipe or usage occasion, 3 required brand mentions, 3 restricted claims (no health claims on non-medical SKUs), the pricing angle, the affiliate link, and 3 example videos that hit the tone. The brief avoids over-scripting because over-scripted creator content underperforms native creator voice by 40 to 60 percent on engagement rate.
Buyer intent content for food brand blogs
Buyer intent content on food brand blogs covers 8 to 16 pieces targeting explicit purchase-decision queries: “where to buy [brand],” “[brand] subscription vs. one-time,” “best [category] for [use case],” and “[brand] gift bundle.” Every buyer intent piece runs 1,400 to 2,400 words with a comparison table, product cards, and a clear conversion path to the specific SKU that matches the query intent. Buyer intent content converts at 3 to 6 percent versus 1 to 2 percent on recipe content because the shopper landed already planning to buy, not exploring a usage occasion.
Where-to-buy content structure
Where-to-buy content structure covers online (DTC storefront, Amazon, Target.com, Whole Foods online), retail (specific chain locators with the store finder embedded), and international (customs limitations, retailer partners abroad). Every piece names specific retailers, links to the store locator, and includes an FAQ block covering shipping availability, subscription options, and gift card compatibility. Where-to-buy content ranks for branded discovery queries the DTC storefront otherwise loses to competitor affiliate reviews.
Subscription versus one-time comparison content
Subscription versus one-time comparison content converts subscription commitments at 3 to 6 percent because it addresses the price-sensitivity concern head-on with a specific math table. The piece covers the discount structure (15 percent lifetime), the skip-a-month mechanic, the pause-anytime rule, the cancellation policy, and the specific yearly savings for the brand’s average consumption cadence. Cross-reference the retention structure on our food and beverage marketing retainer page.
Content refresh cadence on food brand pillars
Content refresh cadence on food brand content pillars runs a rolling audit every 12 to 24 months by pillar. Recipes get refreshed every 12 months with new photography, updated schema, and any nutrition or ingredient adjustments. Ingredient comparison guides refresh every 18 months to update market data. Sourcing story pages refresh every 24 months to reflect farm partnership changes and new harvest angles. Buyer intent content refreshes every 12 months to update retailer availability and pricing.
Recipe refresh priority order
Recipe refresh priority runs by organic traffic rank. The top 20 recipes by monthly organic sessions get refreshed first (new photography, schema audit, related recipe internal links, updated nutrition). The next 40 get refreshed at 15 months. The remaining recipes get refreshed opportunistically when the ranking slips past position 15 in Google. Skipping the refresh cadence lets recipe rankings drift out of the top 3 inside 18 months as newer competitor recipes take the position.
Schema audit checklist per refresh
The schema audit checklist per refresh runs 8 items: Recipe schema completeness, aggregateRating count and accuracy, nutrition data accuracy, prepTime and cookTime match the recipe body, image URLs valid at CDN, related recipe internal links working, product card SKU URL live, and Google Search Console rich result eligibility validated. This checklist takes 20 minutes per recipe and prevents the schema drift that costs recipe rankings 20 to 40 positions quietly.
Reporting cadence for food brand content marketing
Reporting cadence on food brand content marketing runs a monthly executive report plus a quarterly business review. The monthly report ships in the first business week and covers organic sessions by pillar, top 10 ranking recipes with position trend, ingredient guide ranking movements, sourcing page performance, and organic-attributed DTC revenue. Every number carries a comparison to the prior month and a plain-language interpretation the founder reads in 7 minutes.
Metrics that matter for content marketing
Metrics that matter for food brand content marketing: organic sessions by pillar, recipe rich result impressions in Search Console, organic conversion rate to hero SKU pages, organic-attributed DTC revenue, and top 20 ranking positions by monthly organic sessions. Vanity metrics that do not matter: total pageviews without conversion context, average time on page without conversion attribution, and social share counts. The monthly report skips the vanity block entirely.
Quarterly business review structure
The quarterly business review runs 90 minutes with the founder, head of content, and SEO lead. Agenda: organic traffic trend by pillar, top 10 winning content pieces, top 10 losing content pieces (candidates for refresh or removal), competitive gap analysis against 5 named competitor brands, and next quarter’s content calendar with recipes and ingredient guides queued. According to Ahrefs content marketing research, brands running quarterly content audits outperform brands running annual audits by 40 to 70 percent on organic revenue over a 24-month window.
Internal linking discipline across food brand content
Internal linking discipline across food brand content moves authority from recipe pages toward hero SKU product pages and comparison guides. Every recipe links to the hero SKU it uses inline (once in the ingredient list, once in a bottom call-out card). Every ingredient comparison guide links to 3 to 6 recipes using the winning ingredient plus the hero SKU product page. Every sourcing story links to the 2 to 4 SKUs sourced from that specific farm or cooperative.
Anchor text strategy across recipe hubs
Anchor text on internal links varies across recipe hubs to avoid over-optimization patterns Google penalizes. Exact-match anchor (“single-origin Ethiopian coffee”) runs on 20 to 30 percent of internal links. Partial-match variations (“our Ethiopian roast”) run on 30 to 40 percent. Branded anchors (the SKU name) run on 20 to 30 percent. Generic anchors (“shop the coffee”) fill the remaining 10 to 20 percent. This ratio holds ranking without triggering the over-optimization penalty that shows up on brands that anchor-text-stuff every internal link with the same exact-match keyword. Cross-reference the linking layer on our food and beverage web design page.
Link equity from ingredient guides to SKU pages
Link equity from ingredient guides passes to SKU pages when the guide’s comparison table names the hero SKU in the winning column with a product card, and when the guide’s body links to 3 to 6 recipes that use the winning ingredient. This 3-hop path (guide to recipe to SKU) pushes authority from a high-traffic informational query down to a high-intent transactional page. According to Search Engine Land SEO coverage, informational content that internally links to transactional pages produces 2 to 4 times higher organic revenue than isolated content silos.
Wrapping up content marketing for food brands
Content marketing for food brands is the organic engine that turns a DTC snack, drink, or CPG storefront into a search-driven revenue channel. Recipe hub of 40 to 100 recipes. Ingredient comparison guides at 12 to 24 pieces. Sourcing story pages at 6 to 12 pieces. Buyer intent content at 8 to 16 pieces. Creator syndication calendar with 12 to 30 creators per quarter. Refresh cadence at 12 to 24 months by pillar. Reporting with organic sessions and organic revenue attribution.
If your DTC food brand is running paid social at 20,000 dollars monthly with a broken blog and zero recipe schema, professional content marketing for food brands pays for itself inside the first 90 days on organic traffic captured. Redefine Web ships content marketing inside our monthly retainer packages. Book a call and we will walk through the last three DTC food brands we built recipe hubs for, pillar by pillar.
Anchor text on internal links varies across recipe hubs to avoid over-optimization patterns Google penalizes. Exact-match anchor (“single-origin Ethiopian coffee”) runs on 20 to 30 percent of internal links. Partial-match variations (“our Ethiopian roast”) run on 30 to 40 percent. Branded anchors (the SKU name) run on 20 to 30 percent. Generic anchors (“shop the coffee”) fill the remaining 10 to 20 percent. This ratio holds ranking without triggering the over-optimization penalty that shows up on brands that anchor-text-stuff every internal link with the same exact-match keyword. Cross-reference the linking layer on our food and beverage web design page.
Link equity from ingredient guides to SKU pages
Link equity from ingredient guides passes to SKU pages when the guide’s comparison table names the hero SKU in the winning column with a product card, and when the guide’s body links to 3 to 6 recipes that use the winning ingredient. This 3-hop path (guide to recipe to SKU) pushes authority from a high-traffic informational query down to a high-intent transactional page. According to Search Engine Land SEO coverage, informational content that internally links to transactional pages produces 2 to 4 times higher organic revenue than isolated content silos.
Wrapping up content marketing for food brands
Content marketing for food brands is the organic engine that turns a DTC snack, drink, or CPG storefront into a search-driven revenue channel. Recipe hub of 40 to 100 recipes. Ingredient comparison guides at 12 to 24 pieces. Sourcing story pages at 6 to 12 pieces. Buyer intent content at 8 to 16 pieces. Creator syndication calendar with 12 to 30 creators per quarter. Refresh cadence at 12 to 24 months by pillar. Reporting with organic sessions and organic revenue attribution.
If your DTC food brand is running paid social at 20,000 dollars monthly with a broken blog and zero recipe schema, professional content marketing for food brands pays for itself inside the first 90 days on organic traffic captured. Redefine Web ships content marketing inside our monthly retainer packages. Book a call and we will walk through the last three DTC food brands we built recipe hubs for, pillar by pillar.
Internal linking discipline across food brand content moves authority from recipe pages toward hero SKU product pages and comparison guides. Every recipe links to the hero SKU it uses inline (once in the ingredient list, once in a bottom call-out card). Every ingredient comparison guide links to 3 to 6 recipes using the winning ingredient plus the hero SKU product page. Every sourcing story links to the 2 to 4 SKUs sourced from that specific farm or cooperative.
Anchor text strategy across recipe hubs
Anchor text on internal links varies across recipe hubs to avoid over-optimization patterns Google penalizes. Exact-match anchor (“single-origin Ethiopian coffee”) runs on 20 to 30 percent of internal links. Partial-match variations (“our Ethiopian roast”) run on 30 to 40 percent. Branded anchors (the SKU name) run on 20 to 30 percent. Generic anchors (“shop the coffee”) fill the remaining 10 to 20 percent. This ratio holds ranking without triggering the over-optimization penalty that shows up on brands that anchor-text-stuff every internal link with the same exact-match keyword. Cross-reference the linking layer on our food and beverage web design page.
Link equity from ingredient guides to SKU pages
Link equity from ingredient guides passes to SKU pages when the guide’s comparison table names the hero SKU in the winning column with a product card, and when the guide’s body links to 3 to 6 recipes that use the winning ingredient. This 3-hop path (guide to recipe to SKU) pushes authority from a high-traffic informational query down to a high-intent transactional page. According to Search Engine Land SEO coverage, informational content that internally links to transactional pages produces 2 to 4 times higher organic revenue than isolated content silos.
Wrapping up content marketing for food brands
Content marketing for food brands is the organic engine that turns a DTC snack, drink, or CPG storefront into a search-driven revenue channel. Recipe hub of 40 to 100 recipes. Ingredient comparison guides at 12 to 24 pieces. Sourcing story pages at 6 to 12 pieces. Buyer intent content at 8 to 16 pieces. Creator syndication calendar with 12 to 30 creators per quarter. Refresh cadence at 12 to 24 months by pillar. Reporting with organic sessions and organic revenue attribution.
If your DTC food brand is running paid social at 20,000 dollars monthly with a broken blog and zero recipe schema, professional content marketing for food brands pays for itself inside the first 90 days on organic traffic captured. Redefine Web ships content marketing inside our monthly retainer packages. Book a call and we will walk through the last three DTC food brands we built recipe hubs for, pillar by pillar.
Content marketing for food brands starts with a recipe hub because recipe queries account for 40 to 60 percent of high-intent search volume in the food category. Every hero SKU needs 4 to 12 recipes anchored to it, each targeting a specific occasion and audience.
Skip the recipe hub and the brand loses the search real estate that pulls DTC storefront traffic month over month at zero incremental paid cost. Recipe traffic converts at 2 to 4 percent because the shopper landed with usage intent, not passive discovery, which is why food brands win on recipes.
Recipe schema and Google rich result eligibility
Every recipe page ships schema.org Recipe markup including cookTime, prepTime, recipeIngredient, recipeInstructions, nutrition, and aggregateRating. Correctly marked-up recipes qualify for Google’s recipe rich result carousel that pulls 3 to 6 times higher click-through rate than a plain blue link. The schema layer takes 15 minutes per recipe to author and 30 minutes to validate in Google Search Console. Cross-reference the recipe search stack on our food and beverage SEO page.
Recipe hub structure that scales
The recipe hub structure runs 40 to 100 recipes at maturity, organized by hero SKU (4 to 12 recipes per SKU) plus occasion tags (breakfast, weeknight dinner, meal prep, brunch, holiday). Every recipe links back to the hero SKU product page with the SKU embedded in an inline card. The hub earns internal linking value from ingredient comparison guides and the sourcing story pages, which feeds recipe ranking on Google. According to Google Search Central recipe structured data guidance, complete Recipe schema markup is required for eligibility in the recipe carousel and the ingredient search filter.
Pillar structure for food brand content marketing
The pillar structure on content marketing for food brands runs 4 content pillars concurrently: recipe hub (40 to 100 recipes), ingredient comparison guides (12 to 24 guides), sourcing story pages (6 to 12 pages), and buyer intent content (where to buy, subscription vs. one-time, gift bundle guides). Every pillar covers a distinct search intent and every pillar links back to the hero SKU product pages.
Ingredient comparison guide format
Ingredient comparison guides run 1,800 to 3,200 words comparing 2 to 4 ingredient types on 6 to 10 attributes with a comparison table, real-world use case examples, and links to the hero SKU that uses the specific ingredient. Example: organic vs. conventional oats compares nutritional profile, sourcing chain, cost, environmental impact, and taste on a 6-column table. The brand’s SKU appears in the winning column with a product card. These guides rank 3 to 8 months after publication and pull steady-state organic traffic.
Sourcing story pages that build trust
Sourcing story pages name the specific farms, cooperatives, or suppliers the brand sources from, with photos of the farms, farmer quotes, and specific harvest windows. A coffee brand’s Ethiopian farm page ranks for “single-origin Ethiopian coffee” and “Yirgacheffe coffee origin” plus 40 long-tail variations. The sourcing page pulls trust-building traffic that converts at 4 to 6 percent because the shopper landed pattern-matching on transparency and named provenance. Every sourcing page includes farmer or cooperative quotes, harvest dates, and a link back to 3 to 5 hero SKU pages that source from the named supplier.
Vejrø hospitality content case study
Vejrø Resort, a Danish private-island destination with an on-site restaurant focused on organic, locally sourced cuisine, joined us with strong social engagement and no organic-search real estate. Guests found the resort on Instagram but never in Google search for terms like “private island resort Denmark,” “farm-to-table hospitality Denmark,” or “Vejrø restaurant.” The same organic-search gap shows up on DTC food brands running paid social at 20,000 dollars monthly with a broken blog and zero recipe schema.
We built the conversion-focused website with on-site and off-site SEO tuned to the travel-niche keyword clusters, competitor analysis against comparable boutique resorts, and mobile-first design prioritizing guest discovery. Every page carried the structured data qualifying it for Google’s rich results in the hospitality category. Every internal link pushed authority toward the direct-booking conversion path.
Three months later, Vejrø hit 10,000 plus organic visitors, ranked for 200 plus first-page keywords, and pulled a 2.2 percent booking conversion rate from organic traffic. The same pattern applies to content marketing for food brands: recipe schema, ingredient comparison guides, and sourcing story pages pull organic traffic at 20 to 40 percent conversion into hero SKU pages inside 6 months when the content quality matches search intent and every page carries the right structured data markup. Vejrø also proved out the reporting discipline: every monthly report named the exact page, the exact keyword cluster, and the exact search feature (rich result, sitelinks, image pack) driving the incremental organic revenue instead of hiding behind aggregate traffic charts.
Recipe cadence and content calendar for food brands
Recipe cadence on a working food brand content calendar ships 2 to 4 new recipes per week during the first 6 months and drops to 1 per week at maturity. Each recipe takes 4 to 6 hours to produce (write, test in the kitchen, photograph, schema author, publish). At 3 recipes per week, the brand hits 78 recipes inside 6 months plus a backlog of ingredient comparison and sourcing content queued behind the recipe production line.
| Content pillar | Target volume year 1 | Production cost per piece | Refresh cadence |
|---|---|---|---|
| Recipe hub | 40 to 100 recipes | $180 to $320 | Every 12 months |
| Ingredient comparison guides | 12 to 24 guides | $450 to $780 | Every 18 months |
| Sourcing story pages | 6 to 12 pages | $680 to $1,200 | Every 24 months |
| Buyer intent content | 8 to 16 pieces | $220 to $420 | Every 12 months |
Photography as a content calendar constraint
Photography is the actual constraint on recipe cadence, not writing. Every recipe needs 6 to 12 photos: hero shot, ingredient flat lay, prep in progress, plated result, storage, and step shots for the schema markup. A working food brand batches photography 8 recipes at a time to keep the cost per recipe under 200 dollars. Skip the batching and the per-recipe cost climbs to 400 to 600 dollars, which caps recipe cadence at 1 per week and slows organic ranking timeline by 6 months.
Seasonal content calendar planning
Seasonal content calendar planning maps recipes and comparison guides to the seasonal windows they need to rank in. A Christmas cookie recipe needs to publish in September to rank by early December. A Valentine’s chocolate guide needs to publish in November to rank by early February. A back-to-school lunchbox recipe needs to publish in June to rank by late August. The 60-to-90-day ranking curve dictates the calendar.
Creator syndication inside food brand content
Creator syndication on food brand content marketing amplifies the recipe hub through Instagram Reels, TikTok, and YouTube Shorts creators paid to post their own version of the brand’s hero recipes. The creator content pulls net-new audiences into the recipe hub through the creator’s Link in Bio or Amazon Storefront tag. The syndication calendar names 12 to 30 creators per quarter with specific recipes assigned to each.
One brand we picked up had a spreadsheet titled “creator outreach 2023” with 47 rows and 3 responses. All 3 responses were auto-replies. The spreadsheet named zero recipes and offered flat rates below 100 dollars per post. Nobody posts a 30-second video for 87 dollars flat. Nobody.
Creator content commercial terms that work
Working creator content commercial terms run 350 to 1,500 dollars flat per post plus a 12 to 25 percent commission on tagged sales across a 30-day window. The commission mechanic pulls creators into follow-up posts because the incremental revenue continues past the initial fee. Mid-tier creators (30k to 150k followers) hit the sweet spot for food brand content because their engagement rate typically runs 4 to 8 percent versus 0.8 to 1.6 percent on mega-creators.
Content brief structure for creator partnerships
The content brief structure for creator partnerships runs a single page: the SKU, the specific recipe or usage occasion, 3 required brand mentions, 3 restricted claims (no health claims on non-medical SKUs), the pricing angle, the affiliate link, and 3 example videos that hit the tone. The brief avoids over-scripting because over-scripted creator content underperforms native creator voice by 40 to 60 percent on engagement rate.
Buyer intent content for food brand blogs
Buyer intent content on food brand blogs covers 8 to 16 pieces targeting explicit purchase-decision queries: “where to buy [brand],” “[brand] subscription vs. one-time,” “best [category] for [use case],” and “[brand] gift bundle.” Every buyer intent piece runs 1,400 to 2,400 words with a comparison table, product cards, and a clear conversion path to the specific SKU that matches the query intent. Buyer intent content converts at 3 to 6 percent versus 1 to 2 percent on recipe content because the shopper landed already planning to buy, not exploring a usage occasion.
Where-to-buy content structure
Where-to-buy content structure covers online (DTC storefront, Amazon, Target.com, Whole Foods online), retail (specific chain locators with the store finder embedded), and international (customs limitations, retailer partners abroad). Every piece names specific retailers, links to the store locator, and includes an FAQ block covering shipping availability, subscription options, and gift card compatibility. Where-to-buy content ranks for branded discovery queries the DTC storefront otherwise loses to competitor affiliate reviews.
Subscription versus one-time comparison content
Subscription versus one-time comparison content converts subscription commitments at 3 to 6 percent because it addresses the price-sensitivity concern head-on with a specific math table. The piece covers the discount structure (15 percent lifetime), the skip-a-month mechanic, the pause-anytime rule, the cancellation policy, and the specific yearly savings for the brand’s average consumption cadence. Cross-reference the retention structure on our food and beverage marketing retainer page.
Content refresh cadence on food brand pillars
Content refresh cadence on food brand content pillars runs a rolling audit every 12 to 24 months by pillar. Recipes get refreshed every 12 months with new photography, updated schema, and any nutrition or ingredient adjustments. Ingredient comparison guides refresh every 18 months to update market data. Sourcing story pages refresh every 24 months to reflect farm partnership changes and new harvest angles. Buyer intent content refreshes every 12 months to update retailer availability and pricing.
Recipe refresh priority order
Recipe refresh priority runs by organic traffic rank. The top 20 recipes by monthly organic sessions get refreshed first (new photography, schema audit, related recipe internal links, updated nutrition). The next 40 get refreshed at 15 months. The remaining recipes get refreshed opportunistically when the ranking slips past position 15 in Google. Skipping the refresh cadence lets recipe rankings drift out of the top 3 inside 18 months as newer competitor recipes take the position.
Schema audit checklist per refresh
The schema audit checklist per refresh runs 8 items: Recipe schema completeness, aggregateRating count and accuracy, nutrition data accuracy, prepTime and cookTime match the recipe body, image URLs valid at CDN, related recipe internal links working, product card SKU URL live, and Google Search Console rich result eligibility validated. This checklist takes 20 minutes per recipe and prevents the schema drift that costs recipe rankings 20 to 40 positions quietly.
Reporting cadence for food brand content marketing
Reporting cadence on food brand content marketing runs a monthly executive report plus a quarterly business review. The monthly report ships in the first business week and covers organic sessions by pillar, top 10 ranking recipes with position trend, ingredient guide ranking movements, sourcing page performance, and organic-attributed DTC revenue. Every number carries a comparison to the prior month and a plain-language interpretation the founder reads in 7 minutes.
Metrics that matter for content marketing
Metrics that matter for food brand content marketing: organic sessions by pillar, recipe rich result impressions in Search Console, organic conversion rate to hero SKU pages, organic-attributed DTC revenue, and top 20 ranking positions by monthly organic sessions. Vanity metrics that do not matter: total pageviews without conversion context, average time on page without conversion attribution, and social share counts. The monthly report skips the vanity block entirely.
Quarterly business review structure
The quarterly business review runs 90 minutes with the founder, head of content, and SEO lead. Agenda: organic traffic trend by pillar, top 10 winning content pieces, top 10 losing content pieces (candidates for refresh or removal), competitive gap analysis against 5 named competitor brands, and next quarter’s content calendar with recipes and ingredient guides queued. According to Ahrefs content marketing research, brands running quarterly content audits outperform brands running annual audits by 40 to 70 percent on organic revenue over a 24-month window.
Internal linking discipline across food brand content
Internal linking discipline across food brand content moves authority from recipe pages toward hero SKU product pages and comparison guides. Every recipe links to the hero SKU it uses inline (once in the ingredient list, once in a bottom call-out card). Every ingredient comparison guide links to 3 to 6 recipes using the winning ingredient plus the hero SKU product page. Every sourcing story links to the 2 to 4 SKUs sourced from that specific farm or cooperative.
Anchor text strategy across recipe hubs
Anchor text on internal links varies across recipe hubs to avoid over-optimization patterns Google penalizes. Exact-match anchor (“single-origin Ethiopian coffee”) runs on 20 to 30 percent of internal links. Partial-match variations (“our Ethiopian roast”) run on 30 to 40 percent. Branded anchors (the SKU name) run on 20 to 30 percent. Generic anchors (“shop the coffee”) fill the remaining 10 to 20 percent. This ratio holds ranking without triggering the over-optimization penalty that shows up on brands that anchor-text-stuff every internal link with the same exact-match keyword. Cross-reference the linking layer on our food and beverage web design page.
Link equity from ingredient guides to SKU pages
Link equity from ingredient guides passes to SKU pages when the guide’s comparison table names the hero SKU in the winning column with a product card, and when the guide’s body links to 3 to 6 recipes that use the winning ingredient. This 3-hop path (guide to recipe to SKU) pushes authority from a high-traffic informational query down to a high-intent transactional page. According to Search Engine Land SEO coverage, informational content that internally links to transactional pages produces 2 to 4 times higher organic revenue than isolated content silos.
Wrapping up content marketing for food brands
Content marketing for food brands is the organic engine that turns a DTC snack, drink, or CPG storefront into a search-driven revenue channel. Recipe hub of 40 to 100 recipes. Ingredient comparison guides at 12 to 24 pieces. Sourcing story pages at 6 to 12 pieces. Buyer intent content at 8 to 16 pieces. Creator syndication calendar with 12 to 30 creators per quarter. Refresh cadence at 12 to 24 months by pillar. Reporting with organic sessions and organic revenue attribution.
If your DTC food brand is running paid social at 20,000 dollars monthly with a broken blog and zero recipe schema, professional content marketing for food brands pays for itself inside the first 90 days on organic traffic captured. Redefine Web ships content marketing inside our monthly retainer packages. Book a call and we will walk through the last three DTC food brands we built recipe hubs for, pillar by pillar.
Content marketing for food brands starts with a recipe hub because recipe queries account for 40 to 60 percent of high-intent search volume in the food category. Every hero SKU needs 4 to 12 recipes anchored to it, each targeting a specific occasion and audience.
Skip the recipe hub and the brand loses the search real estate that pulls DTC storefront traffic month over month at zero incremental paid cost. Recipe traffic converts at 2 to 4 percent because the shopper landed with usage intent, not passive discovery, which is why food brands win on recipes.
Recipe schema and Google rich result eligibility
Every recipe page ships schema.org Recipe markup including cookTime, prepTime, recipeIngredient, recipeInstructions, nutrition, and aggregateRating. Correctly marked-up recipes qualify for Google’s recipe rich result carousel that pulls 3 to 6 times higher click-through rate than a plain blue link. The schema layer takes 15 minutes per recipe to author and 30 minutes to validate in Google Search Console. Cross-reference the recipe search stack on our food and beverage SEO page.
Recipe hub structure that scales
The recipe hub structure runs 40 to 100 recipes at maturity, organized by hero SKU (4 to 12 recipes per SKU) plus occasion tags (breakfast, weeknight dinner, meal prep, brunch, holiday). Every recipe links back to the hero SKU product page with the SKU embedded in an inline card. The hub earns internal linking value from ingredient comparison guides and the sourcing story pages, which feeds recipe ranking on Google. According to Google Search Central recipe structured data guidance, complete Recipe schema markup is required for eligibility in the recipe carousel and the ingredient search filter.
Pillar structure for food brand content marketing
The pillar structure on content marketing for food brands runs 4 content pillars concurrently: recipe hub (40 to 100 recipes), ingredient comparison guides (12 to 24 guides), sourcing story pages (6 to 12 pages), and buyer intent content (where to buy, subscription vs. one-time, gift bundle guides). Every pillar covers a distinct search intent and every pillar links back to the hero SKU product pages.
Ingredient comparison guide format
Ingredient comparison guides run 1,800 to 3,200 words comparing 2 to 4 ingredient types on 6 to 10 attributes with a comparison table, real-world use case examples, and links to the hero SKU that uses the specific ingredient. Example: organic vs. conventional oats compares nutritional profile, sourcing chain, cost, environmental impact, and taste on a 6-column table. The brand’s SKU appears in the winning column with a product card. These guides rank 3 to 8 months after publication and pull steady-state organic traffic.
Sourcing story pages that build trust
Sourcing story pages name the specific farms, cooperatives, or suppliers the brand sources from, with photos of the farms, farmer quotes, and specific harvest windows. A coffee brand’s Ethiopian farm page ranks for “single-origin Ethiopian coffee” and “Yirgacheffe coffee origin” plus 40 long-tail variations. The sourcing page pulls trust-building traffic that converts at 4 to 6 percent because the shopper landed pattern-matching on transparency and named provenance. Every sourcing page includes farmer or cooperative quotes, harvest dates, and a link back to 3 to 5 hero SKU pages that source from the named supplier.
Vejrø hospitality content case study
Vejrø Resort, a Danish private-island destination with an on-site restaurant focused on organic, locally sourced cuisine, joined us with strong social engagement and no organic-search real estate. Guests found the resort on Instagram but never in Google search for terms like “private island resort Denmark,” “farm-to-table hospitality Denmark,” or “Vejrø restaurant.” The same organic-search gap shows up on DTC food brands running paid social at 20,000 dollars monthly with a broken blog and zero recipe schema.
We built the conversion-focused website with on-site and off-site SEO tuned to the travel-niche keyword clusters, competitor analysis against comparable boutique resorts, and mobile-first design prioritizing guest discovery. Every page carried the structured data qualifying it for Google’s rich results in the hospitality category. Every internal link pushed authority toward the direct-booking conversion path.
Three months later, Vejrø hit 10,000 plus organic visitors, ranked for 200 plus first-page keywords, and pulled a 2.2 percent booking conversion rate from organic traffic. The same pattern applies to content marketing for food brands: recipe schema, ingredient comparison guides, and sourcing story pages pull organic traffic at 20 to 40 percent conversion into hero SKU pages inside 6 months when the content quality matches search intent and every page carries the right structured data markup. Vejrø also proved out the reporting discipline: every monthly report named the exact page, the exact keyword cluster, and the exact search feature (rich result, sitelinks, image pack) driving the incremental organic revenue instead of hiding behind aggregate traffic charts.
Recipe cadence and content calendar for food brands
Recipe cadence on a working food brand content calendar ships 2 to 4 new recipes per week during the first 6 months and drops to 1 per week at maturity. Each recipe takes 4 to 6 hours to produce (write, test in the kitchen, photograph, schema author, publish). At 3 recipes per week, the brand hits 78 recipes inside 6 months plus a backlog of ingredient comparison and sourcing content queued behind the recipe production line.
| Content pillar | Target volume year 1 | Production cost per piece | Refresh cadence |
|---|---|---|---|
| Recipe hub | 40 to 100 recipes | $180 to $320 | Every 12 months |
| Ingredient comparison guides | 12 to 24 guides | $450 to $780 | Every 18 months |
| Sourcing story pages | 6 to 12 pages | $680 to $1,200 | Every 24 months |
| Buyer intent content | 8 to 16 pieces | $220 to $420 | Every 12 months |
Photography as a content calendar constraint
Photography is the actual constraint on recipe cadence, not writing. Every recipe needs 6 to 12 photos: hero shot, ingredient flat lay, prep in progress, plated result, storage, and step shots for the schema markup. A working food brand batches photography 8 recipes at a time to keep the cost per recipe under 200 dollars. Skip the batching and the per-recipe cost climbs to 400 to 600 dollars, which caps recipe cadence at 1 per week and slows organic ranking timeline by 6 months.
Seasonal content calendar planning
Seasonal content calendar planning maps recipes and comparison guides to the seasonal windows they need to rank in. A Christmas cookie recipe needs to publish in September to rank by early December. A Valentine’s chocolate guide needs to publish in November to rank by early February. A back-to-school lunchbox recipe needs to publish in June to rank by late August. The 60-to-90-day ranking curve dictates the calendar.
Creator syndication inside food brand content
Creator syndication on food brand content marketing amplifies the recipe hub through Instagram Reels, TikTok, and YouTube Shorts creators paid to post their own version of the brand’s hero recipes. The creator content pulls net-new audiences into the recipe hub through the creator’s Link in Bio or Amazon Storefront tag. The syndication calendar names 12 to 30 creators per quarter with specific recipes assigned to each.
One brand we picked up had a spreadsheet titled “creator outreach 2023” with 47 rows and 3 responses. All 3 responses were auto-replies. The spreadsheet named zero recipes and offered flat rates below 100 dollars per post. Nobody posts a 30-second video for 87 dollars flat. Nobody.
Creator content commercial terms that work
Working creator content commercial terms run 350 to 1,500 dollars flat per post plus a 12 to 25 percent commission on tagged sales across a 30-day window. The commission mechanic pulls creators into follow-up posts because the incremental revenue continues past the initial fee. Mid-tier creators (30k to 150k followers) hit the sweet spot for food brand content because their engagement rate typically runs 4 to 8 percent versus 0.8 to 1.6 percent on mega-creators.
Content brief structure for creator partnerships
The content brief structure for creator partnerships runs a single page: the SKU, the specific recipe or usage occasion, 3 required brand mentions, 3 restricted claims (no health claims on non-medical SKUs), the pricing angle, the affiliate link, and 3 example videos that hit the tone. The brief avoids over-scripting because over-scripted creator content underperforms native creator voice by 40 to 60 percent on engagement rate.
Buyer intent content for food brand blogs
Buyer intent content on food brand blogs covers 8 to 16 pieces targeting explicit purchase-decision queries: “where to buy [brand],” “[brand] subscription vs. one-time,” “best [category] for [use case],” and “[brand] gift bundle.” Every buyer intent piece runs 1,400 to 2,400 words with a comparison table, product cards, and a clear conversion path to the specific SKU that matches the query intent. Buyer intent content converts at 3 to 6 percent versus 1 to 2 percent on recipe content because the shopper landed already planning to buy, not exploring a usage occasion.
Where-to-buy content structure
Where-to-buy content structure covers online (DTC storefront, Amazon, Target.com, Whole Foods online), retail (specific chain locators with the store finder embedded), and international (customs limitations, retailer partners abroad). Every piece names specific retailers, links to the store locator, and includes an FAQ block covering shipping availability, subscription options, and gift card compatibility. Where-to-buy content ranks for branded discovery queries the DTC storefront otherwise loses to competitor affiliate reviews.
Subscription versus one-time comparison content
Subscription versus one-time comparison content converts subscription commitments at 3 to 6 percent because it addresses the price-sensitivity concern head-on with a specific math table. The piece covers the discount structure (15 percent lifetime), the skip-a-month mechanic, the pause-anytime rule, the cancellation policy, and the specific yearly savings for the brand’s average consumption cadence. Cross-reference the retention structure on our food and beverage marketing retainer page.
Content refresh cadence on food brand pillars
Content refresh cadence on food brand content pillars runs a rolling audit every 12 to 24 months by pillar. Recipes get refreshed every 12 months with new photography, updated schema, and any nutrition or ingredient adjustments. Ingredient comparison guides refresh every 18 months to update market data. Sourcing story pages refresh every 24 months to reflect farm partnership changes and new harvest angles. Buyer intent content refreshes every 12 months to update retailer availability and pricing.
Recipe refresh priority order
Recipe refresh priority runs by organic traffic rank. The top 20 recipes by monthly organic sessions get refreshed first (new photography, schema audit, related recipe internal links, updated nutrition). The next 40 get refreshed at 15 months. The remaining recipes get refreshed opportunistically when the ranking slips past position 15 in Google. Skipping the refresh cadence lets recipe rankings drift out of the top 3 inside 18 months as newer competitor recipes take the position.
Schema audit checklist per refresh
The schema audit checklist per refresh runs 8 items: Recipe schema completeness, aggregateRating count and accuracy, nutrition data accuracy, prepTime and cookTime match the recipe body, image URLs valid at CDN, related recipe internal links working, product card SKU URL live, and Google Search Console rich result eligibility validated. This checklist takes 20 minutes per recipe and prevents the schema drift that costs recipe rankings 20 to 40 positions quietly.
Reporting cadence for food brand content marketing
Reporting cadence on food brand content marketing runs a monthly executive report plus a quarterly business review. The monthly report ships in the first business week and covers organic sessions by pillar, top 10 ranking recipes with position trend, ingredient guide ranking movements, sourcing page performance, and organic-attributed DTC revenue. Every number carries a comparison to the prior month and a plain-language interpretation the founder reads in 7 minutes.
Metrics that matter for content marketing
Metrics that matter for food brand content marketing: organic sessions by pillar, recipe rich result impressions in Search Console, organic conversion rate to hero SKU pages, organic-attributed DTC revenue, and top 20 ranking positions by monthly organic sessions. Vanity metrics that do not matter: total pageviews without conversion context, average time on page without conversion attribution, and social share counts. The monthly report skips the vanity block entirely.
Quarterly business review structure
The quarterly business review runs 90 minutes with the founder, head of content, and SEO lead. Agenda: organic traffic trend by pillar, top 10 winning content pieces, top 10 losing content pieces (candidates for refresh or removal), competitive gap analysis against 5 named competitor brands, and next quarter’s content calendar with recipes and ingredient guides queued. According to Ahrefs content marketing research, brands running quarterly content audits outperform brands running annual audits by 40 to 70 percent on organic revenue over a 24-month window.
Internal linking discipline across food brand content
Internal linking discipline across food brand content moves authority from recipe pages toward hero SKU product pages and comparison guides. Every recipe links to the hero SKU it uses inline (once in the ingredient list, once in a bottom call-out card). Every ingredient comparison guide links to 3 to 6 recipes using the winning ingredient plus the hero SKU product page. Every sourcing story links to the 2 to 4 SKUs sourced from that specific farm or cooperative.
Anchor text strategy across recipe hubs
Anchor text on internal links varies across recipe hubs to avoid over-optimization patterns Google penalizes. Exact-match anchor (“single-origin Ethiopian coffee”) runs on 20 to 30 percent of internal links. Partial-match variations (“our Ethiopian roast”) run on 30 to 40 percent. Branded anchors (the SKU name) run on 20 to 30 percent. Generic anchors (“shop the coffee”) fill the remaining 10 to 20 percent. This ratio holds ranking without triggering the over-optimization penalty that shows up on brands that anchor-text-stuff every internal link with the same exact-match keyword. Cross-reference the linking layer on our food and beverage web design page.
Link equity from ingredient guides to SKU pages
Link equity from ingredient guides passes to SKU pages when the guide’s comparison table names the hero SKU in the winning column with a product card, and when the guide’s body links to 3 to 6 recipes that use the winning ingredient. This 3-hop path (guide to recipe to SKU) pushes authority from a high-traffic informational query down to a high-intent transactional page. According to Search Engine Land SEO coverage, informational content that internally links to transactional pages produces 2 to 4 times higher organic revenue than isolated content silos.
Wrapping up content marketing for food brands
Content marketing for food brands is the organic engine that turns a DTC snack, drink, or CPG storefront into a search-driven revenue channel. Recipe hub of 40 to 100 recipes. Ingredient comparison guides at 12 to 24 pieces. Sourcing story pages at 6 to 12 pieces. Buyer intent content at 8 to 16 pieces. Creator syndication calendar with 12 to 30 creators per quarter. Refresh cadence at 12 to 24 months by pillar. Reporting with organic sessions and organic revenue attribution.
If your DTC food brand is running paid social at 20,000 dollars monthly with a broken blog and zero recipe schema, professional content marketing for food brands pays for itself inside the first 90 days on organic traffic captured. Redefine Web ships content marketing inside our monthly retainer packages. Book a call and we will walk through the last three DTC food brands we built recipe hubs for, pillar by pillar.
Content marketing for food brands starts with a recipe hub because recipe queries account for 40 to 60 percent of high-intent search volume in the food category. Every hero SKU needs 4 to 12 recipes anchored to it, each targeting a specific occasion and audience.
Skip the recipe hub and the brand loses the search real estate that pulls DTC storefront traffic month over month at zero incremental paid cost. Recipe traffic converts at 2 to 4 percent because the shopper landed with usage intent, not passive discovery, which is why food brands win on recipes.
Recipe schema and Google rich result eligibility
Every recipe page ships schema.org Recipe markup including cookTime, prepTime, recipeIngredient, recipeInstructions, nutrition, and aggregateRating. Correctly marked-up recipes qualify for Google’s recipe rich result carousel that pulls 3 to 6 times higher click-through rate than a plain blue link. The schema layer takes 15 minutes per recipe to author and 30 minutes to validate in Google Search Console. Cross-reference the recipe search stack on our food and beverage SEO page.
Recipe hub structure that scales
The recipe hub structure runs 40 to 100 recipes at maturity, organized by hero SKU (4 to 12 recipes per SKU) plus occasion tags (breakfast, weeknight dinner, meal prep, brunch, holiday). Every recipe links back to the hero SKU product page with the SKU embedded in an inline card. The hub earns internal linking value from ingredient comparison guides and the sourcing story pages, which feeds recipe ranking on Google. According to Google Search Central recipe structured data guidance, complete Recipe schema markup is required for eligibility in the recipe carousel and the ingredient search filter.
Pillar structure for food brand content marketing
The pillar structure on content marketing for food brands runs 4 content pillars concurrently: recipe hub (40 to 100 recipes), ingredient comparison guides (12 to 24 guides), sourcing story pages (6 to 12 pages), and buyer intent content (where to buy, subscription vs. one-time, gift bundle guides). Every pillar covers a distinct search intent and every pillar links back to the hero SKU product pages.
Ingredient comparison guide format
Ingredient comparison guides run 1,800 to 3,200 words comparing 2 to 4 ingredient types on 6 to 10 attributes with a comparison table, real-world use case examples, and links to the hero SKU that uses the specific ingredient. Example: organic vs. conventional oats compares nutritional profile, sourcing chain, cost, environmental impact, and taste on a 6-column table. The brand’s SKU appears in the winning column with a product card. These guides rank 3 to 8 months after publication and pull steady-state organic traffic.
Sourcing story pages that build trust
Sourcing story pages name the specific farms, cooperatives, or suppliers the brand sources from, with photos of the farms, farmer quotes, and specific harvest windows. A coffee brand’s Ethiopian farm page ranks for “single-origin Ethiopian coffee” and “Yirgacheffe coffee origin” plus 40 long-tail variations. The sourcing page pulls trust-building traffic that converts at 4 to 6 percent because the shopper landed pattern-matching on transparency and named provenance. Every sourcing page includes farmer or cooperative quotes, harvest dates, and a link back to 3 to 5 hero SKU pages that source from the named supplier.
Vejrø hospitality content case study
Vejrø Resort, a Danish private-island destination with an on-site restaurant focused on organic, locally sourced cuisine, joined us with strong social engagement and no organic-search real estate. Guests found the resort on Instagram but never in Google search for terms like “private island resort Denmark,” “farm-to-table hospitality Denmark,” or “Vejrø restaurant.” The same organic-search gap shows up on DTC food brands running paid social at 20,000 dollars monthly with a broken blog and zero recipe schema.
We built the conversion-focused website with on-site and off-site SEO tuned to the travel-niche keyword clusters, competitor analysis against comparable boutique resorts, and mobile-first design prioritizing guest discovery. Every page carried the structured data qualifying it for Google’s rich results in the hospitality category. Every internal link pushed authority toward the direct-booking conversion path.
Three months later, Vejrø hit 10,000 plus organic visitors, ranked for 200 plus first-page keywords, and pulled a 2.2 percent booking conversion rate from organic traffic. The same pattern applies to content marketing for food brands: recipe schema, ingredient comparison guides, and sourcing story pages pull organic traffic at 20 to 40 percent conversion into hero SKU pages inside 6 months when the content quality matches search intent and every page carries the right structured data markup. Vejrø also proved out the reporting discipline: every monthly report named the exact page, the exact keyword cluster, and the exact search feature (rich result, sitelinks, image pack) driving the incremental organic revenue instead of hiding behind aggregate traffic charts.
Recipe cadence and content calendar for food brands
Recipe cadence on a working food brand content calendar ships 2 to 4 new recipes per week during the first 6 months and drops to 1 per week at maturity. Each recipe takes 4 to 6 hours to produce (write, test in the kitchen, photograph, schema author, publish). At 3 recipes per week, the brand hits 78 recipes inside 6 months plus a backlog of ingredient comparison and sourcing content queued behind the recipe production line.
| Content pillar | Target volume year 1 | Production cost per piece | Refresh cadence |
|---|---|---|---|
| Recipe hub | 40 to 100 recipes | $180 to $320 | Every 12 months |
| Ingredient comparison guides | 12 to 24 guides | $450 to $780 | Every 18 months |
| Sourcing story pages | 6 to 12 pages | $680 to $1,200 | Every 24 months |
| Buyer intent content | 8 to 16 pieces | $220 to $420 | Every 12 months |
Photography as a content calendar constraint
Photography is the actual constraint on recipe cadence, not writing. Every recipe needs 6 to 12 photos: hero shot, ingredient flat lay, prep in progress, plated result, storage, and step shots for the schema markup. A working food brand batches photography 8 recipes at a time to keep the cost per recipe under 200 dollars. Skip the batching and the per-recipe cost climbs to 400 to 600 dollars, which caps recipe cadence at 1 per week and slows organic ranking timeline by 6 months.
Seasonal content calendar planning
Seasonal content calendar planning maps recipes and comparison guides to the seasonal windows they need to rank in. A Christmas cookie recipe needs to publish in September to rank by early December. A Valentine’s chocolate guide needs to publish in November to rank by early February. A back-to-school lunchbox recipe needs to publish in June to rank by late August. The 60-to-90-day ranking curve dictates the calendar.
Creator syndication inside food brand content
Creator syndication on food brand content marketing amplifies the recipe hub through Instagram Reels, TikTok, and YouTube Shorts creators paid to post their own version of the brand’s hero recipes. The creator content pulls net-new audiences into the recipe hub through the creator’s Link in Bio or Amazon Storefront tag. The syndication calendar names 12 to 30 creators per quarter with specific recipes assigned to each.
One brand we picked up had a spreadsheet titled “creator outreach 2023” with 47 rows and 3 responses. All 3 responses were auto-replies. The spreadsheet named zero recipes and offered flat rates below 100 dollars per post. Nobody posts a 30-second video for 87 dollars flat. Nobody.
Creator content commercial terms that work
Working creator content commercial terms run 350 to 1,500 dollars flat per post plus a 12 to 25 percent commission on tagged sales across a 30-day window. The commission mechanic pulls creators into follow-up posts because the incremental revenue continues past the initial fee. Mid-tier creators (30k to 150k followers) hit the sweet spot for food brand content because their engagement rate typically runs 4 to 8 percent versus 0.8 to 1.6 percent on mega-creators.
Content brief structure for creator partnerships
The content brief structure for creator partnerships runs a single page: the SKU, the specific recipe or usage occasion, 3 required brand mentions, 3 restricted claims (no health claims on non-medical SKUs), the pricing angle, the affiliate link, and 3 example videos that hit the tone. The brief avoids over-scripting because over-scripted creator content underperforms native creator voice by 40 to 60 percent on engagement rate.
Buyer intent content for food brand blogs
Buyer intent content on food brand blogs covers 8 to 16 pieces targeting explicit purchase-decision queries: “where to buy [brand],” “[brand] subscription vs. one-time,” “best [category] for [use case],” and “[brand] gift bundle.” Every buyer intent piece runs 1,400 to 2,400 words with a comparison table, product cards, and a clear conversion path to the specific SKU that matches the query intent. Buyer intent content converts at 3 to 6 percent versus 1 to 2 percent on recipe content because the shopper landed already planning to buy, not exploring a usage occasion.
Where-to-buy content structure
Where-to-buy content structure covers online (DTC storefront, Amazon, Target.com, Whole Foods online), retail (specific chain locators with the store finder embedded), and international (customs limitations, retailer partners abroad). Every piece names specific retailers, links to the store locator, and includes an FAQ block covering shipping availability, subscription options, and gift card compatibility. Where-to-buy content ranks for branded discovery queries the DTC storefront otherwise loses to competitor affiliate reviews.
Subscription versus one-time comparison content
Subscription versus one-time comparison content converts subscription commitments at 3 to 6 percent because it addresses the price-sensitivity concern head-on with a specific math table. The piece covers the discount structure (15 percent lifetime), the skip-a-month mechanic, the pause-anytime rule, the cancellation policy, and the specific yearly savings for the brand’s average consumption cadence. Cross-reference the retention structure on our food and beverage marketing retainer page.
Content refresh cadence on food brand pillars
Content refresh cadence on food brand content pillars runs a rolling audit every 12 to 24 months by pillar. Recipes get refreshed every 12 months with new photography, updated schema, and any nutrition or ingredient adjustments. Ingredient comparison guides refresh every 18 months to update market data. Sourcing story pages refresh every 24 months to reflect farm partnership changes and new harvest angles. Buyer intent content refreshes every 12 months to update retailer availability and pricing.
Recipe refresh priority order
Recipe refresh priority runs by organic traffic rank. The top 20 recipes by monthly organic sessions get refreshed first (new photography, schema audit, related recipe internal links, updated nutrition). The next 40 get refreshed at 15 months. The remaining recipes get refreshed opportunistically when the ranking slips past position 15 in Google. Skipping the refresh cadence lets recipe rankings drift out of the top 3 inside 18 months as newer competitor recipes take the position.
Schema audit checklist per refresh
The schema audit checklist per refresh runs 8 items: Recipe schema completeness, aggregateRating count and accuracy, nutrition data accuracy, prepTime and cookTime match the recipe body, image URLs valid at CDN, related recipe internal links working, product card SKU URL live, and Google Search Console rich result eligibility validated. This checklist takes 20 minutes per recipe and prevents the schema drift that costs recipe rankings 20 to 40 positions quietly.
Reporting cadence for food brand content marketing
Reporting cadence on food brand content marketing runs a monthly executive report plus a quarterly business review. The monthly report ships in the first business week and covers organic sessions by pillar, top 10 ranking recipes with position trend, ingredient guide ranking movements, sourcing page performance, and organic-attributed DTC revenue. Every number carries a comparison to the prior month and a plain-language interpretation the founder reads in 7 minutes.
Metrics that matter for content marketing
Metrics that matter for food brand content marketing: organic sessions by pillar, recipe rich result impressions in Search Console, organic conversion rate to hero SKU pages, organic-attributed DTC revenue, and top 20 ranking positions by monthly organic sessions. Vanity metrics that do not matter: total pageviews without conversion context, average time on page without conversion attribution, and social share counts. The monthly report skips the vanity block entirely.
Quarterly business review structure
The quarterly business review runs 90 minutes with the founder, head of content, and SEO lead. Agenda: organic traffic trend by pillar, top 10 winning content pieces, top 10 losing content pieces (candidates for refresh or removal), competitive gap analysis against 5 named competitor brands, and next quarter’s content calendar with recipes and ingredient guides queued. According to Ahrefs content marketing research, brands running quarterly content audits outperform brands running annual audits by 40 to 70 percent on organic revenue over a 24-month window.
Internal linking discipline across food brand content
Internal linking discipline across food brand content moves authority from recipe pages toward hero SKU product pages and comparison guides. Every recipe links to the hero SKU it uses inline (once in the ingredient list, once in a bottom call-out card). Every ingredient comparison guide links to 3 to 6 recipes using the winning ingredient plus the hero SKU product page. Every sourcing story links to the 2 to 4 SKUs sourced from that specific farm or cooperative.
Anchor text strategy across recipe hubs
Anchor text on internal links varies across recipe hubs to avoid over-optimization patterns Google penalizes. Exact-match anchor (“single-origin Ethiopian coffee”) runs on 20 to 30 percent of internal links. Partial-match variations (“our Ethiopian roast”) run on 30 to 40 percent. Branded anchors (the SKU name) run on 20 to 30 percent. Generic anchors (“shop the coffee”) fill the remaining 10 to 20 percent. This ratio holds ranking without triggering the over-optimization penalty that shows up on brands that anchor-text-stuff every internal link with the same exact-match keyword. Cross-reference the linking layer on our food and beverage web design page.
Link equity from ingredient guides to SKU pages
Link equity from ingredient guides passes to SKU pages when the guide’s comparison table names the hero SKU in the winning column with a product card, and when the guide’s body links to 3 to 6 recipes that use the winning ingredient. This 3-hop path (guide to recipe to SKU) pushes authority from a high-traffic informational query down to a high-intent transactional page. According to Search Engine Land SEO coverage, informational content that internally links to transactional pages produces 2 to 4 times higher organic revenue than isolated content silos.
Wrapping up content marketing for food brands
Content marketing for food brands is the organic engine that turns a DTC snack, drink, or CPG storefront into a search-driven revenue channel. Recipe hub of 40 to 100 recipes. Ingredient comparison guides at 12 to 24 pieces. Sourcing story pages at 6 to 12 pieces. Buyer intent content at 8 to 16 pieces. Creator syndication calendar with 12 to 30 creators per quarter. Refresh cadence at 12 to 24 months by pillar. Reporting with organic sessions and organic revenue attribution.
If your DTC food brand is running paid social at 20,000 dollars monthly with a broken blog and zero recipe schema, professional content marketing for food brands pays for itself inside the first 90 days on organic traffic captured. Redefine Web ships content marketing inside our monthly retainer packages. Book a call and we will walk through the last three DTC food brands we built recipe hubs for, pillar by pillar.
Content marketing for food brands starts with a recipe hub because recipe queries account for 40 to 60 percent of high-intent search volume in the food category. Every hero SKU needs 4 to 12 recipes anchored to it, each targeting a specific occasion and audience.
Skip the recipe hub and the brand loses the search real estate that pulls DTC storefront traffic month over month at zero incremental paid cost. Recipe traffic converts at 2 to 4 percent because the shopper landed with usage intent, not passive discovery, which is why food brands win on recipes.
Recipe schema and Google rich result eligibility
Every recipe page ships schema.org Recipe markup including cookTime, prepTime, recipeIngredient, recipeInstructions, nutrition, and aggregateRating. Correctly marked-up recipes qualify for Google’s recipe rich result carousel that pulls 3 to 6 times higher click-through rate than a plain blue link. The schema layer takes 15 minutes per recipe to author and 30 minutes to validate in Google Search Console. Cross-reference the recipe search stack on our food and beverage SEO page.
Recipe hub structure that scales
The recipe hub structure runs 40 to 100 recipes at maturity, organized by hero SKU (4 to 12 recipes per SKU) plus occasion tags (breakfast, weeknight dinner, meal prep, brunch, holiday). Every recipe links back to the hero SKU product page with the SKU embedded in an inline card. The hub earns internal linking value from ingredient comparison guides and the sourcing story pages, which feeds recipe ranking on Google. According to Google Search Central recipe structured data guidance, complete Recipe schema markup is required for eligibility in the recipe carousel and the ingredient search filter.
Pillar structure for food brand content marketing
The pillar structure on content marketing for food brands runs 4 content pillars concurrently: recipe hub (40 to 100 recipes), ingredient comparison guides (12 to 24 guides), sourcing story pages (6 to 12 pages), and buyer intent content (where to buy, subscription vs. one-time, gift bundle guides). Every pillar covers a distinct search intent and every pillar links back to the hero SKU product pages.
Ingredient comparison guide format
Ingredient comparison guides run 1,800 to 3,200 words comparing 2 to 4 ingredient types on 6 to 10 attributes with a comparison table, real-world use case examples, and links to the hero SKU that uses the specific ingredient. Example: organic vs. conventional oats compares nutritional profile, sourcing chain, cost, environmental impact, and taste on a 6-column table. The brand’s SKU appears in the winning column with a product card. These guides rank 3 to 8 months after publication and pull steady-state organic traffic.
Sourcing story pages that build trust
Sourcing story pages name the specific farms, cooperatives, or suppliers the brand sources from, with photos of the farms, farmer quotes, and specific harvest windows. A coffee brand’s Ethiopian farm page ranks for “single-origin Ethiopian coffee” and “Yirgacheffe coffee origin” plus 40 long-tail variations. The sourcing page pulls trust-building traffic that converts at 4 to 6 percent because the shopper landed pattern-matching on transparency and named provenance. Every sourcing page includes farmer or cooperative quotes, harvest dates, and a link back to 3 to 5 hero SKU pages that source from the named supplier.
Vejrø hospitality content case study
Vejrø Resort, a Danish private-island destination with an on-site restaurant focused on organic, locally sourced cuisine, joined us with strong social engagement and no organic-search real estate. Guests found the resort on Instagram but never in Google search for terms like “private island resort Denmark,” “farm-to-table hospitality Denmark,” or “Vejrø restaurant.” The same organic-search gap shows up on DTC food brands running paid social at 20,000 dollars monthly with a broken blog and zero recipe schema.
We built the conversion-focused website with on-site and off-site SEO tuned to the travel-niche keyword clusters, competitor analysis against comparable boutique resorts, and mobile-first design prioritizing guest discovery. Every page carried the structured data qualifying it for Google’s rich results in the hospitality category. Every internal link pushed authority toward the direct-booking conversion path.
Three months later, Vejrø hit 10,000 plus organic visitors, ranked for 200 plus first-page keywords, and pulled a 2.2 percent booking conversion rate from organic traffic. The same pattern applies to content marketing for food brands: recipe schema, ingredient comparison guides, and sourcing story pages pull organic traffic at 20 to 40 percent conversion into hero SKU pages inside 6 months when the content quality matches search intent and every page carries the right structured data markup. Vejrø also proved out the reporting discipline: every monthly report named the exact page, the exact keyword cluster, and the exact search feature (rich result, sitelinks, image pack) driving the incremental organic revenue instead of hiding behind aggregate traffic charts.
Recipe cadence and content calendar for food brands
Recipe cadence on a working food brand content calendar ships 2 to 4 new recipes per week during the first 6 months and drops to 1 per week at maturity. Each recipe takes 4 to 6 hours to produce (write, test in the kitchen, photograph, schema author, publish). At 3 recipes per week, the brand hits 78 recipes inside 6 months plus a backlog of ingredient comparison and sourcing content queued behind the recipe production line.
| Content pillar | Target volume year 1 | Production cost per piece | Refresh cadence |
|---|---|---|---|
| Recipe hub | 40 to 100 recipes | $180 to $320 | Every 12 months |
| Ingredient comparison guides | 12 to 24 guides | $450 to $780 | Every 18 months |
| Sourcing story pages | 6 to 12 pages | $680 to $1,200 | Every 24 months |
| Buyer intent content | 8 to 16 pieces | $220 to $420 | Every 12 months |
Photography as a content calendar constraint
Photography is the actual constraint on recipe cadence, not writing. Every recipe needs 6 to 12 photos: hero shot, ingredient flat lay, prep in progress, plated result, storage, and step shots for the schema markup. A working food brand batches photography 8 recipes at a time to keep the cost per recipe under 200 dollars. Skip the batching and the per-recipe cost climbs to 400 to 600 dollars, which caps recipe cadence at 1 per week and slows organic ranking timeline by 6 months.
Seasonal content calendar planning
Seasonal content calendar planning maps recipes and comparison guides to the seasonal windows they need to rank in. A Christmas cookie recipe needs to publish in September to rank by early December. A Valentine’s chocolate guide needs to publish in November to rank by early February. A back-to-school lunchbox recipe needs to publish in June to rank by late August. The 60-to-90-day ranking curve dictates the calendar.
Creator syndication inside food brand content
Creator syndication on food brand content marketing amplifies the recipe hub through Instagram Reels, TikTok, and YouTube Shorts creators paid to post their own version of the brand’s hero recipes. The creator content pulls net-new audiences into the recipe hub through the creator’s Link in Bio or Amazon Storefront tag. The syndication calendar names 12 to 30 creators per quarter with specific recipes assigned to each.
One brand we picked up had a spreadsheet titled “creator outreach 2023” with 47 rows and 3 responses. All 3 responses were auto-replies. The spreadsheet named zero recipes and offered flat rates below 100 dollars per post. Nobody posts a 30-second video for 87 dollars flat. Nobody.
Creator content commercial terms that work
Working creator content commercial terms run 350 to 1,500 dollars flat per post plus a 12 to 25 percent commission on tagged sales across a 30-day window. The commission mechanic pulls creators into follow-up posts because the incremental revenue continues past the initial fee. Mid-tier creators (30k to 150k followers) hit the sweet spot for food brand content because their engagement rate typically runs 4 to 8 percent versus 0.8 to 1.6 percent on mega-creators.
Content brief structure for creator partnerships
The content brief structure for creator partnerships runs a single page: the SKU, the specific recipe or usage occasion, 3 required brand mentions, 3 restricted claims (no health claims on non-medical SKUs), the pricing angle, the affiliate link, and 3 example videos that hit the tone. The brief avoids over-scripting because over-scripted creator content underperforms native creator voice by 40 to 60 percent on engagement rate.
Buyer intent content for food brand blogs
Buyer intent content on food brand blogs covers 8 to 16 pieces targeting explicit purchase-decision queries: “where to buy [brand],” “[brand] subscription vs. one-time,” “best [category] for [use case],” and “[brand] gift bundle.” Every buyer intent piece runs 1,400 to 2,400 words with a comparison table, product cards, and a clear conversion path to the specific SKU that matches the query intent. Buyer intent content converts at 3 to 6 percent versus 1 to 2 percent on recipe content because the shopper landed already planning to buy, not exploring a usage occasion.
Where-to-buy content structure
Where-to-buy content structure covers online (DTC storefront, Amazon, Target.com, Whole Foods online), retail (specific chain locators with the store finder embedded), and international (customs limitations, retailer partners abroad). Every piece names specific retailers, links to the store locator, and includes an FAQ block covering shipping availability, subscription options, and gift card compatibility. Where-to-buy content ranks for branded discovery queries the DTC storefront otherwise loses to competitor affiliate reviews.
Subscription versus one-time comparison content
Subscription versus one-time comparison content converts subscription commitments at 3 to 6 percent because it addresses the price-sensitivity concern head-on with a specific math table. The piece covers the discount structure (15 percent lifetime), the skip-a-month mechanic, the pause-anytime rule, the cancellation policy, and the specific yearly savings for the brand’s average consumption cadence. Cross-reference the retention structure on our food and beverage marketing retainer page.
Content refresh cadence on food brand pillars
Content refresh cadence on food brand content pillars runs a rolling audit every 12 to 24 months by pillar. Recipes get refreshed every 12 months with new photography, updated schema, and any nutrition or ingredient adjustments. Ingredient comparison guides refresh every 18 months to update market data. Sourcing story pages refresh every 24 months to reflect farm partnership changes and new harvest angles. Buyer intent content refreshes every 12 months to update retailer availability and pricing.
Recipe refresh priority order
Recipe refresh priority runs by organic traffic rank. The top 20 recipes by monthly organic sessions get refreshed first (new photography, schema audit, related recipe internal links, updated nutrition). The next 40 get refreshed at 15 months. The remaining recipes get refreshed opportunistically when the ranking slips past position 15 in Google. Skipping the refresh cadence lets recipe rankings drift out of the top 3 inside 18 months as newer competitor recipes take the position.
Schema audit checklist per refresh
The schema audit checklist per refresh runs 8 items: Recipe schema completeness, aggregateRating count and accuracy, nutrition data accuracy, prepTime and cookTime match the recipe body, image URLs valid at CDN, related recipe internal links working, product card SKU URL live, and Google Search Console rich result eligibility validated. This checklist takes 20 minutes per recipe and prevents the schema drift that costs recipe rankings 20 to 40 positions quietly.
Reporting cadence for food brand content marketing
Reporting cadence on food brand content marketing runs a monthly executive report plus a quarterly business review. The monthly report ships in the first business week and covers organic sessions by pillar, top 10 ranking recipes with position trend, ingredient guide ranking movements, sourcing page performance, and organic-attributed DTC revenue. Every number carries a comparison to the prior month and a plain-language interpretation the founder reads in 7 minutes.
Metrics that matter for content marketing
Metrics that matter for food brand content marketing: organic sessions by pillar, recipe rich result impressions in Search Console, organic conversion rate to hero SKU pages, organic-attributed DTC revenue, and top 20 ranking positions by monthly organic sessions. Vanity metrics that do not matter: total pageviews without conversion context, average time on page without conversion attribution, and social share counts. The monthly report skips the vanity block entirely.
Quarterly business review structure
The quarterly business review runs 90 minutes with the founder, head of content, and SEO lead. Agenda: organic traffic trend by pillar, top 10 winning content pieces, top 10 losing content pieces (candidates for refresh or removal), competitive gap analysis against 5 named competitor brands, and next quarter’s content calendar with recipes and ingredient guides queued. According to Ahrefs content marketing research, brands running quarterly content audits outperform brands running annual audits by 40 to 70 percent on organic revenue over a 24-month window.
Internal linking discipline across food brand content
Internal linking discipline across food brand content moves authority from recipe pages toward hero SKU product pages and comparison guides. Every recipe links to the hero SKU it uses inline (once in the ingredient list, once in a bottom call-out card). Every ingredient comparison guide links to 3 to 6 recipes using the winning ingredient plus the hero SKU product page. Every sourcing story links to the 2 to 4 SKUs sourced from that specific farm or cooperative.
Anchor text strategy across recipe hubs
Anchor text on internal links varies across recipe hubs to avoid over-optimization patterns Google penalizes. Exact-match anchor (“single-origin Ethiopian coffee”) runs on 20 to 30 percent of internal links. Partial-match variations (“our Ethiopian roast”) run on 30 to 40 percent. Branded anchors (the SKU name) run on 20 to 30 percent. Generic anchors (“shop the coffee”) fill the remaining 10 to 20 percent. This ratio holds ranking without triggering the over-optimization penalty that shows up on brands that anchor-text-stuff every internal link with the same exact-match keyword. Cross-reference the linking layer on our food and beverage web design page.
Link equity from ingredient guides to SKU pages
Link equity from ingredient guides passes to SKU pages when the guide’s comparison table names the hero SKU in the winning column with a product card, and when the guide’s body links to 3 to 6 recipes that use the winning ingredient. This 3-hop path (guide to recipe to SKU) pushes authority from a high-traffic informational query down to a high-intent transactional page. According to Search Engine Land SEO coverage, informational content that internally links to transactional pages produces 2 to 4 times higher organic revenue than isolated content silos.
Wrapping up content marketing for food brands
Content marketing for food brands is the organic engine that turns a DTC snack, drink, or CPG storefront into a search-driven revenue channel. Recipe hub of 40 to 100 recipes. Ingredient comparison guides at 12 to 24 pieces. Sourcing story pages at 6 to 12 pieces. Buyer intent content at 8 to 16 pieces. Creator syndication calendar with 12 to 30 creators per quarter. Refresh cadence at 12 to 24 months by pillar. Reporting with organic sessions and organic revenue attribution.
If your DTC food brand is running paid social at 20,000 dollars monthly with a broken blog and zero recipe schema, professional content marketing for food brands pays for itself inside the first 90 days on organic traffic captured. Redefine Web ships content marketing inside our monthly retainer packages. Book a call and we will walk through the last three DTC food brands we built recipe hubs for, pillar by pillar.
Content marketing for food brands starts with a recipe hub because recipe queries account for 40 to 60 percent of high-intent search volume in the food category. Every hero SKU needs 4 to 12 recipes anchored to it, each targeting a specific occasion and audience.
Skip the recipe hub and the brand loses the search real estate that pulls DTC storefront traffic month over month at zero incremental paid cost. Recipe traffic converts at 2 to 4 percent because the shopper landed with usage intent, not passive discovery, which is why food brands win on recipes.
Recipe schema and Google rich result eligibility
Every recipe page ships schema.org Recipe markup including cookTime, prepTime, recipeIngredient, recipeInstructions, nutrition, and aggregateRating. Correctly marked-up recipes qualify for Google’s recipe rich result carousel that pulls 3 to 6 times higher click-through rate than a plain blue link. The schema layer takes 15 minutes per recipe to author and 30 minutes to validate in Google Search Console. Cross-reference the recipe search stack on our food and beverage SEO page.
Recipe hub structure that scales
The recipe hub structure runs 40 to 100 recipes at maturity, organized by hero SKU (4 to 12 recipes per SKU) plus occasion tags (breakfast, weeknight dinner, meal prep, brunch, holiday). Every recipe links back to the hero SKU product page with the SKU embedded in an inline card. The hub earns internal linking value from ingredient comparison guides and the sourcing story pages, which feeds recipe ranking on Google. According to Google Search Central recipe structured data guidance, complete Recipe schema markup is required for eligibility in the recipe carousel and the ingredient search filter.
Pillar structure for food brand content marketing
The pillar structure on content marketing for food brands runs 4 content pillars concurrently: recipe hub (40 to 100 recipes), ingredient comparison guides (12 to 24 guides), sourcing story pages (6 to 12 pages), and buyer intent content (where to buy, subscription vs. one-time, gift bundle guides). Every pillar covers a distinct search intent and every pillar links back to the hero SKU product pages.
Ingredient comparison guide format
Ingredient comparison guides run 1,800 to 3,200 words comparing 2 to 4 ingredient types on 6 to 10 attributes with a comparison table, real-world use case examples, and links to the hero SKU that uses the specific ingredient. Example: organic vs. conventional oats compares nutritional profile, sourcing chain, cost, environmental impact, and taste on a 6-column table. The brand’s SKU appears in the winning column with a product card. These guides rank 3 to 8 months after publication and pull steady-state organic traffic.
Sourcing story pages that build trust
Sourcing story pages name the specific farms, cooperatives, or suppliers the brand sources from, with photos of the farms, farmer quotes, and specific harvest windows. A coffee brand’s Ethiopian farm page ranks for “single-origin Ethiopian coffee” and “Yirgacheffe coffee origin” plus 40 long-tail variations. The sourcing page pulls trust-building traffic that converts at 4 to 6 percent because the shopper landed pattern-matching on transparency and named provenance. Every sourcing page includes farmer or cooperative quotes, harvest dates, and a link back to 3 to 5 hero SKU pages that source from the named supplier.
Vejrø hospitality content case study
Vejrø Resort, a Danish private-island destination with an on-site restaurant focused on organic, locally sourced cuisine, joined us with strong social engagement and no organic-search real estate. Guests found the resort on Instagram but never in Google search for terms like “private island resort Denmark,” “farm-to-table hospitality Denmark,” or “Vejrø restaurant.” The same organic-search gap shows up on DTC food brands running paid social at 20,000 dollars monthly with a broken blog and zero recipe schema.
We built the conversion-focused website with on-site and off-site SEO tuned to the travel-niche keyword clusters, competitor analysis against comparable boutique resorts, and mobile-first design prioritizing guest discovery. Every page carried the structured data qualifying it for Google’s rich results in the hospitality category. Every internal link pushed authority toward the direct-booking conversion path.
Three months later, Vejrø hit 10,000 plus organic visitors, ranked for 200 plus first-page keywords, and pulled a 2.2 percent booking conversion rate from organic traffic. The same pattern applies to content marketing for food brands: recipe schema, ingredient comparison guides, and sourcing story pages pull organic traffic at 20 to 40 percent conversion into hero SKU pages inside 6 months when the content quality matches search intent and every page carries the right structured data markup. Vejrø also proved out the reporting discipline: every monthly report named the exact page, the exact keyword cluster, and the exact search feature (rich result, sitelinks, image pack) driving the incremental organic revenue instead of hiding behind aggregate traffic charts.
Recipe cadence and content calendar for food brands
Recipe cadence on a working food brand content calendar ships 2 to 4 new recipes per week during the first 6 months and drops to 1 per week at maturity. Each recipe takes 4 to 6 hours to produce (write, test in the kitchen, photograph, schema author, publish). At 3 recipes per week, the brand hits 78 recipes inside 6 months plus a backlog of ingredient comparison and sourcing content queued behind the recipe production line.
| Content pillar | Target volume year 1 | Production cost per piece | Refresh cadence |
|---|---|---|---|
| Recipe hub | 40 to 100 recipes | $180 to $320 | Every 12 months |
| Ingredient comparison guides | 12 to 24 guides | $450 to $780 | Every 18 months |
| Sourcing story pages | 6 to 12 pages | $680 to $1,200 | Every 24 months |
| Buyer intent content | 8 to 16 pieces | $220 to $420 | Every 12 months |
Photography as a content calendar constraint
Photography is the actual constraint on recipe cadence, not writing. Every recipe needs 6 to 12 photos: hero shot, ingredient flat lay, prep in progress, plated result, storage, and step shots for the schema markup. A working food brand batches photography 8 recipes at a time to keep the cost per recipe under 200 dollars. Skip the batching and the per-recipe cost climbs to 400 to 600 dollars, which caps recipe cadence at 1 per week and slows organic ranking timeline by 6 months.
Seasonal content calendar planning
Seasonal content calendar planning maps recipes and comparison guides to the seasonal windows they need to rank in. A Christmas cookie recipe needs to publish in September to rank by early December. A Valentine’s chocolate guide needs to publish in November to rank by early February. A back-to-school lunchbox recipe needs to publish in June to rank by late August. The 60-to-90-day ranking curve dictates the calendar.
Creator syndication inside food brand content
Creator syndication on food brand content marketing amplifies the recipe hub through Instagram Reels, TikTok, and YouTube Shorts creators paid to post their own version of the brand’s hero recipes. The creator content pulls net-new audiences into the recipe hub through the creator’s Link in Bio or Amazon Storefront tag. The syndication calendar names 12 to 30 creators per quarter with specific recipes assigned to each.
One brand we picked up had a spreadsheet titled “creator outreach 2023” with 47 rows and 3 responses. All 3 responses were auto-replies. The spreadsheet named zero recipes and offered flat rates below 100 dollars per post. Nobody posts a 30-second video for 87 dollars flat. Nobody.
Creator content commercial terms that work
Working creator content commercial terms run 350 to 1,500 dollars flat per post plus a 12 to 25 percent commission on tagged sales across a 30-day window. The commission mechanic pulls creators into follow-up posts because the incremental revenue continues past the initial fee. Mid-tier creators (30k to 150k followers) hit the sweet spot for food brand content because their engagement rate typically runs 4 to 8 percent versus 0.8 to 1.6 percent on mega-creators.
Content brief structure for creator partnerships
The content brief structure for creator partnerships runs a single page: the SKU, the specific recipe or usage occasion, 3 required brand mentions, 3 restricted claims (no health claims on non-medical SKUs), the pricing angle, the affiliate link, and 3 example videos that hit the tone. The brief avoids over-scripting because over-scripted creator content underperforms native creator voice by 40 to 60 percent on engagement rate.
Buyer intent content for food brand blogs
Buyer intent content on food brand blogs covers 8 to 16 pieces targeting explicit purchase-decision queries: “where to buy [brand],” “[brand] subscription vs. one-time,” “best [category] for [use case],” and “[brand] gift bundle.” Every buyer intent piece runs 1,400 to 2,400 words with a comparison table, product cards, and a clear conversion path to the specific SKU that matches the query intent. Buyer intent content converts at 3 to 6 percent versus 1 to 2 percent on recipe content because the shopper landed already planning to buy, not exploring a usage occasion.
Where-to-buy content structure
Where-to-buy content structure covers online (DTC storefront, Amazon, Target.com, Whole Foods online), retail (specific chain locators with the store finder embedded), and international (customs limitations, retailer partners abroad). Every piece names specific retailers, links to the store locator, and includes an FAQ block covering shipping availability, subscription options, and gift card compatibility. Where-to-buy content ranks for branded discovery queries the DTC storefront otherwise loses to competitor affiliate reviews.
Subscription versus one-time comparison content
Subscription versus one-time comparison content converts subscription commitments at 3 to 6 percent because it addresses the price-sensitivity concern head-on with a specific math table. The piece covers the discount structure (15 percent lifetime), the skip-a-month mechanic, the pause-anytime rule, the cancellation policy, and the specific yearly savings for the brand’s average consumption cadence. Cross-reference the retention structure on our food and beverage marketing retainer page.
Content refresh cadence on food brand pillars
Content refresh cadence on food brand content pillars runs a rolling audit every 12 to 24 months by pillar. Recipes get refreshed every 12 months with new photography, updated schema, and any nutrition or ingredient adjustments. Ingredient comparison guides refresh every 18 months to update market data. Sourcing story pages refresh every 24 months to reflect farm partnership changes and new harvest angles. Buyer intent content refreshes every 12 months to update retailer availability and pricing.
Recipe refresh priority order
Recipe refresh priority runs by organic traffic rank. The top 20 recipes by monthly organic sessions get refreshed first (new photography, schema audit, related recipe internal links, updated nutrition). The next 40 get refreshed at 15 months. The remaining recipes get refreshed opportunistically when the ranking slips past position 15 in Google. Skipping the refresh cadence lets recipe rankings drift out of the top 3 inside 18 months as newer competitor recipes take the position.
Schema audit checklist per refresh
The schema audit checklist per refresh runs 8 items: Recipe schema completeness, aggregateRating count and accuracy, nutrition data accuracy, prepTime and cookTime match the recipe body, image URLs valid at CDN, related recipe internal links working, product card SKU URL live, and Google Search Console rich result eligibility validated. This checklist takes 20 minutes per recipe and prevents the schema drift that costs recipe rankings 20 to 40 positions quietly.
Reporting cadence for food brand content marketing
Reporting cadence on food brand content marketing runs a monthly executive report plus a quarterly business review. The monthly report ships in the first business week and covers organic sessions by pillar, top 10 ranking recipes with position trend, ingredient guide ranking movements, sourcing page performance, and organic-attributed DTC revenue. Every number carries a comparison to the prior month and a plain-language interpretation the founder reads in 7 minutes.
Metrics that matter for content marketing
Metrics that matter for food brand content marketing: organic sessions by pillar, recipe rich result impressions in Search Console, organic conversion rate to hero SKU pages, organic-attributed DTC revenue, and top 20 ranking positions by monthly organic sessions. Vanity metrics that do not matter: total pageviews without conversion context, average time on page without conversion attribution, and social share counts. The monthly report skips the vanity block entirely.
Quarterly business review structure
The quarterly business review runs 90 minutes with the founder, head of content, and SEO lead. Agenda: organic traffic trend by pillar, top 10 winning content pieces, top 10 losing content pieces (candidates for refresh or removal), competitive gap analysis against 5 named competitor brands, and next quarter’s content calendar with recipes and ingredient guides queued. According to Ahrefs content marketing research, brands running quarterly content audits outperform brands running annual audits by 40 to 70 percent on organic revenue over a 24-month window.
Internal linking discipline across food brand content
Internal linking discipline across food brand content moves authority from recipe pages toward hero SKU product pages and comparison guides. Every recipe links to the hero SKU it uses inline (once in the ingredient list, once in a bottom call-out card). Every ingredient comparison guide links to 3 to 6 recipes using the winning ingredient plus the hero SKU product page. Every sourcing story links to the 2 to 4 SKUs sourced from that specific farm or cooperative.
Anchor text strategy across recipe hubs
Anchor text on internal links varies across recipe hubs to avoid over-optimization patterns Google penalizes. Exact-match anchor (“single-origin Ethiopian coffee”) runs on 20 to 30 percent of internal links. Partial-match variations (“our Ethiopian roast”) run on 30 to 40 percent. Branded anchors (the SKU name) run on 20 to 30 percent. Generic anchors (“shop the coffee”) fill the remaining 10 to 20 percent. This ratio holds ranking without triggering the over-optimization penalty that shows up on brands that anchor-text-stuff every internal link with the same exact-match keyword. Cross-reference the linking layer on our food and beverage web design page.
Link equity from ingredient guides to SKU pages
Link equity from ingredient guides passes to SKU pages when the guide’s comparison table names the hero SKU in the winning column with a product card, and when the guide’s body links to 3 to 6 recipes that use the winning ingredient. This 3-hop path (guide to recipe to SKU) pushes authority from a high-traffic informational query down to a high-intent transactional page. According to Search Engine Land SEO coverage, informational content that internally links to transactional pages produces 2 to 4 times higher organic revenue than isolated content silos.
Wrapping up content marketing for food brands
Content marketing for food brands is the organic engine that turns a DTC snack, drink, or CPG storefront into a search-driven revenue channel. Recipe hub of 40 to 100 recipes. Ingredient comparison guides at 12 to 24 pieces. Sourcing story pages at 6 to 12 pieces. Buyer intent content at 8 to 16 pieces. Creator syndication calendar with 12 to 30 creators per quarter. Refresh cadence at 12 to 24 months by pillar. Reporting with organic sessions and organic revenue attribution.
If your DTC food brand is running paid social at 20,000 dollars monthly with a broken blog and zero recipe schema, professional content marketing for food brands pays for itself inside the first 90 days on organic traffic captured. Redefine Web ships content marketing inside our monthly retainer packages. Book a call and we will walk through the last three DTC food brands we built recipe hubs for, pillar by pillar.
Anchor text on internal links varies across recipe hubs to avoid over-optimization patterns Google penalizes. Exact-match anchor (“single-origin Ethiopian coffee”) runs on 20 to 30 percent of internal links. Partial-match variations (“our Ethiopian roast”) run on 30 to 40 percent. Branded anchors (the SKU name) run on 20 to 30 percent. Generic anchors (“shop the coffee”) fill the remaining 10 to 20 percent. This ratio holds ranking without triggering the over-optimization penalty that shows up on brands that anchor-text-stuff every internal link with the same exact-match keyword. Cross-reference the linking layer on our food and beverage web design page.
Link equity from ingredient guides to SKU pages
Link equity from ingredient guides passes to SKU pages when the guide’s comparison table names the hero SKU in the winning column with a product card, and when the guide’s body links to 3 to 6 recipes that use the winning ingredient. This 3-hop path (guide to recipe to SKU) pushes authority from a high-traffic informational query down to a high-intent transactional page. According to Search Engine Land SEO coverage, informational content that internally links to transactional pages produces 2 to 4 times higher organic revenue than isolated content silos.
Wrapping up content marketing for food brands
Content marketing for food brands is the organic engine that turns a DTC snack, drink, or CPG storefront into a search-driven revenue channel. Recipe hub of 40 to 100 recipes. Ingredient comparison guides at 12 to 24 pieces. Sourcing story pages at 6 to 12 pieces. Buyer intent content at 8 to 16 pieces. Creator syndication calendar with 12 to 30 creators per quarter. Refresh cadence at 12 to 24 months by pillar. Reporting with organic sessions and organic revenue attribution.
If your DTC food brand is running paid social at 20,000 dollars monthly with a broken blog and zero recipe schema, professional content marketing for food brands pays for itself inside the first 90 days on organic traffic captured. Redefine Web ships content marketing inside our monthly retainer packages. Book a call and we will walk through the last three DTC food brands we built recipe hubs for, pillar by pillar.
Content marketing for food brands starts with a recipe hub because recipe queries account for 40 to 60 percent of high-intent search volume in the food category. Every hero SKU needs 4 to 12 recipes anchored to it, each targeting a specific occasion and audience.
Skip the recipe hub and the brand loses the search real estate that pulls DTC storefront traffic month over month at zero incremental paid cost. Recipe traffic converts at 2 to 4 percent because the shopper landed with usage intent, not passive discovery, which is why food brands win on recipes.
Recipe schema and Google rich result eligibility
Every recipe page ships schema.org Recipe markup including cookTime, prepTime, recipeIngredient, recipeInstructions, nutrition, and aggregateRating. Correctly marked-up recipes qualify for Google’s recipe rich result carousel that pulls 3 to 6 times higher click-through rate than a plain blue link. The schema layer takes 15 minutes per recipe to author and 30 minutes to validate in Google Search Console. Cross-reference the recipe search stack on our food and beverage SEO page.
Recipe hub structure that scales
The recipe hub structure runs 40 to 100 recipes at maturity, organized by hero SKU (4 to 12 recipes per SKU) plus occasion tags (breakfast, weeknight dinner, meal prep, brunch, holiday). Every recipe links back to the hero SKU product page with the SKU embedded in an inline card. The hub earns internal linking value from ingredient comparison guides and the sourcing story pages, which feeds recipe ranking on Google. According to Google Search Central recipe structured data guidance, complete Recipe schema markup is required for eligibility in the recipe carousel and the ingredient search filter.
Pillar structure for food brand content marketing
The pillar structure on content marketing for food brands runs 4 content pillars concurrently: recipe hub (40 to 100 recipes), ingredient comparison guides (12 to 24 guides), sourcing story pages (6 to 12 pages), and buyer intent content (where to buy, subscription vs. one-time, gift bundle guides). Every pillar covers a distinct search intent and every pillar links back to the hero SKU product pages.
Ingredient comparison guide format
Ingredient comparison guides run 1,800 to 3,200 words comparing 2 to 4 ingredient types on 6 to 10 attributes with a comparison table, real-world use case examples, and links to the hero SKU that uses the specific ingredient. Example: organic vs. conventional oats compares nutritional profile, sourcing chain, cost, environmental impact, and taste on a 6-column table. The brand’s SKU appears in the winning column with a product card. These guides rank 3 to 8 months after publication and pull steady-state organic traffic.
Sourcing story pages that build trust
Sourcing story pages name the specific farms, cooperatives, or suppliers the brand sources from, with photos of the farms, farmer quotes, and specific harvest windows. A coffee brand’s Ethiopian farm page ranks for “single-origin Ethiopian coffee” and “Yirgacheffe coffee origin” plus 40 long-tail variations. The sourcing page pulls trust-building traffic that converts at 4 to 6 percent because the shopper landed pattern-matching on transparency and named provenance. Every sourcing page includes farmer or cooperative quotes, harvest dates, and a link back to 3 to 5 hero SKU pages that source from the named supplier.
Vejrø hospitality content case study
Vejrø Resort, a Danish private-island destination with an on-site restaurant focused on organic, locally sourced cuisine, joined us with strong social engagement and no organic-search real estate. Guests found the resort on Instagram but never in Google search for terms like “private island resort Denmark,” “farm-to-table hospitality Denmark,” or “Vejrø restaurant.” The same organic-search gap shows up on DTC food brands running paid social at 20,000 dollars monthly with a broken blog and zero recipe schema.
We built the conversion-focused website with on-site and off-site SEO tuned to the travel-niche keyword clusters, competitor analysis against comparable boutique resorts, and mobile-first design prioritizing guest discovery. Every page carried the structured data qualifying it for Google’s rich results in the hospitality category. Every internal link pushed authority toward the direct-booking conversion path.
Three months later, Vejrø hit 10,000 plus organic visitors, ranked for 200 plus first-page keywords, and pulled a 2.2 percent booking conversion rate from organic traffic. The same pattern applies to content marketing for food brands: recipe schema, ingredient comparison guides, and sourcing story pages pull organic traffic at 20 to 40 percent conversion into hero SKU pages inside 6 months when the content quality matches search intent and every page carries the right structured data markup. Vejrø also proved out the reporting discipline: every monthly report named the exact page, the exact keyword cluster, and the exact search feature (rich result, sitelinks, image pack) driving the incremental organic revenue instead of hiding behind aggregate traffic charts.
Recipe cadence and content calendar for food brands
Recipe cadence on a working food brand content calendar ships 2 to 4 new recipes per week during the first 6 months and drops to 1 per week at maturity. Each recipe takes 4 to 6 hours to produce (write, test in the kitchen, photograph, schema author, publish). At 3 recipes per week, the brand hits 78 recipes inside 6 months plus a backlog of ingredient comparison and sourcing content queued behind the recipe production line.
| Content pillar | Target volume year 1 | Production cost per piece | Refresh cadence |
|---|---|---|---|
| Recipe hub | 40 to 100 recipes | $180 to $320 | Every 12 months |
| Ingredient comparison guides | 12 to 24 guides | $450 to $780 | Every 18 months |
| Sourcing story pages | 6 to 12 pages | $680 to $1,200 | Every 24 months |
| Buyer intent content | 8 to 16 pieces | $220 to $420 | Every 12 months |
Photography as a content calendar constraint
Photography is the actual constraint on recipe cadence, not writing. Every recipe needs 6 to 12 photos: hero shot, ingredient flat lay, prep in progress, plated result, storage, and step shots for the schema markup. A working food brand batches photography 8 recipes at a time to keep the cost per recipe under 200 dollars. Skip the batching and the per-recipe cost climbs to 400 to 600 dollars, which caps recipe cadence at 1 per week and slows organic ranking timeline by 6 months.
Seasonal content calendar planning
Seasonal content calendar planning maps recipes and comparison guides to the seasonal windows they need to rank in. A Christmas cookie recipe needs to publish in September to rank by early December. A Valentine’s chocolate guide needs to publish in November to rank by early February. A back-to-school lunchbox recipe needs to publish in June to rank by late August. The 60-to-90-day ranking curve dictates the calendar.
Creator syndication inside food brand content
Creator syndication on food brand content marketing amplifies the recipe hub through Instagram Reels, TikTok, and YouTube Shorts creators paid to post their own version of the brand’s hero recipes. The creator content pulls net-new audiences into the recipe hub through the creator’s Link in Bio or Amazon Storefront tag. The syndication calendar names 12 to 30 creators per quarter with specific recipes assigned to each.
One brand we picked up had a spreadsheet titled “creator outreach 2023” with 47 rows and 3 responses. All 3 responses were auto-replies. The spreadsheet named zero recipes and offered flat rates below 100 dollars per post. Nobody posts a 30-second video for 87 dollars flat. Nobody.
Creator content commercial terms that work
Working creator content commercial terms run 350 to 1,500 dollars flat per post plus a 12 to 25 percent commission on tagged sales across a 30-day window. The commission mechanic pulls creators into follow-up posts because the incremental revenue continues past the initial fee. Mid-tier creators (30k to 150k followers) hit the sweet spot for food brand content because their engagement rate typically runs 4 to 8 percent versus 0.8 to 1.6 percent on mega-creators.
Content brief structure for creator partnerships
The content brief structure for creator partnerships runs a single page: the SKU, the specific recipe or usage occasion, 3 required brand mentions, 3 restricted claims (no health claims on non-medical SKUs), the pricing angle, the affiliate link, and 3 example videos that hit the tone. The brief avoids over-scripting because over-scripted creator content underperforms native creator voice by 40 to 60 percent on engagement rate.
Buyer intent content for food brand blogs
Buyer intent content on food brand blogs covers 8 to 16 pieces targeting explicit purchase-decision queries: “where to buy [brand],” “[brand] subscription vs. one-time,” “best [category] for [use case],” and “[brand] gift bundle.” Every buyer intent piece runs 1,400 to 2,400 words with a comparison table, product cards, and a clear conversion path to the specific SKU that matches the query intent. Buyer intent content converts at 3 to 6 percent versus 1 to 2 percent on recipe content because the shopper landed already planning to buy, not exploring a usage occasion.
Where-to-buy content structure
Where-to-buy content structure covers online (DTC storefront, Amazon, Target.com, Whole Foods online), retail (specific chain locators with the store finder embedded), and international (customs limitations, retailer partners abroad). Every piece names specific retailers, links to the store locator, and includes an FAQ block covering shipping availability, subscription options, and gift card compatibility. Where-to-buy content ranks for branded discovery queries the DTC storefront otherwise loses to competitor affiliate reviews.
Subscription versus one-time comparison content
Subscription versus one-time comparison content converts subscription commitments at 3 to 6 percent because it addresses the price-sensitivity concern head-on with a specific math table. The piece covers the discount structure (15 percent lifetime), the skip-a-month mechanic, the pause-anytime rule, the cancellation policy, and the specific yearly savings for the brand’s average consumption cadence. Cross-reference the retention structure on our food and beverage marketing retainer page.
Content refresh cadence on food brand pillars
Content refresh cadence on food brand content pillars runs a rolling audit every 12 to 24 months by pillar. Recipes get refreshed every 12 months with new photography, updated schema, and any nutrition or ingredient adjustments. Ingredient comparison guides refresh every 18 months to update market data. Sourcing story pages refresh every 24 months to reflect farm partnership changes and new harvest angles. Buyer intent content refreshes every 12 months to update retailer availability and pricing.
Recipe refresh priority order
Recipe refresh priority runs by organic traffic rank. The top 20 recipes by monthly organic sessions get refreshed first (new photography, schema audit, related recipe internal links, updated nutrition). The next 40 get refreshed at 15 months. The remaining recipes get refreshed opportunistically when the ranking slips past position 15 in Google. Skipping the refresh cadence lets recipe rankings drift out of the top 3 inside 18 months as newer competitor recipes take the position.
Schema audit checklist per refresh
The schema audit checklist per refresh runs 8 items: Recipe schema completeness, aggregateRating count and accuracy, nutrition data accuracy, prepTime and cookTime match the recipe body, image URLs valid at CDN, related recipe internal links working, product card SKU URL live, and Google Search Console rich result eligibility validated. This checklist takes 20 minutes per recipe and prevents the schema drift that costs recipe rankings 20 to 40 positions quietly.
Reporting cadence for food brand content marketing
Reporting cadence on food brand content marketing runs a monthly executive report plus a quarterly business review. The monthly report ships in the first business week and covers organic sessions by pillar, top 10 ranking recipes with position trend, ingredient guide ranking movements, sourcing page performance, and organic-attributed DTC revenue. Every number carries a comparison to the prior month and a plain-language interpretation the founder reads in 7 minutes.
Metrics that matter for content marketing
Metrics that matter for food brand content marketing: organic sessions by pillar, recipe rich result impressions in Search Console, organic conversion rate to hero SKU pages, organic-attributed DTC revenue, and top 20 ranking positions by monthly organic sessions. Vanity metrics that do not matter: total pageviews without conversion context, average time on page without conversion attribution, and social share counts. The monthly report skips the vanity block entirely.
Quarterly business review structure
The quarterly business review runs 90 minutes with the founder, head of content, and SEO lead. Agenda: organic traffic trend by pillar, top 10 winning content pieces, top 10 losing content pieces (candidates for refresh or removal), competitive gap analysis against 5 named competitor brands, and next quarter’s content calendar with recipes and ingredient guides queued. According to Ahrefs content marketing research, brands running quarterly content audits outperform brands running annual audits by 40 to 70 percent on organic revenue over a 24-month window.
Internal linking discipline across food brand content
Internal linking discipline across food brand content moves authority from recipe pages toward hero SKU product pages and comparison guides. Every recipe links to the hero SKU it uses inline (once in the ingredient list, once in a bottom call-out card). Every ingredient comparison guide links to 3 to 6 recipes using the winning ingredient plus the hero SKU product page. Every sourcing story links to the 2 to 4 SKUs sourced from that specific farm or cooperative.
Anchor text strategy across recipe hubs
Anchor text on internal links varies across recipe hubs to avoid over-optimization patterns Google penalizes. Exact-match anchor (“single-origin Ethiopian coffee”) runs on 20 to 30 percent of internal links. Partial-match variations (“our Ethiopian roast”) run on 30 to 40 percent. Branded anchors (the SKU name) run on 20 to 30 percent. Generic anchors (“shop the coffee”) fill the remaining 10 to 20 percent. This ratio holds ranking without triggering the over-optimization penalty that shows up on brands that anchor-text-stuff every internal link with the same exact-match keyword. Cross-reference the linking layer on our food and beverage web design page.
Link equity from ingredient guides to SKU pages
Link equity from ingredient guides passes to SKU pages when the guide’s comparison table names the hero SKU in the winning column with a product card, and when the guide’s body links to 3 to 6 recipes that use the winning ingredient. This 3-hop path (guide to recipe to SKU) pushes authority from a high-traffic informational query down to a high-intent transactional page. According to Search Engine Land SEO coverage, informational content that internally links to transactional pages produces 2 to 4 times higher organic revenue than isolated content silos.
Wrapping up content marketing for food brands
Content marketing for food brands is the organic engine that turns a DTC snack, drink, or CPG storefront into a search-driven revenue channel. Recipe hub of 40 to 100 recipes. Ingredient comparison guides at 12 to 24 pieces. Sourcing story pages at 6 to 12 pieces. Buyer intent content at 8 to 16 pieces. Creator syndication calendar with 12 to 30 creators per quarter. Refresh cadence at 12 to 24 months by pillar. Reporting with organic sessions and organic revenue attribution.
If your DTC food brand is running paid social at 20,000 dollars monthly with a broken blog and zero recipe schema, professional content marketing for food brands pays for itself inside the first 90 days on organic traffic captured. Redefine Web ships content marketing inside our monthly retainer packages. Book a call and we will walk through the last three DTC food brands we built recipe hubs for, pillar by pillar.
Content marketing for food brands starts with a recipe hub because recipe queries account for 40 to 60 percent of high-intent search volume in the food category. Every hero SKU needs 4 to 12 recipes anchored to it, each targeting a specific occasion and audience.
Skip the recipe hub and the brand loses the search real estate that pulls DTC storefront traffic month over month at zero incremental paid cost. Recipe traffic converts at 2 to 4 percent because the shopper landed with usage intent, not passive discovery, which is why food brands win on recipes.
Recipe schema and Google rich result eligibility
Every recipe page ships schema.org Recipe markup including cookTime, prepTime, recipeIngredient, recipeInstructions, nutrition, and aggregateRating. Correctly marked-up recipes qualify for Google’s recipe rich result carousel that pulls 3 to 6 times higher click-through rate than a plain blue link. The schema layer takes 15 minutes per recipe to author and 30 minutes to validate in Google Search Console. Cross-reference the recipe search stack on our food and beverage SEO page.
Recipe hub structure that scales
The recipe hub structure runs 40 to 100 recipes at maturity, organized by hero SKU (4 to 12 recipes per SKU) plus occasion tags (breakfast, weeknight dinner, meal prep, brunch, holiday). Every recipe links back to the hero SKU product page with the SKU embedded in an inline card. The hub earns internal linking value from ingredient comparison guides and the sourcing story pages, which feeds recipe ranking on Google. According to Google Search Central recipe structured data guidance, complete Recipe schema markup is required for eligibility in the recipe carousel and the ingredient search filter.
Pillar structure for food brand content marketing
The pillar structure on content marketing for food brands runs 4 content pillars concurrently: recipe hub (40 to 100 recipes), ingredient comparison guides (12 to 24 guides), sourcing story pages (6 to 12 pages), and buyer intent content (where to buy, subscription vs. one-time, gift bundle guides). Every pillar covers a distinct search intent and every pillar links back to the hero SKU product pages.
Ingredient comparison guide format
Ingredient comparison guides run 1,800 to 3,200 words comparing 2 to 4 ingredient types on 6 to 10 attributes with a comparison table, real-world use case examples, and links to the hero SKU that uses the specific ingredient. Example: organic vs. conventional oats compares nutritional profile, sourcing chain, cost, environmental impact, and taste on a 6-column table. The brand’s SKU appears in the winning column with a product card. These guides rank 3 to 8 months after publication and pull steady-state organic traffic.
Sourcing story pages that build trust
Sourcing story pages name the specific farms, cooperatives, or suppliers the brand sources from, with photos of the farms, farmer quotes, and specific harvest windows. A coffee brand’s Ethiopian farm page ranks for “single-origin Ethiopian coffee” and “Yirgacheffe coffee origin” plus 40 long-tail variations. The sourcing page pulls trust-building traffic that converts at 4 to 6 percent because the shopper landed pattern-matching on transparency and named provenance. Every sourcing page includes farmer or cooperative quotes, harvest dates, and a link back to 3 to 5 hero SKU pages that source from the named supplier.
Vejrø hospitality content case study
Vejrø Resort, a Danish private-island destination with an on-site restaurant focused on organic, locally sourced cuisine, joined us with strong social engagement and no organic-search real estate. Guests found the resort on Instagram but never in Google search for terms like “private island resort Denmark,” “farm-to-table hospitality Denmark,” or “Vejrø restaurant.” The same organic-search gap shows up on DTC food brands running paid social at 20,000 dollars monthly with a broken blog and zero recipe schema.
We built the conversion-focused website with on-site and off-site SEO tuned to the travel-niche keyword clusters, competitor analysis against comparable boutique resorts, and mobile-first design prioritizing guest discovery. Every page carried the structured data qualifying it for Google’s rich results in the hospitality category. Every internal link pushed authority toward the direct-booking conversion path.
Three months later, Vejrø hit 10,000 plus organic visitors, ranked for 200 plus first-page keywords, and pulled a 2.2 percent booking conversion rate from organic traffic. The same pattern applies to content marketing for food brands: recipe schema, ingredient comparison guides, and sourcing story pages pull organic traffic at 20 to 40 percent conversion into hero SKU pages inside 6 months when the content quality matches search intent and every page carries the right structured data markup. Vejrø also proved out the reporting discipline: every monthly report named the exact page, the exact keyword cluster, and the exact search feature (rich result, sitelinks, image pack) driving the incremental organic revenue instead of hiding behind aggregate traffic charts.
Recipe cadence and content calendar for food brands
Recipe cadence on a working food brand content calendar ships 2 to 4 new recipes per week during the first 6 months and drops to 1 per week at maturity. Each recipe takes 4 to 6 hours to produce (write, test in the kitchen, photograph, schema author, publish). At 3 recipes per week, the brand hits 78 recipes inside 6 months plus a backlog of ingredient comparison and sourcing content queued behind the recipe production line.
| Content pillar | Target volume year 1 | Production cost per piece | Refresh cadence |
|---|---|---|---|
| Recipe hub | 40 to 100 recipes | $180 to $320 | Every 12 months |
| Ingredient comparison guides | 12 to 24 guides | $450 to $780 | Every 18 months |
| Sourcing story pages | 6 to 12 pages | $680 to $1,200 | Every 24 months |
| Buyer intent content | 8 to 16 pieces | $220 to $420 | Every 12 months |
Photography as a content calendar constraint
Photography is the actual constraint on recipe cadence, not writing. Every recipe needs 6 to 12 photos: hero shot, ingredient flat lay, prep in progress, plated result, storage, and step shots for the schema markup. A working food brand batches photography 8 recipes at a time to keep the cost per recipe under 200 dollars. Skip the batching and the per-recipe cost climbs to 400 to 600 dollars, which caps recipe cadence at 1 per week and slows organic ranking timeline by 6 months.
Seasonal content calendar planning
Seasonal content calendar planning maps recipes and comparison guides to the seasonal windows they need to rank in. A Christmas cookie recipe needs to publish in September to rank by early December. A Valentine’s chocolate guide needs to publish in November to rank by early February. A back-to-school lunchbox recipe needs to publish in June to rank by late August. The 60-to-90-day ranking curve dictates the calendar.
Creator syndication inside food brand content
Creator syndication on food brand content marketing amplifies the recipe hub through Instagram Reels, TikTok, and YouTube Shorts creators paid to post their own version of the brand’s hero recipes. The creator content pulls net-new audiences into the recipe hub through the creator’s Link in Bio or Amazon Storefront tag. The syndication calendar names 12 to 30 creators per quarter with specific recipes assigned to each.
One brand we picked up had a spreadsheet titled “creator outreach 2023” with 47 rows and 3 responses. All 3 responses were auto-replies. The spreadsheet named zero recipes and offered flat rates below 100 dollars per post. Nobody posts a 30-second video for 87 dollars flat. Nobody.
Creator content commercial terms that work
Working creator content commercial terms run 350 to 1,500 dollars flat per post plus a 12 to 25 percent commission on tagged sales across a 30-day window. The commission mechanic pulls creators into follow-up posts because the incremental revenue continues past the initial fee. Mid-tier creators (30k to 150k followers) hit the sweet spot for food brand content because their engagement rate typically runs 4 to 8 percent versus 0.8 to 1.6 percent on mega-creators.
Content brief structure for creator partnerships
The content brief structure for creator partnerships runs a single page: the SKU, the specific recipe or usage occasion, 3 required brand mentions, 3 restricted claims (no health claims on non-medical SKUs), the pricing angle, the affiliate link, and 3 example videos that hit the tone. The brief avoids over-scripting because over-scripted creator content underperforms native creator voice by 40 to 60 percent on engagement rate.
Buyer intent content for food brand blogs
Buyer intent content on food brand blogs covers 8 to 16 pieces targeting explicit purchase-decision queries: “where to buy [brand],” “[brand] subscription vs. one-time,” “best [category] for [use case],” and “[brand] gift bundle.” Every buyer intent piece runs 1,400 to 2,400 words with a comparison table, product cards, and a clear conversion path to the specific SKU that matches the query intent. Buyer intent content converts at 3 to 6 percent versus 1 to 2 percent on recipe content because the shopper landed already planning to buy, not exploring a usage occasion.
Where-to-buy content structure
Where-to-buy content structure covers online (DTC storefront, Amazon, Target.com, Whole Foods online), retail (specific chain locators with the store finder embedded), and international (customs limitations, retailer partners abroad). Every piece names specific retailers, links to the store locator, and includes an FAQ block covering shipping availability, subscription options, and gift card compatibility. Where-to-buy content ranks for branded discovery queries the DTC storefront otherwise loses to competitor affiliate reviews.
Subscription versus one-time comparison content
Subscription versus one-time comparison content converts subscription commitments at 3 to 6 percent because it addresses the price-sensitivity concern head-on with a specific math table. The piece covers the discount structure (15 percent lifetime), the skip-a-month mechanic, the pause-anytime rule, the cancellation policy, and the specific yearly savings for the brand’s average consumption cadence. Cross-reference the retention structure on our food and beverage marketing retainer page.
Content refresh cadence on food brand pillars
Content refresh cadence on food brand content pillars runs a rolling audit every 12 to 24 months by pillar. Recipes get refreshed every 12 months with new photography, updated schema, and any nutrition or ingredient adjustments. Ingredient comparison guides refresh every 18 months to update market data. Sourcing story pages refresh every 24 months to reflect farm partnership changes and new harvest angles. Buyer intent content refreshes every 12 months to update retailer availability and pricing.
Recipe refresh priority order
Recipe refresh priority runs by organic traffic rank. The top 20 recipes by monthly organic sessions get refreshed first (new photography, schema audit, related recipe internal links, updated nutrition). The next 40 get refreshed at 15 months. The remaining recipes get refreshed opportunistically when the ranking slips past position 15 in Google. Skipping the refresh cadence lets recipe rankings drift out of the top 3 inside 18 months as newer competitor recipes take the position.
Schema audit checklist per refresh
The schema audit checklist per refresh runs 8 items: Recipe schema completeness, aggregateRating count and accuracy, nutrition data accuracy, prepTime and cookTime match the recipe body, image URLs valid at CDN, related recipe internal links working, product card SKU URL live, and Google Search Console rich result eligibility validated. This checklist takes 20 minutes per recipe and prevents the schema drift that costs recipe rankings 20 to 40 positions quietly.
Reporting cadence for food brand content marketing
Reporting cadence on food brand content marketing runs a monthly executive report plus a quarterly business review. The monthly report ships in the first business week and covers organic sessions by pillar, top 10 ranking recipes with position trend, ingredient guide ranking movements, sourcing page performance, and organic-attributed DTC revenue. Every number carries a comparison to the prior month and a plain-language interpretation the founder reads in 7 minutes.
Metrics that matter for content marketing
Metrics that matter for food brand content marketing: organic sessions by pillar, recipe rich result impressions in Search Console, organic conversion rate to hero SKU pages, organic-attributed DTC revenue, and top 20 ranking positions by monthly organic sessions. Vanity metrics that do not matter: total pageviews without conversion context, average time on page without conversion attribution, and social share counts. The monthly report skips the vanity block entirely.
Quarterly business review structure
The quarterly business review runs 90 minutes with the founder, head of content, and SEO lead. Agenda: organic traffic trend by pillar, top 10 winning content pieces, top 10 losing content pieces (candidates for refresh or removal), competitive gap analysis against 5 named competitor brands, and next quarter’s content calendar with recipes and ingredient guides queued. According to Ahrefs content marketing research, brands running quarterly content audits outperform brands running annual audits by 40 to 70 percent on organic revenue over a 24-month window.
Internal linking discipline across food brand content
Internal linking discipline across food brand content moves authority from recipe pages toward hero SKU product pages and comparison guides. Every recipe links to the hero SKU it uses inline (once in the ingredient list, once in a bottom call-out card). Every ingredient comparison guide links to 3 to 6 recipes using the winning ingredient plus the hero SKU product page. Every sourcing story links to the 2 to 4 SKUs sourced from that specific farm or cooperative.
Anchor text strategy across recipe hubs
Anchor text on internal links varies across recipe hubs to avoid over-optimization patterns Google penalizes. Exact-match anchor (“single-origin Ethiopian coffee”) runs on 20 to 30 percent of internal links. Partial-match variations (“our Ethiopian roast”) run on 30 to 40 percent. Branded anchors (the SKU name) run on 20 to 30 percent. Generic anchors (“shop the coffee”) fill the remaining 10 to 20 percent. This ratio holds ranking without triggering the over-optimization penalty that shows up on brands that anchor-text-stuff every internal link with the same exact-match keyword. Cross-reference the linking layer on our food and beverage web design page.
Link equity from ingredient guides to SKU pages
Link equity from ingredient guides passes to SKU pages when the guide’s comparison table names the hero SKU in the winning column with a product card, and when the guide’s body links to 3 to 6 recipes that use the winning ingredient. This 3-hop path (guide to recipe to SKU) pushes authority from a high-traffic informational query down to a high-intent transactional page. According to Search Engine Land SEO coverage, informational content that internally links to transactional pages produces 2 to 4 times higher organic revenue than isolated content silos.
Wrapping up content marketing for food brands
Content marketing for food brands is the organic engine that turns a DTC snack, drink, or CPG storefront into a search-driven revenue channel. Recipe hub of 40 to 100 recipes. Ingredient comparison guides at 12 to 24 pieces. Sourcing story pages at 6 to 12 pieces. Buyer intent content at 8 to 16 pieces. Creator syndication calendar with 12 to 30 creators per quarter. Refresh cadence at 12 to 24 months by pillar. Reporting with organic sessions and organic revenue attribution.
If your DTC food brand is running paid social at 20,000 dollars monthly with a broken blog and zero recipe schema, professional content marketing for food brands pays for itself inside the first 90 days on organic traffic captured. Redefine Web ships content marketing inside our monthly retainer packages. Book a call and we will walk through the last three DTC food brands we built recipe hubs for, pillar by pillar.
Internal linking discipline across food brand content moves authority from recipe pages toward hero SKU product pages and comparison guides. Every recipe links to the hero SKU it uses inline (once in the ingredient list, once in a bottom call-out card). Every ingredient comparison guide links to 3 to 6 recipes using the winning ingredient plus the hero SKU product page. Every sourcing story links to the 2 to 4 SKUs sourced from that specific farm or cooperative.
Anchor text strategy across recipe hubs
Anchor text on internal links varies across recipe hubs to avoid over-optimization patterns Google penalizes. Exact-match anchor (“single-origin Ethiopian coffee”) runs on 20 to 30 percent of internal links. Partial-match variations (“our Ethiopian roast”) run on 30 to 40 percent. Branded anchors (the SKU name) run on 20 to 30 percent. Generic anchors (“shop the coffee”) fill the remaining 10 to 20 percent. This ratio holds ranking without triggering the over-optimization penalty that shows up on brands that anchor-text-stuff every internal link with the same exact-match keyword. Cross-reference the linking layer on our food and beverage web design page.
Link equity from ingredient guides to SKU pages
Link equity from ingredient guides passes to SKU pages when the guide’s comparison table names the hero SKU in the winning column with a product card, and when the guide’s body links to 3 to 6 recipes that use the winning ingredient. This 3-hop path (guide to recipe to SKU) pushes authority from a high-traffic informational query down to a high-intent transactional page. According to Search Engine Land SEO coverage, informational content that internally links to transactional pages produces 2 to 4 times higher organic revenue than isolated content silos.
Wrapping up content marketing for food brands
Content marketing for food brands is the organic engine that turns a DTC snack, drink, or CPG storefront into a search-driven revenue channel. Recipe hub of 40 to 100 recipes. Ingredient comparison guides at 12 to 24 pieces. Sourcing story pages at 6 to 12 pieces. Buyer intent content at 8 to 16 pieces. Creator syndication calendar with 12 to 30 creators per quarter. Refresh cadence at 12 to 24 months by pillar. Reporting with organic sessions and organic revenue attribution.
If your DTC food brand is running paid social at 20,000 dollars monthly with a broken blog and zero recipe schema, professional content marketing for food brands pays for itself inside the first 90 days on organic traffic captured. Redefine Web ships content marketing inside our monthly retainer packages. Book a call and we will walk through the last three DTC food brands we built recipe hubs for, pillar by pillar.
Content marketing for food brands starts with a recipe hub because recipe queries account for 40 to 60 percent of high-intent search volume in the food category. Every hero SKU needs 4 to 12 recipes anchored to it, each targeting a specific occasion and audience.
Skip the recipe hub and the brand loses the search real estate that pulls DTC storefront traffic month over month at zero incremental paid cost. Recipe traffic converts at 2 to 4 percent because the shopper landed with usage intent, not passive discovery, which is why food brands win on recipes.
Recipe schema and Google rich result eligibility
Every recipe page ships schema.org Recipe markup including cookTime, prepTime, recipeIngredient, recipeInstructions, nutrition, and aggregateRating. Correctly marked-up recipes qualify for Google’s recipe rich result carousel that pulls 3 to 6 times higher click-through rate than a plain blue link. The schema layer takes 15 minutes per recipe to author and 30 minutes to validate in Google Search Console. Cross-reference the recipe search stack on our food and beverage SEO page.
Recipe hub structure that scales
The recipe hub structure runs 40 to 100 recipes at maturity, organized by hero SKU (4 to 12 recipes per SKU) plus occasion tags (breakfast, weeknight dinner, meal prep, brunch, holiday). Every recipe links back to the hero SKU product page with the SKU embedded in an inline card. The hub earns internal linking value from ingredient comparison guides and the sourcing story pages, which feeds recipe ranking on Google. According to Google Search Central recipe structured data guidance, complete Recipe schema markup is required for eligibility in the recipe carousel and the ingredient search filter.
Pillar structure for food brand content marketing
The pillar structure on content marketing for food brands runs 4 content pillars concurrently: recipe hub (40 to 100 recipes), ingredient comparison guides (12 to 24 guides), sourcing story pages (6 to 12 pages), and buyer intent content (where to buy, subscription vs. one-time, gift bundle guides). Every pillar covers a distinct search intent and every pillar links back to the hero SKU product pages.
Ingredient comparison guide format
Ingredient comparison guides run 1,800 to 3,200 words comparing 2 to 4 ingredient types on 6 to 10 attributes with a comparison table, real-world use case examples, and links to the hero SKU that uses the specific ingredient. Example: organic vs. conventional oats compares nutritional profile, sourcing chain, cost, environmental impact, and taste on a 6-column table. The brand’s SKU appears in the winning column with a product card. These guides rank 3 to 8 months after publication and pull steady-state organic traffic.
Sourcing story pages that build trust
Sourcing story pages name the specific farms, cooperatives, or suppliers the brand sources from, with photos of the farms, farmer quotes, and specific harvest windows. A coffee brand’s Ethiopian farm page ranks for “single-origin Ethiopian coffee” and “Yirgacheffe coffee origin” plus 40 long-tail variations. The sourcing page pulls trust-building traffic that converts at 4 to 6 percent because the shopper landed pattern-matching on transparency and named provenance. Every sourcing page includes farmer or cooperative quotes, harvest dates, and a link back to 3 to 5 hero SKU pages that source from the named supplier.
Vejrø hospitality content case study
Vejrø Resort, a Danish private-island destination with an on-site restaurant focused on organic, locally sourced cuisine, joined us with strong social engagement and no organic-search real estate. Guests found the resort on Instagram but never in Google search for terms like “private island resort Denmark,” “farm-to-table hospitality Denmark,” or “Vejrø restaurant.” The same organic-search gap shows up on DTC food brands running paid social at 20,000 dollars monthly with a broken blog and zero recipe schema.
We built the conversion-focused website with on-site and off-site SEO tuned to the travel-niche keyword clusters, competitor analysis against comparable boutique resorts, and mobile-first design prioritizing guest discovery. Every page carried the structured data qualifying it for Google’s rich results in the hospitality category. Every internal link pushed authority toward the direct-booking conversion path.
Three months later, Vejrø hit 10,000 plus organic visitors, ranked for 200 plus first-page keywords, and pulled a 2.2 percent booking conversion rate from organic traffic. The same pattern applies to content marketing for food brands: recipe schema, ingredient comparison guides, and sourcing story pages pull organic traffic at 20 to 40 percent conversion into hero SKU pages inside 6 months when the content quality matches search intent and every page carries the right structured data markup. Vejrø also proved out the reporting discipline: every monthly report named the exact page, the exact keyword cluster, and the exact search feature (rich result, sitelinks, image pack) driving the incremental organic revenue instead of hiding behind aggregate traffic charts.
Recipe cadence and content calendar for food brands
Recipe cadence on a working food brand content calendar ships 2 to 4 new recipes per week during the first 6 months and drops to 1 per week at maturity. Each recipe takes 4 to 6 hours to produce (write, test in the kitchen, photograph, schema author, publish). At 3 recipes per week, the brand hits 78 recipes inside 6 months plus a backlog of ingredient comparison and sourcing content queued behind the recipe production line.
| Content pillar | Target volume year 1 | Production cost per piece | Refresh cadence |
|---|---|---|---|
| Recipe hub | 40 to 100 recipes | $180 to $320 | Every 12 months |
| Ingredient comparison guides | 12 to 24 guides | $450 to $780 | Every 18 months |
| Sourcing story pages | 6 to 12 pages | $680 to $1,200 | Every 24 months |
| Buyer intent content | 8 to 16 pieces | $220 to $420 | Every 12 months |
Photography as a content calendar constraint
Photography is the actual constraint on recipe cadence, not writing. Every recipe needs 6 to 12 photos: hero shot, ingredient flat lay, prep in progress, plated result, storage, and step shots for the schema markup. A working food brand batches photography 8 recipes at a time to keep the cost per recipe under 200 dollars. Skip the batching and the per-recipe cost climbs to 400 to 600 dollars, which caps recipe cadence at 1 per week and slows organic ranking timeline by 6 months.
Seasonal content calendar planning
Seasonal content calendar planning maps recipes and comparison guides to the seasonal windows they need to rank in. A Christmas cookie recipe needs to publish in September to rank by early December. A Valentine’s chocolate guide needs to publish in November to rank by early February. A back-to-school lunchbox recipe needs to publish in June to rank by late August. The 60-to-90-day ranking curve dictates the calendar.
Creator syndication inside food brand content
Creator syndication on food brand content marketing amplifies the recipe hub through Instagram Reels, TikTok, and YouTube Shorts creators paid to post their own version of the brand’s hero recipes. The creator content pulls net-new audiences into the recipe hub through the creator’s Link in Bio or Amazon Storefront tag. The syndication calendar names 12 to 30 creators per quarter with specific recipes assigned to each.
One brand we picked up had a spreadsheet titled “creator outreach 2023” with 47 rows and 3 responses. All 3 responses were auto-replies. The spreadsheet named zero recipes and offered flat rates below 100 dollars per post. Nobody posts a 30-second video for 87 dollars flat. Nobody.
Creator content commercial terms that work
Working creator content commercial terms run 350 to 1,500 dollars flat per post plus a 12 to 25 percent commission on tagged sales across a 30-day window. The commission mechanic pulls creators into follow-up posts because the incremental revenue continues past the initial fee. Mid-tier creators (30k to 150k followers) hit the sweet spot for food brand content because their engagement rate typically runs 4 to 8 percent versus 0.8 to 1.6 percent on mega-creators.
Content brief structure for creator partnerships
The content brief structure for creator partnerships runs a single page: the SKU, the specific recipe or usage occasion, 3 required brand mentions, 3 restricted claims (no health claims on non-medical SKUs), the pricing angle, the affiliate link, and 3 example videos that hit the tone. The brief avoids over-scripting because over-scripted creator content underperforms native creator voice by 40 to 60 percent on engagement rate.
Buyer intent content for food brand blogs
Buyer intent content on food brand blogs covers 8 to 16 pieces targeting explicit purchase-decision queries: “where to buy [brand],” “[brand] subscription vs. one-time,” “best [category] for [use case],” and “[brand] gift bundle.” Every buyer intent piece runs 1,400 to 2,400 words with a comparison table, product cards, and a clear conversion path to the specific SKU that matches the query intent. Buyer intent content converts at 3 to 6 percent versus 1 to 2 percent on recipe content because the shopper landed already planning to buy, not exploring a usage occasion.
Where-to-buy content structure
Where-to-buy content structure covers online (DTC storefront, Amazon, Target.com, Whole Foods online), retail (specific chain locators with the store finder embedded), and international (customs limitations, retailer partners abroad). Every piece names specific retailers, links to the store locator, and includes an FAQ block covering shipping availability, subscription options, and gift card compatibility. Where-to-buy content ranks for branded discovery queries the DTC storefront otherwise loses to competitor affiliate reviews.
Subscription versus one-time comparison content
Subscription versus one-time comparison content converts subscription commitments at 3 to 6 percent because it addresses the price-sensitivity concern head-on with a specific math table. The piece covers the discount structure (15 percent lifetime), the skip-a-month mechanic, the pause-anytime rule, the cancellation policy, and the specific yearly savings for the brand’s average consumption cadence. Cross-reference the retention structure on our food and beverage marketing retainer page.
Content refresh cadence on food brand pillars
Content refresh cadence on food brand content pillars runs a rolling audit every 12 to 24 months by pillar. Recipes get refreshed every 12 months with new photography, updated schema, and any nutrition or ingredient adjustments. Ingredient comparison guides refresh every 18 months to update market data. Sourcing story pages refresh every 24 months to reflect farm partnership changes and new harvest angles. Buyer intent content refreshes every 12 months to update retailer availability and pricing.
Recipe refresh priority order
Recipe refresh priority runs by organic traffic rank. The top 20 recipes by monthly organic sessions get refreshed first (new photography, schema audit, related recipe internal links, updated nutrition). The next 40 get refreshed at 15 months. The remaining recipes get refreshed opportunistically when the ranking slips past position 15 in Google. Skipping the refresh cadence lets recipe rankings drift out of the top 3 inside 18 months as newer competitor recipes take the position.
Schema audit checklist per refresh
The schema audit checklist per refresh runs 8 items: Recipe schema completeness, aggregateRating count and accuracy, nutrition data accuracy, prepTime and cookTime match the recipe body, image URLs valid at CDN, related recipe internal links working, product card SKU URL live, and Google Search Console rich result eligibility validated. This checklist takes 20 minutes per recipe and prevents the schema drift that costs recipe rankings 20 to 40 positions quietly.
Reporting cadence for food brand content marketing
Reporting cadence on food brand content marketing runs a monthly executive report plus a quarterly business review. The monthly report ships in the first business week and covers organic sessions by pillar, top 10 ranking recipes with position trend, ingredient guide ranking movements, sourcing page performance, and organic-attributed DTC revenue. Every number carries a comparison to the prior month and a plain-language interpretation the founder reads in 7 minutes.
Metrics that matter for content marketing
Metrics that matter for food brand content marketing: organic sessions by pillar, recipe rich result impressions in Search Console, organic conversion rate to hero SKU pages, organic-attributed DTC revenue, and top 20 ranking positions by monthly organic sessions. Vanity metrics that do not matter: total pageviews without conversion context, average time on page without conversion attribution, and social share counts. The monthly report skips the vanity block entirely.
Quarterly business review structure
The quarterly business review runs 90 minutes with the founder, head of content, and SEO lead. Agenda: organic traffic trend by pillar, top 10 winning content pieces, top 10 losing content pieces (candidates for refresh or removal), competitive gap analysis against 5 named competitor brands, and next quarter’s content calendar with recipes and ingredient guides queued. According to Ahrefs content marketing research, brands running quarterly content audits outperform brands running annual audits by 40 to 70 percent on organic revenue over a 24-month window.
Internal linking discipline across food brand content
Internal linking discipline across food brand content moves authority from recipe pages toward hero SKU product pages and comparison guides. Every recipe links to the hero SKU it uses inline (once in the ingredient list, once in a bottom call-out card). Every ingredient comparison guide links to 3 to 6 recipes using the winning ingredient plus the hero SKU product page. Every sourcing story links to the 2 to 4 SKUs sourced from that specific farm or cooperative.
Anchor text strategy across recipe hubs
Anchor text on internal links varies across recipe hubs to avoid over-optimization patterns Google penalizes. Exact-match anchor (“single-origin Ethiopian coffee”) runs on 20 to 30 percent of internal links. Partial-match variations (“our Ethiopian roast”) run on 30 to 40 percent. Branded anchors (the SKU name) run on 20 to 30 percent. Generic anchors (“shop the coffee”) fill the remaining 10 to 20 percent. This ratio holds ranking without triggering the over-optimization penalty that shows up on brands that anchor-text-stuff every internal link with the same exact-match keyword. Cross-reference the linking layer on our food and beverage web design page.
Link equity from ingredient guides to SKU pages
Link equity from ingredient guides passes to SKU pages when the guide’s comparison table names the hero SKU in the winning column with a product card, and when the guide’s body links to 3 to 6 recipes that use the winning ingredient. This 3-hop path (guide to recipe to SKU) pushes authority from a high-traffic informational query down to a high-intent transactional page. According to Search Engine Land SEO coverage, informational content that internally links to transactional pages produces 2 to 4 times higher organic revenue than isolated content silos.
Wrapping up content marketing for food brands
Content marketing for food brands is the organic engine that turns a DTC snack, drink, or CPG storefront into a search-driven revenue channel. Recipe hub of 40 to 100 recipes. Ingredient comparison guides at 12 to 24 pieces. Sourcing story pages at 6 to 12 pieces. Buyer intent content at 8 to 16 pieces. Creator syndication calendar with 12 to 30 creators per quarter. Refresh cadence at 12 to 24 months by pillar. Reporting with organic sessions and organic revenue attribution.
If your DTC food brand is running paid social at 20,000 dollars monthly with a broken blog and zero recipe schema, professional content marketing for food brands pays for itself inside the first 90 days on organic traffic captured. Redefine Web ships content marketing inside our monthly retainer packages. Book a call and we will walk through the last three DTC food brands we built recipe hubs for, pillar by pillar.
Content marketing for food brands starts with a recipe hub because recipe queries account for 40 to 60 percent of high-intent search volume in the food category. Every hero SKU needs 4 to 12 recipes anchored to it, each targeting a specific occasion and audience.
Skip the recipe hub and the brand loses the search real estate that pulls DTC storefront traffic month over month at zero incremental paid cost. Recipe traffic converts at 2 to 4 percent because the shopper landed with usage intent, not passive discovery, which is why food brands win on recipes.
Recipe schema and Google rich result eligibility
Every recipe page ships schema.org Recipe markup including cookTime, prepTime, recipeIngredient, recipeInstructions, nutrition, and aggregateRating. Correctly marked-up recipes qualify for Google’s recipe rich result carousel that pulls 3 to 6 times higher click-through rate than a plain blue link. The schema layer takes 15 minutes per recipe to author and 30 minutes to validate in Google Search Console. Cross-reference the recipe search stack on our food and beverage SEO page.
Recipe hub structure that scales
The recipe hub structure runs 40 to 100 recipes at maturity, organized by hero SKU (4 to 12 recipes per SKU) plus occasion tags (breakfast, weeknight dinner, meal prep, brunch, holiday). Every recipe links back to the hero SKU product page with the SKU embedded in an inline card. The hub earns internal linking value from ingredient comparison guides and the sourcing story pages, which feeds recipe ranking on Google. According to Google Search Central recipe structured data guidance, complete Recipe schema markup is required for eligibility in the recipe carousel and the ingredient search filter.
Pillar structure for food brand content marketing
The pillar structure on content marketing for food brands runs 4 content pillars concurrently: recipe hub (40 to 100 recipes), ingredient comparison guides (12 to 24 guides), sourcing story pages (6 to 12 pages), and buyer intent content (where to buy, subscription vs. one-time, gift bundle guides). Every pillar covers a distinct search intent and every pillar links back to the hero SKU product pages.
Ingredient comparison guide format
Ingredient comparison guides run 1,800 to 3,200 words comparing 2 to 4 ingredient types on 6 to 10 attributes with a comparison table, real-world use case examples, and links to the hero SKU that uses the specific ingredient. Example: organic vs. conventional oats compares nutritional profile, sourcing chain, cost, environmental impact, and taste on a 6-column table. The brand’s SKU appears in the winning column with a product card. These guides rank 3 to 8 months after publication and pull steady-state organic traffic.
Sourcing story pages that build trust
Sourcing story pages name the specific farms, cooperatives, or suppliers the brand sources from, with photos of the farms, farmer quotes, and specific harvest windows. A coffee brand’s Ethiopian farm page ranks for “single-origin Ethiopian coffee” and “Yirgacheffe coffee origin” plus 40 long-tail variations. The sourcing page pulls trust-building traffic that converts at 4 to 6 percent because the shopper landed pattern-matching on transparency and named provenance. Every sourcing page includes farmer or cooperative quotes, harvest dates, and a link back to 3 to 5 hero SKU pages that source from the named supplier.
Vejrø hospitality content case study
Vejrø Resort, a Danish private-island destination with an on-site restaurant focused on organic, locally sourced cuisine, joined us with strong social engagement and no organic-search real estate. Guests found the resort on Instagram but never in Google search for terms like “private island resort Denmark,” “farm-to-table hospitality Denmark,” or “Vejrø restaurant.” The same organic-search gap shows up on DTC food brands running paid social at 20,000 dollars monthly with a broken blog and zero recipe schema.
We built the conversion-focused website with on-site and off-site SEO tuned to the travel-niche keyword clusters, competitor analysis against comparable boutique resorts, and mobile-first design prioritizing guest discovery. Every page carried the structured data qualifying it for Google’s rich results in the hospitality category. Every internal link pushed authority toward the direct-booking conversion path.
Three months later, Vejrø hit 10,000 plus organic visitors, ranked for 200 plus first-page keywords, and pulled a 2.2 percent booking conversion rate from organic traffic. The same pattern applies to content marketing for food brands: recipe schema, ingredient comparison guides, and sourcing story pages pull organic traffic at 20 to 40 percent conversion into hero SKU pages inside 6 months when the content quality matches search intent and every page carries the right structured data markup. Vejrø also proved out the reporting discipline: every monthly report named the exact page, the exact keyword cluster, and the exact search feature (rich result, sitelinks, image pack) driving the incremental organic revenue instead of hiding behind aggregate traffic charts.
Recipe cadence and content calendar for food brands
Recipe cadence on a working food brand content calendar ships 2 to 4 new recipes per week during the first 6 months and drops to 1 per week at maturity. Each recipe takes 4 to 6 hours to produce (write, test in the kitchen, photograph, schema author, publish). At 3 recipes per week, the brand hits 78 recipes inside 6 months plus a backlog of ingredient comparison and sourcing content queued behind the recipe production line.
| Content pillar | Target volume year 1 | Production cost per piece | Refresh cadence |
|---|---|---|---|
| Recipe hub | 40 to 100 recipes | $180 to $320 | Every 12 months |
| Ingredient comparison guides | 12 to 24 guides | $450 to $780 | Every 18 months |
| Sourcing story pages | 6 to 12 pages | $680 to $1,200 | Every 24 months |
| Buyer intent content | 8 to 16 pieces | $220 to $420 | Every 12 months |
Photography as a content calendar constraint
Photography is the actual constraint on recipe cadence, not writing. Every recipe needs 6 to 12 photos: hero shot, ingredient flat lay, prep in progress, plated result, storage, and step shots for the schema markup. A working food brand batches photography 8 recipes at a time to keep the cost per recipe under 200 dollars. Skip the batching and the per-recipe cost climbs to 400 to 600 dollars, which caps recipe cadence at 1 per week and slows organic ranking timeline by 6 months.
Seasonal content calendar planning
Seasonal content calendar planning maps recipes and comparison guides to the seasonal windows they need to rank in. A Christmas cookie recipe needs to publish in September to rank by early December. A Valentine’s chocolate guide needs to publish in November to rank by early February. A back-to-school lunchbox recipe needs to publish in June to rank by late August. The 60-to-90-day ranking curve dictates the calendar.
Creator syndication inside food brand content
Creator syndication on food brand content marketing amplifies the recipe hub through Instagram Reels, TikTok, and YouTube Shorts creators paid to post their own version of the brand’s hero recipes. The creator content pulls net-new audiences into the recipe hub through the creator’s Link in Bio or Amazon Storefront tag. The syndication calendar names 12 to 30 creators per quarter with specific recipes assigned to each.
One brand we picked up had a spreadsheet titled “creator outreach 2023” with 47 rows and 3 responses. All 3 responses were auto-replies. The spreadsheet named zero recipes and offered flat rates below 100 dollars per post. Nobody posts a 30-second video for 87 dollars flat. Nobody.
Creator content commercial terms that work
Working creator content commercial terms run 350 to 1,500 dollars flat per post plus a 12 to 25 percent commission on tagged sales across a 30-day window. The commission mechanic pulls creators into follow-up posts because the incremental revenue continues past the initial fee. Mid-tier creators (30k to 150k followers) hit the sweet spot for food brand content because their engagement rate typically runs 4 to 8 percent versus 0.8 to 1.6 percent on mega-creators.
Content brief structure for creator partnerships
The content brief structure for creator partnerships runs a single page: the SKU, the specific recipe or usage occasion, 3 required brand mentions, 3 restricted claims (no health claims on non-medical SKUs), the pricing angle, the affiliate link, and 3 example videos that hit the tone. The brief avoids over-scripting because over-scripted creator content underperforms native creator voice by 40 to 60 percent on engagement rate.
Buyer intent content for food brand blogs
Buyer intent content on food brand blogs covers 8 to 16 pieces targeting explicit purchase-decision queries: “where to buy [brand],” “[brand] subscription vs. one-time,” “best [category] for [use case],” and “[brand] gift bundle.” Every buyer intent piece runs 1,400 to 2,400 words with a comparison table, product cards, and a clear conversion path to the specific SKU that matches the query intent. Buyer intent content converts at 3 to 6 percent versus 1 to 2 percent on recipe content because the shopper landed already planning to buy, not exploring a usage occasion.
Where-to-buy content structure
Where-to-buy content structure covers online (DTC storefront, Amazon, Target.com, Whole Foods online), retail (specific chain locators with the store finder embedded), and international (customs limitations, retailer partners abroad). Every piece names specific retailers, links to the store locator, and includes an FAQ block covering shipping availability, subscription options, and gift card compatibility. Where-to-buy content ranks for branded discovery queries the DTC storefront otherwise loses to competitor affiliate reviews.
Subscription versus one-time comparison content
Subscription versus one-time comparison content converts subscription commitments at 3 to 6 percent because it addresses the price-sensitivity concern head-on with a specific math table. The piece covers the discount structure (15 percent lifetime), the skip-a-month mechanic, the pause-anytime rule, the cancellation policy, and the specific yearly savings for the brand’s average consumption cadence. Cross-reference the retention structure on our food and beverage marketing retainer page.
Content refresh cadence on food brand pillars
Content refresh cadence on food brand content pillars runs a rolling audit every 12 to 24 months by pillar. Recipes get refreshed every 12 months with new photography, updated schema, and any nutrition or ingredient adjustments. Ingredient comparison guides refresh every 18 months to update market data. Sourcing story pages refresh every 24 months to reflect farm partnership changes and new harvest angles. Buyer intent content refreshes every 12 months to update retailer availability and pricing.
Recipe refresh priority order
Recipe refresh priority runs by organic traffic rank. The top 20 recipes by monthly organic sessions get refreshed first (new photography, schema audit, related recipe internal links, updated nutrition). The next 40 get refreshed at 15 months. The remaining recipes get refreshed opportunistically when the ranking slips past position 15 in Google. Skipping the refresh cadence lets recipe rankings drift out of the top 3 inside 18 months as newer competitor recipes take the position.
Schema audit checklist per refresh
The schema audit checklist per refresh runs 8 items: Recipe schema completeness, aggregateRating count and accuracy, nutrition data accuracy, prepTime and cookTime match the recipe body, image URLs valid at CDN, related recipe internal links working, product card SKU URL live, and Google Search Console rich result eligibility validated. This checklist takes 20 minutes per recipe and prevents the schema drift that costs recipe rankings 20 to 40 positions quietly.
Reporting cadence for food brand content marketing
Reporting cadence on food brand content marketing runs a monthly executive report plus a quarterly business review. The monthly report ships in the first business week and covers organic sessions by pillar, top 10 ranking recipes with position trend, ingredient guide ranking movements, sourcing page performance, and organic-attributed DTC revenue. Every number carries a comparison to the prior month and a plain-language interpretation the founder reads in 7 minutes.
Metrics that matter for content marketing
Metrics that matter for food brand content marketing: organic sessions by pillar, recipe rich result impressions in Search Console, organic conversion rate to hero SKU pages, organic-attributed DTC revenue, and top 20 ranking positions by monthly organic sessions. Vanity metrics that do not matter: total pageviews without conversion context, average time on page without conversion attribution, and social share counts. The monthly report skips the vanity block entirely.
Quarterly business review structure
The quarterly business review runs 90 minutes with the founder, head of content, and SEO lead. Agenda: organic traffic trend by pillar, top 10 winning content pieces, top 10 losing content pieces (candidates for refresh or removal), competitive gap analysis against 5 named competitor brands, and next quarter’s content calendar with recipes and ingredient guides queued. According to Ahrefs content marketing research, brands running quarterly content audits outperform brands running annual audits by 40 to 70 percent on organic revenue over a 24-month window.
Internal linking discipline across food brand content
Internal linking discipline across food brand content moves authority from recipe pages toward hero SKU product pages and comparison guides. Every recipe links to the hero SKU it uses inline (once in the ingredient list, once in a bottom call-out card). Every ingredient comparison guide links to 3 to 6 recipes using the winning ingredient plus the hero SKU product page. Every sourcing story links to the 2 to 4 SKUs sourced from that specific farm or cooperative.
Anchor text strategy across recipe hubs
Anchor text on internal links varies across recipe hubs to avoid over-optimization patterns Google penalizes. Exact-match anchor (“single-origin Ethiopian coffee”) runs on 20 to 30 percent of internal links. Partial-match variations (“our Ethiopian roast”) run on 30 to 40 percent. Branded anchors (the SKU name) run on 20 to 30 percent. Generic anchors (“shop the coffee”) fill the remaining 10 to 20 percent. This ratio holds ranking without triggering the over-optimization penalty that shows up on brands that anchor-text-stuff every internal link with the same exact-match keyword. Cross-reference the linking layer on our food and beverage web design page.
Link equity from ingredient guides to SKU pages
Link equity from ingredient guides passes to SKU pages when the guide’s comparison table names the hero SKU in the winning column with a product card, and when the guide’s body links to 3 to 6 recipes that use the winning ingredient. This 3-hop path (guide to recipe to SKU) pushes authority from a high-traffic informational query down to a high-intent transactional page. According to Search Engine Land SEO coverage, informational content that internally links to transactional pages produces 2 to 4 times higher organic revenue than isolated content silos.
Wrapping up content marketing for food brands
Content marketing for food brands is the organic engine that turns a DTC snack, drink, or CPG storefront into a search-driven revenue channel. Recipe hub of 40 to 100 recipes. Ingredient comparison guides at 12 to 24 pieces. Sourcing story pages at 6 to 12 pieces. Buyer intent content at 8 to 16 pieces. Creator syndication calendar with 12 to 30 creators per quarter. Refresh cadence at 12 to 24 months by pillar. Reporting with organic sessions and organic revenue attribution.
If your DTC food brand is running paid social at 20,000 dollars monthly with a broken blog and zero recipe schema, professional content marketing for food brands pays for itself inside the first 90 days on organic traffic captured. Redefine Web ships content marketing inside our monthly retainer packages. Book a call and we will walk through the last three DTC food brands we built recipe hubs for, pillar by pillar.
Anchor text on internal links varies across recipe hubs to avoid over-optimization patterns Google penalizes. Exact-match anchor (“single-origin Ethiopian coffee”) runs on 20 to 30 percent of internal links. Partial-match variations (“our Ethiopian roast”) run on 30 to 40 percent. Branded anchors (the SKU name) run on 20 to 30 percent. Generic anchors (“shop the coffee”) fill the remaining 10 to 20 percent. This ratio holds ranking without triggering the over-optimization penalty that shows up on brands that anchor-text-stuff every internal link with the same exact-match keyword. Cross-reference the linking layer on our food and beverage web design page.
Link equity from ingredient guides to SKU pages
Link equity from ingredient guides passes to SKU pages when the guide’s comparison table names the hero SKU in the winning column with a product card, and when the guide’s body links to 3 to 6 recipes that use the winning ingredient. This 3-hop path (guide to recipe to SKU) pushes authority from a high-traffic informational query down to a high-intent transactional page. According to Search Engine Land SEO coverage, informational content that internally links to transactional pages produces 2 to 4 times higher organic revenue than isolated content silos.
Wrapping up content marketing for food brands
Content marketing for food brands is the organic engine that turns a DTC snack, drink, or CPG storefront into a search-driven revenue channel. Recipe hub of 40 to 100 recipes. Ingredient comparison guides at 12 to 24 pieces. Sourcing story pages at 6 to 12 pieces. Buyer intent content at 8 to 16 pieces. Creator syndication calendar with 12 to 30 creators per quarter. Refresh cadence at 12 to 24 months by pillar. Reporting with organic sessions and organic revenue attribution.
If your DTC food brand is running paid social at 20,000 dollars monthly with a broken blog and zero recipe schema, professional content marketing for food brands pays for itself inside the first 90 days on organic traffic captured. Redefine Web ships content marketing inside our monthly retainer packages. Book a call and we will walk through the last three DTC food brands we built recipe hubs for, pillar by pillar.
Internal linking discipline across food brand content moves authority from recipe pages toward hero SKU product pages and comparison guides. Every recipe links to the hero SKU it uses inline (once in the ingredient list, once in a bottom call-out card). Every ingredient comparison guide links to 3 to 6 recipes using the winning ingredient plus the hero SKU product page. Every sourcing story links to the 2 to 4 SKUs sourced from that specific farm or cooperative.
Anchor text strategy across recipe hubs
Anchor text on internal links varies across recipe hubs to avoid over-optimization patterns Google penalizes. Exact-match anchor (“single-origin Ethiopian coffee”) runs on 20 to 30 percent of internal links. Partial-match variations (“our Ethiopian roast”) run on 30 to 40 percent. Branded anchors (the SKU name) run on 20 to 30 percent. Generic anchors (“shop the coffee”) fill the remaining 10 to 20 percent. This ratio holds ranking without triggering the over-optimization penalty that shows up on brands that anchor-text-stuff every internal link with the same exact-match keyword. Cross-reference the linking layer on our food and beverage web design page.
Link equity from ingredient guides to SKU pages
Link equity from ingredient guides passes to SKU pages when the guide’s comparison table names the hero SKU in the winning column with a product card, and when the guide’s body links to 3 to 6 recipes that use the winning ingredient. This 3-hop path (guide to recipe to SKU) pushes authority from a high-traffic informational query down to a high-intent transactional page. According to Search Engine Land SEO coverage, informational content that internally links to transactional pages produces 2 to 4 times higher organic revenue than isolated content silos.
Wrapping up content marketing for food brands
Content marketing for food brands is the organic engine that turns a DTC snack, drink, or CPG storefront into a search-driven revenue channel. Recipe hub of 40 to 100 recipes. Ingredient comparison guides at 12 to 24 pieces. Sourcing story pages at 6 to 12 pieces. Buyer intent content at 8 to 16 pieces. Creator syndication calendar with 12 to 30 creators per quarter. Refresh cadence at 12 to 24 months by pillar. Reporting with organic sessions and organic revenue attribution.
If your DTC food brand is running paid social at 20,000 dollars monthly with a broken blog and zero recipe schema, professional content marketing for food brands pays for itself inside the first 90 days on organic traffic captured. Redefine Web ships content marketing inside our monthly retainer packages. Book a call and we will walk through the last three DTC food brands we built recipe hubs for, pillar by pillar.
Content marketing for food brands starts with a recipe hub because recipe queries account for 40 to 60 percent of high-intent search volume in the food category. Every hero SKU needs 4 to 12 recipes anchored to it, each targeting a specific occasion and audience.
Skip the recipe hub and the brand loses the search real estate that pulls DTC storefront traffic month over month at zero incremental paid cost. Recipe traffic converts at 2 to 4 percent because the shopper landed with usage intent, not passive discovery, which is why food brands win on recipes.
Recipe schema and Google rich result eligibility
Every recipe page ships schema.org Recipe markup including cookTime, prepTime, recipeIngredient, recipeInstructions, nutrition, and aggregateRating. Correctly marked-up recipes qualify for Google’s recipe rich result carousel that pulls 3 to 6 times higher click-through rate than a plain blue link. The schema layer takes 15 minutes per recipe to author and 30 minutes to validate in Google Search Console. Cross-reference the recipe search stack on our food and beverage SEO page.
Recipe hub structure that scales
The recipe hub structure runs 40 to 100 recipes at maturity, organized by hero SKU (4 to 12 recipes per SKU) plus occasion tags (breakfast, weeknight dinner, meal prep, brunch, holiday). Every recipe links back to the hero SKU product page with the SKU embedded in an inline card. The hub earns internal linking value from ingredient comparison guides and the sourcing story pages, which feeds recipe ranking on Google. According to Google Search Central recipe structured data guidance, complete Recipe schema markup is required for eligibility in the recipe carousel and the ingredient search filter.
Pillar structure for food brand content marketing
The pillar structure on content marketing for food brands runs 4 content pillars concurrently: recipe hub (40 to 100 recipes), ingredient comparison guides (12 to 24 guides), sourcing story pages (6 to 12 pages), and buyer intent content (where to buy, subscription vs. one-time, gift bundle guides). Every pillar covers a distinct search intent and every pillar links back to the hero SKU product pages.
Ingredient comparison guide format
Ingredient comparison guides run 1,800 to 3,200 words comparing 2 to 4 ingredient types on 6 to 10 attributes with a comparison table, real-world use case examples, and links to the hero SKU that uses the specific ingredient. Example: organic vs. conventional oats compares nutritional profile, sourcing chain, cost, environmental impact, and taste on a 6-column table. The brand’s SKU appears in the winning column with a product card. These guides rank 3 to 8 months after publication and pull steady-state organic traffic.
Sourcing story pages that build trust
Sourcing story pages name the specific farms, cooperatives, or suppliers the brand sources from, with photos of the farms, farmer quotes, and specific harvest windows. A coffee brand’s Ethiopian farm page ranks for “single-origin Ethiopian coffee” and “Yirgacheffe coffee origin” plus 40 long-tail variations. The sourcing page pulls trust-building traffic that converts at 4 to 6 percent because the shopper landed pattern-matching on transparency and named provenance. Every sourcing page includes farmer or cooperative quotes, harvest dates, and a link back to 3 to 5 hero SKU pages that source from the named supplier.
Vejrø hospitality content case study
Vejrø Resort, a Danish private-island destination with an on-site restaurant focused on organic, locally sourced cuisine, joined us with strong social engagement and no organic-search real estate. Guests found the resort on Instagram but never in Google search for terms like “private island resort Denmark,” “farm-to-table hospitality Denmark,” or “Vejrø restaurant.” The same organic-search gap shows up on DTC food brands running paid social at 20,000 dollars monthly with a broken blog and zero recipe schema.
We built the conversion-focused website with on-site and off-site SEO tuned to the travel-niche keyword clusters, competitor analysis against comparable boutique resorts, and mobile-first design prioritizing guest discovery. Every page carried the structured data qualifying it for Google’s rich results in the hospitality category. Every internal link pushed authority toward the direct-booking conversion path.
Three months later, Vejrø hit 10,000 plus organic visitors, ranked for 200 plus first-page keywords, and pulled a 2.2 percent booking conversion rate from organic traffic. The same pattern applies to content marketing for food brands: recipe schema, ingredient comparison guides, and sourcing story pages pull organic traffic at 20 to 40 percent conversion into hero SKU pages inside 6 months when the content quality matches search intent and every page carries the right structured data markup. Vejrø also proved out the reporting discipline: every monthly report named the exact page, the exact keyword cluster, and the exact search feature (rich result, sitelinks, image pack) driving the incremental organic revenue instead of hiding behind aggregate traffic charts.
Recipe cadence and content calendar for food brands
Recipe cadence on a working food brand content calendar ships 2 to 4 new recipes per week during the first 6 months and drops to 1 per week at maturity. Each recipe takes 4 to 6 hours to produce (write, test in the kitchen, photograph, schema author, publish). At 3 recipes per week, the brand hits 78 recipes inside 6 months plus a backlog of ingredient comparison and sourcing content queued behind the recipe production line.
| Content pillar | Target volume year 1 | Production cost per piece | Refresh cadence |
|---|---|---|---|
| Recipe hub | 40 to 100 recipes | $180 to $320 | Every 12 months |
| Ingredient comparison guides | 12 to 24 guides | $450 to $780 | Every 18 months |
| Sourcing story pages | 6 to 12 pages | $680 to $1,200 | Every 24 months |
| Buyer intent content | 8 to 16 pieces | $220 to $420 | Every 12 months |
Photography as a content calendar constraint
Photography is the actual constraint on recipe cadence, not writing. Every recipe needs 6 to 12 photos: hero shot, ingredient flat lay, prep in progress, plated result, storage, and step shots for the schema markup. A working food brand batches photography 8 recipes at a time to keep the cost per recipe under 200 dollars. Skip the batching and the per-recipe cost climbs to 400 to 600 dollars, which caps recipe cadence at 1 per week and slows organic ranking timeline by 6 months.
Seasonal content calendar planning
Seasonal content calendar planning maps recipes and comparison guides to the seasonal windows they need to rank in. A Christmas cookie recipe needs to publish in September to rank by early December. A Valentine’s chocolate guide needs to publish in November to rank by early February. A back-to-school lunchbox recipe needs to publish in June to rank by late August. The 60-to-90-day ranking curve dictates the calendar.
Creator syndication inside food brand content
Creator syndication on food brand content marketing amplifies the recipe hub through Instagram Reels, TikTok, and YouTube Shorts creators paid to post their own version of the brand’s hero recipes. The creator content pulls net-new audiences into the recipe hub through the creator’s Link in Bio or Amazon Storefront tag. The syndication calendar names 12 to 30 creators per quarter with specific recipes assigned to each.
One brand we picked up had a spreadsheet titled “creator outreach 2023” with 47 rows and 3 responses. All 3 responses were auto-replies. The spreadsheet named zero recipes and offered flat rates below 100 dollars per post. Nobody posts a 30-second video for 87 dollars flat. Nobody.
Creator content commercial terms that work
Working creator content commercial terms run 350 to 1,500 dollars flat per post plus a 12 to 25 percent commission on tagged sales across a 30-day window. The commission mechanic pulls creators into follow-up posts because the incremental revenue continues past the initial fee. Mid-tier creators (30k to 150k followers) hit the sweet spot for food brand content because their engagement rate typically runs 4 to 8 percent versus 0.8 to 1.6 percent on mega-creators.
Content brief structure for creator partnerships
The content brief structure for creator partnerships runs a single page: the SKU, the specific recipe or usage occasion, 3 required brand mentions, 3 restricted claims (no health claims on non-medical SKUs), the pricing angle, the affiliate link, and 3 example videos that hit the tone. The brief avoids over-scripting because over-scripted creator content underperforms native creator voice by 40 to 60 percent on engagement rate.
Buyer intent content for food brand blogs
Buyer intent content on food brand blogs covers 8 to 16 pieces targeting explicit purchase-decision queries: “where to buy [brand],” “[brand] subscription vs. one-time,” “best [category] for [use case],” and “[brand] gift bundle.” Every buyer intent piece runs 1,400 to 2,400 words with a comparison table, product cards, and a clear conversion path to the specific SKU that matches the query intent. Buyer intent content converts at 3 to 6 percent versus 1 to 2 percent on recipe content because the shopper landed already planning to buy, not exploring a usage occasion.
Where-to-buy content structure
Where-to-buy content structure covers online (DTC storefront, Amazon, Target.com, Whole Foods online), retail (specific chain locators with the store finder embedded), and international (customs limitations, retailer partners abroad). Every piece names specific retailers, links to the store locator, and includes an FAQ block covering shipping availability, subscription options, and gift card compatibility. Where-to-buy content ranks for branded discovery queries the DTC storefront otherwise loses to competitor affiliate reviews.
Subscription versus one-time comparison content
Subscription versus one-time comparison content converts subscription commitments at 3 to 6 percent because it addresses the price-sensitivity concern head-on with a specific math table. The piece covers the discount structure (15 percent lifetime), the skip-a-month mechanic, the pause-anytime rule, the cancellation policy, and the specific yearly savings for the brand’s average consumption cadence. Cross-reference the retention structure on our food and beverage marketing retainer page.
Content refresh cadence on food brand pillars
Content refresh cadence on food brand content pillars runs a rolling audit every 12 to 24 months by pillar. Recipes get refreshed every 12 months with new photography, updated schema, and any nutrition or ingredient adjustments. Ingredient comparison guides refresh every 18 months to update market data. Sourcing story pages refresh every 24 months to reflect farm partnership changes and new harvest angles. Buyer intent content refreshes every 12 months to update retailer availability and pricing.
Recipe refresh priority order
Recipe refresh priority runs by organic traffic rank. The top 20 recipes by monthly organic sessions get refreshed first (new photography, schema audit, related recipe internal links, updated nutrition). The next 40 get refreshed at 15 months. The remaining recipes get refreshed opportunistically when the ranking slips past position 15 in Google. Skipping the refresh cadence lets recipe rankings drift out of the top 3 inside 18 months as newer competitor recipes take the position.
Schema audit checklist per refresh
The schema audit checklist per refresh runs 8 items: Recipe schema completeness, aggregateRating count and accuracy, nutrition data accuracy, prepTime and cookTime match the recipe body, image URLs valid at CDN, related recipe internal links working, product card SKU URL live, and Google Search Console rich result eligibility validated. This checklist takes 20 minutes per recipe and prevents the schema drift that costs recipe rankings 20 to 40 positions quietly.
Reporting cadence for food brand content marketing
Reporting cadence on food brand content marketing runs a monthly executive report plus a quarterly business review. The monthly report ships in the first business week and covers organic sessions by pillar, top 10 ranking recipes with position trend, ingredient guide ranking movements, sourcing page performance, and organic-attributed DTC revenue. Every number carries a comparison to the prior month and a plain-language interpretation the founder reads in 7 minutes.
Metrics that matter for content marketing
Metrics that matter for food brand content marketing: organic sessions by pillar, recipe rich result impressions in Search Console, organic conversion rate to hero SKU pages, organic-attributed DTC revenue, and top 20 ranking positions by monthly organic sessions. Vanity metrics that do not matter: total pageviews without conversion context, average time on page without conversion attribution, and social share counts. The monthly report skips the vanity block entirely.
Quarterly business review structure
The quarterly business review runs 90 minutes with the founder, head of content, and SEO lead. Agenda: organic traffic trend by pillar, top 10 winning content pieces, top 10 losing content pieces (candidates for refresh or removal), competitive gap analysis against 5 named competitor brands, and next quarter’s content calendar with recipes and ingredient guides queued. According to Ahrefs content marketing research, brands running quarterly content audits outperform brands running annual audits by 40 to 70 percent on organic revenue over a 24-month window.
Internal linking discipline across food brand content
Internal linking discipline across food brand content moves authority from recipe pages toward hero SKU product pages and comparison guides. Every recipe links to the hero SKU it uses inline (once in the ingredient list, once in a bottom call-out card). Every ingredient comparison guide links to 3 to 6 recipes using the winning ingredient plus the hero SKU product page. Every sourcing story links to the 2 to 4 SKUs sourced from that specific farm or cooperative.
Anchor text strategy across recipe hubs
Anchor text on internal links varies across recipe hubs to avoid over-optimization patterns Google penalizes. Exact-match anchor (“single-origin Ethiopian coffee”) runs on 20 to 30 percent of internal links. Partial-match variations (“our Ethiopian roast”) run on 30 to 40 percent. Branded anchors (the SKU name) run on 20 to 30 percent. Generic anchors (“shop the coffee”) fill the remaining 10 to 20 percent. This ratio holds ranking without triggering the over-optimization penalty that shows up on brands that anchor-text-stuff every internal link with the same exact-match keyword. Cross-reference the linking layer on our food and beverage web design page.
Link equity from ingredient guides to SKU pages
Link equity from ingredient guides passes to SKU pages when the guide’s comparison table names the hero SKU in the winning column with a product card, and when the guide’s body links to 3 to 6 recipes that use the winning ingredient. This 3-hop path (guide to recipe to SKU) pushes authority from a high-traffic informational query down to a high-intent transactional page. According to Search Engine Land SEO coverage, informational content that internally links to transactional pages produces 2 to 4 times higher organic revenue than isolated content silos.
Wrapping up content marketing for food brands
Content marketing for food brands is the organic engine that turns a DTC snack, drink, or CPG storefront into a search-driven revenue channel. Recipe hub of 40 to 100 recipes. Ingredient comparison guides at 12 to 24 pieces. Sourcing story pages at 6 to 12 pieces. Buyer intent content at 8 to 16 pieces. Creator syndication calendar with 12 to 30 creators per quarter. Refresh cadence at 12 to 24 months by pillar. Reporting with organic sessions and organic revenue attribution.
If your DTC food brand is running paid social at 20,000 dollars monthly with a broken blog and zero recipe schema, professional content marketing for food brands pays for itself inside the first 90 days on organic traffic captured. Redefine Web ships content marketing inside our monthly retainer packages. Book a call and we will walk through the last three DTC food brands we built recipe hubs for, pillar by pillar.
Content marketing for food brands starts with a recipe hub because recipe queries account for 40 to 60 percent of high-intent search volume in the food category. Every hero SKU needs 4 to 12 recipes anchored to it, each targeting a specific occasion and audience.
Skip the recipe hub and the brand loses the search real estate that pulls DTC storefront traffic month over month at zero incremental paid cost. Recipe traffic converts at 2 to 4 percent because the shopper landed with usage intent, not passive discovery, which is why food brands win on recipes.
Recipe schema and Google rich result eligibility
Every recipe page ships schema.org Recipe markup including cookTime, prepTime, recipeIngredient, recipeInstructions, nutrition, and aggregateRating. Correctly marked-up recipes qualify for Google’s recipe rich result carousel that pulls 3 to 6 times higher click-through rate than a plain blue link. The schema layer takes 15 minutes per recipe to author and 30 minutes to validate in Google Search Console. Cross-reference the recipe search stack on our food and beverage SEO page.
Recipe hub structure that scales
The recipe hub structure runs 40 to 100 recipes at maturity, organized by hero SKU (4 to 12 recipes per SKU) plus occasion tags (breakfast, weeknight dinner, meal prep, brunch, holiday). Every recipe links back to the hero SKU product page with the SKU embedded in an inline card. The hub earns internal linking value from ingredient comparison guides and the sourcing story pages, which feeds recipe ranking on Google. According to Google Search Central recipe structured data guidance, complete Recipe schema markup is required for eligibility in the recipe carousel and the ingredient search filter.
Pillar structure for food brand content marketing
The pillar structure on content marketing for food brands runs 4 content pillars concurrently: recipe hub (40 to 100 recipes), ingredient comparison guides (12 to 24 guides), sourcing story pages (6 to 12 pages), and buyer intent content (where to buy, subscription vs. one-time, gift bundle guides). Every pillar covers a distinct search intent and every pillar links back to the hero SKU product pages.
Ingredient comparison guide format
Ingredient comparison guides run 1,800 to 3,200 words comparing 2 to 4 ingredient types on 6 to 10 attributes with a comparison table, real-world use case examples, and links to the hero SKU that uses the specific ingredient. Example: organic vs. conventional oats compares nutritional profile, sourcing chain, cost, environmental impact, and taste on a 6-column table. The brand’s SKU appears in the winning column with a product card. These guides rank 3 to 8 months after publication and pull steady-state organic traffic.
Sourcing story pages that build trust
Sourcing story pages name the specific farms, cooperatives, or suppliers the brand sources from, with photos of the farms, farmer quotes, and specific harvest windows. A coffee brand’s Ethiopian farm page ranks for “single-origin Ethiopian coffee” and “Yirgacheffe coffee origin” plus 40 long-tail variations. The sourcing page pulls trust-building traffic that converts at 4 to 6 percent because the shopper landed pattern-matching on transparency and named provenance. Every sourcing page includes farmer or cooperative quotes, harvest dates, and a link back to 3 to 5 hero SKU pages that source from the named supplier.
Vejrø hospitality content case study
Vejrø Resort, a Danish private-island destination with an on-site restaurant focused on organic, locally sourced cuisine, joined us with strong social engagement and no organic-search real estate. Guests found the resort on Instagram but never in Google search for terms like “private island resort Denmark,” “farm-to-table hospitality Denmark,” or “Vejrø restaurant.” The same organic-search gap shows up on DTC food brands running paid social at 20,000 dollars monthly with a broken blog and zero recipe schema.
We built the conversion-focused website with on-site and off-site SEO tuned to the travel-niche keyword clusters, competitor analysis against comparable boutique resorts, and mobile-first design prioritizing guest discovery. Every page carried the structured data qualifying it for Google’s rich results in the hospitality category. Every internal link pushed authority toward the direct-booking conversion path.
Three months later, Vejrø hit 10,000 plus organic visitors, ranked for 200 plus first-page keywords, and pulled a 2.2 percent booking conversion rate from organic traffic. The same pattern applies to content marketing for food brands: recipe schema, ingredient comparison guides, and sourcing story pages pull organic traffic at 20 to 40 percent conversion into hero SKU pages inside 6 months when the content quality matches search intent and every page carries the right structured data markup. Vejrø also proved out the reporting discipline: every monthly report named the exact page, the exact keyword cluster, and the exact search feature (rich result, sitelinks, image pack) driving the incremental organic revenue instead of hiding behind aggregate traffic charts.
Recipe cadence and content calendar for food brands
Recipe cadence on a working food brand content calendar ships 2 to 4 new recipes per week during the first 6 months and drops to 1 per week at maturity. Each recipe takes 4 to 6 hours to produce (write, test in the kitchen, photograph, schema author, publish). At 3 recipes per week, the brand hits 78 recipes inside 6 months plus a backlog of ingredient comparison and sourcing content queued behind the recipe production line.
| Content pillar | Target volume year 1 | Production cost per piece | Refresh cadence |
|---|---|---|---|
| Recipe hub | 40 to 100 recipes | $180 to $320 | Every 12 months |
| Ingredient comparison guides | 12 to 24 guides | $450 to $780 | Every 18 months |
| Sourcing story pages | 6 to 12 pages | $680 to $1,200 | Every 24 months |
| Buyer intent content | 8 to 16 pieces | $220 to $420 | Every 12 months |
Photography as a content calendar constraint
Photography is the actual constraint on recipe cadence, not writing. Every recipe needs 6 to 12 photos: hero shot, ingredient flat lay, prep in progress, plated result, storage, and step shots for the schema markup. A working food brand batches photography 8 recipes at a time to keep the cost per recipe under 200 dollars. Skip the batching and the per-recipe cost climbs to 400 to 600 dollars, which caps recipe cadence at 1 per week and slows organic ranking timeline by 6 months.
Seasonal content calendar planning
Seasonal content calendar planning maps recipes and comparison guides to the seasonal windows they need to rank in. A Christmas cookie recipe needs to publish in September to rank by early December. A Valentine’s chocolate guide needs to publish in November to rank by early February. A back-to-school lunchbox recipe needs to publish in June to rank by late August. The 60-to-90-day ranking curve dictates the calendar.
Creator syndication inside food brand content
Creator syndication on food brand content marketing amplifies the recipe hub through Instagram Reels, TikTok, and YouTube Shorts creators paid to post their own version of the brand’s hero recipes. The creator content pulls net-new audiences into the recipe hub through the creator’s Link in Bio or Amazon Storefront tag. The syndication calendar names 12 to 30 creators per quarter with specific recipes assigned to each.
One brand we picked up had a spreadsheet titled “creator outreach 2023” with 47 rows and 3 responses. All 3 responses were auto-replies. The spreadsheet named zero recipes and offered flat rates below 100 dollars per post. Nobody posts a 30-second video for 87 dollars flat. Nobody.
Creator content commercial terms that work
Working creator content commercial terms run 350 to 1,500 dollars flat per post plus a 12 to 25 percent commission on tagged sales across a 30-day window. The commission mechanic pulls creators into follow-up posts because the incremental revenue continues past the initial fee. Mid-tier creators (30k to 150k followers) hit the sweet spot for food brand content because their engagement rate typically runs 4 to 8 percent versus 0.8 to 1.6 percent on mega-creators.
Content brief structure for creator partnerships
The content brief structure for creator partnerships runs a single page: the SKU, the specific recipe or usage occasion, 3 required brand mentions, 3 restricted claims (no health claims on non-medical SKUs), the pricing angle, the affiliate link, and 3 example videos that hit the tone. The brief avoids over-scripting because over-scripted creator content underperforms native creator voice by 40 to 60 percent on engagement rate.
Buyer intent content for food brand blogs
Buyer intent content on food brand blogs covers 8 to 16 pieces targeting explicit purchase-decision queries: “where to buy [brand],” “[brand] subscription vs. one-time,” “best [category] for [use case],” and “[brand] gift bundle.” Every buyer intent piece runs 1,400 to 2,400 words with a comparison table, product cards, and a clear conversion path to the specific SKU that matches the query intent. Buyer intent content converts at 3 to 6 percent versus 1 to 2 percent on recipe content because the shopper landed already planning to buy, not exploring a usage occasion.
Where-to-buy content structure
Where-to-buy content structure covers online (DTC storefront, Amazon, Target.com, Whole Foods online), retail (specific chain locators with the store finder embedded), and international (customs limitations, retailer partners abroad). Every piece names specific retailers, links to the store locator, and includes an FAQ block covering shipping availability, subscription options, and gift card compatibility. Where-to-buy content ranks for branded discovery queries the DTC storefront otherwise loses to competitor affiliate reviews.
Subscription versus one-time comparison content
Subscription versus one-time comparison content converts subscription commitments at 3 to 6 percent because it addresses the price-sensitivity concern head-on with a specific math table. The piece covers the discount structure (15 percent lifetime), the skip-a-month mechanic, the pause-anytime rule, the cancellation policy, and the specific yearly savings for the brand’s average consumption cadence. Cross-reference the retention structure on our food and beverage marketing retainer page.
Content refresh cadence on food brand pillars
Content refresh cadence on food brand content pillars runs a rolling audit every 12 to 24 months by pillar. Recipes get refreshed every 12 months with new photography, updated schema, and any nutrition or ingredient adjustments. Ingredient comparison guides refresh every 18 months to update market data. Sourcing story pages refresh every 24 months to reflect farm partnership changes and new harvest angles. Buyer intent content refreshes every 12 months to update retailer availability and pricing.
Recipe refresh priority order
Recipe refresh priority runs by organic traffic rank. The top 20 recipes by monthly organic sessions get refreshed first (new photography, schema audit, related recipe internal links, updated nutrition). The next 40 get refreshed at 15 months. The remaining recipes get refreshed opportunistically when the ranking slips past position 15 in Google. Skipping the refresh cadence lets recipe rankings drift out of the top 3 inside 18 months as newer competitor recipes take the position.
Schema audit checklist per refresh
The schema audit checklist per refresh runs 8 items: Recipe schema completeness, aggregateRating count and accuracy, nutrition data accuracy, prepTime and cookTime match the recipe body, image URLs valid at CDN, related recipe internal links working, product card SKU URL live, and Google Search Console rich result eligibility validated. This checklist takes 20 minutes per recipe and prevents the schema drift that costs recipe rankings 20 to 40 positions quietly.
Reporting cadence for food brand content marketing
Reporting cadence on food brand content marketing runs a monthly executive report plus a quarterly business review. The monthly report ships in the first business week and covers organic sessions by pillar, top 10 ranking recipes with position trend, ingredient guide ranking movements, sourcing page performance, and organic-attributed DTC revenue. Every number carries a comparison to the prior month and a plain-language interpretation the founder reads in 7 minutes.
Metrics that matter for content marketing
Metrics that matter for food brand content marketing: organic sessions by pillar, recipe rich result impressions in Search Console, organic conversion rate to hero SKU pages, organic-attributed DTC revenue, and top 20 ranking positions by monthly organic sessions. Vanity metrics that do not matter: total pageviews without conversion context, average time on page without conversion attribution, and social share counts. The monthly report skips the vanity block entirely.
Quarterly business review structure
The quarterly business review runs 90 minutes with the founder, head of content, and SEO lead. Agenda: organic traffic trend by pillar, top 10 winning content pieces, top 10 losing content pieces (candidates for refresh or removal), competitive gap analysis against 5 named competitor brands, and next quarter’s content calendar with recipes and ingredient guides queued. According to Ahrefs content marketing research, brands running quarterly content audits outperform brands running annual audits by 40 to 70 percent on organic revenue over a 24-month window.
Internal linking discipline across food brand content
Internal linking discipline across food brand content moves authority from recipe pages toward hero SKU product pages and comparison guides. Every recipe links to the hero SKU it uses inline (once in the ingredient list, once in a bottom call-out card). Every ingredient comparison guide links to 3 to 6 recipes using the winning ingredient plus the hero SKU product page. Every sourcing story links to the 2 to 4 SKUs sourced from that specific farm or cooperative.
Anchor text strategy across recipe hubs
Anchor text on internal links varies across recipe hubs to avoid over-optimization patterns Google penalizes. Exact-match anchor (“single-origin Ethiopian coffee”) runs on 20 to 30 percent of internal links. Partial-match variations (“our Ethiopian roast”) run on 30 to 40 percent. Branded anchors (the SKU name) run on 20 to 30 percent. Generic anchors (“shop the coffee”) fill the remaining 10 to 20 percent. This ratio holds ranking without triggering the over-optimization penalty that shows up on brands that anchor-text-stuff every internal link with the same exact-match keyword. Cross-reference the linking layer on our food and beverage web design page.
Link equity from ingredient guides to SKU pages
Link equity from ingredient guides passes to SKU pages when the guide’s comparison table names the hero SKU in the winning column with a product card, and when the guide’s body links to 3 to 6 recipes that use the winning ingredient. This 3-hop path (guide to recipe to SKU) pushes authority from a high-traffic informational query down to a high-intent transactional page. According to Search Engine Land SEO coverage, informational content that internally links to transactional pages produces 2 to 4 times higher organic revenue than isolated content silos.
Wrapping up content marketing for food brands
Content marketing for food brands is the organic engine that turns a DTC snack, drink, or CPG storefront into a search-driven revenue channel. Recipe hub of 40 to 100 recipes. Ingredient comparison guides at 12 to 24 pieces. Sourcing story pages at 6 to 12 pieces. Buyer intent content at 8 to 16 pieces. Creator syndication calendar with 12 to 30 creators per quarter. Refresh cadence at 12 to 24 months by pillar. Reporting with organic sessions and organic revenue attribution.
If your DTC food brand is running paid social at 20,000 dollars monthly with a broken blog and zero recipe schema, professional content marketing for food brands pays for itself inside the first 90 days on organic traffic captured. Redefine Web ships content marketing inside our monthly retainer packages. Book a call and we will walk through the last three DTC food brands we built recipe hubs for, pillar by pillar.
Anchor text on internal links varies across recipe hubs to avoid over-optimization patterns Google penalizes. Exact-match anchor (“single-origin Ethiopian coffee”) runs on 20 to 30 percent of internal links. Partial-match variations (“our Ethiopian roast”) run on 30 to 40 percent. Branded anchors (the SKU name) run on 20 to 30 percent. Generic anchors (“shop the coffee”) fill the remaining 10 to 20 percent. This ratio holds ranking without triggering the over-optimization penalty that shows up on brands that anchor-text-stuff every internal link with the same exact-match keyword. Cross-reference the linking layer on our food and beverage web design page.
Link equity from ingredient guides to SKU pages
Link equity from ingredient guides passes to SKU pages when the guide’s comparison table names the hero SKU in the winning column with a product card, and when the guide’s body links to 3 to 6 recipes that use the winning ingredient. This 3-hop path (guide to recipe to SKU) pushes authority from a high-traffic informational query down to a high-intent transactional page. According to Search Engine Land SEO coverage, informational content that internally links to transactional pages produces 2 to 4 times higher organic revenue than isolated content silos.
Wrapping up content marketing for food brands
Content marketing for food brands is the organic engine that turns a DTC snack, drink, or CPG storefront into a search-driven revenue channel. Recipe hub of 40 to 100 recipes. Ingredient comparison guides at 12 to 24 pieces. Sourcing story pages at 6 to 12 pieces. Buyer intent content at 8 to 16 pieces. Creator syndication calendar with 12 to 30 creators per quarter. Refresh cadence at 12 to 24 months by pillar. Reporting with organic sessions and organic revenue attribution.
If your DTC food brand is running paid social at 20,000 dollars monthly with a broken blog and zero recipe schema, professional content marketing for food brands pays for itself inside the first 90 days on organic traffic captured. Redefine Web ships content marketing inside our monthly retainer packages. Book a call and we will walk through the last three DTC food brands we built recipe hubs for, pillar by pillar.
Content marketing for food brands starts with a recipe hub because recipe queries account for 40 to 60 percent of high-intent search volume in the food category. Every hero SKU needs 4 to 12 recipes anchored to it, each targeting a specific occasion and audience.
Skip the recipe hub and the brand loses the search real estate that pulls DTC storefront traffic month over month at zero incremental paid cost. Recipe traffic converts at 2 to 4 percent because the shopper landed with usage intent, not passive discovery, which is why food brands win on recipes.
Recipe schema and Google rich result eligibility
Every recipe page ships schema.org Recipe markup including cookTime, prepTime, recipeIngredient, recipeInstructions, nutrition, and aggregateRating. Correctly marked-up recipes qualify for Google’s recipe rich result carousel that pulls 3 to 6 times higher click-through rate than a plain blue link. The schema layer takes 15 minutes per recipe to author and 30 minutes to validate in Google Search Console. Cross-reference the recipe search stack on our food and beverage SEO page.
Recipe hub structure that scales
The recipe hub structure runs 40 to 100 recipes at maturity, organized by hero SKU (4 to 12 recipes per SKU) plus occasion tags (breakfast, weeknight dinner, meal prep, brunch, holiday). Every recipe links back to the hero SKU product page with the SKU embedded in an inline card. The hub earns internal linking value from ingredient comparison guides and the sourcing story pages, which feeds recipe ranking on Google. According to Google Search Central recipe structured data guidance, complete Recipe schema markup is required for eligibility in the recipe carousel and the ingredient search filter.
Pillar structure for food brand content marketing
The pillar structure on content marketing for food brands runs 4 content pillars concurrently: recipe hub (40 to 100 recipes), ingredient comparison guides (12 to 24 guides), sourcing story pages (6 to 12 pages), and buyer intent content (where to buy, subscription vs. one-time, gift bundle guides). Every pillar covers a distinct search intent and every pillar links back to the hero SKU product pages.
Ingredient comparison guide format
Ingredient comparison guides run 1,800 to 3,200 words comparing 2 to 4 ingredient types on 6 to 10 attributes with a comparison table, real-world use case examples, and links to the hero SKU that uses the specific ingredient. Example: organic vs. conventional oats compares nutritional profile, sourcing chain, cost, environmental impact, and taste on a 6-column table. The brand’s SKU appears in the winning column with a product card. These guides rank 3 to 8 months after publication and pull steady-state organic traffic.
Sourcing story pages that build trust
Sourcing story pages name the specific farms, cooperatives, or suppliers the brand sources from, with photos of the farms, farmer quotes, and specific harvest windows. A coffee brand’s Ethiopian farm page ranks for “single-origin Ethiopian coffee” and “Yirgacheffe coffee origin” plus 40 long-tail variations. The sourcing page pulls trust-building traffic that converts at 4 to 6 percent because the shopper landed pattern-matching on transparency and named provenance. Every sourcing page includes farmer or cooperative quotes, harvest dates, and a link back to 3 to 5 hero SKU pages that source from the named supplier.
Vejrø hospitality content case study
Vejrø Resort, a Danish private-island destination with an on-site restaurant focused on organic, locally sourced cuisine, joined us with strong social engagement and no organic-search real estate. Guests found the resort on Instagram but never in Google search for terms like “private island resort Denmark,” “farm-to-table hospitality Denmark,” or “Vejrø restaurant.” The same organic-search gap shows up on DTC food brands running paid social at 20,000 dollars monthly with a broken blog and zero recipe schema.
We built the conversion-focused website with on-site and off-site SEO tuned to the travel-niche keyword clusters, competitor analysis against comparable boutique resorts, and mobile-first design prioritizing guest discovery. Every page carried the structured data qualifying it for Google’s rich results in the hospitality category. Every internal link pushed authority toward the direct-booking conversion path.
Three months later, Vejrø hit 10,000 plus organic visitors, ranked for 200 plus first-page keywords, and pulled a 2.2 percent booking conversion rate from organic traffic. The same pattern applies to content marketing for food brands: recipe schema, ingredient comparison guides, and sourcing story pages pull organic traffic at 20 to 40 percent conversion into hero SKU pages inside 6 months when the content quality matches search intent and every page carries the right structured data markup. Vejrø also proved out the reporting discipline: every monthly report named the exact page, the exact keyword cluster, and the exact search feature (rich result, sitelinks, image pack) driving the incremental organic revenue instead of hiding behind aggregate traffic charts.
Recipe cadence and content calendar for food brands
Recipe cadence on a working food brand content calendar ships 2 to 4 new recipes per week during the first 6 months and drops to 1 per week at maturity. Each recipe takes 4 to 6 hours to produce (write, test in the kitchen, photograph, schema author, publish). At 3 recipes per week, the brand hits 78 recipes inside 6 months plus a backlog of ingredient comparison and sourcing content queued behind the recipe production line.
| Content pillar | Target volume year 1 | Production cost per piece | Refresh cadence |
|---|---|---|---|
| Recipe hub | 40 to 100 recipes | $180 to $320 | Every 12 months |
| Ingredient comparison guides | 12 to 24 guides | $450 to $780 | Every 18 months |
| Sourcing story pages | 6 to 12 pages | $680 to $1,200 | Every 24 months |
| Buyer intent content | 8 to 16 pieces | $220 to $420 | Every 12 months |
Photography as a content calendar constraint
Photography is the actual constraint on recipe cadence, not writing. Every recipe needs 6 to 12 photos: hero shot, ingredient flat lay, prep in progress, plated result, storage, and step shots for the schema markup. A working food brand batches photography 8 recipes at a time to keep the cost per recipe under 200 dollars. Skip the batching and the per-recipe cost climbs to 400 to 600 dollars, which caps recipe cadence at 1 per week and slows organic ranking timeline by 6 months.
Seasonal content calendar planning
Seasonal content calendar planning maps recipes and comparison guides to the seasonal windows they need to rank in. A Christmas cookie recipe needs to publish in September to rank by early December. A Valentine’s chocolate guide needs to publish in November to rank by early February. A back-to-school lunchbox recipe needs to publish in June to rank by late August. The 60-to-90-day ranking curve dictates the calendar.
Creator syndication inside food brand content
Creator syndication on food brand content marketing amplifies the recipe hub through Instagram Reels, TikTok, and YouTube Shorts creators paid to post their own version of the brand’s hero recipes. The creator content pulls net-new audiences into the recipe hub through the creator’s Link in Bio or Amazon Storefront tag. The syndication calendar names 12 to 30 creators per quarter with specific recipes assigned to each.
One brand we picked up had a spreadsheet titled “creator outreach 2023” with 47 rows and 3 responses. All 3 responses were auto-replies. The spreadsheet named zero recipes and offered flat rates below 100 dollars per post. Nobody posts a 30-second video for 87 dollars flat. Nobody.
Creator content commercial terms that work
Working creator content commercial terms run 350 to 1,500 dollars flat per post plus a 12 to 25 percent commission on tagged sales across a 30-day window. The commission mechanic pulls creators into follow-up posts because the incremental revenue continues past the initial fee. Mid-tier creators (30k to 150k followers) hit the sweet spot for food brand content because their engagement rate typically runs 4 to 8 percent versus 0.8 to 1.6 percent on mega-creators.
Content brief structure for creator partnerships
The content brief structure for creator partnerships runs a single page: the SKU, the specific recipe or usage occasion, 3 required brand mentions, 3 restricted claims (no health claims on non-medical SKUs), the pricing angle, the affiliate link, and 3 example videos that hit the tone. The brief avoids over-scripting because over-scripted creator content underperforms native creator voice by 40 to 60 percent on engagement rate.
Buyer intent content for food brand blogs
Buyer intent content on food brand blogs covers 8 to 16 pieces targeting explicit purchase-decision queries: “where to buy [brand],” “[brand] subscription vs. one-time,” “best [category] for [use case],” and “[brand] gift bundle.” Every buyer intent piece runs 1,400 to 2,400 words with a comparison table, product cards, and a clear conversion path to the specific SKU that matches the query intent. Buyer intent content converts at 3 to 6 percent versus 1 to 2 percent on recipe content because the shopper landed already planning to buy, not exploring a usage occasion.
Where-to-buy content structure
Where-to-buy content structure covers online (DTC storefront, Amazon, Target.com, Whole Foods online), retail (specific chain locators with the store finder embedded), and international (customs limitations, retailer partners abroad). Every piece names specific retailers, links to the store locator, and includes an FAQ block covering shipping availability, subscription options, and gift card compatibility. Where-to-buy content ranks for branded discovery queries the DTC storefront otherwise loses to competitor affiliate reviews.
Subscription versus one-time comparison content
Subscription versus one-time comparison content converts subscription commitments at 3 to 6 percent because it addresses the price-sensitivity concern head-on with a specific math table. The piece covers the discount structure (15 percent lifetime), the skip-a-month mechanic, the pause-anytime rule, the cancellation policy, and the specific yearly savings for the brand’s average consumption cadence. Cross-reference the retention structure on our food and beverage marketing retainer page.
Content refresh cadence on food brand pillars
Content refresh cadence on food brand content pillars runs a rolling audit every 12 to 24 months by pillar. Recipes get refreshed every 12 months with new photography, updated schema, and any nutrition or ingredient adjustments. Ingredient comparison guides refresh every 18 months to update market data. Sourcing story pages refresh every 24 months to reflect farm partnership changes and new harvest angles. Buyer intent content refreshes every 12 months to update retailer availability and pricing.
Recipe refresh priority order
Recipe refresh priority runs by organic traffic rank. The top 20 recipes by monthly organic sessions get refreshed first (new photography, schema audit, related recipe internal links, updated nutrition). The next 40 get refreshed at 15 months. The remaining recipes get refreshed opportunistically when the ranking slips past position 15 in Google. Skipping the refresh cadence lets recipe rankings drift out of the top 3 inside 18 months as newer competitor recipes take the position.
Schema audit checklist per refresh
The schema audit checklist per refresh runs 8 items: Recipe schema completeness, aggregateRating count and accuracy, nutrition data accuracy, prepTime and cookTime match the recipe body, image URLs valid at CDN, related recipe internal links working, product card SKU URL live, and Google Search Console rich result eligibility validated. This checklist takes 20 minutes per recipe and prevents the schema drift that costs recipe rankings 20 to 40 positions quietly.
Reporting cadence for food brand content marketing
Reporting cadence on food brand content marketing runs a monthly executive report plus a quarterly business review. The monthly report ships in the first business week and covers organic sessions by pillar, top 10 ranking recipes with position trend, ingredient guide ranking movements, sourcing page performance, and organic-attributed DTC revenue. Every number carries a comparison to the prior month and a plain-language interpretation the founder reads in 7 minutes.
Metrics that matter for content marketing
Metrics that matter for food brand content marketing: organic sessions by pillar, recipe rich result impressions in Search Console, organic conversion rate to hero SKU pages, organic-attributed DTC revenue, and top 20 ranking positions by monthly organic sessions. Vanity metrics that do not matter: total pageviews without conversion context, average time on page without conversion attribution, and social share counts. The monthly report skips the vanity block entirely.
Quarterly business review structure
The quarterly business review runs 90 minutes with the founder, head of content, and SEO lead. Agenda: organic traffic trend by pillar, top 10 winning content pieces, top 10 losing content pieces (candidates for refresh or removal), competitive gap analysis against 5 named competitor brands, and next quarter’s content calendar with recipes and ingredient guides queued. According to Ahrefs content marketing research, brands running quarterly content audits outperform brands running annual audits by 40 to 70 percent on organic revenue over a 24-month window.
Internal linking discipline across food brand content
Internal linking discipline across food brand content moves authority from recipe pages toward hero SKU product pages and comparison guides. Every recipe links to the hero SKU it uses inline (once in the ingredient list, once in a bottom call-out card). Every ingredient comparison guide links to 3 to 6 recipes using the winning ingredient plus the hero SKU product page. Every sourcing story links to the 2 to 4 SKUs sourced from that specific farm or cooperative.
Anchor text strategy across recipe hubs
Anchor text on internal links varies across recipe hubs to avoid over-optimization patterns Google penalizes. Exact-match anchor (“single-origin Ethiopian coffee”) runs on 20 to 30 percent of internal links. Partial-match variations (“our Ethiopian roast”) run on 30 to 40 percent. Branded anchors (the SKU name) run on 20 to 30 percent. Generic anchors (“shop the coffee”) fill the remaining 10 to 20 percent. This ratio holds ranking without triggering the over-optimization penalty that shows up on brands that anchor-text-stuff every internal link with the same exact-match keyword. Cross-reference the linking layer on our food and beverage web design page.
Link equity from ingredient guides to SKU pages
Link equity from ingredient guides passes to SKU pages when the guide’s comparison table names the hero SKU in the winning column with a product card, and when the guide’s body links to 3 to 6 recipes that use the winning ingredient. This 3-hop path (guide to recipe to SKU) pushes authority from a high-traffic informational query down to a high-intent transactional page. According to Search Engine Land SEO coverage, informational content that internally links to transactional pages produces 2 to 4 times higher organic revenue than isolated content silos.
Wrapping up content marketing for food brands
Content marketing for food brands is the organic engine that turns a DTC snack, drink, or CPG storefront into a search-driven revenue channel. Recipe hub of 40 to 100 recipes. Ingredient comparison guides at 12 to 24 pieces. Sourcing story pages at 6 to 12 pieces. Buyer intent content at 8 to 16 pieces. Creator syndication calendar with 12 to 30 creators per quarter. Refresh cadence at 12 to 24 months by pillar. Reporting with organic sessions and organic revenue attribution.
If your DTC food brand is running paid social at 20,000 dollars monthly with a broken blog and zero recipe schema, professional content marketing for food brands pays for itself inside the first 90 days on organic traffic captured. Redefine Web ships content marketing inside our monthly retainer packages. Book a call and we will walk through the last three DTC food brands we built recipe hubs for, pillar by pillar.
Content marketing for food brands starts with a recipe hub because recipe queries account for 40 to 60 percent of high-intent search volume in the food category. Every hero SKU needs 4 to 12 recipes anchored to it, each targeting a specific occasion and audience.
Skip the recipe hub and the brand loses the search real estate that pulls DTC storefront traffic month over month at zero incremental paid cost. Recipe traffic converts at 2 to 4 percent because the shopper landed with usage intent, not passive discovery, which is why food brands win on recipes.
Recipe schema and Google rich result eligibility
Every recipe page ships schema.org Recipe markup including cookTime, prepTime, recipeIngredient, recipeInstructions, nutrition, and aggregateRating. Correctly marked-up recipes qualify for Google’s recipe rich result carousel that pulls 3 to 6 times higher click-through rate than a plain blue link. The schema layer takes 15 minutes per recipe to author and 30 minutes to validate in Google Search Console. Cross-reference the recipe search stack on our food and beverage SEO page.
Recipe hub structure that scales
The recipe hub structure runs 40 to 100 recipes at maturity, organized by hero SKU (4 to 12 recipes per SKU) plus occasion tags (breakfast, weeknight dinner, meal prep, brunch, holiday). Every recipe links back to the hero SKU product page with the SKU embedded in an inline card. The hub earns internal linking value from ingredient comparison guides and the sourcing story pages, which feeds recipe ranking on Google. According to Google Search Central recipe structured data guidance, complete Recipe schema markup is required for eligibility in the recipe carousel and the ingredient search filter.
Pillar structure for food brand content marketing
The pillar structure on content marketing for food brands runs 4 content pillars concurrently: recipe hub (40 to 100 recipes), ingredient comparison guides (12 to 24 guides), sourcing story pages (6 to 12 pages), and buyer intent content (where to buy, subscription vs. one-time, gift bundle guides). Every pillar covers a distinct search intent and every pillar links back to the hero SKU product pages.
Ingredient comparison guide format
Ingredient comparison guides run 1,800 to 3,200 words comparing 2 to 4 ingredient types on 6 to 10 attributes with a comparison table, real-world use case examples, and links to the hero SKU that uses the specific ingredient. Example: organic vs. conventional oats compares nutritional profile, sourcing chain, cost, environmental impact, and taste on a 6-column table. The brand’s SKU appears in the winning column with a product card. These guides rank 3 to 8 months after publication and pull steady-state organic traffic.
Sourcing story pages that build trust
Sourcing story pages name the specific farms, cooperatives, or suppliers the brand sources from, with photos of the farms, farmer quotes, and specific harvest windows. A coffee brand’s Ethiopian farm page ranks for “single-origin Ethiopian coffee” and “Yirgacheffe coffee origin” plus 40 long-tail variations. The sourcing page pulls trust-building traffic that converts at 4 to 6 percent because the shopper landed pattern-matching on transparency and named provenance. Every sourcing page includes farmer or cooperative quotes, harvest dates, and a link back to 3 to 5 hero SKU pages that source from the named supplier.
Vejrø hospitality content case study
Vejrø Resort, a Danish private-island destination with an on-site restaurant focused on organic, locally sourced cuisine, joined us with strong social engagement and no organic-search real estate. Guests found the resort on Instagram but never in Google search for terms like “private island resort Denmark,” “farm-to-table hospitality Denmark,” or “Vejrø restaurant.” The same organic-search gap shows up on DTC food brands running paid social at 20,000 dollars monthly with a broken blog and zero recipe schema.
We built the conversion-focused website with on-site and off-site SEO tuned to the travel-niche keyword clusters, competitor analysis against comparable boutique resorts, and mobile-first design prioritizing guest discovery. Every page carried the structured data qualifying it for Google’s rich results in the hospitality category. Every internal link pushed authority toward the direct-booking conversion path.
Three months later, Vejrø hit 10,000 plus organic visitors, ranked for 200 plus first-page keywords, and pulled a 2.2 percent booking conversion rate from organic traffic. The same pattern applies to content marketing for food brands: recipe schema, ingredient comparison guides, and sourcing story pages pull organic traffic at 20 to 40 percent conversion into hero SKU pages inside 6 months when the content quality matches search intent and every page carries the right structured data markup. Vejrø also proved out the reporting discipline: every monthly report named the exact page, the exact keyword cluster, and the exact search feature (rich result, sitelinks, image pack) driving the incremental organic revenue instead of hiding behind aggregate traffic charts.
Recipe cadence and content calendar for food brands
Recipe cadence on a working food brand content calendar ships 2 to 4 new recipes per week during the first 6 months and drops to 1 per week at maturity. Each recipe takes 4 to 6 hours to produce (write, test in the kitchen, photograph, schema author, publish). At 3 recipes per week, the brand hits 78 recipes inside 6 months plus a backlog of ingredient comparison and sourcing content queued behind the recipe production line.
| Content pillar | Target volume year 1 | Production cost per piece | Refresh cadence |
|---|---|---|---|
| Recipe hub | 40 to 100 recipes | $180 to $320 | Every 12 months |
| Ingredient comparison guides | 12 to 24 guides | $450 to $780 | Every 18 months |
| Sourcing story pages | 6 to 12 pages | $680 to $1,200 | Every 24 months |
| Buyer intent content | 8 to 16 pieces | $220 to $420 | Every 12 months |
Photography as a content calendar constraint
Photography is the actual constraint on recipe cadence, not writing. Every recipe needs 6 to 12 photos: hero shot, ingredient flat lay, prep in progress, plated result, storage, and step shots for the schema markup. A working food brand batches photography 8 recipes at a time to keep the cost per recipe under 200 dollars. Skip the batching and the per-recipe cost climbs to 400 to 600 dollars, which caps recipe cadence at 1 per week and slows organic ranking timeline by 6 months.
Seasonal content calendar planning
Seasonal content calendar planning maps recipes and comparison guides to the seasonal windows they need to rank in. A Christmas cookie recipe needs to publish in September to rank by early December. A Valentine’s chocolate guide needs to publish in November to rank by early February. A back-to-school lunchbox recipe needs to publish in June to rank by late August. The 60-to-90-day ranking curve dictates the calendar.
Creator syndication inside food brand content
Creator syndication on food brand content marketing amplifies the recipe hub through Instagram Reels, TikTok, and YouTube Shorts creators paid to post their own version of the brand’s hero recipes. The creator content pulls net-new audiences into the recipe hub through the creator’s Link in Bio or Amazon Storefront tag. The syndication calendar names 12 to 30 creators per quarter with specific recipes assigned to each.
One brand we picked up had a spreadsheet titled “creator outreach 2023” with 47 rows and 3 responses. All 3 responses were auto-replies. The spreadsheet named zero recipes and offered flat rates below 100 dollars per post. Nobody posts a 30-second video for 87 dollars flat. Nobody.
Creator content commercial terms that work
Working creator content commercial terms run 350 to 1,500 dollars flat per post plus a 12 to 25 percent commission on tagged sales across a 30-day window. The commission mechanic pulls creators into follow-up posts because the incremental revenue continues past the initial fee. Mid-tier creators (30k to 150k followers) hit the sweet spot for food brand content because their engagement rate typically runs 4 to 8 percent versus 0.8 to 1.6 percent on mega-creators.
Content brief structure for creator partnerships
The content brief structure for creator partnerships runs a single page: the SKU, the specific recipe or usage occasion, 3 required brand mentions, 3 restricted claims (no health claims on non-medical SKUs), the pricing angle, the affiliate link, and 3 example videos that hit the tone. The brief avoids over-scripting because over-scripted creator content underperforms native creator voice by 40 to 60 percent on engagement rate.
Buyer intent content for food brand blogs
Buyer intent content on food brand blogs covers 8 to 16 pieces targeting explicit purchase-decision queries: “where to buy [brand],” “[brand] subscription vs. one-time,” “best [category] for [use case],” and “[brand] gift bundle.” Every buyer intent piece runs 1,400 to 2,400 words with a comparison table, product cards, and a clear conversion path to the specific SKU that matches the query intent. Buyer intent content converts at 3 to 6 percent versus 1 to 2 percent on recipe content because the shopper landed already planning to buy, not exploring a usage occasion.
Where-to-buy content structure
Where-to-buy content structure covers online (DTC storefront, Amazon, Target.com, Whole Foods online), retail (specific chain locators with the store finder embedded), and international (customs limitations, retailer partners abroad). Every piece names specific retailers, links to the store locator, and includes an FAQ block covering shipping availability, subscription options, and gift card compatibility. Where-to-buy content ranks for branded discovery queries the DTC storefront otherwise loses to competitor affiliate reviews.
Subscription versus one-time comparison content
Subscription versus one-time comparison content converts subscription commitments at 3 to 6 percent because it addresses the price-sensitivity concern head-on with a specific math table. The piece covers the discount structure (15 percent lifetime), the skip-a-month mechanic, the pause-anytime rule, the cancellation policy, and the specific yearly savings for the brand’s average consumption cadence. Cross-reference the retention structure on our food and beverage marketing retainer page.
Content refresh cadence on food brand pillars
Content refresh cadence on food brand content pillars runs a rolling audit every 12 to 24 months by pillar. Recipes get refreshed every 12 months with new photography, updated schema, and any nutrition or ingredient adjustments. Ingredient comparison guides refresh every 18 months to update market data. Sourcing story pages refresh every 24 months to reflect farm partnership changes and new harvest angles. Buyer intent content refreshes every 12 months to update retailer availability and pricing.
Recipe refresh priority order
Recipe refresh priority runs by organic traffic rank. The top 20 recipes by monthly organic sessions get refreshed first (new photography, schema audit, related recipe internal links, updated nutrition). The next 40 get refreshed at 15 months. The remaining recipes get refreshed opportunistically when the ranking slips past position 15 in Google. Skipping the refresh cadence lets recipe rankings drift out of the top 3 inside 18 months as newer competitor recipes take the position.
Schema audit checklist per refresh
The schema audit checklist per refresh runs 8 items: Recipe schema completeness, aggregateRating count and accuracy, nutrition data accuracy, prepTime and cookTime match the recipe body, image URLs valid at CDN, related recipe internal links working, product card SKU URL live, and Google Search Console rich result eligibility validated. This checklist takes 20 minutes per recipe and prevents the schema drift that costs recipe rankings 20 to 40 positions quietly.
Reporting cadence for food brand content marketing
Reporting cadence on food brand content marketing runs a monthly executive report plus a quarterly business review. The monthly report ships in the first business week and covers organic sessions by pillar, top 10 ranking recipes with position trend, ingredient guide ranking movements, sourcing page performance, and organic-attributed DTC revenue. Every number carries a comparison to the prior month and a plain-language interpretation the founder reads in 7 minutes.
Metrics that matter for content marketing
Metrics that matter for food brand content marketing: organic sessions by pillar, recipe rich result impressions in Search Console, organic conversion rate to hero SKU pages, organic-attributed DTC revenue, and top 20 ranking positions by monthly organic sessions. Vanity metrics that do not matter: total pageviews without conversion context, average time on page without conversion attribution, and social share counts. The monthly report skips the vanity block entirely.
Quarterly business review structure
The quarterly business review runs 90 minutes with the founder, head of content, and SEO lead. Agenda: organic traffic trend by pillar, top 10 winning content pieces, top 10 losing content pieces (candidates for refresh or removal), competitive gap analysis against 5 named competitor brands, and next quarter’s content calendar with recipes and ingredient guides queued. According to Ahrefs content marketing research, brands running quarterly content audits outperform brands running annual audits by 40 to 70 percent on organic revenue over a 24-month window.
Internal linking discipline across food brand content
Internal linking discipline across food brand content moves authority from recipe pages toward hero SKU product pages and comparison guides. Every recipe links to the hero SKU it uses inline (once in the ingredient list, once in a bottom call-out card). Every ingredient comparison guide links to 3 to 6 recipes using the winning ingredient plus the hero SKU product page. Every sourcing story links to the 2 to 4 SKUs sourced from that specific farm or cooperative.
Anchor text strategy across recipe hubs
Anchor text on internal links varies across recipe hubs to avoid over-optimization patterns Google penalizes. Exact-match anchor (“single-origin Ethiopian coffee”) runs on 20 to 30 percent of internal links. Partial-match variations (“our Ethiopian roast”) run on 30 to 40 percent. Branded anchors (the SKU name) run on 20 to 30 percent. Generic anchors (“shop the coffee”) fill the remaining 10 to 20 percent. This ratio holds ranking without triggering the over-optimization penalty that shows up on brands that anchor-text-stuff every internal link with the same exact-match keyword. Cross-reference the linking layer on our food and beverage web design page.
Link equity from ingredient guides to SKU pages
Link equity from ingredient guides passes to SKU pages when the guide’s comparison table names the hero SKU in the winning column with a product card, and when the guide’s body links to 3 to 6 recipes that use the winning ingredient. This 3-hop path (guide to recipe to SKU) pushes authority from a high-traffic informational query down to a high-intent transactional page. According to Search Engine Land SEO coverage, informational content that internally links to transactional pages produces 2 to 4 times higher organic revenue than isolated content silos.
Wrapping up content marketing for food brands
Content marketing for food brands is the organic engine that turns a DTC snack, drink, or CPG storefront into a search-driven revenue channel. Recipe hub of 40 to 100 recipes. Ingredient comparison guides at 12 to 24 pieces. Sourcing story pages at 6 to 12 pieces. Buyer intent content at 8 to 16 pieces. Creator syndication calendar with 12 to 30 creators per quarter. Refresh cadence at 12 to 24 months by pillar. Reporting with organic sessions and organic revenue attribution.
If your DTC food brand is running paid social at 20,000 dollars monthly with a broken blog and zero recipe schema, professional content marketing for food brands pays for itself inside the first 90 days on organic traffic captured. Redefine Web ships content marketing inside our monthly retainer packages. Book a call and we will walk through the last three DTC food brands we built recipe hubs for, pillar by pillar.
Content marketing for food brands starts with a recipe hub because recipe queries account for 40 to 60 percent of high-intent search volume in the food category. Every hero SKU needs 4 to 12 recipes anchored to it, each targeting a specific occasion and audience.
Skip the recipe hub and the brand loses the search real estate that pulls DTC storefront traffic month over month at zero incremental paid cost. Recipe traffic converts at 2 to 4 percent because the shopper landed with usage intent, not passive discovery, which is why food brands win on recipes.
Recipe schema and Google rich result eligibility
Every recipe page ships schema.org Recipe markup including cookTime, prepTime, recipeIngredient, recipeInstructions, nutrition, and aggregateRating. Correctly marked-up recipes qualify for Google’s recipe rich result carousel that pulls 3 to 6 times higher click-through rate than a plain blue link. The schema layer takes 15 minutes per recipe to author and 30 minutes to validate in Google Search Console. Cross-reference the recipe search stack on our food and beverage SEO page.
Recipe hub structure that scales
The recipe hub structure runs 40 to 100 recipes at maturity, organized by hero SKU (4 to 12 recipes per SKU) plus occasion tags (breakfast, weeknight dinner, meal prep, brunch, holiday). Every recipe links back to the hero SKU product page with the SKU embedded in an inline card. The hub earns internal linking value from ingredient comparison guides and the sourcing story pages, which feeds recipe ranking on Google. According to Google Search Central recipe structured data guidance, complete Recipe schema markup is required for eligibility in the recipe carousel and the ingredient search filter.
Pillar structure for food brand content marketing
The pillar structure on content marketing for food brands runs 4 content pillars concurrently: recipe hub (40 to 100 recipes), ingredient comparison guides (12 to 24 guides), sourcing story pages (6 to 12 pages), and buyer intent content (where to buy, subscription vs. one-time, gift bundle guides). Every pillar covers a distinct search intent and every pillar links back to the hero SKU product pages.
Ingredient comparison guide format
Ingredient comparison guides run 1,800 to 3,200 words comparing 2 to 4 ingredient types on 6 to 10 attributes with a comparison table, real-world use case examples, and links to the hero SKU that uses the specific ingredient. Example: organic vs. conventional oats compares nutritional profile, sourcing chain, cost, environmental impact, and taste on a 6-column table. The brand’s SKU appears in the winning column with a product card. These guides rank 3 to 8 months after publication and pull steady-state organic traffic.
Sourcing story pages that build trust
Sourcing story pages name the specific farms, cooperatives, or suppliers the brand sources from, with photos of the farms, farmer quotes, and specific harvest windows. A coffee brand’s Ethiopian farm page ranks for “single-origin Ethiopian coffee” and “Yirgacheffe coffee origin” plus 40 long-tail variations. The sourcing page pulls trust-building traffic that converts at 4 to 6 percent because the shopper landed pattern-matching on transparency and named provenance. Every sourcing page includes farmer or cooperative quotes, harvest dates, and a link back to 3 to 5 hero SKU pages that source from the named supplier.
Vejrø hospitality content case study
Vejrø Resort, a Danish private-island destination with an on-site restaurant focused on organic, locally sourced cuisine, joined us with strong social engagement and no organic-search real estate. Guests found the resort on Instagram but never in Google search for terms like “private island resort Denmark,” “farm-to-table hospitality Denmark,” or “Vejrø restaurant.” The same organic-search gap shows up on DTC food brands running paid social at 20,000 dollars monthly with a broken blog and zero recipe schema.
We built the conversion-focused website with on-site and off-site SEO tuned to the travel-niche keyword clusters, competitor analysis against comparable boutique resorts, and mobile-first design prioritizing guest discovery. Every page carried the structured data qualifying it for Google’s rich results in the hospitality category. Every internal link pushed authority toward the direct-booking conversion path.
Three months later, Vejrø hit 10,000 plus organic visitors, ranked for 200 plus first-page keywords, and pulled a 2.2 percent booking conversion rate from organic traffic. The same pattern applies to content marketing for food brands: recipe schema, ingredient comparison guides, and sourcing story pages pull organic traffic at 20 to 40 percent conversion into hero SKU pages inside 6 months when the content quality matches search intent and every page carries the right structured data markup. Vejrø also proved out the reporting discipline: every monthly report named the exact page, the exact keyword cluster, and the exact search feature (rich result, sitelinks, image pack) driving the incremental organic revenue instead of hiding behind aggregate traffic charts.
Recipe cadence and content calendar for food brands
Recipe cadence on a working food brand content calendar ships 2 to 4 new recipes per week during the first 6 months and drops to 1 per week at maturity. Each recipe takes 4 to 6 hours to produce (write, test in the kitchen, photograph, schema author, publish). At 3 recipes per week, the brand hits 78 recipes inside 6 months plus a backlog of ingredient comparison and sourcing content queued behind the recipe production line.
| Content pillar | Target volume year 1 | Production cost per piece | Refresh cadence |
|---|---|---|---|
| Recipe hub | 40 to 100 recipes | $180 to $320 | Every 12 months |
| Ingredient comparison guides | 12 to 24 guides | $450 to $780 | Every 18 months |
| Sourcing story pages | 6 to 12 pages | $680 to $1,200 | Every 24 months |
| Buyer intent content | 8 to 16 pieces | $220 to $420 | Every 12 months |
Photography as a content calendar constraint
Photography is the actual constraint on recipe cadence, not writing. Every recipe needs 6 to 12 photos: hero shot, ingredient flat lay, prep in progress, plated result, storage, and step shots for the schema markup. A working food brand batches photography 8 recipes at a time to keep the cost per recipe under 200 dollars. Skip the batching and the per-recipe cost climbs to 400 to 600 dollars, which caps recipe cadence at 1 per week and slows organic ranking timeline by 6 months.
Seasonal content calendar planning
Seasonal content calendar planning maps recipes and comparison guides to the seasonal windows they need to rank in. A Christmas cookie recipe needs to publish in September to rank by early December. A Valentine’s chocolate guide needs to publish in November to rank by early February. A back-to-school lunchbox recipe needs to publish in June to rank by late August. The 60-to-90-day ranking curve dictates the calendar.
Creator syndication inside food brand content
Creator syndication on food brand content marketing amplifies the recipe hub through Instagram Reels, TikTok, and YouTube Shorts creators paid to post their own version of the brand’s hero recipes. The creator content pulls net-new audiences into the recipe hub through the creator’s Link in Bio or Amazon Storefront tag. The syndication calendar names 12 to 30 creators per quarter with specific recipes assigned to each.
One brand we picked up had a spreadsheet titled “creator outreach 2023” with 47 rows and 3 responses. All 3 responses were auto-replies. The spreadsheet named zero recipes and offered flat rates below 100 dollars per post. Nobody posts a 30-second video for 87 dollars flat. Nobody.
Creator content commercial terms that work
Working creator content commercial terms run 350 to 1,500 dollars flat per post plus a 12 to 25 percent commission on tagged sales across a 30-day window. The commission mechanic pulls creators into follow-up posts because the incremental revenue continues past the initial fee. Mid-tier creators (30k to 150k followers) hit the sweet spot for food brand content because their engagement rate typically runs 4 to 8 percent versus 0.8 to 1.6 percent on mega-creators.
Content brief structure for creator partnerships
The content brief structure for creator partnerships runs a single page: the SKU, the specific recipe or usage occasion, 3 required brand mentions, 3 restricted claims (no health claims on non-medical SKUs), the pricing angle, the affiliate link, and 3 example videos that hit the tone. The brief avoids over-scripting because over-scripted creator content underperforms native creator voice by 40 to 60 percent on engagement rate.
Buyer intent content for food brand blogs
Buyer intent content on food brand blogs covers 8 to 16 pieces targeting explicit purchase-decision queries: “where to buy [brand],” “[brand] subscription vs. one-time,” “best [category] for [use case],” and “[brand] gift bundle.” Every buyer intent piece runs 1,400 to 2,400 words with a comparison table, product cards, and a clear conversion path to the specific SKU that matches the query intent. Buyer intent content converts at 3 to 6 percent versus 1 to 2 percent on recipe content because the shopper landed already planning to buy, not exploring a usage occasion.
Where-to-buy content structure
Where-to-buy content structure covers online (DTC storefront, Amazon, Target.com, Whole Foods online), retail (specific chain locators with the store finder embedded), and international (customs limitations, retailer partners abroad). Every piece names specific retailers, links to the store locator, and includes an FAQ block covering shipping availability, subscription options, and gift card compatibility. Where-to-buy content ranks for branded discovery queries the DTC storefront otherwise loses to competitor affiliate reviews.
Subscription versus one-time comparison content
Subscription versus one-time comparison content converts subscription commitments at 3 to 6 percent because it addresses the price-sensitivity concern head-on with a specific math table. The piece covers the discount structure (15 percent lifetime), the skip-a-month mechanic, the pause-anytime rule, the cancellation policy, and the specific yearly savings for the brand’s average consumption cadence. Cross-reference the retention structure on our food and beverage marketing retainer page.
Content refresh cadence on food brand pillars
Content refresh cadence on food brand content pillars runs a rolling audit every 12 to 24 months by pillar. Recipes get refreshed every 12 months with new photography, updated schema, and any nutrition or ingredient adjustments. Ingredient comparison guides refresh every 18 months to update market data. Sourcing story pages refresh every 24 months to reflect farm partnership changes and new harvest angles. Buyer intent content refreshes every 12 months to update retailer availability and pricing.
Recipe refresh priority order
Recipe refresh priority runs by organic traffic rank. The top 20 recipes by monthly organic sessions get refreshed first (new photography, schema audit, related recipe internal links, updated nutrition). The next 40 get refreshed at 15 months. The remaining recipes get refreshed opportunistically when the ranking slips past position 15 in Google. Skipping the refresh cadence lets recipe rankings drift out of the top 3 inside 18 months as newer competitor recipes take the position.
Schema audit checklist per refresh
The schema audit checklist per refresh runs 8 items: Recipe schema completeness, aggregateRating count and accuracy, nutrition data accuracy, prepTime and cookTime match the recipe body, image URLs valid at CDN, related recipe internal links working, product card SKU URL live, and Google Search Console rich result eligibility validated. This checklist takes 20 minutes per recipe and prevents the schema drift that costs recipe rankings 20 to 40 positions quietly.
Reporting cadence for food brand content marketing
Reporting cadence on food brand content marketing runs a monthly executive report plus a quarterly business review. The monthly report ships in the first business week and covers organic sessions by pillar, top 10 ranking recipes with position trend, ingredient guide ranking movements, sourcing page performance, and organic-attributed DTC revenue. Every number carries a comparison to the prior month and a plain-language interpretation the founder reads in 7 minutes.
Metrics that matter for content marketing
Metrics that matter for food brand content marketing: organic sessions by pillar, recipe rich result impressions in Search Console, organic conversion rate to hero SKU pages, organic-attributed DTC revenue, and top 20 ranking positions by monthly organic sessions. Vanity metrics that do not matter: total pageviews without conversion context, average time on page without conversion attribution, and social share counts. The monthly report skips the vanity block entirely.
Quarterly business review structure
The quarterly business review runs 90 minutes with the founder, head of content, and SEO lead. Agenda: organic traffic trend by pillar, top 10 winning content pieces, top 10 losing content pieces (candidates for refresh or removal), competitive gap analysis against 5 named competitor brands, and next quarter’s content calendar with recipes and ingredient guides queued. According to Ahrefs content marketing research, brands running quarterly content audits outperform brands running annual audits by 40 to 70 percent on organic revenue over a 24-month window.
Internal linking discipline across food brand content
Internal linking discipline across food brand content moves authority from recipe pages toward hero SKU product pages and comparison guides. Every recipe links to the hero SKU it uses inline (once in the ingredient list, once in a bottom call-out card). Every ingredient comparison guide links to 3 to 6 recipes using the winning ingredient plus the hero SKU product page. Every sourcing story links to the 2 to 4 SKUs sourced from that specific farm or cooperative.
Anchor text strategy across recipe hubs
Anchor text on internal links varies across recipe hubs to avoid over-optimization patterns Google penalizes. Exact-match anchor (“single-origin Ethiopian coffee”) runs on 20 to 30 percent of internal links. Partial-match variations (“our Ethiopian roast”) run on 30 to 40 percent. Branded anchors (the SKU name) run on 20 to 30 percent. Generic anchors (“shop the coffee”) fill the remaining 10 to 20 percent. This ratio holds ranking without triggering the over-optimization penalty that shows up on brands that anchor-text-stuff every internal link with the same exact-match keyword. Cross-reference the linking layer on our food and beverage web design page.
Link equity from ingredient guides to SKU pages
Link equity from ingredient guides passes to SKU pages when the guide’s comparison table names the hero SKU in the winning column with a product card, and when the guide’s body links to 3 to 6 recipes that use the winning ingredient. This 3-hop path (guide to recipe to SKU) pushes authority from a high-traffic informational query down to a high-intent transactional page. According to Search Engine Land SEO coverage, informational content that internally links to transactional pages produces 2 to 4 times higher organic revenue than isolated content silos.
Wrapping up content marketing for food brands
Content marketing for food brands is the organic engine that turns a DTC snack, drink, or CPG storefront into a search-driven revenue channel. Recipe hub of 40 to 100 recipes. Ingredient comparison guides at 12 to 24 pieces. Sourcing story pages at 6 to 12 pieces. Buyer intent content at 8 to 16 pieces. Creator syndication calendar with 12 to 30 creators per quarter. Refresh cadence at 12 to 24 months by pillar. Reporting with organic sessions and organic revenue attribution.
If your DTC food brand is running paid social at 20,000 dollars monthly with a broken blog and zero recipe schema, professional content marketing for food brands pays for itself inside the first 90 days on organic traffic captured. Redefine Web ships content marketing inside our monthly retainer packages. Book a call and we will walk through the last three DTC food brands we built recipe hubs for, pillar by pillar.
Anchor text on internal links varies across recipe hubs to avoid over-optimization patterns Google penalizes. Exact-match anchor (“single-origin Ethiopian coffee”) runs on 20 to 30 percent of internal links. Partial-match variations (“our Ethiopian roast”) run on 30 to 40 percent. Branded anchors (the SKU name) run on 20 to 30 percent. Generic anchors (“shop the coffee”) fill the remaining 10 to 20 percent. This ratio holds ranking without triggering the over-optimization penalty that shows up on brands that anchor-text-stuff every internal link with the same exact-match keyword. Cross-reference the linking layer on our food and beverage web design page.
Link equity from ingredient guides to SKU pages
Link equity from ingredient guides passes to SKU pages when the guide’s comparison table names the hero SKU in the winning column with a product card, and when the guide’s body links to 3 to 6 recipes that use the winning ingredient. This 3-hop path (guide to recipe to SKU) pushes authority from a high-traffic informational query down to a high-intent transactional page. According to Search Engine Land SEO coverage, informational content that internally links to transactional pages produces 2 to 4 times higher organic revenue than isolated content silos.
Wrapping up content marketing for food brands
Content marketing for food brands is the organic engine that turns a DTC snack, drink, or CPG storefront into a search-driven revenue channel. Recipe hub of 40 to 100 recipes. Ingredient comparison guides at 12 to 24 pieces. Sourcing story pages at 6 to 12 pieces. Buyer intent content at 8 to 16 pieces. Creator syndication calendar with 12 to 30 creators per quarter. Refresh cadence at 12 to 24 months by pillar. Reporting with organic sessions and organic revenue attribution.
If your DTC food brand is running paid social at 20,000 dollars monthly with a broken blog and zero recipe schema, professional content marketing for food brands pays for itself inside the first 90 days on organic traffic captured. Redefine Web ships content marketing inside our monthly retainer packages. Book a call and we will walk through the last three DTC food brands we built recipe hubs for, pillar by pillar.
Content marketing for food brands starts with a recipe hub because recipe queries account for 40 to 60 percent of high-intent search volume in the food category. Every hero SKU needs 4 to 12 recipes anchored to it, each targeting a specific occasion and audience.
Skip the recipe hub and the brand loses the search real estate that pulls DTC storefront traffic month over month at zero incremental paid cost. Recipe traffic converts at 2 to 4 percent because the shopper landed with usage intent, not passive discovery, which is why food brands win on recipes.
Recipe schema and Google rich result eligibility
Every recipe page ships schema.org Recipe markup including cookTime, prepTime, recipeIngredient, recipeInstructions, nutrition, and aggregateRating. Correctly marked-up recipes qualify for Google’s recipe rich result carousel that pulls 3 to 6 times higher click-through rate than a plain blue link. The schema layer takes 15 minutes per recipe to author and 30 minutes to validate in Google Search Console. Cross-reference the recipe search stack on our food and beverage SEO page.
Recipe hub structure that scales
The recipe hub structure runs 40 to 100 recipes at maturity, organized by hero SKU (4 to 12 recipes per SKU) plus occasion tags (breakfast, weeknight dinner, meal prep, brunch, holiday). Every recipe links back to the hero SKU product page with the SKU embedded in an inline card. The hub earns internal linking value from ingredient comparison guides and the sourcing story pages, which feeds recipe ranking on Google. According to Google Search Central recipe structured data guidance, complete Recipe schema markup is required for eligibility in the recipe carousel and the ingredient search filter.
Pillar structure for food brand content marketing
The pillar structure on content marketing for food brands runs 4 content pillars concurrently: recipe hub (40 to 100 recipes), ingredient comparison guides (12 to 24 guides), sourcing story pages (6 to 12 pages), and buyer intent content (where to buy, subscription vs. one-time, gift bundle guides). Every pillar covers a distinct search intent and every pillar links back to the hero SKU product pages.
Ingredient comparison guide format
Ingredient comparison guides run 1,800 to 3,200 words comparing 2 to 4 ingredient types on 6 to 10 attributes with a comparison table, real-world use case examples, and links to the hero SKU that uses the specific ingredient. Example: organic vs. conventional oats compares nutritional profile, sourcing chain, cost, environmental impact, and taste on a 6-column table. The brand’s SKU appears in the winning column with a product card. These guides rank 3 to 8 months after publication and pull steady-state organic traffic.
Sourcing story pages that build trust
Sourcing story pages name the specific farms, cooperatives, or suppliers the brand sources from, with photos of the farms, farmer quotes, and specific harvest windows. A coffee brand’s Ethiopian farm page ranks for “single-origin Ethiopian coffee” and “Yirgacheffe coffee origin” plus 40 long-tail variations. The sourcing page pulls trust-building traffic that converts at 4 to 6 percent because the shopper landed pattern-matching on transparency and named provenance. Every sourcing page includes farmer or cooperative quotes, harvest dates, and a link back to 3 to 5 hero SKU pages that source from the named supplier.
Vejrø hospitality content case study
Vejrø Resort, a Danish private-island destination with an on-site restaurant focused on organic, locally sourced cuisine, joined us with strong social engagement and no organic-search real estate. Guests found the resort on Instagram but never in Google search for terms like “private island resort Denmark,” “farm-to-table hospitality Denmark,” or “Vejrø restaurant.” The same organic-search gap shows up on DTC food brands running paid social at 20,000 dollars monthly with a broken blog and zero recipe schema.
We built the conversion-focused website with on-site and off-site SEO tuned to the travel-niche keyword clusters, competitor analysis against comparable boutique resorts, and mobile-first design prioritizing guest discovery. Every page carried the structured data qualifying it for Google’s rich results in the hospitality category. Every internal link pushed authority toward the direct-booking conversion path.
Three months later, Vejrø hit 10,000 plus organic visitors, ranked for 200 plus first-page keywords, and pulled a 2.2 percent booking conversion rate from organic traffic. The same pattern applies to content marketing for food brands: recipe schema, ingredient comparison guides, and sourcing story pages pull organic traffic at 20 to 40 percent conversion into hero SKU pages inside 6 months when the content quality matches search intent and every page carries the right structured data markup. Vejrø also proved out the reporting discipline: every monthly report named the exact page, the exact keyword cluster, and the exact search feature (rich result, sitelinks, image pack) driving the incremental organic revenue instead of hiding behind aggregate traffic charts.
Recipe cadence and content calendar for food brands
Recipe cadence on a working food brand content calendar ships 2 to 4 new recipes per week during the first 6 months and drops to 1 per week at maturity. Each recipe takes 4 to 6 hours to produce (write, test in the kitchen, photograph, schema author, publish). At 3 recipes per week, the brand hits 78 recipes inside 6 months plus a backlog of ingredient comparison and sourcing content queued behind the recipe production line.
| Content pillar | Target volume year 1 | Production cost per piece | Refresh cadence |
|---|---|---|---|
| Recipe hub | 40 to 100 recipes | $180 to $320 | Every 12 months |
| Ingredient comparison guides | 12 to 24 guides | $450 to $780 | Every 18 months |
| Sourcing story pages | 6 to 12 pages | $680 to $1,200 | Every 24 months |
| Buyer intent content | 8 to 16 pieces | $220 to $420 | Every 12 months |
Photography as a content calendar constraint
Photography is the actual constraint on recipe cadence, not writing. Every recipe needs 6 to 12 photos: hero shot, ingredient flat lay, prep in progress, plated result, storage, and step shots for the schema markup. A working food brand batches photography 8 recipes at a time to keep the cost per recipe under 200 dollars. Skip the batching and the per-recipe cost climbs to 400 to 600 dollars, which caps recipe cadence at 1 per week and slows organic ranking timeline by 6 months.
Seasonal content calendar planning
Seasonal content calendar planning maps recipes and comparison guides to the seasonal windows they need to rank in. A Christmas cookie recipe needs to publish in September to rank by early December. A Valentine’s chocolate guide needs to publish in November to rank by early February. A back-to-school lunchbox recipe needs to publish in June to rank by late August. The 60-to-90-day ranking curve dictates the calendar.
Creator syndication inside food brand content
Creator syndication on food brand content marketing amplifies the recipe hub through Instagram Reels, TikTok, and YouTube Shorts creators paid to post their own version of the brand’s hero recipes. The creator content pulls net-new audiences into the recipe hub through the creator’s Link in Bio or Amazon Storefront tag. The syndication calendar names 12 to 30 creators per quarter with specific recipes assigned to each.
One brand we picked up had a spreadsheet titled “creator outreach 2023” with 47 rows and 3 responses. All 3 responses were auto-replies. The spreadsheet named zero recipes and offered flat rates below 100 dollars per post. Nobody posts a 30-second video for 87 dollars flat. Nobody.
Creator content commercial terms that work
Working creator content commercial terms run 350 to 1,500 dollars flat per post plus a 12 to 25 percent commission on tagged sales across a 30-day window. The commission mechanic pulls creators into follow-up posts because the incremental revenue continues past the initial fee. Mid-tier creators (30k to 150k followers) hit the sweet spot for food brand content because their engagement rate typically runs 4 to 8 percent versus 0.8 to 1.6 percent on mega-creators.
Content brief structure for creator partnerships
The content brief structure for creator partnerships runs a single page: the SKU, the specific recipe or usage occasion, 3 required brand mentions, 3 restricted claims (no health claims on non-medical SKUs), the pricing angle, the affiliate link, and 3 example videos that hit the tone. The brief avoids over-scripting because over-scripted creator content underperforms native creator voice by 40 to 60 percent on engagement rate.
Buyer intent content for food brand blogs
Buyer intent content on food brand blogs covers 8 to 16 pieces targeting explicit purchase-decision queries: “where to buy [brand],” “[brand] subscription vs. one-time,” “best [category] for [use case],” and “[brand] gift bundle.” Every buyer intent piece runs 1,400 to 2,400 words with a comparison table, product cards, and a clear conversion path to the specific SKU that matches the query intent. Buyer intent content converts at 3 to 6 percent versus 1 to 2 percent on recipe content because the shopper landed already planning to buy, not exploring a usage occasion.
Where-to-buy content structure
Where-to-buy content structure covers online (DTC storefront, Amazon, Target.com, Whole Foods online), retail (specific chain locators with the store finder embedded), and international (customs limitations, retailer partners abroad). Every piece names specific retailers, links to the store locator, and includes an FAQ block covering shipping availability, subscription options, and gift card compatibility. Where-to-buy content ranks for branded discovery queries the DTC storefront otherwise loses to competitor affiliate reviews.
Subscription versus one-time comparison content
Subscription versus one-time comparison content converts subscription commitments at 3 to 6 percent because it addresses the price-sensitivity concern head-on with a specific math table. The piece covers the discount structure (15 percent lifetime), the skip-a-month mechanic, the pause-anytime rule, the cancellation policy, and the specific yearly savings for the brand’s average consumption cadence. Cross-reference the retention structure on our food and beverage marketing retainer page.
Content refresh cadence on food brand pillars
Content refresh cadence on food brand content pillars runs a rolling audit every 12 to 24 months by pillar. Recipes get refreshed every 12 months with new photography, updated schema, and any nutrition or ingredient adjustments. Ingredient comparison guides refresh every 18 months to update market data. Sourcing story pages refresh every 24 months to reflect farm partnership changes and new harvest angles. Buyer intent content refreshes every 12 months to update retailer availability and pricing.
Recipe refresh priority order
Recipe refresh priority runs by organic traffic rank. The top 20 recipes by monthly organic sessions get refreshed first (new photography, schema audit, related recipe internal links, updated nutrition). The next 40 get refreshed at 15 months. The remaining recipes get refreshed opportunistically when the ranking slips past position 15 in Google. Skipping the refresh cadence lets recipe rankings drift out of the top 3 inside 18 months as newer competitor recipes take the position.
Schema audit checklist per refresh
The schema audit checklist per refresh runs 8 items: Recipe schema completeness, aggregateRating count and accuracy, nutrition data accuracy, prepTime and cookTime match the recipe body, image URLs valid at CDN, related recipe internal links working, product card SKU URL live, and Google Search Console rich result eligibility validated. This checklist takes 20 minutes per recipe and prevents the schema drift that costs recipe rankings 20 to 40 positions quietly.
Reporting cadence for food brand content marketing
Reporting cadence on food brand content marketing runs a monthly executive report plus a quarterly business review. The monthly report ships in the first business week and covers organic sessions by pillar, top 10 ranking recipes with position trend, ingredient guide ranking movements, sourcing page performance, and organic-attributed DTC revenue. Every number carries a comparison to the prior month and a plain-language interpretation the founder reads in 7 minutes.
Metrics that matter for content marketing
Metrics that matter for food brand content marketing: organic sessions by pillar, recipe rich result impressions in Search Console, organic conversion rate to hero SKU pages, organic-attributed DTC revenue, and top 20 ranking positions by monthly organic sessions. Vanity metrics that do not matter: total pageviews without conversion context, average time on page without conversion attribution, and social share counts. The monthly report skips the vanity block entirely.
Quarterly business review structure
The quarterly business review runs 90 minutes with the founder, head of content, and SEO lead. Agenda: organic traffic trend by pillar, top 10 winning content pieces, top 10 losing content pieces (candidates for refresh or removal), competitive gap analysis against 5 named competitor brands, and next quarter’s content calendar with recipes and ingredient guides queued. According to Ahrefs content marketing research, brands running quarterly content audits outperform brands running annual audits by 40 to 70 percent on organic revenue over a 24-month window.
Internal linking discipline across food brand content
Internal linking discipline across food brand content moves authority from recipe pages toward hero SKU product pages and comparison guides. Every recipe links to the hero SKU it uses inline (once in the ingredient list, once in a bottom call-out card). Every ingredient comparison guide links to 3 to 6 recipes using the winning ingredient plus the hero SKU product page. Every sourcing story links to the 2 to 4 SKUs sourced from that specific farm or cooperative.
Anchor text strategy across recipe hubs
Anchor text on internal links varies across recipe hubs to avoid over-optimization patterns Google penalizes. Exact-match anchor (“single-origin Ethiopian coffee”) runs on 20 to 30 percent of internal links. Partial-match variations (“our Ethiopian roast”) run on 30 to 40 percent. Branded anchors (the SKU name) run on 20 to 30 percent. Generic anchors (“shop the coffee”) fill the remaining 10 to 20 percent. This ratio holds ranking without triggering the over-optimization penalty that shows up on brands that anchor-text-stuff every internal link with the same exact-match keyword. Cross-reference the linking layer on our food and beverage web design page.
Link equity from ingredient guides to SKU pages
Link equity from ingredient guides passes to SKU pages when the guide’s comparison table names the hero SKU in the winning column with a product card, and when the guide’s body links to 3 to 6 recipes that use the winning ingredient. This 3-hop path (guide to recipe to SKU) pushes authority from a high-traffic informational query down to a high-intent transactional page. According to Search Engine Land SEO coverage, informational content that internally links to transactional pages produces 2 to 4 times higher organic revenue than isolated content silos.
Wrapping up content marketing for food brands
Content marketing for food brands is the organic engine that turns a DTC snack, drink, or CPG storefront into a search-driven revenue channel. Recipe hub of 40 to 100 recipes. Ingredient comparison guides at 12 to 24 pieces. Sourcing story pages at 6 to 12 pieces. Buyer intent content at 8 to 16 pieces. Creator syndication calendar with 12 to 30 creators per quarter. Refresh cadence at 12 to 24 months by pillar. Reporting with organic sessions and organic revenue attribution.
If your DTC food brand is running paid social at 20,000 dollars monthly with a broken blog and zero recipe schema, professional content marketing for food brands pays for itself inside the first 90 days on organic traffic captured. Redefine Web ships content marketing inside our monthly retainer packages. Book a call and we will walk through the last three DTC food brands we built recipe hubs for, pillar by pillar.
Content marketing for food brands starts with a recipe hub because recipe queries account for 40 to 60 percent of high-intent search volume in the food category. Every hero SKU needs 4 to 12 recipes anchored to it, each targeting a specific occasion and audience.
Skip the recipe hub and the brand loses the search real estate that pulls DTC storefront traffic month over month at zero incremental paid cost. Recipe traffic converts at 2 to 4 percent because the shopper landed with usage intent, not passive discovery, which is why food brands win on recipes.
Recipe schema and Google rich result eligibility
Every recipe page ships schema.org Recipe markup including cookTime, prepTime, recipeIngredient, recipeInstructions, nutrition, and aggregateRating. Correctly marked-up recipes qualify for Google’s recipe rich result carousel that pulls 3 to 6 times higher click-through rate than a plain blue link. The schema layer takes 15 minutes per recipe to author and 30 minutes to validate in Google Search Console. Cross-reference the recipe search stack on our food and beverage SEO page.
Recipe hub structure that scales
The recipe hub structure runs 40 to 100 recipes at maturity, organized by hero SKU (4 to 12 recipes per SKU) plus occasion tags (breakfast, weeknight dinner, meal prep, brunch, holiday). Every recipe links back to the hero SKU product page with the SKU embedded in an inline card. The hub earns internal linking value from ingredient comparison guides and the sourcing story pages, which feeds recipe ranking on Google. According to Google Search Central recipe structured data guidance, complete Recipe schema markup is required for eligibility in the recipe carousel and the ingredient search filter.
Pillar structure for food brand content marketing
The pillar structure on content marketing for food brands runs 4 content pillars concurrently: recipe hub (40 to 100 recipes), ingredient comparison guides (12 to 24 guides), sourcing story pages (6 to 12 pages), and buyer intent content (where to buy, subscription vs. one-time, gift bundle guides). Every pillar covers a distinct search intent and every pillar links back to the hero SKU product pages.
Ingredient comparison guide format
Ingredient comparison guides run 1,800 to 3,200 words comparing 2 to 4 ingredient types on 6 to 10 attributes with a comparison table, real-world use case examples, and links to the hero SKU that uses the specific ingredient. Example: organic vs. conventional oats compares nutritional profile, sourcing chain, cost, environmental impact, and taste on a 6-column table. The brand’s SKU appears in the winning column with a product card. These guides rank 3 to 8 months after publication and pull steady-state organic traffic.
Sourcing story pages that build trust
Sourcing story pages name the specific farms, cooperatives, or suppliers the brand sources from, with photos of the farms, farmer quotes, and specific harvest windows. A coffee brand’s Ethiopian farm page ranks for “single-origin Ethiopian coffee” and “Yirgacheffe coffee origin” plus 40 long-tail variations. The sourcing page pulls trust-building traffic that converts at 4 to 6 percent because the shopper landed pattern-matching on transparency and named provenance. Every sourcing page includes farmer or cooperative quotes, harvest dates, and a link back to 3 to 5 hero SKU pages that source from the named supplier.
Vejrø hospitality content case study
Vejrø Resort, a Danish private-island destination with an on-site restaurant focused on organic, locally sourced cuisine, joined us with strong social engagement and no organic-search real estate. Guests found the resort on Instagram but never in Google search for terms like “private island resort Denmark,” “farm-to-table hospitality Denmark,” or “Vejrø restaurant.” The same organic-search gap shows up on DTC food brands running paid social at 20,000 dollars monthly with a broken blog and zero recipe schema.
We built the conversion-focused website with on-site and off-site SEO tuned to the travel-niche keyword clusters, competitor analysis against comparable boutique resorts, and mobile-first design prioritizing guest discovery. Every page carried the structured data qualifying it for Google’s rich results in the hospitality category. Every internal link pushed authority toward the direct-booking conversion path.
Three months later, Vejrø hit 10,000 plus organic visitors, ranked for 200 plus first-page keywords, and pulled a 2.2 percent booking conversion rate from organic traffic. The same pattern applies to content marketing for food brands: recipe schema, ingredient comparison guides, and sourcing story pages pull organic traffic at 20 to 40 percent conversion into hero SKU pages inside 6 months when the content quality matches search intent and every page carries the right structured data markup. Vejrø also proved out the reporting discipline: every monthly report named the exact page, the exact keyword cluster, and the exact search feature (rich result, sitelinks, image pack) driving the incremental organic revenue instead of hiding behind aggregate traffic charts.
Recipe cadence and content calendar for food brands
Recipe cadence on a working food brand content calendar ships 2 to 4 new recipes per week during the first 6 months and drops to 1 per week at maturity. Each recipe takes 4 to 6 hours to produce (write, test in the kitchen, photograph, schema author, publish). At 3 recipes per week, the brand hits 78 recipes inside 6 months plus a backlog of ingredient comparison and sourcing content queued behind the recipe production line.
| Content pillar | Target volume year 1 | Production cost per piece | Refresh cadence |
|---|---|---|---|
| Recipe hub | 40 to 100 recipes | $180 to $320 | Every 12 months |
| Ingredient comparison guides | 12 to 24 guides | $450 to $780 | Every 18 months |
| Sourcing story pages | 6 to 12 pages | $680 to $1,200 | Every 24 months |
| Buyer intent content | 8 to 16 pieces | $220 to $420 | Every 12 months |
Photography as a content calendar constraint
Photography is the actual constraint on recipe cadence, not writing. Every recipe needs 6 to 12 photos: hero shot, ingredient flat lay, prep in progress, plated result, storage, and step shots for the schema markup. A working food brand batches photography 8 recipes at a time to keep the cost per recipe under 200 dollars. Skip the batching and the per-recipe cost climbs to 400 to 600 dollars, which caps recipe cadence at 1 per week and slows organic ranking timeline by 6 months.
Seasonal content calendar planning
Seasonal content calendar planning maps recipes and comparison guides to the seasonal windows they need to rank in. A Christmas cookie recipe needs to publish in September to rank by early December. A Valentine’s chocolate guide needs to publish in November to rank by early February. A back-to-school lunchbox recipe needs to publish in June to rank by late August. The 60-to-90-day ranking curve dictates the calendar.
Creator syndication inside food brand content
Creator syndication on food brand content marketing amplifies the recipe hub through Instagram Reels, TikTok, and YouTube Shorts creators paid to post their own version of the brand’s hero recipes. The creator content pulls net-new audiences into the recipe hub through the creator’s Link in Bio or Amazon Storefront tag. The syndication calendar names 12 to 30 creators per quarter with specific recipes assigned to each.
One brand we picked up had a spreadsheet titled “creator outreach 2023” with 47 rows and 3 responses. All 3 responses were auto-replies. The spreadsheet named zero recipes and offered flat rates below 100 dollars per post. Nobody posts a 30-second video for 87 dollars flat. Nobody.
Creator content commercial terms that work
Working creator content commercial terms run 350 to 1,500 dollars flat per post plus a 12 to 25 percent commission on tagged sales across a 30-day window. The commission mechanic pulls creators into follow-up posts because the incremental revenue continues past the initial fee. Mid-tier creators (30k to 150k followers) hit the sweet spot for food brand content because their engagement rate typically runs 4 to 8 percent versus 0.8 to 1.6 percent on mega-creators.
Content brief structure for creator partnerships
The content brief structure for creator partnerships runs a single page: the SKU, the specific recipe or usage occasion, 3 required brand mentions, 3 restricted claims (no health claims on non-medical SKUs), the pricing angle, the affiliate link, and 3 example videos that hit the tone. The brief avoids over-scripting because over-scripted creator content underperforms native creator voice by 40 to 60 percent on engagement rate.
Buyer intent content for food brand blogs
Buyer intent content on food brand blogs covers 8 to 16 pieces targeting explicit purchase-decision queries: “where to buy [brand],” “[brand] subscription vs. one-time,” “best [category] for [use case],” and “[brand] gift bundle.” Every buyer intent piece runs 1,400 to 2,400 words with a comparison table, product cards, and a clear conversion path to the specific SKU that matches the query intent. Buyer intent content converts at 3 to 6 percent versus 1 to 2 percent on recipe content because the shopper landed already planning to buy, not exploring a usage occasion.
Where-to-buy content structure
Where-to-buy content structure covers online (DTC storefront, Amazon, Target.com, Whole Foods online), retail (specific chain locators with the store finder embedded), and international (customs limitations, retailer partners abroad). Every piece names specific retailers, links to the store locator, and includes an FAQ block covering shipping availability, subscription options, and gift card compatibility. Where-to-buy content ranks for branded discovery queries the DTC storefront otherwise loses to competitor affiliate reviews.
Subscription versus one-time comparison content
Subscription versus one-time comparison content converts subscription commitments at 3 to 6 percent because it addresses the price-sensitivity concern head-on with a specific math table. The piece covers the discount structure (15 percent lifetime), the skip-a-month mechanic, the pause-anytime rule, the cancellation policy, and the specific yearly savings for the brand’s average consumption cadence. Cross-reference the retention structure on our food and beverage marketing retainer page.
Content refresh cadence on food brand pillars
Content refresh cadence on food brand content pillars runs a rolling audit every 12 to 24 months by pillar. Recipes get refreshed every 12 months with new photography, updated schema, and any nutrition or ingredient adjustments. Ingredient comparison guides refresh every 18 months to update market data. Sourcing story pages refresh every 24 months to reflect farm partnership changes and new harvest angles. Buyer intent content refreshes every 12 months to update retailer availability and pricing.
Recipe refresh priority order
Recipe refresh priority runs by organic traffic rank. The top 20 recipes by monthly organic sessions get refreshed first (new photography, schema audit, related recipe internal links, updated nutrition). The next 40 get refreshed at 15 months. The remaining recipes get refreshed opportunistically when the ranking slips past position 15 in Google. Skipping the refresh cadence lets recipe rankings drift out of the top 3 inside 18 months as newer competitor recipes take the position.
Schema audit checklist per refresh
The schema audit checklist per refresh runs 8 items: Recipe schema completeness, aggregateRating count and accuracy, nutrition data accuracy, prepTime and cookTime match the recipe body, image URLs valid at CDN, related recipe internal links working, product card SKU URL live, and Google Search Console rich result eligibility validated. This checklist takes 20 minutes per recipe and prevents the schema drift that costs recipe rankings 20 to 40 positions quietly.
Reporting cadence for food brand content marketing
Reporting cadence on food brand content marketing runs a monthly executive report plus a quarterly business review. The monthly report ships in the first business week and covers organic sessions by pillar, top 10 ranking recipes with position trend, ingredient guide ranking movements, sourcing page performance, and organic-attributed DTC revenue. Every number carries a comparison to the prior month and a plain-language interpretation the founder reads in 7 minutes.
Metrics that matter for content marketing
Metrics that matter for food brand content marketing: organic sessions by pillar, recipe rich result impressions in Search Console, organic conversion rate to hero SKU pages, organic-attributed DTC revenue, and top 20 ranking positions by monthly organic sessions. Vanity metrics that do not matter: total pageviews without conversion context, average time on page without conversion attribution, and social share counts. The monthly report skips the vanity block entirely.
Quarterly business review structure
The quarterly business review runs 90 minutes with the founder, head of content, and SEO lead. Agenda: organic traffic trend by pillar, top 10 winning content pieces, top 10 losing content pieces (candidates for refresh or removal), competitive gap analysis against 5 named competitor brands, and next quarter’s content calendar with recipes and ingredient guides queued. According to Ahrefs content marketing research, brands running quarterly content audits outperform brands running annual audits by 40 to 70 percent on organic revenue over a 24-month window.
Internal linking discipline across food brand content
Internal linking discipline across food brand content moves authority from recipe pages toward hero SKU product pages and comparison guides. Every recipe links to the hero SKU it uses inline (once in the ingredient list, once in a bottom call-out card). Every ingredient comparison guide links to 3 to 6 recipes using the winning ingredient plus the hero SKU product page. Every sourcing story links to the 2 to 4 SKUs sourced from that specific farm or cooperative.
Anchor text strategy across recipe hubs
Anchor text on internal links varies across recipe hubs to avoid over-optimization patterns Google penalizes. Exact-match anchor (“single-origin Ethiopian coffee”) runs on 20 to 30 percent of internal links. Partial-match variations (“our Ethiopian roast”) run on 30 to 40 percent. Branded anchors (the SKU name) run on 20 to 30 percent. Generic anchors (“shop the coffee”) fill the remaining 10 to 20 percent. This ratio holds ranking without triggering the over-optimization penalty that shows up on brands that anchor-text-stuff every internal link with the same exact-match keyword. Cross-reference the linking layer on our food and beverage web design page.
Link equity from ingredient guides to SKU pages
Link equity from ingredient guides passes to SKU pages when the guide’s comparison table names the hero SKU in the winning column with a product card, and when the guide’s body links to 3 to 6 recipes that use the winning ingredient. This 3-hop path (guide to recipe to SKU) pushes authority from a high-traffic informational query down to a high-intent transactional page. According to Search Engine Land SEO coverage, informational content that internally links to transactional pages produces 2 to 4 times higher organic revenue than isolated content silos.
Wrapping up content marketing for food brands
Content marketing for food brands is the organic engine that turns a DTC snack, drink, or CPG storefront into a search-driven revenue channel. Recipe hub of 40 to 100 recipes. Ingredient comparison guides at 12 to 24 pieces. Sourcing story pages at 6 to 12 pieces. Buyer intent content at 8 to 16 pieces. Creator syndication calendar with 12 to 30 creators per quarter. Refresh cadence at 12 to 24 months by pillar. Reporting with organic sessions and organic revenue attribution.
If your DTC food brand is running paid social at 20,000 dollars monthly with a broken blog and zero recipe schema, professional content marketing for food brands pays for itself inside the first 90 days on organic traffic captured. Redefine Web ships content marketing inside our monthly retainer packages. Book a call and we will walk through the last three DTC food brands we built recipe hubs for, pillar by pillar.
Internal linking discipline across food brand content moves authority from recipe pages toward hero SKU product pages and comparison guides. Every recipe links to the hero SKU it uses inline (once in the ingredient list, once in a bottom call-out card). Every ingredient comparison guide links to 3 to 6 recipes using the winning ingredient plus the hero SKU product page. Every sourcing story links to the 2 to 4 SKUs sourced from that specific farm or cooperative.
Anchor text strategy across recipe hubs
Anchor text on internal links varies across recipe hubs to avoid over-optimization patterns Google penalizes. Exact-match anchor (“single-origin Ethiopian coffee”) runs on 20 to 30 percent of internal links. Partial-match variations (“our Ethiopian roast”) run on 30 to 40 percent. Branded anchors (the SKU name) run on 20 to 30 percent. Generic anchors (“shop the coffee”) fill the remaining 10 to 20 percent. This ratio holds ranking without triggering the over-optimization penalty that shows up on brands that anchor-text-stuff every internal link with the same exact-match keyword. Cross-reference the linking layer on our food and beverage web design page.
Link equity from ingredient guides to SKU pages
Link equity from ingredient guides passes to SKU pages when the guide’s comparison table names the hero SKU in the winning column with a product card, and when the guide’s body links to 3 to 6 recipes that use the winning ingredient. This 3-hop path (guide to recipe to SKU) pushes authority from a high-traffic informational query down to a high-intent transactional page. According to Search Engine Land SEO coverage, informational content that internally links to transactional pages produces 2 to 4 times higher organic revenue than isolated content silos.
Wrapping up content marketing for food brands
Content marketing for food brands is the organic engine that turns a DTC snack, drink, or CPG storefront into a search-driven revenue channel. Recipe hub of 40 to 100 recipes. Ingredient comparison guides at 12 to 24 pieces. Sourcing story pages at 6 to 12 pieces. Buyer intent content at 8 to 16 pieces. Creator syndication calendar with 12 to 30 creators per quarter. Refresh cadence at 12 to 24 months by pillar. Reporting with organic sessions and organic revenue attribution.
If your DTC food brand is running paid social at 20,000 dollars monthly with a broken blog and zero recipe schema, professional content marketing for food brands pays for itself inside the first 90 days on organic traffic captured. Redefine Web ships content marketing inside our monthly retainer packages. Book a call and we will walk through the last three DTC food brands we built recipe hubs for, pillar by pillar.
Content marketing for food brands starts with a recipe hub because recipe queries account for 40 to 60 percent of high-intent search volume in the food category. Every hero SKU needs 4 to 12 recipes anchored to it, each targeting a specific occasion and audience.
Skip the recipe hub and the brand loses the search real estate that pulls DTC storefront traffic month over month at zero incremental paid cost. Recipe traffic converts at 2 to 4 percent because the shopper landed with usage intent, not passive discovery, which is why food brands win on recipes.
Recipe schema and Google rich result eligibility
Every recipe page ships schema.org Recipe markup including cookTime, prepTime, recipeIngredient, recipeInstructions, nutrition, and aggregateRating. Correctly marked-up recipes qualify for Google’s recipe rich result carousel that pulls 3 to 6 times higher click-through rate than a plain blue link. The schema layer takes 15 minutes per recipe to author and 30 minutes to validate in Google Search Console. Cross-reference the recipe search stack on our food and beverage SEO page.
Recipe hub structure that scales
The recipe hub structure runs 40 to 100 recipes at maturity, organized by hero SKU (4 to 12 recipes per SKU) plus occasion tags (breakfast, weeknight dinner, meal prep, brunch, holiday). Every recipe links back to the hero SKU product page with the SKU embedded in an inline card. The hub earns internal linking value from ingredient comparison guides and the sourcing story pages, which feeds recipe ranking on Google. According to Google Search Central recipe structured data guidance, complete Recipe schema markup is required for eligibility in the recipe carousel and the ingredient search filter.
Pillar structure for food brand content marketing
The pillar structure on content marketing for food brands runs 4 content pillars concurrently: recipe hub (40 to 100 recipes), ingredient comparison guides (12 to 24 guides), sourcing story pages (6 to 12 pages), and buyer intent content (where to buy, subscription vs. one-time, gift bundle guides). Every pillar covers a distinct search intent and every pillar links back to the hero SKU product pages.
Ingredient comparison guide format
Ingredient comparison guides run 1,800 to 3,200 words comparing 2 to 4 ingredient types on 6 to 10 attributes with a comparison table, real-world use case examples, and links to the hero SKU that uses the specific ingredient. Example: organic vs. conventional oats compares nutritional profile, sourcing chain, cost, environmental impact, and taste on a 6-column table. The brand’s SKU appears in the winning column with a product card. These guides rank 3 to 8 months after publication and pull steady-state organic traffic.
Sourcing story pages that build trust
Sourcing story pages name the specific farms, cooperatives, or suppliers the brand sources from, with photos of the farms, farmer quotes, and specific harvest windows. A coffee brand’s Ethiopian farm page ranks for “single-origin Ethiopian coffee” and “Yirgacheffe coffee origin” plus 40 long-tail variations. The sourcing page pulls trust-building traffic that converts at 4 to 6 percent because the shopper landed pattern-matching on transparency and named provenance. Every sourcing page includes farmer or cooperative quotes, harvest dates, and a link back to 3 to 5 hero SKU pages that source from the named supplier.
Vejrø hospitality content case study
Vejrø Resort, a Danish private-island destination with an on-site restaurant focused on organic, locally sourced cuisine, joined us with strong social engagement and no organic-search real estate. Guests found the resort on Instagram but never in Google search for terms like “private island resort Denmark,” “farm-to-table hospitality Denmark,” or “Vejrø restaurant.” The same organic-search gap shows up on DTC food brands running paid social at 20,000 dollars monthly with a broken blog and zero recipe schema.
We built the conversion-focused website with on-site and off-site SEO tuned to the travel-niche keyword clusters, competitor analysis against comparable boutique resorts, and mobile-first design prioritizing guest discovery. Every page carried the structured data qualifying it for Google’s rich results in the hospitality category. Every internal link pushed authority toward the direct-booking conversion path.
Three months later, Vejrø hit 10,000 plus organic visitors, ranked for 200 plus first-page keywords, and pulled a 2.2 percent booking conversion rate from organic traffic. The same pattern applies to content marketing for food brands: recipe schema, ingredient comparison guides, and sourcing story pages pull organic traffic at 20 to 40 percent conversion into hero SKU pages inside 6 months when the content quality matches search intent and every page carries the right structured data markup. Vejrø also proved out the reporting discipline: every monthly report named the exact page, the exact keyword cluster, and the exact search feature (rich result, sitelinks, image pack) driving the incremental organic revenue instead of hiding behind aggregate traffic charts.
Recipe cadence and content calendar for food brands
Recipe cadence on a working food brand content calendar ships 2 to 4 new recipes per week during the first 6 months and drops to 1 per week at maturity. Each recipe takes 4 to 6 hours to produce (write, test in the kitchen, photograph, schema author, publish). At 3 recipes per week, the brand hits 78 recipes inside 6 months plus a backlog of ingredient comparison and sourcing content queued behind the recipe production line.
| Content pillar | Target volume year 1 | Production cost per piece | Refresh cadence |
|---|---|---|---|
| Recipe hub | 40 to 100 recipes | $180 to $320 | Every 12 months |
| Ingredient comparison guides | 12 to 24 guides | $450 to $780 | Every 18 months |
| Sourcing story pages | 6 to 12 pages | $680 to $1,200 | Every 24 months |
| Buyer intent content | 8 to 16 pieces | $220 to $420 | Every 12 months |
Photography as a content calendar constraint
Photography is the actual constraint on recipe cadence, not writing. Every recipe needs 6 to 12 photos: hero shot, ingredient flat lay, prep in progress, plated result, storage, and step shots for the schema markup. A working food brand batches photography 8 recipes at a time to keep the cost per recipe under 200 dollars. Skip the batching and the per-recipe cost climbs to 400 to 600 dollars, which caps recipe cadence at 1 per week and slows organic ranking timeline by 6 months.
Seasonal content calendar planning
Seasonal content calendar planning maps recipes and comparison guides to the seasonal windows they need to rank in. A Christmas cookie recipe needs to publish in September to rank by early December. A Valentine’s chocolate guide needs to publish in November to rank by early February. A back-to-school lunchbox recipe needs to publish in June to rank by late August. The 60-to-90-day ranking curve dictates the calendar.
Creator syndication inside food brand content
Creator syndication on food brand content marketing amplifies the recipe hub through Instagram Reels, TikTok, and YouTube Shorts creators paid to post their own version of the brand’s hero recipes. The creator content pulls net-new audiences into the recipe hub through the creator’s Link in Bio or Amazon Storefront tag. The syndication calendar names 12 to 30 creators per quarter with specific recipes assigned to each.
One brand we picked up had a spreadsheet titled “creator outreach 2023” with 47 rows and 3 responses. All 3 responses were auto-replies. The spreadsheet named zero recipes and offered flat rates below 100 dollars per post. Nobody posts a 30-second video for 87 dollars flat. Nobody.
Creator content commercial terms that work
Working creator content commercial terms run 350 to 1,500 dollars flat per post plus a 12 to 25 percent commission on tagged sales across a 30-day window. The commission mechanic pulls creators into follow-up posts because the incremental revenue continues past the initial fee. Mid-tier creators (30k to 150k followers) hit the sweet spot for food brand content because their engagement rate typically runs 4 to 8 percent versus 0.8 to 1.6 percent on mega-creators.
Content brief structure for creator partnerships
The content brief structure for creator partnerships runs a single page: the SKU, the specific recipe or usage occasion, 3 required brand mentions, 3 restricted claims (no health claims on non-medical SKUs), the pricing angle, the affiliate link, and 3 example videos that hit the tone. The brief avoids over-scripting because over-scripted creator content underperforms native creator voice by 40 to 60 percent on engagement rate.
Buyer intent content for food brand blogs
Buyer intent content on food brand blogs covers 8 to 16 pieces targeting explicit purchase-decision queries: “where to buy [brand],” “[brand] subscription vs. one-time,” “best [category] for [use case],” and “[brand] gift bundle.” Every buyer intent piece runs 1,400 to 2,400 words with a comparison table, product cards, and a clear conversion path to the specific SKU that matches the query intent. Buyer intent content converts at 3 to 6 percent versus 1 to 2 percent on recipe content because the shopper landed already planning to buy, not exploring a usage occasion.
Where-to-buy content structure
Where-to-buy content structure covers online (DTC storefront, Amazon, Target.com, Whole Foods online), retail (specific chain locators with the store finder embedded), and international (customs limitations, retailer partners abroad). Every piece names specific retailers, links to the store locator, and includes an FAQ block covering shipping availability, subscription options, and gift card compatibility. Where-to-buy content ranks for branded discovery queries the DTC storefront otherwise loses to competitor affiliate reviews.
Subscription versus one-time comparison content
Subscription versus one-time comparison content converts subscription commitments at 3 to 6 percent because it addresses the price-sensitivity concern head-on with a specific math table. The piece covers the discount structure (15 percent lifetime), the skip-a-month mechanic, the pause-anytime rule, the cancellation policy, and the specific yearly savings for the brand’s average consumption cadence. Cross-reference the retention structure on our food and beverage marketing retainer page.
Content refresh cadence on food brand pillars
Content refresh cadence on food brand content pillars runs a rolling audit every 12 to 24 months by pillar. Recipes get refreshed every 12 months with new photography, updated schema, and any nutrition or ingredient adjustments. Ingredient comparison guides refresh every 18 months to update market data. Sourcing story pages refresh every 24 months to reflect farm partnership changes and new harvest angles. Buyer intent content refreshes every 12 months to update retailer availability and pricing.
Recipe refresh priority order
Recipe refresh priority runs by organic traffic rank. The top 20 recipes by monthly organic sessions get refreshed first (new photography, schema audit, related recipe internal links, updated nutrition). The next 40 get refreshed at 15 months. The remaining recipes get refreshed opportunistically when the ranking slips past position 15 in Google. Skipping the refresh cadence lets recipe rankings drift out of the top 3 inside 18 months as newer competitor recipes take the position.
Schema audit checklist per refresh
The schema audit checklist per refresh runs 8 items: Recipe schema completeness, aggregateRating count and accuracy, nutrition data accuracy, prepTime and cookTime match the recipe body, image URLs valid at CDN, related recipe internal links working, product card SKU URL live, and Google Search Console rich result eligibility validated. This checklist takes 20 minutes per recipe and prevents the schema drift that costs recipe rankings 20 to 40 positions quietly.
Reporting cadence for food brand content marketing
Reporting cadence on food brand content marketing runs a monthly executive report plus a quarterly business review. The monthly report ships in the first business week and covers organic sessions by pillar, top 10 ranking recipes with position trend, ingredient guide ranking movements, sourcing page performance, and organic-attributed DTC revenue. Every number carries a comparison to the prior month and a plain-language interpretation the founder reads in 7 minutes.
Metrics that matter for content marketing
Metrics that matter for food brand content marketing: organic sessions by pillar, recipe rich result impressions in Search Console, organic conversion rate to hero SKU pages, organic-attributed DTC revenue, and top 20 ranking positions by monthly organic sessions. Vanity metrics that do not matter: total pageviews without conversion context, average time on page without conversion attribution, and social share counts. The monthly report skips the vanity block entirely.
Quarterly business review structure
The quarterly business review runs 90 minutes with the founder, head of content, and SEO lead. Agenda: organic traffic trend by pillar, top 10 winning content pieces, top 10 losing content pieces (candidates for refresh or removal), competitive gap analysis against 5 named competitor brands, and next quarter’s content calendar with recipes and ingredient guides queued. According to Ahrefs content marketing research, brands running quarterly content audits outperform brands running annual audits by 40 to 70 percent on organic revenue over a 24-month window.
Internal linking discipline across food brand content
Internal linking discipline across food brand content moves authority from recipe pages toward hero SKU product pages and comparison guides. Every recipe links to the hero SKU it uses inline (once in the ingredient list, once in a bottom call-out card). Every ingredient comparison guide links to 3 to 6 recipes using the winning ingredient plus the hero SKU product page. Every sourcing story links to the 2 to 4 SKUs sourced from that specific farm or cooperative.
Anchor text strategy across recipe hubs
Anchor text on internal links varies across recipe hubs to avoid over-optimization patterns Google penalizes. Exact-match anchor (“single-origin Ethiopian coffee”) runs on 20 to 30 percent of internal links. Partial-match variations (“our Ethiopian roast”) run on 30 to 40 percent. Branded anchors (the SKU name) run on 20 to 30 percent. Generic anchors (“shop the coffee”) fill the remaining 10 to 20 percent. This ratio holds ranking without triggering the over-optimization penalty that shows up on brands that anchor-text-stuff every internal link with the same exact-match keyword. Cross-reference the linking layer on our food and beverage web design page.
Link equity from ingredient guides to SKU pages
Link equity from ingredient guides passes to SKU pages when the guide’s comparison table names the hero SKU in the winning column with a product card, and when the guide’s body links to 3 to 6 recipes that use the winning ingredient. This 3-hop path (guide to recipe to SKU) pushes authority from a high-traffic informational query down to a high-intent transactional page. According to Search Engine Land SEO coverage, informational content that internally links to transactional pages produces 2 to 4 times higher organic revenue than isolated content silos.
Wrapping up content marketing for food brands
Content marketing for food brands is the organic engine that turns a DTC snack, drink, or CPG storefront into a search-driven revenue channel. Recipe hub of 40 to 100 recipes. Ingredient comparison guides at 12 to 24 pieces. Sourcing story pages at 6 to 12 pieces. Buyer intent content at 8 to 16 pieces. Creator syndication calendar with 12 to 30 creators per quarter. Refresh cadence at 12 to 24 months by pillar. Reporting with organic sessions and organic revenue attribution.
If your DTC food brand is running paid social at 20,000 dollars monthly with a broken blog and zero recipe schema, professional content marketing for food brands pays for itself inside the first 90 days on organic traffic captured. Redefine Web ships content marketing inside our monthly retainer packages. Book a call and we will walk through the last three DTC food brands we built recipe hubs for, pillar by pillar.
Content marketing for food brands starts with a recipe hub because recipe queries account for 40 to 60 percent of high-intent search volume in the food category. Every hero SKU needs 4 to 12 recipes anchored to it, each targeting a specific occasion and audience.
Skip the recipe hub and the brand loses the search real estate that pulls DTC storefront traffic month over month at zero incremental paid cost. Recipe traffic converts at 2 to 4 percent because the shopper landed with usage intent, not passive discovery, which is why food brands win on recipes.
Recipe schema and Google rich result eligibility
Every recipe page ships schema.org Recipe markup including cookTime, prepTime, recipeIngredient, recipeInstructions, nutrition, and aggregateRating. Correctly marked-up recipes qualify for Google’s recipe rich result carousel that pulls 3 to 6 times higher click-through rate than a plain blue link. The schema layer takes 15 minutes per recipe to author and 30 minutes to validate in Google Search Console. Cross-reference the recipe search stack on our food and beverage SEO page.
Recipe hub structure that scales
The recipe hub structure runs 40 to 100 recipes at maturity, organized by hero SKU (4 to 12 recipes per SKU) plus occasion tags (breakfast, weeknight dinner, meal prep, brunch, holiday). Every recipe links back to the hero SKU product page with the SKU embedded in an inline card. The hub earns internal linking value from ingredient comparison guides and the sourcing story pages, which feeds recipe ranking on Google. According to Google Search Central recipe structured data guidance, complete Recipe schema markup is required for eligibility in the recipe carousel and the ingredient search filter.
Pillar structure for food brand content marketing
The pillar structure on content marketing for food brands runs 4 content pillars concurrently: recipe hub (40 to 100 recipes), ingredient comparison guides (12 to 24 guides), sourcing story pages (6 to 12 pages), and buyer intent content (where to buy, subscription vs. one-time, gift bundle guides). Every pillar covers a distinct search intent and every pillar links back to the hero SKU product pages.
Ingredient comparison guide format
Ingredient comparison guides run 1,800 to 3,200 words comparing 2 to 4 ingredient types on 6 to 10 attributes with a comparison table, real-world use case examples, and links to the hero SKU that uses the specific ingredient. Example: organic vs. conventional oats compares nutritional profile, sourcing chain, cost, environmental impact, and taste on a 6-column table. The brand’s SKU appears in the winning column with a product card. These guides rank 3 to 8 months after publication and pull steady-state organic traffic.
Sourcing story pages that build trust
Sourcing story pages name the specific farms, cooperatives, or suppliers the brand sources from, with photos of the farms, farmer quotes, and specific harvest windows. A coffee brand’s Ethiopian farm page ranks for “single-origin Ethiopian coffee” and “Yirgacheffe coffee origin” plus 40 long-tail variations. The sourcing page pulls trust-building traffic that converts at 4 to 6 percent because the shopper landed pattern-matching on transparency and named provenance. Every sourcing page includes farmer or cooperative quotes, harvest dates, and a link back to 3 to 5 hero SKU pages that source from the named supplier.
Vejrø hospitality content case study
Vejrø Resort, a Danish private-island destination with an on-site restaurant focused on organic, locally sourced cuisine, joined us with strong social engagement and no organic-search real estate. Guests found the resort on Instagram but never in Google search for terms like “private island resort Denmark,” “farm-to-table hospitality Denmark,” or “Vejrø restaurant.” The same organic-search gap shows up on DTC food brands running paid social at 20,000 dollars monthly with a broken blog and zero recipe schema.
We built the conversion-focused website with on-site and off-site SEO tuned to the travel-niche keyword clusters, competitor analysis against comparable boutique resorts, and mobile-first design prioritizing guest discovery. Every page carried the structured data qualifying it for Google’s rich results in the hospitality category. Every internal link pushed authority toward the direct-booking conversion path.
Three months later, Vejrø hit 10,000 plus organic visitors, ranked for 200 plus first-page keywords, and pulled a 2.2 percent booking conversion rate from organic traffic. The same pattern applies to content marketing for food brands: recipe schema, ingredient comparison guides, and sourcing story pages pull organic traffic at 20 to 40 percent conversion into hero SKU pages inside 6 months when the content quality matches search intent and every page carries the right structured data markup. Vejrø also proved out the reporting discipline: every monthly report named the exact page, the exact keyword cluster, and the exact search feature (rich result, sitelinks, image pack) driving the incremental organic revenue instead of hiding behind aggregate traffic charts.
Recipe cadence and content calendar for food brands
Recipe cadence on a working food brand content calendar ships 2 to 4 new recipes per week during the first 6 months and drops to 1 per week at maturity. Each recipe takes 4 to 6 hours to produce (write, test in the kitchen, photograph, schema author, publish). At 3 recipes per week, the brand hits 78 recipes inside 6 months plus a backlog of ingredient comparison and sourcing content queued behind the recipe production line.
| Content pillar | Target volume year 1 | Production cost per piece | Refresh cadence |
|---|---|---|---|
| Recipe hub | 40 to 100 recipes | $180 to $320 | Every 12 months |
| Ingredient comparison guides | 12 to 24 guides | $450 to $780 | Every 18 months |
| Sourcing story pages | 6 to 12 pages | $680 to $1,200 | Every 24 months |
| Buyer intent content | 8 to 16 pieces | $220 to $420 | Every 12 months |
Photography as a content calendar constraint
Photography is the actual constraint on recipe cadence, not writing. Every recipe needs 6 to 12 photos: hero shot, ingredient flat lay, prep in progress, plated result, storage, and step shots for the schema markup. A working food brand batches photography 8 recipes at a time to keep the cost per recipe under 200 dollars. Skip the batching and the per-recipe cost climbs to 400 to 600 dollars, which caps recipe cadence at 1 per week and slows organic ranking timeline by 6 months.
Seasonal content calendar planning
Seasonal content calendar planning maps recipes and comparison guides to the seasonal windows they need to rank in. A Christmas cookie recipe needs to publish in September to rank by early December. A Valentine’s chocolate guide needs to publish in November to rank by early February. A back-to-school lunchbox recipe needs to publish in June to rank by late August. The 60-to-90-day ranking curve dictates the calendar.
Creator syndication inside food brand content
Creator syndication on food brand content marketing amplifies the recipe hub through Instagram Reels, TikTok, and YouTube Shorts creators paid to post their own version of the brand’s hero recipes. The creator content pulls net-new audiences into the recipe hub through the creator’s Link in Bio or Amazon Storefront tag. The syndication calendar names 12 to 30 creators per quarter with specific recipes assigned to each.
One brand we picked up had a spreadsheet titled “creator outreach 2023” with 47 rows and 3 responses. All 3 responses were auto-replies. The spreadsheet named zero recipes and offered flat rates below 100 dollars per post. Nobody posts a 30-second video for 87 dollars flat. Nobody.
Creator content commercial terms that work
Working creator content commercial terms run 350 to 1,500 dollars flat per post plus a 12 to 25 percent commission on tagged sales across a 30-day window. The commission mechanic pulls creators into follow-up posts because the incremental revenue continues past the initial fee. Mid-tier creators (30k to 150k followers) hit the sweet spot for food brand content because their engagement rate typically runs 4 to 8 percent versus 0.8 to 1.6 percent on mega-creators.
Content brief structure for creator partnerships
The content brief structure for creator partnerships runs a single page: the SKU, the specific recipe or usage occasion, 3 required brand mentions, 3 restricted claims (no health claims on non-medical SKUs), the pricing angle, the affiliate link, and 3 example videos that hit the tone. The brief avoids over-scripting because over-scripted creator content underperforms native creator voice by 40 to 60 percent on engagement rate.
Buyer intent content for food brand blogs
Buyer intent content on food brand blogs covers 8 to 16 pieces targeting explicit purchase-decision queries: “where to buy [brand],” “[brand] subscription vs. one-time,” “best [category] for [use case],” and “[brand] gift bundle.” Every buyer intent piece runs 1,400 to 2,400 words with a comparison table, product cards, and a clear conversion path to the specific SKU that matches the query intent. Buyer intent content converts at 3 to 6 percent versus 1 to 2 percent on recipe content because the shopper landed already planning to buy, not exploring a usage occasion.
Where-to-buy content structure
Where-to-buy content structure covers online (DTC storefront, Amazon, Target.com, Whole Foods online), retail (specific chain locators with the store finder embedded), and international (customs limitations, retailer partners abroad). Every piece names specific retailers, links to the store locator, and includes an FAQ block covering shipping availability, subscription options, and gift card compatibility. Where-to-buy content ranks for branded discovery queries the DTC storefront otherwise loses to competitor affiliate reviews.
Subscription versus one-time comparison content
Subscription versus one-time comparison content converts subscription commitments at 3 to 6 percent because it addresses the price-sensitivity concern head-on with a specific math table. The piece covers the discount structure (15 percent lifetime), the skip-a-month mechanic, the pause-anytime rule, the cancellation policy, and the specific yearly savings for the brand’s average consumption cadence. Cross-reference the retention structure on our food and beverage marketing retainer page.
Content refresh cadence on food brand pillars
Content refresh cadence on food brand content pillars runs a rolling audit every 12 to 24 months by pillar. Recipes get refreshed every 12 months with new photography, updated schema, and any nutrition or ingredient adjustments. Ingredient comparison guides refresh every 18 months to update market data. Sourcing story pages refresh every 24 months to reflect farm partnership changes and new harvest angles. Buyer intent content refreshes every 12 months to update retailer availability and pricing.
Recipe refresh priority order
Recipe refresh priority runs by organic traffic rank. The top 20 recipes by monthly organic sessions get refreshed first (new photography, schema audit, related recipe internal links, updated nutrition). The next 40 get refreshed at 15 months. The remaining recipes get refreshed opportunistically when the ranking slips past position 15 in Google. Skipping the refresh cadence lets recipe rankings drift out of the top 3 inside 18 months as newer competitor recipes take the position.
Schema audit checklist per refresh
The schema audit checklist per refresh runs 8 items: Recipe schema completeness, aggregateRating count and accuracy, nutrition data accuracy, prepTime and cookTime match the recipe body, image URLs valid at CDN, related recipe internal links working, product card SKU URL live, and Google Search Console rich result eligibility validated. This checklist takes 20 minutes per recipe and prevents the schema drift that costs recipe rankings 20 to 40 positions quietly.
Reporting cadence for food brand content marketing
Reporting cadence on food brand content marketing runs a monthly executive report plus a quarterly business review. The monthly report ships in the first business week and covers organic sessions by pillar, top 10 ranking recipes with position trend, ingredient guide ranking movements, sourcing page performance, and organic-attributed DTC revenue. Every number carries a comparison to the prior month and a plain-language interpretation the founder reads in 7 minutes.
Metrics that matter for content marketing
Metrics that matter for food brand content marketing: organic sessions by pillar, recipe rich result impressions in Search Console, organic conversion rate to hero SKU pages, organic-attributed DTC revenue, and top 20 ranking positions by monthly organic sessions. Vanity metrics that do not matter: total pageviews without conversion context, average time on page without conversion attribution, and social share counts. The monthly report skips the vanity block entirely.
Quarterly business review structure
The quarterly business review runs 90 minutes with the founder, head of content, and SEO lead. Agenda: organic traffic trend by pillar, top 10 winning content pieces, top 10 losing content pieces (candidates for refresh or removal), competitive gap analysis against 5 named competitor brands, and next quarter’s content calendar with recipes and ingredient guides queued. According to Ahrefs content marketing research, brands running quarterly content audits outperform brands running annual audits by 40 to 70 percent on organic revenue over a 24-month window.
Internal linking discipline across food brand content
Internal linking discipline across food brand content moves authority from recipe pages toward hero SKU product pages and comparison guides. Every recipe links to the hero SKU it uses inline (once in the ingredient list, once in a bottom call-out card). Every ingredient comparison guide links to 3 to 6 recipes using the winning ingredient plus the hero SKU product page. Every sourcing story links to the 2 to 4 SKUs sourced from that specific farm or cooperative.
Anchor text strategy across recipe hubs
Anchor text on internal links varies across recipe hubs to avoid over-optimization patterns Google penalizes. Exact-match anchor (“single-origin Ethiopian coffee”) runs on 20 to 30 percent of internal links. Partial-match variations (“our Ethiopian roast”) run on 30 to 40 percent. Branded anchors (the SKU name) run on 20 to 30 percent. Generic anchors (“shop the coffee”) fill the remaining 10 to 20 percent. This ratio holds ranking without triggering the over-optimization penalty that shows up on brands that anchor-text-stuff every internal link with the same exact-match keyword. Cross-reference the linking layer on our food and beverage web design page.
Link equity from ingredient guides to SKU pages
Link equity from ingredient guides passes to SKU pages when the guide’s comparison table names the hero SKU in the winning column with a product card, and when the guide’s body links to 3 to 6 recipes that use the winning ingredient. This 3-hop path (guide to recipe to SKU) pushes authority from a high-traffic informational query down to a high-intent transactional page. According to Search Engine Land SEO coverage, informational content that internally links to transactional pages produces 2 to 4 times higher organic revenue than isolated content silos.
Wrapping up content marketing for food brands
Content marketing for food brands is the organic engine that turns a DTC snack, drink, or CPG storefront into a search-driven revenue channel. Recipe hub of 40 to 100 recipes. Ingredient comparison guides at 12 to 24 pieces. Sourcing story pages at 6 to 12 pieces. Buyer intent content at 8 to 16 pieces. Creator syndication calendar with 12 to 30 creators per quarter. Refresh cadence at 12 to 24 months by pillar. Reporting with organic sessions and organic revenue attribution.
If your DTC food brand is running paid social at 20,000 dollars monthly with a broken blog and zero recipe schema, professional content marketing for food brands pays for itself inside the first 90 days on organic traffic captured. Redefine Web ships content marketing inside our monthly retainer packages. Book a call and we will walk through the last three DTC food brands we built recipe hubs for, pillar by pillar.
Anchor text on internal links varies across recipe hubs to avoid over-optimization patterns Google penalizes. Exact-match anchor (“single-origin Ethiopian coffee”) runs on 20 to 30 percent of internal links. Partial-match variations (“our Ethiopian roast”) run on 30 to 40 percent. Branded anchors (the SKU name) run on 20 to 30 percent. Generic anchors (“shop the coffee”) fill the remaining 10 to 20 percent. This ratio holds ranking without triggering the over-optimization penalty that shows up on brands that anchor-text-stuff every internal link with the same exact-match keyword. Cross-reference the linking layer on our food and beverage web design page.
Link equity from ingredient guides to SKU pages
Link equity from ingredient guides passes to SKU pages when the guide’s comparison table names the hero SKU in the winning column with a product card, and when the guide’s body links to 3 to 6 recipes that use the winning ingredient. This 3-hop path (guide to recipe to SKU) pushes authority from a high-traffic informational query down to a high-intent transactional page. According to Search Engine Land SEO coverage, informational content that internally links to transactional pages produces 2 to 4 times higher organic revenue than isolated content silos.
Wrapping up content marketing for food brands
Content marketing for food brands is the organic engine that turns a DTC snack, drink, or CPG storefront into a search-driven revenue channel. Recipe hub of 40 to 100 recipes. Ingredient comparison guides at 12 to 24 pieces. Sourcing story pages at 6 to 12 pieces. Buyer intent content at 8 to 16 pieces. Creator syndication calendar with 12 to 30 creators per quarter. Refresh cadence at 12 to 24 months by pillar. Reporting with organic sessions and organic revenue attribution.
If your DTC food brand is running paid social at 20,000 dollars monthly with a broken blog and zero recipe schema, professional content marketing for food brands pays for itself inside the first 90 days on organic traffic captured. Redefine Web ships content marketing inside our monthly retainer packages. Book a call and we will walk through the last three DTC food brands we built recipe hubs for, pillar by pillar.
Internal linking discipline across food brand content moves authority from recipe pages toward hero SKU product pages and comparison guides. Every recipe links to the hero SKU it uses inline (once in the ingredient list, once in a bottom call-out card). Every ingredient comparison guide links to 3 to 6 recipes using the winning ingredient plus the hero SKU product page. Every sourcing story links to the 2 to 4 SKUs sourced from that specific farm or cooperative.
Anchor text strategy across recipe hubs
Anchor text on internal links varies across recipe hubs to avoid over-optimization patterns Google penalizes. Exact-match anchor (“single-origin Ethiopian coffee”) runs on 20 to 30 percent of internal links. Partial-match variations (“our Ethiopian roast”) run on 30 to 40 percent. Branded anchors (the SKU name) run on 20 to 30 percent. Generic anchors (“shop the coffee”) fill the remaining 10 to 20 percent. This ratio holds ranking without triggering the over-optimization penalty that shows up on brands that anchor-text-stuff every internal link with the same exact-match keyword. Cross-reference the linking layer on our food and beverage web design page.
Link equity from ingredient guides to SKU pages
Link equity from ingredient guides passes to SKU pages when the guide’s comparison table names the hero SKU in the winning column with a product card, and when the guide’s body links to 3 to 6 recipes that use the winning ingredient. This 3-hop path (guide to recipe to SKU) pushes authority from a high-traffic informational query down to a high-intent transactional page. According to Search Engine Land SEO coverage, informational content that internally links to transactional pages produces 2 to 4 times higher organic revenue than isolated content silos.
Wrapping up content marketing for food brands
Content marketing for food brands is the organic engine that turns a DTC snack, drink, or CPG storefront into a search-driven revenue channel. Recipe hub of 40 to 100 recipes. Ingredient comparison guides at 12 to 24 pieces. Sourcing story pages at 6 to 12 pieces. Buyer intent content at 8 to 16 pieces. Creator syndication calendar with 12 to 30 creators per quarter. Refresh cadence at 12 to 24 months by pillar. Reporting with organic sessions and organic revenue attribution.
If your DTC food brand is running paid social at 20,000 dollars monthly with a broken blog and zero recipe schema, professional content marketing for food brands pays for itself inside the first 90 days on organic traffic captured. Redefine Web ships content marketing inside our monthly retainer packages. Book a call and we will walk through the last three DTC food brands we built recipe hubs for, pillar by pillar.
Content marketing for food brands starts with a recipe hub because recipe queries account for 40 to 60 percent of high-intent search volume in the food category. Every hero SKU needs 4 to 12 recipes anchored to it, each targeting a specific occasion and audience.
Skip the recipe hub and the brand loses the search real estate that pulls DTC storefront traffic month over month at zero incremental paid cost. Recipe traffic converts at 2 to 4 percent because the shopper landed with usage intent, not passive discovery, which is why food brands win on recipes.
Recipe schema and Google rich result eligibility
Every recipe page ships schema.org Recipe markup including cookTime, prepTime, recipeIngredient, recipeInstructions, nutrition, and aggregateRating. Correctly marked-up recipes qualify for Google’s recipe rich result carousel that pulls 3 to 6 times higher click-through rate than a plain blue link. The schema layer takes 15 minutes per recipe to author and 30 minutes to validate in Google Search Console. Cross-reference the recipe search stack on our food and beverage SEO page.
Recipe hub structure that scales
The recipe hub structure runs 40 to 100 recipes at maturity, organized by hero SKU (4 to 12 recipes per SKU) plus occasion tags (breakfast, weeknight dinner, meal prep, brunch, holiday). Every recipe links back to the hero SKU product page with the SKU embedded in an inline card. The hub earns internal linking value from ingredient comparison guides and the sourcing story pages, which feeds recipe ranking on Google. According to Google Search Central recipe structured data guidance, complete Recipe schema markup is required for eligibility in the recipe carousel and the ingredient search filter.
Pillar structure for food brand content marketing
The pillar structure on content marketing for food brands runs 4 content pillars concurrently: recipe hub (40 to 100 recipes), ingredient comparison guides (12 to 24 guides), sourcing story pages (6 to 12 pages), and buyer intent content (where to buy, subscription vs. one-time, gift bundle guides). Every pillar covers a distinct search intent and every pillar links back to the hero SKU product pages.
Ingredient comparison guide format
Ingredient comparison guides run 1,800 to 3,200 words comparing 2 to 4 ingredient types on 6 to 10 attributes with a comparison table, real-world use case examples, and links to the hero SKU that uses the specific ingredient. Example: organic vs. conventional oats compares nutritional profile, sourcing chain, cost, environmental impact, and taste on a 6-column table. The brand’s SKU appears in the winning column with a product card. These guides rank 3 to 8 months after publication and pull steady-state organic traffic.
Sourcing story pages that build trust
Sourcing story pages name the specific farms, cooperatives, or suppliers the brand sources from, with photos of the farms, farmer quotes, and specific harvest windows. A coffee brand’s Ethiopian farm page ranks for “single-origin Ethiopian coffee” and “Yirgacheffe coffee origin” plus 40 long-tail variations. The sourcing page pulls trust-building traffic that converts at 4 to 6 percent because the shopper landed pattern-matching on transparency and named provenance. Every sourcing page includes farmer or cooperative quotes, harvest dates, and a link back to 3 to 5 hero SKU pages that source from the named supplier.
Vejrø hospitality content case study
Vejrø Resort, a Danish private-island destination with an on-site restaurant focused on organic, locally sourced cuisine, joined us with strong social engagement and no organic-search real estate. Guests found the resort on Instagram but never in Google search for terms like “private island resort Denmark,” “farm-to-table hospitality Denmark,” or “Vejrø restaurant.” The same organic-search gap shows up on DTC food brands running paid social at 20,000 dollars monthly with a broken blog and zero recipe schema.
We built the conversion-focused website with on-site and off-site SEO tuned to the travel-niche keyword clusters, competitor analysis against comparable boutique resorts, and mobile-first design prioritizing guest discovery. Every page carried the structured data qualifying it for Google’s rich results in the hospitality category. Every internal link pushed authority toward the direct-booking conversion path.
Three months later, Vejrø hit 10,000 plus organic visitors, ranked for 200 plus first-page keywords, and pulled a 2.2 percent booking conversion rate from organic traffic. The same pattern applies to content marketing for food brands: recipe schema, ingredient comparison guides, and sourcing story pages pull organic traffic at 20 to 40 percent conversion into hero SKU pages inside 6 months when the content quality matches search intent and every page carries the right structured data markup. Vejrø also proved out the reporting discipline: every monthly report named the exact page, the exact keyword cluster, and the exact search feature (rich result, sitelinks, image pack) driving the incremental organic revenue instead of hiding behind aggregate traffic charts.
Recipe cadence and content calendar for food brands
Recipe cadence on a working food brand content calendar ships 2 to 4 new recipes per week during the first 6 months and drops to 1 per week at maturity. Each recipe takes 4 to 6 hours to produce (write, test in the kitchen, photograph, schema author, publish). At 3 recipes per week, the brand hits 78 recipes inside 6 months plus a backlog of ingredient comparison and sourcing content queued behind the recipe production line.
| Content pillar | Target volume year 1 | Production cost per piece | Refresh cadence |
|---|---|---|---|
| Recipe hub | 40 to 100 recipes | $180 to $320 | Every 12 months |
| Ingredient comparison guides | 12 to 24 guides | $450 to $780 | Every 18 months |
| Sourcing story pages | 6 to 12 pages | $680 to $1,200 | Every 24 months |
| Buyer intent content | 8 to 16 pieces | $220 to $420 | Every 12 months |
Photography as a content calendar constraint
Photography is the actual constraint on recipe cadence, not writing. Every recipe needs 6 to 12 photos: hero shot, ingredient flat lay, prep in progress, plated result, storage, and step shots for the schema markup. A working food brand batches photography 8 recipes at a time to keep the cost per recipe under 200 dollars. Skip the batching and the per-recipe cost climbs to 400 to 600 dollars, which caps recipe cadence at 1 per week and slows organic ranking timeline by 6 months.
Seasonal content calendar planning
Seasonal content calendar planning maps recipes and comparison guides to the seasonal windows they need to rank in. A Christmas cookie recipe needs to publish in September to rank by early December. A Valentine’s chocolate guide needs to publish in November to rank by early February. A back-to-school lunchbox recipe needs to publish in June to rank by late August. The 60-to-90-day ranking curve dictates the calendar.
Creator syndication inside food brand content
Creator syndication on food brand content marketing amplifies the recipe hub through Instagram Reels, TikTok, and YouTube Shorts creators paid to post their own version of the brand’s hero recipes. The creator content pulls net-new audiences into the recipe hub through the creator’s Link in Bio or Amazon Storefront tag. The syndication calendar names 12 to 30 creators per quarter with specific recipes assigned to each.
One brand we picked up had a spreadsheet titled “creator outreach 2023” with 47 rows and 3 responses. All 3 responses were auto-replies. The spreadsheet named zero recipes and offered flat rates below 100 dollars per post. Nobody posts a 30-second video for 87 dollars flat. Nobody.
Creator content commercial terms that work
Working creator content commercial terms run 350 to 1,500 dollars flat per post plus a 12 to 25 percent commission on tagged sales across a 30-day window. The commission mechanic pulls creators into follow-up posts because the incremental revenue continues past the initial fee. Mid-tier creators (30k to 150k followers) hit the sweet spot for food brand content because their engagement rate typically runs 4 to 8 percent versus 0.8 to 1.6 percent on mega-creators.
Content brief structure for creator partnerships
The content brief structure for creator partnerships runs a single page: the SKU, the specific recipe or usage occasion, 3 required brand mentions, 3 restricted claims (no health claims on non-medical SKUs), the pricing angle, the affiliate link, and 3 example videos that hit the tone. The brief avoids over-scripting because over-scripted creator content underperforms native creator voice by 40 to 60 percent on engagement rate.
Buyer intent content for food brand blogs
Buyer intent content on food brand blogs covers 8 to 16 pieces targeting explicit purchase-decision queries: “where to buy [brand],” “[brand] subscription vs. one-time,” “best [category] for [use case],” and “[brand] gift bundle.” Every buyer intent piece runs 1,400 to 2,400 words with a comparison table, product cards, and a clear conversion path to the specific SKU that matches the query intent. Buyer intent content converts at 3 to 6 percent versus 1 to 2 percent on recipe content because the shopper landed already planning to buy, not exploring a usage occasion.
Where-to-buy content structure
Where-to-buy content structure covers online (DTC storefront, Amazon, Target.com, Whole Foods online), retail (specific chain locators with the store finder embedded), and international (customs limitations, retailer partners abroad). Every piece names specific retailers, links to the store locator, and includes an FAQ block covering shipping availability, subscription options, and gift card compatibility. Where-to-buy content ranks for branded discovery queries the DTC storefront otherwise loses to competitor affiliate reviews.
Subscription versus one-time comparison content
Subscription versus one-time comparison content converts subscription commitments at 3 to 6 percent because it addresses the price-sensitivity concern head-on with a specific math table. The piece covers the discount structure (15 percent lifetime), the skip-a-month mechanic, the pause-anytime rule, the cancellation policy, and the specific yearly savings for the brand’s average consumption cadence. Cross-reference the retention structure on our food and beverage marketing retainer page.
Content refresh cadence on food brand pillars
Content refresh cadence on food brand content pillars runs a rolling audit every 12 to 24 months by pillar. Recipes get refreshed every 12 months with new photography, updated schema, and any nutrition or ingredient adjustments. Ingredient comparison guides refresh every 18 months to update market data. Sourcing story pages refresh every 24 months to reflect farm partnership changes and new harvest angles. Buyer intent content refreshes every 12 months to update retailer availability and pricing.
Recipe refresh priority order
Recipe refresh priority runs by organic traffic rank. The top 20 recipes by monthly organic sessions get refreshed first (new photography, schema audit, related recipe internal links, updated nutrition). The next 40 get refreshed at 15 months. The remaining recipes get refreshed opportunistically when the ranking slips past position 15 in Google. Skipping the refresh cadence lets recipe rankings drift out of the top 3 inside 18 months as newer competitor recipes take the position.
Schema audit checklist per refresh
The schema audit checklist per refresh runs 8 items: Recipe schema completeness, aggregateRating count and accuracy, nutrition data accuracy, prepTime and cookTime match the recipe body, image URLs valid at CDN, related recipe internal links working, product card SKU URL live, and Google Search Console rich result eligibility validated. This checklist takes 20 minutes per recipe and prevents the schema drift that costs recipe rankings 20 to 40 positions quietly.
Reporting cadence for food brand content marketing
Reporting cadence on food brand content marketing runs a monthly executive report plus a quarterly business review. The monthly report ships in the first business week and covers organic sessions by pillar, top 10 ranking recipes with position trend, ingredient guide ranking movements, sourcing page performance, and organic-attributed DTC revenue. Every number carries a comparison to the prior month and a plain-language interpretation the founder reads in 7 minutes.
Metrics that matter for content marketing
Metrics that matter for food brand content marketing: organic sessions by pillar, recipe rich result impressions in Search Console, organic conversion rate to hero SKU pages, organic-attributed DTC revenue, and top 20 ranking positions by monthly organic sessions. Vanity metrics that do not matter: total pageviews without conversion context, average time on page without conversion attribution, and social share counts. The monthly report skips the vanity block entirely.
Quarterly business review structure
The quarterly business review runs 90 minutes with the founder, head of content, and SEO lead. Agenda: organic traffic trend by pillar, top 10 winning content pieces, top 10 losing content pieces (candidates for refresh or removal), competitive gap analysis against 5 named competitor brands, and next quarter’s content calendar with recipes and ingredient guides queued. According to Ahrefs content marketing research, brands running quarterly content audits outperform brands running annual audits by 40 to 70 percent on organic revenue over a 24-month window.
Internal linking discipline across food brand content
Internal linking discipline across food brand content moves authority from recipe pages toward hero SKU product pages and comparison guides. Every recipe links to the hero SKU it uses inline (once in the ingredient list, once in a bottom call-out card). Every ingredient comparison guide links to 3 to 6 recipes using the winning ingredient plus the hero SKU product page. Every sourcing story links to the 2 to 4 SKUs sourced from that specific farm or cooperative.
Anchor text strategy across recipe hubs
Anchor text on internal links varies across recipe hubs to avoid over-optimization patterns Google penalizes. Exact-match anchor (“single-origin Ethiopian coffee”) runs on 20 to 30 percent of internal links. Partial-match variations (“our Ethiopian roast”) run on 30 to 40 percent. Branded anchors (the SKU name) run on 20 to 30 percent. Generic anchors (“shop the coffee”) fill the remaining 10 to 20 percent. This ratio holds ranking without triggering the over-optimization penalty that shows up on brands that anchor-text-stuff every internal link with the same exact-match keyword. Cross-reference the linking layer on our food and beverage web design page.
Link equity from ingredient guides to SKU pages
Link equity from ingredient guides passes to SKU pages when the guide’s comparison table names the hero SKU in the winning column with a product card, and when the guide’s body links to 3 to 6 recipes that use the winning ingredient. This 3-hop path (guide to recipe to SKU) pushes authority from a high-traffic informational query down to a high-intent transactional page. According to Search Engine Land SEO coverage, informational content that internally links to transactional pages produces 2 to 4 times higher organic revenue than isolated content silos.
Wrapping up content marketing for food brands
Content marketing for food brands is the organic engine that turns a DTC snack, drink, or CPG storefront into a search-driven revenue channel. Recipe hub of 40 to 100 recipes. Ingredient comparison guides at 12 to 24 pieces. Sourcing story pages at 6 to 12 pieces. Buyer intent content at 8 to 16 pieces. Creator syndication calendar with 12 to 30 creators per quarter. Refresh cadence at 12 to 24 months by pillar. Reporting with organic sessions and organic revenue attribution.
If your DTC food brand is running paid social at 20,000 dollars monthly with a broken blog and zero recipe schema, professional content marketing for food brands pays for itself inside the first 90 days on organic traffic captured. Redefine Web ships content marketing inside our monthly retainer packages. Book a call and we will walk through the last three DTC food brands we built recipe hubs for, pillar by pillar.
Content marketing for food brands starts with a recipe hub because recipe queries account for 40 to 60 percent of high-intent search volume in the food category. Every hero SKU needs 4 to 12 recipes anchored to it, each targeting a specific occasion and audience.
Skip the recipe hub and the brand loses the search real estate that pulls DTC storefront traffic month over month at zero incremental paid cost. Recipe traffic converts at 2 to 4 percent because the shopper landed with usage intent, not passive discovery, which is why food brands win on recipes.
Recipe schema and Google rich result eligibility
Every recipe page ships schema.org Recipe markup including cookTime, prepTime, recipeIngredient, recipeInstructions, nutrition, and aggregateRating. Correctly marked-up recipes qualify for Google’s recipe rich result carousel that pulls 3 to 6 times higher click-through rate than a plain blue link. The schema layer takes 15 minutes per recipe to author and 30 minutes to validate in Google Search Console. Cross-reference the recipe search stack on our food and beverage SEO page.
Recipe hub structure that scales
The recipe hub structure runs 40 to 100 recipes at maturity, organized by hero SKU (4 to 12 recipes per SKU) plus occasion tags (breakfast, weeknight dinner, meal prep, brunch, holiday). Every recipe links back to the hero SKU product page with the SKU embedded in an inline card. The hub earns internal linking value from ingredient comparison guides and the sourcing story pages, which feeds recipe ranking on Google. According to Google Search Central recipe structured data guidance, complete Recipe schema markup is required for eligibility in the recipe carousel and the ingredient search filter.
Pillar structure for food brand content marketing
The pillar structure on content marketing for food brands runs 4 content pillars concurrently: recipe hub (40 to 100 recipes), ingredient comparison guides (12 to 24 guides), sourcing story pages (6 to 12 pages), and buyer intent content (where to buy, subscription vs. one-time, gift bundle guides). Every pillar covers a distinct search intent and every pillar links back to the hero SKU product pages.
Ingredient comparison guide format
Ingredient comparison guides run 1,800 to 3,200 words comparing 2 to 4 ingredient types on 6 to 10 attributes with a comparison table, real-world use case examples, and links to the hero SKU that uses the specific ingredient. Example: organic vs. conventional oats compares nutritional profile, sourcing chain, cost, environmental impact, and taste on a 6-column table. The brand’s SKU appears in the winning column with a product card. These guides rank 3 to 8 months after publication and pull steady-state organic traffic.
Sourcing story pages that build trust
Sourcing story pages name the specific farms, cooperatives, or suppliers the brand sources from, with photos of the farms, farmer quotes, and specific harvest windows. A coffee brand’s Ethiopian farm page ranks for “single-origin Ethiopian coffee” and “Yirgacheffe coffee origin” plus 40 long-tail variations. The sourcing page pulls trust-building traffic that converts at 4 to 6 percent because the shopper landed pattern-matching on transparency and named provenance. Every sourcing page includes farmer or cooperative quotes, harvest dates, and a link back to 3 to 5 hero SKU pages that source from the named supplier.
Vejrø hospitality content case study
Vejrø Resort, a Danish private-island destination with an on-site restaurant focused on organic, locally sourced cuisine, joined us with strong social engagement and no organic-search real estate. Guests found the resort on Instagram but never in Google search for terms like “private island resort Denmark,” “farm-to-table hospitality Denmark,” or “Vejrø restaurant.” The same organic-search gap shows up on DTC food brands running paid social at 20,000 dollars monthly with a broken blog and zero recipe schema.
We built the conversion-focused website with on-site and off-site SEO tuned to the travel-niche keyword clusters, competitor analysis against comparable boutique resorts, and mobile-first design prioritizing guest discovery. Every page carried the structured data qualifying it for Google’s rich results in the hospitality category. Every internal link pushed authority toward the direct-booking conversion path.
Three months later, Vejrø hit 10,000 plus organic visitors, ranked for 200 plus first-page keywords, and pulled a 2.2 percent booking conversion rate from organic traffic. The same pattern applies to content marketing for food brands: recipe schema, ingredient comparison guides, and sourcing story pages pull organic traffic at 20 to 40 percent conversion into hero SKU pages inside 6 months when the content quality matches search intent and every page carries the right structured data markup. Vejrø also proved out the reporting discipline: every monthly report named the exact page, the exact keyword cluster, and the exact search feature (rich result, sitelinks, image pack) driving the incremental organic revenue instead of hiding behind aggregate traffic charts.
Recipe cadence and content calendar for food brands
Recipe cadence on a working food brand content calendar ships 2 to 4 new recipes per week during the first 6 months and drops to 1 per week at maturity. Each recipe takes 4 to 6 hours to produce (write, test in the kitchen, photograph, schema author, publish). At 3 recipes per week, the brand hits 78 recipes inside 6 months plus a backlog of ingredient comparison and sourcing content queued behind the recipe production line.
| Content pillar | Target volume year 1 | Production cost per piece | Refresh cadence |
|---|---|---|---|
| Recipe hub | 40 to 100 recipes | $180 to $320 | Every 12 months |
| Ingredient comparison guides | 12 to 24 guides | $450 to $780 | Every 18 months |
| Sourcing story pages | 6 to 12 pages | $680 to $1,200 | Every 24 months |
| Buyer intent content | 8 to 16 pieces | $220 to $420 | Every 12 months |
Photography as a content calendar constraint
Photography is the actual constraint on recipe cadence, not writing. Every recipe needs 6 to 12 photos: hero shot, ingredient flat lay, prep in progress, plated result, storage, and step shots for the schema markup. A working food brand batches photography 8 recipes at a time to keep the cost per recipe under 200 dollars. Skip the batching and the per-recipe cost climbs to 400 to 600 dollars, which caps recipe cadence at 1 per week and slows organic ranking timeline by 6 months.
Seasonal content calendar planning
Seasonal content calendar planning maps recipes and comparison guides to the seasonal windows they need to rank in. A Christmas cookie recipe needs to publish in September to rank by early December. A Valentine’s chocolate guide needs to publish in November to rank by early February. A back-to-school lunchbox recipe needs to publish in June to rank by late August. The 60-to-90-day ranking curve dictates the calendar.
Creator syndication inside food brand content
Creator syndication on food brand content marketing amplifies the recipe hub through Instagram Reels, TikTok, and YouTube Shorts creators paid to post their own version of the brand’s hero recipes. The creator content pulls net-new audiences into the recipe hub through the creator’s Link in Bio or Amazon Storefront tag. The syndication calendar names 12 to 30 creators per quarter with specific recipes assigned to each.
One brand we picked up had a spreadsheet titled “creator outreach 2023” with 47 rows and 3 responses. All 3 responses were auto-replies. The spreadsheet named zero recipes and offered flat rates below 100 dollars per post. Nobody posts a 30-second video for 87 dollars flat. Nobody.
Creator content commercial terms that work
Working creator content commercial terms run 350 to 1,500 dollars flat per post plus a 12 to 25 percent commission on tagged sales across a 30-day window. The commission mechanic pulls creators into follow-up posts because the incremental revenue continues past the initial fee. Mid-tier creators (30k to 150k followers) hit the sweet spot for food brand content because their engagement rate typically runs 4 to 8 percent versus 0.8 to 1.6 percent on mega-creators.
Content brief structure for creator partnerships
The content brief structure for creator partnerships runs a single page: the SKU, the specific recipe or usage occasion, 3 required brand mentions, 3 restricted claims (no health claims on non-medical SKUs), the pricing angle, the affiliate link, and 3 example videos that hit the tone. The brief avoids over-scripting because over-scripted creator content underperforms native creator voice by 40 to 60 percent on engagement rate.
Buyer intent content for food brand blogs
Buyer intent content on food brand blogs covers 8 to 16 pieces targeting explicit purchase-decision queries: “where to buy [brand],” “[brand] subscription vs. one-time,” “best [category] for [use case],” and “[brand] gift bundle.” Every buyer intent piece runs 1,400 to 2,400 words with a comparison table, product cards, and a clear conversion path to the specific SKU that matches the query intent. Buyer intent content converts at 3 to 6 percent versus 1 to 2 percent on recipe content because the shopper landed already planning to buy, not exploring a usage occasion.
Where-to-buy content structure
Where-to-buy content structure covers online (DTC storefront, Amazon, Target.com, Whole Foods online), retail (specific chain locators with the store finder embedded), and international (customs limitations, retailer partners abroad). Every piece names specific retailers, links to the store locator, and includes an FAQ block covering shipping availability, subscription options, and gift card compatibility. Where-to-buy content ranks for branded discovery queries the DTC storefront otherwise loses to competitor affiliate reviews.
Subscription versus one-time comparison content
Subscription versus one-time comparison content converts subscription commitments at 3 to 6 percent because it addresses the price-sensitivity concern head-on with a specific math table. The piece covers the discount structure (15 percent lifetime), the skip-a-month mechanic, the pause-anytime rule, the cancellation policy, and the specific yearly savings for the brand’s average consumption cadence. Cross-reference the retention structure on our food and beverage marketing retainer page.
Content refresh cadence on food brand pillars
Content refresh cadence on food brand content pillars runs a rolling audit every 12 to 24 months by pillar. Recipes get refreshed every 12 months with new photography, updated schema, and any nutrition or ingredient adjustments. Ingredient comparison guides refresh every 18 months to update market data. Sourcing story pages refresh every 24 months to reflect farm partnership changes and new harvest angles. Buyer intent content refreshes every 12 months to update retailer availability and pricing.
Recipe refresh priority order
Recipe refresh priority runs by organic traffic rank. The top 20 recipes by monthly organic sessions get refreshed first (new photography, schema audit, related recipe internal links, updated nutrition). The next 40 get refreshed at 15 months. The remaining recipes get refreshed opportunistically when the ranking slips past position 15 in Google. Skipping the refresh cadence lets recipe rankings drift out of the top 3 inside 18 months as newer competitor recipes take the position.
Schema audit checklist per refresh
The schema audit checklist per refresh runs 8 items: Recipe schema completeness, aggregateRating count and accuracy, nutrition data accuracy, prepTime and cookTime match the recipe body, image URLs valid at CDN, related recipe internal links working, product card SKU URL live, and Google Search Console rich result eligibility validated. This checklist takes 20 minutes per recipe and prevents the schema drift that costs recipe rankings 20 to 40 positions quietly.
Reporting cadence for food brand content marketing
Reporting cadence on food brand content marketing runs a monthly executive report plus a quarterly business review. The monthly report ships in the first business week and covers organic sessions by pillar, top 10 ranking recipes with position trend, ingredient guide ranking movements, sourcing page performance, and organic-attributed DTC revenue. Every number carries a comparison to the prior month and a plain-language interpretation the founder reads in 7 minutes.
Metrics that matter for content marketing
Metrics that matter for food brand content marketing: organic sessions by pillar, recipe rich result impressions in Search Console, organic conversion rate to hero SKU pages, organic-attributed DTC revenue, and top 20 ranking positions by monthly organic sessions. Vanity metrics that do not matter: total pageviews without conversion context, average time on page without conversion attribution, and social share counts. The monthly report skips the vanity block entirely.
Quarterly business review structure
The quarterly business review runs 90 minutes with the founder, head of content, and SEO lead. Agenda: organic traffic trend by pillar, top 10 winning content pieces, top 10 losing content pieces (candidates for refresh or removal), competitive gap analysis against 5 named competitor brands, and next quarter’s content calendar with recipes and ingredient guides queued. According to Ahrefs content marketing research, brands running quarterly content audits outperform brands running annual audits by 40 to 70 percent on organic revenue over a 24-month window.
Internal linking discipline across food brand content
Internal linking discipline across food brand content moves authority from recipe pages toward hero SKU product pages and comparison guides. Every recipe links to the hero SKU it uses inline (once in the ingredient list, once in a bottom call-out card). Every ingredient comparison guide links to 3 to 6 recipes using the winning ingredient plus the hero SKU product page. Every sourcing story links to the 2 to 4 SKUs sourced from that specific farm or cooperative.
Anchor text strategy across recipe hubs
Anchor text on internal links varies across recipe hubs to avoid over-optimization patterns Google penalizes. Exact-match anchor (“single-origin Ethiopian coffee”) runs on 20 to 30 percent of internal links. Partial-match variations (“our Ethiopian roast”) run on 30 to 40 percent. Branded anchors (the SKU name) run on 20 to 30 percent. Generic anchors (“shop the coffee”) fill the remaining 10 to 20 percent. This ratio holds ranking without triggering the over-optimization penalty that shows up on brands that anchor-text-stuff every internal link with the same exact-match keyword. Cross-reference the linking layer on our food and beverage web design page.
Link equity from ingredient guides to SKU pages
Link equity from ingredient guides passes to SKU pages when the guide’s comparison table names the hero SKU in the winning column with a product card, and when the guide’s body links to 3 to 6 recipes that use the winning ingredient. This 3-hop path (guide to recipe to SKU) pushes authority from a high-traffic informational query down to a high-intent transactional page. According to Search Engine Land SEO coverage, informational content that internally links to transactional pages produces 2 to 4 times higher organic revenue than isolated content silos.
Wrapping up content marketing for food brands
Content marketing for food brands is the organic engine that turns a DTC snack, drink, or CPG storefront into a search-driven revenue channel. Recipe hub of 40 to 100 recipes. Ingredient comparison guides at 12 to 24 pieces. Sourcing story pages at 6 to 12 pieces. Buyer intent content at 8 to 16 pieces. Creator syndication calendar with 12 to 30 creators per quarter. Refresh cadence at 12 to 24 months by pillar. Reporting with organic sessions and organic revenue attribution.
If your DTC food brand is running paid social at 20,000 dollars monthly with a broken blog and zero recipe schema, professional content marketing for food brands pays for itself inside the first 90 days on organic traffic captured. Redefine Web ships content marketing inside our monthly retainer packages. Book a call and we will walk through the last three DTC food brands we built recipe hubs for, pillar by pillar.
Internal linking discipline across food brand content moves authority from recipe pages toward hero SKU product pages and comparison guides. Every recipe links to the hero SKU it uses inline (once in the ingredient list, once in a bottom call-out card). Every ingredient comparison guide links to 3 to 6 recipes using the winning ingredient plus the hero SKU product page. Every sourcing story links to the 2 to 4 SKUs sourced from that specific farm or cooperative.
Anchor text strategy across recipe hubs
Anchor text on internal links varies across recipe hubs to avoid over-optimization patterns Google penalizes. Exact-match anchor (“single-origin Ethiopian coffee”) runs on 20 to 30 percent of internal links. Partial-match variations (“our Ethiopian roast”) run on 30 to 40 percent. Branded anchors (the SKU name) run on 20 to 30 percent. Generic anchors (“shop the coffee”) fill the remaining 10 to 20 percent. This ratio holds ranking without triggering the over-optimization penalty that shows up on brands that anchor-text-stuff every internal link with the same exact-match keyword. Cross-reference the linking layer on our food and beverage web design page.
Link equity from ingredient guides to SKU pages
Link equity from ingredient guides passes to SKU pages when the guide’s comparison table names the hero SKU in the winning column with a product card, and when the guide’s body links to 3 to 6 recipes that use the winning ingredient. This 3-hop path (guide to recipe to SKU) pushes authority from a high-traffic informational query down to a high-intent transactional page. According to Search Engine Land SEO coverage, informational content that internally links to transactional pages produces 2 to 4 times higher organic revenue than isolated content silos.
Wrapping up content marketing for food brands
Content marketing for food brands is the organic engine that turns a DTC snack, drink, or CPG storefront into a search-driven revenue channel. Recipe hub of 40 to 100 recipes. Ingredient comparison guides at 12 to 24 pieces. Sourcing story pages at 6 to 12 pieces. Buyer intent content at 8 to 16 pieces. Creator syndication calendar with 12 to 30 creators per quarter. Refresh cadence at 12 to 24 months by pillar. Reporting with organic sessions and organic revenue attribution.
If your DTC food brand is running paid social at 20,000 dollars monthly with a broken blog and zero recipe schema, professional content marketing for food brands pays for itself inside the first 90 days on organic traffic captured. Redefine Web ships content marketing inside our monthly retainer packages. Book a call and we will walk through the last three DTC food brands we built recipe hubs for, pillar by pillar.
Content marketing for food brands starts with a recipe hub because recipe queries account for 40 to 60 percent of high-intent search volume in the food category. Every hero SKU needs 4 to 12 recipes anchored to it, each targeting a specific occasion and audience.
Skip the recipe hub and the brand loses the search real estate that pulls DTC storefront traffic month over month at zero incremental paid cost. Recipe traffic converts at 2 to 4 percent because the shopper landed with usage intent, not passive discovery, which is why food brands win on recipes.
Recipe schema and Google rich result eligibility
Every recipe page ships schema.org Recipe markup including cookTime, prepTime, recipeIngredient, recipeInstructions, nutrition, and aggregateRating. Correctly marked-up recipes qualify for Google’s recipe rich result carousel that pulls 3 to 6 times higher click-through rate than a plain blue link. The schema layer takes 15 minutes per recipe to author and 30 minutes to validate in Google Search Console. Cross-reference the recipe search stack on our food and beverage SEO page.
Recipe hub structure that scales
The recipe hub structure runs 40 to 100 recipes at maturity, organized by hero SKU (4 to 12 recipes per SKU) plus occasion tags (breakfast, weeknight dinner, meal prep, brunch, holiday). Every recipe links back to the hero SKU product page with the SKU embedded in an inline card. The hub earns internal linking value from ingredient comparison guides and the sourcing story pages, which feeds recipe ranking on Google. According to Google Search Central recipe structured data guidance, complete Recipe schema markup is required for eligibility in the recipe carousel and the ingredient search filter.
Pillar structure for food brand content marketing
The pillar structure on content marketing for food brands runs 4 content pillars concurrently: recipe hub (40 to 100 recipes), ingredient comparison guides (12 to 24 guides), sourcing story pages (6 to 12 pages), and buyer intent content (where to buy, subscription vs. one-time, gift bundle guides). Every pillar covers a distinct search intent and every pillar links back to the hero SKU product pages.
Ingredient comparison guide format
Ingredient comparison guides run 1,800 to 3,200 words comparing 2 to 4 ingredient types on 6 to 10 attributes with a comparison table, real-world use case examples, and links to the hero SKU that uses the specific ingredient. Example: organic vs. conventional oats compares nutritional profile, sourcing chain, cost, environmental impact, and taste on a 6-column table. The brand’s SKU appears in the winning column with a product card. These guides rank 3 to 8 months after publication and pull steady-state organic traffic.
Sourcing story pages that build trust
Sourcing story pages name the specific farms, cooperatives, or suppliers the brand sources from, with photos of the farms, farmer quotes, and specific harvest windows. A coffee brand’s Ethiopian farm page ranks for “single-origin Ethiopian coffee” and “Yirgacheffe coffee origin” plus 40 long-tail variations. The sourcing page pulls trust-building traffic that converts at 4 to 6 percent because the shopper landed pattern-matching on transparency and named provenance. Every sourcing page includes farmer or cooperative quotes, harvest dates, and a link back to 3 to 5 hero SKU pages that source from the named supplier.
Vejrø hospitality content case study
Vejrø Resort, a Danish private-island destination with an on-site restaurant focused on organic, locally sourced cuisine, joined us with strong social engagement and no organic-search real estate. Guests found the resort on Instagram but never in Google search for terms like “private island resort Denmark,” “farm-to-table hospitality Denmark,” or “Vejrø restaurant.” The same organic-search gap shows up on DTC food brands running paid social at 20,000 dollars monthly with a broken blog and zero recipe schema.
We built the conversion-focused website with on-site and off-site SEO tuned to the travel-niche keyword clusters, competitor analysis against comparable boutique resorts, and mobile-first design prioritizing guest discovery. Every page carried the structured data qualifying it for Google’s rich results in the hospitality category. Every internal link pushed authority toward the direct-booking conversion path.
Three months later, Vejrø hit 10,000 plus organic visitors, ranked for 200 plus first-page keywords, and pulled a 2.2 percent booking conversion rate from organic traffic. The same pattern applies to content marketing for food brands: recipe schema, ingredient comparison guides, and sourcing story pages pull organic traffic at 20 to 40 percent conversion into hero SKU pages inside 6 months when the content quality matches search intent and every page carries the right structured data markup. Vejrø also proved out the reporting discipline: every monthly report named the exact page, the exact keyword cluster, and the exact search feature (rich result, sitelinks, image pack) driving the incremental organic revenue instead of hiding behind aggregate traffic charts.
Recipe cadence and content calendar for food brands
Recipe cadence on a working food brand content calendar ships 2 to 4 new recipes per week during the first 6 months and drops to 1 per week at maturity. Each recipe takes 4 to 6 hours to produce (write, test in the kitchen, photograph, schema author, publish). At 3 recipes per week, the brand hits 78 recipes inside 6 months plus a backlog of ingredient comparison and sourcing content queued behind the recipe production line.
| Content pillar | Target volume year 1 | Production cost per piece | Refresh cadence |
|---|---|---|---|
| Recipe hub | 40 to 100 recipes | $180 to $320 | Every 12 months |
| Ingredient comparison guides | 12 to 24 guides | $450 to $780 | Every 18 months |
| Sourcing story pages | 6 to 12 pages | $680 to $1,200 | Every 24 months |
| Buyer intent content | 8 to 16 pieces | $220 to $420 | Every 12 months |
Photography as a content calendar constraint
Photography is the actual constraint on recipe cadence, not writing. Every recipe needs 6 to 12 photos: hero shot, ingredient flat lay, prep in progress, plated result, storage, and step shots for the schema markup. A working food brand batches photography 8 recipes at a time to keep the cost per recipe under 200 dollars. Skip the batching and the per-recipe cost climbs to 400 to 600 dollars, which caps recipe cadence at 1 per week and slows organic ranking timeline by 6 months.
Seasonal content calendar planning
Seasonal content calendar planning maps recipes and comparison guides to the seasonal windows they need to rank in. A Christmas cookie recipe needs to publish in September to rank by early December. A Valentine’s chocolate guide needs to publish in November to rank by early February. A back-to-school lunchbox recipe needs to publish in June to rank by late August. The 60-to-90-day ranking curve dictates the calendar.
Creator syndication inside food brand content
Creator syndication on food brand content marketing amplifies the recipe hub through Instagram Reels, TikTok, and YouTube Shorts creators paid to post their own version of the brand’s hero recipes. The creator content pulls net-new audiences into the recipe hub through the creator’s Link in Bio or Amazon Storefront tag. The syndication calendar names 12 to 30 creators per quarter with specific recipes assigned to each.
One brand we picked up had a spreadsheet titled “creator outreach 2023” with 47 rows and 3 responses. All 3 responses were auto-replies. The spreadsheet named zero recipes and offered flat rates below 100 dollars per post. Nobody posts a 30-second video for 87 dollars flat. Nobody.
Creator content commercial terms that work
Working creator content commercial terms run 350 to 1,500 dollars flat per post plus a 12 to 25 percent commission on tagged sales across a 30-day window. The commission mechanic pulls creators into follow-up posts because the incremental revenue continues past the initial fee. Mid-tier creators (30k to 150k followers) hit the sweet spot for food brand content because their engagement rate typically runs 4 to 8 percent versus 0.8 to 1.6 percent on mega-creators.
Content brief structure for creator partnerships
The content brief structure for creator partnerships runs a single page: the SKU, the specific recipe or usage occasion, 3 required brand mentions, 3 restricted claims (no health claims on non-medical SKUs), the pricing angle, the affiliate link, and 3 example videos that hit the tone. The brief avoids over-scripting because over-scripted creator content underperforms native creator voice by 40 to 60 percent on engagement rate.
Buyer intent content for food brand blogs
Buyer intent content on food brand blogs covers 8 to 16 pieces targeting explicit purchase-decision queries: “where to buy [brand],” “[brand] subscription vs. one-time,” “best [category] for [use case],” and “[brand] gift bundle.” Every buyer intent piece runs 1,400 to 2,400 words with a comparison table, product cards, and a clear conversion path to the specific SKU that matches the query intent. Buyer intent content converts at 3 to 6 percent versus 1 to 2 percent on recipe content because the shopper landed already planning to buy, not exploring a usage occasion.
Where-to-buy content structure
Where-to-buy content structure covers online (DTC storefront, Amazon, Target.com, Whole Foods online), retail (specific chain locators with the store finder embedded), and international (customs limitations, retailer partners abroad). Every piece names specific retailers, links to the store locator, and includes an FAQ block covering shipping availability, subscription options, and gift card compatibility. Where-to-buy content ranks for branded discovery queries the DTC storefront otherwise loses to competitor affiliate reviews.
Subscription versus one-time comparison content
Subscription versus one-time comparison content converts subscription commitments at 3 to 6 percent because it addresses the price-sensitivity concern head-on with a specific math table. The piece covers the discount structure (15 percent lifetime), the skip-a-month mechanic, the pause-anytime rule, the cancellation policy, and the specific yearly savings for the brand’s average consumption cadence. Cross-reference the retention structure on our food and beverage marketing retainer page.
Content refresh cadence on food brand pillars
Content refresh cadence on food brand content pillars runs a rolling audit every 12 to 24 months by pillar. Recipes get refreshed every 12 months with new photography, updated schema, and any nutrition or ingredient adjustments. Ingredient comparison guides refresh every 18 months to update market data. Sourcing story pages refresh every 24 months to reflect farm partnership changes and new harvest angles. Buyer intent content refreshes every 12 months to update retailer availability and pricing.
Recipe refresh priority order
Recipe refresh priority runs by organic traffic rank. The top 20 recipes by monthly organic sessions get refreshed first (new photography, schema audit, related recipe internal links, updated nutrition). The next 40 get refreshed at 15 months. The remaining recipes get refreshed opportunistically when the ranking slips past position 15 in Google. Skipping the refresh cadence lets recipe rankings drift out of the top 3 inside 18 months as newer competitor recipes take the position.
Schema audit checklist per refresh
The schema audit checklist per refresh runs 8 items: Recipe schema completeness, aggregateRating count and accuracy, nutrition data accuracy, prepTime and cookTime match the recipe body, image URLs valid at CDN, related recipe internal links working, product card SKU URL live, and Google Search Console rich result eligibility validated. This checklist takes 20 minutes per recipe and prevents the schema drift that costs recipe rankings 20 to 40 positions quietly.
Reporting cadence for food brand content marketing
Reporting cadence on food brand content marketing runs a monthly executive report plus a quarterly business review. The monthly report ships in the first business week and covers organic sessions by pillar, top 10 ranking recipes with position trend, ingredient guide ranking movements, sourcing page performance, and organic-attributed DTC revenue. Every number carries a comparison to the prior month and a plain-language interpretation the founder reads in 7 minutes.
Metrics that matter for content marketing
Metrics that matter for food brand content marketing: organic sessions by pillar, recipe rich result impressions in Search Console, organic conversion rate to hero SKU pages, organic-attributed DTC revenue, and top 20 ranking positions by monthly organic sessions. Vanity metrics that do not matter: total pageviews without conversion context, average time on page without conversion attribution, and social share counts. The monthly report skips the vanity block entirely.
Quarterly business review structure
The quarterly business review runs 90 minutes with the founder, head of content, and SEO lead. Agenda: organic traffic trend by pillar, top 10 winning content pieces, top 10 losing content pieces (candidates for refresh or removal), competitive gap analysis against 5 named competitor brands, and next quarter’s content calendar with recipes and ingredient guides queued. According to Ahrefs content marketing research, brands running quarterly content audits outperform brands running annual audits by 40 to 70 percent on organic revenue over a 24-month window.
Internal linking discipline across food brand content
Internal linking discipline across food brand content moves authority from recipe pages toward hero SKU product pages and comparison guides. Every recipe links to the hero SKU it uses inline (once in the ingredient list, once in a bottom call-out card). Every ingredient comparison guide links to 3 to 6 recipes using the winning ingredient plus the hero SKU product page. Every sourcing story links to the 2 to 4 SKUs sourced from that specific farm or cooperative.
Anchor text strategy across recipe hubs
Anchor text on internal links varies across recipe hubs to avoid over-optimization patterns Google penalizes. Exact-match anchor (“single-origin Ethiopian coffee”) runs on 20 to 30 percent of internal links. Partial-match variations (“our Ethiopian roast”) run on 30 to 40 percent. Branded anchors (the SKU name) run on 20 to 30 percent. Generic anchors (“shop the coffee”) fill the remaining 10 to 20 percent. This ratio holds ranking without triggering the over-optimization penalty that shows up on brands that anchor-text-stuff every internal link with the same exact-match keyword. Cross-reference the linking layer on our food and beverage web design page.
Link equity from ingredient guides to SKU pages
Link equity from ingredient guides passes to SKU pages when the guide’s comparison table names the hero SKU in the winning column with a product card, and when the guide’s body links to 3 to 6 recipes that use the winning ingredient. This 3-hop path (guide to recipe to SKU) pushes authority from a high-traffic informational query down to a high-intent transactional page. According to Search Engine Land SEO coverage, informational content that internally links to transactional pages produces 2 to 4 times higher organic revenue than isolated content silos.
Wrapping up content marketing for food brands
Content marketing for food brands is the organic engine that turns a DTC snack, drink, or CPG storefront into a search-driven revenue channel. Recipe hub of 40 to 100 recipes. Ingredient comparison guides at 12 to 24 pieces. Sourcing story pages at 6 to 12 pieces. Buyer intent content at 8 to 16 pieces. Creator syndication calendar with 12 to 30 creators per quarter. Refresh cadence at 12 to 24 months by pillar. Reporting with organic sessions and organic revenue attribution.
If your DTC food brand is running paid social at 20,000 dollars monthly with a broken blog and zero recipe schema, professional content marketing for food brands pays for itself inside the first 90 days on organic traffic captured. Redefine Web ships content marketing inside our monthly retainer packages. Book a call and we will walk through the last three DTC food brands we built recipe hubs for, pillar by pillar.
Content marketing for food brands starts with a recipe hub because recipe queries account for 40 to 60 percent of high-intent search volume in the food category. Every hero SKU needs 4 to 12 recipes anchored to it, each targeting a specific occasion and audience.
Skip the recipe hub and the brand loses the search real estate that pulls DTC storefront traffic month over month at zero incremental paid cost. Recipe traffic converts at 2 to 4 percent because the shopper landed with usage intent, not passive discovery, which is why food brands win on recipes.
Recipe schema and Google rich result eligibility
Every recipe page ships schema.org Recipe markup including cookTime, prepTime, recipeIngredient, recipeInstructions, nutrition, and aggregateRating. Correctly marked-up recipes qualify for Google’s recipe rich result carousel that pulls 3 to 6 times higher click-through rate than a plain blue link. The schema layer takes 15 minutes per recipe to author and 30 minutes to validate in Google Search Console. Cross-reference the recipe search stack on our food and beverage SEO page.
Recipe hub structure that scales
The recipe hub structure runs 40 to 100 recipes at maturity, organized by hero SKU (4 to 12 recipes per SKU) plus occasion tags (breakfast, weeknight dinner, meal prep, brunch, holiday). Every recipe links back to the hero SKU product page with the SKU embedded in an inline card. The hub earns internal linking value from ingredient comparison guides and the sourcing story pages, which feeds recipe ranking on Google. According to Google Search Central recipe structured data guidance, complete Recipe schema markup is required for eligibility in the recipe carousel and the ingredient search filter.
Pillar structure for food brand content marketing
The pillar structure on content marketing for food brands runs 4 content pillars concurrently: recipe hub (40 to 100 recipes), ingredient comparison guides (12 to 24 guides), sourcing story pages (6 to 12 pages), and buyer intent content (where to buy, subscription vs. one-time, gift bundle guides). Every pillar covers a distinct search intent and every pillar links back to the hero SKU product pages.
Ingredient comparison guide format
Ingredient comparison guides run 1,800 to 3,200 words comparing 2 to 4 ingredient types on 6 to 10 attributes with a comparison table, real-world use case examples, and links to the hero SKU that uses the specific ingredient. Example: organic vs. conventional oats compares nutritional profile, sourcing chain, cost, environmental impact, and taste on a 6-column table. The brand’s SKU appears in the winning column with a product card. These guides rank 3 to 8 months after publication and pull steady-state organic traffic.
Sourcing story pages that build trust
Sourcing story pages name the specific farms, cooperatives, or suppliers the brand sources from, with photos of the farms, farmer quotes, and specific harvest windows. A coffee brand’s Ethiopian farm page ranks for “single-origin Ethiopian coffee” and “Yirgacheffe coffee origin” plus 40 long-tail variations. The sourcing page pulls trust-building traffic that converts at 4 to 6 percent because the shopper landed pattern-matching on transparency and named provenance. Every sourcing page includes farmer or cooperative quotes, harvest dates, and a link back to 3 to 5 hero SKU pages that source from the named supplier.
Vejrø hospitality content case study
Vejrø Resort, a Danish private-island destination with an on-site restaurant focused on organic, locally sourced cuisine, joined us with strong social engagement and no organic-search real estate. Guests found the resort on Instagram but never in Google search for terms like “private island resort Denmark,” “farm-to-table hospitality Denmark,” or “Vejrø restaurant.” The same organic-search gap shows up on DTC food brands running paid social at 20,000 dollars monthly with a broken blog and zero recipe schema.
We built the conversion-focused website with on-site and off-site SEO tuned to the travel-niche keyword clusters, competitor analysis against comparable boutique resorts, and mobile-first design prioritizing guest discovery. Every page carried the structured data qualifying it for Google’s rich results in the hospitality category. Every internal link pushed authority toward the direct-booking conversion path.
Three months later, Vejrø hit 10,000 plus organic visitors, ranked for 200 plus first-page keywords, and pulled a 2.2 percent booking conversion rate from organic traffic. The same pattern applies to content marketing for food brands: recipe schema, ingredient comparison guides, and sourcing story pages pull organic traffic at 20 to 40 percent conversion into hero SKU pages inside 6 months when the content quality matches search intent and every page carries the right structured data markup. Vejrø also proved out the reporting discipline: every monthly report named the exact page, the exact keyword cluster, and the exact search feature (rich result, sitelinks, image pack) driving the incremental organic revenue instead of hiding behind aggregate traffic charts.
Recipe cadence and content calendar for food brands
Recipe cadence on a working food brand content calendar ships 2 to 4 new recipes per week during the first 6 months and drops to 1 per week at maturity. Each recipe takes 4 to 6 hours to produce (write, test in the kitchen, photograph, schema author, publish). At 3 recipes per week, the brand hits 78 recipes inside 6 months plus a backlog of ingredient comparison and sourcing content queued behind the recipe production line.
| Content pillar | Target volume year 1 | Production cost per piece | Refresh cadence |
|---|---|---|---|
| Recipe hub | 40 to 100 recipes | $180 to $320 | Every 12 months |
| Ingredient comparison guides | 12 to 24 guides | $450 to $780 | Every 18 months |
| Sourcing story pages | 6 to 12 pages | $680 to $1,200 | Every 24 months |
| Buyer intent content | 8 to 16 pieces | $220 to $420 | Every 12 months |
Photography as a content calendar constraint
Photography is the actual constraint on recipe cadence, not writing. Every recipe needs 6 to 12 photos: hero shot, ingredient flat lay, prep in progress, plated result, storage, and step shots for the schema markup. A working food brand batches photography 8 recipes at a time to keep the cost per recipe under 200 dollars. Skip the batching and the per-recipe cost climbs to 400 to 600 dollars, which caps recipe cadence at 1 per week and slows organic ranking timeline by 6 months.
Seasonal content calendar planning
Seasonal content calendar planning maps recipes and comparison guides to the seasonal windows they need to rank in. A Christmas cookie recipe needs to publish in September to rank by early December. A Valentine’s chocolate guide needs to publish in November to rank by early February. A back-to-school lunchbox recipe needs to publish in June to rank by late August. The 60-to-90-day ranking curve dictates the calendar.
Creator syndication inside food brand content
Creator syndication on food brand content marketing amplifies the recipe hub through Instagram Reels, TikTok, and YouTube Shorts creators paid to post their own version of the brand’s hero recipes. The creator content pulls net-new audiences into the recipe hub through the creator’s Link in Bio or Amazon Storefront tag. The syndication calendar names 12 to 30 creators per quarter with specific recipes assigned to each.
One brand we picked up had a spreadsheet titled “creator outreach 2023” with 47 rows and 3 responses. All 3 responses were auto-replies. The spreadsheet named zero recipes and offered flat rates below 100 dollars per post. Nobody posts a 30-second video for 87 dollars flat. Nobody.
Creator content commercial terms that work
Working creator content commercial terms run 350 to 1,500 dollars flat per post plus a 12 to 25 percent commission on tagged sales across a 30-day window. The commission mechanic pulls creators into follow-up posts because the incremental revenue continues past the initial fee. Mid-tier creators (30k to 150k followers) hit the sweet spot for food brand content because their engagement rate typically runs 4 to 8 percent versus 0.8 to 1.6 percent on mega-creators.
Content brief structure for creator partnerships
The content brief structure for creator partnerships runs a single page: the SKU, the specific recipe or usage occasion, 3 required brand mentions, 3 restricted claims (no health claims on non-medical SKUs), the pricing angle, the affiliate link, and 3 example videos that hit the tone. The brief avoids over-scripting because over-scripted creator content underperforms native creator voice by 40 to 60 percent on engagement rate.
Buyer intent content for food brand blogs
Buyer intent content on food brand blogs covers 8 to 16 pieces targeting explicit purchase-decision queries: “where to buy [brand],” “[brand] subscription vs. one-time,” “best [category] for [use case],” and “[brand] gift bundle.” Every buyer intent piece runs 1,400 to 2,400 words with a comparison table, product cards, and a clear conversion path to the specific SKU that matches the query intent. Buyer intent content converts at 3 to 6 percent versus 1 to 2 percent on recipe content because the shopper landed already planning to buy, not exploring a usage occasion.
Where-to-buy content structure
Where-to-buy content structure covers online (DTC storefront, Amazon, Target.com, Whole Foods online), retail (specific chain locators with the store finder embedded), and international (customs limitations, retailer partners abroad). Every piece names specific retailers, links to the store locator, and includes an FAQ block covering shipping availability, subscription options, and gift card compatibility. Where-to-buy content ranks for branded discovery queries the DTC storefront otherwise loses to competitor affiliate reviews.
Subscription versus one-time comparison content
Subscription versus one-time comparison content converts subscription commitments at 3 to 6 percent because it addresses the price-sensitivity concern head-on with a specific math table. The piece covers the discount structure (15 percent lifetime), the skip-a-month mechanic, the pause-anytime rule, the cancellation policy, and the specific yearly savings for the brand’s average consumption cadence. Cross-reference the retention structure on our food and beverage marketing retainer page.
Content refresh cadence on food brand pillars
Content refresh cadence on food brand content pillars runs a rolling audit every 12 to 24 months by pillar. Recipes get refreshed every 12 months with new photography, updated schema, and any nutrition or ingredient adjustments. Ingredient comparison guides refresh every 18 months to update market data. Sourcing story pages refresh every 24 months to reflect farm partnership changes and new harvest angles. Buyer intent content refreshes every 12 months to update retailer availability and pricing.
Recipe refresh priority order
Recipe refresh priority runs by organic traffic rank. The top 20 recipes by monthly organic sessions get refreshed first (new photography, schema audit, related recipe internal links, updated nutrition). The next 40 get refreshed at 15 months. The remaining recipes get refreshed opportunistically when the ranking slips past position 15 in Google. Skipping the refresh cadence lets recipe rankings drift out of the top 3 inside 18 months as newer competitor recipes take the position.
Schema audit checklist per refresh
The schema audit checklist per refresh runs 8 items: Recipe schema completeness, aggregateRating count and accuracy, nutrition data accuracy, prepTime and cookTime match the recipe body, image URLs valid at CDN, related recipe internal links working, product card SKU URL live, and Google Search Console rich result eligibility validated. This checklist takes 20 minutes per recipe and prevents the schema drift that costs recipe rankings 20 to 40 positions quietly.
Reporting cadence for food brand content marketing
Reporting cadence on food brand content marketing runs a monthly executive report plus a quarterly business review. The monthly report ships in the first business week and covers organic sessions by pillar, top 10 ranking recipes with position trend, ingredient guide ranking movements, sourcing page performance, and organic-attributed DTC revenue. Every number carries a comparison to the prior month and a plain-language interpretation the founder reads in 7 minutes.
Metrics that matter for content marketing
Metrics that matter for food brand content marketing: organic sessions by pillar, recipe rich result impressions in Search Console, organic conversion rate to hero SKU pages, organic-attributed DTC revenue, and top 20 ranking positions by monthly organic sessions. Vanity metrics that do not matter: total pageviews without conversion context, average time on page without conversion attribution, and social share counts. The monthly report skips the vanity block entirely.
Quarterly business review structure
The quarterly business review runs 90 minutes with the founder, head of content, and SEO lead. Agenda: organic traffic trend by pillar, top 10 winning content pieces, top 10 losing content pieces (candidates for refresh or removal), competitive gap analysis against 5 named competitor brands, and next quarter’s content calendar with recipes and ingredient guides queued. According to Ahrefs content marketing research, brands running quarterly content audits outperform brands running annual audits by 40 to 70 percent on organic revenue over a 24-month window.
Internal linking discipline across food brand content
Internal linking discipline across food brand content moves authority from recipe pages toward hero SKU product pages and comparison guides. Every recipe links to the hero SKU it uses inline (once in the ingredient list, once in a bottom call-out card). Every ingredient comparison guide links to 3 to 6 recipes using the winning ingredient plus the hero SKU product page. Every sourcing story links to the 2 to 4 SKUs sourced from that specific farm or cooperative.
Anchor text strategy across recipe hubs
Anchor text on internal links varies across recipe hubs to avoid over-optimization patterns Google penalizes. Exact-match anchor (“single-origin Ethiopian coffee”) runs on 20 to 30 percent of internal links. Partial-match variations (“our Ethiopian roast”) run on 30 to 40 percent. Branded anchors (the SKU name) run on 20 to 30 percent. Generic anchors (“shop the coffee”) fill the remaining 10 to 20 percent. This ratio holds ranking without triggering the over-optimization penalty that shows up on brands that anchor-text-stuff every internal link with the same exact-match keyword. Cross-reference the linking layer on our food and beverage web design page.
Link equity from ingredient guides to SKU pages
Link equity from ingredient guides passes to SKU pages when the guide’s comparison table names the hero SKU in the winning column with a product card, and when the guide’s body links to 3 to 6 recipes that use the winning ingredient. This 3-hop path (guide to recipe to SKU) pushes authority from a high-traffic informational query down to a high-intent transactional page. According to Search Engine Land SEO coverage, informational content that internally links to transactional pages produces 2 to 4 times higher organic revenue than isolated content silos.
Wrapping up content marketing for food brands
Content marketing for food brands is the organic engine that turns a DTC snack, drink, or CPG storefront into a search-driven revenue channel. Recipe hub of 40 to 100 recipes. Ingredient comparison guides at 12 to 24 pieces. Sourcing story pages at 6 to 12 pieces. Buyer intent content at 8 to 16 pieces. Creator syndication calendar with 12 to 30 creators per quarter. Refresh cadence at 12 to 24 months by pillar. Reporting with organic sessions and organic revenue attribution.
If your DTC food brand is running paid social at 20,000 dollars monthly with a broken blog and zero recipe schema, professional content marketing for food brands pays for itself inside the first 90 days on organic traffic captured. Redefine Web ships content marketing inside our monthly retainer packages. Book a call and we will walk through the last three DTC food brands we built recipe hubs for, pillar by pillar.
Content marketing for food brands starts with a recipe hub because recipe queries account for 40 to 60 percent of high-intent search volume in the food category. Every hero SKU needs 4 to 12 recipes anchored to it, each targeting a specific occasion and audience.
Skip the recipe hub and the brand loses the search real estate that pulls DTC storefront traffic month over month at zero incremental paid cost. Recipe traffic converts at 2 to 4 percent because the shopper landed with usage intent, not passive discovery, which is why food brands win on recipes.
Recipe schema and Google rich result eligibility
Every recipe page ships schema.org Recipe markup including cookTime, prepTime, recipeIngredient, recipeInstructions, nutrition, and aggregateRating. Correctly marked-up recipes qualify for Google’s recipe rich result carousel that pulls 3 to 6 times higher click-through rate than a plain blue link. The schema layer takes 15 minutes per recipe to author and 30 minutes to validate in Google Search Console. Cross-reference the recipe search stack on our food and beverage SEO page.
Recipe hub structure that scales
The recipe hub structure runs 40 to 100 recipes at maturity, organized by hero SKU (4 to 12 recipes per SKU) plus occasion tags (breakfast, weeknight dinner, meal prep, brunch, holiday). Every recipe links back to the hero SKU product page with the SKU embedded in an inline card. The hub earns internal linking value from ingredient comparison guides and the sourcing story pages, which feeds recipe ranking on Google. According to Google Search Central recipe structured data guidance, complete Recipe schema markup is required for eligibility in the recipe carousel and the ingredient search filter.
Pillar structure for food brand content marketing
The pillar structure on content marketing for food brands runs 4 content pillars concurrently: recipe hub (40 to 100 recipes), ingredient comparison guides (12 to 24 guides), sourcing story pages (6 to 12 pages), and buyer intent content (where to buy, subscription vs. one-time, gift bundle guides). Every pillar covers a distinct search intent and every pillar links back to the hero SKU product pages.
Ingredient comparison guide format
Ingredient comparison guides run 1,800 to 3,200 words comparing 2 to 4 ingredient types on 6 to 10 attributes with a comparison table, real-world use case examples, and links to the hero SKU that uses the specific ingredient. Example: organic vs. conventional oats compares nutritional profile, sourcing chain, cost, environmental impact, and taste on a 6-column table. The brand’s SKU appears in the winning column with a product card. These guides rank 3 to 8 months after publication and pull steady-state organic traffic.
Sourcing story pages that build trust
Sourcing story pages name the specific farms, cooperatives, or suppliers the brand sources from, with photos of the farms, farmer quotes, and specific harvest windows. A coffee brand’s Ethiopian farm page ranks for “single-origin Ethiopian coffee” and “Yirgacheffe coffee origin” plus 40 long-tail variations. The sourcing page pulls trust-building traffic that converts at 4 to 6 percent because the shopper landed pattern-matching on transparency and named provenance. Every sourcing page includes farmer or cooperative quotes, harvest dates, and a link back to 3 to 5 hero SKU pages that source from the named supplier.
Vejrø hospitality content case study
Vejrø Resort, a Danish private-island destination with an on-site restaurant focused on organic, locally sourced cuisine, joined us with strong social engagement and no organic-search real estate. Guests found the resort on Instagram but never in Google search for terms like “private island resort Denmark,” “farm-to-table hospitality Denmark,” or “Vejrø restaurant.” The same organic-search gap shows up on DTC food brands running paid social at 20,000 dollars monthly with a broken blog and zero recipe schema.
We built the conversion-focused website with on-site and off-site SEO tuned to the travel-niche keyword clusters, competitor analysis against comparable boutique resorts, and mobile-first design prioritizing guest discovery. Every page carried the structured data qualifying it for Google’s rich results in the hospitality category. Every internal link pushed authority toward the direct-booking conversion path.
Three months later, Vejrø hit 10,000 plus organic visitors, ranked for 200 plus first-page keywords, and pulled a 2.2 percent booking conversion rate from organic traffic. The same pattern applies to content marketing for food brands: recipe schema, ingredient comparison guides, and sourcing story pages pull organic traffic at 20 to 40 percent conversion into hero SKU pages inside 6 months when the content quality matches search intent and every page carries the right structured data markup. Vejrø also proved out the reporting discipline: every monthly report named the exact page, the exact keyword cluster, and the exact search feature (rich result, sitelinks, image pack) driving the incremental organic revenue instead of hiding behind aggregate traffic charts.
Recipe cadence and content calendar for food brands
Recipe cadence on a working food brand content calendar ships 2 to 4 new recipes per week during the first 6 months and drops to 1 per week at maturity. Each recipe takes 4 to 6 hours to produce (write, test in the kitchen, photograph, schema author, publish). At 3 recipes per week, the brand hits 78 recipes inside 6 months plus a backlog of ingredient comparison and sourcing content queued behind the recipe production line.
| Content pillar | Target volume year 1 | Production cost per piece | Refresh cadence |
|---|---|---|---|
| Recipe hub | 40 to 100 recipes | $180 to $320 | Every 12 months |
| Ingredient comparison guides | 12 to 24 guides | $450 to $780 | Every 18 months |
| Sourcing story pages | 6 to 12 pages | $680 to $1,200 | Every 24 months |
| Buyer intent content | 8 to 16 pieces | $220 to $420 | Every 12 months |
Photography as a content calendar constraint
Photography is the actual constraint on recipe cadence, not writing. Every recipe needs 6 to 12 photos: hero shot, ingredient flat lay, prep in progress, plated result, storage, and step shots for the schema markup. A working food brand batches photography 8 recipes at a time to keep the cost per recipe under 200 dollars. Skip the batching and the per-recipe cost climbs to 400 to 600 dollars, which caps recipe cadence at 1 per week and slows organic ranking timeline by 6 months.
Seasonal content calendar planning
Seasonal content calendar planning maps recipes and comparison guides to the seasonal windows they need to rank in. A Christmas cookie recipe needs to publish in September to rank by early December. A Valentine’s chocolate guide needs to publish in November to rank by early February. A back-to-school lunchbox recipe needs to publish in June to rank by late August. The 60-to-90-day ranking curve dictates the calendar.
Creator syndication inside food brand content
Creator syndication on food brand content marketing amplifies the recipe hub through Instagram Reels, TikTok, and YouTube Shorts creators paid to post their own version of the brand’s hero recipes. The creator content pulls net-new audiences into the recipe hub through the creator’s Link in Bio or Amazon Storefront tag. The syndication calendar names 12 to 30 creators per quarter with specific recipes assigned to each.
One brand we picked up had a spreadsheet titled “creator outreach 2023” with 47 rows and 3 responses. All 3 responses were auto-replies. The spreadsheet named zero recipes and offered flat rates below 100 dollars per post. Nobody posts a 30-second video for 87 dollars flat. Nobody.
Creator content commercial terms that work
Working creator content commercial terms run 350 to 1,500 dollars flat per post plus a 12 to 25 percent commission on tagged sales across a 30-day window. The commission mechanic pulls creators into follow-up posts because the incremental revenue continues past the initial fee. Mid-tier creators (30k to 150k followers) hit the sweet spot for food brand content because their engagement rate typically runs 4 to 8 percent versus 0.8 to 1.6 percent on mega-creators.
Content brief structure for creator partnerships
The content brief structure for creator partnerships runs a single page: the SKU, the specific recipe or usage occasion, 3 required brand mentions, 3 restricted claims (no health claims on non-medical SKUs), the pricing angle, the affiliate link, and 3 example videos that hit the tone. The brief avoids over-scripting because over-scripted creator content underperforms native creator voice by 40 to 60 percent on engagement rate.
Buyer intent content for food brand blogs
Buyer intent content on food brand blogs covers 8 to 16 pieces targeting explicit purchase-decision queries: “where to buy [brand],” “[brand] subscription vs. one-time,” “best [category] for [use case],” and “[brand] gift bundle.” Every buyer intent piece runs 1,400 to 2,400 words with a comparison table, product cards, and a clear conversion path to the specific SKU that matches the query intent. Buyer intent content converts at 3 to 6 percent versus 1 to 2 percent on recipe content because the shopper landed already planning to buy, not exploring a usage occasion.
Where-to-buy content structure
Where-to-buy content structure covers online (DTC storefront, Amazon, Target.com, Whole Foods online), retail (specific chain locators with the store finder embedded), and international (customs limitations, retailer partners abroad). Every piece names specific retailers, links to the store locator, and includes an FAQ block covering shipping availability, subscription options, and gift card compatibility. Where-to-buy content ranks for branded discovery queries the DTC storefront otherwise loses to competitor affiliate reviews.
Subscription versus one-time comparison content
Subscription versus one-time comparison content converts subscription commitments at 3 to 6 percent because it addresses the price-sensitivity concern head-on with a specific math table. The piece covers the discount structure (15 percent lifetime), the skip-a-month mechanic, the pause-anytime rule, the cancellation policy, and the specific yearly savings for the brand’s average consumption cadence. Cross-reference the retention structure on our food and beverage marketing retainer page.
Content refresh cadence on food brand pillars
Content refresh cadence on food brand content pillars runs a rolling audit every 12 to 24 months by pillar. Recipes get refreshed every 12 months with new photography, updated schema, and any nutrition or ingredient adjustments. Ingredient comparison guides refresh every 18 months to update market data. Sourcing story pages refresh every 24 months to reflect farm partnership changes and new harvest angles. Buyer intent content refreshes every 12 months to update retailer availability and pricing.
Recipe refresh priority order
Recipe refresh priority runs by organic traffic rank. The top 20 recipes by monthly organic sessions get refreshed first (new photography, schema audit, related recipe internal links, updated nutrition). The next 40 get refreshed at 15 months. The remaining recipes get refreshed opportunistically when the ranking slips past position 15 in Google. Skipping the refresh cadence lets recipe rankings drift out of the top 3 inside 18 months as newer competitor recipes take the position.
Schema audit checklist per refresh
The schema audit checklist per refresh runs 8 items: Recipe schema completeness, aggregateRating count and accuracy, nutrition data accuracy, prepTime and cookTime match the recipe body, image URLs valid at CDN, related recipe internal links working, product card SKU URL live, and Google Search Console rich result eligibility validated. This checklist takes 20 minutes per recipe and prevents the schema drift that costs recipe rankings 20 to 40 positions quietly.
Reporting cadence for food brand content marketing
Reporting cadence on food brand content marketing runs a monthly executive report plus a quarterly business review. The monthly report ships in the first business week and covers organic sessions by pillar, top 10 ranking recipes with position trend, ingredient guide ranking movements, sourcing page performance, and organic-attributed DTC revenue. Every number carries a comparison to the prior month and a plain-language interpretation the founder reads in 7 minutes.
Metrics that matter for content marketing
Metrics that matter for food brand content marketing: organic sessions by pillar, recipe rich result impressions in Search Console, organic conversion rate to hero SKU pages, organic-attributed DTC revenue, and top 20 ranking positions by monthly organic sessions. Vanity metrics that do not matter: total pageviews without conversion context, average time on page without conversion attribution, and social share counts. The monthly report skips the vanity block entirely.
Quarterly business review structure
The quarterly business review runs 90 minutes with the founder, head of content, and SEO lead. Agenda: organic traffic trend by pillar, top 10 winning content pieces, top 10 losing content pieces (candidates for refresh or removal), competitive gap analysis against 5 named competitor brands, and next quarter’s content calendar with recipes and ingredient guides queued. According to Ahrefs content marketing research, brands running quarterly content audits outperform brands running annual audits by 40 to 70 percent on organic revenue over a 24-month window.
Internal linking discipline across food brand content
Internal linking discipline across food brand content moves authority from recipe pages toward hero SKU product pages and comparison guides. Every recipe links to the hero SKU it uses inline (once in the ingredient list, once in a bottom call-out card). Every ingredient comparison guide links to 3 to 6 recipes using the winning ingredient plus the hero SKU product page. Every sourcing story links to the 2 to 4 SKUs sourced from that specific farm or cooperative.
Anchor text strategy across recipe hubs
Anchor text on internal links varies across recipe hubs to avoid over-optimization patterns Google penalizes. Exact-match anchor (“single-origin Ethiopian coffee”) runs on 20 to 30 percent of internal links. Partial-match variations (“our Ethiopian roast”) run on 30 to 40 percent. Branded anchors (the SKU name) run on 20 to 30 percent. Generic anchors (“shop the coffee”) fill the remaining 10 to 20 percent. This ratio holds ranking without triggering the over-optimization penalty that shows up on brands that anchor-text-stuff every internal link with the same exact-match keyword. Cross-reference the linking layer on our food and beverage web design page.
Link equity from ingredient guides to SKU pages
Link equity from ingredient guides passes to SKU pages when the guide’s comparison table names the hero SKU in the winning column with a product card, and when the guide’s body links to 3 to 6 recipes that use the winning ingredient. This 3-hop path (guide to recipe to SKU) pushes authority from a high-traffic informational query down to a high-intent transactional page. According to Search Engine Land SEO coverage, informational content that internally links to transactional pages produces 2 to 4 times higher organic revenue than isolated content silos.
Wrapping up content marketing for food brands
Content marketing for food brands is the organic engine that turns a DTC snack, drink, or CPG storefront into a search-driven revenue channel. Recipe hub of 40 to 100 recipes. Ingredient comparison guides at 12 to 24 pieces. Sourcing story pages at 6 to 12 pieces. Buyer intent content at 8 to 16 pieces. Creator syndication calendar with 12 to 30 creators per quarter. Refresh cadence at 12 to 24 months by pillar. Reporting with organic sessions and organic revenue attribution.
If your DTC food brand is running paid social at 20,000 dollars monthly with a broken blog and zero recipe schema, professional content marketing for food brands pays for itself inside the first 90 days on organic traffic captured. Redefine Web ships content marketing inside our monthly retainer packages. Book a call and we will walk through the last three DTC food brands we built recipe hubs for, pillar by pillar.
Anchor text on internal links varies across recipe hubs to avoid over-optimization patterns Google penalizes. Exact-match anchor (“single-origin Ethiopian coffee”) runs on 20 to 30 percent of internal links. Partial-match variations (“our Ethiopian roast”) run on 30 to 40 percent. Branded anchors (the SKU name) run on 20 to 30 percent. Generic anchors (“shop the coffee”) fill the remaining 10 to 20 percent. This ratio holds ranking without triggering the over-optimization penalty that shows up on brands that anchor-text-stuff every internal link with the same exact-match keyword. Cross-reference the linking layer on our food and beverage web design page.
Link equity from ingredient guides to SKU pages
Link equity from ingredient guides passes to SKU pages when the guide’s comparison table names the hero SKU in the winning column with a product card, and when the guide’s body links to 3 to 6 recipes that use the winning ingredient. This 3-hop path (guide to recipe to SKU) pushes authority from a high-traffic informational query down to a high-intent transactional page. According to Search Engine Land SEO coverage, informational content that internally links to transactional pages produces 2 to 4 times higher organic revenue than isolated content silos.
Wrapping up content marketing for food brands
Content marketing for food brands is the organic engine that turns a DTC snack, drink, or CPG storefront into a search-driven revenue channel. Recipe hub of 40 to 100 recipes. Ingredient comparison guides at 12 to 24 pieces. Sourcing story pages at 6 to 12 pieces. Buyer intent content at 8 to 16 pieces. Creator syndication calendar with 12 to 30 creators per quarter. Refresh cadence at 12 to 24 months by pillar. Reporting with organic sessions and organic revenue attribution.
If your DTC food brand is running paid social at 20,000 dollars monthly with a broken blog and zero recipe schema, professional content marketing for food brands pays for itself inside the first 90 days on organic traffic captured. Redefine Web ships content marketing inside our monthly retainer packages. Book a call and we will walk through the last three DTC food brands we built recipe hubs for, pillar by pillar.
Content marketing for food brands starts with a recipe hub because recipe queries account for 40 to 60 percent of high-intent search volume in the food category. Every hero SKU needs 4 to 12 recipes anchored to it, each targeting a specific occasion and audience.
Skip the recipe hub and the brand loses the search real estate that pulls DTC storefront traffic month over month at zero incremental paid cost. Recipe traffic converts at 2 to 4 percent because the shopper landed with usage intent, not passive discovery, which is why food brands win on recipes.
Recipe schema and Google rich result eligibility
Every recipe page ships schema.org Recipe markup including cookTime, prepTime, recipeIngredient, recipeInstructions, nutrition, and aggregateRating. Correctly marked-up recipes qualify for Google’s recipe rich result carousel that pulls 3 to 6 times higher click-through rate than a plain blue link. The schema layer takes 15 minutes per recipe to author and 30 minutes to validate in Google Search Console. Cross-reference the recipe search stack on our food and beverage SEO page.
Recipe hub structure that scales
The recipe hub structure runs 40 to 100 recipes at maturity, organized by hero SKU (4 to 12 recipes per SKU) plus occasion tags (breakfast, weeknight dinner, meal prep, brunch, holiday). Every recipe links back to the hero SKU product page with the SKU embedded in an inline card. The hub earns internal linking value from ingredient comparison guides and the sourcing story pages, which feeds recipe ranking on Google. According to Google Search Central recipe structured data guidance, complete Recipe schema markup is required for eligibility in the recipe carousel and the ingredient search filter.
Pillar structure for food brand content marketing
The pillar structure on content marketing for food brands runs 4 content pillars concurrently: recipe hub (40 to 100 recipes), ingredient comparison guides (12 to 24 guides), sourcing story pages (6 to 12 pages), and buyer intent content (where to buy, subscription vs. one-time, gift bundle guides). Every pillar covers a distinct search intent and every pillar links back to the hero SKU product pages.
Ingredient comparison guide format
Ingredient comparison guides run 1,800 to 3,200 words comparing 2 to 4 ingredient types on 6 to 10 attributes with a comparison table, real-world use case examples, and links to the hero SKU that uses the specific ingredient. Example: organic vs. conventional oats compares nutritional profile, sourcing chain, cost, environmental impact, and taste on a 6-column table. The brand’s SKU appears in the winning column with a product card. These guides rank 3 to 8 months after publication and pull steady-state organic traffic.
Sourcing story pages that build trust
Sourcing story pages name the specific farms, cooperatives, or suppliers the brand sources from, with photos of the farms, farmer quotes, and specific harvest windows. A coffee brand’s Ethiopian farm page ranks for “single-origin Ethiopian coffee” and “Yirgacheffe coffee origin” plus 40 long-tail variations. The sourcing page pulls trust-building traffic that converts at 4 to 6 percent because the shopper landed pattern-matching on transparency and named provenance. Every sourcing page includes farmer or cooperative quotes, harvest dates, and a link back to 3 to 5 hero SKU pages that source from the named supplier.
Vejrø hospitality content case study
Vejrø Resort, a Danish private-island destination with an on-site restaurant focused on organic, locally sourced cuisine, joined us with strong social engagement and no organic-search real estate. Guests found the resort on Instagram but never in Google search for terms like “private island resort Denmark,” “farm-to-table hospitality Denmark,” or “Vejrø restaurant.” The same organic-search gap shows up on DTC food brands running paid social at 20,000 dollars monthly with a broken blog and zero recipe schema.
We built the conversion-focused website with on-site and off-site SEO tuned to the travel-niche keyword clusters, competitor analysis against comparable boutique resorts, and mobile-first design prioritizing guest discovery. Every page carried the structured data qualifying it for Google’s rich results in the hospitality category. Every internal link pushed authority toward the direct-booking conversion path.
Three months later, Vejrø hit 10,000 plus organic visitors, ranked for 200 plus first-page keywords, and pulled a 2.2 percent booking conversion rate from organic traffic. The same pattern applies to content marketing for food brands: recipe schema, ingredient comparison guides, and sourcing story pages pull organic traffic at 20 to 40 percent conversion into hero SKU pages inside 6 months when the content quality matches search intent and every page carries the right structured data markup. Vejrø also proved out the reporting discipline: every monthly report named the exact page, the exact keyword cluster, and the exact search feature (rich result, sitelinks, image pack) driving the incremental organic revenue instead of hiding behind aggregate traffic charts.
Recipe cadence and content calendar for food brands
Recipe cadence on a working food brand content calendar ships 2 to 4 new recipes per week during the first 6 months and drops to 1 per week at maturity. Each recipe takes 4 to 6 hours to produce (write, test in the kitchen, photograph, schema author, publish). At 3 recipes per week, the brand hits 78 recipes inside 6 months plus a backlog of ingredient comparison and sourcing content queued behind the recipe production line.
| Content pillar | Target volume year 1 | Production cost per piece | Refresh cadence |
|---|---|---|---|
| Recipe hub | 40 to 100 recipes | $180 to $320 | Every 12 months |
| Ingredient comparison guides | 12 to 24 guides | $450 to $780 | Every 18 months |
| Sourcing story pages | 6 to 12 pages | $680 to $1,200 | Every 24 months |
| Buyer intent content | 8 to 16 pieces | $220 to $420 | Every 12 months |
Photography as a content calendar constraint
Photography is the actual constraint on recipe cadence, not writing. Every recipe needs 6 to 12 photos: hero shot, ingredient flat lay, prep in progress, plated result, storage, and step shots for the schema markup. A working food brand batches photography 8 recipes at a time to keep the cost per recipe under 200 dollars. Skip the batching and the per-recipe cost climbs to 400 to 600 dollars, which caps recipe cadence at 1 per week and slows organic ranking timeline by 6 months.
Seasonal content calendar planning
Seasonal content calendar planning maps recipes and comparison guides to the seasonal windows they need to rank in. A Christmas cookie recipe needs to publish in September to rank by early December. A Valentine’s chocolate guide needs to publish in November to rank by early February. A back-to-school lunchbox recipe needs to publish in June to rank by late August. The 60-to-90-day ranking curve dictates the calendar.
Creator syndication inside food brand content
Creator syndication on food brand content marketing amplifies the recipe hub through Instagram Reels, TikTok, and YouTube Shorts creators paid to post their own version of the brand’s hero recipes. The creator content pulls net-new audiences into the recipe hub through the creator’s Link in Bio or Amazon Storefront tag. The syndication calendar names 12 to 30 creators per quarter with specific recipes assigned to each.
One brand we picked up had a spreadsheet titled “creator outreach 2023” with 47 rows and 3 responses. All 3 responses were auto-replies. The spreadsheet named zero recipes and offered flat rates below 100 dollars per post. Nobody posts a 30-second video for 87 dollars flat. Nobody.
Creator content commercial terms that work
Working creator content commercial terms run 350 to 1,500 dollars flat per post plus a 12 to 25 percent commission on tagged sales across a 30-day window. The commission mechanic pulls creators into follow-up posts because the incremental revenue continues past the initial fee. Mid-tier creators (30k to 150k followers) hit the sweet spot for food brand content because their engagement rate typically runs 4 to 8 percent versus 0.8 to 1.6 percent on mega-creators.
Content brief structure for creator partnerships
The content brief structure for creator partnerships runs a single page: the SKU, the specific recipe or usage occasion, 3 required brand mentions, 3 restricted claims (no health claims on non-medical SKUs), the pricing angle, the affiliate link, and 3 example videos that hit the tone. The brief avoids over-scripting because over-scripted creator content underperforms native creator voice by 40 to 60 percent on engagement rate.
Buyer intent content for food brand blogs
Buyer intent content on food brand blogs covers 8 to 16 pieces targeting explicit purchase-decision queries: “where to buy [brand],” “[brand] subscription vs. one-time,” “best [category] for [use case],” and “[brand] gift bundle.” Every buyer intent piece runs 1,400 to 2,400 words with a comparison table, product cards, and a clear conversion path to the specific SKU that matches the query intent. Buyer intent content converts at 3 to 6 percent versus 1 to 2 percent on recipe content because the shopper landed already planning to buy, not exploring a usage occasion.
Where-to-buy content structure
Where-to-buy content structure covers online (DTC storefront, Amazon, Target.com, Whole Foods online), retail (specific chain locators with the store finder embedded), and international (customs limitations, retailer partners abroad). Every piece names specific retailers, links to the store locator, and includes an FAQ block covering shipping availability, subscription options, and gift card compatibility. Where-to-buy content ranks for branded discovery queries the DTC storefront otherwise loses to competitor affiliate reviews.
Subscription versus one-time comparison content
Subscription versus one-time comparison content converts subscription commitments at 3 to 6 percent because it addresses the price-sensitivity concern head-on with a specific math table. The piece covers the discount structure (15 percent lifetime), the skip-a-month mechanic, the pause-anytime rule, the cancellation policy, and the specific yearly savings for the brand’s average consumption cadence. Cross-reference the retention structure on our food and beverage marketing retainer page.
Content refresh cadence on food brand pillars
Content refresh cadence on food brand content pillars runs a rolling audit every 12 to 24 months by pillar. Recipes get refreshed every 12 months with new photography, updated schema, and any nutrition or ingredient adjustments. Ingredient comparison guides refresh every 18 months to update market data. Sourcing story pages refresh every 24 months to reflect farm partnership changes and new harvest angles. Buyer intent content refreshes every 12 months to update retailer availability and pricing.
Recipe refresh priority order
Recipe refresh priority runs by organic traffic rank. The top 20 recipes by monthly organic sessions get refreshed first (new photography, schema audit, related recipe internal links, updated nutrition). The next 40 get refreshed at 15 months. The remaining recipes get refreshed opportunistically when the ranking slips past position 15 in Google. Skipping the refresh cadence lets recipe rankings drift out of the top 3 inside 18 months as newer competitor recipes take the position.
Schema audit checklist per refresh
The schema audit checklist per refresh runs 8 items: Recipe schema completeness, aggregateRating count and accuracy, nutrition data accuracy, prepTime and cookTime match the recipe body, image URLs valid at CDN, related recipe internal links working, product card SKU URL live, and Google Search Console rich result eligibility validated. This checklist takes 20 minutes per recipe and prevents the schema drift that costs recipe rankings 20 to 40 positions quietly.
Reporting cadence for food brand content marketing
Reporting cadence on food brand content marketing runs a monthly executive report plus a quarterly business review. The monthly report ships in the first business week and covers organic sessions by pillar, top 10 ranking recipes with position trend, ingredient guide ranking movements, sourcing page performance, and organic-attributed DTC revenue. Every number carries a comparison to the prior month and a plain-language interpretation the founder reads in 7 minutes.
Metrics that matter for content marketing
Metrics that matter for food brand content marketing: organic sessions by pillar, recipe rich result impressions in Search Console, organic conversion rate to hero SKU pages, organic-attributed DTC revenue, and top 20 ranking positions by monthly organic sessions. Vanity metrics that do not matter: total pageviews without conversion context, average time on page without conversion attribution, and social share counts. The monthly report skips the vanity block entirely.
Quarterly business review structure
The quarterly business review runs 90 minutes with the founder, head of content, and SEO lead. Agenda: organic traffic trend by pillar, top 10 winning content pieces, top 10 losing content pieces (candidates for refresh or removal), competitive gap analysis against 5 named competitor brands, and next quarter’s content calendar with recipes and ingredient guides queued. According to Ahrefs content marketing research, brands running quarterly content audits outperform brands running annual audits by 40 to 70 percent on organic revenue over a 24-month window.
Internal linking discipline across food brand content
Internal linking discipline across food brand content moves authority from recipe pages toward hero SKU product pages and comparison guides. Every recipe links to the hero SKU it uses inline (once in the ingredient list, once in a bottom call-out card). Every ingredient comparison guide links to 3 to 6 recipes using the winning ingredient plus the hero SKU product page. Every sourcing story links to the 2 to 4 SKUs sourced from that specific farm or cooperative.
Anchor text strategy across recipe hubs
Anchor text on internal links varies across recipe hubs to avoid over-optimization patterns Google penalizes. Exact-match anchor (“single-origin Ethiopian coffee”) runs on 20 to 30 percent of internal links. Partial-match variations (“our Ethiopian roast”) run on 30 to 40 percent. Branded anchors (the SKU name) run on 20 to 30 percent. Generic anchors (“shop the coffee”) fill the remaining 10 to 20 percent. This ratio holds ranking without triggering the over-optimization penalty that shows up on brands that anchor-text-stuff every internal link with the same exact-match keyword. Cross-reference the linking layer on our food and beverage web design page.
Link equity from ingredient guides to SKU pages
Link equity from ingredient guides passes to SKU pages when the guide’s comparison table names the hero SKU in the winning column with a product card, and when the guide’s body links to 3 to 6 recipes that use the winning ingredient. This 3-hop path (guide to recipe to SKU) pushes authority from a high-traffic informational query down to a high-intent transactional page. According to Search Engine Land SEO coverage, informational content that internally links to transactional pages produces 2 to 4 times higher organic revenue than isolated content silos.
Wrapping up content marketing for food brands
Content marketing for food brands is the organic engine that turns a DTC snack, drink, or CPG storefront into a search-driven revenue channel. Recipe hub of 40 to 100 recipes. Ingredient comparison guides at 12 to 24 pieces. Sourcing story pages at 6 to 12 pieces. Buyer intent content at 8 to 16 pieces. Creator syndication calendar with 12 to 30 creators per quarter. Refresh cadence at 12 to 24 months by pillar. Reporting with organic sessions and organic revenue attribution.
If your DTC food brand is running paid social at 20,000 dollars monthly with a broken blog and zero recipe schema, professional content marketing for food brands pays for itself inside the first 90 days on organic traffic captured. Redefine Web ships content marketing inside our monthly retainer packages. Book a call and we will walk through the last three DTC food brands we built recipe hubs for, pillar by pillar.
Content marketing for food brands starts with a recipe hub because recipe queries account for 40 to 60 percent of high-intent search volume in the food category. Every hero SKU needs 4 to 12 recipes anchored to it, each targeting a specific occasion and audience.
Skip the recipe hub and the brand loses the search real estate that pulls DTC storefront traffic month over month at zero incremental paid cost. Recipe traffic converts at 2 to 4 percent because the shopper landed with usage intent, not passive discovery, which is why food brands win on recipes.
Recipe schema and Google rich result eligibility
Every recipe page ships schema.org Recipe markup including cookTime, prepTime, recipeIngredient, recipeInstructions, nutrition, and aggregateRating. Correctly marked-up recipes qualify for Google’s recipe rich result carousel that pulls 3 to 6 times higher click-through rate than a plain blue link. The schema layer takes 15 minutes per recipe to author and 30 minutes to validate in Google Search Console. Cross-reference the recipe search stack on our food and beverage SEO page.
Recipe hub structure that scales
The recipe hub structure runs 40 to 100 recipes at maturity, organized by hero SKU (4 to 12 recipes per SKU) plus occasion tags (breakfast, weeknight dinner, meal prep, brunch, holiday). Every recipe links back to the hero SKU product page with the SKU embedded in an inline card. The hub earns internal linking value from ingredient comparison guides and the sourcing story pages, which feeds recipe ranking on Google. According to Google Search Central recipe structured data guidance, complete Recipe schema markup is required for eligibility in the recipe carousel and the ingredient search filter.
Pillar structure for food brand content marketing
The pillar structure on content marketing for food brands runs 4 content pillars concurrently: recipe hub (40 to 100 recipes), ingredient comparison guides (12 to 24 guides), sourcing story pages (6 to 12 pages), and buyer intent content (where to buy, subscription vs. one-time, gift bundle guides). Every pillar covers a distinct search intent and every pillar links back to the hero SKU product pages.
Ingredient comparison guide format
Ingredient comparison guides run 1,800 to 3,200 words comparing 2 to 4 ingredient types on 6 to 10 attributes with a comparison table, real-world use case examples, and links to the hero SKU that uses the specific ingredient. Example: organic vs. conventional oats compares nutritional profile, sourcing chain, cost, environmental impact, and taste on a 6-column table. The brand’s SKU appears in the winning column with a product card. These guides rank 3 to 8 months after publication and pull steady-state organic traffic.
Sourcing story pages that build trust
Sourcing story pages name the specific farms, cooperatives, or suppliers the brand sources from, with photos of the farms, farmer quotes, and specific harvest windows. A coffee brand’s Ethiopian farm page ranks for “single-origin Ethiopian coffee” and “Yirgacheffe coffee origin” plus 40 long-tail variations. The sourcing page pulls trust-building traffic that converts at 4 to 6 percent because the shopper landed pattern-matching on transparency and named provenance. Every sourcing page includes farmer or cooperative quotes, harvest dates, and a link back to 3 to 5 hero SKU pages that source from the named supplier.
Vejrø hospitality content case study
Vejrø Resort, a Danish private-island destination with an on-site restaurant focused on organic, locally sourced cuisine, joined us with strong social engagement and no organic-search real estate. Guests found the resort on Instagram but never in Google search for terms like “private island resort Denmark,” “farm-to-table hospitality Denmark,” or “Vejrø restaurant.” The same organic-search gap shows up on DTC food brands running paid social at 20,000 dollars monthly with a broken blog and zero recipe schema.
We built the conversion-focused website with on-site and off-site SEO tuned to the travel-niche keyword clusters, competitor analysis against comparable boutique resorts, and mobile-first design prioritizing guest discovery. Every page carried the structured data qualifying it for Google’s rich results in the hospitality category. Every internal link pushed authority toward the direct-booking conversion path.
Three months later, Vejrø hit 10,000 plus organic visitors, ranked for 200 plus first-page keywords, and pulled a 2.2 percent booking conversion rate from organic traffic. The same pattern applies to content marketing for food brands: recipe schema, ingredient comparison guides, and sourcing story pages pull organic traffic at 20 to 40 percent conversion into hero SKU pages inside 6 months when the content quality matches search intent and every page carries the right structured data markup. Vejrø also proved out the reporting discipline: every monthly report named the exact page, the exact keyword cluster, and the exact search feature (rich result, sitelinks, image pack) driving the incremental organic revenue instead of hiding behind aggregate traffic charts.
Recipe cadence and content calendar for food brands
Recipe cadence on a working food brand content calendar ships 2 to 4 new recipes per week during the first 6 months and drops to 1 per week at maturity. Each recipe takes 4 to 6 hours to produce (write, test in the kitchen, photograph, schema author, publish). At 3 recipes per week, the brand hits 78 recipes inside 6 months plus a backlog of ingredient comparison and sourcing content queued behind the recipe production line.
| Content pillar | Target volume year 1 | Production cost per piece | Refresh cadence |
|---|---|---|---|
| Recipe hub | 40 to 100 recipes | $180 to $320 | Every 12 months |
| Ingredient comparison guides | 12 to 24 guides | $450 to $780 | Every 18 months |
| Sourcing story pages | 6 to 12 pages | $680 to $1,200 | Every 24 months |
| Buyer intent content | 8 to 16 pieces | $220 to $420 | Every 12 months |
Photography as a content calendar constraint
Photography is the actual constraint on recipe cadence, not writing. Every recipe needs 6 to 12 photos: hero shot, ingredient flat lay, prep in progress, plated result, storage, and step shots for the schema markup. A working food brand batches photography 8 recipes at a time to keep the cost per recipe under 200 dollars. Skip the batching and the per-recipe cost climbs to 400 to 600 dollars, which caps recipe cadence at 1 per week and slows organic ranking timeline by 6 months.
Seasonal content calendar planning
Seasonal content calendar planning maps recipes and comparison guides to the seasonal windows they need to rank in. A Christmas cookie recipe needs to publish in September to rank by early December. A Valentine’s chocolate guide needs to publish in November to rank by early February. A back-to-school lunchbox recipe needs to publish in June to rank by late August. The 60-to-90-day ranking curve dictates the calendar.
Creator syndication inside food brand content
Creator syndication on food brand content marketing amplifies the recipe hub through Instagram Reels, TikTok, and YouTube Shorts creators paid to post their own version of the brand’s hero recipes. The creator content pulls net-new audiences into the recipe hub through the creator’s Link in Bio or Amazon Storefront tag. The syndication calendar names 12 to 30 creators per quarter with specific recipes assigned to each.
One brand we picked up had a spreadsheet titled “creator outreach 2023” with 47 rows and 3 responses. All 3 responses were auto-replies. The spreadsheet named zero recipes and offered flat rates below 100 dollars per post. Nobody posts a 30-second video for 87 dollars flat. Nobody.
Creator content commercial terms that work
Working creator content commercial terms run 350 to 1,500 dollars flat per post plus a 12 to 25 percent commission on tagged sales across a 30-day window. The commission mechanic pulls creators into follow-up posts because the incremental revenue continues past the initial fee. Mid-tier creators (30k to 150k followers) hit the sweet spot for food brand content because their engagement rate typically runs 4 to 8 percent versus 0.8 to 1.6 percent on mega-creators.
Content brief structure for creator partnerships
The content brief structure for creator partnerships runs a single page: the SKU, the specific recipe or usage occasion, 3 required brand mentions, 3 restricted claims (no health claims on non-medical SKUs), the pricing angle, the affiliate link, and 3 example videos that hit the tone. The brief avoids over-scripting because over-scripted creator content underperforms native creator voice by 40 to 60 percent on engagement rate.
Buyer intent content for food brand blogs
Buyer intent content on food brand blogs covers 8 to 16 pieces targeting explicit purchase-decision queries: “where to buy [brand],” “[brand] subscription vs. one-time,” “best [category] for [use case],” and “[brand] gift bundle.” Every buyer intent piece runs 1,400 to 2,400 words with a comparison table, product cards, and a clear conversion path to the specific SKU that matches the query intent. Buyer intent content converts at 3 to 6 percent versus 1 to 2 percent on recipe content because the shopper landed already planning to buy, not exploring a usage occasion.
Where-to-buy content structure
Where-to-buy content structure covers online (DTC storefront, Amazon, Target.com, Whole Foods online), retail (specific chain locators with the store finder embedded), and international (customs limitations, retailer partners abroad). Every piece names specific retailers, links to the store locator, and includes an FAQ block covering shipping availability, subscription options, and gift card compatibility. Where-to-buy content ranks for branded discovery queries the DTC storefront otherwise loses to competitor affiliate reviews.
Subscription versus one-time comparison content
Subscription versus one-time comparison content converts subscription commitments at 3 to 6 percent because it addresses the price-sensitivity concern head-on with a specific math table. The piece covers the discount structure (15 percent lifetime), the skip-a-month mechanic, the pause-anytime rule, the cancellation policy, and the specific yearly savings for the brand’s average consumption cadence. Cross-reference the retention structure on our food and beverage marketing retainer page.
Content refresh cadence on food brand pillars
Content refresh cadence on food brand content pillars runs a rolling audit every 12 to 24 months by pillar. Recipes get refreshed every 12 months with new photography, updated schema, and any nutrition or ingredient adjustments. Ingredient comparison guides refresh every 18 months to update market data. Sourcing story pages refresh every 24 months to reflect farm partnership changes and new harvest angles. Buyer intent content refreshes every 12 months to update retailer availability and pricing.
Recipe refresh priority order
Recipe refresh priority runs by organic traffic rank. The top 20 recipes by monthly organic sessions get refreshed first (new photography, schema audit, related recipe internal links, updated nutrition). The next 40 get refreshed at 15 months. The remaining recipes get refreshed opportunistically when the ranking slips past position 15 in Google. Skipping the refresh cadence lets recipe rankings drift out of the top 3 inside 18 months as newer competitor recipes take the position.
Schema audit checklist per refresh
The schema audit checklist per refresh runs 8 items: Recipe schema completeness, aggregateRating count and accuracy, nutrition data accuracy, prepTime and cookTime match the recipe body, image URLs valid at CDN, related recipe internal links working, product card SKU URL live, and Google Search Console rich result eligibility validated. This checklist takes 20 minutes per recipe and prevents the schema drift that costs recipe rankings 20 to 40 positions quietly.
Reporting cadence for food brand content marketing
Reporting cadence on food brand content marketing runs a monthly executive report plus a quarterly business review. The monthly report ships in the first business week and covers organic sessions by pillar, top 10 ranking recipes with position trend, ingredient guide ranking movements, sourcing page performance, and organic-attributed DTC revenue. Every number carries a comparison to the prior month and a plain-language interpretation the founder reads in 7 minutes.
Metrics that matter for content marketing
Metrics that matter for food brand content marketing: organic sessions by pillar, recipe rich result impressions in Search Console, organic conversion rate to hero SKU pages, organic-attributed DTC revenue, and top 20 ranking positions by monthly organic sessions. Vanity metrics that do not matter: total pageviews without conversion context, average time on page without conversion attribution, and social share counts. The monthly report skips the vanity block entirely.
Quarterly business review structure
The quarterly business review runs 90 minutes with the founder, head of content, and SEO lead. Agenda: organic traffic trend by pillar, top 10 winning content pieces, top 10 losing content pieces (candidates for refresh or removal), competitive gap analysis against 5 named competitor brands, and next quarter’s content calendar with recipes and ingredient guides queued. According to Ahrefs content marketing research, brands running quarterly content audits outperform brands running annual audits by 40 to 70 percent on organic revenue over a 24-month window.
Internal linking discipline across food brand content
Internal linking discipline across food brand content moves authority from recipe pages toward hero SKU product pages and comparison guides. Every recipe links to the hero SKU it uses inline (once in the ingredient list, once in a bottom call-out card). Every ingredient comparison guide links to 3 to 6 recipes using the winning ingredient plus the hero SKU product page. Every sourcing story links to the 2 to 4 SKUs sourced from that specific farm or cooperative.
Anchor text strategy across recipe hubs
Anchor text on internal links varies across recipe hubs to avoid over-optimization patterns Google penalizes. Exact-match anchor (“single-origin Ethiopian coffee”) runs on 20 to 30 percent of internal links. Partial-match variations (“our Ethiopian roast”) run on 30 to 40 percent. Branded anchors (the SKU name) run on 20 to 30 percent. Generic anchors (“shop the coffee”) fill the remaining 10 to 20 percent. This ratio holds ranking without triggering the over-optimization penalty that shows up on brands that anchor-text-stuff every internal link with the same exact-match keyword. Cross-reference the linking layer on our food and beverage web design page.
Link equity from ingredient guides to SKU pages
Link equity from ingredient guides passes to SKU pages when the guide’s comparison table names the hero SKU in the winning column with a product card, and when the guide’s body links to 3 to 6 recipes that use the winning ingredient. This 3-hop path (guide to recipe to SKU) pushes authority from a high-traffic informational query down to a high-intent transactional page. According to Search Engine Land SEO coverage, informational content that internally links to transactional pages produces 2 to 4 times higher organic revenue than isolated content silos.
Wrapping up content marketing for food brands
Content marketing for food brands is the organic engine that turns a DTC snack, drink, or CPG storefront into a search-driven revenue channel. Recipe hub of 40 to 100 recipes. Ingredient comparison guides at 12 to 24 pieces. Sourcing story pages at 6 to 12 pieces. Buyer intent content at 8 to 16 pieces. Creator syndication calendar with 12 to 30 creators per quarter. Refresh cadence at 12 to 24 months by pillar. Reporting with organic sessions and organic revenue attribution.
If your DTC food brand is running paid social at 20,000 dollars monthly with a broken blog and zero recipe schema, professional content marketing for food brands pays for itself inside the first 90 days on organic traffic captured. Redefine Web ships content marketing inside our monthly retainer packages. Book a call and we will walk through the last three DTC food brands we built recipe hubs for, pillar by pillar.
Internal linking discipline across food brand content moves authority from recipe pages toward hero SKU product pages and comparison guides. Every recipe links to the hero SKU it uses inline (once in the ingredient list, once in a bottom call-out card). Every ingredient comparison guide links to 3 to 6 recipes using the winning ingredient plus the hero SKU product page. Every sourcing story links to the 2 to 4 SKUs sourced from that specific farm or cooperative.
Anchor text strategy across recipe hubs
Anchor text on internal links varies across recipe hubs to avoid over-optimization patterns Google penalizes. Exact-match anchor (“single-origin Ethiopian coffee”) runs on 20 to 30 percent of internal links. Partial-match variations (“our Ethiopian roast”) run on 30 to 40 percent. Branded anchors (the SKU name) run on 20 to 30 percent. Generic anchors (“shop the coffee”) fill the remaining 10 to 20 percent. This ratio holds ranking without triggering the over-optimization penalty that shows up on brands that anchor-text-stuff every internal link with the same exact-match keyword. Cross-reference the linking layer on our food and beverage web design page.
Link equity from ingredient guides to SKU pages
Link equity from ingredient guides passes to SKU pages when the guide’s comparison table names the hero SKU in the winning column with a product card, and when the guide’s body links to 3 to 6 recipes that use the winning ingredient. This 3-hop path (guide to recipe to SKU) pushes authority from a high-traffic informational query down to a high-intent transactional page. According to Search Engine Land SEO coverage, informational content that internally links to transactional pages produces 2 to 4 times higher organic revenue than isolated content silos.
Wrapping up content marketing for food brands
Content marketing for food brands is the organic engine that turns a DTC snack, drink, or CPG storefront into a search-driven revenue channel. Recipe hub of 40 to 100 recipes. Ingredient comparison guides at 12 to 24 pieces. Sourcing story pages at 6 to 12 pieces. Buyer intent content at 8 to 16 pieces. Creator syndication calendar with 12 to 30 creators per quarter. Refresh cadence at 12 to 24 months by pillar. Reporting with organic sessions and organic revenue attribution.
If your DTC food brand is running paid social at 20,000 dollars monthly with a broken blog and zero recipe schema, professional content marketing for food brands pays for itself inside the first 90 days on organic traffic captured. Redefine Web ships content marketing inside our monthly retainer packages. Book a call and we will walk through the last three DTC food brands we built recipe hubs for, pillar by pillar.
Content marketing for food brands starts with a recipe hub because recipe queries account for 40 to 60 percent of high-intent search volume in the food category. Every hero SKU needs 4 to 12 recipes anchored to it, each targeting a specific occasion and audience.
Skip the recipe hub and the brand loses the search real estate that pulls DTC storefront traffic month over month at zero incremental paid cost. Recipe traffic converts at 2 to 4 percent because the shopper landed with usage intent, not passive discovery, which is why food brands win on recipes.
Recipe schema and Google rich result eligibility
Every recipe page ships schema.org Recipe markup including cookTime, prepTime, recipeIngredient, recipeInstructions, nutrition, and aggregateRating. Correctly marked-up recipes qualify for Google’s recipe rich result carousel that pulls 3 to 6 times higher click-through rate than a plain blue link. The schema layer takes 15 minutes per recipe to author and 30 minutes to validate in Google Search Console. Cross-reference the recipe search stack on our food and beverage SEO page.
Recipe hub structure that scales
The recipe hub structure runs 40 to 100 recipes at maturity, organized by hero SKU (4 to 12 recipes per SKU) plus occasion tags (breakfast, weeknight dinner, meal prep, brunch, holiday). Every recipe links back to the hero SKU product page with the SKU embedded in an inline card. The hub earns internal linking value from ingredient comparison guides and the sourcing story pages, which feeds recipe ranking on Google. According to Google Search Central recipe structured data guidance, complete Recipe schema markup is required for eligibility in the recipe carousel and the ingredient search filter.
Pillar structure for food brand content marketing
The pillar structure on content marketing for food brands runs 4 content pillars concurrently: recipe hub (40 to 100 recipes), ingredient comparison guides (12 to 24 guides), sourcing story pages (6 to 12 pages), and buyer intent content (where to buy, subscription vs. one-time, gift bundle guides). Every pillar covers a distinct search intent and every pillar links back to the hero SKU product pages.
Ingredient comparison guide format
Ingredient comparison guides run 1,800 to 3,200 words comparing 2 to 4 ingredient types on 6 to 10 attributes with a comparison table, real-world use case examples, and links to the hero SKU that uses the specific ingredient. Example: organic vs. conventional oats compares nutritional profile, sourcing chain, cost, environmental impact, and taste on a 6-column table. The brand’s SKU appears in the winning column with a product card. These guides rank 3 to 8 months after publication and pull steady-state organic traffic.
Sourcing story pages that build trust
Sourcing story pages name the specific farms, cooperatives, or suppliers the brand sources from, with photos of the farms, farmer quotes, and specific harvest windows. A coffee brand’s Ethiopian farm page ranks for “single-origin Ethiopian coffee” and “Yirgacheffe coffee origin” plus 40 long-tail variations. The sourcing page pulls trust-building traffic that converts at 4 to 6 percent because the shopper landed pattern-matching on transparency and named provenance. Every sourcing page includes farmer or cooperative quotes, harvest dates, and a link back to 3 to 5 hero SKU pages that source from the named supplier.
Vejrø hospitality content case study
Vejrø Resort, a Danish private-island destination with an on-site restaurant focused on organic, locally sourced cuisine, joined us with strong social engagement and no organic-search real estate. Guests found the resort on Instagram but never in Google search for terms like “private island resort Denmark,” “farm-to-table hospitality Denmark,” or “Vejrø restaurant.” The same organic-search gap shows up on DTC food brands running paid social at 20,000 dollars monthly with a broken blog and zero recipe schema.
We built the conversion-focused website with on-site and off-site SEO tuned to the travel-niche keyword clusters, competitor analysis against comparable boutique resorts, and mobile-first design prioritizing guest discovery. Every page carried the structured data qualifying it for Google’s rich results in the hospitality category. Every internal link pushed authority toward the direct-booking conversion path.
Three months later, Vejrø hit 10,000 plus organic visitors, ranked for 200 plus first-page keywords, and pulled a 2.2 percent booking conversion rate from organic traffic. The same pattern applies to content marketing for food brands: recipe schema, ingredient comparison guides, and sourcing story pages pull organic traffic at 20 to 40 percent conversion into hero SKU pages inside 6 months when the content quality matches search intent and every page carries the right structured data markup. Vejrø also proved out the reporting discipline: every monthly report named the exact page, the exact keyword cluster, and the exact search feature (rich result, sitelinks, image pack) driving the incremental organic revenue instead of hiding behind aggregate traffic charts.
Recipe cadence and content calendar for food brands
Recipe cadence on a working food brand content calendar ships 2 to 4 new recipes per week during the first 6 months and drops to 1 per week at maturity. Each recipe takes 4 to 6 hours to produce (write, test in the kitchen, photograph, schema author, publish). At 3 recipes per week, the brand hits 78 recipes inside 6 months plus a backlog of ingredient comparison and sourcing content queued behind the recipe production line.
| Content pillar | Target volume year 1 | Production cost per piece | Refresh cadence |
|---|---|---|---|
| Recipe hub | 40 to 100 recipes | $180 to $320 | Every 12 months |
| Ingredient comparison guides | 12 to 24 guides | $450 to $780 | Every 18 months |
| Sourcing story pages | 6 to 12 pages | $680 to $1,200 | Every 24 months |
| Buyer intent content | 8 to 16 pieces | $220 to $420 | Every 12 months |
Photography as a content calendar constraint
Photography is the actual constraint on recipe cadence, not writing. Every recipe needs 6 to 12 photos: hero shot, ingredient flat lay, prep in progress, plated result, storage, and step shots for the schema markup. A working food brand batches photography 8 recipes at a time to keep the cost per recipe under 200 dollars. Skip the batching and the per-recipe cost climbs to 400 to 600 dollars, which caps recipe cadence at 1 per week and slows organic ranking timeline by 6 months.
Seasonal content calendar planning
Seasonal content calendar planning maps recipes and comparison guides to the seasonal windows they need to rank in. A Christmas cookie recipe needs to publish in September to rank by early December. A Valentine’s chocolate guide needs to publish in November to rank by early February. A back-to-school lunchbox recipe needs to publish in June to rank by late August. The 60-to-90-day ranking curve dictates the calendar.
Creator syndication inside food brand content
Creator syndication on food brand content marketing amplifies the recipe hub through Instagram Reels, TikTok, and YouTube Shorts creators paid to post their own version of the brand’s hero recipes. The creator content pulls net-new audiences into the recipe hub through the creator’s Link in Bio or Amazon Storefront tag. The syndication calendar names 12 to 30 creators per quarter with specific recipes assigned to each.
One brand we picked up had a spreadsheet titled “creator outreach 2023” with 47 rows and 3 responses. All 3 responses were auto-replies. The spreadsheet named zero recipes and offered flat rates below 100 dollars per post. Nobody posts a 30-second video for 87 dollars flat. Nobody.
Creator content commercial terms that work
Working creator content commercial terms run 350 to 1,500 dollars flat per post plus a 12 to 25 percent commission on tagged sales across a 30-day window. The commission mechanic pulls creators into follow-up posts because the incremental revenue continues past the initial fee. Mid-tier creators (30k to 150k followers) hit the sweet spot for food brand content because their engagement rate typically runs 4 to 8 percent versus 0.8 to 1.6 percent on mega-creators.
Content brief structure for creator partnerships
The content brief structure for creator partnerships runs a single page: the SKU, the specific recipe or usage occasion, 3 required brand mentions, 3 restricted claims (no health claims on non-medical SKUs), the pricing angle, the affiliate link, and 3 example videos that hit the tone. The brief avoids over-scripting because over-scripted creator content underperforms native creator voice by 40 to 60 percent on engagement rate.
Buyer intent content for food brand blogs
Buyer intent content on food brand blogs covers 8 to 16 pieces targeting explicit purchase-decision queries: “where to buy [brand],” “[brand] subscription vs. one-time,” “best [category] for [use case],” and “[brand] gift bundle.” Every buyer intent piece runs 1,400 to 2,400 words with a comparison table, product cards, and a clear conversion path to the specific SKU that matches the query intent. Buyer intent content converts at 3 to 6 percent versus 1 to 2 percent on recipe content because the shopper landed already planning to buy, not exploring a usage occasion.
Where-to-buy content structure
Where-to-buy content structure covers online (DTC storefront, Amazon, Target.com, Whole Foods online), retail (specific chain locators with the store finder embedded), and international (customs limitations, retailer partners abroad). Every piece names specific retailers, links to the store locator, and includes an FAQ block covering shipping availability, subscription options, and gift card compatibility. Where-to-buy content ranks for branded discovery queries the DTC storefront otherwise loses to competitor affiliate reviews.
Subscription versus one-time comparison content
Subscription versus one-time comparison content converts subscription commitments at 3 to 6 percent because it addresses the price-sensitivity concern head-on with a specific math table. The piece covers the discount structure (15 percent lifetime), the skip-a-month mechanic, the pause-anytime rule, the cancellation policy, and the specific yearly savings for the brand’s average consumption cadence. Cross-reference the retention structure on our food and beverage marketing retainer page.
Content refresh cadence on food brand pillars
Content refresh cadence on food brand content pillars runs a rolling audit every 12 to 24 months by pillar. Recipes get refreshed every 12 months with new photography, updated schema, and any nutrition or ingredient adjustments. Ingredient comparison guides refresh every 18 months to update market data. Sourcing story pages refresh every 24 months to reflect farm partnership changes and new harvest angles. Buyer intent content refreshes every 12 months to update retailer availability and pricing.
Recipe refresh priority order
Recipe refresh priority runs by organic traffic rank. The top 20 recipes by monthly organic sessions get refreshed first (new photography, schema audit, related recipe internal links, updated nutrition). The next 40 get refreshed at 15 months. The remaining recipes get refreshed opportunistically when the ranking slips past position 15 in Google. Skipping the refresh cadence lets recipe rankings drift out of the top 3 inside 18 months as newer competitor recipes take the position.
Schema audit checklist per refresh
The schema audit checklist per refresh runs 8 items: Recipe schema completeness, aggregateRating count and accuracy, nutrition data accuracy, prepTime and cookTime match the recipe body, image URLs valid at CDN, related recipe internal links working, product card SKU URL live, and Google Search Console rich result eligibility validated. This checklist takes 20 minutes per recipe and prevents the schema drift that costs recipe rankings 20 to 40 positions quietly.
Reporting cadence for food brand content marketing
Reporting cadence on food brand content marketing runs a monthly executive report plus a quarterly business review. The monthly report ships in the first business week and covers organic sessions by pillar, top 10 ranking recipes with position trend, ingredient guide ranking movements, sourcing page performance, and organic-attributed DTC revenue. Every number carries a comparison to the prior month and a plain-language interpretation the founder reads in 7 minutes.
Metrics that matter for content marketing
Metrics that matter for food brand content marketing: organic sessions by pillar, recipe rich result impressions in Search Console, organic conversion rate to hero SKU pages, organic-attributed DTC revenue, and top 20 ranking positions by monthly organic sessions. Vanity metrics that do not matter: total pageviews without conversion context, average time on page without conversion attribution, and social share counts. The monthly report skips the vanity block entirely.
Quarterly business review structure
The quarterly business review runs 90 minutes with the founder, head of content, and SEO lead. Agenda: organic traffic trend by pillar, top 10 winning content pieces, top 10 losing content pieces (candidates for refresh or removal), competitive gap analysis against 5 named competitor brands, and next quarter’s content calendar with recipes and ingredient guides queued. According to Ahrefs content marketing research, brands running quarterly content audits outperform brands running annual audits by 40 to 70 percent on organic revenue over a 24-month window.
Internal linking discipline across food brand content
Internal linking discipline across food brand content moves authority from recipe pages toward hero SKU product pages and comparison guides. Every recipe links to the hero SKU it uses inline (once in the ingredient list, once in a bottom call-out card). Every ingredient comparison guide links to 3 to 6 recipes using the winning ingredient plus the hero SKU product page. Every sourcing story links to the 2 to 4 SKUs sourced from that specific farm or cooperative.
Anchor text strategy across recipe hubs
Anchor text on internal links varies across recipe hubs to avoid over-optimization patterns Google penalizes. Exact-match anchor (“single-origin Ethiopian coffee”) runs on 20 to 30 percent of internal links. Partial-match variations (“our Ethiopian roast”) run on 30 to 40 percent. Branded anchors (the SKU name) run on 20 to 30 percent. Generic anchors (“shop the coffee”) fill the remaining 10 to 20 percent. This ratio holds ranking without triggering the over-optimization penalty that shows up on brands that anchor-text-stuff every internal link with the same exact-match keyword. Cross-reference the linking layer on our food and beverage web design page.
Link equity from ingredient guides to SKU pages
Link equity from ingredient guides passes to SKU pages when the guide’s comparison table names the hero SKU in the winning column with a product card, and when the guide’s body links to 3 to 6 recipes that use the winning ingredient. This 3-hop path (guide to recipe to SKU) pushes authority from a high-traffic informational query down to a high-intent transactional page. According to Search Engine Land SEO coverage, informational content that internally links to transactional pages produces 2 to 4 times higher organic revenue than isolated content silos.
Wrapping up content marketing for food brands
Content marketing for food brands is the organic engine that turns a DTC snack, drink, or CPG storefront into a search-driven revenue channel. Recipe hub of 40 to 100 recipes. Ingredient comparison guides at 12 to 24 pieces. Sourcing story pages at 6 to 12 pieces. Buyer intent content at 8 to 16 pieces. Creator syndication calendar with 12 to 30 creators per quarter. Refresh cadence at 12 to 24 months by pillar. Reporting with organic sessions and organic revenue attribution.
If your DTC food brand is running paid social at 20,000 dollars monthly with a broken blog and zero recipe schema, professional content marketing for food brands pays for itself inside the first 90 days on organic traffic captured. Redefine Web ships content marketing inside our monthly retainer packages. Book a call and we will walk through the last three DTC food brands we built recipe hubs for, pillar by pillar.
Content marketing for food brands starts with a recipe hub because recipe queries account for 40 to 60 percent of high-intent search volume in the food category. Every hero SKU needs 4 to 12 recipes anchored to it, each targeting a specific occasion and audience.
Skip the recipe hub and the brand loses the search real estate that pulls DTC storefront traffic month over month at zero incremental paid cost. Recipe traffic converts at 2 to 4 percent because the shopper landed with usage intent, not passive discovery, which is why food brands win on recipes.
Recipe schema and Google rich result eligibility
Every recipe page ships schema.org Recipe markup including cookTime, prepTime, recipeIngredient, recipeInstructions, nutrition, and aggregateRating. Correctly marked-up recipes qualify for Google’s recipe rich result carousel that pulls 3 to 6 times higher click-through rate than a plain blue link. The schema layer takes 15 minutes per recipe to author and 30 minutes to validate in Google Search Console. Cross-reference the recipe search stack on our food and beverage SEO page.
Recipe hub structure that scales
The recipe hub structure runs 40 to 100 recipes at maturity, organized by hero SKU (4 to 12 recipes per SKU) plus occasion tags (breakfast, weeknight dinner, meal prep, brunch, holiday). Every recipe links back to the hero SKU product page with the SKU embedded in an inline card. The hub earns internal linking value from ingredient comparison guides and the sourcing story pages, which feeds recipe ranking on Google. According to Google Search Central recipe structured data guidance, complete Recipe schema markup is required for eligibility in the recipe carousel and the ingredient search filter.
Pillar structure for food brand content marketing
The pillar structure on content marketing for food brands runs 4 content pillars concurrently: recipe hub (40 to 100 recipes), ingredient comparison guides (12 to 24 guides), sourcing story pages (6 to 12 pages), and buyer intent content (where to buy, subscription vs. one-time, gift bundle guides). Every pillar covers a distinct search intent and every pillar links back to the hero SKU product pages.
Ingredient comparison guide format
Ingredient comparison guides run 1,800 to 3,200 words comparing 2 to 4 ingredient types on 6 to 10 attributes with a comparison table, real-world use case examples, and links to the hero SKU that uses the specific ingredient. Example: organic vs. conventional oats compares nutritional profile, sourcing chain, cost, environmental impact, and taste on a 6-column table. The brand’s SKU appears in the winning column with a product card. These guides rank 3 to 8 months after publication and pull steady-state organic traffic.
Sourcing story pages that build trust
Sourcing story pages name the specific farms, cooperatives, or suppliers the brand sources from, with photos of the farms, farmer quotes, and specific harvest windows. A coffee brand’s Ethiopian farm page ranks for “single-origin Ethiopian coffee” and “Yirgacheffe coffee origin” plus 40 long-tail variations. The sourcing page pulls trust-building traffic that converts at 4 to 6 percent because the shopper landed pattern-matching on transparency and named provenance. Every sourcing page includes farmer or cooperative quotes, harvest dates, and a link back to 3 to 5 hero SKU pages that source from the named supplier.
Vejrø hospitality content case study
Vejrø Resort, a Danish private-island destination with an on-site restaurant focused on organic, locally sourced cuisine, joined us with strong social engagement and no organic-search real estate. Guests found the resort on Instagram but never in Google search for terms like “private island resort Denmark,” “farm-to-table hospitality Denmark,” or “Vejrø restaurant.” The same organic-search gap shows up on DTC food brands running paid social at 20,000 dollars monthly with a broken blog and zero recipe schema.
We built the conversion-focused website with on-site and off-site SEO tuned to the travel-niche keyword clusters, competitor analysis against comparable boutique resorts, and mobile-first design prioritizing guest discovery. Every page carried the structured data qualifying it for Google’s rich results in the hospitality category. Every internal link pushed authority toward the direct-booking conversion path.
Three months later, Vejrø hit 10,000 plus organic visitors, ranked for 200 plus first-page keywords, and pulled a 2.2 percent booking conversion rate from organic traffic. The same pattern applies to content marketing for food brands: recipe schema, ingredient comparison guides, and sourcing story pages pull organic traffic at 20 to 40 percent conversion into hero SKU pages inside 6 months when the content quality matches search intent and every page carries the right structured data markup. Vejrø also proved out the reporting discipline: every monthly report named the exact page, the exact keyword cluster, and the exact search feature (rich result, sitelinks, image pack) driving the incremental organic revenue instead of hiding behind aggregate traffic charts.
Recipe cadence and content calendar for food brands
Recipe cadence on a working food brand content calendar ships 2 to 4 new recipes per week during the first 6 months and drops to 1 per week at maturity. Each recipe takes 4 to 6 hours to produce (write, test in the kitchen, photograph, schema author, publish). At 3 recipes per week, the brand hits 78 recipes inside 6 months plus a backlog of ingredient comparison and sourcing content queued behind the recipe production line.
| Content pillar | Target volume year 1 | Production cost per piece | Refresh cadence |
|---|---|---|---|
| Recipe hub | 40 to 100 recipes | $180 to $320 | Every 12 months |
| Ingredient comparison guides | 12 to 24 guides | $450 to $780 | Every 18 months |
| Sourcing story pages | 6 to 12 pages | $680 to $1,200 | Every 24 months |
| Buyer intent content | 8 to 16 pieces | $220 to $420 | Every 12 months |
Photography as a content calendar constraint
Photography is the actual constraint on recipe cadence, not writing. Every recipe needs 6 to 12 photos: hero shot, ingredient flat lay, prep in progress, plated result, storage, and step shots for the schema markup. A working food brand batches photography 8 recipes at a time to keep the cost per recipe under 200 dollars. Skip the batching and the per-recipe cost climbs to 400 to 600 dollars, which caps recipe cadence at 1 per week and slows organic ranking timeline by 6 months.
Seasonal content calendar planning
Seasonal content calendar planning maps recipes and comparison guides to the seasonal windows they need to rank in. A Christmas cookie recipe needs to publish in September to rank by early December. A Valentine’s chocolate guide needs to publish in November to rank by early February. A back-to-school lunchbox recipe needs to publish in June to rank by late August. The 60-to-90-day ranking curve dictates the calendar.
Creator syndication inside food brand content
Creator syndication on food brand content marketing amplifies the recipe hub through Instagram Reels, TikTok, and YouTube Shorts creators paid to post their own version of the brand’s hero recipes. The creator content pulls net-new audiences into the recipe hub through the creator’s Link in Bio or Amazon Storefront tag. The syndication calendar names 12 to 30 creators per quarter with specific recipes assigned to each.
One brand we picked up had a spreadsheet titled “creator outreach 2023” with 47 rows and 3 responses. All 3 responses were auto-replies. The spreadsheet named zero recipes and offered flat rates below 100 dollars per post. Nobody posts a 30-second video for 87 dollars flat. Nobody.
Creator content commercial terms that work
Working creator content commercial terms run 350 to 1,500 dollars flat per post plus a 12 to 25 percent commission on tagged sales across a 30-day window. The commission mechanic pulls creators into follow-up posts because the incremental revenue continues past the initial fee. Mid-tier creators (30k to 150k followers) hit the sweet spot for food brand content because their engagement rate typically runs 4 to 8 percent versus 0.8 to 1.6 percent on mega-creators.
Content brief structure for creator partnerships
The content brief structure for creator partnerships runs a single page: the SKU, the specific recipe or usage occasion, 3 required brand mentions, 3 restricted claims (no health claims on non-medical SKUs), the pricing angle, the affiliate link, and 3 example videos that hit the tone. The brief avoids over-scripting because over-scripted creator content underperforms native creator voice by 40 to 60 percent on engagement rate.
Buyer intent content for food brand blogs
Buyer intent content on food brand blogs covers 8 to 16 pieces targeting explicit purchase-decision queries: “where to buy [brand],” “[brand] subscription vs. one-time,” “best [category] for [use case],” and “[brand] gift bundle.” Every buyer intent piece runs 1,400 to 2,400 words with a comparison table, product cards, and a clear conversion path to the specific SKU that matches the query intent. Buyer intent content converts at 3 to 6 percent versus 1 to 2 percent on recipe content because the shopper landed already planning to buy, not exploring a usage occasion.
Where-to-buy content structure
Where-to-buy content structure covers online (DTC storefront, Amazon, Target.com, Whole Foods online), retail (specific chain locators with the store finder embedded), and international (customs limitations, retailer partners abroad). Every piece names specific retailers, links to the store locator, and includes an FAQ block covering shipping availability, subscription options, and gift card compatibility. Where-to-buy content ranks for branded discovery queries the DTC storefront otherwise loses to competitor affiliate reviews.
Subscription versus one-time comparison content
Subscription versus one-time comparison content converts subscription commitments at 3 to 6 percent because it addresses the price-sensitivity concern head-on with a specific math table. The piece covers the discount structure (15 percent lifetime), the skip-a-month mechanic, the pause-anytime rule, the cancellation policy, and the specific yearly savings for the brand’s average consumption cadence. Cross-reference the retention structure on our food and beverage marketing retainer page.
Content refresh cadence on food brand pillars
Content refresh cadence on food brand content pillars runs a rolling audit every 12 to 24 months by pillar. Recipes get refreshed every 12 months with new photography, updated schema, and any nutrition or ingredient adjustments. Ingredient comparison guides refresh every 18 months to update market data. Sourcing story pages refresh every 24 months to reflect farm partnership changes and new harvest angles. Buyer intent content refreshes every 12 months to update retailer availability and pricing.
Recipe refresh priority order
Recipe refresh priority runs by organic traffic rank. The top 20 recipes by monthly organic sessions get refreshed first (new photography, schema audit, related recipe internal links, updated nutrition). The next 40 get refreshed at 15 months. The remaining recipes get refreshed opportunistically when the ranking slips past position 15 in Google. Skipping the refresh cadence lets recipe rankings drift out of the top 3 inside 18 months as newer competitor recipes take the position.
Schema audit checklist per refresh
The schema audit checklist per refresh runs 8 items: Recipe schema completeness, aggregateRating count and accuracy, nutrition data accuracy, prepTime and cookTime match the recipe body, image URLs valid at CDN, related recipe internal links working, product card SKU URL live, and Google Search Console rich result eligibility validated. This checklist takes 20 minutes per recipe and prevents the schema drift that costs recipe rankings 20 to 40 positions quietly.
Reporting cadence for food brand content marketing
Reporting cadence on food brand content marketing runs a monthly executive report plus a quarterly business review. The monthly report ships in the first business week and covers organic sessions by pillar, top 10 ranking recipes with position trend, ingredient guide ranking movements, sourcing page performance, and organic-attributed DTC revenue. Every number carries a comparison to the prior month and a plain-language interpretation the founder reads in 7 minutes.
Metrics that matter for content marketing
Metrics that matter for food brand content marketing: organic sessions by pillar, recipe rich result impressions in Search Console, organic conversion rate to hero SKU pages, organic-attributed DTC revenue, and top 20 ranking positions by monthly organic sessions. Vanity metrics that do not matter: total pageviews without conversion context, average time on page without conversion attribution, and social share counts. The monthly report skips the vanity block entirely.
Quarterly business review structure
The quarterly business review runs 90 minutes with the founder, head of content, and SEO lead. Agenda: organic traffic trend by pillar, top 10 winning content pieces, top 10 losing content pieces (candidates for refresh or removal), competitive gap analysis against 5 named competitor brands, and next quarter’s content calendar with recipes and ingredient guides queued. According to Ahrefs content marketing research, brands running quarterly content audits outperform brands running annual audits by 40 to 70 percent on organic revenue over a 24-month window.
Internal linking discipline across food brand content
Internal linking discipline across food brand content moves authority from recipe pages toward hero SKU product pages and comparison guides. Every recipe links to the hero SKU it uses inline (once in the ingredient list, once in a bottom call-out card). Every ingredient comparison guide links to 3 to 6 recipes using the winning ingredient plus the hero SKU product page. Every sourcing story links to the 2 to 4 SKUs sourced from that specific farm or cooperative.
Anchor text strategy across recipe hubs
Anchor text on internal links varies across recipe hubs to avoid over-optimization patterns Google penalizes. Exact-match anchor (“single-origin Ethiopian coffee”) runs on 20 to 30 percent of internal links. Partial-match variations (“our Ethiopian roast”) run on 30 to 40 percent. Branded anchors (the SKU name) run on 20 to 30 percent. Generic anchors (“shop the coffee”) fill the remaining 10 to 20 percent. This ratio holds ranking without triggering the over-optimization penalty that shows up on brands that anchor-text-stuff every internal link with the same exact-match keyword. Cross-reference the linking layer on our food and beverage web design page.
Link equity from ingredient guides to SKU pages
Link equity from ingredient guides passes to SKU pages when the guide’s comparison table names the hero SKU in the winning column with a product card, and when the guide’s body links to 3 to 6 recipes that use the winning ingredient. This 3-hop path (guide to recipe to SKU) pushes authority from a high-traffic informational query down to a high-intent transactional page. According to Search Engine Land SEO coverage, informational content that internally links to transactional pages produces 2 to 4 times higher organic revenue than isolated content silos.
Wrapping up content marketing for food brands
Content marketing for food brands is the organic engine that turns a DTC snack, drink, or CPG storefront into a search-driven revenue channel. Recipe hub of 40 to 100 recipes. Ingredient comparison guides at 12 to 24 pieces. Sourcing story pages at 6 to 12 pieces. Buyer intent content at 8 to 16 pieces. Creator syndication calendar with 12 to 30 creators per quarter. Refresh cadence at 12 to 24 months by pillar. Reporting with organic sessions and organic revenue attribution.
If your DTC food brand is running paid social at 20,000 dollars monthly with a broken blog and zero recipe schema, professional content marketing for food brands pays for itself inside the first 90 days on organic traffic captured. Redefine Web ships content marketing inside our monthly retainer packages. Book a call and we will walk through the last three DTC food brands we built recipe hubs for, pillar by pillar.
Anchor text on internal links varies across recipe hubs to avoid over-optimization patterns Google penalizes. Exact-match anchor (“single-origin Ethiopian coffee”) runs on 20 to 30 percent of internal links. Partial-match variations (“our Ethiopian roast”) run on 30 to 40 percent. Branded anchors (the SKU name) run on 20 to 30 percent. Generic anchors (“shop the coffee”) fill the remaining 10 to 20 percent. This ratio holds ranking without triggering the over-optimization penalty that shows up on brands that anchor-text-stuff every internal link with the same exact-match keyword. Cross-reference the linking layer on our food and beverage web design page.
Link equity from ingredient guides to SKU pages
Link equity from ingredient guides passes to SKU pages when the guide’s comparison table names the hero SKU in the winning column with a product card, and when the guide’s body links to 3 to 6 recipes that use the winning ingredient. This 3-hop path (guide to recipe to SKU) pushes authority from a high-traffic informational query down to a high-intent transactional page. According to Search Engine Land SEO coverage, informational content that internally links to transactional pages produces 2 to 4 times higher organic revenue than isolated content silos.
Wrapping up content marketing for food brands
Content marketing for food brands is the organic engine that turns a DTC snack, drink, or CPG storefront into a search-driven revenue channel. Recipe hub of 40 to 100 recipes. Ingredient comparison guides at 12 to 24 pieces. Sourcing story pages at 6 to 12 pieces. Buyer intent content at 8 to 16 pieces. Creator syndication calendar with 12 to 30 creators per quarter. Refresh cadence at 12 to 24 months by pillar. Reporting with organic sessions and organic revenue attribution.
If your DTC food brand is running paid social at 20,000 dollars monthly with a broken blog and zero recipe schema, professional content marketing for food brands pays for itself inside the first 90 days on organic traffic captured. Redefine Web ships content marketing inside our monthly retainer packages. Book a call and we will walk through the last three DTC food brands we built recipe hubs for, pillar by pillar.
Internal linking discipline across food brand content moves authority from recipe pages toward hero SKU product pages and comparison guides. Every recipe links to the hero SKU it uses inline (once in the ingredient list, once in a bottom call-out card). Every ingredient comparison guide links to 3 to 6 recipes using the winning ingredient plus the hero SKU product page. Every sourcing story links to the 2 to 4 SKUs sourced from that specific farm or cooperative.
Anchor text strategy across recipe hubs
Anchor text on internal links varies across recipe hubs to avoid over-optimization patterns Google penalizes. Exact-match anchor (“single-origin Ethiopian coffee”) runs on 20 to 30 percent of internal links. Partial-match variations (“our Ethiopian roast”) run on 30 to 40 percent. Branded anchors (the SKU name) run on 20 to 30 percent. Generic anchors (“shop the coffee”) fill the remaining 10 to 20 percent. This ratio holds ranking without triggering the over-optimization penalty that shows up on brands that anchor-text-stuff every internal link with the same exact-match keyword. Cross-reference the linking layer on our food and beverage web design page.
Link equity from ingredient guides to SKU pages
Link equity from ingredient guides passes to SKU pages when the guide’s comparison table names the hero SKU in the winning column with a product card, and when the guide’s body links to 3 to 6 recipes that use the winning ingredient. This 3-hop path (guide to recipe to SKU) pushes authority from a high-traffic informational query down to a high-intent transactional page. According to Search Engine Land SEO coverage, informational content that internally links to transactional pages produces 2 to 4 times higher organic revenue than isolated content silos.
Wrapping up content marketing for food brands
Content marketing for food brands is the organic engine that turns a DTC snack, drink, or CPG storefront into a search-driven revenue channel. Recipe hub of 40 to 100 recipes. Ingredient comparison guides at 12 to 24 pieces. Sourcing story pages at 6 to 12 pieces. Buyer intent content at 8 to 16 pieces. Creator syndication calendar with 12 to 30 creators per quarter. Refresh cadence at 12 to 24 months by pillar. Reporting with organic sessions and organic revenue attribution.
If your DTC food brand is running paid social at 20,000 dollars monthly with a broken blog and zero recipe schema, professional content marketing for food brands pays for itself inside the first 90 days on organic traffic captured. Redefine Web ships content marketing inside our monthly retainer packages. Book a call and we will walk through the last three DTC food brands we built recipe hubs for, pillar by pillar.
Content marketing for food brands starts with a recipe hub because recipe queries account for 40 to 60 percent of high-intent search volume in the food category. Every hero SKU needs 4 to 12 recipes anchored to it, each targeting a specific occasion and audience.
Skip the recipe hub and the brand loses the search real estate that pulls DTC storefront traffic month over month at zero incremental paid cost. Recipe traffic converts at 2 to 4 percent because the shopper landed with usage intent, not passive discovery, which is why food brands win on recipes.
Recipe schema and Google rich result eligibility
Every recipe page ships schema.org Recipe markup including cookTime, prepTime, recipeIngredient, recipeInstructions, nutrition, and aggregateRating. Correctly marked-up recipes qualify for Google’s recipe rich result carousel that pulls 3 to 6 times higher click-through rate than a plain blue link. The schema layer takes 15 minutes per recipe to author and 30 minutes to validate in Google Search Console. Cross-reference the recipe search stack on our food and beverage SEO page.
Recipe hub structure that scales
The recipe hub structure runs 40 to 100 recipes at maturity, organized by hero SKU (4 to 12 recipes per SKU) plus occasion tags (breakfast, weeknight dinner, meal prep, brunch, holiday). Every recipe links back to the hero SKU product page with the SKU embedded in an inline card. The hub earns internal linking value from ingredient comparison guides and the sourcing story pages, which feeds recipe ranking on Google. According to Google Search Central recipe structured data guidance, complete Recipe schema markup is required for eligibility in the recipe carousel and the ingredient search filter.
Pillar structure for food brand content marketing
The pillar structure on content marketing for food brands runs 4 content pillars concurrently: recipe hub (40 to 100 recipes), ingredient comparison guides (12 to 24 guides), sourcing story pages (6 to 12 pages), and buyer intent content (where to buy, subscription vs. one-time, gift bundle guides). Every pillar covers a distinct search intent and every pillar links back to the hero SKU product pages.
Ingredient comparison guide format
Ingredient comparison guides run 1,800 to 3,200 words comparing 2 to 4 ingredient types on 6 to 10 attributes with a comparison table, real-world use case examples, and links to the hero SKU that uses the specific ingredient. Example: organic vs. conventional oats compares nutritional profile, sourcing chain, cost, environmental impact, and taste on a 6-column table. The brand’s SKU appears in the winning column with a product card. These guides rank 3 to 8 months after publication and pull steady-state organic traffic.
Sourcing story pages that build trust
Sourcing story pages name the specific farms, cooperatives, or suppliers the brand sources from, with photos of the farms, farmer quotes, and specific harvest windows. A coffee brand’s Ethiopian farm page ranks for “single-origin Ethiopian coffee” and “Yirgacheffe coffee origin” plus 40 long-tail variations. The sourcing page pulls trust-building traffic that converts at 4 to 6 percent because the shopper landed pattern-matching on transparency and named provenance. Every sourcing page includes farmer or cooperative quotes, harvest dates, and a link back to 3 to 5 hero SKU pages that source from the named supplier.
Vejrø hospitality content case study
Vejrø Resort, a Danish private-island destination with an on-site restaurant focused on organic, locally sourced cuisine, joined us with strong social engagement and no organic-search real estate. Guests found the resort on Instagram but never in Google search for terms like “private island resort Denmark,” “farm-to-table hospitality Denmark,” or “Vejrø restaurant.” The same organic-search gap shows up on DTC food brands running paid social at 20,000 dollars monthly with a broken blog and zero recipe schema.
We built the conversion-focused website with on-site and off-site SEO tuned to the travel-niche keyword clusters, competitor analysis against comparable boutique resorts, and mobile-first design prioritizing guest discovery. Every page carried the structured data qualifying it for Google’s rich results in the hospitality category. Every internal link pushed authority toward the direct-booking conversion path.
Three months later, Vejrø hit 10,000 plus organic visitors, ranked for 200 plus first-page keywords, and pulled a 2.2 percent booking conversion rate from organic traffic. The same pattern applies to content marketing for food brands: recipe schema, ingredient comparison guides, and sourcing story pages pull organic traffic at 20 to 40 percent conversion into hero SKU pages inside 6 months when the content quality matches search intent and every page carries the right structured data markup. Vejrø also proved out the reporting discipline: every monthly report named the exact page, the exact keyword cluster, and the exact search feature (rich result, sitelinks, image pack) driving the incremental organic revenue instead of hiding behind aggregate traffic charts.
Recipe cadence and content calendar for food brands
Recipe cadence on a working food brand content calendar ships 2 to 4 new recipes per week during the first 6 months and drops to 1 per week at maturity. Each recipe takes 4 to 6 hours to produce (write, test in the kitchen, photograph, schema author, publish). At 3 recipes per week, the brand hits 78 recipes inside 6 months plus a backlog of ingredient comparison and sourcing content queued behind the recipe production line.
| Content pillar | Target volume year 1 | Production cost per piece | Refresh cadence |
|---|---|---|---|
| Recipe hub | 40 to 100 recipes | $180 to $320 | Every 12 months |
| Ingredient comparison guides | 12 to 24 guides | $450 to $780 | Every 18 months |
| Sourcing story pages | 6 to 12 pages | $680 to $1,200 | Every 24 months |
| Buyer intent content | 8 to 16 pieces | $220 to $420 | Every 12 months |
Photography as a content calendar constraint
Photography is the actual constraint on recipe cadence, not writing. Every recipe needs 6 to 12 photos: hero shot, ingredient flat lay, prep in progress, plated result, storage, and step shots for the schema markup. A working food brand batches photography 8 recipes at a time to keep the cost per recipe under 200 dollars. Skip the batching and the per-recipe cost climbs to 400 to 600 dollars, which caps recipe cadence at 1 per week and slows organic ranking timeline by 6 months.
Seasonal content calendar planning
Seasonal content calendar planning maps recipes and comparison guides to the seasonal windows they need to rank in. A Christmas cookie recipe needs to publish in September to rank by early December. A Valentine’s chocolate guide needs to publish in November to rank by early February. A back-to-school lunchbox recipe needs to publish in June to rank by late August. The 60-to-90-day ranking curve dictates the calendar.
Creator syndication inside food brand content
Creator syndication on food brand content marketing amplifies the recipe hub through Instagram Reels, TikTok, and YouTube Shorts creators paid to post their own version of the brand’s hero recipes. The creator content pulls net-new audiences into the recipe hub through the creator’s Link in Bio or Amazon Storefront tag. The syndication calendar names 12 to 30 creators per quarter with specific recipes assigned to each.
One brand we picked up had a spreadsheet titled “creator outreach 2023” with 47 rows and 3 responses. All 3 responses were auto-replies. The spreadsheet named zero recipes and offered flat rates below 100 dollars per post. Nobody posts a 30-second video for 87 dollars flat. Nobody.
Creator content commercial terms that work
Working creator content commercial terms run 350 to 1,500 dollars flat per post plus a 12 to 25 percent commission on tagged sales across a 30-day window. The commission mechanic pulls creators into follow-up posts because the incremental revenue continues past the initial fee. Mid-tier creators (30k to 150k followers) hit the sweet spot for food brand content because their engagement rate typically runs 4 to 8 percent versus 0.8 to 1.6 percent on mega-creators.
Content brief structure for creator partnerships
The content brief structure for creator partnerships runs a single page: the SKU, the specific recipe or usage occasion, 3 required brand mentions, 3 restricted claims (no health claims on non-medical SKUs), the pricing angle, the affiliate link, and 3 example videos that hit the tone. The brief avoids over-scripting because over-scripted creator content underperforms native creator voice by 40 to 60 percent on engagement rate.
Buyer intent content for food brand blogs
Buyer intent content on food brand blogs covers 8 to 16 pieces targeting explicit purchase-decision queries: “where to buy [brand],” “[brand] subscription vs. one-time,” “best [category] for [use case],” and “[brand] gift bundle.” Every buyer intent piece runs 1,400 to 2,400 words with a comparison table, product cards, and a clear conversion path to the specific SKU that matches the query intent. Buyer intent content converts at 3 to 6 percent versus 1 to 2 percent on recipe content because the shopper landed already planning to buy, not exploring a usage occasion.
Where-to-buy content structure
Where-to-buy content structure covers online (DTC storefront, Amazon, Target.com, Whole Foods online), retail (specific chain locators with the store finder embedded), and international (customs limitations, retailer partners abroad). Every piece names specific retailers, links to the store locator, and includes an FAQ block covering shipping availability, subscription options, and gift card compatibility. Where-to-buy content ranks for branded discovery queries the DTC storefront otherwise loses to competitor affiliate reviews.
Subscription versus one-time comparison content
Subscription versus one-time comparison content converts subscription commitments at 3 to 6 percent because it addresses the price-sensitivity concern head-on with a specific math table. The piece covers the discount structure (15 percent lifetime), the skip-a-month mechanic, the pause-anytime rule, the cancellation policy, and the specific yearly savings for the brand’s average consumption cadence. Cross-reference the retention structure on our food and beverage marketing retainer page.
Content refresh cadence on food brand pillars
Content refresh cadence on food brand content pillars runs a rolling audit every 12 to 24 months by pillar. Recipes get refreshed every 12 months with new photography, updated schema, and any nutrition or ingredient adjustments. Ingredient comparison guides refresh every 18 months to update market data. Sourcing story pages refresh every 24 months to reflect farm partnership changes and new harvest angles. Buyer intent content refreshes every 12 months to update retailer availability and pricing.
Recipe refresh priority order
Recipe refresh priority runs by organic traffic rank. The top 20 recipes by monthly organic sessions get refreshed first (new photography, schema audit, related recipe internal links, updated nutrition). The next 40 get refreshed at 15 months. The remaining recipes get refreshed opportunistically when the ranking slips past position 15 in Google. Skipping the refresh cadence lets recipe rankings drift out of the top 3 inside 18 months as newer competitor recipes take the position.
Schema audit checklist per refresh
The schema audit checklist per refresh runs 8 items: Recipe schema completeness, aggregateRating count and accuracy, nutrition data accuracy, prepTime and cookTime match the recipe body, image URLs valid at CDN, related recipe internal links working, product card SKU URL live, and Google Search Console rich result eligibility validated. This checklist takes 20 minutes per recipe and prevents the schema drift that costs recipe rankings 20 to 40 positions quietly.
Reporting cadence for food brand content marketing
Reporting cadence on food brand content marketing runs a monthly executive report plus a quarterly business review. The monthly report ships in the first business week and covers organic sessions by pillar, top 10 ranking recipes with position trend, ingredient guide ranking movements, sourcing page performance, and organic-attributed DTC revenue. Every number carries a comparison to the prior month and a plain-language interpretation the founder reads in 7 minutes.
Metrics that matter for content marketing
Metrics that matter for food brand content marketing: organic sessions by pillar, recipe rich result impressions in Search Console, organic conversion rate to hero SKU pages, organic-attributed DTC revenue, and top 20 ranking positions by monthly organic sessions. Vanity metrics that do not matter: total pageviews without conversion context, average time on page without conversion attribution, and social share counts. The monthly report skips the vanity block entirely.
Quarterly business review structure
The quarterly business review runs 90 minutes with the founder, head of content, and SEO lead. Agenda: organic traffic trend by pillar, top 10 winning content pieces, top 10 losing content pieces (candidates for refresh or removal), competitive gap analysis against 5 named competitor brands, and next quarter’s content calendar with recipes and ingredient guides queued. According to Ahrefs content marketing research, brands running quarterly content audits outperform brands running annual audits by 40 to 70 percent on organic revenue over a 24-month window.
Internal linking discipline across food brand content
Internal linking discipline across food brand content moves authority from recipe pages toward hero SKU product pages and comparison guides. Every recipe links to the hero SKU it uses inline (once in the ingredient list, once in a bottom call-out card). Every ingredient comparison guide links to 3 to 6 recipes using the winning ingredient plus the hero SKU product page. Every sourcing story links to the 2 to 4 SKUs sourced from that specific farm or cooperative.
Anchor text strategy across recipe hubs
Anchor text on internal links varies across recipe hubs to avoid over-optimization patterns Google penalizes. Exact-match anchor (“single-origin Ethiopian coffee”) runs on 20 to 30 percent of internal links. Partial-match variations (“our Ethiopian roast”) run on 30 to 40 percent. Branded anchors (the SKU name) run on 20 to 30 percent. Generic anchors (“shop the coffee”) fill the remaining 10 to 20 percent. This ratio holds ranking without triggering the over-optimization penalty that shows up on brands that anchor-text-stuff every internal link with the same exact-match keyword. Cross-reference the linking layer on our food and beverage web design page.
Link equity from ingredient guides to SKU pages
Link equity from ingredient guides passes to SKU pages when the guide’s comparison table names the hero SKU in the winning column with a product card, and when the guide’s body links to 3 to 6 recipes that use the winning ingredient. This 3-hop path (guide to recipe to SKU) pushes authority from a high-traffic informational query down to a high-intent transactional page. According to Search Engine Land SEO coverage, informational content that internally links to transactional pages produces 2 to 4 times higher organic revenue than isolated content silos.
Wrapping up content marketing for food brands
Content marketing for food brands is the organic engine that turns a DTC snack, drink, or CPG storefront into a search-driven revenue channel. Recipe hub of 40 to 100 recipes. Ingredient comparison guides at 12 to 24 pieces. Sourcing story pages at 6 to 12 pieces. Buyer intent content at 8 to 16 pieces. Creator syndication calendar with 12 to 30 creators per quarter. Refresh cadence at 12 to 24 months by pillar. Reporting with organic sessions and organic revenue attribution.
If your DTC food brand is running paid social at 20,000 dollars monthly with a broken blog and zero recipe schema, professional content marketing for food brands pays for itself inside the first 90 days on organic traffic captured. Redefine Web ships content marketing inside our monthly retainer packages. Book a call and we will walk through the last three DTC food brands we built recipe hubs for, pillar by pillar.
Content marketing for food brands starts with a recipe hub because recipe queries account for 40 to 60 percent of high-intent search volume in the food category. Every hero SKU needs 4 to 12 recipes anchored to it, each targeting a specific occasion and audience.
Skip the recipe hub and the brand loses the search real estate that pulls DTC storefront traffic month over month at zero incremental paid cost. Recipe traffic converts at 2 to 4 percent because the shopper landed with usage intent, not passive discovery, which is why food brands win on recipes.
Recipe schema and Google rich result eligibility
Every recipe page ships schema.org Recipe markup including cookTime, prepTime, recipeIngredient, recipeInstructions, nutrition, and aggregateRating. Correctly marked-up recipes qualify for Google’s recipe rich result carousel that pulls 3 to 6 times higher click-through rate than a plain blue link. The schema layer takes 15 minutes per recipe to author and 30 minutes to validate in Google Search Console. Cross-reference the recipe search stack on our food and beverage SEO page.
Recipe hub structure that scales
The recipe hub structure runs 40 to 100 recipes at maturity, organized by hero SKU (4 to 12 recipes per SKU) plus occasion tags (breakfast, weeknight dinner, meal prep, brunch, holiday). Every recipe links back to the hero SKU product page with the SKU embedded in an inline card. The hub earns internal linking value from ingredient comparison guides and the sourcing story pages, which feeds recipe ranking on Google. According to Google Search Central recipe structured data guidance, complete Recipe schema markup is required for eligibility in the recipe carousel and the ingredient search filter.
Pillar structure for food brand content marketing
The pillar structure on content marketing for food brands runs 4 content pillars concurrently: recipe hub (40 to 100 recipes), ingredient comparison guides (12 to 24 guides), sourcing story pages (6 to 12 pages), and buyer intent content (where to buy, subscription vs. one-time, gift bundle guides). Every pillar covers a distinct search intent and every pillar links back to the hero SKU product pages.
Ingredient comparison guide format
Ingredient comparison guides run 1,800 to 3,200 words comparing 2 to 4 ingredient types on 6 to 10 attributes with a comparison table, real-world use case examples, and links to the hero SKU that uses the specific ingredient. Example: organic vs. conventional oats compares nutritional profile, sourcing chain, cost, environmental impact, and taste on a 6-column table. The brand’s SKU appears in the winning column with a product card. These guides rank 3 to 8 months after publication and pull steady-state organic traffic.
Sourcing story pages that build trust
Sourcing story pages name the specific farms, cooperatives, or suppliers the brand sources from, with photos of the farms, farmer quotes, and specific harvest windows. A coffee brand’s Ethiopian farm page ranks for “single-origin Ethiopian coffee” and “Yirgacheffe coffee origin” plus 40 long-tail variations. The sourcing page pulls trust-building traffic that converts at 4 to 6 percent because the shopper landed pattern-matching on transparency and named provenance. Every sourcing page includes farmer or cooperative quotes, harvest dates, and a link back to 3 to 5 hero SKU pages that source from the named supplier.
Vejrø hospitality content case study
Vejrø Resort, a Danish private-island destination with an on-site restaurant focused on organic, locally sourced cuisine, joined us with strong social engagement and no organic-search real estate. Guests found the resort on Instagram but never in Google search for terms like “private island resort Denmark,” “farm-to-table hospitality Denmark,” or “Vejrø restaurant.” The same organic-search gap shows up on DTC food brands running paid social at 20,000 dollars monthly with a broken blog and zero recipe schema.
We built the conversion-focused website with on-site and off-site SEO tuned to the travel-niche keyword clusters, competitor analysis against comparable boutique resorts, and mobile-first design prioritizing guest discovery. Every page carried the structured data qualifying it for Google’s rich results in the hospitality category. Every internal link pushed authority toward the direct-booking conversion path.
Three months later, Vejrø hit 10,000 plus organic visitors, ranked for 200 plus first-page keywords, and pulled a 2.2 percent booking conversion rate from organic traffic. The same pattern applies to content marketing for food brands: recipe schema, ingredient comparison guides, and sourcing story pages pull organic traffic at 20 to 40 percent conversion into hero SKU pages inside 6 months when the content quality matches search intent and every page carries the right structured data markup. Vejrø also proved out the reporting discipline: every monthly report named the exact page, the exact keyword cluster, and the exact search feature (rich result, sitelinks, image pack) driving the incremental organic revenue instead of hiding behind aggregate traffic charts.
Recipe cadence and content calendar for food brands
Recipe cadence on a working food brand content calendar ships 2 to 4 new recipes per week during the first 6 months and drops to 1 per week at maturity. Each recipe takes 4 to 6 hours to produce (write, test in the kitchen, photograph, schema author, publish). At 3 recipes per week, the brand hits 78 recipes inside 6 months plus a backlog of ingredient comparison and sourcing content queued behind the recipe production line.
| Content pillar | Target volume year 1 | Production cost per piece | Refresh cadence |
|---|---|---|---|
| Recipe hub | 40 to 100 recipes | $180 to $320 | Every 12 months |
| Ingredient comparison guides | 12 to 24 guides | $450 to $780 | Every 18 months |
| Sourcing story pages | 6 to 12 pages | $680 to $1,200 | Every 24 months |
| Buyer intent content | 8 to 16 pieces | $220 to $420 | Every 12 months |
Photography as a content calendar constraint
Photography is the actual constraint on recipe cadence, not writing. Every recipe needs 6 to 12 photos: hero shot, ingredient flat lay, prep in progress, plated result, storage, and step shots for the schema markup. A working food brand batches photography 8 recipes at a time to keep the cost per recipe under 200 dollars. Skip the batching and the per-recipe cost climbs to 400 to 600 dollars, which caps recipe cadence at 1 per week and slows organic ranking timeline by 6 months.
Seasonal content calendar planning
Seasonal content calendar planning maps recipes and comparison guides to the seasonal windows they need to rank in. A Christmas cookie recipe needs to publish in September to rank by early December. A Valentine’s chocolate guide needs to publish in November to rank by early February. A back-to-school lunchbox recipe needs to publish in June to rank by late August. The 60-to-90-day ranking curve dictates the calendar.
Creator syndication inside food brand content
Creator syndication on food brand content marketing amplifies the recipe hub through Instagram Reels, TikTok, and YouTube Shorts creators paid to post their own version of the brand’s hero recipes. The creator content pulls net-new audiences into the recipe hub through the creator’s Link in Bio or Amazon Storefront tag. The syndication calendar names 12 to 30 creators per quarter with specific recipes assigned to each.
One brand we picked up had a spreadsheet titled “creator outreach 2023” with 47 rows and 3 responses. All 3 responses were auto-replies. The spreadsheet named zero recipes and offered flat rates below 100 dollars per post. Nobody posts a 30-second video for 87 dollars flat. Nobody.
Creator content commercial terms that work
Working creator content commercial terms run 350 to 1,500 dollars flat per post plus a 12 to 25 percent commission on tagged sales across a 30-day window. The commission mechanic pulls creators into follow-up posts because the incremental revenue continues past the initial fee. Mid-tier creators (30k to 150k followers) hit the sweet spot for food brand content because their engagement rate typically runs 4 to 8 percent versus 0.8 to 1.6 percent on mega-creators.
Content brief structure for creator partnerships
The content brief structure for creator partnerships runs a single page: the SKU, the specific recipe or usage occasion, 3 required brand mentions, 3 restricted claims (no health claims on non-medical SKUs), the pricing angle, the affiliate link, and 3 example videos that hit the tone. The brief avoids over-scripting because over-scripted creator content underperforms native creator voice by 40 to 60 percent on engagement rate.
Buyer intent content for food brand blogs
Buyer intent content on food brand blogs covers 8 to 16 pieces targeting explicit purchase-decision queries: “where to buy [brand],” “[brand] subscription vs. one-time,” “best [category] for [use case],” and “[brand] gift bundle.” Every buyer intent piece runs 1,400 to 2,400 words with a comparison table, product cards, and a clear conversion path to the specific SKU that matches the query intent. Buyer intent content converts at 3 to 6 percent versus 1 to 2 percent on recipe content because the shopper landed already planning to buy, not exploring a usage occasion.
Where-to-buy content structure
Where-to-buy content structure covers online (DTC storefront, Amazon, Target.com, Whole Foods online), retail (specific chain locators with the store finder embedded), and international (customs limitations, retailer partners abroad). Every piece names specific retailers, links to the store locator, and includes an FAQ block covering shipping availability, subscription options, and gift card compatibility. Where-to-buy content ranks for branded discovery queries the DTC storefront otherwise loses to competitor affiliate reviews.
Subscription versus one-time comparison content
Subscription versus one-time comparison content converts subscription commitments at 3 to 6 percent because it addresses the price-sensitivity concern head-on with a specific math table. The piece covers the discount structure (15 percent lifetime), the skip-a-month mechanic, the pause-anytime rule, the cancellation policy, and the specific yearly savings for the brand’s average consumption cadence. Cross-reference the retention structure on our food and beverage marketing retainer page.
Content refresh cadence on food brand pillars
Content refresh cadence on food brand content pillars runs a rolling audit every 12 to 24 months by pillar. Recipes get refreshed every 12 months with new photography, updated schema, and any nutrition or ingredient adjustments. Ingredient comparison guides refresh every 18 months to update market data. Sourcing story pages refresh every 24 months to reflect farm partnership changes and new harvest angles. Buyer intent content refreshes every 12 months to update retailer availability and pricing.
Recipe refresh priority order
Recipe refresh priority runs by organic traffic rank. The top 20 recipes by monthly organic sessions get refreshed first (new photography, schema audit, related recipe internal links, updated nutrition). The next 40 get refreshed at 15 months. The remaining recipes get refreshed opportunistically when the ranking slips past position 15 in Google. Skipping the refresh cadence lets recipe rankings drift out of the top 3 inside 18 months as newer competitor recipes take the position.
Schema audit checklist per refresh
The schema audit checklist per refresh runs 8 items: Recipe schema completeness, aggregateRating count and accuracy, nutrition data accuracy, prepTime and cookTime match the recipe body, image URLs valid at CDN, related recipe internal links working, product card SKU URL live, and Google Search Console rich result eligibility validated. This checklist takes 20 minutes per recipe and prevents the schema drift that costs recipe rankings 20 to 40 positions quietly.
Reporting cadence for food brand content marketing
Reporting cadence on food brand content marketing runs a monthly executive report plus a quarterly business review. The monthly report ships in the first business week and covers organic sessions by pillar, top 10 ranking recipes with position trend, ingredient guide ranking movements, sourcing page performance, and organic-attributed DTC revenue. Every number carries a comparison to the prior month and a plain-language interpretation the founder reads in 7 minutes.
Metrics that matter for content marketing
Metrics that matter for food brand content marketing: organic sessions by pillar, recipe rich result impressions in Search Console, organic conversion rate to hero SKU pages, organic-attributed DTC revenue, and top 20 ranking positions by monthly organic sessions. Vanity metrics that do not matter: total pageviews without conversion context, average time on page without conversion attribution, and social share counts. The monthly report skips the vanity block entirely.
Quarterly business review structure
The quarterly business review runs 90 minutes with the founder, head of content, and SEO lead. Agenda: organic traffic trend by pillar, top 10 winning content pieces, top 10 losing content pieces (candidates for refresh or removal), competitive gap analysis against 5 named competitor brands, and next quarter’s content calendar with recipes and ingredient guides queued. According to Ahrefs content marketing research, brands running quarterly content audits outperform brands running annual audits by 40 to 70 percent on organic revenue over a 24-month window.
Internal linking discipline across food brand content
Internal linking discipline across food brand content moves authority from recipe pages toward hero SKU product pages and comparison guides. Every recipe links to the hero SKU it uses inline (once in the ingredient list, once in a bottom call-out card). Every ingredient comparison guide links to 3 to 6 recipes using the winning ingredient plus the hero SKU product page. Every sourcing story links to the 2 to 4 SKUs sourced from that specific farm or cooperative.
Anchor text strategy across recipe hubs
Anchor text on internal links varies across recipe hubs to avoid over-optimization patterns Google penalizes. Exact-match anchor (“single-origin Ethiopian coffee”) runs on 20 to 30 percent of internal links. Partial-match variations (“our Ethiopian roast”) run on 30 to 40 percent. Branded anchors (the SKU name) run on 20 to 30 percent. Generic anchors (“shop the coffee”) fill the remaining 10 to 20 percent. This ratio holds ranking without triggering the over-optimization penalty that shows up on brands that anchor-text-stuff every internal link with the same exact-match keyword. Cross-reference the linking layer on our food and beverage web design page.
Link equity from ingredient guides to SKU pages
Link equity from ingredient guides passes to SKU pages when the guide’s comparison table names the hero SKU in the winning column with a product card, and when the guide’s body links to 3 to 6 recipes that use the winning ingredient. This 3-hop path (guide to recipe to SKU) pushes authority from a high-traffic informational query down to a high-intent transactional page. According to Search Engine Land SEO coverage, informational content that internally links to transactional pages produces 2 to 4 times higher organic revenue than isolated content silos.
Wrapping up content marketing for food brands
Content marketing for food brands is the organic engine that turns a DTC snack, drink, or CPG storefront into a search-driven revenue channel. Recipe hub of 40 to 100 recipes. Ingredient comparison guides at 12 to 24 pieces. Sourcing story pages at 6 to 12 pieces. Buyer intent content at 8 to 16 pieces. Creator syndication calendar with 12 to 30 creators per quarter. Refresh cadence at 12 to 24 months by pillar. Reporting with organic sessions and organic revenue attribution.
If your DTC food brand is running paid social at 20,000 dollars monthly with a broken blog and zero recipe schema, professional content marketing for food brands pays for itself inside the first 90 days on organic traffic captured. Redefine Web ships content marketing inside our monthly retainer packages. Book a call and we will walk through the last three DTC food brands we built recipe hubs for, pillar by pillar.
Internal linking discipline across food brand content moves authority from recipe pages toward hero SKU product pages and comparison guides. Every recipe links to the hero SKU it uses inline (once in the ingredient list, once in a bottom call-out card). Every ingredient comparison guide links to 3 to 6 recipes using the winning ingredient plus the hero SKU product page. Every sourcing story links to the 2 to 4 SKUs sourced from that specific farm or cooperative.
Anchor text strategy across recipe hubs
Anchor text on internal links varies across recipe hubs to avoid over-optimization patterns Google penalizes. Exact-match anchor (“single-origin Ethiopian coffee”) runs on 20 to 30 percent of internal links. Partial-match variations (“our Ethiopian roast”) run on 30 to 40 percent. Branded anchors (the SKU name) run on 20 to 30 percent. Generic anchors (“shop the coffee”) fill the remaining 10 to 20 percent. This ratio holds ranking without triggering the over-optimization penalty that shows up on brands that anchor-text-stuff every internal link with the same exact-match keyword. Cross-reference the linking layer on our food and beverage web design page.
Link equity from ingredient guides to SKU pages
Link equity from ingredient guides passes to SKU pages when the guide’s comparison table names the hero SKU in the winning column with a product card, and when the guide’s body links to 3 to 6 recipes that use the winning ingredient. This 3-hop path (guide to recipe to SKU) pushes authority from a high-traffic informational query down to a high-intent transactional page. According to Search Engine Land SEO coverage, informational content that internally links to transactional pages produces 2 to 4 times higher organic revenue than isolated content silos.
Wrapping up content marketing for food brands
Content marketing for food brands is the organic engine that turns a DTC snack, drink, or CPG storefront into a search-driven revenue channel. Recipe hub of 40 to 100 recipes. Ingredient comparison guides at 12 to 24 pieces. Sourcing story pages at 6 to 12 pieces. Buyer intent content at 8 to 16 pieces. Creator syndication calendar with 12 to 30 creators per quarter. Refresh cadence at 12 to 24 months by pillar. Reporting with organic sessions and organic revenue attribution.
If your DTC food brand is running paid social at 20,000 dollars monthly with a broken blog and zero recipe schema, professional content marketing for food brands pays for itself inside the first 90 days on organic traffic captured. Redefine Web ships content marketing inside our monthly retainer packages. Book a call and we will walk through the last three DTC food brands we built recipe hubs for, pillar by pillar.
Internal linking discipline across food brand content moves authority from recipe pages toward hero SKU product pages and comparison guides. Every recipe links to the hero SKU it uses inline (once in the ingredient list, once in a bottom call-out card). Every ingredient comparison guide links to 3 to 6 recipes using the winning ingredient plus the hero SKU product page. Every sourcing story links to the 2 to 4 SKUs sourced from that specific farm or cooperative.
Anchor text strategy across recipe hubs
Anchor text on internal links varies across recipe hubs to avoid over-optimization patterns Google penalizes. Exact-match anchor (“single-origin Ethiopian coffee”) runs on 20 to 30 percent of internal links. Partial-match variations (“our Ethiopian roast”) run on 30 to 40 percent. Branded anchors (the SKU name) run on 20 to 30 percent. Generic anchors (“shop the coffee”) fill the remaining 10 to 20 percent. This ratio holds ranking without triggering the over-optimization penalty that shows up on brands that anchor-text-stuff every internal link with the same exact-match keyword. Cross-reference the linking layer on our food and beverage web design page.
Link equity from ingredient guides to SKU pages
Link equity from ingredient guides passes to SKU pages when the guide’s comparison table names the hero SKU in the winning column with a product card, and when the guide’s body links to 3 to 6 recipes that use the winning ingredient. This 3-hop path (guide to recipe to SKU) pushes authority from a high-traffic informational query down to a high-intent transactional page. According to Search Engine Land SEO coverage, informational content that internally links to transactional pages produces 2 to 4 times higher organic revenue than isolated content silos.
Wrapping up content marketing for food brands
Content marketing for food brands is the organic engine that turns a DTC snack, drink, or CPG storefront into a search-driven revenue channel. Recipe hub of 40 to 100 recipes. Ingredient comparison guides at 12 to 24 pieces. Sourcing story pages at 6 to 12 pieces. Buyer intent content at 8 to 16 pieces. Creator syndication calendar with 12 to 30 creators per quarter. Refresh cadence at 12 to 24 months by pillar. Reporting with organic sessions and organic revenue attribution.
If your DTC food brand is running paid social at 20,000 dollars monthly with a broken blog and zero recipe schema, professional content marketing for food brands pays for itself inside the first 90 days on organic traffic captured. Redefine Web ships content marketing inside our monthly retainer packages. Book a call and we will walk through the last three DTC food brands we built recipe hubs for, pillar by pillar.
Content marketing for food brands starts with a recipe hub because recipe queries account for 40 to 60 percent of high-intent search volume in the food category. Every hero SKU needs 4 to 12 recipes anchored to it, each targeting a specific occasion and audience.
Skip the recipe hub and the brand loses the search real estate that pulls DTC storefront traffic month over month at zero incremental paid cost. Recipe traffic converts at 2 to 4 percent because the shopper landed with usage intent, not passive discovery, which is why food brands win on recipes.
Recipe schema and Google rich result eligibility
Every recipe page ships schema.org Recipe markup including cookTime, prepTime, recipeIngredient, recipeInstructions, nutrition, and aggregateRating. Correctly marked-up recipes qualify for Google’s recipe rich result carousel that pulls 3 to 6 times higher click-through rate than a plain blue link. The schema layer takes 15 minutes per recipe to author and 30 minutes to validate in Google Search Console. Cross-reference the recipe search stack on our food and beverage SEO page.
Recipe hub structure that scales
The recipe hub structure runs 40 to 100 recipes at maturity, organized by hero SKU (4 to 12 recipes per SKU) plus occasion tags (breakfast, weeknight dinner, meal prep, brunch, holiday). Every recipe links back to the hero SKU product page with the SKU embedded in an inline card. The hub earns internal linking value from ingredient comparison guides and the sourcing story pages, which feeds recipe ranking on Google. According to Google Search Central recipe structured data guidance, complete Recipe schema markup is required for eligibility in the recipe carousel and the ingredient search filter.
Pillar structure for food brand content marketing
The pillar structure on content marketing for food brands runs 4 content pillars concurrently: recipe hub (40 to 100 recipes), ingredient comparison guides (12 to 24 guides), sourcing story pages (6 to 12 pages), and buyer intent content (where to buy, subscription vs. one-time, gift bundle guides). Every pillar covers a distinct search intent and every pillar links back to the hero SKU product pages.
Ingredient comparison guide format
Ingredient comparison guides run 1,800 to 3,200 words comparing 2 to 4 ingredient types on 6 to 10 attributes with a comparison table, real-world use case examples, and links to the hero SKU that uses the specific ingredient. Example: organic vs. conventional oats compares nutritional profile, sourcing chain, cost, environmental impact, and taste on a 6-column table. The brand’s SKU appears in the winning column with a product card. These guides rank 3 to 8 months after publication and pull steady-state organic traffic.
Sourcing story pages that build trust
Sourcing story pages name the specific farms, cooperatives, or suppliers the brand sources from, with photos of the farms, farmer quotes, and specific harvest windows. A coffee brand’s Ethiopian farm page ranks for “single-origin Ethiopian coffee” and “Yirgacheffe coffee origin” plus 40 long-tail variations. The sourcing page pulls trust-building traffic that converts at 4 to 6 percent because the shopper landed pattern-matching on transparency and named provenance. Every sourcing page includes farmer or cooperative quotes, harvest dates, and a link back to 3 to 5 hero SKU pages that source from the named supplier.
Vejrø hospitality content case study
Vejrø Resort, a Danish private-island destination with an on-site restaurant focused on organic, locally sourced cuisine, joined us with strong social engagement and no organic-search real estate. Guests found the resort on Instagram but never in Google search for terms like “private island resort Denmark,” “farm-to-table hospitality Denmark,” or “Vejrø restaurant.” The same organic-search gap shows up on DTC food brands running paid social at 20,000 dollars monthly with a broken blog and zero recipe schema.
We built the conversion-focused website with on-site and off-site SEO tuned to the travel-niche keyword clusters, competitor analysis against comparable boutique resorts, and mobile-first design prioritizing guest discovery. Every page carried the structured data qualifying it for Google’s rich results in the hospitality category. Every internal link pushed authority toward the direct-booking conversion path.
Three months later, Vejrø hit 10,000 plus organic visitors, ranked for 200 plus first-page keywords, and pulled a 2.2 percent booking conversion rate from organic traffic. The same pattern applies to content marketing for food brands: recipe schema, ingredient comparison guides, and sourcing story pages pull organic traffic at 20 to 40 percent conversion into hero SKU pages inside 6 months when the content quality matches search intent and every page carries the right structured data markup. Vejrø also proved out the reporting discipline: every monthly report named the exact page, the exact keyword cluster, and the exact search feature (rich result, sitelinks, image pack) driving the incremental organic revenue instead of hiding behind aggregate traffic charts.
Recipe cadence and content calendar for food brands
Recipe cadence on a working food brand content calendar ships 2 to 4 new recipes per week during the first 6 months and drops to 1 per week at maturity. Each recipe takes 4 to 6 hours to produce (write, test in the kitchen, photograph, schema author, publish). At 3 recipes per week, the brand hits 78 recipes inside 6 months plus a backlog of ingredient comparison and sourcing content queued behind the recipe production line.
| Content pillar | Target volume year 1 | Production cost per piece | Refresh cadence |
|---|---|---|---|
| Recipe hub | 40 to 100 recipes | $180 to $320 | Every 12 months |
| Ingredient comparison guides | 12 to 24 guides | $450 to $780 | Every 18 months |
| Sourcing story pages | 6 to 12 pages | $680 to $1,200 | Every 24 months |
| Buyer intent content | 8 to 16 pieces | $220 to $420 | Every 12 months |
Photography as a content calendar constraint
Photography is the actual constraint on recipe cadence, not writing. Every recipe needs 6 to 12 photos: hero shot, ingredient flat lay, prep in progress, plated result, storage, and step shots for the schema markup. A working food brand batches photography 8 recipes at a time to keep the cost per recipe under 200 dollars. Skip the batching and the per-recipe cost climbs to 400 to 600 dollars, which caps recipe cadence at 1 per week and slows organic ranking timeline by 6 months.
Seasonal content calendar planning
Seasonal content calendar planning maps recipes and comparison guides to the seasonal windows they need to rank in. A Christmas cookie recipe needs to publish in September to rank by early December. A Valentine’s chocolate guide needs to publish in November to rank by early February. A back-to-school lunchbox recipe needs to publish in June to rank by late August. The 60-to-90-day ranking curve dictates the calendar.
Creator syndication inside food brand content
Creator syndication on food brand content marketing amplifies the recipe hub through Instagram Reels, TikTok, and YouTube Shorts creators paid to post their own version of the brand’s hero recipes. The creator content pulls net-new audiences into the recipe hub through the creator’s Link in Bio or Amazon Storefront tag. The syndication calendar names 12 to 30 creators per quarter with specific recipes assigned to each.
One brand we picked up had a spreadsheet titled “creator outreach 2023” with 47 rows and 3 responses. All 3 responses were auto-replies. The spreadsheet named zero recipes and offered flat rates below 100 dollars per post. Nobody posts a 30-second video for 87 dollars flat. Nobody.
Creator content commercial terms that work
Working creator content commercial terms run 350 to 1,500 dollars flat per post plus a 12 to 25 percent commission on tagged sales across a 30-day window. The commission mechanic pulls creators into follow-up posts because the incremental revenue continues past the initial fee. Mid-tier creators (30k to 150k followers) hit the sweet spot for food brand content because their engagement rate typically runs 4 to 8 percent versus 0.8 to 1.6 percent on mega-creators.
Content brief structure for creator partnerships
The content brief structure for creator partnerships runs a single page: the SKU, the specific recipe or usage occasion, 3 required brand mentions, 3 restricted claims (no health claims on non-medical SKUs), the pricing angle, the affiliate link, and 3 example videos that hit the tone. The brief avoids over-scripting because over-scripted creator content underperforms native creator voice by 40 to 60 percent on engagement rate.
Buyer intent content for food brand blogs
Buyer intent content on food brand blogs covers 8 to 16 pieces targeting explicit purchase-decision queries: “where to buy [brand],” “[brand] subscription vs. one-time,” “best [category] for [use case],” and “[brand] gift bundle.” Every buyer intent piece runs 1,400 to 2,400 words with a comparison table, product cards, and a clear conversion path to the specific SKU that matches the query intent. Buyer intent content converts at 3 to 6 percent versus 1 to 2 percent on recipe content because the shopper landed already planning to buy, not exploring a usage occasion.
Where-to-buy content structure
Where-to-buy content structure covers online (DTC storefront, Amazon, Target.com, Whole Foods online), retail (specific chain locators with the store finder embedded), and international (customs limitations, retailer partners abroad). Every piece names specific retailers, links to the store locator, and includes an FAQ block covering shipping availability, subscription options, and gift card compatibility. Where-to-buy content ranks for branded discovery queries the DTC storefront otherwise loses to competitor affiliate reviews.
Subscription versus one-time comparison content
Subscription versus one-time comparison content converts subscription commitments at 3 to 6 percent because it addresses the price-sensitivity concern head-on with a specific math table. The piece covers the discount structure (15 percent lifetime), the skip-a-month mechanic, the pause-anytime rule, the cancellation policy, and the specific yearly savings for the brand’s average consumption cadence. Cross-reference the retention structure on our food and beverage marketing retainer page.
Content refresh cadence on food brand pillars
Content refresh cadence on food brand content pillars runs a rolling audit every 12 to 24 months by pillar. Recipes get refreshed every 12 months with new photography, updated schema, and any nutrition or ingredient adjustments. Ingredient comparison guides refresh every 18 months to update market data. Sourcing story pages refresh every 24 months to reflect farm partnership changes and new harvest angles. Buyer intent content refreshes every 12 months to update retailer availability and pricing.
Recipe refresh priority order
Recipe refresh priority runs by organic traffic rank. The top 20 recipes by monthly organic sessions get refreshed first (new photography, schema audit, related recipe internal links, updated nutrition). The next 40 get refreshed at 15 months. The remaining recipes get refreshed opportunistically when the ranking slips past position 15 in Google. Skipping the refresh cadence lets recipe rankings drift out of the top 3 inside 18 months as newer competitor recipes take the position.
Schema audit checklist per refresh
The schema audit checklist per refresh runs 8 items: Recipe schema completeness, aggregateRating count and accuracy, nutrition data accuracy, prepTime and cookTime match the recipe body, image URLs valid at CDN, related recipe internal links working, product card SKU URL live, and Google Search Console rich result eligibility validated. This checklist takes 20 minutes per recipe and prevents the schema drift that costs recipe rankings 20 to 40 positions quietly.
Reporting cadence for food brand content marketing
Reporting cadence on food brand content marketing runs a monthly executive report plus a quarterly business review. The monthly report ships in the first business week and covers organic sessions by pillar, top 10 ranking recipes with position trend, ingredient guide ranking movements, sourcing page performance, and organic-attributed DTC revenue. Every number carries a comparison to the prior month and a plain-language interpretation the founder reads in 7 minutes.
Metrics that matter for content marketing
Metrics that matter for food brand content marketing: organic sessions by pillar, recipe rich result impressions in Search Console, organic conversion rate to hero SKU pages, organic-attributed DTC revenue, and top 20 ranking positions by monthly organic sessions. Vanity metrics that do not matter: total pageviews without conversion context, average time on page without conversion attribution, and social share counts. The monthly report skips the vanity block entirely.
Quarterly business review structure
The quarterly business review runs 90 minutes with the founder, head of content, and SEO lead. Agenda: organic traffic trend by pillar, top 10 winning content pieces, top 10 losing content pieces (candidates for refresh or removal), competitive gap analysis against 5 named competitor brands, and next quarter’s content calendar with recipes and ingredient guides queued. According to Ahrefs content marketing research, brands running quarterly content audits outperform brands running annual audits by 40 to 70 percent on organic revenue over a 24-month window.
Internal linking discipline across food brand content
Internal linking discipline across food brand content moves authority from recipe pages toward hero SKU product pages and comparison guides. Every recipe links to the hero SKU it uses inline (once in the ingredient list, once in a bottom call-out card). Every ingredient comparison guide links to 3 to 6 recipes using the winning ingredient plus the hero SKU product page. Every sourcing story links to the 2 to 4 SKUs sourced from that specific farm or cooperative.
Anchor text strategy across recipe hubs
Anchor text on internal links varies across recipe hubs to avoid over-optimization patterns Google penalizes. Exact-match anchor (“single-origin Ethiopian coffee”) runs on 20 to 30 percent of internal links. Partial-match variations (“our Ethiopian roast”) run on 30 to 40 percent. Branded anchors (the SKU name) run on 20 to 30 percent. Generic anchors (“shop the coffee”) fill the remaining 10 to 20 percent. This ratio holds ranking without triggering the over-optimization penalty that shows up on brands that anchor-text-stuff every internal link with the same exact-match keyword. Cross-reference the linking layer on our food and beverage web design page.
Link equity from ingredient guides to SKU pages
Link equity from ingredient guides passes to SKU pages when the guide’s comparison table names the hero SKU in the winning column with a product card, and when the guide’s body links to 3 to 6 recipes that use the winning ingredient. This 3-hop path (guide to recipe to SKU) pushes authority from a high-traffic informational query down to a high-intent transactional page. According to Search Engine Land SEO coverage, informational content that internally links to transactional pages produces 2 to 4 times higher organic revenue than isolated content silos.
Wrapping up content marketing for food brands
Content marketing for food brands is the organic engine that turns a DTC snack, drink, or CPG storefront into a search-driven revenue channel. Recipe hub of 40 to 100 recipes. Ingredient comparison guides at 12 to 24 pieces. Sourcing story pages at 6 to 12 pieces. Buyer intent content at 8 to 16 pieces. Creator syndication calendar with 12 to 30 creators per quarter. Refresh cadence at 12 to 24 months by pillar. Reporting with organic sessions and organic revenue attribution.
If your DTC food brand is running paid social at 20,000 dollars monthly with a broken blog and zero recipe schema, professional content marketing for food brands pays for itself inside the first 90 days on organic traffic captured. Redefine Web ships content marketing inside our monthly retainer packages. Book a call and we will walk through the last three DTC food brands we built recipe hubs for, pillar by pillar.
Content marketing for food brands starts with a recipe hub because recipe queries account for 40 to 60 percent of high-intent search volume in the food category. Every hero SKU needs 4 to 12 recipes anchored to it, each targeting a specific occasion and audience.
Skip the recipe hub and the brand loses the search real estate that pulls DTC storefront traffic month over month at zero incremental paid cost. Recipe traffic converts at 2 to 4 percent because the shopper landed with usage intent, not passive discovery, which is why food brands win on recipes.
Recipe schema and Google rich result eligibility
Every recipe page ships schema.org Recipe markup including cookTime, prepTime, recipeIngredient, recipeInstructions, nutrition, and aggregateRating. Correctly marked-up recipes qualify for Google’s recipe rich result carousel that pulls 3 to 6 times higher click-through rate than a plain blue link. The schema layer takes 15 minutes per recipe to author and 30 minutes to validate in Google Search Console. Cross-reference the recipe search stack on our food and beverage SEO page.
Recipe hub structure that scales
The recipe hub structure runs 40 to 100 recipes at maturity, organized by hero SKU (4 to 12 recipes per SKU) plus occasion tags (breakfast, weeknight dinner, meal prep, brunch, holiday). Every recipe links back to the hero SKU product page with the SKU embedded in an inline card. The hub earns internal linking value from ingredient comparison guides and the sourcing story pages, which feeds recipe ranking on Google. According to Google Search Central recipe structured data guidance, complete Recipe schema markup is required for eligibility in the recipe carousel and the ingredient search filter.
Pillar structure for food brand content marketing
The pillar structure on content marketing for food brands runs 4 content pillars concurrently: recipe hub (40 to 100 recipes), ingredient comparison guides (12 to 24 guides), sourcing story pages (6 to 12 pages), and buyer intent content (where to buy, subscription vs. one-time, gift bundle guides). Every pillar covers a distinct search intent and every pillar links back to the hero SKU product pages.
Ingredient comparison guide format
Ingredient comparison guides run 1,800 to 3,200 words comparing 2 to 4 ingredient types on 6 to 10 attributes with a comparison table, real-world use case examples, and links to the hero SKU that uses the specific ingredient. Example: organic vs. conventional oats compares nutritional profile, sourcing chain, cost, environmental impact, and taste on a 6-column table. The brand’s SKU appears in the winning column with a product card. These guides rank 3 to 8 months after publication and pull steady-state organic traffic.
Sourcing story pages that build trust
Sourcing story pages name the specific farms, cooperatives, or suppliers the brand sources from, with photos of the farms, farmer quotes, and specific harvest windows. A coffee brand’s Ethiopian farm page ranks for “single-origin Ethiopian coffee” and “Yirgacheffe coffee origin” plus 40 long-tail variations. The sourcing page pulls trust-building traffic that converts at 4 to 6 percent because the shopper landed pattern-matching on transparency and named provenance. Every sourcing page includes farmer or cooperative quotes, harvest dates, and a link back to 3 to 5 hero SKU pages that source from the named supplier.
Vejrø hospitality content case study
Vejrø Resort, a Danish private-island destination with an on-site restaurant focused on organic, locally sourced cuisine, joined us with strong social engagement and no organic-search real estate. Guests found the resort on Instagram but never in Google search for terms like “private island resort Denmark,” “farm-to-table hospitality Denmark,” or “Vejrø restaurant.” The same organic-search gap shows up on DTC food brands running paid social at 20,000 dollars monthly with a broken blog and zero recipe schema.
We built the conversion-focused website with on-site and off-site SEO tuned to the travel-niche keyword clusters, competitor analysis against comparable boutique resorts, and mobile-first design prioritizing guest discovery. Every page carried the structured data qualifying it for Google’s rich results in the hospitality category. Every internal link pushed authority toward the direct-booking conversion path.
Three months later, Vejrø hit 10,000 plus organic visitors, ranked for 200 plus first-page keywords, and pulled a 2.2 percent booking conversion rate from organic traffic. The same pattern applies to content marketing for food brands: recipe schema, ingredient comparison guides, and sourcing story pages pull organic traffic at 20 to 40 percent conversion into hero SKU pages inside 6 months when the content quality matches search intent and every page carries the right structured data markup. Vejrø also proved out the reporting discipline: every monthly report named the exact page, the exact keyword cluster, and the exact search feature (rich result, sitelinks, image pack) driving the incremental organic revenue instead of hiding behind aggregate traffic charts.
Recipe cadence and content calendar for food brands
Recipe cadence on a working food brand content calendar ships 2 to 4 new recipes per week during the first 6 months and drops to 1 per week at maturity. Each recipe takes 4 to 6 hours to produce (write, test in the kitchen, photograph, schema author, publish). At 3 recipes per week, the brand hits 78 recipes inside 6 months plus a backlog of ingredient comparison and sourcing content queued behind the recipe production line.
| Content pillar | Target volume year 1 | Production cost per piece | Refresh cadence |
|---|---|---|---|
| Recipe hub | 40 to 100 recipes | $180 to $320 | Every 12 months |
| Ingredient comparison guides | 12 to 24 guides | $450 to $780 | Every 18 months |
| Sourcing story pages | 6 to 12 pages | $680 to $1,200 | Every 24 months |
| Buyer intent content | 8 to 16 pieces | $220 to $420 | Every 12 months |
Photography as a content calendar constraint
Photography is the actual constraint on recipe cadence, not writing. Every recipe needs 6 to 12 photos: hero shot, ingredient flat lay, prep in progress, plated result, storage, and step shots for the schema markup. A working food brand batches photography 8 recipes at a time to keep the cost per recipe under 200 dollars. Skip the batching and the per-recipe cost climbs to 400 to 600 dollars, which caps recipe cadence at 1 per week and slows organic ranking timeline by 6 months.
Seasonal content calendar planning
Seasonal content calendar planning maps recipes and comparison guides to the seasonal windows they need to rank in. A Christmas cookie recipe needs to publish in September to rank by early December. A Valentine’s chocolate guide needs to publish in November to rank by early February. A back-to-school lunchbox recipe needs to publish in June to rank by late August. The 60-to-90-day ranking curve dictates the calendar.
Creator syndication inside food brand content
Creator syndication on food brand content marketing amplifies the recipe hub through Instagram Reels, TikTok, and YouTube Shorts creators paid to post their own version of the brand’s hero recipes. The creator content pulls net-new audiences into the recipe hub through the creator’s Link in Bio or Amazon Storefront tag. The syndication calendar names 12 to 30 creators per quarter with specific recipes assigned to each.
One brand we picked up had a spreadsheet titled “creator outreach 2023” with 47 rows and 3 responses. All 3 responses were auto-replies. The spreadsheet named zero recipes and offered flat rates below 100 dollars per post. Nobody posts a 30-second video for 87 dollars flat. Nobody.
Creator content commercial terms that work
Working creator content commercial terms run 350 to 1,500 dollars flat per post plus a 12 to 25 percent commission on tagged sales across a 30-day window. The commission mechanic pulls creators into follow-up posts because the incremental revenue continues past the initial fee. Mid-tier creators (30k to 150k followers) hit the sweet spot for food brand content because their engagement rate typically runs 4 to 8 percent versus 0.8 to 1.6 percent on mega-creators.
Content brief structure for creator partnerships
The content brief structure for creator partnerships runs a single page: the SKU, the specific recipe or usage occasion, 3 required brand mentions, 3 restricted claims (no health claims on non-medical SKUs), the pricing angle, the affiliate link, and 3 example videos that hit the tone. The brief avoids over-scripting because over-scripted creator content underperforms native creator voice by 40 to 60 percent on engagement rate.
Buyer intent content for food brand blogs
Buyer intent content on food brand blogs covers 8 to 16 pieces targeting explicit purchase-decision queries: “where to buy [brand],” “[brand] subscription vs. one-time,” “best [category] for [use case],” and “[brand] gift bundle.” Every buyer intent piece runs 1,400 to 2,400 words with a comparison table, product cards, and a clear conversion path to the specific SKU that matches the query intent. Buyer intent content converts at 3 to 6 percent versus 1 to 2 percent on recipe content because the shopper landed already planning to buy, not exploring a usage occasion.
Where-to-buy content structure
Where-to-buy content structure covers online (DTC storefront, Amazon, Target.com, Whole Foods online), retail (specific chain locators with the store finder embedded), and international (customs limitations, retailer partners abroad). Every piece names specific retailers, links to the store locator, and includes an FAQ block covering shipping availability, subscription options, and gift card compatibility. Where-to-buy content ranks for branded discovery queries the DTC storefront otherwise loses to competitor affiliate reviews.
Subscription versus one-time comparison content
Subscription versus one-time comparison content converts subscription commitments at 3 to 6 percent because it addresses the price-sensitivity concern head-on with a specific math table. The piece covers the discount structure (15 percent lifetime), the skip-a-month mechanic, the pause-anytime rule, the cancellation policy, and the specific yearly savings for the brand’s average consumption cadence. Cross-reference the retention structure on our food and beverage marketing retainer page.
Content refresh cadence on food brand pillars
Content refresh cadence on food brand content pillars runs a rolling audit every 12 to 24 months by pillar. Recipes get refreshed every 12 months with new photography, updated schema, and any nutrition or ingredient adjustments. Ingredient comparison guides refresh every 18 months to update market data. Sourcing story pages refresh every 24 months to reflect farm partnership changes and new harvest angles. Buyer intent content refreshes every 12 months to update retailer availability and pricing.
Recipe refresh priority order
Recipe refresh priority runs by organic traffic rank. The top 20 recipes by monthly organic sessions get refreshed first (new photography, schema audit, related recipe internal links, updated nutrition). The next 40 get refreshed at 15 months. The remaining recipes get refreshed opportunistically when the ranking slips past position 15 in Google. Skipping the refresh cadence lets recipe rankings drift out of the top 3 inside 18 months as newer competitor recipes take the position.
Schema audit checklist per refresh
The schema audit checklist per refresh runs 8 items: Recipe schema completeness, aggregateRating count and accuracy, nutrition data accuracy, prepTime and cookTime match the recipe body, image URLs valid at CDN, related recipe internal links working, product card SKU URL live, and Google Search Console rich result eligibility validated. This checklist takes 20 minutes per recipe and prevents the schema drift that costs recipe rankings 20 to 40 positions quietly.
Reporting cadence for food brand content marketing
Reporting cadence on food brand content marketing runs a monthly executive report plus a quarterly business review. The monthly report ships in the first business week and covers organic sessions by pillar, top 10 ranking recipes with position trend, ingredient guide ranking movements, sourcing page performance, and organic-attributed DTC revenue. Every number carries a comparison to the prior month and a plain-language interpretation the founder reads in 7 minutes.
Metrics that matter for content marketing
Metrics that matter for food brand content marketing: organic sessions by pillar, recipe rich result impressions in Search Console, organic conversion rate to hero SKU pages, organic-attributed DTC revenue, and top 20 ranking positions by monthly organic sessions. Vanity metrics that do not matter: total pageviews without conversion context, average time on page without conversion attribution, and social share counts. The monthly report skips the vanity block entirely.
Quarterly business review structure
The quarterly business review runs 90 minutes with the founder, head of content, and SEO lead. Agenda: organic traffic trend by pillar, top 10 winning content pieces, top 10 losing content pieces (candidates for refresh or removal), competitive gap analysis against 5 named competitor brands, and next quarter’s content calendar with recipes and ingredient guides queued. According to Ahrefs content marketing research, brands running quarterly content audits outperform brands running annual audits by 40 to 70 percent on organic revenue over a 24-month window.
Internal linking discipline across food brand content
Internal linking discipline across food brand content moves authority from recipe pages toward hero SKU product pages and comparison guides. Every recipe links to the hero SKU it uses inline (once in the ingredient list, once in a bottom call-out card). Every ingredient comparison guide links to 3 to 6 recipes using the winning ingredient plus the hero SKU product page. Every sourcing story links to the 2 to 4 SKUs sourced from that specific farm or cooperative.
Anchor text strategy across recipe hubs
Anchor text on internal links varies across recipe hubs to avoid over-optimization patterns Google penalizes. Exact-match anchor (“single-origin Ethiopian coffee”) runs on 20 to 30 percent of internal links. Partial-match variations (“our Ethiopian roast”) run on 30 to 40 percent. Branded anchors (the SKU name) run on 20 to 30 percent. Generic anchors (“shop the coffee”) fill the remaining 10 to 20 percent. This ratio holds ranking without triggering the over-optimization penalty that shows up on brands that anchor-text-stuff every internal link with the same exact-match keyword. Cross-reference the linking layer on our food and beverage web design page.
Link equity from ingredient guides to SKU pages
Link equity from ingredient guides passes to SKU pages when the guide’s comparison table names the hero SKU in the winning column with a product card, and when the guide’s body links to 3 to 6 recipes that use the winning ingredient. This 3-hop path (guide to recipe to SKU) pushes authority from a high-traffic informational query down to a high-intent transactional page. According to Search Engine Land SEO coverage, informational content that internally links to transactional pages produces 2 to 4 times higher organic revenue than isolated content silos.
Wrapping up content marketing for food brands
Content marketing for food brands is the organic engine that turns a DTC snack, drink, or CPG storefront into a search-driven revenue channel. Recipe hub of 40 to 100 recipes. Ingredient comparison guides at 12 to 24 pieces. Sourcing story pages at 6 to 12 pieces. Buyer intent content at 8 to 16 pieces. Creator syndication calendar with 12 to 30 creators per quarter. Refresh cadence at 12 to 24 months by pillar. Reporting with organic sessions and organic revenue attribution.
If your DTC food brand is running paid social at 20,000 dollars monthly with a broken blog and zero recipe schema, professional content marketing for food brands pays for itself inside the first 90 days on organic traffic captured. Redefine Web ships content marketing inside our monthly retainer packages. Book a call and we will walk through the last three DTC food brands we built recipe hubs for, pillar by pillar.
Content marketing for food brands starts with a recipe hub because recipe queries account for 40 to 60 percent of high-intent search volume in the food category. Every hero SKU needs 4 to 12 recipes anchored to it, each targeting a specific occasion and audience.
Skip the recipe hub and the brand loses the search real estate that pulls DTC storefront traffic month over month at zero incremental paid cost. Recipe traffic converts at 2 to 4 percent because the shopper landed with usage intent, not passive discovery, which is why food brands win on recipes.
Recipe schema and Google rich result eligibility
Every recipe page ships schema.org Recipe markup including cookTime, prepTime, recipeIngredient, recipeInstructions, nutrition, and aggregateRating. Correctly marked-up recipes qualify for Google’s recipe rich result carousel that pulls 3 to 6 times higher click-through rate than a plain blue link. The schema layer takes 15 minutes per recipe to author and 30 minutes to validate in Google Search Console. Cross-reference the recipe search stack on our food and beverage SEO page.
Recipe hub structure that scales
The recipe hub structure runs 40 to 100 recipes at maturity, organized by hero SKU (4 to 12 recipes per SKU) plus occasion tags (breakfast, weeknight dinner, meal prep, brunch, holiday). Every recipe links back to the hero SKU product page with the SKU embedded in an inline card. The hub earns internal linking value from ingredient comparison guides and the sourcing story pages, which feeds recipe ranking on Google. According to Google Search Central recipe structured data guidance, complete Recipe schema markup is required for eligibility in the recipe carousel and the ingredient search filter.
Pillar structure for food brand content marketing
The pillar structure on content marketing for food brands runs 4 content pillars concurrently: recipe hub (40 to 100 recipes), ingredient comparison guides (12 to 24 guides), sourcing story pages (6 to 12 pages), and buyer intent content (where to buy, subscription vs. one-time, gift bundle guides). Every pillar covers a distinct search intent and every pillar links back to the hero SKU product pages.
Ingredient comparison guide format
Ingredient comparison guides run 1,800 to 3,200 words comparing 2 to 4 ingredient types on 6 to 10 attributes with a comparison table, real-world use case examples, and links to the hero SKU that uses the specific ingredient. Example: organic vs. conventional oats compares nutritional profile, sourcing chain, cost, environmental impact, and taste on a 6-column table. The brand’s SKU appears in the winning column with a product card. These guides rank 3 to 8 months after publication and pull steady-state organic traffic.
Sourcing story pages that build trust
Sourcing story pages name the specific farms, cooperatives, or suppliers the brand sources from, with photos of the farms, farmer quotes, and specific harvest windows. A coffee brand’s Ethiopian farm page ranks for “single-origin Ethiopian coffee” and “Yirgacheffe coffee origin” plus 40 long-tail variations. The sourcing page pulls trust-building traffic that converts at 4 to 6 percent because the shopper landed pattern-matching on transparency and named provenance. Every sourcing page includes farmer or cooperative quotes, harvest dates, and a link back to 3 to 5 hero SKU pages that source from the named supplier.
Vejrø hospitality content case study
Vejrø Resort, a Danish private-island destination with an on-site restaurant focused on organic, locally sourced cuisine, joined us with strong social engagement and no organic-search real estate. Guests found the resort on Instagram but never in Google search for terms like “private island resort Denmark,” “farm-to-table hospitality Denmark,” or “Vejrø restaurant.” The same organic-search gap shows up on DTC food brands running paid social at 20,000 dollars monthly with a broken blog and zero recipe schema.
We built the conversion-focused website with on-site and off-site SEO tuned to the travel-niche keyword clusters, competitor analysis against comparable boutique resorts, and mobile-first design prioritizing guest discovery. Every page carried the structured data qualifying it for Google’s rich results in the hospitality category. Every internal link pushed authority toward the direct-booking conversion path.
Three months later, Vejrø hit 10,000 plus organic visitors, ranked for 200 plus first-page keywords, and pulled a 2.2 percent booking conversion rate from organic traffic. The same pattern applies to content marketing for food brands: recipe schema, ingredient comparison guides, and sourcing story pages pull organic traffic at 20 to 40 percent conversion into hero SKU pages inside 6 months when the content quality matches search intent and every page carries the right structured data markup. Vejrø also proved out the reporting discipline: every monthly report named the exact page, the exact keyword cluster, and the exact search feature (rich result, sitelinks, image pack) driving the incremental organic revenue instead of hiding behind aggregate traffic charts.
Recipe cadence and content calendar for food brands
Recipe cadence on a working food brand content calendar ships 2 to 4 new recipes per week during the first 6 months and drops to 1 per week at maturity. Each recipe takes 4 to 6 hours to produce (write, test in the kitchen, photograph, schema author, publish). At 3 recipes per week, the brand hits 78 recipes inside 6 months plus a backlog of ingredient comparison and sourcing content queued behind the recipe production line.
| Content pillar | Target volume year 1 | Production cost per piece | Refresh cadence |
|---|---|---|---|
| Recipe hub | 40 to 100 recipes | $180 to $320 | Every 12 months |
| Ingredient comparison guides | 12 to 24 guides | $450 to $780 | Every 18 months |
| Sourcing story pages | 6 to 12 pages | $680 to $1,200 | Every 24 months |
| Buyer intent content | 8 to 16 pieces | $220 to $420 | Every 12 months |
Photography as a content calendar constraint
Photography is the actual constraint on recipe cadence, not writing. Every recipe needs 6 to 12 photos: hero shot, ingredient flat lay, prep in progress, plated result, storage, and step shots for the schema markup. A working food brand batches photography 8 recipes at a time to keep the cost per recipe under 200 dollars. Skip the batching and the per-recipe cost climbs to 400 to 600 dollars, which caps recipe cadence at 1 per week and slows organic ranking timeline by 6 months.
Seasonal content calendar planning
Seasonal content calendar planning maps recipes and comparison guides to the seasonal windows they need to rank in. A Christmas cookie recipe needs to publish in September to rank by early December. A Valentine’s chocolate guide needs to publish in November to rank by early February. A back-to-school lunchbox recipe needs to publish in June to rank by late August. The 60-to-90-day ranking curve dictates the calendar.
Creator syndication inside food brand content
Creator syndication on food brand content marketing amplifies the recipe hub through Instagram Reels, TikTok, and YouTube Shorts creators paid to post their own version of the brand’s hero recipes. The creator content pulls net-new audiences into the recipe hub through the creator’s Link in Bio or Amazon Storefront tag. The syndication calendar names 12 to 30 creators per quarter with specific recipes assigned to each.
One brand we picked up had a spreadsheet titled “creator outreach 2023” with 47 rows and 3 responses. All 3 responses were auto-replies. The spreadsheet named zero recipes and offered flat rates below 100 dollars per post. Nobody posts a 30-second video for 87 dollars flat. Nobody.
Creator content commercial terms that work
Working creator content commercial terms run 350 to 1,500 dollars flat per post plus a 12 to 25 percent commission on tagged sales across a 30-day window. The commission mechanic pulls creators into follow-up posts because the incremental revenue continues past the initial fee. Mid-tier creators (30k to 150k followers) hit the sweet spot for food brand content because their engagement rate typically runs 4 to 8 percent versus 0.8 to 1.6 percent on mega-creators.
Content brief structure for creator partnerships
The content brief structure for creator partnerships runs a single page: the SKU, the specific recipe or usage occasion, 3 required brand mentions, 3 restricted claims (no health claims on non-medical SKUs), the pricing angle, the affiliate link, and 3 example videos that hit the tone. The brief avoids over-scripting because over-scripted creator content underperforms native creator voice by 40 to 60 percent on engagement rate.
Buyer intent content for food brand blogs
Buyer intent content on food brand blogs covers 8 to 16 pieces targeting explicit purchase-decision queries: “where to buy [brand],” “[brand] subscription vs. one-time,” “best [category] for [use case],” and “[brand] gift bundle.” Every buyer intent piece runs 1,400 to 2,400 words with a comparison table, product cards, and a clear conversion path to the specific SKU that matches the query intent. Buyer intent content converts at 3 to 6 percent versus 1 to 2 percent on recipe content because the shopper landed already planning to buy, not exploring a usage occasion.
Where-to-buy content structure
Where-to-buy content structure covers online (DTC storefront, Amazon, Target.com, Whole Foods online), retail (specific chain locators with the store finder embedded), and international (customs limitations, retailer partners abroad). Every piece names specific retailers, links to the store locator, and includes an FAQ block covering shipping availability, subscription options, and gift card compatibility. Where-to-buy content ranks for branded discovery queries the DTC storefront otherwise loses to competitor affiliate reviews.
Subscription versus one-time comparison content
Subscription versus one-time comparison content converts subscription commitments at 3 to 6 percent because it addresses the price-sensitivity concern head-on with a specific math table. The piece covers the discount structure (15 percent lifetime), the skip-a-month mechanic, the pause-anytime rule, the cancellation policy, and the specific yearly savings for the brand’s average consumption cadence. Cross-reference the retention structure on our food and beverage marketing retainer page.
Content refresh cadence on food brand pillars
Content refresh cadence on food brand content pillars runs a rolling audit every 12 to 24 months by pillar. Recipes get refreshed every 12 months with new photography, updated schema, and any nutrition or ingredient adjustments. Ingredient comparison guides refresh every 18 months to update market data. Sourcing story pages refresh every 24 months to reflect farm partnership changes and new harvest angles. Buyer intent content refreshes every 12 months to update retailer availability and pricing.
Recipe refresh priority order
Recipe refresh priority runs by organic traffic rank. The top 20 recipes by monthly organic sessions get refreshed first (new photography, schema audit, related recipe internal links, updated nutrition). The next 40 get refreshed at 15 months. The remaining recipes get refreshed opportunistically when the ranking slips past position 15 in Google. Skipping the refresh cadence lets recipe rankings drift out of the top 3 inside 18 months as newer competitor recipes take the position.
Schema audit checklist per refresh
The schema audit checklist per refresh runs 8 items: Recipe schema completeness, aggregateRating count and accuracy, nutrition data accuracy, prepTime and cookTime match the recipe body, image URLs valid at CDN, related recipe internal links working, product card SKU URL live, and Google Search Console rich result eligibility validated. This checklist takes 20 minutes per recipe and prevents the schema drift that costs recipe rankings 20 to 40 positions quietly.
Reporting cadence for food brand content marketing
Reporting cadence on food brand content marketing runs a monthly executive report plus a quarterly business review. The monthly report ships in the first business week and covers organic sessions by pillar, top 10 ranking recipes with position trend, ingredient guide ranking movements, sourcing page performance, and organic-attributed DTC revenue. Every number carries a comparison to the prior month and a plain-language interpretation the founder reads in 7 minutes.
Metrics that matter for content marketing
Metrics that matter for food brand content marketing: organic sessions by pillar, recipe rich result impressions in Search Console, organic conversion rate to hero SKU pages, organic-attributed DTC revenue, and top 20 ranking positions by monthly organic sessions. Vanity metrics that do not matter: total pageviews without conversion context, average time on page without conversion attribution, and social share counts. The monthly report skips the vanity block entirely.
Quarterly business review structure
The quarterly business review runs 90 minutes with the founder, head of content, and SEO lead. Agenda: organic traffic trend by pillar, top 10 winning content pieces, top 10 losing content pieces (candidates for refresh or removal), competitive gap analysis against 5 named competitor brands, and next quarter’s content calendar with recipes and ingredient guides queued. According to Ahrefs content marketing research, brands running quarterly content audits outperform brands running annual audits by 40 to 70 percent on organic revenue over a 24-month window.
Internal linking discipline across food brand content
Internal linking discipline across food brand content moves authority from recipe pages toward hero SKU product pages and comparison guides. Every recipe links to the hero SKU it uses inline (once in the ingredient list, once in a bottom call-out card). Every ingredient comparison guide links to 3 to 6 recipes using the winning ingredient plus the hero SKU product page. Every sourcing story links to the 2 to 4 SKUs sourced from that specific farm or cooperative.
Anchor text strategy across recipe hubs
Anchor text on internal links varies across recipe hubs to avoid over-optimization patterns Google penalizes. Exact-match anchor (“single-origin Ethiopian coffee”) runs on 20 to 30 percent of internal links. Partial-match variations (“our Ethiopian roast”) run on 30 to 40 percent. Branded anchors (the SKU name) run on 20 to 30 percent. Generic anchors (“shop the coffee”) fill the remaining 10 to 20 percent. This ratio holds ranking without triggering the over-optimization penalty that shows up on brands that anchor-text-stuff every internal link with the same exact-match keyword. Cross-reference the linking layer on our food and beverage web design page.
Link equity from ingredient guides to SKU pages
Link equity from ingredient guides passes to SKU pages when the guide’s comparison table names the hero SKU in the winning column with a product card, and when the guide’s body links to 3 to 6 recipes that use the winning ingredient. This 3-hop path (guide to recipe to SKU) pushes authority from a high-traffic informational query down to a high-intent transactional page. According to Search Engine Land SEO coverage, informational content that internally links to transactional pages produces 2 to 4 times higher organic revenue than isolated content silos.
Wrapping up content marketing for food brands
Content marketing for food brands is the organic engine that turns a DTC snack, drink, or CPG storefront into a search-driven revenue channel. Recipe hub of 40 to 100 recipes. Ingredient comparison guides at 12 to 24 pieces. Sourcing story pages at 6 to 12 pieces. Buyer intent content at 8 to 16 pieces. Creator syndication calendar with 12 to 30 creators per quarter. Refresh cadence at 12 to 24 months by pillar. Reporting with organic sessions and organic revenue attribution.
If your DTC food brand is running paid social at 20,000 dollars monthly with a broken blog and zero recipe schema, professional content marketing for food brands pays for itself inside the first 90 days on organic traffic captured. Redefine Web ships content marketing inside our monthly retainer packages. Book a call and we will walk through the last three DTC food brands we built recipe hubs for, pillar by pillar.
Anchor text on internal links varies across recipe hubs to avoid over-optimization patterns Google penalizes. Exact-match anchor (“single-origin Ethiopian coffee”) runs on 20 to 30 percent of internal links. Partial-match variations (“our Ethiopian roast”) run on 30 to 40 percent. Branded anchors (the SKU name) run on 20 to 30 percent. Generic anchors (“shop the coffee”) fill the remaining 10 to 20 percent. This ratio holds ranking without triggering the over-optimization penalty that shows up on brands that anchor-text-stuff every internal link with the same exact-match keyword. Cross-reference the linking layer on our food and beverage web design page.
Link equity from ingredient guides to SKU pages
Link equity from ingredient guides passes to SKU pages when the guide’s comparison table names the hero SKU in the winning column with a product card, and when the guide’s body links to 3 to 6 recipes that use the winning ingredient. This 3-hop path (guide to recipe to SKU) pushes authority from a high-traffic informational query down to a high-intent transactional page. According to Search Engine Land SEO coverage, informational content that internally links to transactional pages produces 2 to 4 times higher organic revenue than isolated content silos.
Wrapping up content marketing for food brands
Content marketing for food brands is the organic engine that turns a DTC snack, drink, or CPG storefront into a search-driven revenue channel. Recipe hub of 40 to 100 recipes. Ingredient comparison guides at 12 to 24 pieces. Sourcing story pages at 6 to 12 pieces. Buyer intent content at 8 to 16 pieces. Creator syndication calendar with 12 to 30 creators per quarter. Refresh cadence at 12 to 24 months by pillar. Reporting with organic sessions and organic revenue attribution.
If your DTC food brand is running paid social at 20,000 dollars monthly with a broken blog and zero recipe schema, professional content marketing for food brands pays for itself inside the first 90 days on organic traffic captured. Redefine Web ships content marketing inside our monthly retainer packages. Book a call and we will walk through the last three DTC food brands we built recipe hubs for, pillar by pillar.
Content marketing for food brands starts with a recipe hub because recipe queries account for 40 to 60 percent of high-intent search volume in the food category. Every hero SKU needs 4 to 12 recipes anchored to it, each targeting a specific occasion and audience.
Skip the recipe hub and the brand loses the search real estate that pulls DTC storefront traffic month over month at zero incremental paid cost. Recipe traffic converts at 2 to 4 percent because the shopper landed with usage intent, not passive discovery, which is why food brands win on recipes.
Recipe schema and Google rich result eligibility
Every recipe page ships schema.org Recipe markup including cookTime, prepTime, recipeIngredient, recipeInstructions, nutrition, and aggregateRating. Correctly marked-up recipes qualify for Google’s recipe rich result carousel that pulls 3 to 6 times higher click-through rate than a plain blue link. The schema layer takes 15 minutes per recipe to author and 30 minutes to validate in Google Search Console. Cross-reference the recipe search stack on our food and beverage SEO page.
Recipe hub structure that scales
The recipe hub structure runs 40 to 100 recipes at maturity, organized by hero SKU (4 to 12 recipes per SKU) plus occasion tags (breakfast, weeknight dinner, meal prep, brunch, holiday). Every recipe links back to the hero SKU product page with the SKU embedded in an inline card. The hub earns internal linking value from ingredient comparison guides and the sourcing story pages, which feeds recipe ranking on Google. According to Google Search Central recipe structured data guidance, complete Recipe schema markup is required for eligibility in the recipe carousel and the ingredient search filter.
Pillar structure for food brand content marketing
The pillar structure on content marketing for food brands runs 4 content pillars concurrently: recipe hub (40 to 100 recipes), ingredient comparison guides (12 to 24 guides), sourcing story pages (6 to 12 pages), and buyer intent content (where to buy, subscription vs. one-time, gift bundle guides). Every pillar covers a distinct search intent and every pillar links back to the hero SKU product pages.
Ingredient comparison guide format
Ingredient comparison guides run 1,800 to 3,200 words comparing 2 to 4 ingredient types on 6 to 10 attributes with a comparison table, real-world use case examples, and links to the hero SKU that uses the specific ingredient. Example: organic vs. conventional oats compares nutritional profile, sourcing chain, cost, environmental impact, and taste on a 6-column table. The brand’s SKU appears in the winning column with a product card. These guides rank 3 to 8 months after publication and pull steady-state organic traffic.
Sourcing story pages that build trust
Sourcing story pages name the specific farms, cooperatives, or suppliers the brand sources from, with photos of the farms, farmer quotes, and specific harvest windows. A coffee brand’s Ethiopian farm page ranks for “single-origin Ethiopian coffee” and “Yirgacheffe coffee origin” plus 40 long-tail variations. The sourcing page pulls trust-building traffic that converts at 4 to 6 percent because the shopper landed pattern-matching on transparency and named provenance. Every sourcing page includes farmer or cooperative quotes, harvest dates, and a link back to 3 to 5 hero SKU pages that source from the named supplier.
Vejrø hospitality content case study
Vejrø Resort, a Danish private-island destination with an on-site restaurant focused on organic, locally sourced cuisine, joined us with strong social engagement and no organic-search real estate. Guests found the resort on Instagram but never in Google search for terms like “private island resort Denmark,” “farm-to-table hospitality Denmark,” or “Vejrø restaurant.” The same organic-search gap shows up on DTC food brands running paid social at 20,000 dollars monthly with a broken blog and zero recipe schema.
We built the conversion-focused website with on-site and off-site SEO tuned to the travel-niche keyword clusters, competitor analysis against comparable boutique resorts, and mobile-first design prioritizing guest discovery. Every page carried the structured data qualifying it for Google’s rich results in the hospitality category. Every internal link pushed authority toward the direct-booking conversion path.
Three months later, Vejrø hit 10,000 plus organic visitors, ranked for 200 plus first-page keywords, and pulled a 2.2 percent booking conversion rate from organic traffic. The same pattern applies to content marketing for food brands: recipe schema, ingredient comparison guides, and sourcing story pages pull organic traffic at 20 to 40 percent conversion into hero SKU pages inside 6 months when the content quality matches search intent and every page carries the right structured data markup. Vejrø also proved out the reporting discipline: every monthly report named the exact page, the exact keyword cluster, and the exact search feature (rich result, sitelinks, image pack) driving the incremental organic revenue instead of hiding behind aggregate traffic charts.
Recipe cadence and content calendar for food brands
Recipe cadence on a working food brand content calendar ships 2 to 4 new recipes per week during the first 6 months and drops to 1 per week at maturity. Each recipe takes 4 to 6 hours to produce (write, test in the kitchen, photograph, schema author, publish). At 3 recipes per week, the brand hits 78 recipes inside 6 months plus a backlog of ingredient comparison and sourcing content queued behind the recipe production line.
| Content pillar | Target volume year 1 | Production cost per piece | Refresh cadence |
|---|---|---|---|
| Recipe hub | 40 to 100 recipes | $180 to $320 | Every 12 months |
| Ingredient comparison guides | 12 to 24 guides | $450 to $780 | Every 18 months |
| Sourcing story pages | 6 to 12 pages | $680 to $1,200 | Every 24 months |
| Buyer intent content | 8 to 16 pieces | $220 to $420 | Every 12 months |
Photography as a content calendar constraint
Photography is the actual constraint on recipe cadence, not writing. Every recipe needs 6 to 12 photos: hero shot, ingredient flat lay, prep in progress, plated result, storage, and step shots for the schema markup. A working food brand batches photography 8 recipes at a time to keep the cost per recipe under 200 dollars. Skip the batching and the per-recipe cost climbs to 400 to 600 dollars, which caps recipe cadence at 1 per week and slows organic ranking timeline by 6 months.
Seasonal content calendar planning
Seasonal content calendar planning maps recipes and comparison guides to the seasonal windows they need to rank in. A Christmas cookie recipe needs to publish in September to rank by early December. A Valentine’s chocolate guide needs to publish in November to rank by early February. A back-to-school lunchbox recipe needs to publish in June to rank by late August. The 60-to-90-day ranking curve dictates the calendar.
Creator syndication inside food brand content
Creator syndication on food brand content marketing amplifies the recipe hub through Instagram Reels, TikTok, and YouTube Shorts creators paid to post their own version of the brand’s hero recipes. The creator content pulls net-new audiences into the recipe hub through the creator’s Link in Bio or Amazon Storefront tag. The syndication calendar names 12 to 30 creators per quarter with specific recipes assigned to each.
One brand we picked up had a spreadsheet titled “creator outreach 2023” with 47 rows and 3 responses. All 3 responses were auto-replies. The spreadsheet named zero recipes and offered flat rates below 100 dollars per post. Nobody posts a 30-second video for 87 dollars flat. Nobody.
Creator content commercial terms that work
Working creator content commercial terms run 350 to 1,500 dollars flat per post plus a 12 to 25 percent commission on tagged sales across a 30-day window. The commission mechanic pulls creators into follow-up posts because the incremental revenue continues past the initial fee. Mid-tier creators (30k to 150k followers) hit the sweet spot for food brand content because their engagement rate typically runs 4 to 8 percent versus 0.8 to 1.6 percent on mega-creators.
Content brief structure for creator partnerships
The content brief structure for creator partnerships runs a single page: the SKU, the specific recipe or usage occasion, 3 required brand mentions, 3 restricted claims (no health claims on non-medical SKUs), the pricing angle, the affiliate link, and 3 example videos that hit the tone. The brief avoids over-scripting because over-scripted creator content underperforms native creator voice by 40 to 60 percent on engagement rate.
Buyer intent content for food brand blogs
Buyer intent content on food brand blogs covers 8 to 16 pieces targeting explicit purchase-decision queries: “where to buy [brand],” “[brand] subscription vs. one-time,” “best [category] for [use case],” and “[brand] gift bundle.” Every buyer intent piece runs 1,400 to 2,400 words with a comparison table, product cards, and a clear conversion path to the specific SKU that matches the query intent. Buyer intent content converts at 3 to 6 percent versus 1 to 2 percent on recipe content because the shopper landed already planning to buy, not exploring a usage occasion.
Where-to-buy content structure
Where-to-buy content structure covers online (DTC storefront, Amazon, Target.com, Whole Foods online), retail (specific chain locators with the store finder embedded), and international (customs limitations, retailer partners abroad). Every piece names specific retailers, links to the store locator, and includes an FAQ block covering shipping availability, subscription options, and gift card compatibility. Where-to-buy content ranks for branded discovery queries the DTC storefront otherwise loses to competitor affiliate reviews.
Subscription versus one-time comparison content
Subscription versus one-time comparison content converts subscription commitments at 3 to 6 percent because it addresses the price-sensitivity concern head-on with a specific math table. The piece covers the discount structure (15 percent lifetime), the skip-a-month mechanic, the pause-anytime rule, the cancellation policy, and the specific yearly savings for the brand’s average consumption cadence. Cross-reference the retention structure on our food and beverage marketing retainer page.
Content refresh cadence on food brand pillars
Content refresh cadence on food brand content pillars runs a rolling audit every 12 to 24 months by pillar. Recipes get refreshed every 12 months with new photography, updated schema, and any nutrition or ingredient adjustments. Ingredient comparison guides refresh every 18 months to update market data. Sourcing story pages refresh every 24 months to reflect farm partnership changes and new harvest angles. Buyer intent content refreshes every 12 months to update retailer availability and pricing.
Recipe refresh priority order
Recipe refresh priority runs by organic traffic rank. The top 20 recipes by monthly organic sessions get refreshed first (new photography, schema audit, related recipe internal links, updated nutrition). The next 40 get refreshed at 15 months. The remaining recipes get refreshed opportunistically when the ranking slips past position 15 in Google. Skipping the refresh cadence lets recipe rankings drift out of the top 3 inside 18 months as newer competitor recipes take the position.
Schema audit checklist per refresh
The schema audit checklist per refresh runs 8 items: Recipe schema completeness, aggregateRating count and accuracy, nutrition data accuracy, prepTime and cookTime match the recipe body, image URLs valid at CDN, related recipe internal links working, product card SKU URL live, and Google Search Console rich result eligibility validated. This checklist takes 20 minutes per recipe and prevents the schema drift that costs recipe rankings 20 to 40 positions quietly.
Reporting cadence for food brand content marketing
Reporting cadence on food brand content marketing runs a monthly executive report plus a quarterly business review. The monthly report ships in the first business week and covers organic sessions by pillar, top 10 ranking recipes with position trend, ingredient guide ranking movements, sourcing page performance, and organic-attributed DTC revenue. Every number carries a comparison to the prior month and a plain-language interpretation the founder reads in 7 minutes.
Metrics that matter for content marketing
Metrics that matter for food brand content marketing: organic sessions by pillar, recipe rich result impressions in Search Console, organic conversion rate to hero SKU pages, organic-attributed DTC revenue, and top 20 ranking positions by monthly organic sessions. Vanity metrics that do not matter: total pageviews without conversion context, average time on page without conversion attribution, and social share counts. The monthly report skips the vanity block entirely.
Quarterly business review structure
The quarterly business review runs 90 minutes with the founder, head of content, and SEO lead. Agenda: organic traffic trend by pillar, top 10 winning content pieces, top 10 losing content pieces (candidates for refresh or removal), competitive gap analysis against 5 named competitor brands, and next quarter’s content calendar with recipes and ingredient guides queued. According to Ahrefs content marketing research, brands running quarterly content audits outperform brands running annual audits by 40 to 70 percent on organic revenue over a 24-month window.
Internal linking discipline across food brand content
Internal linking discipline across food brand content moves authority from recipe pages toward hero SKU product pages and comparison guides. Every recipe links to the hero SKU it uses inline (once in the ingredient list, once in a bottom call-out card). Every ingredient comparison guide links to 3 to 6 recipes using the winning ingredient plus the hero SKU product page. Every sourcing story links to the 2 to 4 SKUs sourced from that specific farm or cooperative.
Anchor text strategy across recipe hubs
Anchor text on internal links varies across recipe hubs to avoid over-optimization patterns Google penalizes. Exact-match anchor (“single-origin Ethiopian coffee”) runs on 20 to 30 percent of internal links. Partial-match variations (“our Ethiopian roast”) run on 30 to 40 percent. Branded anchors (the SKU name) run on 20 to 30 percent. Generic anchors (“shop the coffee”) fill the remaining 10 to 20 percent. This ratio holds ranking without triggering the over-optimization penalty that shows up on brands that anchor-text-stuff every internal link with the same exact-match keyword. Cross-reference the linking layer on our food and beverage web design page.
Link equity from ingredient guides to SKU pages
Link equity from ingredient guides passes to SKU pages when the guide’s comparison table names the hero SKU in the winning column with a product card, and when the guide’s body links to 3 to 6 recipes that use the winning ingredient. This 3-hop path (guide to recipe to SKU) pushes authority from a high-traffic informational query down to a high-intent transactional page. According to Search Engine Land SEO coverage, informational content that internally links to transactional pages produces 2 to 4 times higher organic revenue than isolated content silos.
Wrapping up content marketing for food brands
Content marketing for food brands is the organic engine that turns a DTC snack, drink, or CPG storefront into a search-driven revenue channel. Recipe hub of 40 to 100 recipes. Ingredient comparison guides at 12 to 24 pieces. Sourcing story pages at 6 to 12 pieces. Buyer intent content at 8 to 16 pieces. Creator syndication calendar with 12 to 30 creators per quarter. Refresh cadence at 12 to 24 months by pillar. Reporting with organic sessions and organic revenue attribution.
If your DTC food brand is running paid social at 20,000 dollars monthly with a broken blog and zero recipe schema, professional content marketing for food brands pays for itself inside the first 90 days on organic traffic captured. Redefine Web ships content marketing inside our monthly retainer packages. Book a call and we will walk through the last three DTC food brands we built recipe hubs for, pillar by pillar.
Content marketing for food brands starts with a recipe hub because recipe queries account for 40 to 60 percent of high-intent search volume in the food category. Every hero SKU needs 4 to 12 recipes anchored to it, each targeting a specific occasion and audience.
Skip the recipe hub and the brand loses the search real estate that pulls DTC storefront traffic month over month at zero incremental paid cost. Recipe traffic converts at 2 to 4 percent because the shopper landed with usage intent, not passive discovery, which is why food brands win on recipes.
Recipe schema and Google rich result eligibility
Every recipe page ships schema.org Recipe markup including cookTime, prepTime, recipeIngredient, recipeInstructions, nutrition, and aggregateRating. Correctly marked-up recipes qualify for Google’s recipe rich result carousel that pulls 3 to 6 times higher click-through rate than a plain blue link. The schema layer takes 15 minutes per recipe to author and 30 minutes to validate in Google Search Console. Cross-reference the recipe search stack on our food and beverage SEO page.
Recipe hub structure that scales
The recipe hub structure runs 40 to 100 recipes at maturity, organized by hero SKU (4 to 12 recipes per SKU) plus occasion tags (breakfast, weeknight dinner, meal prep, brunch, holiday). Every recipe links back to the hero SKU product page with the SKU embedded in an inline card. The hub earns internal linking value from ingredient comparison guides and the sourcing story pages, which feeds recipe ranking on Google. According to Google Search Central recipe structured data guidance, complete Recipe schema markup is required for eligibility in the recipe carousel and the ingredient search filter.
Pillar structure for food brand content marketing
The pillar structure on content marketing for food brands runs 4 content pillars concurrently: recipe hub (40 to 100 recipes), ingredient comparison guides (12 to 24 guides), sourcing story pages (6 to 12 pages), and buyer intent content (where to buy, subscription vs. one-time, gift bundle guides). Every pillar covers a distinct search intent and every pillar links back to the hero SKU product pages.
Ingredient comparison guide format
Ingredient comparison guides run 1,800 to 3,200 words comparing 2 to 4 ingredient types on 6 to 10 attributes with a comparison table, real-world use case examples, and links to the hero SKU that uses the specific ingredient. Example: organic vs. conventional oats compares nutritional profile, sourcing chain, cost, environmental impact, and taste on a 6-column table. The brand’s SKU appears in the winning column with a product card. These guides rank 3 to 8 months after publication and pull steady-state organic traffic.
Sourcing story pages that build trust
Sourcing story pages name the specific farms, cooperatives, or suppliers the brand sources from, with photos of the farms, farmer quotes, and specific harvest windows. A coffee brand’s Ethiopian farm page ranks for “single-origin Ethiopian coffee” and “Yirgacheffe coffee origin” plus 40 long-tail variations. The sourcing page pulls trust-building traffic that converts at 4 to 6 percent because the shopper landed pattern-matching on transparency and named provenance. Every sourcing page includes farmer or cooperative quotes, harvest dates, and a link back to 3 to 5 hero SKU pages that source from the named supplier.
Vejrø hospitality content case study
Vejrø Resort, a Danish private-island destination with an on-site restaurant focused on organic, locally sourced cuisine, joined us with strong social engagement and no organic-search real estate. Guests found the resort on Instagram but never in Google search for terms like “private island resort Denmark,” “farm-to-table hospitality Denmark,” or “Vejrø restaurant.” The same organic-search gap shows up on DTC food brands running paid social at 20,000 dollars monthly with a broken blog and zero recipe schema.
We built the conversion-focused website with on-site and off-site SEO tuned to the travel-niche keyword clusters, competitor analysis against comparable boutique resorts, and mobile-first design prioritizing guest discovery. Every page carried the structured data qualifying it for Google’s rich results in the hospitality category. Every internal link pushed authority toward the direct-booking conversion path.
Three months later, Vejrø hit 10,000 plus organic visitors, ranked for 200 plus first-page keywords, and pulled a 2.2 percent booking conversion rate from organic traffic. The same pattern applies to content marketing for food brands: recipe schema, ingredient comparison guides, and sourcing story pages pull organic traffic at 20 to 40 percent conversion into hero SKU pages inside 6 months when the content quality matches search intent and every page carries the right structured data markup. Vejrø also proved out the reporting discipline: every monthly report named the exact page, the exact keyword cluster, and the exact search feature (rich result, sitelinks, image pack) driving the incremental organic revenue instead of hiding behind aggregate traffic charts.
Recipe cadence and content calendar for food brands
Recipe cadence on a working food brand content calendar ships 2 to 4 new recipes per week during the first 6 months and drops to 1 per week at maturity. Each recipe takes 4 to 6 hours to produce (write, test in the kitchen, photograph, schema author, publish). At 3 recipes per week, the brand hits 78 recipes inside 6 months plus a backlog of ingredient comparison and sourcing content queued behind the recipe production line.
| Content pillar | Target volume year 1 | Production cost per piece | Refresh cadence |
|---|---|---|---|
| Recipe hub | 40 to 100 recipes | $180 to $320 | Every 12 months |
| Ingredient comparison guides | 12 to 24 guides | $450 to $780 | Every 18 months |
| Sourcing story pages | 6 to 12 pages | $680 to $1,200 | Every 24 months |
| Buyer intent content | 8 to 16 pieces | $220 to $420 | Every 12 months |
Photography as a content calendar constraint
Photography is the actual constraint on recipe cadence, not writing. Every recipe needs 6 to 12 photos: hero shot, ingredient flat lay, prep in progress, plated result, storage, and step shots for the schema markup. A working food brand batches photography 8 recipes at a time to keep the cost per recipe under 200 dollars. Skip the batching and the per-recipe cost climbs to 400 to 600 dollars, which caps recipe cadence at 1 per week and slows organic ranking timeline by 6 months.
Seasonal content calendar planning
Seasonal content calendar planning maps recipes and comparison guides to the seasonal windows they need to rank in. A Christmas cookie recipe needs to publish in September to rank by early December. A Valentine’s chocolate guide needs to publish in November to rank by early February. A back-to-school lunchbox recipe needs to publish in June to rank by late August. The 60-to-90-day ranking curve dictates the calendar.
Creator syndication inside food brand content
Creator syndication on food brand content marketing amplifies the recipe hub through Instagram Reels, TikTok, and YouTube Shorts creators paid to post their own version of the brand’s hero recipes. The creator content pulls net-new audiences into the recipe hub through the creator’s Link in Bio or Amazon Storefront tag. The syndication calendar names 12 to 30 creators per quarter with specific recipes assigned to each.
One brand we picked up had a spreadsheet titled “creator outreach 2023” with 47 rows and 3 responses. All 3 responses were auto-replies. The spreadsheet named zero recipes and offered flat rates below 100 dollars per post. Nobody posts a 30-second video for 87 dollars flat. Nobody.
Creator content commercial terms that work
Working creator content commercial terms run 350 to 1,500 dollars flat per post plus a 12 to 25 percent commission on tagged sales across a 30-day window. The commission mechanic pulls creators into follow-up posts because the incremental revenue continues past the initial fee. Mid-tier creators (30k to 150k followers) hit the sweet spot for food brand content because their engagement rate typically runs 4 to 8 percent versus 0.8 to 1.6 percent on mega-creators.
Content brief structure for creator partnerships
The content brief structure for creator partnerships runs a single page: the SKU, the specific recipe or usage occasion, 3 required brand mentions, 3 restricted claims (no health claims on non-medical SKUs), the pricing angle, the affiliate link, and 3 example videos that hit the tone. The brief avoids over-scripting because over-scripted creator content underperforms native creator voice by 40 to 60 percent on engagement rate.
Buyer intent content for food brand blogs
Buyer intent content on food brand blogs covers 8 to 16 pieces targeting explicit purchase-decision queries: “where to buy [brand],” “[brand] subscription vs. one-time,” “best [category] for [use case],” and “[brand] gift bundle.” Every buyer intent piece runs 1,400 to 2,400 words with a comparison table, product cards, and a clear conversion path to the specific SKU that matches the query intent. Buyer intent content converts at 3 to 6 percent versus 1 to 2 percent on recipe content because the shopper landed already planning to buy, not exploring a usage occasion.
Where-to-buy content structure
Where-to-buy content structure covers online (DTC storefront, Amazon, Target.com, Whole Foods online), retail (specific chain locators with the store finder embedded), and international (customs limitations, retailer partners abroad). Every piece names specific retailers, links to the store locator, and includes an FAQ block covering shipping availability, subscription options, and gift card compatibility. Where-to-buy content ranks for branded discovery queries the DTC storefront otherwise loses to competitor affiliate reviews.
Subscription versus one-time comparison content
Subscription versus one-time comparison content converts subscription commitments at 3 to 6 percent because it addresses the price-sensitivity concern head-on with a specific math table. The piece covers the discount structure (15 percent lifetime), the skip-a-month mechanic, the pause-anytime rule, the cancellation policy, and the specific yearly savings for the brand’s average consumption cadence. Cross-reference the retention structure on our food and beverage marketing retainer page.
Content refresh cadence on food brand pillars
Content refresh cadence on food brand content pillars runs a rolling audit every 12 to 24 months by pillar. Recipes get refreshed every 12 months with new photography, updated schema, and any nutrition or ingredient adjustments. Ingredient comparison guides refresh every 18 months to update market data. Sourcing story pages refresh every 24 months to reflect farm partnership changes and new harvest angles. Buyer intent content refreshes every 12 months to update retailer availability and pricing.
Recipe refresh priority order
Recipe refresh priority runs by organic traffic rank. The top 20 recipes by monthly organic sessions get refreshed first (new photography, schema audit, related recipe internal links, updated nutrition). The next 40 get refreshed at 15 months. The remaining recipes get refreshed opportunistically when the ranking slips past position 15 in Google. Skipping the refresh cadence lets recipe rankings drift out of the top 3 inside 18 months as newer competitor recipes take the position.
Schema audit checklist per refresh
The schema audit checklist per refresh runs 8 items: Recipe schema completeness, aggregateRating count and accuracy, nutrition data accuracy, prepTime and cookTime match the recipe body, image URLs valid at CDN, related recipe internal links working, product card SKU URL live, and Google Search Console rich result eligibility validated. This checklist takes 20 minutes per recipe and prevents the schema drift that costs recipe rankings 20 to 40 positions quietly.
Reporting cadence for food brand content marketing
Reporting cadence on food brand content marketing runs a monthly executive report plus a quarterly business review. The monthly report ships in the first business week and covers organic sessions by pillar, top 10 ranking recipes with position trend, ingredient guide ranking movements, sourcing page performance, and organic-attributed DTC revenue. Every number carries a comparison to the prior month and a plain-language interpretation the founder reads in 7 minutes.
Metrics that matter for content marketing
Metrics that matter for food brand content marketing: organic sessions by pillar, recipe rich result impressions in Search Console, organic conversion rate to hero SKU pages, organic-attributed DTC revenue, and top 20 ranking positions by monthly organic sessions. Vanity metrics that do not matter: total pageviews without conversion context, average time on page without conversion attribution, and social share counts. The monthly report skips the vanity block entirely.
Quarterly business review structure
The quarterly business review runs 90 minutes with the founder, head of content, and SEO lead. Agenda: organic traffic trend by pillar, top 10 winning content pieces, top 10 losing content pieces (candidates for refresh or removal), competitive gap analysis against 5 named competitor brands, and next quarter’s content calendar with recipes and ingredient guides queued. According to Ahrefs content marketing research, brands running quarterly content audits outperform brands running annual audits by 40 to 70 percent on organic revenue over a 24-month window.
Internal linking discipline across food brand content
Internal linking discipline across food brand content moves authority from recipe pages toward hero SKU product pages and comparison guides. Every recipe links to the hero SKU it uses inline (once in the ingredient list, once in a bottom call-out card). Every ingredient comparison guide links to 3 to 6 recipes using the winning ingredient plus the hero SKU product page. Every sourcing story links to the 2 to 4 SKUs sourced from that specific farm or cooperative.
Anchor text strategy across recipe hubs
Anchor text on internal links varies across recipe hubs to avoid over-optimization patterns Google penalizes. Exact-match anchor (“single-origin Ethiopian coffee”) runs on 20 to 30 percent of internal links. Partial-match variations (“our Ethiopian roast”) run on 30 to 40 percent. Branded anchors (the SKU name) run on 20 to 30 percent. Generic anchors (“shop the coffee”) fill the remaining 10 to 20 percent. This ratio holds ranking without triggering the over-optimization penalty that shows up on brands that anchor-text-stuff every internal link with the same exact-match keyword. Cross-reference the linking layer on our food and beverage web design page.
Link equity from ingredient guides to SKU pages
Link equity from ingredient guides passes to SKU pages when the guide’s comparison table names the hero SKU in the winning column with a product card, and when the guide’s body links to 3 to 6 recipes that use the winning ingredient. This 3-hop path (guide to recipe to SKU) pushes authority from a high-traffic informational query down to a high-intent transactional page. According to Search Engine Land SEO coverage, informational content that internally links to transactional pages produces 2 to 4 times higher organic revenue than isolated content silos.
Wrapping up content marketing for food brands
Content marketing for food brands is the organic engine that turns a DTC snack, drink, or CPG storefront into a search-driven revenue channel. Recipe hub of 40 to 100 recipes. Ingredient comparison guides at 12 to 24 pieces. Sourcing story pages at 6 to 12 pieces. Buyer intent content at 8 to 16 pieces. Creator syndication calendar with 12 to 30 creators per quarter. Refresh cadence at 12 to 24 months by pillar. Reporting with organic sessions and organic revenue attribution.
If your DTC food brand is running paid social at 20,000 dollars monthly with a broken blog and zero recipe schema, professional content marketing for food brands pays for itself inside the first 90 days on organic traffic captured. Redefine Web ships content marketing inside our monthly retainer packages. Book a call and we will walk through the last three DTC food brands we built recipe hubs for, pillar by pillar.
Internal linking discipline across food brand content moves authority from recipe pages toward hero SKU product pages and comparison guides. Every recipe links to the hero SKU it uses inline (once in the ingredient list, once in a bottom call-out card). Every ingredient comparison guide links to 3 to 6 recipes using the winning ingredient plus the hero SKU product page. Every sourcing story links to the 2 to 4 SKUs sourced from that specific farm or cooperative.
Anchor text strategy across recipe hubs
Anchor text on internal links varies across recipe hubs to avoid over-optimization patterns Google penalizes. Exact-match anchor (“single-origin Ethiopian coffee”) runs on 20 to 30 percent of internal links. Partial-match variations (“our Ethiopian roast”) run on 30 to 40 percent. Branded anchors (the SKU name) run on 20 to 30 percent. Generic anchors (“shop the coffee”) fill the remaining 10 to 20 percent. This ratio holds ranking without triggering the over-optimization penalty that shows up on brands that anchor-text-stuff every internal link with the same exact-match keyword. Cross-reference the linking layer on our food and beverage web design page.
Link equity from ingredient guides to SKU pages
Link equity from ingredient guides passes to SKU pages when the guide’s comparison table names the hero SKU in the winning column with a product card, and when the guide’s body links to 3 to 6 recipes that use the winning ingredient. This 3-hop path (guide to recipe to SKU) pushes authority from a high-traffic informational query down to a high-intent transactional page. According to Search Engine Land SEO coverage, informational content that internally links to transactional pages produces 2 to 4 times higher organic revenue than isolated content silos.
Wrapping up content marketing for food brands
Content marketing for food brands is the organic engine that turns a DTC snack, drink, or CPG storefront into a search-driven revenue channel. Recipe hub of 40 to 100 recipes. Ingredient comparison guides at 12 to 24 pieces. Sourcing story pages at 6 to 12 pieces. Buyer intent content at 8 to 16 pieces. Creator syndication calendar with 12 to 30 creators per quarter. Refresh cadence at 12 to 24 months by pillar. Reporting with organic sessions and organic revenue attribution.
If your DTC food brand is running paid social at 20,000 dollars monthly with a broken blog and zero recipe schema, professional content marketing for food brands pays for itself inside the first 90 days on organic traffic captured. Redefine Web ships content marketing inside our monthly retainer packages. Book a call and we will walk through the last three DTC food brands we built recipe hubs for, pillar by pillar.
Content marketing for food brands starts with a recipe hub because recipe queries account for 40 to 60 percent of high-intent search volume in the food category. Every hero SKU needs 4 to 12 recipes anchored to it, each targeting a specific occasion and audience.
Skip the recipe hub and the brand loses the search real estate that pulls DTC storefront traffic month over month at zero incremental paid cost. Recipe traffic converts at 2 to 4 percent because the shopper landed with usage intent, not passive discovery, which is why food brands win on recipes.
Recipe schema and Google rich result eligibility
Every recipe page ships schema.org Recipe markup including cookTime, prepTime, recipeIngredient, recipeInstructions, nutrition, and aggregateRating. Correctly marked-up recipes qualify for Google’s recipe rich result carousel that pulls 3 to 6 times higher click-through rate than a plain blue link. The schema layer takes 15 minutes per recipe to author and 30 minutes to validate in Google Search Console. Cross-reference the recipe search stack on our food and beverage SEO page.
Recipe hub structure that scales
The recipe hub structure runs 40 to 100 recipes at maturity, organized by hero SKU (4 to 12 recipes per SKU) plus occasion tags (breakfast, weeknight dinner, meal prep, brunch, holiday). Every recipe links back to the hero SKU product page with the SKU embedded in an inline card. The hub earns internal linking value from ingredient comparison guides and the sourcing story pages, which feeds recipe ranking on Google. According to Google Search Central recipe structured data guidance, complete Recipe schema markup is required for eligibility in the recipe carousel and the ingredient search filter.
Pillar structure for food brand content marketing
The pillar structure on content marketing for food brands runs 4 content pillars concurrently: recipe hub (40 to 100 recipes), ingredient comparison guides (12 to 24 guides), sourcing story pages (6 to 12 pages), and buyer intent content (where to buy, subscription vs. one-time, gift bundle guides). Every pillar covers a distinct search intent and every pillar links back to the hero SKU product pages.
Ingredient comparison guide format
Ingredient comparison guides run 1,800 to 3,200 words comparing 2 to 4 ingredient types on 6 to 10 attributes with a comparison table, real-world use case examples, and links to the hero SKU that uses the specific ingredient. Example: organic vs. conventional oats compares nutritional profile, sourcing chain, cost, environmental impact, and taste on a 6-column table. The brand’s SKU appears in the winning column with a product card. These guides rank 3 to 8 months after publication and pull steady-state organic traffic.
Sourcing story pages that build trust
Sourcing story pages name the specific farms, cooperatives, or suppliers the brand sources from, with photos of the farms, farmer quotes, and specific harvest windows. A coffee brand’s Ethiopian farm page ranks for “single-origin Ethiopian coffee” and “Yirgacheffe coffee origin” plus 40 long-tail variations. The sourcing page pulls trust-building traffic that converts at 4 to 6 percent because the shopper landed pattern-matching on transparency and named provenance. Every sourcing page includes farmer or cooperative quotes, harvest dates, and a link back to 3 to 5 hero SKU pages that source from the named supplier.
Vejrø hospitality content case study
Vejrø Resort, a Danish private-island destination with an on-site restaurant focused on organic, locally sourced cuisine, joined us with strong social engagement and no organic-search real estate. Guests found the resort on Instagram but never in Google search for terms like “private island resort Denmark,” “farm-to-table hospitality Denmark,” or “Vejrø restaurant.” The same organic-search gap shows up on DTC food brands running paid social at 20,000 dollars monthly with a broken blog and zero recipe schema.
We built the conversion-focused website with on-site and off-site SEO tuned to the travel-niche keyword clusters, competitor analysis against comparable boutique resorts, and mobile-first design prioritizing guest discovery. Every page carried the structured data qualifying it for Google’s rich results in the hospitality category. Every internal link pushed authority toward the direct-booking conversion path.
Three months later, Vejrø hit 10,000 plus organic visitors, ranked for 200 plus first-page keywords, and pulled a 2.2 percent booking conversion rate from organic traffic. The same pattern applies to content marketing for food brands: recipe schema, ingredient comparison guides, and sourcing story pages pull organic traffic at 20 to 40 percent conversion into hero SKU pages inside 6 months when the content quality matches search intent and every page carries the right structured data markup. Vejrø also proved out the reporting discipline: every monthly report named the exact page, the exact keyword cluster, and the exact search feature (rich result, sitelinks, image pack) driving the incremental organic revenue instead of hiding behind aggregate traffic charts.
Recipe cadence and content calendar for food brands
Recipe cadence on a working food brand content calendar ships 2 to 4 new recipes per week during the first 6 months and drops to 1 per week at maturity. Each recipe takes 4 to 6 hours to produce (write, test in the kitchen, photograph, schema author, publish). At 3 recipes per week, the brand hits 78 recipes inside 6 months plus a backlog of ingredient comparison and sourcing content queued behind the recipe production line.
| Content pillar | Target volume year 1 | Production cost per piece | Refresh cadence |
|---|---|---|---|
| Recipe hub | 40 to 100 recipes | $180 to $320 | Every 12 months |
| Ingredient comparison guides | 12 to 24 guides | $450 to $780 | Every 18 months |
| Sourcing story pages | 6 to 12 pages | $680 to $1,200 | Every 24 months |
| Buyer intent content | 8 to 16 pieces | $220 to $420 | Every 12 months |
Photography as a content calendar constraint
Photography is the actual constraint on recipe cadence, not writing. Every recipe needs 6 to 12 photos: hero shot, ingredient flat lay, prep in progress, plated result, storage, and step shots for the schema markup. A working food brand batches photography 8 recipes at a time to keep the cost per recipe under 200 dollars. Skip the batching and the per-recipe cost climbs to 400 to 600 dollars, which caps recipe cadence at 1 per week and slows organic ranking timeline by 6 months.
Seasonal content calendar planning
Seasonal content calendar planning maps recipes and comparison guides to the seasonal windows they need to rank in. A Christmas cookie recipe needs to publish in September to rank by early December. A Valentine’s chocolate guide needs to publish in November to rank by early February. A back-to-school lunchbox recipe needs to publish in June to rank by late August. The 60-to-90-day ranking curve dictates the calendar.
Creator syndication inside food brand content
Creator syndication on food brand content marketing amplifies the recipe hub through Instagram Reels, TikTok, and YouTube Shorts creators paid to post their own version of the brand’s hero recipes. The creator content pulls net-new audiences into the recipe hub through the creator’s Link in Bio or Amazon Storefront tag. The syndication calendar names 12 to 30 creators per quarter with specific recipes assigned to each.
One brand we picked up had a spreadsheet titled “creator outreach 2023” with 47 rows and 3 responses. All 3 responses were auto-replies. The spreadsheet named zero recipes and offered flat rates below 100 dollars per post. Nobody posts a 30-second video for 87 dollars flat. Nobody.
Creator content commercial terms that work
Working creator content commercial terms run 350 to 1,500 dollars flat per post plus a 12 to 25 percent commission on tagged sales across a 30-day window. The commission mechanic pulls creators into follow-up posts because the incremental revenue continues past the initial fee. Mid-tier creators (30k to 150k followers) hit the sweet spot for food brand content because their engagement rate typically runs 4 to 8 percent versus 0.8 to 1.6 percent on mega-creators.
Content brief structure for creator partnerships
The content brief structure for creator partnerships runs a single page: the SKU, the specific recipe or usage occasion, 3 required brand mentions, 3 restricted claims (no health claims on non-medical SKUs), the pricing angle, the affiliate link, and 3 example videos that hit the tone. The brief avoids over-scripting because over-scripted creator content underperforms native creator voice by 40 to 60 percent on engagement rate.
Buyer intent content for food brand blogs
Buyer intent content on food brand blogs covers 8 to 16 pieces targeting explicit purchase-decision queries: “where to buy [brand],” “[brand] subscription vs. one-time,” “best [category] for [use case],” and “[brand] gift bundle.” Every buyer intent piece runs 1,400 to 2,400 words with a comparison table, product cards, and a clear conversion path to the specific SKU that matches the query intent. Buyer intent content converts at 3 to 6 percent versus 1 to 2 percent on recipe content because the shopper landed already planning to buy, not exploring a usage occasion.
Where-to-buy content structure
Where-to-buy content structure covers online (DTC storefront, Amazon, Target.com, Whole Foods online), retail (specific chain locators with the store finder embedded), and international (customs limitations, retailer partners abroad). Every piece names specific retailers, links to the store locator, and includes an FAQ block covering shipping availability, subscription options, and gift card compatibility. Where-to-buy content ranks for branded discovery queries the DTC storefront otherwise loses to competitor affiliate reviews.
Subscription versus one-time comparison content
Subscription versus one-time comparison content converts subscription commitments at 3 to 6 percent because it addresses the price-sensitivity concern head-on with a specific math table. The piece covers the discount structure (15 percent lifetime), the skip-a-month mechanic, the pause-anytime rule, the cancellation policy, and the specific yearly savings for the brand’s average consumption cadence. Cross-reference the retention structure on our food and beverage marketing retainer page.
Content refresh cadence on food brand pillars
Content refresh cadence on food brand content pillars runs a rolling audit every 12 to 24 months by pillar. Recipes get refreshed every 12 months with new photography, updated schema, and any nutrition or ingredient adjustments. Ingredient comparison guides refresh every 18 months to update market data. Sourcing story pages refresh every 24 months to reflect farm partnership changes and new harvest angles. Buyer intent content refreshes every 12 months to update retailer availability and pricing.
Recipe refresh priority order
Recipe refresh priority runs by organic traffic rank. The top 20 recipes by monthly organic sessions get refreshed first (new photography, schema audit, related recipe internal links, updated nutrition). The next 40 get refreshed at 15 months. The remaining recipes get refreshed opportunistically when the ranking slips past position 15 in Google. Skipping the refresh cadence lets recipe rankings drift out of the top 3 inside 18 months as newer competitor recipes take the position.
Schema audit checklist per refresh
The schema audit checklist per refresh runs 8 items: Recipe schema completeness, aggregateRating count and accuracy, nutrition data accuracy, prepTime and cookTime match the recipe body, image URLs valid at CDN, related recipe internal links working, product card SKU URL live, and Google Search Console rich result eligibility validated. This checklist takes 20 minutes per recipe and prevents the schema drift that costs recipe rankings 20 to 40 positions quietly.
Reporting cadence for food brand content marketing
Reporting cadence on food brand content marketing runs a monthly executive report plus a quarterly business review. The monthly report ships in the first business week and covers organic sessions by pillar, top 10 ranking recipes with position trend, ingredient guide ranking movements, sourcing page performance, and organic-attributed DTC revenue. Every number carries a comparison to the prior month and a plain-language interpretation the founder reads in 7 minutes.
Metrics that matter for content marketing
Metrics that matter for food brand content marketing: organic sessions by pillar, recipe rich result impressions in Search Console, organic conversion rate to hero SKU pages, organic-attributed DTC revenue, and top 20 ranking positions by monthly organic sessions. Vanity metrics that do not matter: total pageviews without conversion context, average time on page without conversion attribution, and social share counts. The monthly report skips the vanity block entirely.
Quarterly business review structure
The quarterly business review runs 90 minutes with the founder, head of content, and SEO lead. Agenda: organic traffic trend by pillar, top 10 winning content pieces, top 10 losing content pieces (candidates for refresh or removal), competitive gap analysis against 5 named competitor brands, and next quarter’s content calendar with recipes and ingredient guides queued. According to Ahrefs content marketing research, brands running quarterly content audits outperform brands running annual audits by 40 to 70 percent on organic revenue over a 24-month window.
Internal linking discipline across food brand content
Internal linking discipline across food brand content moves authority from recipe pages toward hero SKU product pages and comparison guides. Every recipe links to the hero SKU it uses inline (once in the ingredient list, once in a bottom call-out card). Every ingredient comparison guide links to 3 to 6 recipes using the winning ingredient plus the hero SKU product page. Every sourcing story links to the 2 to 4 SKUs sourced from that specific farm or cooperative.
Anchor text strategy across recipe hubs
Anchor text on internal links varies across recipe hubs to avoid over-optimization patterns Google penalizes. Exact-match anchor (“single-origin Ethiopian coffee”) runs on 20 to 30 percent of internal links. Partial-match variations (“our Ethiopian roast”) run on 30 to 40 percent. Branded anchors (the SKU name) run on 20 to 30 percent. Generic anchors (“shop the coffee”) fill the remaining 10 to 20 percent. This ratio holds ranking without triggering the over-optimization penalty that shows up on brands that anchor-text-stuff every internal link with the same exact-match keyword. Cross-reference the linking layer on our food and beverage web design page.
Link equity from ingredient guides to SKU pages
Link equity from ingredient guides passes to SKU pages when the guide’s comparison table names the hero SKU in the winning column with a product card, and when the guide’s body links to 3 to 6 recipes that use the winning ingredient. This 3-hop path (guide to recipe to SKU) pushes authority from a high-traffic informational query down to a high-intent transactional page. According to Search Engine Land SEO coverage, informational content that internally links to transactional pages produces 2 to 4 times higher organic revenue than isolated content silos.
Wrapping up content marketing for food brands
Content marketing for food brands is the organic engine that turns a DTC snack, drink, or CPG storefront into a search-driven revenue channel. Recipe hub of 40 to 100 recipes. Ingredient comparison guides at 12 to 24 pieces. Sourcing story pages at 6 to 12 pieces. Buyer intent content at 8 to 16 pieces. Creator syndication calendar with 12 to 30 creators per quarter. Refresh cadence at 12 to 24 months by pillar. Reporting with organic sessions and organic revenue attribution.
If your DTC food brand is running paid social at 20,000 dollars monthly with a broken blog and zero recipe schema, professional content marketing for food brands pays for itself inside the first 90 days on organic traffic captured. Redefine Web ships content marketing inside our monthly retainer packages. Book a call and we will walk through the last three DTC food brands we built recipe hubs for, pillar by pillar.
Content marketing for food brands starts with a recipe hub because recipe queries account for 40 to 60 percent of high-intent search volume in the food category. Every hero SKU needs 4 to 12 recipes anchored to it, each targeting a specific occasion and audience.
Skip the recipe hub and the brand loses the search real estate that pulls DTC storefront traffic month over month at zero incremental paid cost. Recipe traffic converts at 2 to 4 percent because the shopper landed with usage intent, not passive discovery, which is why food brands win on recipes.
Recipe schema and Google rich result eligibility
Every recipe page ships schema.org Recipe markup including cookTime, prepTime, recipeIngredient, recipeInstructions, nutrition, and aggregateRating. Correctly marked-up recipes qualify for Google’s recipe rich result carousel that pulls 3 to 6 times higher click-through rate than a plain blue link. The schema layer takes 15 minutes per recipe to author and 30 minutes to validate in Google Search Console. Cross-reference the recipe search stack on our food and beverage SEO page.
Recipe hub structure that scales
The recipe hub structure runs 40 to 100 recipes at maturity, organized by hero SKU (4 to 12 recipes per SKU) plus occasion tags (breakfast, weeknight dinner, meal prep, brunch, holiday). Every recipe links back to the hero SKU product page with the SKU embedded in an inline card. The hub earns internal linking value from ingredient comparison guides and the sourcing story pages, which feeds recipe ranking on Google. According to Google Search Central recipe structured data guidance, complete Recipe schema markup is required for eligibility in the recipe carousel and the ingredient search filter.
Pillar structure for food brand content marketing
The pillar structure on content marketing for food brands runs 4 content pillars concurrently: recipe hub (40 to 100 recipes), ingredient comparison guides (12 to 24 guides), sourcing story pages (6 to 12 pages), and buyer intent content (where to buy, subscription vs. one-time, gift bundle guides). Every pillar covers a distinct search intent and every pillar links back to the hero SKU product pages.
Ingredient comparison guide format
Ingredient comparison guides run 1,800 to 3,200 words comparing 2 to 4 ingredient types on 6 to 10 attributes with a comparison table, real-world use case examples, and links to the hero SKU that uses the specific ingredient. Example: organic vs. conventional oats compares nutritional profile, sourcing chain, cost, environmental impact, and taste on a 6-column table. The brand’s SKU appears in the winning column with a product card. These guides rank 3 to 8 months after publication and pull steady-state organic traffic.
Sourcing story pages that build trust
Sourcing story pages name the specific farms, cooperatives, or suppliers the brand sources from, with photos of the farms, farmer quotes, and specific harvest windows. A coffee brand’s Ethiopian farm page ranks for “single-origin Ethiopian coffee” and “Yirgacheffe coffee origin” plus 40 long-tail variations. The sourcing page pulls trust-building traffic that converts at 4 to 6 percent because the shopper landed pattern-matching on transparency and named provenance. Every sourcing page includes farmer or cooperative quotes, harvest dates, and a link back to 3 to 5 hero SKU pages that source from the named supplier.
Vejrø hospitality content case study
Vejrø Resort, a Danish private-island destination with an on-site restaurant focused on organic, locally sourced cuisine, joined us with strong social engagement and no organic-search real estate. Guests found the resort on Instagram but never in Google search for terms like “private island resort Denmark,” “farm-to-table hospitality Denmark,” or “Vejrø restaurant.” The same organic-search gap shows up on DTC food brands running paid social at 20,000 dollars monthly with a broken blog and zero recipe schema.
We built the conversion-focused website with on-site and off-site SEO tuned to the travel-niche keyword clusters, competitor analysis against comparable boutique resorts, and mobile-first design prioritizing guest discovery. Every page carried the structured data qualifying it for Google’s rich results in the hospitality category. Every internal link pushed authority toward the direct-booking conversion path.
Three months later, Vejrø hit 10,000 plus organic visitors, ranked for 200 plus first-page keywords, and pulled a 2.2 percent booking conversion rate from organic traffic. The same pattern applies to content marketing for food brands: recipe schema, ingredient comparison guides, and sourcing story pages pull organic traffic at 20 to 40 percent conversion into hero SKU pages inside 6 months when the content quality matches search intent and every page carries the right structured data markup. Vejrø also proved out the reporting discipline: every monthly report named the exact page, the exact keyword cluster, and the exact search feature (rich result, sitelinks, image pack) driving the incremental organic revenue instead of hiding behind aggregate traffic charts.
Recipe cadence and content calendar for food brands
Recipe cadence on a working food brand content calendar ships 2 to 4 new recipes per week during the first 6 months and drops to 1 per week at maturity. Each recipe takes 4 to 6 hours to produce (write, test in the kitchen, photograph, schema author, publish). At 3 recipes per week, the brand hits 78 recipes inside 6 months plus a backlog of ingredient comparison and sourcing content queued behind the recipe production line.
| Content pillar | Target volume year 1 | Production cost per piece | Refresh cadence |
|---|---|---|---|
| Recipe hub | 40 to 100 recipes | $180 to $320 | Every 12 months |
| Ingredient comparison guides | 12 to 24 guides | $450 to $780 | Every 18 months |
| Sourcing story pages | 6 to 12 pages | $680 to $1,200 | Every 24 months |
| Buyer intent content | 8 to 16 pieces | $220 to $420 | Every 12 months |
Photography as a content calendar constraint
Photography is the actual constraint on recipe cadence, not writing. Every recipe needs 6 to 12 photos: hero shot, ingredient flat lay, prep in progress, plated result, storage, and step shots for the schema markup. A working food brand batches photography 8 recipes at a time to keep the cost per recipe under 200 dollars. Skip the batching and the per-recipe cost climbs to 400 to 600 dollars, which caps recipe cadence at 1 per week and slows organic ranking timeline by 6 months.
Seasonal content calendar planning
Seasonal content calendar planning maps recipes and comparison guides to the seasonal windows they need to rank in. A Christmas cookie recipe needs to publish in September to rank by early December. A Valentine’s chocolate guide needs to publish in November to rank by early February. A back-to-school lunchbox recipe needs to publish in June to rank by late August. The 60-to-90-day ranking curve dictates the calendar.
Creator syndication inside food brand content
Creator syndication on food brand content marketing amplifies the recipe hub through Instagram Reels, TikTok, and YouTube Shorts creators paid to post their own version of the brand’s hero recipes. The creator content pulls net-new audiences into the recipe hub through the creator’s Link in Bio or Amazon Storefront tag. The syndication calendar names 12 to 30 creators per quarter with specific recipes assigned to each.
One brand we picked up had a spreadsheet titled “creator outreach 2023” with 47 rows and 3 responses. All 3 responses were auto-replies. The spreadsheet named zero recipes and offered flat rates below 100 dollars per post. Nobody posts a 30-second video for 87 dollars flat. Nobody.
Creator content commercial terms that work
Working creator content commercial terms run 350 to 1,500 dollars flat per post plus a 12 to 25 percent commission on tagged sales across a 30-day window. The commission mechanic pulls creators into follow-up posts because the incremental revenue continues past the initial fee. Mid-tier creators (30k to 150k followers) hit the sweet spot for food brand content because their engagement rate typically runs 4 to 8 percent versus 0.8 to 1.6 percent on mega-creators.
Content brief structure for creator partnerships
The content brief structure for creator partnerships runs a single page: the SKU, the specific recipe or usage occasion, 3 required brand mentions, 3 restricted claims (no health claims on non-medical SKUs), the pricing angle, the affiliate link, and 3 example videos that hit the tone. The brief avoids over-scripting because over-scripted creator content underperforms native creator voice by 40 to 60 percent on engagement rate.
Buyer intent content for food brand blogs
Buyer intent content on food brand blogs covers 8 to 16 pieces targeting explicit purchase-decision queries: “where to buy [brand],” “[brand] subscription vs. one-time,” “best [category] for [use case],” and “[brand] gift bundle.” Every buyer intent piece runs 1,400 to 2,400 words with a comparison table, product cards, and a clear conversion path to the specific SKU that matches the query intent. Buyer intent content converts at 3 to 6 percent versus 1 to 2 percent on recipe content because the shopper landed already planning to buy, not exploring a usage occasion.
Where-to-buy content structure
Where-to-buy content structure covers online (DTC storefront, Amazon, Target.com, Whole Foods online), retail (specific chain locators with the store finder embedded), and international (customs limitations, retailer partners abroad). Every piece names specific retailers, links to the store locator, and includes an FAQ block covering shipping availability, subscription options, and gift card compatibility. Where-to-buy content ranks for branded discovery queries the DTC storefront otherwise loses to competitor affiliate reviews.
Subscription versus one-time comparison content
Subscription versus one-time comparison content converts subscription commitments at 3 to 6 percent because it addresses the price-sensitivity concern head-on with a specific math table. The piece covers the discount structure (15 percent lifetime), the skip-a-month mechanic, the pause-anytime rule, the cancellation policy, and the specific yearly savings for the brand’s average consumption cadence. Cross-reference the retention structure on our food and beverage marketing retainer page.
Content refresh cadence on food brand pillars
Content refresh cadence on food brand content pillars runs a rolling audit every 12 to 24 months by pillar. Recipes get refreshed every 12 months with new photography, updated schema, and any nutrition or ingredient adjustments. Ingredient comparison guides refresh every 18 months to update market data. Sourcing story pages refresh every 24 months to reflect farm partnership changes and new harvest angles. Buyer intent content refreshes every 12 months to update retailer availability and pricing.
Recipe refresh priority order
Recipe refresh priority runs by organic traffic rank. The top 20 recipes by monthly organic sessions get refreshed first (new photography, schema audit, related recipe internal links, updated nutrition). The next 40 get refreshed at 15 months. The remaining recipes get refreshed opportunistically when the ranking slips past position 15 in Google. Skipping the refresh cadence lets recipe rankings drift out of the top 3 inside 18 months as newer competitor recipes take the position.
Schema audit checklist per refresh
The schema audit checklist per refresh runs 8 items: Recipe schema completeness, aggregateRating count and accuracy, nutrition data accuracy, prepTime and cookTime match the recipe body, image URLs valid at CDN, related recipe internal links working, product card SKU URL live, and Google Search Console rich result eligibility validated. This checklist takes 20 minutes per recipe and prevents the schema drift that costs recipe rankings 20 to 40 positions quietly.
Reporting cadence for food brand content marketing
Reporting cadence on food brand content marketing runs a monthly executive report plus a quarterly business review. The monthly report ships in the first business week and covers organic sessions by pillar, top 10 ranking recipes with position trend, ingredient guide ranking movements, sourcing page performance, and organic-attributed DTC revenue. Every number carries a comparison to the prior month and a plain-language interpretation the founder reads in 7 minutes.
Metrics that matter for content marketing
Metrics that matter for food brand content marketing: organic sessions by pillar, recipe rich result impressions in Search Console, organic conversion rate to hero SKU pages, organic-attributed DTC revenue, and top 20 ranking positions by monthly organic sessions. Vanity metrics that do not matter: total pageviews without conversion context, average time on page without conversion attribution, and social share counts. The monthly report skips the vanity block entirely.
Quarterly business review structure
The quarterly business review runs 90 minutes with the founder, head of content, and SEO lead. Agenda: organic traffic trend by pillar, top 10 winning content pieces, top 10 losing content pieces (candidates for refresh or removal), competitive gap analysis against 5 named competitor brands, and next quarter’s content calendar with recipes and ingredient guides queued. According to Ahrefs content marketing research, brands running quarterly content audits outperform brands running annual audits by 40 to 70 percent on organic revenue over a 24-month window.
Internal linking discipline across food brand content
Internal linking discipline across food brand content moves authority from recipe pages toward hero SKU product pages and comparison guides. Every recipe links to the hero SKU it uses inline (once in the ingredient list, once in a bottom call-out card). Every ingredient comparison guide links to 3 to 6 recipes using the winning ingredient plus the hero SKU product page. Every sourcing story links to the 2 to 4 SKUs sourced from that specific farm or cooperative.
Anchor text strategy across recipe hubs
Anchor text on internal links varies across recipe hubs to avoid over-optimization patterns Google penalizes. Exact-match anchor (“single-origin Ethiopian coffee”) runs on 20 to 30 percent of internal links. Partial-match variations (“our Ethiopian roast”) run on 30 to 40 percent. Branded anchors (the SKU name) run on 20 to 30 percent. Generic anchors (“shop the coffee”) fill the remaining 10 to 20 percent. This ratio holds ranking without triggering the over-optimization penalty that shows up on brands that anchor-text-stuff every internal link with the same exact-match keyword. Cross-reference the linking layer on our food and beverage web design page.
Link equity from ingredient guides to SKU pages
Link equity from ingredient guides passes to SKU pages when the guide’s comparison table names the hero SKU in the winning column with a product card, and when the guide’s body links to 3 to 6 recipes that use the winning ingredient. This 3-hop path (guide to recipe to SKU) pushes authority from a high-traffic informational query down to a high-intent transactional page. According to Search Engine Land SEO coverage, informational content that internally links to transactional pages produces 2 to 4 times higher organic revenue than isolated content silos.
Wrapping up content marketing for food brands
Content marketing for food brands is the organic engine that turns a DTC snack, drink, or CPG storefront into a search-driven revenue channel. Recipe hub of 40 to 100 recipes. Ingredient comparison guides at 12 to 24 pieces. Sourcing story pages at 6 to 12 pieces. Buyer intent content at 8 to 16 pieces. Creator syndication calendar with 12 to 30 creators per quarter. Refresh cadence at 12 to 24 months by pillar. Reporting with organic sessions and organic revenue attribution.
If your DTC food brand is running paid social at 20,000 dollars monthly with a broken blog and zero recipe schema, professional content marketing for food brands pays for itself inside the first 90 days on organic traffic captured. Redefine Web ships content marketing inside our monthly retainer packages. Book a call and we will walk through the last three DTC food brands we built recipe hubs for, pillar by pillar.
Anchor text on internal links varies across recipe hubs to avoid over-optimization patterns Google penalizes. Exact-match anchor (“single-origin Ethiopian coffee”) runs on 20 to 30 percent of internal links. Partial-match variations (“our Ethiopian roast”) run on 30 to 40 percent. Branded anchors (the SKU name) run on 20 to 30 percent. Generic anchors (“shop the coffee”) fill the remaining 10 to 20 percent. This ratio holds ranking without triggering the over-optimization penalty that shows up on brands that anchor-text-stuff every internal link with the same exact-match keyword. Cross-reference the linking layer on our food and beverage web design page.
Link equity from ingredient guides to SKU pages
Link equity from ingredient guides passes to SKU pages when the guide’s comparison table names the hero SKU in the winning column with a product card, and when the guide’s body links to 3 to 6 recipes that use the winning ingredient. This 3-hop path (guide to recipe to SKU) pushes authority from a high-traffic informational query down to a high-intent transactional page. According to Search Engine Land SEO coverage, informational content that internally links to transactional pages produces 2 to 4 times higher organic revenue than isolated content silos.
Wrapping up content marketing for food brands
Content marketing for food brands is the organic engine that turns a DTC snack, drink, or CPG storefront into a search-driven revenue channel. Recipe hub of 40 to 100 recipes. Ingredient comparison guides at 12 to 24 pieces. Sourcing story pages at 6 to 12 pieces. Buyer intent content at 8 to 16 pieces. Creator syndication calendar with 12 to 30 creators per quarter. Refresh cadence at 12 to 24 months by pillar. Reporting with organic sessions and organic revenue attribution.
If your DTC food brand is running paid social at 20,000 dollars monthly with a broken blog and zero recipe schema, professional content marketing for food brands pays for itself inside the first 90 days on organic traffic captured. Redefine Web ships content marketing inside our monthly retainer packages. Book a call and we will walk through the last three DTC food brands we built recipe hubs for, pillar by pillar.
Internal linking discipline across food brand content moves authority from recipe pages toward hero SKU product pages and comparison guides. Every recipe links to the hero SKU it uses inline (once in the ingredient list, once in a bottom call-out card). Every ingredient comparison guide links to 3 to 6 recipes using the winning ingredient plus the hero SKU product page. Every sourcing story links to the 2 to 4 SKUs sourced from that specific farm or cooperative.
Anchor text strategy across recipe hubs
Anchor text on internal links varies across recipe hubs to avoid over-optimization patterns Google penalizes. Exact-match anchor (“single-origin Ethiopian coffee”) runs on 20 to 30 percent of internal links. Partial-match variations (“our Ethiopian roast”) run on 30 to 40 percent. Branded anchors (the SKU name) run on 20 to 30 percent. Generic anchors (“shop the coffee”) fill the remaining 10 to 20 percent. This ratio holds ranking without triggering the over-optimization penalty that shows up on brands that anchor-text-stuff every internal link with the same exact-match keyword. Cross-reference the linking layer on our food and beverage web design page.
Link equity from ingredient guides to SKU pages
Link equity from ingredient guides passes to SKU pages when the guide’s comparison table names the hero SKU in the winning column with a product card, and when the guide’s body links to 3 to 6 recipes that use the winning ingredient. This 3-hop path (guide to recipe to SKU) pushes authority from a high-traffic informational query down to a high-intent transactional page. According to Search Engine Land SEO coverage, informational content that internally links to transactional pages produces 2 to 4 times higher organic revenue than isolated content silos.
Wrapping up content marketing for food brands
Content marketing for food brands is the organic engine that turns a DTC snack, drink, or CPG storefront into a search-driven revenue channel. Recipe hub of 40 to 100 recipes. Ingredient comparison guides at 12 to 24 pieces. Sourcing story pages at 6 to 12 pieces. Buyer intent content at 8 to 16 pieces. Creator syndication calendar with 12 to 30 creators per quarter. Refresh cadence at 12 to 24 months by pillar. Reporting with organic sessions and organic revenue attribution.
If your DTC food brand is running paid social at 20,000 dollars monthly with a broken blog and zero recipe schema, professional content marketing for food brands pays for itself inside the first 90 days on organic traffic captured. Redefine Web ships content marketing inside our monthly retainer packages. Book a call and we will walk through the last three DTC food brands we built recipe hubs for, pillar by pillar.
Content marketing for food brands starts with a recipe hub because recipe queries account for 40 to 60 percent of high-intent search volume in the food category. Every hero SKU needs 4 to 12 recipes anchored to it, each targeting a specific occasion and audience.
Skip the recipe hub and the brand loses the search real estate that pulls DTC storefront traffic month over month at zero incremental paid cost. Recipe traffic converts at 2 to 4 percent because the shopper landed with usage intent, not passive discovery, which is why food brands win on recipes.
Recipe schema and Google rich result eligibility
Every recipe page ships schema.org Recipe markup including cookTime, prepTime, recipeIngredient, recipeInstructions, nutrition, and aggregateRating. Correctly marked-up recipes qualify for Google’s recipe rich result carousel that pulls 3 to 6 times higher click-through rate than a plain blue link. The schema layer takes 15 minutes per recipe to author and 30 minutes to validate in Google Search Console. Cross-reference the recipe search stack on our food and beverage SEO page.
Recipe hub structure that scales
The recipe hub structure runs 40 to 100 recipes at maturity, organized by hero SKU (4 to 12 recipes per SKU) plus occasion tags (breakfast, weeknight dinner, meal prep, brunch, holiday). Every recipe links back to the hero SKU product page with the SKU embedded in an inline card. The hub earns internal linking value from ingredient comparison guides and the sourcing story pages, which feeds recipe ranking on Google. According to Google Search Central recipe structured data guidance, complete Recipe schema markup is required for eligibility in the recipe carousel and the ingredient search filter.
Pillar structure for food brand content marketing
The pillar structure on content marketing for food brands runs 4 content pillars concurrently: recipe hub (40 to 100 recipes), ingredient comparison guides (12 to 24 guides), sourcing story pages (6 to 12 pages), and buyer intent content (where to buy, subscription vs. one-time, gift bundle guides). Every pillar covers a distinct search intent and every pillar links back to the hero SKU product pages.
Ingredient comparison guide format
Ingredient comparison guides run 1,800 to 3,200 words comparing 2 to 4 ingredient types on 6 to 10 attributes with a comparison table, real-world use case examples, and links to the hero SKU that uses the specific ingredient. Example: organic vs. conventional oats compares nutritional profile, sourcing chain, cost, environmental impact, and taste on a 6-column table. The brand’s SKU appears in the winning column with a product card. These guides rank 3 to 8 months after publication and pull steady-state organic traffic.
Sourcing story pages that build trust
Sourcing story pages name the specific farms, cooperatives, or suppliers the brand sources from, with photos of the farms, farmer quotes, and specific harvest windows. A coffee brand’s Ethiopian farm page ranks for “single-origin Ethiopian coffee” and “Yirgacheffe coffee origin” plus 40 long-tail variations. The sourcing page pulls trust-building traffic that converts at 4 to 6 percent because the shopper landed pattern-matching on transparency and named provenance. Every sourcing page includes farmer or cooperative quotes, harvest dates, and a link back to 3 to 5 hero SKU pages that source from the named supplier.
Vejrø hospitality content case study
Vejrø Resort, a Danish private-island destination with an on-site restaurant focused on organic, locally sourced cuisine, joined us with strong social engagement and no organic-search real estate. Guests found the resort on Instagram but never in Google search for terms like “private island resort Denmark,” “farm-to-table hospitality Denmark,” or “Vejrø restaurant.” The same organic-search gap shows up on DTC food brands running paid social at 20,000 dollars monthly with a broken blog and zero recipe schema.
We built the conversion-focused website with on-site and off-site SEO tuned to the travel-niche keyword clusters, competitor analysis against comparable boutique resorts, and mobile-first design prioritizing guest discovery. Every page carried the structured data qualifying it for Google’s rich results in the hospitality category. Every internal link pushed authority toward the direct-booking conversion path.
Three months later, Vejrø hit 10,000 plus organic visitors, ranked for 200 plus first-page keywords, and pulled a 2.2 percent booking conversion rate from organic traffic. The same pattern applies to content marketing for food brands: recipe schema, ingredient comparison guides, and sourcing story pages pull organic traffic at 20 to 40 percent conversion into hero SKU pages inside 6 months when the content quality matches search intent and every page carries the right structured data markup. Vejrø also proved out the reporting discipline: every monthly report named the exact page, the exact keyword cluster, and the exact search feature (rich result, sitelinks, image pack) driving the incremental organic revenue instead of hiding behind aggregate traffic charts.
Recipe cadence and content calendar for food brands
Recipe cadence on a working food brand content calendar ships 2 to 4 new recipes per week during the first 6 months and drops to 1 per week at maturity. Each recipe takes 4 to 6 hours to produce (write, test in the kitchen, photograph, schema author, publish). At 3 recipes per week, the brand hits 78 recipes inside 6 months plus a backlog of ingredient comparison and sourcing content queued behind the recipe production line.
| Content pillar | Target volume year 1 | Production cost per piece | Refresh cadence |
|---|---|---|---|
| Recipe hub | 40 to 100 recipes | $180 to $320 | Every 12 months |
| Ingredient comparison guides | 12 to 24 guides | $450 to $780 | Every 18 months |
| Sourcing story pages | 6 to 12 pages | $680 to $1,200 | Every 24 months |
| Buyer intent content | 8 to 16 pieces | $220 to $420 | Every 12 months |
Photography as a content calendar constraint
Photography is the actual constraint on recipe cadence, not writing. Every recipe needs 6 to 12 photos: hero shot, ingredient flat lay, prep in progress, plated result, storage, and step shots for the schema markup. A working food brand batches photography 8 recipes at a time to keep the cost per recipe under 200 dollars. Skip the batching and the per-recipe cost climbs to 400 to 600 dollars, which caps recipe cadence at 1 per week and slows organic ranking timeline by 6 months.
Seasonal content calendar planning
Seasonal content calendar planning maps recipes and comparison guides to the seasonal windows they need to rank in. A Christmas cookie recipe needs to publish in September to rank by early December. A Valentine’s chocolate guide needs to publish in November to rank by early February. A back-to-school lunchbox recipe needs to publish in June to rank by late August. The 60-to-90-day ranking curve dictates the calendar.
Creator syndication inside food brand content
Creator syndication on food brand content marketing amplifies the recipe hub through Instagram Reels, TikTok, and YouTube Shorts creators paid to post their own version of the brand’s hero recipes. The creator content pulls net-new audiences into the recipe hub through the creator’s Link in Bio or Amazon Storefront tag. The syndication calendar names 12 to 30 creators per quarter with specific recipes assigned to each.
One brand we picked up had a spreadsheet titled “creator outreach 2023” with 47 rows and 3 responses. All 3 responses were auto-replies. The spreadsheet named zero recipes and offered flat rates below 100 dollars per post. Nobody posts a 30-second video for 87 dollars flat. Nobody.
Creator content commercial terms that work
Working creator content commercial terms run 350 to 1,500 dollars flat per post plus a 12 to 25 percent commission on tagged sales across a 30-day window. The commission mechanic pulls creators into follow-up posts because the incremental revenue continues past the initial fee. Mid-tier creators (30k to 150k followers) hit the sweet spot for food brand content because their engagement rate typically runs 4 to 8 percent versus 0.8 to 1.6 percent on mega-creators.
Content brief structure for creator partnerships
The content brief structure for creator partnerships runs a single page: the SKU, the specific recipe or usage occasion, 3 required brand mentions, 3 restricted claims (no health claims on non-medical SKUs), the pricing angle, the affiliate link, and 3 example videos that hit the tone. The brief avoids over-scripting because over-scripted creator content underperforms native creator voice by 40 to 60 percent on engagement rate.
Buyer intent content for food brand blogs
Buyer intent content on food brand blogs covers 8 to 16 pieces targeting explicit purchase-decision queries: “where to buy [brand],” “[brand] subscription vs. one-time,” “best [category] for [use case],” and “[brand] gift bundle.” Every buyer intent piece runs 1,400 to 2,400 words with a comparison table, product cards, and a clear conversion path to the specific SKU that matches the query intent. Buyer intent content converts at 3 to 6 percent versus 1 to 2 percent on recipe content because the shopper landed already planning to buy, not exploring a usage occasion.
Where-to-buy content structure
Where-to-buy content structure covers online (DTC storefront, Amazon, Target.com, Whole Foods online), retail (specific chain locators with the store finder embedded), and international (customs limitations, retailer partners abroad). Every piece names specific retailers, links to the store locator, and includes an FAQ block covering shipping availability, subscription options, and gift card compatibility. Where-to-buy content ranks for branded discovery queries the DTC storefront otherwise loses to competitor affiliate reviews.
Subscription versus one-time comparison content
Subscription versus one-time comparison content converts subscription commitments at 3 to 6 percent because it addresses the price-sensitivity concern head-on with a specific math table. The piece covers the discount structure (15 percent lifetime), the skip-a-month mechanic, the pause-anytime rule, the cancellation policy, and the specific yearly savings for the brand’s average consumption cadence. Cross-reference the retention structure on our food and beverage marketing retainer page.
Content refresh cadence on food brand pillars
Content refresh cadence on food brand content pillars runs a rolling audit every 12 to 24 months by pillar. Recipes get refreshed every 12 months with new photography, updated schema, and any nutrition or ingredient adjustments. Ingredient comparison guides refresh every 18 months to update market data. Sourcing story pages refresh every 24 months to reflect farm partnership changes and new harvest angles. Buyer intent content refreshes every 12 months to update retailer availability and pricing.
Recipe refresh priority order
Recipe refresh priority runs by organic traffic rank. The top 20 recipes by monthly organic sessions get refreshed first (new photography, schema audit, related recipe internal links, updated nutrition). The next 40 get refreshed at 15 months. The remaining recipes get refreshed opportunistically when the ranking slips past position 15 in Google. Skipping the refresh cadence lets recipe rankings drift out of the top 3 inside 18 months as newer competitor recipes take the position.
Schema audit checklist per refresh
The schema audit checklist per refresh runs 8 items: Recipe schema completeness, aggregateRating count and accuracy, nutrition data accuracy, prepTime and cookTime match the recipe body, image URLs valid at CDN, related recipe internal links working, product card SKU URL live, and Google Search Console rich result eligibility validated. This checklist takes 20 minutes per recipe and prevents the schema drift that costs recipe rankings 20 to 40 positions quietly.
Reporting cadence for food brand content marketing
Reporting cadence on food brand content marketing runs a monthly executive report plus a quarterly business review. The monthly report ships in the first business week and covers organic sessions by pillar, top 10 ranking recipes with position trend, ingredient guide ranking movements, sourcing page performance, and organic-attributed DTC revenue. Every number carries a comparison to the prior month and a plain-language interpretation the founder reads in 7 minutes.
Metrics that matter for content marketing
Metrics that matter for food brand content marketing: organic sessions by pillar, recipe rich result impressions in Search Console, organic conversion rate to hero SKU pages, organic-attributed DTC revenue, and top 20 ranking positions by monthly organic sessions. Vanity metrics that do not matter: total pageviews without conversion context, average time on page without conversion attribution, and social share counts. The monthly report skips the vanity block entirely.
Quarterly business review structure
The quarterly business review runs 90 minutes with the founder, head of content, and SEO lead. Agenda: organic traffic trend by pillar, top 10 winning content pieces, top 10 losing content pieces (candidates for refresh or removal), competitive gap analysis against 5 named competitor brands, and next quarter’s content calendar with recipes and ingredient guides queued. According to Ahrefs content marketing research, brands running quarterly content audits outperform brands running annual audits by 40 to 70 percent on organic revenue over a 24-month window.
Internal linking discipline across food brand content
Internal linking discipline across food brand content moves authority from recipe pages toward hero SKU product pages and comparison guides. Every recipe links to the hero SKU it uses inline (once in the ingredient list, once in a bottom call-out card). Every ingredient comparison guide links to 3 to 6 recipes using the winning ingredient plus the hero SKU product page. Every sourcing story links to the 2 to 4 SKUs sourced from that specific farm or cooperative.
Anchor text strategy across recipe hubs
Anchor text on internal links varies across recipe hubs to avoid over-optimization patterns Google penalizes. Exact-match anchor (“single-origin Ethiopian coffee”) runs on 20 to 30 percent of internal links. Partial-match variations (“our Ethiopian roast”) run on 30 to 40 percent. Branded anchors (the SKU name) run on 20 to 30 percent. Generic anchors (“shop the coffee”) fill the remaining 10 to 20 percent. This ratio holds ranking without triggering the over-optimization penalty that shows up on brands that anchor-text-stuff every internal link with the same exact-match keyword. Cross-reference the linking layer on our food and beverage web design page.
Link equity from ingredient guides to SKU pages
Link equity from ingredient guides passes to SKU pages when the guide’s comparison table names the hero SKU in the winning column with a product card, and when the guide’s body links to 3 to 6 recipes that use the winning ingredient. This 3-hop path (guide to recipe to SKU) pushes authority from a high-traffic informational query down to a high-intent transactional page. According to Search Engine Land SEO coverage, informational content that internally links to transactional pages produces 2 to 4 times higher organic revenue than isolated content silos.
Wrapping up content marketing for food brands
Content marketing for food brands is the organic engine that turns a DTC snack, drink, or CPG storefront into a search-driven revenue channel. Recipe hub of 40 to 100 recipes. Ingredient comparison guides at 12 to 24 pieces. Sourcing story pages at 6 to 12 pieces. Buyer intent content at 8 to 16 pieces. Creator syndication calendar with 12 to 30 creators per quarter. Refresh cadence at 12 to 24 months by pillar. Reporting with organic sessions and organic revenue attribution.
If your DTC food brand is running paid social at 20,000 dollars monthly with a broken blog and zero recipe schema, professional content marketing for food brands pays for itself inside the first 90 days on organic traffic captured. Redefine Web ships content marketing inside our monthly retainer packages. Book a call and we will walk through the last three DTC food brands we built recipe hubs for, pillar by pillar.
Content marketing for food brands starts with a recipe hub because recipe queries account for 40 to 60 percent of high-intent search volume in the food category. Every hero SKU needs 4 to 12 recipes anchored to it, each targeting a specific occasion and audience.
Skip the recipe hub and the brand loses the search real estate that pulls DTC storefront traffic month over month at zero incremental paid cost. Recipe traffic converts at 2 to 4 percent because the shopper landed with usage intent, not passive discovery, which is why food brands win on recipes.
Recipe schema and Google rich result eligibility
Every recipe page ships schema.org Recipe markup including cookTime, prepTime, recipeIngredient, recipeInstructions, nutrition, and aggregateRating. Correctly marked-up recipes qualify for Google’s recipe rich result carousel that pulls 3 to 6 times higher click-through rate than a plain blue link. The schema layer takes 15 minutes per recipe to author and 30 minutes to validate in Google Search Console. Cross-reference the recipe search stack on our food and beverage SEO page.
Recipe hub structure that scales
The recipe hub structure runs 40 to 100 recipes at maturity, organized by hero SKU (4 to 12 recipes per SKU) plus occasion tags (breakfast, weeknight dinner, meal prep, brunch, holiday). Every recipe links back to the hero SKU product page with the SKU embedded in an inline card. The hub earns internal linking value from ingredient comparison guides and the sourcing story pages, which feeds recipe ranking on Google. According to Google Search Central recipe structured data guidance, complete Recipe schema markup is required for eligibility in the recipe carousel and the ingredient search filter.
Pillar structure for food brand content marketing
The pillar structure on content marketing for food brands runs 4 content pillars concurrently: recipe hub (40 to 100 recipes), ingredient comparison guides (12 to 24 guides), sourcing story pages (6 to 12 pages), and buyer intent content (where to buy, subscription vs. one-time, gift bundle guides). Every pillar covers a distinct search intent and every pillar links back to the hero SKU product pages.
Ingredient comparison guide format
Ingredient comparison guides run 1,800 to 3,200 words comparing 2 to 4 ingredient types on 6 to 10 attributes with a comparison table, real-world use case examples, and links to the hero SKU that uses the specific ingredient. Example: organic vs. conventional oats compares nutritional profile, sourcing chain, cost, environmental impact, and taste on a 6-column table. The brand’s SKU appears in the winning column with a product card. These guides rank 3 to 8 months after publication and pull steady-state organic traffic.
Sourcing story pages that build trust
Sourcing story pages name the specific farms, cooperatives, or suppliers the brand sources from, with photos of the farms, farmer quotes, and specific harvest windows. A coffee brand’s Ethiopian farm page ranks for “single-origin Ethiopian coffee” and “Yirgacheffe coffee origin” plus 40 long-tail variations. The sourcing page pulls trust-building traffic that converts at 4 to 6 percent because the shopper landed pattern-matching on transparency and named provenance. Every sourcing page includes farmer or cooperative quotes, harvest dates, and a link back to 3 to 5 hero SKU pages that source from the named supplier.
Vejrø hospitality content case study
Vejrø Resort, a Danish private-island destination with an on-site restaurant focused on organic, locally sourced cuisine, joined us with strong social engagement and no organic-search real estate. Guests found the resort on Instagram but never in Google search for terms like “private island resort Denmark,” “farm-to-table hospitality Denmark,” or “Vejrø restaurant.” The same organic-search gap shows up on DTC food brands running paid social at 20,000 dollars monthly with a broken blog and zero recipe schema.
We built the conversion-focused website with on-site and off-site SEO tuned to the travel-niche keyword clusters, competitor analysis against comparable boutique resorts, and mobile-first design prioritizing guest discovery. Every page carried the structured data qualifying it for Google’s rich results in the hospitality category. Every internal link pushed authority toward the direct-booking conversion path.
Three months later, Vejrø hit 10,000 plus organic visitors, ranked for 200 plus first-page keywords, and pulled a 2.2 percent booking conversion rate from organic traffic. The same pattern applies to content marketing for food brands: recipe schema, ingredient comparison guides, and sourcing story pages pull organic traffic at 20 to 40 percent conversion into hero SKU pages inside 6 months when the content quality matches search intent and every page carries the right structured data markup. Vejrø also proved out the reporting discipline: every monthly report named the exact page, the exact keyword cluster, and the exact search feature (rich result, sitelinks, image pack) driving the incremental organic revenue instead of hiding behind aggregate traffic charts.
Recipe cadence and content calendar for food brands
Recipe cadence on a working food brand content calendar ships 2 to 4 new recipes per week during the first 6 months and drops to 1 per week at maturity. Each recipe takes 4 to 6 hours to produce (write, test in the kitchen, photograph, schema author, publish). At 3 recipes per week, the brand hits 78 recipes inside 6 months plus a backlog of ingredient comparison and sourcing content queued behind the recipe production line.
| Content pillar | Target volume year 1 | Production cost per piece | Refresh cadence |
|---|---|---|---|
| Recipe hub | 40 to 100 recipes | $180 to $320 | Every 12 months |
| Ingredient comparison guides | 12 to 24 guides | $450 to $780 | Every 18 months |
| Sourcing story pages | 6 to 12 pages | $680 to $1,200 | Every 24 months |
| Buyer intent content | 8 to 16 pieces | $220 to $420 | Every 12 months |
Photography as a content calendar constraint
Photography is the actual constraint on recipe cadence, not writing. Every recipe needs 6 to 12 photos: hero shot, ingredient flat lay, prep in progress, plated result, storage, and step shots for the schema markup. A working food brand batches photography 8 recipes at a time to keep the cost per recipe under 200 dollars. Skip the batching and the per-recipe cost climbs to 400 to 600 dollars, which caps recipe cadence at 1 per week and slows organic ranking timeline by 6 months.
Seasonal content calendar planning
Seasonal content calendar planning maps recipes and comparison guides to the seasonal windows they need to rank in. A Christmas cookie recipe needs to publish in September to rank by early December. A Valentine’s chocolate guide needs to publish in November to rank by early February. A back-to-school lunchbox recipe needs to publish in June to rank by late August. The 60-to-90-day ranking curve dictates the calendar.
Creator syndication inside food brand content
Creator syndication on food brand content marketing amplifies the recipe hub through Instagram Reels, TikTok, and YouTube Shorts creators paid to post their own version of the brand’s hero recipes. The creator content pulls net-new audiences into the recipe hub through the creator’s Link in Bio or Amazon Storefront tag. The syndication calendar names 12 to 30 creators per quarter with specific recipes assigned to each.
One brand we picked up had a spreadsheet titled “creator outreach 2023” with 47 rows and 3 responses. All 3 responses were auto-replies. The spreadsheet named zero recipes and offered flat rates below 100 dollars per post. Nobody posts a 30-second video for 87 dollars flat. Nobody.
Creator content commercial terms that work
Working creator content commercial terms run 350 to 1,500 dollars flat per post plus a 12 to 25 percent commission on tagged sales across a 30-day window. The commission mechanic pulls creators into follow-up posts because the incremental revenue continues past the initial fee. Mid-tier creators (30k to 150k followers) hit the sweet spot for food brand content because their engagement rate typically runs 4 to 8 percent versus 0.8 to 1.6 percent on mega-creators.
Content brief structure for creator partnerships
The content brief structure for creator partnerships runs a single page: the SKU, the specific recipe or usage occasion, 3 required brand mentions, 3 restricted claims (no health claims on non-medical SKUs), the pricing angle, the affiliate link, and 3 example videos that hit the tone. The brief avoids over-scripting because over-scripted creator content underperforms native creator voice by 40 to 60 percent on engagement rate.
Buyer intent content for food brand blogs
Buyer intent content on food brand blogs covers 8 to 16 pieces targeting explicit purchase-decision queries: “where to buy [brand],” “[brand] subscription vs. one-time,” “best [category] for [use case],” and “[brand] gift bundle.” Every buyer intent piece runs 1,400 to 2,400 words with a comparison table, product cards, and a clear conversion path to the specific SKU that matches the query intent. Buyer intent content converts at 3 to 6 percent versus 1 to 2 percent on recipe content because the shopper landed already planning to buy, not exploring a usage occasion.
Where-to-buy content structure
Where-to-buy content structure covers online (DTC storefront, Amazon, Target.com, Whole Foods online), retail (specific chain locators with the store finder embedded), and international (customs limitations, retailer partners abroad). Every piece names specific retailers, links to the store locator, and includes an FAQ block covering shipping availability, subscription options, and gift card compatibility. Where-to-buy content ranks for branded discovery queries the DTC storefront otherwise loses to competitor affiliate reviews.
Subscription versus one-time comparison content
Subscription versus one-time comparison content converts subscription commitments at 3 to 6 percent because it addresses the price-sensitivity concern head-on with a specific math table. The piece covers the discount structure (15 percent lifetime), the skip-a-month mechanic, the pause-anytime rule, the cancellation policy, and the specific yearly savings for the brand’s average consumption cadence. Cross-reference the retention structure on our food and beverage marketing retainer page.
Content refresh cadence on food brand pillars
Content refresh cadence on food brand content pillars runs a rolling audit every 12 to 24 months by pillar. Recipes get refreshed every 12 months with new photography, updated schema, and any nutrition or ingredient adjustments. Ingredient comparison guides refresh every 18 months to update market data. Sourcing story pages refresh every 24 months to reflect farm partnership changes and new harvest angles. Buyer intent content refreshes every 12 months to update retailer availability and pricing.
Recipe refresh priority order
Recipe refresh priority runs by organic traffic rank. The top 20 recipes by monthly organic sessions get refreshed first (new photography, schema audit, related recipe internal links, updated nutrition). The next 40 get refreshed at 15 months. The remaining recipes get refreshed opportunistically when the ranking slips past position 15 in Google. Skipping the refresh cadence lets recipe rankings drift out of the top 3 inside 18 months as newer competitor recipes take the position.
Schema audit checklist per refresh
The schema audit checklist per refresh runs 8 items: Recipe schema completeness, aggregateRating count and accuracy, nutrition data accuracy, prepTime and cookTime match the recipe body, image URLs valid at CDN, related recipe internal links working, product card SKU URL live, and Google Search Console rich result eligibility validated. This checklist takes 20 minutes per recipe and prevents the schema drift that costs recipe rankings 20 to 40 positions quietly.
Reporting cadence for food brand content marketing
Reporting cadence on food brand content marketing runs a monthly executive report plus a quarterly business review. The monthly report ships in the first business week and covers organic sessions by pillar, top 10 ranking recipes with position trend, ingredient guide ranking movements, sourcing page performance, and organic-attributed DTC revenue. Every number carries a comparison to the prior month and a plain-language interpretation the founder reads in 7 minutes.
Metrics that matter for content marketing
Metrics that matter for food brand content marketing: organic sessions by pillar, recipe rich result impressions in Search Console, organic conversion rate to hero SKU pages, organic-attributed DTC revenue, and top 20 ranking positions by monthly organic sessions. Vanity metrics that do not matter: total pageviews without conversion context, average time on page without conversion attribution, and social share counts. The monthly report skips the vanity block entirely.
Quarterly business review structure
The quarterly business review runs 90 minutes with the founder, head of content, and SEO lead. Agenda: organic traffic trend by pillar, top 10 winning content pieces, top 10 losing content pieces (candidates for refresh or removal), competitive gap analysis against 5 named competitor brands, and next quarter’s content calendar with recipes and ingredient guides queued. According to Ahrefs content marketing research, brands running quarterly content audits outperform brands running annual audits by 40 to 70 percent on organic revenue over a 24-month window.
Internal linking discipline across food brand content
Internal linking discipline across food brand content moves authority from recipe pages toward hero SKU product pages and comparison guides. Every recipe links to the hero SKU it uses inline (once in the ingredient list, once in a bottom call-out card). Every ingredient comparison guide links to 3 to 6 recipes using the winning ingredient plus the hero SKU product page. Every sourcing story links to the 2 to 4 SKUs sourced from that specific farm or cooperative.
Anchor text strategy across recipe hubs
Anchor text on internal links varies across recipe hubs to avoid over-optimization patterns Google penalizes. Exact-match anchor (“single-origin Ethiopian coffee”) runs on 20 to 30 percent of internal links. Partial-match variations (“our Ethiopian roast”) run on 30 to 40 percent. Branded anchors (the SKU name) run on 20 to 30 percent. Generic anchors (“shop the coffee”) fill the remaining 10 to 20 percent. This ratio holds ranking without triggering the over-optimization penalty that shows up on brands that anchor-text-stuff every internal link with the same exact-match keyword. Cross-reference the linking layer on our food and beverage web design page.
Link equity from ingredient guides to SKU pages
Link equity from ingredient guides passes to SKU pages when the guide’s comparison table names the hero SKU in the winning column with a product card, and when the guide’s body links to 3 to 6 recipes that use the winning ingredient. This 3-hop path (guide to recipe to SKU) pushes authority from a high-traffic informational query down to a high-intent transactional page. According to Search Engine Land SEO coverage, informational content that internally links to transactional pages produces 2 to 4 times higher organic revenue than isolated content silos.
Wrapping up content marketing for food brands
Content marketing for food brands is the organic engine that turns a DTC snack, drink, or CPG storefront into a search-driven revenue channel. Recipe hub of 40 to 100 recipes. Ingredient comparison guides at 12 to 24 pieces. Sourcing story pages at 6 to 12 pieces. Buyer intent content at 8 to 16 pieces. Creator syndication calendar with 12 to 30 creators per quarter. Refresh cadence at 12 to 24 months by pillar. Reporting with organic sessions and organic revenue attribution.
If your DTC food brand is running paid social at 20,000 dollars monthly with a broken blog and zero recipe schema, professional content marketing for food brands pays for itself inside the first 90 days on organic traffic captured. Redefine Web ships content marketing inside our monthly retainer packages. Book a call and we will walk through the last three DTC food brands we built recipe hubs for, pillar by pillar.
Content marketing for food brands starts with a recipe hub because recipe queries account for 40 to 60 percent of high-intent search volume in the food category. Every hero SKU needs 4 to 12 recipes anchored to it, each targeting a specific occasion and audience.
Skip the recipe hub and the brand loses the search real estate that pulls DTC storefront traffic month over month at zero incremental paid cost. Recipe traffic converts at 2 to 4 percent because the shopper landed with usage intent, not passive discovery, which is why food brands win on recipes.
Recipe schema and Google rich result eligibility
Every recipe page ships schema.org Recipe markup including cookTime, prepTime, recipeIngredient, recipeInstructions, nutrition, and aggregateRating. Correctly marked-up recipes qualify for Google’s recipe rich result carousel that pulls 3 to 6 times higher click-through rate than a plain blue link. The schema layer takes 15 minutes per recipe to author and 30 minutes to validate in Google Search Console. Cross-reference the recipe search stack on our food and beverage SEO page.
Recipe hub structure that scales
The recipe hub structure runs 40 to 100 recipes at maturity, organized by hero SKU (4 to 12 recipes per SKU) plus occasion tags (breakfast, weeknight dinner, meal prep, brunch, holiday). Every recipe links back to the hero SKU product page with the SKU embedded in an inline card. The hub earns internal linking value from ingredient comparison guides and the sourcing story pages, which feeds recipe ranking on Google. According to Google Search Central recipe structured data guidance, complete Recipe schema markup is required for eligibility in the recipe carousel and the ingredient search filter.
Pillar structure for food brand content marketing
The pillar structure on content marketing for food brands runs 4 content pillars concurrently: recipe hub (40 to 100 recipes), ingredient comparison guides (12 to 24 guides), sourcing story pages (6 to 12 pages), and buyer intent content (where to buy, subscription vs. one-time, gift bundle guides). Every pillar covers a distinct search intent and every pillar links back to the hero SKU product pages.
Ingredient comparison guide format
Ingredient comparison guides run 1,800 to 3,200 words comparing 2 to 4 ingredient types on 6 to 10 attributes with a comparison table, real-world use case examples, and links to the hero SKU that uses the specific ingredient. Example: organic vs. conventional oats compares nutritional profile, sourcing chain, cost, environmental impact, and taste on a 6-column table. The brand’s SKU appears in the winning column with a product card. These guides rank 3 to 8 months after publication and pull steady-state organic traffic.
Sourcing story pages that build trust
Sourcing story pages name the specific farms, cooperatives, or suppliers the brand sources from, with photos of the farms, farmer quotes, and specific harvest windows. A coffee brand’s Ethiopian farm page ranks for “single-origin Ethiopian coffee” and “Yirgacheffe coffee origin” plus 40 long-tail variations. The sourcing page pulls trust-building traffic that converts at 4 to 6 percent because the shopper landed pattern-matching on transparency and named provenance. Every sourcing page includes farmer or cooperative quotes, harvest dates, and a link back to 3 to 5 hero SKU pages that source from the named supplier.
Vejrø hospitality content case study
Vejrø Resort, a Danish private-island destination with an on-site restaurant focused on organic, locally sourced cuisine, joined us with strong social engagement and no organic-search real estate. Guests found the resort on Instagram but never in Google search for terms like “private island resort Denmark,” “farm-to-table hospitality Denmark,” or “Vejrø restaurant.” The same organic-search gap shows up on DTC food brands running paid social at 20,000 dollars monthly with a broken blog and zero recipe schema.
We built the conversion-focused website with on-site and off-site SEO tuned to the travel-niche keyword clusters, competitor analysis against comparable boutique resorts, and mobile-first design prioritizing guest discovery. Every page carried the structured data qualifying it for Google’s rich results in the hospitality category. Every internal link pushed authority toward the direct-booking conversion path.
Three months later, Vejrø hit 10,000 plus organic visitors, ranked for 200 plus first-page keywords, and pulled a 2.2 percent booking conversion rate from organic traffic. The same pattern applies to content marketing for food brands: recipe schema, ingredient comparison guides, and sourcing story pages pull organic traffic at 20 to 40 percent conversion into hero SKU pages inside 6 months when the content quality matches search intent and every page carries the right structured data markup. Vejrø also proved out the reporting discipline: every monthly report named the exact page, the exact keyword cluster, and the exact search feature (rich result, sitelinks, image pack) driving the incremental organic revenue instead of hiding behind aggregate traffic charts.
Recipe cadence and content calendar for food brands
Recipe cadence on a working food brand content calendar ships 2 to 4 new recipes per week during the first 6 months and drops to 1 per week at maturity. Each recipe takes 4 to 6 hours to produce (write, test in the kitchen, photograph, schema author, publish). At 3 recipes per week, the brand hits 78 recipes inside 6 months plus a backlog of ingredient comparison and sourcing content queued behind the recipe production line.
| Content pillar | Target volume year 1 | Production cost per piece | Refresh cadence |
|---|---|---|---|
| Recipe hub | 40 to 100 recipes | $180 to $320 | Every 12 months |
| Ingredient comparison guides | 12 to 24 guides | $450 to $780 | Every 18 months |
| Sourcing story pages | 6 to 12 pages | $680 to $1,200 | Every 24 months |
| Buyer intent content | 8 to 16 pieces | $220 to $420 | Every 12 months |
Photography as a content calendar constraint
Photography is the actual constraint on recipe cadence, not writing. Every recipe needs 6 to 12 photos: hero shot, ingredient flat lay, prep in progress, plated result, storage, and step shots for the schema markup. A working food brand batches photography 8 recipes at a time to keep the cost per recipe under 200 dollars. Skip the batching and the per-recipe cost climbs to 400 to 600 dollars, which caps recipe cadence at 1 per week and slows organic ranking timeline by 6 months.
Seasonal content calendar planning
Seasonal content calendar planning maps recipes and comparison guides to the seasonal windows they need to rank in. A Christmas cookie recipe needs to publish in September to rank by early December. A Valentine’s chocolate guide needs to publish in November to rank by early February. A back-to-school lunchbox recipe needs to publish in June to rank by late August. The 60-to-90-day ranking curve dictates the calendar.
Creator syndication inside food brand content
Creator syndication on food brand content marketing amplifies the recipe hub through Instagram Reels, TikTok, and YouTube Shorts creators paid to post their own version of the brand’s hero recipes. The creator content pulls net-new audiences into the recipe hub through the creator’s Link in Bio or Amazon Storefront tag. The syndication calendar names 12 to 30 creators per quarter with specific recipes assigned to each.
One brand we picked up had a spreadsheet titled “creator outreach 2023” with 47 rows and 3 responses. All 3 responses were auto-replies. The spreadsheet named zero recipes and offered flat rates below 100 dollars per post. Nobody posts a 30-second video for 87 dollars flat. Nobody.
Creator content commercial terms that work
Working creator content commercial terms run 350 to 1,500 dollars flat per post plus a 12 to 25 percent commission on tagged sales across a 30-day window. The commission mechanic pulls creators into follow-up posts because the incremental revenue continues past the initial fee. Mid-tier creators (30k to 150k followers) hit the sweet spot for food brand content because their engagement rate typically runs 4 to 8 percent versus 0.8 to 1.6 percent on mega-creators.
Content brief structure for creator partnerships
The content brief structure for creator partnerships runs a single page: the SKU, the specific recipe or usage occasion, 3 required brand mentions, 3 restricted claims (no health claims on non-medical SKUs), the pricing angle, the affiliate link, and 3 example videos that hit the tone. The brief avoids over-scripting because over-scripted creator content underperforms native creator voice by 40 to 60 percent on engagement rate.
Buyer intent content for food brand blogs
Buyer intent content on food brand blogs covers 8 to 16 pieces targeting explicit purchase-decision queries: “where to buy [brand],” “[brand] subscription vs. one-time,” “best [category] for [use case],” and “[brand] gift bundle.” Every buyer intent piece runs 1,400 to 2,400 words with a comparison table, product cards, and a clear conversion path to the specific SKU that matches the query intent. Buyer intent content converts at 3 to 6 percent versus 1 to 2 percent on recipe content because the shopper landed already planning to buy, not exploring a usage occasion.
Where-to-buy content structure
Where-to-buy content structure covers online (DTC storefront, Amazon, Target.com, Whole Foods online), retail (specific chain locators with the store finder embedded), and international (customs limitations, retailer partners abroad). Every piece names specific retailers, links to the store locator, and includes an FAQ block covering shipping availability, subscription options, and gift card compatibility. Where-to-buy content ranks for branded discovery queries the DTC storefront otherwise loses to competitor affiliate reviews.
Subscription versus one-time comparison content
Subscription versus one-time comparison content converts subscription commitments at 3 to 6 percent because it addresses the price-sensitivity concern head-on with a specific math table. The piece covers the discount structure (15 percent lifetime), the skip-a-month mechanic, the pause-anytime rule, the cancellation policy, and the specific yearly savings for the brand’s average consumption cadence. Cross-reference the retention structure on our food and beverage marketing retainer page.
Content refresh cadence on food brand pillars
Content refresh cadence on food brand content pillars runs a rolling audit every 12 to 24 months by pillar. Recipes get refreshed every 12 months with new photography, updated schema, and any nutrition or ingredient adjustments. Ingredient comparison guides refresh every 18 months to update market data. Sourcing story pages refresh every 24 months to reflect farm partnership changes and new harvest angles. Buyer intent content refreshes every 12 months to update retailer availability and pricing.
Recipe refresh priority order
Recipe refresh priority runs by organic traffic rank. The top 20 recipes by monthly organic sessions get refreshed first (new photography, schema audit, related recipe internal links, updated nutrition). The next 40 get refreshed at 15 months. The remaining recipes get refreshed opportunistically when the ranking slips past position 15 in Google. Skipping the refresh cadence lets recipe rankings drift out of the top 3 inside 18 months as newer competitor recipes take the position.
Schema audit checklist per refresh
The schema audit checklist per refresh runs 8 items: Recipe schema completeness, aggregateRating count and accuracy, nutrition data accuracy, prepTime and cookTime match the recipe body, image URLs valid at CDN, related recipe internal links working, product card SKU URL live, and Google Search Console rich result eligibility validated. This checklist takes 20 minutes per recipe and prevents the schema drift that costs recipe rankings 20 to 40 positions quietly.
Reporting cadence for food brand content marketing
Reporting cadence on food brand content marketing runs a monthly executive report plus a quarterly business review. The monthly report ships in the first business week and covers organic sessions by pillar, top 10 ranking recipes with position trend, ingredient guide ranking movements, sourcing page performance, and organic-attributed DTC revenue. Every number carries a comparison to the prior month and a plain-language interpretation the founder reads in 7 minutes.
Metrics that matter for content marketing
Metrics that matter for food brand content marketing: organic sessions by pillar, recipe rich result impressions in Search Console, organic conversion rate to hero SKU pages, organic-attributed DTC revenue, and top 20 ranking positions by monthly organic sessions. Vanity metrics that do not matter: total pageviews without conversion context, average time on page without conversion attribution, and social share counts. The monthly report skips the vanity block entirely.
Quarterly business review structure
The quarterly business review runs 90 minutes with the founder, head of content, and SEO lead. Agenda: organic traffic trend by pillar, top 10 winning content pieces, top 10 losing content pieces (candidates for refresh or removal), competitive gap analysis against 5 named competitor brands, and next quarter’s content calendar with recipes and ingredient guides queued. According to Ahrefs content marketing research, brands running quarterly content audits outperform brands running annual audits by 40 to 70 percent on organic revenue over a 24-month window.
Internal linking discipline across food brand content
Internal linking discipline across food brand content moves authority from recipe pages toward hero SKU product pages and comparison guides. Every recipe links to the hero SKU it uses inline (once in the ingredient list, once in a bottom call-out card). Every ingredient comparison guide links to 3 to 6 recipes using the winning ingredient plus the hero SKU product page. Every sourcing story links to the 2 to 4 SKUs sourced from that specific farm or cooperative.
Anchor text strategy across recipe hubs
Anchor text on internal links varies across recipe hubs to avoid over-optimization patterns Google penalizes. Exact-match anchor (“single-origin Ethiopian coffee”) runs on 20 to 30 percent of internal links. Partial-match variations (“our Ethiopian roast”) run on 30 to 40 percent. Branded anchors (the SKU name) run on 20 to 30 percent. Generic anchors (“shop the coffee”) fill the remaining 10 to 20 percent. This ratio holds ranking without triggering the over-optimization penalty that shows up on brands that anchor-text-stuff every internal link with the same exact-match keyword. Cross-reference the linking layer on our food and beverage web design page.
Link equity from ingredient guides to SKU pages
Link equity from ingredient guides passes to SKU pages when the guide’s comparison table names the hero SKU in the winning column with a product card, and when the guide’s body links to 3 to 6 recipes that use the winning ingredient. This 3-hop path (guide to recipe to SKU) pushes authority from a high-traffic informational query down to a high-intent transactional page. According to Search Engine Land SEO coverage, informational content that internally links to transactional pages produces 2 to 4 times higher organic revenue than isolated content silos.
Wrapping up content marketing for food brands
Content marketing for food brands is the organic engine that turns a DTC snack, drink, or CPG storefront into a search-driven revenue channel. Recipe hub of 40 to 100 recipes. Ingredient comparison guides at 12 to 24 pieces. Sourcing story pages at 6 to 12 pieces. Buyer intent content at 8 to 16 pieces. Creator syndication calendar with 12 to 30 creators per quarter. Refresh cadence at 12 to 24 months by pillar. Reporting with organic sessions and organic revenue attribution.
If your DTC food brand is running paid social at 20,000 dollars monthly with a broken blog and zero recipe schema, professional content marketing for food brands pays for itself inside the first 90 days on organic traffic captured. Redefine Web ships content marketing inside our monthly retainer packages. Book a call and we will walk through the last three DTC food brands we built recipe hubs for, pillar by pillar.
Internal linking discipline across food brand content moves authority from recipe pages toward hero SKU product pages and comparison guides. Every recipe links to the hero SKU it uses inline (once in the ingredient list, once in a bottom call-out card). Every ingredient comparison guide links to 3 to 6 recipes using the winning ingredient plus the hero SKU product page. Every sourcing story links to the 2 to 4 SKUs sourced from that specific farm or cooperative.
Anchor text strategy across recipe hubs
Anchor text on internal links varies across recipe hubs to avoid over-optimization patterns Google penalizes. Exact-match anchor (“single-origin Ethiopian coffee”) runs on 20 to 30 percent of internal links. Partial-match variations (“our Ethiopian roast”) run on 30 to 40 percent. Branded anchors (the SKU name) run on 20 to 30 percent. Generic anchors (“shop the coffee”) fill the remaining 10 to 20 percent. This ratio holds ranking without triggering the over-optimization penalty that shows up on brands that anchor-text-stuff every internal link with the same exact-match keyword. Cross-reference the linking layer on our food and beverage web design page.
Link equity from ingredient guides to SKU pages
Link equity from ingredient guides passes to SKU pages when the guide’s comparison table names the hero SKU in the winning column with a product card, and when the guide’s body links to 3 to 6 recipes that use the winning ingredient. This 3-hop path (guide to recipe to SKU) pushes authority from a high-traffic informational query down to a high-intent transactional page. According to Search Engine Land SEO coverage, informational content that internally links to transactional pages produces 2 to 4 times higher organic revenue than isolated content silos.
Wrapping up content marketing for food brands
Content marketing for food brands is the organic engine that turns a DTC snack, drink, or CPG storefront into a search-driven revenue channel. Recipe hub of 40 to 100 recipes. Ingredient comparison guides at 12 to 24 pieces. Sourcing story pages at 6 to 12 pieces. Buyer intent content at 8 to 16 pieces. Creator syndication calendar with 12 to 30 creators per quarter. Refresh cadence at 12 to 24 months by pillar. Reporting with organic sessions and organic revenue attribution.
If your DTC food brand is running paid social at 20,000 dollars monthly with a broken blog and zero recipe schema, professional content marketing for food brands pays for itself inside the first 90 days on organic traffic captured. Redefine Web ships content marketing inside our monthly retainer packages. Book a call and we will walk through the last three DTC food brands we built recipe hubs for, pillar by pillar.
Content marketing for food brands starts with a recipe hub because recipe queries account for 40 to 60 percent of high-intent search volume in the food category. Every hero SKU needs 4 to 12 recipes anchored to it, each targeting a specific occasion and audience.
Skip the recipe hub and the brand loses the search real estate that pulls DTC storefront traffic month over month at zero incremental paid cost. Recipe traffic converts at 2 to 4 percent because the shopper landed with usage intent, not passive discovery, which is why food brands win on recipes.
Recipe schema and Google rich result eligibility
Every recipe page ships schema.org Recipe markup including cookTime, prepTime, recipeIngredient, recipeInstructions, nutrition, and aggregateRating. Correctly marked-up recipes qualify for Google’s recipe rich result carousel that pulls 3 to 6 times higher click-through rate than a plain blue link. The schema layer takes 15 minutes per recipe to author and 30 minutes to validate in Google Search Console. Cross-reference the recipe search stack on our food and beverage SEO page.
Recipe hub structure that scales
The recipe hub structure runs 40 to 100 recipes at maturity, organized by hero SKU (4 to 12 recipes per SKU) plus occasion tags (breakfast, weeknight dinner, meal prep, brunch, holiday). Every recipe links back to the hero SKU product page with the SKU embedded in an inline card. The hub earns internal linking value from ingredient comparison guides and the sourcing story pages, which feeds recipe ranking on Google. According to Google Search Central recipe structured data guidance, complete Recipe schema markup is required for eligibility in the recipe carousel and the ingredient search filter.
Pillar structure for food brand content marketing
The pillar structure on content marketing for food brands runs 4 content pillars concurrently: recipe hub (40 to 100 recipes), ingredient comparison guides (12 to 24 guides), sourcing story pages (6 to 12 pages), and buyer intent content (where to buy, subscription vs. one-time, gift bundle guides). Every pillar covers a distinct search intent and every pillar links back to the hero SKU product pages.
Ingredient comparison guide format
Ingredient comparison guides run 1,800 to 3,200 words comparing 2 to 4 ingredient types on 6 to 10 attributes with a comparison table, real-world use case examples, and links to the hero SKU that uses the specific ingredient. Example: organic vs. conventional oats compares nutritional profile, sourcing chain, cost, environmental impact, and taste on a 6-column table. The brand’s SKU appears in the winning column with a product card. These guides rank 3 to 8 months after publication and pull steady-state organic traffic.
Sourcing story pages that build trust
Sourcing story pages name the specific farms, cooperatives, or suppliers the brand sources from, with photos of the farms, farmer quotes, and specific harvest windows. A coffee brand’s Ethiopian farm page ranks for “single-origin Ethiopian coffee” and “Yirgacheffe coffee origin” plus 40 long-tail variations. The sourcing page pulls trust-building traffic that converts at 4 to 6 percent because the shopper landed pattern-matching on transparency and named provenance. Every sourcing page includes farmer or cooperative quotes, harvest dates, and a link back to 3 to 5 hero SKU pages that source from the named supplier.
Vejrø hospitality content case study
Vejrø Resort, a Danish private-island destination with an on-site restaurant focused on organic, locally sourced cuisine, joined us with strong social engagement and no organic-search real estate. Guests found the resort on Instagram but never in Google search for terms like “private island resort Denmark,” “farm-to-table hospitality Denmark,” or “Vejrø restaurant.” The same organic-search gap shows up on DTC food brands running paid social at 20,000 dollars monthly with a broken blog and zero recipe schema.
We built the conversion-focused website with on-site and off-site SEO tuned to the travel-niche keyword clusters, competitor analysis against comparable boutique resorts, and mobile-first design prioritizing guest discovery. Every page carried the structured data qualifying it for Google’s rich results in the hospitality category. Every internal link pushed authority toward the direct-booking conversion path.
Three months later, Vejrø hit 10,000 plus organic visitors, ranked for 200 plus first-page keywords, and pulled a 2.2 percent booking conversion rate from organic traffic. The same pattern applies to content marketing for food brands: recipe schema, ingredient comparison guides, and sourcing story pages pull organic traffic at 20 to 40 percent conversion into hero SKU pages inside 6 months when the content quality matches search intent and every page carries the right structured data markup. Vejrø also proved out the reporting discipline: every monthly report named the exact page, the exact keyword cluster, and the exact search feature (rich result, sitelinks, image pack) driving the incremental organic revenue instead of hiding behind aggregate traffic charts.
Recipe cadence and content calendar for food brands
Recipe cadence on a working food brand content calendar ships 2 to 4 new recipes per week during the first 6 months and drops to 1 per week at maturity. Each recipe takes 4 to 6 hours to produce (write, test in the kitchen, photograph, schema author, publish). At 3 recipes per week, the brand hits 78 recipes inside 6 months plus a backlog of ingredient comparison and sourcing content queued behind the recipe production line.
| Content pillar | Target volume year 1 | Production cost per piece | Refresh cadence |
|---|---|---|---|
| Recipe hub | 40 to 100 recipes | $180 to $320 | Every 12 months |
| Ingredient comparison guides | 12 to 24 guides | $450 to $780 | Every 18 months |
| Sourcing story pages | 6 to 12 pages | $680 to $1,200 | Every 24 months |
| Buyer intent content | 8 to 16 pieces | $220 to $420 | Every 12 months |
Photography as a content calendar constraint
Photography is the actual constraint on recipe cadence, not writing. Every recipe needs 6 to 12 photos: hero shot, ingredient flat lay, prep in progress, plated result, storage, and step shots for the schema markup. A working food brand batches photography 8 recipes at a time to keep the cost per recipe under 200 dollars. Skip the batching and the per-recipe cost climbs to 400 to 600 dollars, which caps recipe cadence at 1 per week and slows organic ranking timeline by 6 months.
Seasonal content calendar planning
Seasonal content calendar planning maps recipes and comparison guides to the seasonal windows they need to rank in. A Christmas cookie recipe needs to publish in September to rank by early December. A Valentine’s chocolate guide needs to publish in November to rank by early February. A back-to-school lunchbox recipe needs to publish in June to rank by late August. The 60-to-90-day ranking curve dictates the calendar.
Creator syndication inside food brand content
Creator syndication on food brand content marketing amplifies the recipe hub through Instagram Reels, TikTok, and YouTube Shorts creators paid to post their own version of the brand’s hero recipes. The creator content pulls net-new audiences into the recipe hub through the creator’s Link in Bio or Amazon Storefront tag. The syndication calendar names 12 to 30 creators per quarter with specific recipes assigned to each.
One brand we picked up had a spreadsheet titled “creator outreach 2023” with 47 rows and 3 responses. All 3 responses were auto-replies. The spreadsheet named zero recipes and offered flat rates below 100 dollars per post. Nobody posts a 30-second video for 87 dollars flat. Nobody.
Creator content commercial terms that work
Working creator content commercial terms run 350 to 1,500 dollars flat per post plus a 12 to 25 percent commission on tagged sales across a 30-day window. The commission mechanic pulls creators into follow-up posts because the incremental revenue continues past the initial fee. Mid-tier creators (30k to 150k followers) hit the sweet spot for food brand content because their engagement rate typically runs 4 to 8 percent versus 0.8 to 1.6 percent on mega-creators.
Content brief structure for creator partnerships
The content brief structure for creator partnerships runs a single page: the SKU, the specific recipe or usage occasion, 3 required brand mentions, 3 restricted claims (no health claims on non-medical SKUs), the pricing angle, the affiliate link, and 3 example videos that hit the tone. The brief avoids over-scripting because over-scripted creator content underperforms native creator voice by 40 to 60 percent on engagement rate.
Buyer intent content for food brand blogs
Buyer intent content on food brand blogs covers 8 to 16 pieces targeting explicit purchase-decision queries: “where to buy [brand],” “[brand] subscription vs. one-time,” “best [category] for [use case],” and “[brand] gift bundle.” Every buyer intent piece runs 1,400 to 2,400 words with a comparison table, product cards, and a clear conversion path to the specific SKU that matches the query intent. Buyer intent content converts at 3 to 6 percent versus 1 to 2 percent on recipe content because the shopper landed already planning to buy, not exploring a usage occasion.
Where-to-buy content structure
Where-to-buy content structure covers online (DTC storefront, Amazon, Target.com, Whole Foods online), retail (specific chain locators with the store finder embedded), and international (customs limitations, retailer partners abroad). Every piece names specific retailers, links to the store locator, and includes an FAQ block covering shipping availability, subscription options, and gift card compatibility. Where-to-buy content ranks for branded discovery queries the DTC storefront otherwise loses to competitor affiliate reviews.
Subscription versus one-time comparison content
Subscription versus one-time comparison content converts subscription commitments at 3 to 6 percent because it addresses the price-sensitivity concern head-on with a specific math table. The piece covers the discount structure (15 percent lifetime), the skip-a-month mechanic, the pause-anytime rule, the cancellation policy, and the specific yearly savings for the brand’s average consumption cadence. Cross-reference the retention structure on our food and beverage marketing retainer page.
Content refresh cadence on food brand pillars
Content refresh cadence on food brand content pillars runs a rolling audit every 12 to 24 months by pillar. Recipes get refreshed every 12 months with new photography, updated schema, and any nutrition or ingredient adjustments. Ingredient comparison guides refresh every 18 months to update market data. Sourcing story pages refresh every 24 months to reflect farm partnership changes and new harvest angles. Buyer intent content refreshes every 12 months to update retailer availability and pricing.
Recipe refresh priority order
Recipe refresh priority runs by organic traffic rank. The top 20 recipes by monthly organic sessions get refreshed first (new photography, schema audit, related recipe internal links, updated nutrition). The next 40 get refreshed at 15 months. The remaining recipes get refreshed opportunistically when the ranking slips past position 15 in Google. Skipping the refresh cadence lets recipe rankings drift out of the top 3 inside 18 months as newer competitor recipes take the position.
Schema audit checklist per refresh
The schema audit checklist per refresh runs 8 items: Recipe schema completeness, aggregateRating count and accuracy, nutrition data accuracy, prepTime and cookTime match the recipe body, image URLs valid at CDN, related recipe internal links working, product card SKU URL live, and Google Search Console rich result eligibility validated. This checklist takes 20 minutes per recipe and prevents the schema drift that costs recipe rankings 20 to 40 positions quietly.
Reporting cadence for food brand content marketing
Reporting cadence on food brand content marketing runs a monthly executive report plus a quarterly business review. The monthly report ships in the first business week and covers organic sessions by pillar, top 10 ranking recipes with position trend, ingredient guide ranking movements, sourcing page performance, and organic-attributed DTC revenue. Every number carries a comparison to the prior month and a plain-language interpretation the founder reads in 7 minutes.
Metrics that matter for content marketing
Metrics that matter for food brand content marketing: organic sessions by pillar, recipe rich result impressions in Search Console, organic conversion rate to hero SKU pages, organic-attributed DTC revenue, and top 20 ranking positions by monthly organic sessions. Vanity metrics that do not matter: total pageviews without conversion context, average time on page without conversion attribution, and social share counts. The monthly report skips the vanity block entirely.
Quarterly business review structure
The quarterly business review runs 90 minutes with the founder, head of content, and SEO lead. Agenda: organic traffic trend by pillar, top 10 winning content pieces, top 10 losing content pieces (candidates for refresh or removal), competitive gap analysis against 5 named competitor brands, and next quarter’s content calendar with recipes and ingredient guides queued. According to Ahrefs content marketing research, brands running quarterly content audits outperform brands running annual audits by 40 to 70 percent on organic revenue over a 24-month window.
Internal linking discipline across food brand content
Internal linking discipline across food brand content moves authority from recipe pages toward hero SKU product pages and comparison guides. Every recipe links to the hero SKU it uses inline (once in the ingredient list, once in a bottom call-out card). Every ingredient comparison guide links to 3 to 6 recipes using the winning ingredient plus the hero SKU product page. Every sourcing story links to the 2 to 4 SKUs sourced from that specific farm or cooperative.
Anchor text strategy across recipe hubs
Anchor text on internal links varies across recipe hubs to avoid over-optimization patterns Google penalizes. Exact-match anchor (“single-origin Ethiopian coffee”) runs on 20 to 30 percent of internal links. Partial-match variations (“our Ethiopian roast”) run on 30 to 40 percent. Branded anchors (the SKU name) run on 20 to 30 percent. Generic anchors (“shop the coffee”) fill the remaining 10 to 20 percent. This ratio holds ranking without triggering the over-optimization penalty that shows up on brands that anchor-text-stuff every internal link with the same exact-match keyword. Cross-reference the linking layer on our food and beverage web design page.
Link equity from ingredient guides to SKU pages
Link equity from ingredient guides passes to SKU pages when the guide’s comparison table names the hero SKU in the winning column with a product card, and when the guide’s body links to 3 to 6 recipes that use the winning ingredient. This 3-hop path (guide to recipe to SKU) pushes authority from a high-traffic informational query down to a high-intent transactional page. According to Search Engine Land SEO coverage, informational content that internally links to transactional pages produces 2 to 4 times higher organic revenue than isolated content silos.
Wrapping up content marketing for food brands
Content marketing for food brands is the organic engine that turns a DTC snack, drink, or CPG storefront into a search-driven revenue channel. Recipe hub of 40 to 100 recipes. Ingredient comparison guides at 12 to 24 pieces. Sourcing story pages at 6 to 12 pieces. Buyer intent content at 8 to 16 pieces. Creator syndication calendar with 12 to 30 creators per quarter. Refresh cadence at 12 to 24 months by pillar. Reporting with organic sessions and organic revenue attribution.
If your DTC food brand is running paid social at 20,000 dollars monthly with a broken blog and zero recipe schema, professional content marketing for food brands pays for itself inside the first 90 days on organic traffic captured. Redefine Web ships content marketing inside our monthly retainer packages. Book a call and we will walk through the last three DTC food brands we built recipe hubs for, pillar by pillar.
Content marketing for food brands starts with a recipe hub because recipe queries account for 40 to 60 percent of high-intent search volume in the food category. Every hero SKU needs 4 to 12 recipes anchored to it, each targeting a specific occasion and audience.
Skip the recipe hub and the brand loses the search real estate that pulls DTC storefront traffic month over month at zero incremental paid cost. Recipe traffic converts at 2 to 4 percent because the shopper landed with usage intent, not passive discovery, which is why food brands win on recipes.
Recipe schema and Google rich result eligibility
Every recipe page ships schema.org Recipe markup including cookTime, prepTime, recipeIngredient, recipeInstructions, nutrition, and aggregateRating. Correctly marked-up recipes qualify for Google’s recipe rich result carousel that pulls 3 to 6 times higher click-through rate than a plain blue link. The schema layer takes 15 minutes per recipe to author and 30 minutes to validate in Google Search Console. Cross-reference the recipe search stack on our food and beverage SEO page.
Recipe hub structure that scales
The recipe hub structure runs 40 to 100 recipes at maturity, organized by hero SKU (4 to 12 recipes per SKU) plus occasion tags (breakfast, weeknight dinner, meal prep, brunch, holiday). Every recipe links back to the hero SKU product page with the SKU embedded in an inline card. The hub earns internal linking value from ingredient comparison guides and the sourcing story pages, which feeds recipe ranking on Google. According to Google Search Central recipe structured data guidance, complete Recipe schema markup is required for eligibility in the recipe carousel and the ingredient search filter.
Pillar structure for food brand content marketing
The pillar structure on content marketing for food brands runs 4 content pillars concurrently: recipe hub (40 to 100 recipes), ingredient comparison guides (12 to 24 guides), sourcing story pages (6 to 12 pages), and buyer intent content (where to buy, subscription vs. one-time, gift bundle guides). Every pillar covers a distinct search intent and every pillar links back to the hero SKU product pages.
Ingredient comparison guide format
Ingredient comparison guides run 1,800 to 3,200 words comparing 2 to 4 ingredient types on 6 to 10 attributes with a comparison table, real-world use case examples, and links to the hero SKU that uses the specific ingredient. Example: organic vs. conventional oats compares nutritional profile, sourcing chain, cost, environmental impact, and taste on a 6-column table. The brand’s SKU appears in the winning column with a product card. These guides rank 3 to 8 months after publication and pull steady-state organic traffic.
Sourcing story pages that build trust
Sourcing story pages name the specific farms, cooperatives, or suppliers the brand sources from, with photos of the farms, farmer quotes, and specific harvest windows. A coffee brand’s Ethiopian farm page ranks for “single-origin Ethiopian coffee” and “Yirgacheffe coffee origin” plus 40 long-tail variations. The sourcing page pulls trust-building traffic that converts at 4 to 6 percent because the shopper landed pattern-matching on transparency and named provenance. Every sourcing page includes farmer or cooperative quotes, harvest dates, and a link back to 3 to 5 hero SKU pages that source from the named supplier.
Vejrø hospitality content case study
Vejrø Resort, a Danish private-island destination with an on-site restaurant focused on organic, locally sourced cuisine, joined us with strong social engagement and no organic-search real estate. Guests found the resort on Instagram but never in Google search for terms like “private island resort Denmark,” “farm-to-table hospitality Denmark,” or “Vejrø restaurant.” The same organic-search gap shows up on DTC food brands running paid social at 20,000 dollars monthly with a broken blog and zero recipe schema.
We built the conversion-focused website with on-site and off-site SEO tuned to the travel-niche keyword clusters, competitor analysis against comparable boutique resorts, and mobile-first design prioritizing guest discovery. Every page carried the structured data qualifying it for Google’s rich results in the hospitality category. Every internal link pushed authority toward the direct-booking conversion path.
Three months later, Vejrø hit 10,000 plus organic visitors, ranked for 200 plus first-page keywords, and pulled a 2.2 percent booking conversion rate from organic traffic. The same pattern applies to content marketing for food brands: recipe schema, ingredient comparison guides, and sourcing story pages pull organic traffic at 20 to 40 percent conversion into hero SKU pages inside 6 months when the content quality matches search intent and every page carries the right structured data markup. Vejrø also proved out the reporting discipline: every monthly report named the exact page, the exact keyword cluster, and the exact search feature (rich result, sitelinks, image pack) driving the incremental organic revenue instead of hiding behind aggregate traffic charts.
Recipe cadence and content calendar for food brands
Recipe cadence on a working food brand content calendar ships 2 to 4 new recipes per week during the first 6 months and drops to 1 per week at maturity. Each recipe takes 4 to 6 hours to produce (write, test in the kitchen, photograph, schema author, publish). At 3 recipes per week, the brand hits 78 recipes inside 6 months plus a backlog of ingredient comparison and sourcing content queued behind the recipe production line.
| Content pillar | Target volume year 1 | Production cost per piece | Refresh cadence |
|---|---|---|---|
| Recipe hub | 40 to 100 recipes | $180 to $320 | Every 12 months |
| Ingredient comparison guides | 12 to 24 guides | $450 to $780 | Every 18 months |
| Sourcing story pages | 6 to 12 pages | $680 to $1,200 | Every 24 months |
| Buyer intent content | 8 to 16 pieces | $220 to $420 | Every 12 months |
Photography as a content calendar constraint
Photography is the actual constraint on recipe cadence, not writing. Every recipe needs 6 to 12 photos: hero shot, ingredient flat lay, prep in progress, plated result, storage, and step shots for the schema markup. A working food brand batches photography 8 recipes at a time to keep the cost per recipe under 200 dollars. Skip the batching and the per-recipe cost climbs to 400 to 600 dollars, which caps recipe cadence at 1 per week and slows organic ranking timeline by 6 months.
Seasonal content calendar planning
Seasonal content calendar planning maps recipes and comparison guides to the seasonal windows they need to rank in. A Christmas cookie recipe needs to publish in September to rank by early December. A Valentine’s chocolate guide needs to publish in November to rank by early February. A back-to-school lunchbox recipe needs to publish in June to rank by late August. The 60-to-90-day ranking curve dictates the calendar.
Creator syndication inside food brand content
Creator syndication on food brand content marketing amplifies the recipe hub through Instagram Reels, TikTok, and YouTube Shorts creators paid to post their own version of the brand’s hero recipes. The creator content pulls net-new audiences into the recipe hub through the creator’s Link in Bio or Amazon Storefront tag. The syndication calendar names 12 to 30 creators per quarter with specific recipes assigned to each.
One brand we picked up had a spreadsheet titled “creator outreach 2023” with 47 rows and 3 responses. All 3 responses were auto-replies. The spreadsheet named zero recipes and offered flat rates below 100 dollars per post. Nobody posts a 30-second video for 87 dollars flat. Nobody.
Creator content commercial terms that work
Working creator content commercial terms run 350 to 1,500 dollars flat per post plus a 12 to 25 percent commission on tagged sales across a 30-day window. The commission mechanic pulls creators into follow-up posts because the incremental revenue continues past the initial fee. Mid-tier creators (30k to 150k followers) hit the sweet spot for food brand content because their engagement rate typically runs 4 to 8 percent versus 0.8 to 1.6 percent on mega-creators.
Content brief structure for creator partnerships
The content brief structure for creator partnerships runs a single page: the SKU, the specific recipe or usage occasion, 3 required brand mentions, 3 restricted claims (no health claims on non-medical SKUs), the pricing angle, the affiliate link, and 3 example videos that hit the tone. The brief avoids over-scripting because over-scripted creator content underperforms native creator voice by 40 to 60 percent on engagement rate.
Buyer intent content for food brand blogs
Buyer intent content on food brand blogs covers 8 to 16 pieces targeting explicit purchase-decision queries: “where to buy [brand],” “[brand] subscription vs. one-time,” “best [category] for [use case],” and “[brand] gift bundle.” Every buyer intent piece runs 1,400 to 2,400 words with a comparison table, product cards, and a clear conversion path to the specific SKU that matches the query intent. Buyer intent content converts at 3 to 6 percent versus 1 to 2 percent on recipe content because the shopper landed already planning to buy, not exploring a usage occasion.
Where-to-buy content structure
Where-to-buy content structure covers online (DTC storefront, Amazon, Target.com, Whole Foods online), retail (specific chain locators with the store finder embedded), and international (customs limitations, retailer partners abroad). Every piece names specific retailers, links to the store locator, and includes an FAQ block covering shipping availability, subscription options, and gift card compatibility. Where-to-buy content ranks for branded discovery queries the DTC storefront otherwise loses to competitor affiliate reviews.
Subscription versus one-time comparison content
Subscription versus one-time comparison content converts subscription commitments at 3 to 6 percent because it addresses the price-sensitivity concern head-on with a specific math table. The piece covers the discount structure (15 percent lifetime), the skip-a-month mechanic, the pause-anytime rule, the cancellation policy, and the specific yearly savings for the brand’s average consumption cadence. Cross-reference the retention structure on our food and beverage marketing retainer page.
Content refresh cadence on food brand pillars
Content refresh cadence on food brand content pillars runs a rolling audit every 12 to 24 months by pillar. Recipes get refreshed every 12 months with new photography, updated schema, and any nutrition or ingredient adjustments. Ingredient comparison guides refresh every 18 months to update market data. Sourcing story pages refresh every 24 months to reflect farm partnership changes and new harvest angles. Buyer intent content refreshes every 12 months to update retailer availability and pricing.
Recipe refresh priority order
Recipe refresh priority runs by organic traffic rank. The top 20 recipes by monthly organic sessions get refreshed first (new photography, schema audit, related recipe internal links, updated nutrition). The next 40 get refreshed at 15 months. The remaining recipes get refreshed opportunistically when the ranking slips past position 15 in Google. Skipping the refresh cadence lets recipe rankings drift out of the top 3 inside 18 months as newer competitor recipes take the position.
Schema audit checklist per refresh
The schema audit checklist per refresh runs 8 items: Recipe schema completeness, aggregateRating count and accuracy, nutrition data accuracy, prepTime and cookTime match the recipe body, image URLs valid at CDN, related recipe internal links working, product card SKU URL live, and Google Search Console rich result eligibility validated. This checklist takes 20 minutes per recipe and prevents the schema drift that costs recipe rankings 20 to 40 positions quietly.
Reporting cadence for food brand content marketing
Reporting cadence on food brand content marketing runs a monthly executive report plus a quarterly business review. The monthly report ships in the first business week and covers organic sessions by pillar, top 10 ranking recipes with position trend, ingredient guide ranking movements, sourcing page performance, and organic-attributed DTC revenue. Every number carries a comparison to the prior month and a plain-language interpretation the founder reads in 7 minutes.
Metrics that matter for content marketing
Metrics that matter for food brand content marketing: organic sessions by pillar, recipe rich result impressions in Search Console, organic conversion rate to hero SKU pages, organic-attributed DTC revenue, and top 20 ranking positions by monthly organic sessions. Vanity metrics that do not matter: total pageviews without conversion context, average time on page without conversion attribution, and social share counts. The monthly report skips the vanity block entirely.
Quarterly business review structure
The quarterly business review runs 90 minutes with the founder, head of content, and SEO lead. Agenda: organic traffic trend by pillar, top 10 winning content pieces, top 10 losing content pieces (candidates for refresh or removal), competitive gap analysis against 5 named competitor brands, and next quarter’s content calendar with recipes and ingredient guides queued. According to Ahrefs content marketing research, brands running quarterly content audits outperform brands running annual audits by 40 to 70 percent on organic revenue over a 24-month window.
Internal linking discipline across food brand content
Internal linking discipline across food brand content moves authority from recipe pages toward hero SKU product pages and comparison guides. Every recipe links to the hero SKU it uses inline (once in the ingredient list, once in a bottom call-out card). Every ingredient comparison guide links to 3 to 6 recipes using the winning ingredient plus the hero SKU product page. Every sourcing story links to the 2 to 4 SKUs sourced from that specific farm or cooperative.
Anchor text strategy across recipe hubs
Anchor text on internal links varies across recipe hubs to avoid over-optimization patterns Google penalizes. Exact-match anchor (“single-origin Ethiopian coffee”) runs on 20 to 30 percent of internal links. Partial-match variations (“our Ethiopian roast”) run on 30 to 40 percent. Branded anchors (the SKU name) run on 20 to 30 percent. Generic anchors (“shop the coffee”) fill the remaining 10 to 20 percent. This ratio holds ranking without triggering the over-optimization penalty that shows up on brands that anchor-text-stuff every internal link with the same exact-match keyword. Cross-reference the linking layer on our food and beverage web design page.
Link equity from ingredient guides to SKU pages
Link equity from ingredient guides passes to SKU pages when the guide’s comparison table names the hero SKU in the winning column with a product card, and when the guide’s body links to 3 to 6 recipes that use the winning ingredient. This 3-hop path (guide to recipe to SKU) pushes authority from a high-traffic informational query down to a high-intent transactional page. According to Search Engine Land SEO coverage, informational content that internally links to transactional pages produces 2 to 4 times higher organic revenue than isolated content silos.
Wrapping up content marketing for food brands
Content marketing for food brands is the organic engine that turns a DTC snack, drink, or CPG storefront into a search-driven revenue channel. Recipe hub of 40 to 100 recipes. Ingredient comparison guides at 12 to 24 pieces. Sourcing story pages at 6 to 12 pieces. Buyer intent content at 8 to 16 pieces. Creator syndication calendar with 12 to 30 creators per quarter. Refresh cadence at 12 to 24 months by pillar. Reporting with organic sessions and organic revenue attribution.
If your DTC food brand is running paid social at 20,000 dollars monthly with a broken blog and zero recipe schema, professional content marketing for food brands pays for itself inside the first 90 days on organic traffic captured. Redefine Web ships content marketing inside our monthly retainer packages. Book a call and we will walk through the last three DTC food brands we built recipe hubs for, pillar by pillar.
Content marketing for food brands starts with a recipe hub because recipe queries account for 40 to 60 percent of high-intent search volume in the food category. Every hero SKU needs 4 to 12 recipes anchored to it, each targeting a specific occasion and audience.
Skip the recipe hub and the brand loses the search real estate that pulls DTC storefront traffic month over month at zero incremental paid cost. Recipe traffic converts at 2 to 4 percent because the shopper landed with usage intent, not passive discovery, which is why food brands win on recipes.
Recipe schema and Google rich result eligibility
Every recipe page ships schema.org Recipe markup including cookTime, prepTime, recipeIngredient, recipeInstructions, nutrition, and aggregateRating. Correctly marked-up recipes qualify for Google’s recipe rich result carousel that pulls 3 to 6 times higher click-through rate than a plain blue link. The schema layer takes 15 minutes per recipe to author and 30 minutes to validate in Google Search Console. Cross-reference the recipe search stack on our food and beverage SEO page.
Recipe hub structure that scales
The recipe hub structure runs 40 to 100 recipes at maturity, organized by hero SKU (4 to 12 recipes per SKU) plus occasion tags (breakfast, weeknight dinner, meal prep, brunch, holiday). Every recipe links back to the hero SKU product page with the SKU embedded in an inline card. The hub earns internal linking value from ingredient comparison guides and the sourcing story pages, which feeds recipe ranking on Google. According to Google Search Central recipe structured data guidance, complete Recipe schema markup is required for eligibility in the recipe carousel and the ingredient search filter.
Pillar structure for food brand content marketing
The pillar structure on content marketing for food brands runs 4 content pillars concurrently: recipe hub (40 to 100 recipes), ingredient comparison guides (12 to 24 guides), sourcing story pages (6 to 12 pages), and buyer intent content (where to buy, subscription vs. one-time, gift bundle guides). Every pillar covers a distinct search intent and every pillar links back to the hero SKU product pages.
Ingredient comparison guide format
Ingredient comparison guides run 1,800 to 3,200 words comparing 2 to 4 ingredient types on 6 to 10 attributes with a comparison table, real-world use case examples, and links to the hero SKU that uses the specific ingredient. Example: organic vs. conventional oats compares nutritional profile, sourcing chain, cost, environmental impact, and taste on a 6-column table. The brand’s SKU appears in the winning column with a product card. These guides rank 3 to 8 months after publication and pull steady-state organic traffic.
Sourcing story pages that build trust
Sourcing story pages name the specific farms, cooperatives, or suppliers the brand sources from, with photos of the farms, farmer quotes, and specific harvest windows. A coffee brand’s Ethiopian farm page ranks for “single-origin Ethiopian coffee” and “Yirgacheffe coffee origin” plus 40 long-tail variations. The sourcing page pulls trust-building traffic that converts at 4 to 6 percent because the shopper landed pattern-matching on transparency and named provenance. Every sourcing page includes farmer or cooperative quotes, harvest dates, and a link back to 3 to 5 hero SKU pages that source from the named supplier.
Vejrø hospitality content case study
Vejrø Resort, a Danish private-island destination with an on-site restaurant focused on organic, locally sourced cuisine, joined us with strong social engagement and no organic-search real estate. Guests found the resort on Instagram but never in Google search for terms like “private island resort Denmark,” “farm-to-table hospitality Denmark,” or “Vejrø restaurant.” The same organic-search gap shows up on DTC food brands running paid social at 20,000 dollars monthly with a broken blog and zero recipe schema.
We built the conversion-focused website with on-site and off-site SEO tuned to the travel-niche keyword clusters, competitor analysis against comparable boutique resorts, and mobile-first design prioritizing guest discovery. Every page carried the structured data qualifying it for Google’s rich results in the hospitality category. Every internal link pushed authority toward the direct-booking conversion path.
Three months later, Vejrø hit 10,000 plus organic visitors, ranked for 200 plus first-page keywords, and pulled a 2.2 percent booking conversion rate from organic traffic. The same pattern applies to content marketing for food brands: recipe schema, ingredient comparison guides, and sourcing story pages pull organic traffic at 20 to 40 percent conversion into hero SKU pages inside 6 months when the content quality matches search intent and every page carries the right structured data markup. Vejrø also proved out the reporting discipline: every monthly report named the exact page, the exact keyword cluster, and the exact search feature (rich result, sitelinks, image pack) driving the incremental organic revenue instead of hiding behind aggregate traffic charts.
Recipe cadence and content calendar for food brands
Recipe cadence on a working food brand content calendar ships 2 to 4 new recipes per week during the first 6 months and drops to 1 per week at maturity. Each recipe takes 4 to 6 hours to produce (write, test in the kitchen, photograph, schema author, publish). At 3 recipes per week, the brand hits 78 recipes inside 6 months plus a backlog of ingredient comparison and sourcing content queued behind the recipe production line.
| Content pillar | Target volume year 1 | Production cost per piece | Refresh cadence |
|---|---|---|---|
| Recipe hub | 40 to 100 recipes | $180 to $320 | Every 12 months |
| Ingredient comparison guides | 12 to 24 guides | $450 to $780 | Every 18 months |
| Sourcing story pages | 6 to 12 pages | $680 to $1,200 | Every 24 months |
| Buyer intent content | 8 to 16 pieces | $220 to $420 | Every 12 months |
Photography as a content calendar constraint
Photography is the actual constraint on recipe cadence, not writing. Every recipe needs 6 to 12 photos: hero shot, ingredient flat lay, prep in progress, plated result, storage, and step shots for the schema markup. A working food brand batches photography 8 recipes at a time to keep the cost per recipe under 200 dollars. Skip the batching and the per-recipe cost climbs to 400 to 600 dollars, which caps recipe cadence at 1 per week and slows organic ranking timeline by 6 months.
Seasonal content calendar planning
Seasonal content calendar planning maps recipes and comparison guides to the seasonal windows they need to rank in. A Christmas cookie recipe needs to publish in September to rank by early December. A Valentine’s chocolate guide needs to publish in November to rank by early February. A back-to-school lunchbox recipe needs to publish in June to rank by late August. The 60-to-90-day ranking curve dictates the calendar.
Creator syndication inside food brand content
Creator syndication on food brand content marketing amplifies the recipe hub through Instagram Reels, TikTok, and YouTube Shorts creators paid to post their own version of the brand’s hero recipes. The creator content pulls net-new audiences into the recipe hub through the creator’s Link in Bio or Amazon Storefront tag. The syndication calendar names 12 to 30 creators per quarter with specific recipes assigned to each.
One brand we picked up had a spreadsheet titled “creator outreach 2023” with 47 rows and 3 responses. All 3 responses were auto-replies. The spreadsheet named zero recipes and offered flat rates below 100 dollars per post. Nobody posts a 30-second video for 87 dollars flat. Nobody.
Creator content commercial terms that work
Working creator content commercial terms run 350 to 1,500 dollars flat per post plus a 12 to 25 percent commission on tagged sales across a 30-day window. The commission mechanic pulls creators into follow-up posts because the incremental revenue continues past the initial fee. Mid-tier creators (30k to 150k followers) hit the sweet spot for food brand content because their engagement rate typically runs 4 to 8 percent versus 0.8 to 1.6 percent on mega-creators.
Content brief structure for creator partnerships
The content brief structure for creator partnerships runs a single page: the SKU, the specific recipe or usage occasion, 3 required brand mentions, 3 restricted claims (no health claims on non-medical SKUs), the pricing angle, the affiliate link, and 3 example videos that hit the tone. The brief avoids over-scripting because over-scripted creator content underperforms native creator voice by 40 to 60 percent on engagement rate.
Buyer intent content for food brand blogs
Buyer intent content on food brand blogs covers 8 to 16 pieces targeting explicit purchase-decision queries: “where to buy [brand],” “[brand] subscription vs. one-time,” “best [category] for [use case],” and “[brand] gift bundle.” Every buyer intent piece runs 1,400 to 2,400 words with a comparison table, product cards, and a clear conversion path to the specific SKU that matches the query intent. Buyer intent content converts at 3 to 6 percent versus 1 to 2 percent on recipe content because the shopper landed already planning to buy, not exploring a usage occasion.
Where-to-buy content structure
Where-to-buy content structure covers online (DTC storefront, Amazon, Target.com, Whole Foods online), retail (specific chain locators with the store finder embedded), and international (customs limitations, retailer partners abroad). Every piece names specific retailers, links to the store locator, and includes an FAQ block covering shipping availability, subscription options, and gift card compatibility. Where-to-buy content ranks for branded discovery queries the DTC storefront otherwise loses to competitor affiliate reviews.
Subscription versus one-time comparison content
Subscription versus one-time comparison content converts subscription commitments at 3 to 6 percent because it addresses the price-sensitivity concern head-on with a specific math table. The piece covers the discount structure (15 percent lifetime), the skip-a-month mechanic, the pause-anytime rule, the cancellation policy, and the specific yearly savings for the brand’s average consumption cadence. Cross-reference the retention structure on our food and beverage marketing retainer page.
Content refresh cadence on food brand pillars
Content refresh cadence on food brand content pillars runs a rolling audit every 12 to 24 months by pillar. Recipes get refreshed every 12 months with new photography, updated schema, and any nutrition or ingredient adjustments. Ingredient comparison guides refresh every 18 months to update market data. Sourcing story pages refresh every 24 months to reflect farm partnership changes and new harvest angles. Buyer intent content refreshes every 12 months to update retailer availability and pricing.
Recipe refresh priority order
Recipe refresh priority runs by organic traffic rank. The top 20 recipes by monthly organic sessions get refreshed first (new photography, schema audit, related recipe internal links, updated nutrition). The next 40 get refreshed at 15 months. The remaining recipes get refreshed opportunistically when the ranking slips past position 15 in Google. Skipping the refresh cadence lets recipe rankings drift out of the top 3 inside 18 months as newer competitor recipes take the position.
Schema audit checklist per refresh
The schema audit checklist per refresh runs 8 items: Recipe schema completeness, aggregateRating count and accuracy, nutrition data accuracy, prepTime and cookTime match the recipe body, image URLs valid at CDN, related recipe internal links working, product card SKU URL live, and Google Search Console rich result eligibility validated. This checklist takes 20 minutes per recipe and prevents the schema drift that costs recipe rankings 20 to 40 positions quietly.
Reporting cadence for food brand content marketing
Reporting cadence on food brand content marketing runs a monthly executive report plus a quarterly business review. The monthly report ships in the first business week and covers organic sessions by pillar, top 10 ranking recipes with position trend, ingredient guide ranking movements, sourcing page performance, and organic-attributed DTC revenue. Every number carries a comparison to the prior month and a plain-language interpretation the founder reads in 7 minutes.
Metrics that matter for content marketing
Metrics that matter for food brand content marketing: organic sessions by pillar, recipe rich result impressions in Search Console, organic conversion rate to hero SKU pages, organic-attributed DTC revenue, and top 20 ranking positions by monthly organic sessions. Vanity metrics that do not matter: total pageviews without conversion context, average time on page without conversion attribution, and social share counts. The monthly report skips the vanity block entirely.
Quarterly business review structure
The quarterly business review runs 90 minutes with the founder, head of content, and SEO lead. Agenda: organic traffic trend by pillar, top 10 winning content pieces, top 10 losing content pieces (candidates for refresh or removal), competitive gap analysis against 5 named competitor brands, and next quarter’s content calendar with recipes and ingredient guides queued. According to Ahrefs content marketing research, brands running quarterly content audits outperform brands running annual audits by 40 to 70 percent on organic revenue over a 24-month window.
Internal linking discipline across food brand content
Internal linking discipline across food brand content moves authority from recipe pages toward hero SKU product pages and comparison guides. Every recipe links to the hero SKU it uses inline (once in the ingredient list, once in a bottom call-out card). Every ingredient comparison guide links to 3 to 6 recipes using the winning ingredient plus the hero SKU product page. Every sourcing story links to the 2 to 4 SKUs sourced from that specific farm or cooperative.
Anchor text strategy across recipe hubs
Anchor text on internal links varies across recipe hubs to avoid over-optimization patterns Google penalizes. Exact-match anchor (“single-origin Ethiopian coffee”) runs on 20 to 30 percent of internal links. Partial-match variations (“our Ethiopian roast”) run on 30 to 40 percent. Branded anchors (the SKU name) run on 20 to 30 percent. Generic anchors (“shop the coffee”) fill the remaining 10 to 20 percent. This ratio holds ranking without triggering the over-optimization penalty that shows up on brands that anchor-text-stuff every internal link with the same exact-match keyword. Cross-reference the linking layer on our food and beverage web design page.
Link equity from ingredient guides to SKU pages
Link equity from ingredient guides passes to SKU pages when the guide’s comparison table names the hero SKU in the winning column with a product card, and when the guide’s body links to 3 to 6 recipes that use the winning ingredient. This 3-hop path (guide to recipe to SKU) pushes authority from a high-traffic informational query down to a high-intent transactional page. According to Search Engine Land SEO coverage, informational content that internally links to transactional pages produces 2 to 4 times higher organic revenue than isolated content silos.
Wrapping up content marketing for food brands
Content marketing for food brands is the organic engine that turns a DTC snack, drink, or CPG storefront into a search-driven revenue channel. Recipe hub of 40 to 100 recipes. Ingredient comparison guides at 12 to 24 pieces. Sourcing story pages at 6 to 12 pieces. Buyer intent content at 8 to 16 pieces. Creator syndication calendar with 12 to 30 creators per quarter. Refresh cadence at 12 to 24 months by pillar. Reporting with organic sessions and organic revenue attribution.
If your DTC food brand is running paid social at 20,000 dollars monthly with a broken blog and zero recipe schema, professional content marketing for food brands pays for itself inside the first 90 days on organic traffic captured. Redefine Web ships content marketing inside our monthly retainer packages. Book a call and we will walk through the last three DTC food brands we built recipe hubs for, pillar by pillar.
Anchor text on internal links varies across recipe hubs to avoid over-optimization patterns Google penalizes. Exact-match anchor (“single-origin Ethiopian coffee”) runs on 20 to 30 percent of internal links. Partial-match variations (“our Ethiopian roast”) run on 30 to 40 percent. Branded anchors (the SKU name) run on 20 to 30 percent. Generic anchors (“shop the coffee”) fill the remaining 10 to 20 percent. This ratio holds ranking without triggering the over-optimization penalty that shows up on brands that anchor-text-stuff every internal link with the same exact-match keyword. Cross-reference the linking layer on our food and beverage web design page.
Link equity from ingredient guides to SKU pages
Link equity from ingredient guides passes to SKU pages when the guide’s comparison table names the hero SKU in the winning column with a product card, and when the guide’s body links to 3 to 6 recipes that use the winning ingredient. This 3-hop path (guide to recipe to SKU) pushes authority from a high-traffic informational query down to a high-intent transactional page. According to Search Engine Land SEO coverage, informational content that internally links to transactional pages produces 2 to 4 times higher organic revenue than isolated content silos.
Wrapping up content marketing for food brands
Content marketing for food brands is the organic engine that turns a DTC snack, drink, or CPG storefront into a search-driven revenue channel. Recipe hub of 40 to 100 recipes. Ingredient comparison guides at 12 to 24 pieces. Sourcing story pages at 6 to 12 pieces. Buyer intent content at 8 to 16 pieces. Creator syndication calendar with 12 to 30 creators per quarter. Refresh cadence at 12 to 24 months by pillar. Reporting with organic sessions and organic revenue attribution.
If your DTC food brand is running paid social at 20,000 dollars monthly with a broken blog and zero recipe schema, professional content marketing for food brands pays for itself inside the first 90 days on organic traffic captured. Redefine Web ships content marketing inside our monthly retainer packages. Book a call and we will walk through the last three DTC food brands we built recipe hubs for, pillar by pillar.
Content marketing for food brands starts with a recipe hub because recipe queries account for 40 to 60 percent of high-intent search volume in the food category. Every hero SKU needs 4 to 12 recipes anchored to it, each targeting a specific occasion and audience.
Skip the recipe hub and the brand loses the search real estate that pulls DTC storefront traffic month over month at zero incremental paid cost. Recipe traffic converts at 2 to 4 percent because the shopper landed with usage intent, not passive discovery, which is why food brands win on recipes.
Recipe schema and Google rich result eligibility
Every recipe page ships schema.org Recipe markup including cookTime, prepTime, recipeIngredient, recipeInstructions, nutrition, and aggregateRating. Correctly marked-up recipes qualify for Google’s recipe rich result carousel that pulls 3 to 6 times higher click-through rate than a plain blue link. The schema layer takes 15 minutes per recipe to author and 30 minutes to validate in Google Search Console. Cross-reference the recipe search stack on our food and beverage SEO page.
Recipe hub structure that scales
The recipe hub structure runs 40 to 100 recipes at maturity, organized by hero SKU (4 to 12 recipes per SKU) plus occasion tags (breakfast, weeknight dinner, meal prep, brunch, holiday). Every recipe links back to the hero SKU product page with the SKU embedded in an inline card. The hub earns internal linking value from ingredient comparison guides and the sourcing story pages, which feeds recipe ranking on Google. According to Google Search Central recipe structured data guidance, complete Recipe schema markup is required for eligibility in the recipe carousel and the ingredient search filter.
Pillar structure for food brand content marketing
The pillar structure on content marketing for food brands runs 4 content pillars concurrently: recipe hub (40 to 100 recipes), ingredient comparison guides (12 to 24 guides), sourcing story pages (6 to 12 pages), and buyer intent content (where to buy, subscription vs. one-time, gift bundle guides). Every pillar covers a distinct search intent and every pillar links back to the hero SKU product pages.
Ingredient comparison guide format
Ingredient comparison guides run 1,800 to 3,200 words comparing 2 to 4 ingredient types on 6 to 10 attributes with a comparison table, real-world use case examples, and links to the hero SKU that uses the specific ingredient. Example: organic vs. conventional oats compares nutritional profile, sourcing chain, cost, environmental impact, and taste on a 6-column table. The brand’s SKU appears in the winning column with a product card. These guides rank 3 to 8 months after publication and pull steady-state organic traffic.
Sourcing story pages that build trust
Sourcing story pages name the specific farms, cooperatives, or suppliers the brand sources from, with photos of the farms, farmer quotes, and specific harvest windows. A coffee brand’s Ethiopian farm page ranks for “single-origin Ethiopian coffee” and “Yirgacheffe coffee origin” plus 40 long-tail variations. The sourcing page pulls trust-building traffic that converts at 4 to 6 percent because the shopper landed pattern-matching on transparency and named provenance. Every sourcing page includes farmer or cooperative quotes, harvest dates, and a link back to 3 to 5 hero SKU pages that source from the named supplier.
Vejrø hospitality content case study
Vejrø Resort, a Danish private-island destination with an on-site restaurant focused on organic, locally sourced cuisine, joined us with strong social engagement and no organic-search real estate. Guests found the resort on Instagram but never in Google search for terms like “private island resort Denmark,” “farm-to-table hospitality Denmark,” or “Vejrø restaurant.” The same organic-search gap shows up on DTC food brands running paid social at 20,000 dollars monthly with a broken blog and zero recipe schema.
We built the conversion-focused website with on-site and off-site SEO tuned to the travel-niche keyword clusters, competitor analysis against comparable boutique resorts, and mobile-first design prioritizing guest discovery. Every page carried the structured data qualifying it for Google’s rich results in the hospitality category. Every internal link pushed authority toward the direct-booking conversion path.
Three months later, Vejrø hit 10,000 plus organic visitors, ranked for 200 plus first-page keywords, and pulled a 2.2 percent booking conversion rate from organic traffic. The same pattern applies to content marketing for food brands: recipe schema, ingredient comparison guides, and sourcing story pages pull organic traffic at 20 to 40 percent conversion into hero SKU pages inside 6 months when the content quality matches search intent and every page carries the right structured data markup. Vejrø also proved out the reporting discipline: every monthly report named the exact page, the exact keyword cluster, and the exact search feature (rich result, sitelinks, image pack) driving the incremental organic revenue instead of hiding behind aggregate traffic charts.
Recipe cadence and content calendar for food brands
Recipe cadence on a working food brand content calendar ships 2 to 4 new recipes per week during the first 6 months and drops to 1 per week at maturity. Each recipe takes 4 to 6 hours to produce (write, test in the kitchen, photograph, schema author, publish). At 3 recipes per week, the brand hits 78 recipes inside 6 months plus a backlog of ingredient comparison and sourcing content queued behind the recipe production line.
| Content pillar | Target volume year 1 | Production cost per piece | Refresh cadence |
|---|---|---|---|
| Recipe hub | 40 to 100 recipes | $180 to $320 | Every 12 months |
| Ingredient comparison guides | 12 to 24 guides | $450 to $780 | Every 18 months |
| Sourcing story pages | 6 to 12 pages | $680 to $1,200 | Every 24 months |
| Buyer intent content | 8 to 16 pieces | $220 to $420 | Every 12 months |
Photography as a content calendar constraint
Photography is the actual constraint on recipe cadence, not writing. Every recipe needs 6 to 12 photos: hero shot, ingredient flat lay, prep in progress, plated result, storage, and step shots for the schema markup. A working food brand batches photography 8 recipes at a time to keep the cost per recipe under 200 dollars. Skip the batching and the per-recipe cost climbs to 400 to 600 dollars, which caps recipe cadence at 1 per week and slows organic ranking timeline by 6 months.
Seasonal content calendar planning
Seasonal content calendar planning maps recipes and comparison guides to the seasonal windows they need to rank in. A Christmas cookie recipe needs to publish in September to rank by early December. A Valentine’s chocolate guide needs to publish in November to rank by early February. A back-to-school lunchbox recipe needs to publish in June to rank by late August. The 60-to-90-day ranking curve dictates the calendar.
Creator syndication inside food brand content
Creator syndication on food brand content marketing amplifies the recipe hub through Instagram Reels, TikTok, and YouTube Shorts creators paid to post their own version of the brand’s hero recipes. The creator content pulls net-new audiences into the recipe hub through the creator’s Link in Bio or Amazon Storefront tag. The syndication calendar names 12 to 30 creators per quarter with specific recipes assigned to each.
One brand we picked up had a spreadsheet titled “creator outreach 2023” with 47 rows and 3 responses. All 3 responses were auto-replies. The spreadsheet named zero recipes and offered flat rates below 100 dollars per post. Nobody posts a 30-second video for 87 dollars flat. Nobody.
Creator content commercial terms that work
Working creator content commercial terms run 350 to 1,500 dollars flat per post plus a 12 to 25 percent commission on tagged sales across a 30-day window. The commission mechanic pulls creators into follow-up posts because the incremental revenue continues past the initial fee. Mid-tier creators (30k to 150k followers) hit the sweet spot for food brand content because their engagement rate typically runs 4 to 8 percent versus 0.8 to 1.6 percent on mega-creators.
Content brief structure for creator partnerships
The content brief structure for creator partnerships runs a single page: the SKU, the specific recipe or usage occasion, 3 required brand mentions, 3 restricted claims (no health claims on non-medical SKUs), the pricing angle, the affiliate link, and 3 example videos that hit the tone. The brief avoids over-scripting because over-scripted creator content underperforms native creator voice by 40 to 60 percent on engagement rate.
Buyer intent content for food brand blogs
Buyer intent content on food brand blogs covers 8 to 16 pieces targeting explicit purchase-decision queries: “where to buy [brand],” “[brand] subscription vs. one-time,” “best [category] for [use case],” and “[brand] gift bundle.” Every buyer intent piece runs 1,400 to 2,400 words with a comparison table, product cards, and a clear conversion path to the specific SKU that matches the query intent. Buyer intent content converts at 3 to 6 percent versus 1 to 2 percent on recipe content because the shopper landed already planning to buy, not exploring a usage occasion.
Where-to-buy content structure
Where-to-buy content structure covers online (DTC storefront, Amazon, Target.com, Whole Foods online), retail (specific chain locators with the store finder embedded), and international (customs limitations, retailer partners abroad). Every piece names specific retailers, links to the store locator, and includes an FAQ block covering shipping availability, subscription options, and gift card compatibility. Where-to-buy content ranks for branded discovery queries the DTC storefront otherwise loses to competitor affiliate reviews.
Subscription versus one-time comparison content
Subscription versus one-time comparison content converts subscription commitments at 3 to 6 percent because it addresses the price-sensitivity concern head-on with a specific math table. The piece covers the discount structure (15 percent lifetime), the skip-a-month mechanic, the pause-anytime rule, the cancellation policy, and the specific yearly savings for the brand’s average consumption cadence. Cross-reference the retention structure on our food and beverage marketing retainer page.
Content refresh cadence on food brand pillars
Content refresh cadence on food brand content pillars runs a rolling audit every 12 to 24 months by pillar. Recipes get refreshed every 12 months with new photography, updated schema, and any nutrition or ingredient adjustments. Ingredient comparison guides refresh every 18 months to update market data. Sourcing story pages refresh every 24 months to reflect farm partnership changes and new harvest angles. Buyer intent content refreshes every 12 months to update retailer availability and pricing.
Recipe refresh priority order
Recipe refresh priority runs by organic traffic rank. The top 20 recipes by monthly organic sessions get refreshed first (new photography, schema audit, related recipe internal links, updated nutrition). The next 40 get refreshed at 15 months. The remaining recipes get refreshed opportunistically when the ranking slips past position 15 in Google. Skipping the refresh cadence lets recipe rankings drift out of the top 3 inside 18 months as newer competitor recipes take the position.
Schema audit checklist per refresh
The schema audit checklist per refresh runs 8 items: Recipe schema completeness, aggregateRating count and accuracy, nutrition data accuracy, prepTime and cookTime match the recipe body, image URLs valid at CDN, related recipe internal links working, product card SKU URL live, and Google Search Console rich result eligibility validated. This checklist takes 20 minutes per recipe and prevents the schema drift that costs recipe rankings 20 to 40 positions quietly.
Reporting cadence for food brand content marketing
Reporting cadence on food brand content marketing runs a monthly executive report plus a quarterly business review. The monthly report ships in the first business week and covers organic sessions by pillar, top 10 ranking recipes with position trend, ingredient guide ranking movements, sourcing page performance, and organic-attributed DTC revenue. Every number carries a comparison to the prior month and a plain-language interpretation the founder reads in 7 minutes.
Metrics that matter for content marketing
Metrics that matter for food brand content marketing: organic sessions by pillar, recipe rich result impressions in Search Console, organic conversion rate to hero SKU pages, organic-attributed DTC revenue, and top 20 ranking positions by monthly organic sessions. Vanity metrics that do not matter: total pageviews without conversion context, average time on page without conversion attribution, and social share counts. The monthly report skips the vanity block entirely.
Quarterly business review structure
The quarterly business review runs 90 minutes with the founder, head of content, and SEO lead. Agenda: organic traffic trend by pillar, top 10 winning content pieces, top 10 losing content pieces (candidates for refresh or removal), competitive gap analysis against 5 named competitor brands, and next quarter’s content calendar with recipes and ingredient guides queued. According to Ahrefs content marketing research, brands running quarterly content audits outperform brands running annual audits by 40 to 70 percent on organic revenue over a 24-month window.
Internal linking discipline across food brand content
Internal linking discipline across food brand content moves authority from recipe pages toward hero SKU product pages and comparison guides. Every recipe links to the hero SKU it uses inline (once in the ingredient list, once in a bottom call-out card). Every ingredient comparison guide links to 3 to 6 recipes using the winning ingredient plus the hero SKU product page. Every sourcing story links to the 2 to 4 SKUs sourced from that specific farm or cooperative.
Anchor text strategy across recipe hubs
Anchor text on internal links varies across recipe hubs to avoid over-optimization patterns Google penalizes. Exact-match anchor (“single-origin Ethiopian coffee”) runs on 20 to 30 percent of internal links. Partial-match variations (“our Ethiopian roast”) run on 30 to 40 percent. Branded anchors (the SKU name) run on 20 to 30 percent. Generic anchors (“shop the coffee”) fill the remaining 10 to 20 percent. This ratio holds ranking without triggering the over-optimization penalty that shows up on brands that anchor-text-stuff every internal link with the same exact-match keyword. Cross-reference the linking layer on our food and beverage web design page.
Link equity from ingredient guides to SKU pages
Link equity from ingredient guides passes to SKU pages when the guide’s comparison table names the hero SKU in the winning column with a product card, and when the guide’s body links to 3 to 6 recipes that use the winning ingredient. This 3-hop path (guide to recipe to SKU) pushes authority from a high-traffic informational query down to a high-intent transactional page. According to Search Engine Land SEO coverage, informational content that internally links to transactional pages produces 2 to 4 times higher organic revenue than isolated content silos.
Wrapping up content marketing for food brands
Content marketing for food brands is the organic engine that turns a DTC snack, drink, or CPG storefront into a search-driven revenue channel. Recipe hub of 40 to 100 recipes. Ingredient comparison guides at 12 to 24 pieces. Sourcing story pages at 6 to 12 pieces. Buyer intent content at 8 to 16 pieces. Creator syndication calendar with 12 to 30 creators per quarter. Refresh cadence at 12 to 24 months by pillar. Reporting with organic sessions and organic revenue attribution.
If your DTC food brand is running paid social at 20,000 dollars monthly with a broken blog and zero recipe schema, professional content marketing for food brands pays for itself inside the first 90 days on organic traffic captured. Redefine Web ships content marketing inside our monthly retainer packages. Book a call and we will walk through the last three DTC food brands we built recipe hubs for, pillar by pillar.
Content marketing for food brands starts with a recipe hub because recipe queries account for 40 to 60 percent of high-intent search volume in the food category. Every hero SKU needs 4 to 12 recipes anchored to it, each targeting a specific occasion and audience.
Skip the recipe hub and the brand loses the search real estate that pulls DTC storefront traffic month over month at zero incremental paid cost. Recipe traffic converts at 2 to 4 percent because the shopper landed with usage intent, not passive discovery, which is why food brands win on recipes.
Recipe schema and Google rich result eligibility
Every recipe page ships schema.org Recipe markup including cookTime, prepTime, recipeIngredient, recipeInstructions, nutrition, and aggregateRating. Correctly marked-up recipes qualify for Google’s recipe rich result carousel that pulls 3 to 6 times higher click-through rate than a plain blue link. The schema layer takes 15 minutes per recipe to author and 30 minutes to validate in Google Search Console. Cross-reference the recipe search stack on our food and beverage SEO page.
Recipe hub structure that scales
The recipe hub structure runs 40 to 100 recipes at maturity, organized by hero SKU (4 to 12 recipes per SKU) plus occasion tags (breakfast, weeknight dinner, meal prep, brunch, holiday). Every recipe links back to the hero SKU product page with the SKU embedded in an inline card. The hub earns internal linking value from ingredient comparison guides and the sourcing story pages, which feeds recipe ranking on Google. According to Google Search Central recipe structured data guidance, complete Recipe schema markup is required for eligibility in the recipe carousel and the ingredient search filter.
Pillar structure for food brand content marketing
The pillar structure on content marketing for food brands runs 4 content pillars concurrently: recipe hub (40 to 100 recipes), ingredient comparison guides (12 to 24 guides), sourcing story pages (6 to 12 pages), and buyer intent content (where to buy, subscription vs. one-time, gift bundle guides). Every pillar covers a distinct search intent and every pillar links back to the hero SKU product pages.
Ingredient comparison guide format
Ingredient comparison guides run 1,800 to 3,200 words comparing 2 to 4 ingredient types on 6 to 10 attributes with a comparison table, real-world use case examples, and links to the hero SKU that uses the specific ingredient. Example: organic vs. conventional oats compares nutritional profile, sourcing chain, cost, environmental impact, and taste on a 6-column table. The brand’s SKU appears in the winning column with a product card. These guides rank 3 to 8 months after publication and pull steady-state organic traffic.
Sourcing story pages that build trust
Sourcing story pages name the specific farms, cooperatives, or suppliers the brand sources from, with photos of the farms, farmer quotes, and specific harvest windows. A coffee brand’s Ethiopian farm page ranks for “single-origin Ethiopian coffee” and “Yirgacheffe coffee origin” plus 40 long-tail variations. The sourcing page pulls trust-building traffic that converts at 4 to 6 percent because the shopper landed pattern-matching on transparency and named provenance. Every sourcing page includes farmer or cooperative quotes, harvest dates, and a link back to 3 to 5 hero SKU pages that source from the named supplier.
Vejrø hospitality content case study
Vejrø Resort, a Danish private-island destination with an on-site restaurant focused on organic, locally sourced cuisine, joined us with strong social engagement and no organic-search real estate. Guests found the resort on Instagram but never in Google search for terms like “private island resort Denmark,” “farm-to-table hospitality Denmark,” or “Vejrø restaurant.” The same organic-search gap shows up on DTC food brands running paid social at 20,000 dollars monthly with a broken blog and zero recipe schema.
We built the conversion-focused website with on-site and off-site SEO tuned to the travel-niche keyword clusters, competitor analysis against comparable boutique resorts, and mobile-first design prioritizing guest discovery. Every page carried the structured data qualifying it for Google’s rich results in the hospitality category. Every internal link pushed authority toward the direct-booking conversion path.
Three months later, Vejrø hit 10,000 plus organic visitors, ranked for 200 plus first-page keywords, and pulled a 2.2 percent booking conversion rate from organic traffic. The same pattern applies to content marketing for food brands: recipe schema, ingredient comparison guides, and sourcing story pages pull organic traffic at 20 to 40 percent conversion into hero SKU pages inside 6 months when the content quality matches search intent and every page carries the right structured data markup. Vejrø also proved out the reporting discipline: every monthly report named the exact page, the exact keyword cluster, and the exact search feature (rich result, sitelinks, image pack) driving the incremental organic revenue instead of hiding behind aggregate traffic charts.
Recipe cadence and content calendar for food brands
Recipe cadence on a working food brand content calendar ships 2 to 4 new recipes per week during the first 6 months and drops to 1 per week at maturity. Each recipe takes 4 to 6 hours to produce (write, test in the kitchen, photograph, schema author, publish). At 3 recipes per week, the brand hits 78 recipes inside 6 months plus a backlog of ingredient comparison and sourcing content queued behind the recipe production line.
| Content pillar | Target volume year 1 | Production cost per piece | Refresh cadence |
|---|---|---|---|
| Recipe hub | 40 to 100 recipes | $180 to $320 | Every 12 months |
| Ingredient comparison guides | 12 to 24 guides | $450 to $780 | Every 18 months |
| Sourcing story pages | 6 to 12 pages | $680 to $1,200 | Every 24 months |
| Buyer intent content | 8 to 16 pieces | $220 to $420 | Every 12 months |
Photography as a content calendar constraint
Photography is the actual constraint on recipe cadence, not writing. Every recipe needs 6 to 12 photos: hero shot, ingredient flat lay, prep in progress, plated result, storage, and step shots for the schema markup. A working food brand batches photography 8 recipes at a time to keep the cost per recipe under 200 dollars. Skip the batching and the per-recipe cost climbs to 400 to 600 dollars, which caps recipe cadence at 1 per week and slows organic ranking timeline by 6 months.
Seasonal content calendar planning
Seasonal content calendar planning maps recipes and comparison guides to the seasonal windows they need to rank in. A Christmas cookie recipe needs to publish in September to rank by early December. A Valentine’s chocolate guide needs to publish in November to rank by early February. A back-to-school lunchbox recipe needs to publish in June to rank by late August. The 60-to-90-day ranking curve dictates the calendar.
Creator syndication inside food brand content
Creator syndication on food brand content marketing amplifies the recipe hub through Instagram Reels, TikTok, and YouTube Shorts creators paid to post their own version of the brand’s hero recipes. The creator content pulls net-new audiences into the recipe hub through the creator’s Link in Bio or Amazon Storefront tag. The syndication calendar names 12 to 30 creators per quarter with specific recipes assigned to each.
One brand we picked up had a spreadsheet titled “creator outreach 2023” with 47 rows and 3 responses. All 3 responses were auto-replies. The spreadsheet named zero recipes and offered flat rates below 100 dollars per post. Nobody posts a 30-second video for 87 dollars flat. Nobody.
Creator content commercial terms that work
Working creator content commercial terms run 350 to 1,500 dollars flat per post plus a 12 to 25 percent commission on tagged sales across a 30-day window. The commission mechanic pulls creators into follow-up posts because the incremental revenue continues past the initial fee. Mid-tier creators (30k to 150k followers) hit the sweet spot for food brand content because their engagement rate typically runs 4 to 8 percent versus 0.8 to 1.6 percent on mega-creators.
Content brief structure for creator partnerships
The content brief structure for creator partnerships runs a single page: the SKU, the specific recipe or usage occasion, 3 required brand mentions, 3 restricted claims (no health claims on non-medical SKUs), the pricing angle, the affiliate link, and 3 example videos that hit the tone. The brief avoids over-scripting because over-scripted creator content underperforms native creator voice by 40 to 60 percent on engagement rate.
Buyer intent content for food brand blogs
Buyer intent content on food brand blogs covers 8 to 16 pieces targeting explicit purchase-decision queries: “where to buy [brand],” “[brand] subscription vs. one-time,” “best [category] for [use case],” and “[brand] gift bundle.” Every buyer intent piece runs 1,400 to 2,400 words with a comparison table, product cards, and a clear conversion path to the specific SKU that matches the query intent. Buyer intent content converts at 3 to 6 percent versus 1 to 2 percent on recipe content because the shopper landed already planning to buy, not exploring a usage occasion.
Where-to-buy content structure
Where-to-buy content structure covers online (DTC storefront, Amazon, Target.com, Whole Foods online), retail (specific chain locators with the store finder embedded), and international (customs limitations, retailer partners abroad). Every piece names specific retailers, links to the store locator, and includes an FAQ block covering shipping availability, subscription options, and gift card compatibility. Where-to-buy content ranks for branded discovery queries the DTC storefront otherwise loses to competitor affiliate reviews.
Subscription versus one-time comparison content
Subscription versus one-time comparison content converts subscription commitments at 3 to 6 percent because it addresses the price-sensitivity concern head-on with a specific math table. The piece covers the discount structure (15 percent lifetime), the skip-a-month mechanic, the pause-anytime rule, the cancellation policy, and the specific yearly savings for the brand’s average consumption cadence. Cross-reference the retention structure on our food and beverage marketing retainer page.
Content refresh cadence on food brand pillars
Content refresh cadence on food brand content pillars runs a rolling audit every 12 to 24 months by pillar. Recipes get refreshed every 12 months with new photography, updated schema, and any nutrition or ingredient adjustments. Ingredient comparison guides refresh every 18 months to update market data. Sourcing story pages refresh every 24 months to reflect farm partnership changes and new harvest angles. Buyer intent content refreshes every 12 months to update retailer availability and pricing.
Recipe refresh priority order
Recipe refresh priority runs by organic traffic rank. The top 20 recipes by monthly organic sessions get refreshed first (new photography, schema audit, related recipe internal links, updated nutrition). The next 40 get refreshed at 15 months. The remaining recipes get refreshed opportunistically when the ranking slips past position 15 in Google. Skipping the refresh cadence lets recipe rankings drift out of the top 3 inside 18 months as newer competitor recipes take the position.
Schema audit checklist per refresh
The schema audit checklist per refresh runs 8 items: Recipe schema completeness, aggregateRating count and accuracy, nutrition data accuracy, prepTime and cookTime match the recipe body, image URLs valid at CDN, related recipe internal links working, product card SKU URL live, and Google Search Console rich result eligibility validated. This checklist takes 20 minutes per recipe and prevents the schema drift that costs recipe rankings 20 to 40 positions quietly.
Reporting cadence for food brand content marketing
Reporting cadence on food brand content marketing runs a monthly executive report plus a quarterly business review. The monthly report ships in the first business week and covers organic sessions by pillar, top 10 ranking recipes with position trend, ingredient guide ranking movements, sourcing page performance, and organic-attributed DTC revenue. Every number carries a comparison to the prior month and a plain-language interpretation the founder reads in 7 minutes.
Metrics that matter for content marketing
Metrics that matter for food brand content marketing: organic sessions by pillar, recipe rich result impressions in Search Console, organic conversion rate to hero SKU pages, organic-attributed DTC revenue, and top 20 ranking positions by monthly organic sessions. Vanity metrics that do not matter: total pageviews without conversion context, average time on page without conversion attribution, and social share counts. The monthly report skips the vanity block entirely.
Quarterly business review structure
The quarterly business review runs 90 minutes with the founder, head of content, and SEO lead. Agenda: organic traffic trend by pillar, top 10 winning content pieces, top 10 losing content pieces (candidates for refresh or removal), competitive gap analysis against 5 named competitor brands, and next quarter’s content calendar with recipes and ingredient guides queued. According to Ahrefs content marketing research, brands running quarterly content audits outperform brands running annual audits by 40 to 70 percent on organic revenue over a 24-month window.
Internal linking discipline across food brand content
Internal linking discipline across food brand content moves authority from recipe pages toward hero SKU product pages and comparison guides. Every recipe links to the hero SKU it uses inline (once in the ingredient list, once in a bottom call-out card). Every ingredient comparison guide links to 3 to 6 recipes using the winning ingredient plus the hero SKU product page. Every sourcing story links to the 2 to 4 SKUs sourced from that specific farm or cooperative.
Anchor text strategy across recipe hubs
Anchor text on internal links varies across recipe hubs to avoid over-optimization patterns Google penalizes. Exact-match anchor (“single-origin Ethiopian coffee”) runs on 20 to 30 percent of internal links. Partial-match variations (“our Ethiopian roast”) run on 30 to 40 percent. Branded anchors (the SKU name) run on 20 to 30 percent. Generic anchors (“shop the coffee”) fill the remaining 10 to 20 percent. This ratio holds ranking without triggering the over-optimization penalty that shows up on brands that anchor-text-stuff every internal link with the same exact-match keyword. Cross-reference the linking layer on our food and beverage web design page.
Link equity from ingredient guides to SKU pages
Link equity from ingredient guides passes to SKU pages when the guide’s comparison table names the hero SKU in the winning column with a product card, and when the guide’s body links to 3 to 6 recipes that use the winning ingredient. This 3-hop path (guide to recipe to SKU) pushes authority from a high-traffic informational query down to a high-intent transactional page. According to Search Engine Land SEO coverage, informational content that internally links to transactional pages produces 2 to 4 times higher organic revenue than isolated content silos.
Wrapping up content marketing for food brands
Content marketing for food brands is the organic engine that turns a DTC snack, drink, or CPG storefront into a search-driven revenue channel. Recipe hub of 40 to 100 recipes. Ingredient comparison guides at 12 to 24 pieces. Sourcing story pages at 6 to 12 pieces. Buyer intent content at 8 to 16 pieces. Creator syndication calendar with 12 to 30 creators per quarter. Refresh cadence at 12 to 24 months by pillar. Reporting with organic sessions and organic revenue attribution.
If your DTC food brand is running paid social at 20,000 dollars monthly with a broken blog and zero recipe schema, professional content marketing for food brands pays for itself inside the first 90 days on organic traffic captured. Redefine Web ships content marketing inside our monthly retainer packages. Book a call and we will walk through the last three DTC food brands we built recipe hubs for, pillar by pillar.
Internal linking discipline across food brand content moves authority from recipe pages toward hero SKU product pages and comparison guides. Every recipe links to the hero SKU it uses inline (once in the ingredient list, once in a bottom call-out card). Every ingredient comparison guide links to 3 to 6 recipes using the winning ingredient plus the hero SKU product page. Every sourcing story links to the 2 to 4 SKUs sourced from that specific farm or cooperative.
Anchor text strategy across recipe hubs
Anchor text on internal links varies across recipe hubs to avoid over-optimization patterns Google penalizes. Exact-match anchor (“single-origin Ethiopian coffee”) runs on 20 to 30 percent of internal links. Partial-match variations (“our Ethiopian roast”) run on 30 to 40 percent. Branded anchors (the SKU name) run on 20 to 30 percent. Generic anchors (“shop the coffee”) fill the remaining 10 to 20 percent. This ratio holds ranking without triggering the over-optimization penalty that shows up on brands that anchor-text-stuff every internal link with the same exact-match keyword. Cross-reference the linking layer on our food and beverage web design page.
Link equity from ingredient guides to SKU pages
Link equity from ingredient guides passes to SKU pages when the guide’s comparison table names the hero SKU in the winning column with a product card, and when the guide’s body links to 3 to 6 recipes that use the winning ingredient. This 3-hop path (guide to recipe to SKU) pushes authority from a high-traffic informational query down to a high-intent transactional page. According to Search Engine Land SEO coverage, informational content that internally links to transactional pages produces 2 to 4 times higher organic revenue than isolated content silos.
Wrapping up content marketing for food brands
Content marketing for food brands is the organic engine that turns a DTC snack, drink, or CPG storefront into a search-driven revenue channel. Recipe hub of 40 to 100 recipes. Ingredient comparison guides at 12 to 24 pieces. Sourcing story pages at 6 to 12 pieces. Buyer intent content at 8 to 16 pieces. Creator syndication calendar with 12 to 30 creators per quarter. Refresh cadence at 12 to 24 months by pillar. Reporting with organic sessions and organic revenue attribution.
If your DTC food brand is running paid social at 20,000 dollars monthly with a broken blog and zero recipe schema, professional content marketing for food brands pays for itself inside the first 90 days on organic traffic captured. Redefine Web ships content marketing inside our monthly retainer packages. Book a call and we will walk through the last three DTC food brands we built recipe hubs for, pillar by pillar.
Content marketing for food brands starts with a recipe hub because recipe queries account for 40 to 60 percent of high-intent search volume in the food category. Every hero SKU needs 4 to 12 recipes anchored to it, each targeting a specific occasion and audience.
Skip the recipe hub and the brand loses the search real estate that pulls DTC storefront traffic month over month at zero incremental paid cost. Recipe traffic converts at 2 to 4 percent because the shopper landed with usage intent, not passive discovery, which is why food brands win on recipes.
Recipe schema and Google rich result eligibility
Every recipe page ships schema.org Recipe markup including cookTime, prepTime, recipeIngredient, recipeInstructions, nutrition, and aggregateRating. Correctly marked-up recipes qualify for Google’s recipe rich result carousel that pulls 3 to 6 times higher click-through rate than a plain blue link. The schema layer takes 15 minutes per recipe to author and 30 minutes to validate in Google Search Console. Cross-reference the recipe search stack on our food and beverage SEO page.
Recipe hub structure that scales
The recipe hub structure runs 40 to 100 recipes at maturity, organized by hero SKU (4 to 12 recipes per SKU) plus occasion tags (breakfast, weeknight dinner, meal prep, brunch, holiday). Every recipe links back to the hero SKU product page with the SKU embedded in an inline card. The hub earns internal linking value from ingredient comparison guides and the sourcing story pages, which feeds recipe ranking on Google. According to Google Search Central recipe structured data guidance, complete Recipe schema markup is required for eligibility in the recipe carousel and the ingredient search filter.
Pillar structure for food brand content marketing
The pillar structure on content marketing for food brands runs 4 content pillars concurrently: recipe hub (40 to 100 recipes), ingredient comparison guides (12 to 24 guides), sourcing story pages (6 to 12 pages), and buyer intent content (where to buy, subscription vs. one-time, gift bundle guides). Every pillar covers a distinct search intent and every pillar links back to the hero SKU product pages.
Ingredient comparison guide format
Ingredient comparison guides run 1,800 to 3,200 words comparing 2 to 4 ingredient types on 6 to 10 attributes with a comparison table, real-world use case examples, and links to the hero SKU that uses the specific ingredient. Example: organic vs. conventional oats compares nutritional profile, sourcing chain, cost, environmental impact, and taste on a 6-column table. The brand’s SKU appears in the winning column with a product card. These guides rank 3 to 8 months after publication and pull steady-state organic traffic.
Sourcing story pages that build trust
Sourcing story pages name the specific farms, cooperatives, or suppliers the brand sources from, with photos of the farms, farmer quotes, and specific harvest windows. A coffee brand’s Ethiopian farm page ranks for “single-origin Ethiopian coffee” and “Yirgacheffe coffee origin” plus 40 long-tail variations. The sourcing page pulls trust-building traffic that converts at 4 to 6 percent because the shopper landed pattern-matching on transparency and named provenance. Every sourcing page includes farmer or cooperative quotes, harvest dates, and a link back to 3 to 5 hero SKU pages that source from the named supplier.
Vejrø hospitality content case study
Vejrø Resort, a Danish private-island destination with an on-site restaurant focused on organic, locally sourced cuisine, joined us with strong social engagement and no organic-search real estate. Guests found the resort on Instagram but never in Google search for terms like “private island resort Denmark,” “farm-to-table hospitality Denmark,” or “Vejrø restaurant.” The same organic-search gap shows up on DTC food brands running paid social at 20,000 dollars monthly with a broken blog and zero recipe schema.
We built the conversion-focused website with on-site and off-site SEO tuned to the travel-niche keyword clusters, competitor analysis against comparable boutique resorts, and mobile-first design prioritizing guest discovery. Every page carried the structured data qualifying it for Google’s rich results in the hospitality category. Every internal link pushed authority toward the direct-booking conversion path.
Three months later, Vejrø hit 10,000 plus organic visitors, ranked for 200 plus first-page keywords, and pulled a 2.2 percent booking conversion rate from organic traffic. The same pattern applies to content marketing for food brands: recipe schema, ingredient comparison guides, and sourcing story pages pull organic traffic at 20 to 40 percent conversion into hero SKU pages inside 6 months when the content quality matches search intent and every page carries the right structured data markup. Vejrø also proved out the reporting discipline: every monthly report named the exact page, the exact keyword cluster, and the exact search feature (rich result, sitelinks, image pack) driving the incremental organic revenue instead of hiding behind aggregate traffic charts.
Recipe cadence and content calendar for food brands
Recipe cadence on a working food brand content calendar ships 2 to 4 new recipes per week during the first 6 months and drops to 1 per week at maturity. Each recipe takes 4 to 6 hours to produce (write, test in the kitchen, photograph, schema author, publish). At 3 recipes per week, the brand hits 78 recipes inside 6 months plus a backlog of ingredient comparison and sourcing content queued behind the recipe production line.
| Content pillar | Target volume year 1 | Production cost per piece | Refresh cadence |
|---|---|---|---|
| Recipe hub | 40 to 100 recipes | $180 to $320 | Every 12 months |
| Ingredient comparison guides | 12 to 24 guides | $450 to $780 | Every 18 months |
| Sourcing story pages | 6 to 12 pages | $680 to $1,200 | Every 24 months |
| Buyer intent content | 8 to 16 pieces | $220 to $420 | Every 12 months |
Photography as a content calendar constraint
Photography is the actual constraint on recipe cadence, not writing. Every recipe needs 6 to 12 photos: hero shot, ingredient flat lay, prep in progress, plated result, storage, and step shots for the schema markup. A working food brand batches photography 8 recipes at a time to keep the cost per recipe under 200 dollars. Skip the batching and the per-recipe cost climbs to 400 to 600 dollars, which caps recipe cadence at 1 per week and slows organic ranking timeline by 6 months.
Seasonal content calendar planning
Seasonal content calendar planning maps recipes and comparison guides to the seasonal windows they need to rank in. A Christmas cookie recipe needs to publish in September to rank by early December. A Valentine’s chocolate guide needs to publish in November to rank by early February. A back-to-school lunchbox recipe needs to publish in June to rank by late August. The 60-to-90-day ranking curve dictates the calendar.
Creator syndication inside food brand content
Creator syndication on food brand content marketing amplifies the recipe hub through Instagram Reels, TikTok, and YouTube Shorts creators paid to post their own version of the brand’s hero recipes. The creator content pulls net-new audiences into the recipe hub through the creator’s Link in Bio or Amazon Storefront tag. The syndication calendar names 12 to 30 creators per quarter with specific recipes assigned to each.
One brand we picked up had a spreadsheet titled “creator outreach 2023” with 47 rows and 3 responses. All 3 responses were auto-replies. The spreadsheet named zero recipes and offered flat rates below 100 dollars per post. Nobody posts a 30-second video for 87 dollars flat. Nobody.
Creator content commercial terms that work
Working creator content commercial terms run 350 to 1,500 dollars flat per post plus a 12 to 25 percent commission on tagged sales across a 30-day window. The commission mechanic pulls creators into follow-up posts because the incremental revenue continues past the initial fee. Mid-tier creators (30k to 150k followers) hit the sweet spot for food brand content because their engagement rate typically runs 4 to 8 percent versus 0.8 to 1.6 percent on mega-creators.
Content brief structure for creator partnerships
The content brief structure for creator partnerships runs a single page: the SKU, the specific recipe or usage occasion, 3 required brand mentions, 3 restricted claims (no health claims on non-medical SKUs), the pricing angle, the affiliate link, and 3 example videos that hit the tone. The brief avoids over-scripting because over-scripted creator content underperforms native creator voice by 40 to 60 percent on engagement rate.
Buyer intent content for food brand blogs
Buyer intent content on food brand blogs covers 8 to 16 pieces targeting explicit purchase-decision queries: “where to buy [brand],” “[brand] subscription vs. one-time,” “best [category] for [use case],” and “[brand] gift bundle.” Every buyer intent piece runs 1,400 to 2,400 words with a comparison table, product cards, and a clear conversion path to the specific SKU that matches the query intent. Buyer intent content converts at 3 to 6 percent versus 1 to 2 percent on recipe content because the shopper landed already planning to buy, not exploring a usage occasion.
Where-to-buy content structure
Where-to-buy content structure covers online (DTC storefront, Amazon, Target.com, Whole Foods online), retail (specific chain locators with the store finder embedded), and international (customs limitations, retailer partners abroad). Every piece names specific retailers, links to the store locator, and includes an FAQ block covering shipping availability, subscription options, and gift card compatibility. Where-to-buy content ranks for branded discovery queries the DTC storefront otherwise loses to competitor affiliate reviews.
Subscription versus one-time comparison content
Subscription versus one-time comparison content converts subscription commitments at 3 to 6 percent because it addresses the price-sensitivity concern head-on with a specific math table. The piece covers the discount structure (15 percent lifetime), the skip-a-month mechanic, the pause-anytime rule, the cancellation policy, and the specific yearly savings for the brand’s average consumption cadence. Cross-reference the retention structure on our food and beverage marketing retainer page.
Content refresh cadence on food brand pillars
Content refresh cadence on food brand content pillars runs a rolling audit every 12 to 24 months by pillar. Recipes get refreshed every 12 months with new photography, updated schema, and any nutrition or ingredient adjustments. Ingredient comparison guides refresh every 18 months to update market data. Sourcing story pages refresh every 24 months to reflect farm partnership changes and new harvest angles. Buyer intent content refreshes every 12 months to update retailer availability and pricing.
Recipe refresh priority order
Recipe refresh priority runs by organic traffic rank. The top 20 recipes by monthly organic sessions get refreshed first (new photography, schema audit, related recipe internal links, updated nutrition). The next 40 get refreshed at 15 months. The remaining recipes get refreshed opportunistically when the ranking slips past position 15 in Google. Skipping the refresh cadence lets recipe rankings drift out of the top 3 inside 18 months as newer competitor recipes take the position.
Schema audit checklist per refresh
The schema audit checklist per refresh runs 8 items: Recipe schema completeness, aggregateRating count and accuracy, nutrition data accuracy, prepTime and cookTime match the recipe body, image URLs valid at CDN, related recipe internal links working, product card SKU URL live, and Google Search Console rich result eligibility validated. This checklist takes 20 minutes per recipe and prevents the schema drift that costs recipe rankings 20 to 40 positions quietly.
Reporting cadence for food brand content marketing
Reporting cadence on food brand content marketing runs a monthly executive report plus a quarterly business review. The monthly report ships in the first business week and covers organic sessions by pillar, top 10 ranking recipes with position trend, ingredient guide ranking movements, sourcing page performance, and organic-attributed DTC revenue. Every number carries a comparison to the prior month and a plain-language interpretation the founder reads in 7 minutes.
Metrics that matter for content marketing
Metrics that matter for food brand content marketing: organic sessions by pillar, recipe rich result impressions in Search Console, organic conversion rate to hero SKU pages, organic-attributed DTC revenue, and top 20 ranking positions by monthly organic sessions. Vanity metrics that do not matter: total pageviews without conversion context, average time on page without conversion attribution, and social share counts. The monthly report skips the vanity block entirely.
Quarterly business review structure
The quarterly business review runs 90 minutes with the founder, head of content, and SEO lead. Agenda: organic traffic trend by pillar, top 10 winning content pieces, top 10 losing content pieces (candidates for refresh or removal), competitive gap analysis against 5 named competitor brands, and next quarter’s content calendar with recipes and ingredient guides queued. According to Ahrefs content marketing research, brands running quarterly content audits outperform brands running annual audits by 40 to 70 percent on organic revenue over a 24-month window.
Internal linking discipline across food brand content
Internal linking discipline across food brand content moves authority from recipe pages toward hero SKU product pages and comparison guides. Every recipe links to the hero SKU it uses inline (once in the ingredient list, once in a bottom call-out card). Every ingredient comparison guide links to 3 to 6 recipes using the winning ingredient plus the hero SKU product page. Every sourcing story links to the 2 to 4 SKUs sourced from that specific farm or cooperative.
Anchor text strategy across recipe hubs
Anchor text on internal links varies across recipe hubs to avoid over-optimization patterns Google penalizes. Exact-match anchor (“single-origin Ethiopian coffee”) runs on 20 to 30 percent of internal links. Partial-match variations (“our Ethiopian roast”) run on 30 to 40 percent. Branded anchors (the SKU name) run on 20 to 30 percent. Generic anchors (“shop the coffee”) fill the remaining 10 to 20 percent. This ratio holds ranking without triggering the over-optimization penalty that shows up on brands that anchor-text-stuff every internal link with the same exact-match keyword. Cross-reference the linking layer on our food and beverage web design page.
Link equity from ingredient guides to SKU pages
Link equity from ingredient guides passes to SKU pages when the guide’s comparison table names the hero SKU in the winning column with a product card, and when the guide’s body links to 3 to 6 recipes that use the winning ingredient. This 3-hop path (guide to recipe to SKU) pushes authority from a high-traffic informational query down to a high-intent transactional page. According to Search Engine Land SEO coverage, informational content that internally links to transactional pages produces 2 to 4 times higher organic revenue than isolated content silos.
Wrapping up content marketing for food brands
Content marketing for food brands is the organic engine that turns a DTC snack, drink, or CPG storefront into a search-driven revenue channel. Recipe hub of 40 to 100 recipes. Ingredient comparison guides at 12 to 24 pieces. Sourcing story pages at 6 to 12 pieces. Buyer intent content at 8 to 16 pieces. Creator syndication calendar with 12 to 30 creators per quarter. Refresh cadence at 12 to 24 months by pillar. Reporting with organic sessions and organic revenue attribution.
If your DTC food brand is running paid social at 20,000 dollars monthly with a broken blog and zero recipe schema, professional content marketing for food brands pays for itself inside the first 90 days on organic traffic captured. Redefine Web ships content marketing inside our monthly retainer packages. Book a call and we will walk through the last three DTC food brands we built recipe hubs for, pillar by pillar.
Content marketing for food brands starts with a recipe hub because recipe queries account for 40 to 60 percent of high-intent search volume in the food category. Every hero SKU needs 4 to 12 recipes anchored to it, each targeting a specific occasion and audience.
Skip the recipe hub and the brand loses the search real estate that pulls DTC storefront traffic month over month at zero incremental paid cost. Recipe traffic converts at 2 to 4 percent because the shopper landed with usage intent, not passive discovery, which is why food brands win on recipes.
Recipe schema and Google rich result eligibility
Every recipe page ships schema.org Recipe markup including cookTime, prepTime, recipeIngredient, recipeInstructions, nutrition, and aggregateRating. Correctly marked-up recipes qualify for Google’s recipe rich result carousel that pulls 3 to 6 times higher click-through rate than a plain blue link. The schema layer takes 15 minutes per recipe to author and 30 minutes to validate in Google Search Console. Cross-reference the recipe search stack on our food and beverage SEO page.
Recipe hub structure that scales
The recipe hub structure runs 40 to 100 recipes at maturity, organized by hero SKU (4 to 12 recipes per SKU) plus occasion tags (breakfast, weeknight dinner, meal prep, brunch, holiday). Every recipe links back to the hero SKU product page with the SKU embedded in an inline card. The hub earns internal linking value from ingredient comparison guides and the sourcing story pages, which feeds recipe ranking on Google. According to Google Search Central recipe structured data guidance, complete Recipe schema markup is required for eligibility in the recipe carousel and the ingredient search filter.
Pillar structure for food brand content marketing
The pillar structure on content marketing for food brands runs 4 content pillars concurrently: recipe hub (40 to 100 recipes), ingredient comparison guides (12 to 24 guides), sourcing story pages (6 to 12 pages), and buyer intent content (where to buy, subscription vs. one-time, gift bundle guides). Every pillar covers a distinct search intent and every pillar links back to the hero SKU product pages.
Ingredient comparison guide format
Ingredient comparison guides run 1,800 to 3,200 words comparing 2 to 4 ingredient types on 6 to 10 attributes with a comparison table, real-world use case examples, and links to the hero SKU that uses the specific ingredient. Example: organic vs. conventional oats compares nutritional profile, sourcing chain, cost, environmental impact, and taste on a 6-column table. The brand’s SKU appears in the winning column with a product card. These guides rank 3 to 8 months after publication and pull steady-state organic traffic.
Sourcing story pages that build trust
Sourcing story pages name the specific farms, cooperatives, or suppliers the brand sources from, with photos of the farms, farmer quotes, and specific harvest windows. A coffee brand’s Ethiopian farm page ranks for “single-origin Ethiopian coffee” and “Yirgacheffe coffee origin” plus 40 long-tail variations. The sourcing page pulls trust-building traffic that converts at 4 to 6 percent because the shopper landed pattern-matching on transparency and named provenance. Every sourcing page includes farmer or cooperative quotes, harvest dates, and a link back to 3 to 5 hero SKU pages that source from the named supplier.
Vejrø hospitality content case study
Vejrø Resort, a Danish private-island destination with an on-site restaurant focused on organic, locally sourced cuisine, joined us with strong social engagement and no organic-search real estate. Guests found the resort on Instagram but never in Google search for terms like “private island resort Denmark,” “farm-to-table hospitality Denmark,” or “Vejrø restaurant.” The same organic-search gap shows up on DTC food brands running paid social at 20,000 dollars monthly with a broken blog and zero recipe schema.
We built the conversion-focused website with on-site and off-site SEO tuned to the travel-niche keyword clusters, competitor analysis against comparable boutique resorts, and mobile-first design prioritizing guest discovery. Every page carried the structured data qualifying it for Google’s rich results in the hospitality category. Every internal link pushed authority toward the direct-booking conversion path.
Three months later, Vejrø hit 10,000 plus organic visitors, ranked for 200 plus first-page keywords, and pulled a 2.2 percent booking conversion rate from organic traffic. The same pattern applies to content marketing for food brands: recipe schema, ingredient comparison guides, and sourcing story pages pull organic traffic at 20 to 40 percent conversion into hero SKU pages inside 6 months when the content quality matches search intent and every page carries the right structured data markup. Vejrø also proved out the reporting discipline: every monthly report named the exact page, the exact keyword cluster, and the exact search feature (rich result, sitelinks, image pack) driving the incremental organic revenue instead of hiding behind aggregate traffic charts.
Recipe cadence and content calendar for food brands
Recipe cadence on a working food brand content calendar ships 2 to 4 new recipes per week during the first 6 months and drops to 1 per week at maturity. Each recipe takes 4 to 6 hours to produce (write, test in the kitchen, photograph, schema author, publish). At 3 recipes per week, the brand hits 78 recipes inside 6 months plus a backlog of ingredient comparison and sourcing content queued behind the recipe production line.
| Content pillar | Target volume year 1 | Production cost per piece | Refresh cadence |
|---|---|---|---|
| Recipe hub | 40 to 100 recipes | $180 to $320 | Every 12 months |
| Ingredient comparison guides | 12 to 24 guides | $450 to $780 | Every 18 months |
| Sourcing story pages | 6 to 12 pages | $680 to $1,200 | Every 24 months |
| Buyer intent content | 8 to 16 pieces | $220 to $420 | Every 12 months |
Photography as a content calendar constraint
Photography is the actual constraint on recipe cadence, not writing. Every recipe needs 6 to 12 photos: hero shot, ingredient flat lay, prep in progress, plated result, storage, and step shots for the schema markup. A working food brand batches photography 8 recipes at a time to keep the cost per recipe under 200 dollars. Skip the batching and the per-recipe cost climbs to 400 to 600 dollars, which caps recipe cadence at 1 per week and slows organic ranking timeline by 6 months.
Seasonal content calendar planning
Seasonal content calendar planning maps recipes and comparison guides to the seasonal windows they need to rank in. A Christmas cookie recipe needs to publish in September to rank by early December. A Valentine’s chocolate guide needs to publish in November to rank by early February. A back-to-school lunchbox recipe needs to publish in June to rank by late August. The 60-to-90-day ranking curve dictates the calendar.
Creator syndication inside food brand content
Creator syndication on food brand content marketing amplifies the recipe hub through Instagram Reels, TikTok, and YouTube Shorts creators paid to post their own version of the brand’s hero recipes. The creator content pulls net-new audiences into the recipe hub through the creator’s Link in Bio or Amazon Storefront tag. The syndication calendar names 12 to 30 creators per quarter with specific recipes assigned to each.
One brand we picked up had a spreadsheet titled “creator outreach 2023” with 47 rows and 3 responses. All 3 responses were auto-replies. The spreadsheet named zero recipes and offered flat rates below 100 dollars per post. Nobody posts a 30-second video for 87 dollars flat. Nobody.
Creator content commercial terms that work
Working creator content commercial terms run 350 to 1,500 dollars flat per post plus a 12 to 25 percent commission on tagged sales across a 30-day window. The commission mechanic pulls creators into follow-up posts because the incremental revenue continues past the initial fee. Mid-tier creators (30k to 150k followers) hit the sweet spot for food brand content because their engagement rate typically runs 4 to 8 percent versus 0.8 to 1.6 percent on mega-creators.
Content brief structure for creator partnerships
The content brief structure for creator partnerships runs a single page: the SKU, the specific recipe or usage occasion, 3 required brand mentions, 3 restricted claims (no health claims on non-medical SKUs), the pricing angle, the affiliate link, and 3 example videos that hit the tone. The brief avoids over-scripting because over-scripted creator content underperforms native creator voice by 40 to 60 percent on engagement rate.
Buyer intent content for food brand blogs
Buyer intent content on food brand blogs covers 8 to 16 pieces targeting explicit purchase-decision queries: “where to buy [brand],” “[brand] subscription vs. one-time,” “best [category] for [use case],” and “[brand] gift bundle.” Every buyer intent piece runs 1,400 to 2,400 words with a comparison table, product cards, and a clear conversion path to the specific SKU that matches the query intent. Buyer intent content converts at 3 to 6 percent versus 1 to 2 percent on recipe content because the shopper landed already planning to buy, not exploring a usage occasion.
Where-to-buy content structure
Where-to-buy content structure covers online (DTC storefront, Amazon, Target.com, Whole Foods online), retail (specific chain locators with the store finder embedded), and international (customs limitations, retailer partners abroad). Every piece names specific retailers, links to the store locator, and includes an FAQ block covering shipping availability, subscription options, and gift card compatibility. Where-to-buy content ranks for branded discovery queries the DTC storefront otherwise loses to competitor affiliate reviews.
Subscription versus one-time comparison content
Subscription versus one-time comparison content converts subscription commitments at 3 to 6 percent because it addresses the price-sensitivity concern head-on with a specific math table. The piece covers the discount structure (15 percent lifetime), the skip-a-month mechanic, the pause-anytime rule, the cancellation policy, and the specific yearly savings for the brand’s average consumption cadence. Cross-reference the retention structure on our food and beverage marketing retainer page.
Content refresh cadence on food brand pillars
Content refresh cadence on food brand content pillars runs a rolling audit every 12 to 24 months by pillar. Recipes get refreshed every 12 months with new photography, updated schema, and any nutrition or ingredient adjustments. Ingredient comparison guides refresh every 18 months to update market data. Sourcing story pages refresh every 24 months to reflect farm partnership changes and new harvest angles. Buyer intent content refreshes every 12 months to update retailer availability and pricing.
Recipe refresh priority order
Recipe refresh priority runs by organic traffic rank. The top 20 recipes by monthly organic sessions get refreshed first (new photography, schema audit, related recipe internal links, updated nutrition). The next 40 get refreshed at 15 months. The remaining recipes get refreshed opportunistically when the ranking slips past position 15 in Google. Skipping the refresh cadence lets recipe rankings drift out of the top 3 inside 18 months as newer competitor recipes take the position.
Schema audit checklist per refresh
The schema audit checklist per refresh runs 8 items: Recipe schema completeness, aggregateRating count and accuracy, nutrition data accuracy, prepTime and cookTime match the recipe body, image URLs valid at CDN, related recipe internal links working, product card SKU URL live, and Google Search Console rich result eligibility validated. This checklist takes 20 minutes per recipe and prevents the schema drift that costs recipe rankings 20 to 40 positions quietly.
Reporting cadence for food brand content marketing
Reporting cadence on food brand content marketing runs a monthly executive report plus a quarterly business review. The monthly report ships in the first business week and covers organic sessions by pillar, top 10 ranking recipes with position trend, ingredient guide ranking movements, sourcing page performance, and organic-attributed DTC revenue. Every number carries a comparison to the prior month and a plain-language interpretation the founder reads in 7 minutes.
Metrics that matter for content marketing
Metrics that matter for food brand content marketing: organic sessions by pillar, recipe rich result impressions in Search Console, organic conversion rate to hero SKU pages, organic-attributed DTC revenue, and top 20 ranking positions by monthly organic sessions. Vanity metrics that do not matter: total pageviews without conversion context, average time on page without conversion attribution, and social share counts. The monthly report skips the vanity block entirely.
Quarterly business review structure
The quarterly business review runs 90 minutes with the founder, head of content, and SEO lead. Agenda: organic traffic trend by pillar, top 10 winning content pieces, top 10 losing content pieces (candidates for refresh or removal), competitive gap analysis against 5 named competitor brands, and next quarter’s content calendar with recipes and ingredient guides queued. According to Ahrefs content marketing research, brands running quarterly content audits outperform brands running annual audits by 40 to 70 percent on organic revenue over a 24-month window.
Internal linking discipline across food brand content
Internal linking discipline across food brand content moves authority from recipe pages toward hero SKU product pages and comparison guides. Every recipe links to the hero SKU it uses inline (once in the ingredient list, once in a bottom call-out card). Every ingredient comparison guide links to 3 to 6 recipes using the winning ingredient plus the hero SKU product page. Every sourcing story links to the 2 to 4 SKUs sourced from that specific farm or cooperative.
Anchor text strategy across recipe hubs
Anchor text on internal links varies across recipe hubs to avoid over-optimization patterns Google penalizes. Exact-match anchor (“single-origin Ethiopian coffee”) runs on 20 to 30 percent of internal links. Partial-match variations (“our Ethiopian roast”) run on 30 to 40 percent. Branded anchors (the SKU name) run on 20 to 30 percent. Generic anchors (“shop the coffee”) fill the remaining 10 to 20 percent. This ratio holds ranking without triggering the over-optimization penalty that shows up on brands that anchor-text-stuff every internal link with the same exact-match keyword. Cross-reference the linking layer on our food and beverage web design page.
Link equity from ingredient guides to SKU pages
Link equity from ingredient guides passes to SKU pages when the guide’s comparison table names the hero SKU in the winning column with a product card, and when the guide’s body links to 3 to 6 recipes that use the winning ingredient. This 3-hop path (guide to recipe to SKU) pushes authority from a high-traffic informational query down to a high-intent transactional page. According to Search Engine Land SEO coverage, informational content that internally links to transactional pages produces 2 to 4 times higher organic revenue than isolated content silos.
Wrapping up content marketing for food brands
Content marketing for food brands is the organic engine that turns a DTC snack, drink, or CPG storefront into a search-driven revenue channel. Recipe hub of 40 to 100 recipes. Ingredient comparison guides at 12 to 24 pieces. Sourcing story pages at 6 to 12 pieces. Buyer intent content at 8 to 16 pieces. Creator syndication calendar with 12 to 30 creators per quarter. Refresh cadence at 12 to 24 months by pillar. Reporting with organic sessions and organic revenue attribution.
If your DTC food brand is running paid social at 20,000 dollars monthly with a broken blog and zero recipe schema, professional content marketing for food brands pays for itself inside the first 90 days on organic traffic captured. Redefine Web ships content marketing inside our monthly retainer packages. Book a call and we will walk through the last three DTC food brands we built recipe hubs for, pillar by pillar.
Anchor text on internal links varies across recipe hubs to avoid over-optimization patterns Google penalizes. Exact-match anchor (“single-origin Ethiopian coffee”) runs on 20 to 30 percent of internal links. Partial-match variations (“our Ethiopian roast”) run on 30 to 40 percent. Branded anchors (the SKU name) run on 20 to 30 percent. Generic anchors (“shop the coffee”) fill the remaining 10 to 20 percent. This ratio holds ranking without triggering the over-optimization penalty that shows up on brands that anchor-text-stuff every internal link with the same exact-match keyword. Cross-reference the linking layer on our food and beverage web design page.
Link equity from ingredient guides to SKU pages
Link equity from ingredient guides passes to SKU pages when the guide’s comparison table names the hero SKU in the winning column with a product card, and when the guide’s body links to 3 to 6 recipes that use the winning ingredient. This 3-hop path (guide to recipe to SKU) pushes authority from a high-traffic informational query down to a high-intent transactional page. According to Search Engine Land SEO coverage, informational content that internally links to transactional pages produces 2 to 4 times higher organic revenue than isolated content silos.
Wrapping up content marketing for food brands
Content marketing for food brands is the organic engine that turns a DTC snack, drink, or CPG storefront into a search-driven revenue channel. Recipe hub of 40 to 100 recipes. Ingredient comparison guides at 12 to 24 pieces. Sourcing story pages at 6 to 12 pieces. Buyer intent content at 8 to 16 pieces. Creator syndication calendar with 12 to 30 creators per quarter. Refresh cadence at 12 to 24 months by pillar. Reporting with organic sessions and organic revenue attribution.
If your DTC food brand is running paid social at 20,000 dollars monthly with a broken blog and zero recipe schema, professional content marketing for food brands pays for itself inside the first 90 days on organic traffic captured. Redefine Web ships content marketing inside our monthly retainer packages. Book a call and we will walk through the last three DTC food brands we built recipe hubs for, pillar by pillar.
Internal linking discipline across food brand content moves authority from recipe pages toward hero SKU product pages and comparison guides. Every recipe links to the hero SKU it uses inline (once in the ingredient list, once in a bottom call-out card). Every ingredient comparison guide links to 3 to 6 recipes using the winning ingredient plus the hero SKU product page. Every sourcing story links to the 2 to 4 SKUs sourced from that specific farm or cooperative.
Anchor text strategy across recipe hubs
Anchor text on internal links varies across recipe hubs to avoid over-optimization patterns Google penalizes. Exact-match anchor (“single-origin Ethiopian coffee”) runs on 20 to 30 percent of internal links. Partial-match variations (“our Ethiopian roast”) run on 30 to 40 percent. Branded anchors (the SKU name) run on 20 to 30 percent. Generic anchors (“shop the coffee”) fill the remaining 10 to 20 percent. This ratio holds ranking without triggering the over-optimization penalty that shows up on brands that anchor-text-stuff every internal link with the same exact-match keyword. Cross-reference the linking layer on our food and beverage web design page.
Link equity from ingredient guides to SKU pages
Link equity from ingredient guides passes to SKU pages when the guide’s comparison table names the hero SKU in the winning column with a product card, and when the guide’s body links to 3 to 6 recipes that use the winning ingredient. This 3-hop path (guide to recipe to SKU) pushes authority from a high-traffic informational query down to a high-intent transactional page. According to Search Engine Land SEO coverage, informational content that internally links to transactional pages produces 2 to 4 times higher organic revenue than isolated content silos.
Wrapping up content marketing for food brands
Content marketing for food brands is the organic engine that turns a DTC snack, drink, or CPG storefront into a search-driven revenue channel. Recipe hub of 40 to 100 recipes. Ingredient comparison guides at 12 to 24 pieces. Sourcing story pages at 6 to 12 pieces. Buyer intent content at 8 to 16 pieces. Creator syndication calendar with 12 to 30 creators per quarter. Refresh cadence at 12 to 24 months by pillar. Reporting with organic sessions and organic revenue attribution.
If your DTC food brand is running paid social at 20,000 dollars monthly with a broken blog and zero recipe schema, professional content marketing for food brands pays for itself inside the first 90 days on organic traffic captured. Redefine Web ships content marketing inside our monthly retainer packages. Book a call and we will walk through the last three DTC food brands we built recipe hubs for, pillar by pillar.
Content marketing for food brands starts with a recipe hub because recipe queries account for 40 to 60 percent of high-intent search volume in the food category. Every hero SKU needs 4 to 12 recipes anchored to it, each targeting a specific occasion and audience.
Skip the recipe hub and the brand loses the search real estate that pulls DTC storefront traffic month over month at zero incremental paid cost. Recipe traffic converts at 2 to 4 percent because the shopper landed with usage intent, not passive discovery, which is why food brands win on recipes.
Recipe schema and Google rich result eligibility
Every recipe page ships schema.org Recipe markup including cookTime, prepTime, recipeIngredient, recipeInstructions, nutrition, and aggregateRating. Correctly marked-up recipes qualify for Google’s recipe rich result carousel that pulls 3 to 6 times higher click-through rate than a plain blue link. The schema layer takes 15 minutes per recipe to author and 30 minutes to validate in Google Search Console. Cross-reference the recipe search stack on our food and beverage SEO page.
Recipe hub structure that scales
The recipe hub structure runs 40 to 100 recipes at maturity, organized by hero SKU (4 to 12 recipes per SKU) plus occasion tags (breakfast, weeknight dinner, meal prep, brunch, holiday). Every recipe links back to the hero SKU product page with the SKU embedded in an inline card. The hub earns internal linking value from ingredient comparison guides and the sourcing story pages, which feeds recipe ranking on Google. According to Google Search Central recipe structured data guidance, complete Recipe schema markup is required for eligibility in the recipe carousel and the ingredient search filter.
Pillar structure for food brand content marketing
The pillar structure on content marketing for food brands runs 4 content pillars concurrently: recipe hub (40 to 100 recipes), ingredient comparison guides (12 to 24 guides), sourcing story pages (6 to 12 pages), and buyer intent content (where to buy, subscription vs. one-time, gift bundle guides). Every pillar covers a distinct search intent and every pillar links back to the hero SKU product pages.
Ingredient comparison guide format
Ingredient comparison guides run 1,800 to 3,200 words comparing 2 to 4 ingredient types on 6 to 10 attributes with a comparison table, real-world use case examples, and links to the hero SKU that uses the specific ingredient. Example: organic vs. conventional oats compares nutritional profile, sourcing chain, cost, environmental impact, and taste on a 6-column table. The brand’s SKU appears in the winning column with a product card. These guides rank 3 to 8 months after publication and pull steady-state organic traffic.
Sourcing story pages that build trust
Sourcing story pages name the specific farms, cooperatives, or suppliers the brand sources from, with photos of the farms, farmer quotes, and specific harvest windows. A coffee brand’s Ethiopian farm page ranks for “single-origin Ethiopian coffee” and “Yirgacheffe coffee origin” plus 40 long-tail variations. The sourcing page pulls trust-building traffic that converts at 4 to 6 percent because the shopper landed pattern-matching on transparency and named provenance. Every sourcing page includes farmer or cooperative quotes, harvest dates, and a link back to 3 to 5 hero SKU pages that source from the named supplier.
Vejrø hospitality content case study
Vejrø Resort, a Danish private-island destination with an on-site restaurant focused on organic, locally sourced cuisine, joined us with strong social engagement and no organic-search real estate. Guests found the resort on Instagram but never in Google search for terms like “private island resort Denmark,” “farm-to-table hospitality Denmark,” or “Vejrø restaurant.” The same organic-search gap shows up on DTC food brands running paid social at 20,000 dollars monthly with a broken blog and zero recipe schema.
We built the conversion-focused website with on-site and off-site SEO tuned to the travel-niche keyword clusters, competitor analysis against comparable boutique resorts, and mobile-first design prioritizing guest discovery. Every page carried the structured data qualifying it for Google’s rich results in the hospitality category. Every internal link pushed authority toward the direct-booking conversion path.
Three months later, Vejrø hit 10,000 plus organic visitors, ranked for 200 plus first-page keywords, and pulled a 2.2 percent booking conversion rate from organic traffic. The same pattern applies to content marketing for food brands: recipe schema, ingredient comparison guides, and sourcing story pages pull organic traffic at 20 to 40 percent conversion into hero SKU pages inside 6 months when the content quality matches search intent and every page carries the right structured data markup. Vejrø also proved out the reporting discipline: every monthly report named the exact page, the exact keyword cluster, and the exact search feature (rich result, sitelinks, image pack) driving the incremental organic revenue instead of hiding behind aggregate traffic charts.
Recipe cadence and content calendar for food brands
Recipe cadence on a working food brand content calendar ships 2 to 4 new recipes per week during the first 6 months and drops to 1 per week at maturity. Each recipe takes 4 to 6 hours to produce (write, test in the kitchen, photograph, schema author, publish). At 3 recipes per week, the brand hits 78 recipes inside 6 months plus a backlog of ingredient comparison and sourcing content queued behind the recipe production line.
| Content pillar | Target volume year 1 | Production cost per piece | Refresh cadence |
|---|---|---|---|
| Recipe hub | 40 to 100 recipes | $180 to $320 | Every 12 months |
| Ingredient comparison guides | 12 to 24 guides | $450 to $780 | Every 18 months |
| Sourcing story pages | 6 to 12 pages | $680 to $1,200 | Every 24 months |
| Buyer intent content | 8 to 16 pieces | $220 to $420 | Every 12 months |
Photography as a content calendar constraint
Photography is the actual constraint on recipe cadence, not writing. Every recipe needs 6 to 12 photos: hero shot, ingredient flat lay, prep in progress, plated result, storage, and step shots for the schema markup. A working food brand batches photography 8 recipes at a time to keep the cost per recipe under 200 dollars. Skip the batching and the per-recipe cost climbs to 400 to 600 dollars, which caps recipe cadence at 1 per week and slows organic ranking timeline by 6 months.
Seasonal content calendar planning
Seasonal content calendar planning maps recipes and comparison guides to the seasonal windows they need to rank in. A Christmas cookie recipe needs to publish in September to rank by early December. A Valentine’s chocolate guide needs to publish in November to rank by early February. A back-to-school lunchbox recipe needs to publish in June to rank by late August. The 60-to-90-day ranking curve dictates the calendar.
Creator syndication inside food brand content
Creator syndication on food brand content marketing amplifies the recipe hub through Instagram Reels, TikTok, and YouTube Shorts creators paid to post their own version of the brand’s hero recipes. The creator content pulls net-new audiences into the recipe hub through the creator’s Link in Bio or Amazon Storefront tag. The syndication calendar names 12 to 30 creators per quarter with specific recipes assigned to each.
One brand we picked up had a spreadsheet titled “creator outreach 2023” with 47 rows and 3 responses. All 3 responses were auto-replies. The spreadsheet named zero recipes and offered flat rates below 100 dollars per post. Nobody posts a 30-second video for 87 dollars flat. Nobody.
Creator content commercial terms that work
Working creator content commercial terms run 350 to 1,500 dollars flat per post plus a 12 to 25 percent commission on tagged sales across a 30-day window. The commission mechanic pulls creators into follow-up posts because the incremental revenue continues past the initial fee. Mid-tier creators (30k to 150k followers) hit the sweet spot for food brand content because their engagement rate typically runs 4 to 8 percent versus 0.8 to 1.6 percent on mega-creators.
Content brief structure for creator partnerships
The content brief structure for creator partnerships runs a single page: the SKU, the specific recipe or usage occasion, 3 required brand mentions, 3 restricted claims (no health claims on non-medical SKUs), the pricing angle, the affiliate link, and 3 example videos that hit the tone. The brief avoids over-scripting because over-scripted creator content underperforms native creator voice by 40 to 60 percent on engagement rate.
Buyer intent content for food brand blogs
Buyer intent content on food brand blogs covers 8 to 16 pieces targeting explicit purchase-decision queries: “where to buy [brand],” “[brand] subscription vs. one-time,” “best [category] for [use case],” and “[brand] gift bundle.” Every buyer intent piece runs 1,400 to 2,400 words with a comparison table, product cards, and a clear conversion path to the specific SKU that matches the query intent. Buyer intent content converts at 3 to 6 percent versus 1 to 2 percent on recipe content because the shopper landed already planning to buy, not exploring a usage occasion.
Where-to-buy content structure
Where-to-buy content structure covers online (DTC storefront, Amazon, Target.com, Whole Foods online), retail (specific chain locators with the store finder embedded), and international (customs limitations, retailer partners abroad). Every piece names specific retailers, links to the store locator, and includes an FAQ block covering shipping availability, subscription options, and gift card compatibility. Where-to-buy content ranks for branded discovery queries the DTC storefront otherwise loses to competitor affiliate reviews.
Subscription versus one-time comparison content
Subscription versus one-time comparison content converts subscription commitments at 3 to 6 percent because it addresses the price-sensitivity concern head-on with a specific math table. The piece covers the discount structure (15 percent lifetime), the skip-a-month mechanic, the pause-anytime rule, the cancellation policy, and the specific yearly savings for the brand’s average consumption cadence. Cross-reference the retention structure on our food and beverage marketing retainer page.
Content refresh cadence on food brand pillars
Content refresh cadence on food brand content pillars runs a rolling audit every 12 to 24 months by pillar. Recipes get refreshed every 12 months with new photography, updated schema, and any nutrition or ingredient adjustments. Ingredient comparison guides refresh every 18 months to update market data. Sourcing story pages refresh every 24 months to reflect farm partnership changes and new harvest angles. Buyer intent content refreshes every 12 months to update retailer availability and pricing.
Recipe refresh priority order
Recipe refresh priority runs by organic traffic rank. The top 20 recipes by monthly organic sessions get refreshed first (new photography, schema audit, related recipe internal links, updated nutrition). The next 40 get refreshed at 15 months. The remaining recipes get refreshed opportunistically when the ranking slips past position 15 in Google. Skipping the refresh cadence lets recipe rankings drift out of the top 3 inside 18 months as newer competitor recipes take the position.
Schema audit checklist per refresh
The schema audit checklist per refresh runs 8 items: Recipe schema completeness, aggregateRating count and accuracy, nutrition data accuracy, prepTime and cookTime match the recipe body, image URLs valid at CDN, related recipe internal links working, product card SKU URL live, and Google Search Console rich result eligibility validated. This checklist takes 20 minutes per recipe and prevents the schema drift that costs recipe rankings 20 to 40 positions quietly.
Reporting cadence for food brand content marketing
Reporting cadence on food brand content marketing runs a monthly executive report plus a quarterly business review. The monthly report ships in the first business week and covers organic sessions by pillar, top 10 ranking recipes with position trend, ingredient guide ranking movements, sourcing page performance, and organic-attributed DTC revenue. Every number carries a comparison to the prior month and a plain-language interpretation the founder reads in 7 minutes.
Metrics that matter for content marketing
Metrics that matter for food brand content marketing: organic sessions by pillar, recipe rich result impressions in Search Console, organic conversion rate to hero SKU pages, organic-attributed DTC revenue, and top 20 ranking positions by monthly organic sessions. Vanity metrics that do not matter: total pageviews without conversion context, average time on page without conversion attribution, and social share counts. The monthly report skips the vanity block entirely.
Quarterly business review structure
The quarterly business review runs 90 minutes with the founder, head of content, and SEO lead. Agenda: organic traffic trend by pillar, top 10 winning content pieces, top 10 losing content pieces (candidates for refresh or removal), competitive gap analysis against 5 named competitor brands, and next quarter’s content calendar with recipes and ingredient guides queued. According to Ahrefs content marketing research, brands running quarterly content audits outperform brands running annual audits by 40 to 70 percent on organic revenue over a 24-month window.
Internal linking discipline across food brand content
Internal linking discipline across food brand content moves authority from recipe pages toward hero SKU product pages and comparison guides. Every recipe links to the hero SKU it uses inline (once in the ingredient list, once in a bottom call-out card). Every ingredient comparison guide links to 3 to 6 recipes using the winning ingredient plus the hero SKU product page. Every sourcing story links to the 2 to 4 SKUs sourced from that specific farm or cooperative.
Anchor text strategy across recipe hubs
Anchor text on internal links varies across recipe hubs to avoid over-optimization patterns Google penalizes. Exact-match anchor (“single-origin Ethiopian coffee”) runs on 20 to 30 percent of internal links. Partial-match variations (“our Ethiopian roast”) run on 30 to 40 percent. Branded anchors (the SKU name) run on 20 to 30 percent. Generic anchors (“shop the coffee”) fill the remaining 10 to 20 percent. This ratio holds ranking without triggering the over-optimization penalty that shows up on brands that anchor-text-stuff every internal link with the same exact-match keyword. Cross-reference the linking layer on our food and beverage web design page.
Link equity from ingredient guides to SKU pages
Link equity from ingredient guides passes to SKU pages when the guide’s comparison table names the hero SKU in the winning column with a product card, and when the guide’s body links to 3 to 6 recipes that use the winning ingredient. This 3-hop path (guide to recipe to SKU) pushes authority from a high-traffic informational query down to a high-intent transactional page. According to Search Engine Land SEO coverage, informational content that internally links to transactional pages produces 2 to 4 times higher organic revenue than isolated content silos.
Wrapping up content marketing for food brands
Content marketing for food brands is the organic engine that turns a DTC snack, drink, or CPG storefront into a search-driven revenue channel. Recipe hub of 40 to 100 recipes. Ingredient comparison guides at 12 to 24 pieces. Sourcing story pages at 6 to 12 pieces. Buyer intent content at 8 to 16 pieces. Creator syndication calendar with 12 to 30 creators per quarter. Refresh cadence at 12 to 24 months by pillar. Reporting with organic sessions and organic revenue attribution.
If your DTC food brand is running paid social at 20,000 dollars monthly with a broken blog and zero recipe schema, professional content marketing for food brands pays for itself inside the first 90 days on organic traffic captured. Redefine Web ships content marketing inside our monthly retainer packages. Book a call and we will walk through the last three DTC food brands we built recipe hubs for, pillar by pillar.
Content marketing for food brands starts with a recipe hub because recipe queries account for 40 to 60 percent of high-intent search volume in the food category. Every hero SKU needs 4 to 12 recipes anchored to it, each targeting a specific occasion and audience.
Skip the recipe hub and the brand loses the search real estate that pulls DTC storefront traffic month over month at zero incremental paid cost. Recipe traffic converts at 2 to 4 percent because the shopper landed with usage intent, not passive discovery, which is why food brands win on recipes.
Recipe schema and Google rich result eligibility
Every recipe page ships schema.org Recipe markup including cookTime, prepTime, recipeIngredient, recipeInstructions, nutrition, and aggregateRating. Correctly marked-up recipes qualify for Google’s recipe rich result carousel that pulls 3 to 6 times higher click-through rate than a plain blue link. The schema layer takes 15 minutes per recipe to author and 30 minutes to validate in Google Search Console. Cross-reference the recipe search stack on our food and beverage SEO page.
Recipe hub structure that scales
The recipe hub structure runs 40 to 100 recipes at maturity, organized by hero SKU (4 to 12 recipes per SKU) plus occasion tags (breakfast, weeknight dinner, meal prep, brunch, holiday). Every recipe links back to the hero SKU product page with the SKU embedded in an inline card. The hub earns internal linking value from ingredient comparison guides and the sourcing story pages, which feeds recipe ranking on Google. According to Google Search Central recipe structured data guidance, complete Recipe schema markup is required for eligibility in the recipe carousel and the ingredient search filter.
Pillar structure for food brand content marketing
The pillar structure on content marketing for food brands runs 4 content pillars concurrently: recipe hub (40 to 100 recipes), ingredient comparison guides (12 to 24 guides), sourcing story pages (6 to 12 pages), and buyer intent content (where to buy, subscription vs. one-time, gift bundle guides). Every pillar covers a distinct search intent and every pillar links back to the hero SKU product pages.
Ingredient comparison guide format
Ingredient comparison guides run 1,800 to 3,200 words comparing 2 to 4 ingredient types on 6 to 10 attributes with a comparison table, real-world use case examples, and links to the hero SKU that uses the specific ingredient. Example: organic vs. conventional oats compares nutritional profile, sourcing chain, cost, environmental impact, and taste on a 6-column table. The brand’s SKU appears in the winning column with a product card. These guides rank 3 to 8 months after publication and pull steady-state organic traffic.
Sourcing story pages that build trust
Sourcing story pages name the specific farms, cooperatives, or suppliers the brand sources from, with photos of the farms, farmer quotes, and specific harvest windows. A coffee brand’s Ethiopian farm page ranks for “single-origin Ethiopian coffee” and “Yirgacheffe coffee origin” plus 40 long-tail variations. The sourcing page pulls trust-building traffic that converts at 4 to 6 percent because the shopper landed pattern-matching on transparency and named provenance. Every sourcing page includes farmer or cooperative quotes, harvest dates, and a link back to 3 to 5 hero SKU pages that source from the named supplier.
Vejrø hospitality content case study
Vejrø Resort, a Danish private-island destination with an on-site restaurant focused on organic, locally sourced cuisine, joined us with strong social engagement and no organic-search real estate. Guests found the resort on Instagram but never in Google search for terms like “private island resort Denmark,” “farm-to-table hospitality Denmark,” or “Vejrø restaurant.” The same organic-search gap shows up on DTC food brands running paid social at 20,000 dollars monthly with a broken blog and zero recipe schema.
We built the conversion-focused website with on-site and off-site SEO tuned to the travel-niche keyword clusters, competitor analysis against comparable boutique resorts, and mobile-first design prioritizing guest discovery. Every page carried the structured data qualifying it for Google’s rich results in the hospitality category. Every internal link pushed authority toward the direct-booking conversion path.
Three months later, Vejrø hit 10,000 plus organic visitors, ranked for 200 plus first-page keywords, and pulled a 2.2 percent booking conversion rate from organic traffic. The same pattern applies to content marketing for food brands: recipe schema, ingredient comparison guides, and sourcing story pages pull organic traffic at 20 to 40 percent conversion into hero SKU pages inside 6 months when the content quality matches search intent and every page carries the right structured data markup. Vejrø also proved out the reporting discipline: every monthly report named the exact page, the exact keyword cluster, and the exact search feature (rich result, sitelinks, image pack) driving the incremental organic revenue instead of hiding behind aggregate traffic charts.
Recipe cadence and content calendar for food brands
Recipe cadence on a working food brand content calendar ships 2 to 4 new recipes per week during the first 6 months and drops to 1 per week at maturity. Each recipe takes 4 to 6 hours to produce (write, test in the kitchen, photograph, schema author, publish). At 3 recipes per week, the brand hits 78 recipes inside 6 months plus a backlog of ingredient comparison and sourcing content queued behind the recipe production line.
| Content pillar | Target volume year 1 | Production cost per piece | Refresh cadence |
|---|---|---|---|
| Recipe hub | 40 to 100 recipes | $180 to $320 | Every 12 months |
| Ingredient comparison guides | 12 to 24 guides | $450 to $780 | Every 18 months |
| Sourcing story pages | 6 to 12 pages | $680 to $1,200 | Every 24 months |
| Buyer intent content | 8 to 16 pieces | $220 to $420 | Every 12 months |
Photography as a content calendar constraint
Photography is the actual constraint on recipe cadence, not writing. Every recipe needs 6 to 12 photos: hero shot, ingredient flat lay, prep in progress, plated result, storage, and step shots for the schema markup. A working food brand batches photography 8 recipes at a time to keep the cost per recipe under 200 dollars. Skip the batching and the per-recipe cost climbs to 400 to 600 dollars, which caps recipe cadence at 1 per week and slows organic ranking timeline by 6 months.
Seasonal content calendar planning
Seasonal content calendar planning maps recipes and comparison guides to the seasonal windows they need to rank in. A Christmas cookie recipe needs to publish in September to rank by early December. A Valentine’s chocolate guide needs to publish in November to rank by early February. A back-to-school lunchbox recipe needs to publish in June to rank by late August. The 60-to-90-day ranking curve dictates the calendar.
Creator syndication inside food brand content
Creator syndication on food brand content marketing amplifies the recipe hub through Instagram Reels, TikTok, and YouTube Shorts creators paid to post their own version of the brand’s hero recipes. The creator content pulls net-new audiences into the recipe hub through the creator’s Link in Bio or Amazon Storefront tag. The syndication calendar names 12 to 30 creators per quarter with specific recipes assigned to each.
One brand we picked up had a spreadsheet titled “creator outreach 2023” with 47 rows and 3 responses. All 3 responses were auto-replies. The spreadsheet named zero recipes and offered flat rates below 100 dollars per post. Nobody posts a 30-second video for 87 dollars flat. Nobody.
Creator content commercial terms that work
Working creator content commercial terms run 350 to 1,500 dollars flat per post plus a 12 to 25 percent commission on tagged sales across a 30-day window. The commission mechanic pulls creators into follow-up posts because the incremental revenue continues past the initial fee. Mid-tier creators (30k to 150k followers) hit the sweet spot for food brand content because their engagement rate typically runs 4 to 8 percent versus 0.8 to 1.6 percent on mega-creators.
Content brief structure for creator partnerships
The content brief structure for creator partnerships runs a single page: the SKU, the specific recipe or usage occasion, 3 required brand mentions, 3 restricted claims (no health claims on non-medical SKUs), the pricing angle, the affiliate link, and 3 example videos that hit the tone. The brief avoids over-scripting because over-scripted creator content underperforms native creator voice by 40 to 60 percent on engagement rate.
Buyer intent content for food brand blogs
Buyer intent content on food brand blogs covers 8 to 16 pieces targeting explicit purchase-decision queries: “where to buy [brand],” “[brand] subscription vs. one-time,” “best [category] for [use case],” and “[brand] gift bundle.” Every buyer intent piece runs 1,400 to 2,400 words with a comparison table, product cards, and a clear conversion path to the specific SKU that matches the query intent. Buyer intent content converts at 3 to 6 percent versus 1 to 2 percent on recipe content because the shopper landed already planning to buy, not exploring a usage occasion.
Where-to-buy content structure
Where-to-buy content structure covers online (DTC storefront, Amazon, Target.com, Whole Foods online), retail (specific chain locators with the store finder embedded), and international (customs limitations, retailer partners abroad). Every piece names specific retailers, links to the store locator, and includes an FAQ block covering shipping availability, subscription options, and gift card compatibility. Where-to-buy content ranks for branded discovery queries the DTC storefront otherwise loses to competitor affiliate reviews.
Subscription versus one-time comparison content
Subscription versus one-time comparison content converts subscription commitments at 3 to 6 percent because it addresses the price-sensitivity concern head-on with a specific math table. The piece covers the discount structure (15 percent lifetime), the skip-a-month mechanic, the pause-anytime rule, the cancellation policy, and the specific yearly savings for the brand’s average consumption cadence. Cross-reference the retention structure on our food and beverage marketing retainer page.
Content refresh cadence on food brand pillars
Content refresh cadence on food brand content pillars runs a rolling audit every 12 to 24 months by pillar. Recipes get refreshed every 12 months with new photography, updated schema, and any nutrition or ingredient adjustments. Ingredient comparison guides refresh every 18 months to update market data. Sourcing story pages refresh every 24 months to reflect farm partnership changes and new harvest angles. Buyer intent content refreshes every 12 months to update retailer availability and pricing.
Recipe refresh priority order
Recipe refresh priority runs by organic traffic rank. The top 20 recipes by monthly organic sessions get refreshed first (new photography, schema audit, related recipe internal links, updated nutrition). The next 40 get refreshed at 15 months. The remaining recipes get refreshed opportunistically when the ranking slips past position 15 in Google. Skipping the refresh cadence lets recipe rankings drift out of the top 3 inside 18 months as newer competitor recipes take the position.
Schema audit checklist per refresh
The schema audit checklist per refresh runs 8 items: Recipe schema completeness, aggregateRating count and accuracy, nutrition data accuracy, prepTime and cookTime match the recipe body, image URLs valid at CDN, related recipe internal links working, product card SKU URL live, and Google Search Console rich result eligibility validated. This checklist takes 20 minutes per recipe and prevents the schema drift that costs recipe rankings 20 to 40 positions quietly.
Reporting cadence for food brand content marketing
Reporting cadence on food brand content marketing runs a monthly executive report plus a quarterly business review. The monthly report ships in the first business week and covers organic sessions by pillar, top 10 ranking recipes with position trend, ingredient guide ranking movements, sourcing page performance, and organic-attributed DTC revenue. Every number carries a comparison to the prior month and a plain-language interpretation the founder reads in 7 minutes.
Metrics that matter for content marketing
Metrics that matter for food brand content marketing: organic sessions by pillar, recipe rich result impressions in Search Console, organic conversion rate to hero SKU pages, organic-attributed DTC revenue, and top 20 ranking positions by monthly organic sessions. Vanity metrics that do not matter: total pageviews without conversion context, average time on page without conversion attribution, and social share counts. The monthly report skips the vanity block entirely.
Quarterly business review structure
The quarterly business review runs 90 minutes with the founder, head of content, and SEO lead. Agenda: organic traffic trend by pillar, top 10 winning content pieces, top 10 losing content pieces (candidates for refresh or removal), competitive gap analysis against 5 named competitor brands, and next quarter’s content calendar with recipes and ingredient guides queued. According to Ahrefs content marketing research, brands running quarterly content audits outperform brands running annual audits by 40 to 70 percent on organic revenue over a 24-month window.
Internal linking discipline across food brand content
Internal linking discipline across food brand content moves authority from recipe pages toward hero SKU product pages and comparison guides. Every recipe links to the hero SKU it uses inline (once in the ingredient list, once in a bottom call-out card). Every ingredient comparison guide links to 3 to 6 recipes using the winning ingredient plus the hero SKU product page. Every sourcing story links to the 2 to 4 SKUs sourced from that specific farm or cooperative.
Anchor text strategy across recipe hubs
Anchor text on internal links varies across recipe hubs to avoid over-optimization patterns Google penalizes. Exact-match anchor (“single-origin Ethiopian coffee”) runs on 20 to 30 percent of internal links. Partial-match variations (“our Ethiopian roast”) run on 30 to 40 percent. Branded anchors (the SKU name) run on 20 to 30 percent. Generic anchors (“shop the coffee”) fill the remaining 10 to 20 percent. This ratio holds ranking without triggering the over-optimization penalty that shows up on brands that anchor-text-stuff every internal link with the same exact-match keyword. Cross-reference the linking layer on our food and beverage web design page.
Link equity from ingredient guides to SKU pages
Link equity from ingredient guides passes to SKU pages when the guide’s comparison table names the hero SKU in the winning column with a product card, and when the guide’s body links to 3 to 6 recipes that use the winning ingredient. This 3-hop path (guide to recipe to SKU) pushes authority from a high-traffic informational query down to a high-intent transactional page. According to Search Engine Land SEO coverage, informational content that internally links to transactional pages produces 2 to 4 times higher organic revenue than isolated content silos.
Wrapping up content marketing for food brands
Content marketing for food brands is the organic engine that turns a DTC snack, drink, or CPG storefront into a search-driven revenue channel. Recipe hub of 40 to 100 recipes. Ingredient comparison guides at 12 to 24 pieces. Sourcing story pages at 6 to 12 pieces. Buyer intent content at 8 to 16 pieces. Creator syndication calendar with 12 to 30 creators per quarter. Refresh cadence at 12 to 24 months by pillar. Reporting with organic sessions and organic revenue attribution.
If your DTC food brand is running paid social at 20,000 dollars monthly with a broken blog and zero recipe schema, professional content marketing for food brands pays for itself inside the first 90 days on organic traffic captured. Redefine Web ships content marketing inside our monthly retainer packages. Book a call and we will walk through the last three DTC food brands we built recipe hubs for, pillar by pillar.
Content marketing for food brands starts with a recipe hub because recipe queries account for 40 to 60 percent of high-intent search volume in the food category. Every hero SKU needs 4 to 12 recipes anchored to it, each targeting a specific occasion and audience.
Skip the recipe hub and the brand loses the search real estate that pulls DTC storefront traffic month over month at zero incremental paid cost. Recipe traffic converts at 2 to 4 percent because the shopper landed with usage intent, not passive discovery, which is why food brands win on recipes.
Recipe schema and Google rich result eligibility
Every recipe page ships schema.org Recipe markup including cookTime, prepTime, recipeIngredient, recipeInstructions, nutrition, and aggregateRating. Correctly marked-up recipes qualify for Google’s recipe rich result carousel that pulls 3 to 6 times higher click-through rate than a plain blue link. The schema layer takes 15 minutes per recipe to author and 30 minutes to validate in Google Search Console. Cross-reference the recipe search stack on our food and beverage SEO page.
Recipe hub structure that scales
The recipe hub structure runs 40 to 100 recipes at maturity, organized by hero SKU (4 to 12 recipes per SKU) plus occasion tags (breakfast, weeknight dinner, meal prep, brunch, holiday). Every recipe links back to the hero SKU product page with the SKU embedded in an inline card. The hub earns internal linking value from ingredient comparison guides and the sourcing story pages, which feeds recipe ranking on Google. According to Google Search Central recipe structured data guidance, complete Recipe schema markup is required for eligibility in the recipe carousel and the ingredient search filter.
Pillar structure for food brand content marketing
The pillar structure on content marketing for food brands runs 4 content pillars concurrently: recipe hub (40 to 100 recipes), ingredient comparison guides (12 to 24 guides), sourcing story pages (6 to 12 pages), and buyer intent content (where to buy, subscription vs. one-time, gift bundle guides). Every pillar covers a distinct search intent and every pillar links back to the hero SKU product pages.
Ingredient comparison guide format
Ingredient comparison guides run 1,800 to 3,200 words comparing 2 to 4 ingredient types on 6 to 10 attributes with a comparison table, real-world use case examples, and links to the hero SKU that uses the specific ingredient. Example: organic vs. conventional oats compares nutritional profile, sourcing chain, cost, environmental impact, and taste on a 6-column table. The brand’s SKU appears in the winning column with a product card. These guides rank 3 to 8 months after publication and pull steady-state organic traffic.
Sourcing story pages that build trust
Sourcing story pages name the specific farms, cooperatives, or suppliers the brand sources from, with photos of the farms, farmer quotes, and specific harvest windows. A coffee brand’s Ethiopian farm page ranks for “single-origin Ethiopian coffee” and “Yirgacheffe coffee origin” plus 40 long-tail variations. The sourcing page pulls trust-building traffic that converts at 4 to 6 percent because the shopper landed pattern-matching on transparency and named provenance. Every sourcing page includes farmer or cooperative quotes, harvest dates, and a link back to 3 to 5 hero SKU pages that source from the named supplier.
Vejrø hospitality content case study
Vejrø Resort, a Danish private-island destination with an on-site restaurant focused on organic, locally sourced cuisine, joined us with strong social engagement and no organic-search real estate. Guests found the resort on Instagram but never in Google search for terms like “private island resort Denmark,” “farm-to-table hospitality Denmark,” or “Vejrø restaurant.” The same organic-search gap shows up on DTC food brands running paid social at 20,000 dollars monthly with a broken blog and zero recipe schema.
We built the conversion-focused website with on-site and off-site SEO tuned to the travel-niche keyword clusters, competitor analysis against comparable boutique resorts, and mobile-first design prioritizing guest discovery. Every page carried the structured data qualifying it for Google’s rich results in the hospitality category. Every internal link pushed authority toward the direct-booking conversion path.
Three months later, Vejrø hit 10,000 plus organic visitors, ranked for 200 plus first-page keywords, and pulled a 2.2 percent booking conversion rate from organic traffic. The same pattern applies to content marketing for food brands: recipe schema, ingredient comparison guides, and sourcing story pages pull organic traffic at 20 to 40 percent conversion into hero SKU pages inside 6 months when the content quality matches search intent and every page carries the right structured data markup. Vejrø also proved out the reporting discipline: every monthly report named the exact page, the exact keyword cluster, and the exact search feature (rich result, sitelinks, image pack) driving the incremental organic revenue instead of hiding behind aggregate traffic charts.
Recipe cadence and content calendar for food brands
Recipe cadence on a working food brand content calendar ships 2 to 4 new recipes per week during the first 6 months and drops to 1 per week at maturity. Each recipe takes 4 to 6 hours to produce (write, test in the kitchen, photograph, schema author, publish). At 3 recipes per week, the brand hits 78 recipes inside 6 months plus a backlog of ingredient comparison and sourcing content queued behind the recipe production line.
| Content pillar | Target volume year 1 | Production cost per piece | Refresh cadence |
|---|---|---|---|
| Recipe hub | 40 to 100 recipes | $180 to $320 | Every 12 months |
| Ingredient comparison guides | 12 to 24 guides | $450 to $780 | Every 18 months |
| Sourcing story pages | 6 to 12 pages | $680 to $1,200 | Every 24 months |
| Buyer intent content | 8 to 16 pieces | $220 to $420 | Every 12 months |
Photography as a content calendar constraint
Photography is the actual constraint on recipe cadence, not writing. Every recipe needs 6 to 12 photos: hero shot, ingredient flat lay, prep in progress, plated result, storage, and step shots for the schema markup. A working food brand batches photography 8 recipes at a time to keep the cost per recipe under 200 dollars. Skip the batching and the per-recipe cost climbs to 400 to 600 dollars, which caps recipe cadence at 1 per week and slows organic ranking timeline by 6 months.
Seasonal content calendar planning
Seasonal content calendar planning maps recipes and comparison guides to the seasonal windows they need to rank in. A Christmas cookie recipe needs to publish in September to rank by early December. A Valentine’s chocolate guide needs to publish in November to rank by early February. A back-to-school lunchbox recipe needs to publish in June to rank by late August. The 60-to-90-day ranking curve dictates the calendar.
Creator syndication inside food brand content
Creator syndication on food brand content marketing amplifies the recipe hub through Instagram Reels, TikTok, and YouTube Shorts creators paid to post their own version of the brand’s hero recipes. The creator content pulls net-new audiences into the recipe hub through the creator’s Link in Bio or Amazon Storefront tag. The syndication calendar names 12 to 30 creators per quarter with specific recipes assigned to each.
One brand we picked up had a spreadsheet titled “creator outreach 2023” with 47 rows and 3 responses. All 3 responses were auto-replies. The spreadsheet named zero recipes and offered flat rates below 100 dollars per post. Nobody posts a 30-second video for 87 dollars flat. Nobody.
Creator content commercial terms that work
Working creator content commercial terms run 350 to 1,500 dollars flat per post plus a 12 to 25 percent commission on tagged sales across a 30-day window. The commission mechanic pulls creators into follow-up posts because the incremental revenue continues past the initial fee. Mid-tier creators (30k to 150k followers) hit the sweet spot for food brand content because their engagement rate typically runs 4 to 8 percent versus 0.8 to 1.6 percent on mega-creators.
Content brief structure for creator partnerships
The content brief structure for creator partnerships runs a single page: the SKU, the specific recipe or usage occasion, 3 required brand mentions, 3 restricted claims (no health claims on non-medical SKUs), the pricing angle, the affiliate link, and 3 example videos that hit the tone. The brief avoids over-scripting because over-scripted creator content underperforms native creator voice by 40 to 60 percent on engagement rate.
Buyer intent content for food brand blogs
Buyer intent content on food brand blogs covers 8 to 16 pieces targeting explicit purchase-decision queries: “where to buy [brand],” “[brand] subscription vs. one-time,” “best [category] for [use case],” and “[brand] gift bundle.” Every buyer intent piece runs 1,400 to 2,400 words with a comparison table, product cards, and a clear conversion path to the specific SKU that matches the query intent. Buyer intent content converts at 3 to 6 percent versus 1 to 2 percent on recipe content because the shopper landed already planning to buy, not exploring a usage occasion.
Where-to-buy content structure
Where-to-buy content structure covers online (DTC storefront, Amazon, Target.com, Whole Foods online), retail (specific chain locators with the store finder embedded), and international (customs limitations, retailer partners abroad). Every piece names specific retailers, links to the store locator, and includes an FAQ block covering shipping availability, subscription options, and gift card compatibility. Where-to-buy content ranks for branded discovery queries the DTC storefront otherwise loses to competitor affiliate reviews.
Subscription versus one-time comparison content
Subscription versus one-time comparison content converts subscription commitments at 3 to 6 percent because it addresses the price-sensitivity concern head-on with a specific math table. The piece covers the discount structure (15 percent lifetime), the skip-a-month mechanic, the pause-anytime rule, the cancellation policy, and the specific yearly savings for the brand’s average consumption cadence. Cross-reference the retention structure on our food and beverage marketing retainer page.
Content refresh cadence on food brand pillars
Content refresh cadence on food brand content pillars runs a rolling audit every 12 to 24 months by pillar. Recipes get refreshed every 12 months with new photography, updated schema, and any nutrition or ingredient adjustments. Ingredient comparison guides refresh every 18 months to update market data. Sourcing story pages refresh every 24 months to reflect farm partnership changes and new harvest angles. Buyer intent content refreshes every 12 months to update retailer availability and pricing.
Recipe refresh priority order
Recipe refresh priority runs by organic traffic rank. The top 20 recipes by monthly organic sessions get refreshed first (new photography, schema audit, related recipe internal links, updated nutrition). The next 40 get refreshed at 15 months. The remaining recipes get refreshed opportunistically when the ranking slips past position 15 in Google. Skipping the refresh cadence lets recipe rankings drift out of the top 3 inside 18 months as newer competitor recipes take the position.
Schema audit checklist per refresh
The schema audit checklist per refresh runs 8 items: Recipe schema completeness, aggregateRating count and accuracy, nutrition data accuracy, prepTime and cookTime match the recipe body, image URLs valid at CDN, related recipe internal links working, product card SKU URL live, and Google Search Console rich result eligibility validated. This checklist takes 20 minutes per recipe and prevents the schema drift that costs recipe rankings 20 to 40 positions quietly.
Reporting cadence for food brand content marketing
Reporting cadence on food brand content marketing runs a monthly executive report plus a quarterly business review. The monthly report ships in the first business week and covers organic sessions by pillar, top 10 ranking recipes with position trend, ingredient guide ranking movements, sourcing page performance, and organic-attributed DTC revenue. Every number carries a comparison to the prior month and a plain-language interpretation the founder reads in 7 minutes.
Metrics that matter for content marketing
Metrics that matter for food brand content marketing: organic sessions by pillar, recipe rich result impressions in Search Console, organic conversion rate to hero SKU pages, organic-attributed DTC revenue, and top 20 ranking positions by monthly organic sessions. Vanity metrics that do not matter: total pageviews without conversion context, average time on page without conversion attribution, and social share counts. The monthly report skips the vanity block entirely.
Quarterly business review structure
The quarterly business review runs 90 minutes with the founder, head of content, and SEO lead. Agenda: organic traffic trend by pillar, top 10 winning content pieces, top 10 losing content pieces (candidates for refresh or removal), competitive gap analysis against 5 named competitor brands, and next quarter’s content calendar with recipes and ingredient guides queued. According to Ahrefs content marketing research, brands running quarterly content audits outperform brands running annual audits by 40 to 70 percent on organic revenue over a 24-month window.
Internal linking discipline across food brand content
Internal linking discipline across food brand content moves authority from recipe pages toward hero SKU product pages and comparison guides. Every recipe links to the hero SKU it uses inline (once in the ingredient list, once in a bottom call-out card). Every ingredient comparison guide links to 3 to 6 recipes using the winning ingredient plus the hero SKU product page. Every sourcing story links to the 2 to 4 SKUs sourced from that specific farm or cooperative.
Anchor text strategy across recipe hubs
Anchor text on internal links varies across recipe hubs to avoid over-optimization patterns Google penalizes. Exact-match anchor (“single-origin Ethiopian coffee”) runs on 20 to 30 percent of internal links. Partial-match variations (“our Ethiopian roast”) run on 30 to 40 percent. Branded anchors (the SKU name) run on 20 to 30 percent. Generic anchors (“shop the coffee”) fill the remaining 10 to 20 percent. This ratio holds ranking without triggering the over-optimization penalty that shows up on brands that anchor-text-stuff every internal link with the same exact-match keyword. Cross-reference the linking layer on our food and beverage web design page.
Link equity from ingredient guides to SKU pages
Link equity from ingredient guides passes to SKU pages when the guide’s comparison table names the hero SKU in the winning column with a product card, and when the guide’s body links to 3 to 6 recipes that use the winning ingredient. This 3-hop path (guide to recipe to SKU) pushes authority from a high-traffic informational query down to a high-intent transactional page. According to Search Engine Land SEO coverage, informational content that internally links to transactional pages produces 2 to 4 times higher organic revenue than isolated content silos.
Wrapping up content marketing for food brands
Content marketing for food brands is the organic engine that turns a DTC snack, drink, or CPG storefront into a search-driven revenue channel. Recipe hub of 40 to 100 recipes. Ingredient comparison guides at 12 to 24 pieces. Sourcing story pages at 6 to 12 pieces. Buyer intent content at 8 to 16 pieces. Creator syndication calendar with 12 to 30 creators per quarter. Refresh cadence at 12 to 24 months by pillar. Reporting with organic sessions and organic revenue attribution.
If your DTC food brand is running paid social at 20,000 dollars monthly with a broken blog and zero recipe schema, professional content marketing for food brands pays for itself inside the first 90 days on organic traffic captured. Redefine Web ships content marketing inside our monthly retainer packages. Book a call and we will walk through the last three DTC food brands we built recipe hubs for, pillar by pillar.
Internal linking discipline across food brand content moves authority from recipe pages toward hero SKU product pages and comparison guides. Every recipe links to the hero SKU it uses inline (once in the ingredient list, once in a bottom call-out card). Every ingredient comparison guide links to 3 to 6 recipes using the winning ingredient plus the hero SKU product page. Every sourcing story links to the 2 to 4 SKUs sourced from that specific farm or cooperative.
Anchor text strategy across recipe hubs
Anchor text on internal links varies across recipe hubs to avoid over-optimization patterns Google penalizes. Exact-match anchor (“single-origin Ethiopian coffee”) runs on 20 to 30 percent of internal links. Partial-match variations (“our Ethiopian roast”) run on 30 to 40 percent. Branded anchors (the SKU name) run on 20 to 30 percent. Generic anchors (“shop the coffee”) fill the remaining 10 to 20 percent. This ratio holds ranking without triggering the over-optimization penalty that shows up on brands that anchor-text-stuff every internal link with the same exact-match keyword. Cross-reference the linking layer on our food and beverage web design page.
Link equity from ingredient guides to SKU pages
Link equity from ingredient guides passes to SKU pages when the guide’s comparison table names the hero SKU in the winning column with a product card, and when the guide’s body links to 3 to 6 recipes that use the winning ingredient. This 3-hop path (guide to recipe to SKU) pushes authority from a high-traffic informational query down to a high-intent transactional page. According to Search Engine Land SEO coverage, informational content that internally links to transactional pages produces 2 to 4 times higher organic revenue than isolated content silos.
Wrapping up content marketing for food brands
Content marketing for food brands is the organic engine that turns a DTC snack, drink, or CPG storefront into a search-driven revenue channel. Recipe hub of 40 to 100 recipes. Ingredient comparison guides at 12 to 24 pieces. Sourcing story pages at 6 to 12 pieces. Buyer intent content at 8 to 16 pieces. Creator syndication calendar with 12 to 30 creators per quarter. Refresh cadence at 12 to 24 months by pillar. Reporting with organic sessions and organic revenue attribution.
If your DTC food brand is running paid social at 20,000 dollars monthly with a broken blog and zero recipe schema, professional content marketing for food brands pays for itself inside the first 90 days on organic traffic captured. Redefine Web ships content marketing inside our monthly retainer packages. Book a call and we will walk through the last three DTC food brands we built recipe hubs for, pillar by pillar.
Content marketing for food brands starts with a recipe hub because recipe queries account for 40 to 60 percent of high-intent search volume in the food category. Every hero SKU needs 4 to 12 recipes anchored to it, each targeting a specific occasion and audience.
Skip the recipe hub and the brand loses the search real estate that pulls DTC storefront traffic month over month at zero incremental paid cost. Recipe traffic converts at 2 to 4 percent because the shopper landed with usage intent, not passive discovery, which is why food brands win on recipes.
Recipe schema and Google rich result eligibility
Every recipe page ships schema.org Recipe markup including cookTime, prepTime, recipeIngredient, recipeInstructions, nutrition, and aggregateRating. Correctly marked-up recipes qualify for Google’s recipe rich result carousel that pulls 3 to 6 times higher click-through rate than a plain blue link. The schema layer takes 15 minutes per recipe to author and 30 minutes to validate in Google Search Console. Cross-reference the recipe search stack on our food and beverage SEO page.
Recipe hub structure that scales
The recipe hub structure runs 40 to 100 recipes at maturity, organized by hero SKU (4 to 12 recipes per SKU) plus occasion tags (breakfast, weeknight dinner, meal prep, brunch, holiday). Every recipe links back to the hero SKU product page with the SKU embedded in an inline card. The hub earns internal linking value from ingredient comparison guides and the sourcing story pages, which feeds recipe ranking on Google. According to Google Search Central recipe structured data guidance, complete Recipe schema markup is required for eligibility in the recipe carousel and the ingredient search filter.
Pillar structure for food brand content marketing
The pillar structure on content marketing for food brands runs 4 content pillars concurrently: recipe hub (40 to 100 recipes), ingredient comparison guides (12 to 24 guides), sourcing story pages (6 to 12 pages), and buyer intent content (where to buy, subscription vs. one-time, gift bundle guides). Every pillar covers a distinct search intent and every pillar links back to the hero SKU product pages.
Ingredient comparison guide format
Ingredient comparison guides run 1,800 to 3,200 words comparing 2 to 4 ingredient types on 6 to 10 attributes with a comparison table, real-world use case examples, and links to the hero SKU that uses the specific ingredient. Example: organic vs. conventional oats compares nutritional profile, sourcing chain, cost, environmental impact, and taste on a 6-column table. The brand’s SKU appears in the winning column with a product card. These guides rank 3 to 8 months after publication and pull steady-state organic traffic.
Sourcing story pages that build trust
Sourcing story pages name the specific farms, cooperatives, or suppliers the brand sources from, with photos of the farms, farmer quotes, and specific harvest windows. A coffee brand’s Ethiopian farm page ranks for “single-origin Ethiopian coffee” and “Yirgacheffe coffee origin” plus 40 long-tail variations. The sourcing page pulls trust-building traffic that converts at 4 to 6 percent because the shopper landed pattern-matching on transparency and named provenance. Every sourcing page includes farmer or cooperative quotes, harvest dates, and a link back to 3 to 5 hero SKU pages that source from the named supplier.
Vejrø hospitality content case study
Vejrø Resort, a Danish private-island destination with an on-site restaurant focused on organic, locally sourced cuisine, joined us with strong social engagement and no organic-search real estate. Guests found the resort on Instagram but never in Google search for terms like “private island resort Denmark,” “farm-to-table hospitality Denmark,” or “Vejrø restaurant.” The same organic-search gap shows up on DTC food brands running paid social at 20,000 dollars monthly with a broken blog and zero recipe schema.
We built the conversion-focused website with on-site and off-site SEO tuned to the travel-niche keyword clusters, competitor analysis against comparable boutique resorts, and mobile-first design prioritizing guest discovery. Every page carried the structured data qualifying it for Google’s rich results in the hospitality category. Every internal link pushed authority toward the direct-booking conversion path.
Three months later, Vejrø hit 10,000 plus organic visitors, ranked for 200 plus first-page keywords, and pulled a 2.2 percent booking conversion rate from organic traffic. The same pattern applies to content marketing for food brands: recipe schema, ingredient comparison guides, and sourcing story pages pull organic traffic at 20 to 40 percent conversion into hero SKU pages inside 6 months when the content quality matches search intent and every page carries the right structured data markup. Vejrø also proved out the reporting discipline: every monthly report named the exact page, the exact keyword cluster, and the exact search feature (rich result, sitelinks, image pack) driving the incremental organic revenue instead of hiding behind aggregate traffic charts.
Recipe cadence and content calendar for food brands
Recipe cadence on a working food brand content calendar ships 2 to 4 new recipes per week during the first 6 months and drops to 1 per week at maturity. Each recipe takes 4 to 6 hours to produce (write, test in the kitchen, photograph, schema author, publish). At 3 recipes per week, the brand hits 78 recipes inside 6 months plus a backlog of ingredient comparison and sourcing content queued behind the recipe production line.
| Content pillar | Target volume year 1 | Production cost per piece | Refresh cadence |
|---|---|---|---|
| Recipe hub | 40 to 100 recipes | $180 to $320 | Every 12 months |
| Ingredient comparison guides | 12 to 24 guides | $450 to $780 | Every 18 months |
| Sourcing story pages | 6 to 12 pages | $680 to $1,200 | Every 24 months |
| Buyer intent content | 8 to 16 pieces | $220 to $420 | Every 12 months |
Photography as a content calendar constraint
Photography is the actual constraint on recipe cadence, not writing. Every recipe needs 6 to 12 photos: hero shot, ingredient flat lay, prep in progress, plated result, storage, and step shots for the schema markup. A working food brand batches photography 8 recipes at a time to keep the cost per recipe under 200 dollars. Skip the batching and the per-recipe cost climbs to 400 to 600 dollars, which caps recipe cadence at 1 per week and slows organic ranking timeline by 6 months.
Seasonal content calendar planning
Seasonal content calendar planning maps recipes and comparison guides to the seasonal windows they need to rank in. A Christmas cookie recipe needs to publish in September to rank by early December. A Valentine’s chocolate guide needs to publish in November to rank by early February. A back-to-school lunchbox recipe needs to publish in June to rank by late August. The 60-to-90-day ranking curve dictates the calendar.
Creator syndication inside food brand content
Creator syndication on food brand content marketing amplifies the recipe hub through Instagram Reels, TikTok, and YouTube Shorts creators paid to post their own version of the brand’s hero recipes. The creator content pulls net-new audiences into the recipe hub through the creator’s Link in Bio or Amazon Storefront tag. The syndication calendar names 12 to 30 creators per quarter with specific recipes assigned to each.
One brand we picked up had a spreadsheet titled “creator outreach 2023” with 47 rows and 3 responses. All 3 responses were auto-replies. The spreadsheet named zero recipes and offered flat rates below 100 dollars per post. Nobody posts a 30-second video for 87 dollars flat. Nobody.
Creator content commercial terms that work
Working creator content commercial terms run 350 to 1,500 dollars flat per post plus a 12 to 25 percent commission on tagged sales across a 30-day window. The commission mechanic pulls creators into follow-up posts because the incremental revenue continues past the initial fee. Mid-tier creators (30k to 150k followers) hit the sweet spot for food brand content because their engagement rate typically runs 4 to 8 percent versus 0.8 to 1.6 percent on mega-creators.
Content brief structure for creator partnerships
The content brief structure for creator partnerships runs a single page: the SKU, the specific recipe or usage occasion, 3 required brand mentions, 3 restricted claims (no health claims on non-medical SKUs), the pricing angle, the affiliate link, and 3 example videos that hit the tone. The brief avoids over-scripting because over-scripted creator content underperforms native creator voice by 40 to 60 percent on engagement rate.
Buyer intent content for food brand blogs
Buyer intent content on food brand blogs covers 8 to 16 pieces targeting explicit purchase-decision queries: “where to buy [brand],” “[brand] subscription vs. one-time,” “best [category] for [use case],” and “[brand] gift bundle.” Every buyer intent piece runs 1,400 to 2,400 words with a comparison table, product cards, and a clear conversion path to the specific SKU that matches the query intent. Buyer intent content converts at 3 to 6 percent versus 1 to 2 percent on recipe content because the shopper landed already planning to buy, not exploring a usage occasion.
Where-to-buy content structure
Where-to-buy content structure covers online (DTC storefront, Amazon, Target.com, Whole Foods online), retail (specific chain locators with the store finder embedded), and international (customs limitations, retailer partners abroad). Every piece names specific retailers, links to the store locator, and includes an FAQ block covering shipping availability, subscription options, and gift card compatibility. Where-to-buy content ranks for branded discovery queries the DTC storefront otherwise loses to competitor affiliate reviews.
Subscription versus one-time comparison content
Subscription versus one-time comparison content converts subscription commitments at 3 to 6 percent because it addresses the price-sensitivity concern head-on with a specific math table. The piece covers the discount structure (15 percent lifetime), the skip-a-month mechanic, the pause-anytime rule, the cancellation policy, and the specific yearly savings for the brand’s average consumption cadence. Cross-reference the retention structure on our food and beverage marketing retainer page.
Content refresh cadence on food brand pillars
Content refresh cadence on food brand content pillars runs a rolling audit every 12 to 24 months by pillar. Recipes get refreshed every 12 months with new photography, updated schema, and any nutrition or ingredient adjustments. Ingredient comparison guides refresh every 18 months to update market data. Sourcing story pages refresh every 24 months to reflect farm partnership changes and new harvest angles. Buyer intent content refreshes every 12 months to update retailer availability and pricing.
Recipe refresh priority order
Recipe refresh priority runs by organic traffic rank. The top 20 recipes by monthly organic sessions get refreshed first (new photography, schema audit, related recipe internal links, updated nutrition). The next 40 get refreshed at 15 months. The remaining recipes get refreshed opportunistically when the ranking slips past position 15 in Google. Skipping the refresh cadence lets recipe rankings drift out of the top 3 inside 18 months as newer competitor recipes take the position.
Schema audit checklist per refresh
The schema audit checklist per refresh runs 8 items: Recipe schema completeness, aggregateRating count and accuracy, nutrition data accuracy, prepTime and cookTime match the recipe body, image URLs valid at CDN, related recipe internal links working, product card SKU URL live, and Google Search Console rich result eligibility validated. This checklist takes 20 minutes per recipe and prevents the schema drift that costs recipe rankings 20 to 40 positions quietly.
Reporting cadence for food brand content marketing
Reporting cadence on food brand content marketing runs a monthly executive report plus a quarterly business review. The monthly report ships in the first business week and covers organic sessions by pillar, top 10 ranking recipes with position trend, ingredient guide ranking movements, sourcing page performance, and organic-attributed DTC revenue. Every number carries a comparison to the prior month and a plain-language interpretation the founder reads in 7 minutes.
Metrics that matter for content marketing
Metrics that matter for food brand content marketing: organic sessions by pillar, recipe rich result impressions in Search Console, organic conversion rate to hero SKU pages, organic-attributed DTC revenue, and top 20 ranking positions by monthly organic sessions. Vanity metrics that do not matter: total pageviews without conversion context, average time on page without conversion attribution, and social share counts. The monthly report skips the vanity block entirely.
Quarterly business review structure
The quarterly business review runs 90 minutes with the founder, head of content, and SEO lead. Agenda: organic traffic trend by pillar, top 10 winning content pieces, top 10 losing content pieces (candidates for refresh or removal), competitive gap analysis against 5 named competitor brands, and next quarter’s content calendar with recipes and ingredient guides queued. According to Ahrefs content marketing research, brands running quarterly content audits outperform brands running annual audits by 40 to 70 percent on organic revenue over a 24-month window.
Internal linking discipline across food brand content
Internal linking discipline across food brand content moves authority from recipe pages toward hero SKU product pages and comparison guides. Every recipe links to the hero SKU it uses inline (once in the ingredient list, once in a bottom call-out card). Every ingredient comparison guide links to 3 to 6 recipes using the winning ingredient plus the hero SKU product page. Every sourcing story links to the 2 to 4 SKUs sourced from that specific farm or cooperative.
Anchor text strategy across recipe hubs
Anchor text on internal links varies across recipe hubs to avoid over-optimization patterns Google penalizes. Exact-match anchor (“single-origin Ethiopian coffee”) runs on 20 to 30 percent of internal links. Partial-match variations (“our Ethiopian roast”) run on 30 to 40 percent. Branded anchors (the SKU name) run on 20 to 30 percent. Generic anchors (“shop the coffee”) fill the remaining 10 to 20 percent. This ratio holds ranking without triggering the over-optimization penalty that shows up on brands that anchor-text-stuff every internal link with the same exact-match keyword. Cross-reference the linking layer on our food and beverage web design page.
Link equity from ingredient guides to SKU pages
Link equity from ingredient guides passes to SKU pages when the guide’s comparison table names the hero SKU in the winning column with a product card, and when the guide’s body links to 3 to 6 recipes that use the winning ingredient. This 3-hop path (guide to recipe to SKU) pushes authority from a high-traffic informational query down to a high-intent transactional page. According to Search Engine Land SEO coverage, informational content that internally links to transactional pages produces 2 to 4 times higher organic revenue than isolated content silos.
Wrapping up content marketing for food brands
Content marketing for food brands is the organic engine that turns a DTC snack, drink, or CPG storefront into a search-driven revenue channel. Recipe hub of 40 to 100 recipes. Ingredient comparison guides at 12 to 24 pieces. Sourcing story pages at 6 to 12 pieces. Buyer intent content at 8 to 16 pieces. Creator syndication calendar with 12 to 30 creators per quarter. Refresh cadence at 12 to 24 months by pillar. Reporting with organic sessions and organic revenue attribution.
If your DTC food brand is running paid social at 20,000 dollars monthly with a broken blog and zero recipe schema, professional content marketing for food brands pays for itself inside the first 90 days on organic traffic captured. Redefine Web ships content marketing inside our monthly retainer packages. Book a call and we will walk through the last three DTC food brands we built recipe hubs for, pillar by pillar.
Content marketing for food brands starts with a recipe hub because recipe queries account for 40 to 60 percent of high-intent search volume in the food category. Every hero SKU needs 4 to 12 recipes anchored to it, each targeting a specific occasion and audience.
Skip the recipe hub and the brand loses the search real estate that pulls DTC storefront traffic month over month at zero incremental paid cost. Recipe traffic converts at 2 to 4 percent because the shopper landed with usage intent, not passive discovery, which is why food brands win on recipes.
Recipe schema and Google rich result eligibility
Every recipe page ships schema.org Recipe markup including cookTime, prepTime, recipeIngredient, recipeInstructions, nutrition, and aggregateRating. Correctly marked-up recipes qualify for Google’s recipe rich result carousel that pulls 3 to 6 times higher click-through rate than a plain blue link. The schema layer takes 15 minutes per recipe to author and 30 minutes to validate in Google Search Console. Cross-reference the recipe search stack on our food and beverage SEO page.
Recipe hub structure that scales
The recipe hub structure runs 40 to 100 recipes at maturity, organized by hero SKU (4 to 12 recipes per SKU) plus occasion tags (breakfast, weeknight dinner, meal prep, brunch, holiday). Every recipe links back to the hero SKU product page with the SKU embedded in an inline card. The hub earns internal linking value from ingredient comparison guides and the sourcing story pages, which feeds recipe ranking on Google. According to Google Search Central recipe structured data guidance, complete Recipe schema markup is required for eligibility in the recipe carousel and the ingredient search filter.
Pillar structure for food brand content marketing
The pillar structure on content marketing for food brands runs 4 content pillars concurrently: recipe hub (40 to 100 recipes), ingredient comparison guides (12 to 24 guides), sourcing story pages (6 to 12 pages), and buyer intent content (where to buy, subscription vs. one-time, gift bundle guides). Every pillar covers a distinct search intent and every pillar links back to the hero SKU product pages.
Ingredient comparison guide format
Ingredient comparison guides run 1,800 to 3,200 words comparing 2 to 4 ingredient types on 6 to 10 attributes with a comparison table, real-world use case examples, and links to the hero SKU that uses the specific ingredient. Example: organic vs. conventional oats compares nutritional profile, sourcing chain, cost, environmental impact, and taste on a 6-column table. The brand’s SKU appears in the winning column with a product card. These guides rank 3 to 8 months after publication and pull steady-state organic traffic.
Sourcing story pages that build trust
Sourcing story pages name the specific farms, cooperatives, or suppliers the brand sources from, with photos of the farms, farmer quotes, and specific harvest windows. A coffee brand’s Ethiopian farm page ranks for “single-origin Ethiopian coffee” and “Yirgacheffe coffee origin” plus 40 long-tail variations. The sourcing page pulls trust-building traffic that converts at 4 to 6 percent because the shopper landed pattern-matching on transparency and named provenance. Every sourcing page includes farmer or cooperative quotes, harvest dates, and a link back to 3 to 5 hero SKU pages that source from the named supplier.
Vejrø hospitality content case study
Vejrø Resort, a Danish private-island destination with an on-site restaurant focused on organic, locally sourced cuisine, joined us with strong social engagement and no organic-search real estate. Guests found the resort on Instagram but never in Google search for terms like “private island resort Denmark,” “farm-to-table hospitality Denmark,” or “Vejrø restaurant.” The same organic-search gap shows up on DTC food brands running paid social at 20,000 dollars monthly with a broken blog and zero recipe schema.
We built the conversion-focused website with on-site and off-site SEO tuned to the travel-niche keyword clusters, competitor analysis against comparable boutique resorts, and mobile-first design prioritizing guest discovery. Every page carried the structured data qualifying it for Google’s rich results in the hospitality category. Every internal link pushed authority toward the direct-booking conversion path.
Three months later, Vejrø hit 10,000 plus organic visitors, ranked for 200 plus first-page keywords, and pulled a 2.2 percent booking conversion rate from organic traffic. The same pattern applies to content marketing for food brands: recipe schema, ingredient comparison guides, and sourcing story pages pull organic traffic at 20 to 40 percent conversion into hero SKU pages inside 6 months when the content quality matches search intent and every page carries the right structured data markup. Vejrø also proved out the reporting discipline: every monthly report named the exact page, the exact keyword cluster, and the exact search feature (rich result, sitelinks, image pack) driving the incremental organic revenue instead of hiding behind aggregate traffic charts.
Recipe cadence and content calendar for food brands
Recipe cadence on a working food brand content calendar ships 2 to 4 new recipes per week during the first 6 months and drops to 1 per week at maturity. Each recipe takes 4 to 6 hours to produce (write, test in the kitchen, photograph, schema author, publish). At 3 recipes per week, the brand hits 78 recipes inside 6 months plus a backlog of ingredient comparison and sourcing content queued behind the recipe production line.
| Content pillar | Target volume year 1 | Production cost per piece | Refresh cadence |
|---|---|---|---|
| Recipe hub | 40 to 100 recipes | $180 to $320 | Every 12 months |
| Ingredient comparison guides | 12 to 24 guides | $450 to $780 | Every 18 months |
| Sourcing story pages | 6 to 12 pages | $680 to $1,200 | Every 24 months |
| Buyer intent content | 8 to 16 pieces | $220 to $420 | Every 12 months |
Photography as a content calendar constraint
Photography is the actual constraint on recipe cadence, not writing. Every recipe needs 6 to 12 photos: hero shot, ingredient flat lay, prep in progress, plated result, storage, and step shots for the schema markup. A working food brand batches photography 8 recipes at a time to keep the cost per recipe under 200 dollars. Skip the batching and the per-recipe cost climbs to 400 to 600 dollars, which caps recipe cadence at 1 per week and slows organic ranking timeline by 6 months.
Seasonal content calendar planning
Seasonal content calendar planning maps recipes and comparison guides to the seasonal windows they need to rank in. A Christmas cookie recipe needs to publish in September to rank by early December. A Valentine’s chocolate guide needs to publish in November to rank by early February. A back-to-school lunchbox recipe needs to publish in June to rank by late August. The 60-to-90-day ranking curve dictates the calendar.
Creator syndication inside food brand content
Creator syndication on food brand content marketing amplifies the recipe hub through Instagram Reels, TikTok, and YouTube Shorts creators paid to post their own version of the brand’s hero recipes. The creator content pulls net-new audiences into the recipe hub through the creator’s Link in Bio or Amazon Storefront tag. The syndication calendar names 12 to 30 creators per quarter with specific recipes assigned to each.
One brand we picked up had a spreadsheet titled “creator outreach 2023” with 47 rows and 3 responses. All 3 responses were auto-replies. The spreadsheet named zero recipes and offered flat rates below 100 dollars per post. Nobody posts a 30-second video for 87 dollars flat. Nobody.
Creator content commercial terms that work
Working creator content commercial terms run 350 to 1,500 dollars flat per post plus a 12 to 25 percent commission on tagged sales across a 30-day window. The commission mechanic pulls creators into follow-up posts because the incremental revenue continues past the initial fee. Mid-tier creators (30k to 150k followers) hit the sweet spot for food brand content because their engagement rate typically runs 4 to 8 percent versus 0.8 to 1.6 percent on mega-creators.
Content brief structure for creator partnerships
The content brief structure for creator partnerships runs a single page: the SKU, the specific recipe or usage occasion, 3 required brand mentions, 3 restricted claims (no health claims on non-medical SKUs), the pricing angle, the affiliate link, and 3 example videos that hit the tone. The brief avoids over-scripting because over-scripted creator content underperforms native creator voice by 40 to 60 percent on engagement rate.
Buyer intent content for food brand blogs
Buyer intent content on food brand blogs covers 8 to 16 pieces targeting explicit purchase-decision queries: “where to buy [brand],” “[brand] subscription vs. one-time,” “best [category] for [use case],” and “[brand] gift bundle.” Every buyer intent piece runs 1,400 to 2,400 words with a comparison table, product cards, and a clear conversion path to the specific SKU that matches the query intent. Buyer intent content converts at 3 to 6 percent versus 1 to 2 percent on recipe content because the shopper landed already planning to buy, not exploring a usage occasion.
Where-to-buy content structure
Where-to-buy content structure covers online (DTC storefront, Amazon, Target.com, Whole Foods online), retail (specific chain locators with the store finder embedded), and international (customs limitations, retailer partners abroad). Every piece names specific retailers, links to the store locator, and includes an FAQ block covering shipping availability, subscription options, and gift card compatibility. Where-to-buy content ranks for branded discovery queries the DTC storefront otherwise loses to competitor affiliate reviews.
Subscription versus one-time comparison content
Subscription versus one-time comparison content converts subscription commitments at 3 to 6 percent because it addresses the price-sensitivity concern head-on with a specific math table. The piece covers the discount structure (15 percent lifetime), the skip-a-month mechanic, the pause-anytime rule, the cancellation policy, and the specific yearly savings for the brand’s average consumption cadence. Cross-reference the retention structure on our food and beverage marketing retainer page.
Content refresh cadence on food brand pillars
Content refresh cadence on food brand content pillars runs a rolling audit every 12 to 24 months by pillar. Recipes get refreshed every 12 months with new photography, updated schema, and any nutrition or ingredient adjustments. Ingredient comparison guides refresh every 18 months to update market data. Sourcing story pages refresh every 24 months to reflect farm partnership changes and new harvest angles. Buyer intent content refreshes every 12 months to update retailer availability and pricing.
Recipe refresh priority order
Recipe refresh priority runs by organic traffic rank. The top 20 recipes by monthly organic sessions get refreshed first (new photography, schema audit, related recipe internal links, updated nutrition). The next 40 get refreshed at 15 months. The remaining recipes get refreshed opportunistically when the ranking slips past position 15 in Google. Skipping the refresh cadence lets recipe rankings drift out of the top 3 inside 18 months as newer competitor recipes take the position.
Schema audit checklist per refresh
The schema audit checklist per refresh runs 8 items: Recipe schema completeness, aggregateRating count and accuracy, nutrition data accuracy, prepTime and cookTime match the recipe body, image URLs valid at CDN, related recipe internal links working, product card SKU URL live, and Google Search Console rich result eligibility validated. This checklist takes 20 minutes per recipe and prevents the schema drift that costs recipe rankings 20 to 40 positions quietly.
Reporting cadence for food brand content marketing
Reporting cadence on food brand content marketing runs a monthly executive report plus a quarterly business review. The monthly report ships in the first business week and covers organic sessions by pillar, top 10 ranking recipes with position trend, ingredient guide ranking movements, sourcing page performance, and organic-attributed DTC revenue. Every number carries a comparison to the prior month and a plain-language interpretation the founder reads in 7 minutes.
Metrics that matter for content marketing
Metrics that matter for food brand content marketing: organic sessions by pillar, recipe rich result impressions in Search Console, organic conversion rate to hero SKU pages, organic-attributed DTC revenue, and top 20 ranking positions by monthly organic sessions. Vanity metrics that do not matter: total pageviews without conversion context, average time on page without conversion attribution, and social share counts. The monthly report skips the vanity block entirely.
Quarterly business review structure
The quarterly business review runs 90 minutes with the founder, head of content, and SEO lead. Agenda: organic traffic trend by pillar, top 10 winning content pieces, top 10 losing content pieces (candidates for refresh or removal), competitive gap analysis against 5 named competitor brands, and next quarter’s content calendar with recipes and ingredient guides queued. According to Ahrefs content marketing research, brands running quarterly content audits outperform brands running annual audits by 40 to 70 percent on organic revenue over a 24-month window.
Internal linking discipline across food brand content
Internal linking discipline across food brand content moves authority from recipe pages toward hero SKU product pages and comparison guides. Every recipe links to the hero SKU it uses inline (once in the ingredient list, once in a bottom call-out card). Every ingredient comparison guide links to 3 to 6 recipes using the winning ingredient plus the hero SKU product page. Every sourcing story links to the 2 to 4 SKUs sourced from that specific farm or cooperative.
Anchor text strategy across recipe hubs
Anchor text on internal links varies across recipe hubs to avoid over-optimization patterns Google penalizes. Exact-match anchor (“single-origin Ethiopian coffee”) runs on 20 to 30 percent of internal links. Partial-match variations (“our Ethiopian roast”) run on 30 to 40 percent. Branded anchors (the SKU name) run on 20 to 30 percent. Generic anchors (“shop the coffee”) fill the remaining 10 to 20 percent. This ratio holds ranking without triggering the over-optimization penalty that shows up on brands that anchor-text-stuff every internal link with the same exact-match keyword. Cross-reference the linking layer on our food and beverage web design page.
Link equity from ingredient guides to SKU pages
Link equity from ingredient guides passes to SKU pages when the guide’s comparison table names the hero SKU in the winning column with a product card, and when the guide’s body links to 3 to 6 recipes that use the winning ingredient. This 3-hop path (guide to recipe to SKU) pushes authority from a high-traffic informational query down to a high-intent transactional page. According to Search Engine Land SEO coverage, informational content that internally links to transactional pages produces 2 to 4 times higher organic revenue than isolated content silos.
Wrapping up content marketing for food brands
Content marketing for food brands is the organic engine that turns a DTC snack, drink, or CPG storefront into a search-driven revenue channel. Recipe hub of 40 to 100 recipes. Ingredient comparison guides at 12 to 24 pieces. Sourcing story pages at 6 to 12 pieces. Buyer intent content at 8 to 16 pieces. Creator syndication calendar with 12 to 30 creators per quarter. Refresh cadence at 12 to 24 months by pillar. Reporting with organic sessions and organic revenue attribution.
If your DTC food brand is running paid social at 20,000 dollars monthly with a broken blog and zero recipe schema, professional content marketing for food brands pays for itself inside the first 90 days on organic traffic captured. Redefine Web ships content marketing inside our monthly retainer packages. Book a call and we will walk through the last three DTC food brands we built recipe hubs for, pillar by pillar.
Content marketing for food brands starts with a recipe hub because recipe queries account for 40 to 60 percent of high-intent search volume in the food category. Every hero SKU needs 4 to 12 recipes anchored to it, each targeting a specific occasion and audience.
Skip the recipe hub and the brand loses the search real estate that pulls DTC storefront traffic month over month at zero incremental paid cost. Recipe traffic converts at 2 to 4 percent because the shopper landed with usage intent, not passive discovery, which is why food brands win on recipes.
Recipe schema and Google rich result eligibility
Every recipe page ships schema.org Recipe markup including cookTime, prepTime, recipeIngredient, recipeInstructions, nutrition, and aggregateRating. Correctly marked-up recipes qualify for Google’s recipe rich result carousel that pulls 3 to 6 times higher click-through rate than a plain blue link. The schema layer takes 15 minutes per recipe to author and 30 minutes to validate in Google Search Console. Cross-reference the recipe search stack on our food and beverage SEO page.
Recipe hub structure that scales
The recipe hub structure runs 40 to 100 recipes at maturity, organized by hero SKU (4 to 12 recipes per SKU) plus occasion tags (breakfast, weeknight dinner, meal prep, brunch, holiday). Every recipe links back to the hero SKU product page with the SKU embedded in an inline card. The hub earns internal linking value from ingredient comparison guides and the sourcing story pages, which feeds recipe ranking on Google. According to Google Search Central recipe structured data guidance, complete Recipe schema markup is required for eligibility in the recipe carousel and the ingredient search filter.
Pillar structure for food brand content marketing
The pillar structure on content marketing for food brands runs 4 content pillars concurrently: recipe hub (40 to 100 recipes), ingredient comparison guides (12 to 24 guides), sourcing story pages (6 to 12 pages), and buyer intent content (where to buy, subscription vs. one-time, gift bundle guides). Every pillar covers a distinct search intent and every pillar links back to the hero SKU product pages.
Ingredient comparison guide format
Ingredient comparison guides run 1,800 to 3,200 words comparing 2 to 4 ingredient types on 6 to 10 attributes with a comparison table, real-world use case examples, and links to the hero SKU that uses the specific ingredient. Example: organic vs. conventional oats compares nutritional profile, sourcing chain, cost, environmental impact, and taste on a 6-column table. The brand’s SKU appears in the winning column with a product card. These guides rank 3 to 8 months after publication and pull steady-state organic traffic.
Sourcing story pages that build trust
Sourcing story pages name the specific farms, cooperatives, or suppliers the brand sources from, with photos of the farms, farmer quotes, and specific harvest windows. A coffee brand’s Ethiopian farm page ranks for “single-origin Ethiopian coffee” and “Yirgacheffe coffee origin” plus 40 long-tail variations. The sourcing page pulls trust-building traffic that converts at 4 to 6 percent because the shopper landed pattern-matching on transparency and named provenance. Every sourcing page includes farmer or cooperative quotes, harvest dates, and a link back to 3 to 5 hero SKU pages that source from the named supplier.
Vejrø hospitality content case study
Vejrø Resort, a Danish private-island destination with an on-site restaurant focused on organic, locally sourced cuisine, joined us with strong social engagement and no organic-search real estate. Guests found the resort on Instagram but never in Google search for terms like “private island resort Denmark,” “farm-to-table hospitality Denmark,” or “Vejrø restaurant.” The same organic-search gap shows up on DTC food brands running paid social at 20,000 dollars monthly with a broken blog and zero recipe schema.
We built the conversion-focused website with on-site and off-site SEO tuned to the travel-niche keyword clusters, competitor analysis against comparable boutique resorts, and mobile-first design prioritizing guest discovery. Every page carried the structured data qualifying it for Google’s rich results in the hospitality category. Every internal link pushed authority toward the direct-booking conversion path.
Three months later, Vejrø hit 10,000 plus organic visitors, ranked for 200 plus first-page keywords, and pulled a 2.2 percent booking conversion rate from organic traffic. The same pattern applies to content marketing for food brands: recipe schema, ingredient comparison guides, and sourcing story pages pull organic traffic at 20 to 40 percent conversion into hero SKU pages inside 6 months when the content quality matches search intent and every page carries the right structured data markup. Vejrø also proved out the reporting discipline: every monthly report named the exact page, the exact keyword cluster, and the exact search feature (rich result, sitelinks, image pack) driving the incremental organic revenue instead of hiding behind aggregate traffic charts.
Recipe cadence and content calendar for food brands
Recipe cadence on a working food brand content calendar ships 2 to 4 new recipes per week during the first 6 months and drops to 1 per week at maturity. Each recipe takes 4 to 6 hours to produce (write, test in the kitchen, photograph, schema author, publish). At 3 recipes per week, the brand hits 78 recipes inside 6 months plus a backlog of ingredient comparison and sourcing content queued behind the recipe production line.
| Content pillar | Target volume year 1 | Production cost per piece | Refresh cadence |
|---|---|---|---|
| Recipe hub | 40 to 100 recipes | $180 to $320 | Every 12 months |
| Ingredient comparison guides | 12 to 24 guides | $450 to $780 | Every 18 months |
| Sourcing story pages | 6 to 12 pages | $680 to $1,200 | Every 24 months |
| Buyer intent content | 8 to 16 pieces | $220 to $420 | Every 12 months |
Photography as a content calendar constraint
Photography is the actual constraint on recipe cadence, not writing. Every recipe needs 6 to 12 photos: hero shot, ingredient flat lay, prep in progress, plated result, storage, and step shots for the schema markup. A working food brand batches photography 8 recipes at a time to keep the cost per recipe under 200 dollars. Skip the batching and the per-recipe cost climbs to 400 to 600 dollars, which caps recipe cadence at 1 per week and slows organic ranking timeline by 6 months.
Seasonal content calendar planning
Seasonal content calendar planning maps recipes and comparison guides to the seasonal windows they need to rank in. A Christmas cookie recipe needs to publish in September to rank by early December. A Valentine’s chocolate guide needs to publish in November to rank by early February. A back-to-school lunchbox recipe needs to publish in June to rank by late August. The 60-to-90-day ranking curve dictates the calendar.
Creator syndication inside food brand content
Creator syndication on food brand content marketing amplifies the recipe hub through Instagram Reels, TikTok, and YouTube Shorts creators paid to post their own version of the brand’s hero recipes. The creator content pulls net-new audiences into the recipe hub through the creator’s Link in Bio or Amazon Storefront tag. The syndication calendar names 12 to 30 creators per quarter with specific recipes assigned to each.
One brand we picked up had a spreadsheet titled “creator outreach 2023” with 47 rows and 3 responses. All 3 responses were auto-replies. The spreadsheet named zero recipes and offered flat rates below 100 dollars per post. Nobody posts a 30-second video for 87 dollars flat. Nobody.
Creator content commercial terms that work
Working creator content commercial terms run 350 to 1,500 dollars flat per post plus a 12 to 25 percent commission on tagged sales across a 30-day window. The commission mechanic pulls creators into follow-up posts because the incremental revenue continues past the initial fee. Mid-tier creators (30k to 150k followers) hit the sweet spot for food brand content because their engagement rate typically runs 4 to 8 percent versus 0.8 to 1.6 percent on mega-creators.
Content brief structure for creator partnerships
The content brief structure for creator partnerships runs a single page: the SKU, the specific recipe or usage occasion, 3 required brand mentions, 3 restricted claims (no health claims on non-medical SKUs), the pricing angle, the affiliate link, and 3 example videos that hit the tone. The brief avoids over-scripting because over-scripted creator content underperforms native creator voice by 40 to 60 percent on engagement rate.
Buyer intent content for food brand blogs
Buyer intent content on food brand blogs covers 8 to 16 pieces targeting explicit purchase-decision queries: “where to buy [brand],” “[brand] subscription vs. one-time,” “best [category] for [use case],” and “[brand] gift bundle.” Every buyer intent piece runs 1,400 to 2,400 words with a comparison table, product cards, and a clear conversion path to the specific SKU that matches the query intent. Buyer intent content converts at 3 to 6 percent versus 1 to 2 percent on recipe content because the shopper landed already planning to buy, not exploring a usage occasion.
Where-to-buy content structure
Where-to-buy content structure covers online (DTC storefront, Amazon, Target.com, Whole Foods online), retail (specific chain locators with the store finder embedded), and international (customs limitations, retailer partners abroad). Every piece names specific retailers, links to the store locator, and includes an FAQ block covering shipping availability, subscription options, and gift card compatibility. Where-to-buy content ranks for branded discovery queries the DTC storefront otherwise loses to competitor affiliate reviews.
Subscription versus one-time comparison content
Subscription versus one-time comparison content converts subscription commitments at 3 to 6 percent because it addresses the price-sensitivity concern head-on with a specific math table. The piece covers the discount structure (15 percent lifetime), the skip-a-month mechanic, the pause-anytime rule, the cancellation policy, and the specific yearly savings for the brand’s average consumption cadence. Cross-reference the retention structure on our food and beverage marketing retainer page.
Content refresh cadence on food brand pillars
Content refresh cadence on food brand content pillars runs a rolling audit every 12 to 24 months by pillar. Recipes get refreshed every 12 months with new photography, updated schema, and any nutrition or ingredient adjustments. Ingredient comparison guides refresh every 18 months to update market data. Sourcing story pages refresh every 24 months to reflect farm partnership changes and new harvest angles. Buyer intent content refreshes every 12 months to update retailer availability and pricing.
Recipe refresh priority order
Recipe refresh priority runs by organic traffic rank. The top 20 recipes by monthly organic sessions get refreshed first (new photography, schema audit, related recipe internal links, updated nutrition). The next 40 get refreshed at 15 months. The remaining recipes get refreshed opportunistically when the ranking slips past position 15 in Google. Skipping the refresh cadence lets recipe rankings drift out of the top 3 inside 18 months as newer competitor recipes take the position.
Schema audit checklist per refresh
The schema audit checklist per refresh runs 8 items: Recipe schema completeness, aggregateRating count and accuracy, nutrition data accuracy, prepTime and cookTime match the recipe body, image URLs valid at CDN, related recipe internal links working, product card SKU URL live, and Google Search Console rich result eligibility validated. This checklist takes 20 minutes per recipe and prevents the schema drift that costs recipe rankings 20 to 40 positions quietly.
Reporting cadence for food brand content marketing
Reporting cadence on food brand content marketing runs a monthly executive report plus a quarterly business review. The monthly report ships in the first business week and covers organic sessions by pillar, top 10 ranking recipes with position trend, ingredient guide ranking movements, sourcing page performance, and organic-attributed DTC revenue. Every number carries a comparison to the prior month and a plain-language interpretation the founder reads in 7 minutes.
Metrics that matter for content marketing
Metrics that matter for food brand content marketing: organic sessions by pillar, recipe rich result impressions in Search Console, organic conversion rate to hero SKU pages, organic-attributed DTC revenue, and top 20 ranking positions by monthly organic sessions. Vanity metrics that do not matter: total pageviews without conversion context, average time on page without conversion attribution, and social share counts. The monthly report skips the vanity block entirely.
Quarterly business review structure
The quarterly business review runs 90 minutes with the founder, head of content, and SEO lead. Agenda: organic traffic trend by pillar, top 10 winning content pieces, top 10 losing content pieces (candidates for refresh or removal), competitive gap analysis against 5 named competitor brands, and next quarter’s content calendar with recipes and ingredient guides queued. According to Ahrefs content marketing research, brands running quarterly content audits outperform brands running annual audits by 40 to 70 percent on organic revenue over a 24-month window.
Internal linking discipline across food brand content
Internal linking discipline across food brand content moves authority from recipe pages toward hero SKU product pages and comparison guides. Every recipe links to the hero SKU it uses inline (once in the ingredient list, once in a bottom call-out card). Every ingredient comparison guide links to 3 to 6 recipes using the winning ingredient plus the hero SKU product page. Every sourcing story links to the 2 to 4 SKUs sourced from that specific farm or cooperative.
Anchor text strategy across recipe hubs
Anchor text on internal links varies across recipe hubs to avoid over-optimization patterns Google penalizes. Exact-match anchor (“single-origin Ethiopian coffee”) runs on 20 to 30 percent of internal links. Partial-match variations (“our Ethiopian roast”) run on 30 to 40 percent. Branded anchors (the SKU name) run on 20 to 30 percent. Generic anchors (“shop the coffee”) fill the remaining 10 to 20 percent. This ratio holds ranking without triggering the over-optimization penalty that shows up on brands that anchor-text-stuff every internal link with the same exact-match keyword. Cross-reference the linking layer on our food and beverage web design page.
Link equity from ingredient guides to SKU pages
Link equity from ingredient guides passes to SKU pages when the guide’s comparison table names the hero SKU in the winning column with a product card, and when the guide’s body links to 3 to 6 recipes that use the winning ingredient. This 3-hop path (guide to recipe to SKU) pushes authority from a high-traffic informational query down to a high-intent transactional page. According to Search Engine Land SEO coverage, informational content that internally links to transactional pages produces 2 to 4 times higher organic revenue than isolated content silos.
Wrapping up content marketing for food brands
Content marketing for food brands is the organic engine that turns a DTC snack, drink, or CPG storefront into a search-driven revenue channel. Recipe hub of 40 to 100 recipes. Ingredient comparison guides at 12 to 24 pieces. Sourcing story pages at 6 to 12 pieces. Buyer intent content at 8 to 16 pieces. Creator syndication calendar with 12 to 30 creators per quarter. Refresh cadence at 12 to 24 months by pillar. Reporting with organic sessions and organic revenue attribution.
If your DTC food brand is running paid social at 20,000 dollars monthly with a broken blog and zero recipe schema, professional content marketing for food brands pays for itself inside the first 90 days on organic traffic captured. Redefine Web ships content marketing inside our monthly retainer packages. Book a call and we will walk through the last three DTC food brands we built recipe hubs for, pillar by pillar.
Anchor text on internal links varies across recipe hubs to avoid over-optimization patterns Google penalizes. Exact-match anchor (“single-origin Ethiopian coffee”) runs on 20 to 30 percent of internal links. Partial-match variations (“our Ethiopian roast”) run on 30 to 40 percent. Branded anchors (the SKU name) run on 20 to 30 percent. Generic anchors (“shop the coffee”) fill the remaining 10 to 20 percent. This ratio holds ranking without triggering the over-optimization penalty that shows up on brands that anchor-text-stuff every internal link with the same exact-match keyword. Cross-reference the linking layer on our food and beverage web design page.
Link equity from ingredient guides to SKU pages
Link equity from ingredient guides passes to SKU pages when the guide’s comparison table names the hero SKU in the winning column with a product card, and when the guide’s body links to 3 to 6 recipes that use the winning ingredient. This 3-hop path (guide to recipe to SKU) pushes authority from a high-traffic informational query down to a high-intent transactional page. According to Search Engine Land SEO coverage, informational content that internally links to transactional pages produces 2 to 4 times higher organic revenue than isolated content silos.
Wrapping up content marketing for food brands
Content marketing for food brands is the organic engine that turns a DTC snack, drink, or CPG storefront into a search-driven revenue channel. Recipe hub of 40 to 100 recipes. Ingredient comparison guides at 12 to 24 pieces. Sourcing story pages at 6 to 12 pieces. Buyer intent content at 8 to 16 pieces. Creator syndication calendar with 12 to 30 creators per quarter. Refresh cadence at 12 to 24 months by pillar. Reporting with organic sessions and organic revenue attribution.
If your DTC food brand is running paid social at 20,000 dollars monthly with a broken blog and zero recipe schema, professional content marketing for food brands pays for itself inside the first 90 days on organic traffic captured. Redefine Web ships content marketing inside our monthly retainer packages. Book a call and we will walk through the last three DTC food brands we built recipe hubs for, pillar by pillar.
Content marketing for food brands starts with a recipe hub because recipe queries account for 40 to 60 percent of high-intent search volume in the food category. Every hero SKU needs 4 to 12 recipes anchored to it, each targeting a specific occasion and audience.
Skip the recipe hub and the brand loses the search real estate that pulls DTC storefront traffic month over month at zero incremental paid cost. Recipe traffic converts at 2 to 4 percent because the shopper landed with usage intent, not passive discovery, which is why food brands win on recipes.
Recipe schema and Google rich result eligibility
Every recipe page ships schema.org Recipe markup including cookTime, prepTime, recipeIngredient, recipeInstructions, nutrition, and aggregateRating. Correctly marked-up recipes qualify for Google’s recipe rich result carousel that pulls 3 to 6 times higher click-through rate than a plain blue link. The schema layer takes 15 minutes per recipe to author and 30 minutes to validate in Google Search Console. Cross-reference the recipe search stack on our food and beverage SEO page.
Recipe hub structure that scales
The recipe hub structure runs 40 to 100 recipes at maturity, organized by hero SKU (4 to 12 recipes per SKU) plus occasion tags (breakfast, weeknight dinner, meal prep, brunch, holiday). Every recipe links back to the hero SKU product page with the SKU embedded in an inline card. The hub earns internal linking value from ingredient comparison guides and the sourcing story pages, which feeds recipe ranking on Google. According to Google Search Central recipe structured data guidance, complete Recipe schema markup is required for eligibility in the recipe carousel and the ingredient search filter.
Pillar structure for food brand content marketing
The pillar structure on content marketing for food brands runs 4 content pillars concurrently: recipe hub (40 to 100 recipes), ingredient comparison guides (12 to 24 guides), sourcing story pages (6 to 12 pages), and buyer intent content (where to buy, subscription vs. one-time, gift bundle guides). Every pillar covers a distinct search intent and every pillar links back to the hero SKU product pages.
Ingredient comparison guide format
Ingredient comparison guides run 1,800 to 3,200 words comparing 2 to 4 ingredient types on 6 to 10 attributes with a comparison table, real-world use case examples, and links to the hero SKU that uses the specific ingredient. Example: organic vs. conventional oats compares nutritional profile, sourcing chain, cost, environmental impact, and taste on a 6-column table. The brand’s SKU appears in the winning column with a product card. These guides rank 3 to 8 months after publication and pull steady-state organic traffic.
Sourcing story pages that build trust
Sourcing story pages name the specific farms, cooperatives, or suppliers the brand sources from, with photos of the farms, farmer quotes, and specific harvest windows. A coffee brand’s Ethiopian farm page ranks for “single-origin Ethiopian coffee” and “Yirgacheffe coffee origin” plus 40 long-tail variations. The sourcing page pulls trust-building traffic that converts at 4 to 6 percent because the shopper landed pattern-matching on transparency and named provenance. Every sourcing page includes farmer or cooperative quotes, harvest dates, and a link back to 3 to 5 hero SKU pages that source from the named supplier.
Vejrø hospitality content case study
Vejrø Resort, a Danish private-island destination with an on-site restaurant focused on organic, locally sourced cuisine, joined us with strong social engagement and no organic-search real estate. Guests found the resort on Instagram but never in Google search for terms like “private island resort Denmark,” “farm-to-table hospitality Denmark,” or “Vejrø restaurant.” The same organic-search gap shows up on DTC food brands running paid social at 20,000 dollars monthly with a broken blog and zero recipe schema.
We built the conversion-focused website with on-site and off-site SEO tuned to the travel-niche keyword clusters, competitor analysis against comparable boutique resorts, and mobile-first design prioritizing guest discovery. Every page carried the structured data qualifying it for Google’s rich results in the hospitality category. Every internal link pushed authority toward the direct-booking conversion path.
Three months later, Vejrø hit 10,000 plus organic visitors, ranked for 200 plus first-page keywords, and pulled a 2.2 percent booking conversion rate from organic traffic. The same pattern applies to content marketing for food brands: recipe schema, ingredient comparison guides, and sourcing story pages pull organic traffic at 20 to 40 percent conversion into hero SKU pages inside 6 months when the content quality matches search intent and every page carries the right structured data markup. Vejrø also proved out the reporting discipline: every monthly report named the exact page, the exact keyword cluster, and the exact search feature (rich result, sitelinks, image pack) driving the incremental organic revenue instead of hiding behind aggregate traffic charts.
Recipe cadence and content calendar for food brands
Recipe cadence on a working food brand content calendar ships 2 to 4 new recipes per week during the first 6 months and drops to 1 per week at maturity. Each recipe takes 4 to 6 hours to produce (write, test in the kitchen, photograph, schema author, publish). At 3 recipes per week, the brand hits 78 recipes inside 6 months plus a backlog of ingredient comparison and sourcing content queued behind the recipe production line.
| Content pillar | Target volume year 1 | Production cost per piece | Refresh cadence |
|---|---|---|---|
| Recipe hub | 40 to 100 recipes | $180 to $320 | Every 12 months |
| Ingredient comparison guides | 12 to 24 guides | $450 to $780 | Every 18 months |
| Sourcing story pages | 6 to 12 pages | $680 to $1,200 | Every 24 months |
| Buyer intent content | 8 to 16 pieces | $220 to $420 | Every 12 months |
Photography as a content calendar constraint
Photography is the actual constraint on recipe cadence, not writing. Every recipe needs 6 to 12 photos: hero shot, ingredient flat lay, prep in progress, plated result, storage, and step shots for the schema markup. A working food brand batches photography 8 recipes at a time to keep the cost per recipe under 200 dollars. Skip the batching and the per-recipe cost climbs to 400 to 600 dollars, which caps recipe cadence at 1 per week and slows organic ranking timeline by 6 months.
Seasonal content calendar planning
Seasonal content calendar planning maps recipes and comparison guides to the seasonal windows they need to rank in. A Christmas cookie recipe needs to publish in September to rank by early December. A Valentine’s chocolate guide needs to publish in November to rank by early February. A back-to-school lunchbox recipe needs to publish in June to rank by late August. The 60-to-90-day ranking curve dictates the calendar.
Creator syndication inside food brand content
Creator syndication on food brand content marketing amplifies the recipe hub through Instagram Reels, TikTok, and YouTube Shorts creators paid to post their own version of the brand’s hero recipes. The creator content pulls net-new audiences into the recipe hub through the creator’s Link in Bio or Amazon Storefront tag. The syndication calendar names 12 to 30 creators per quarter with specific recipes assigned to each.
One brand we picked up had a spreadsheet titled “creator outreach 2023” with 47 rows and 3 responses. All 3 responses were auto-replies. The spreadsheet named zero recipes and offered flat rates below 100 dollars per post. Nobody posts a 30-second video for 87 dollars flat. Nobody.
Creator content commercial terms that work
Working creator content commercial terms run 350 to 1,500 dollars flat per post plus a 12 to 25 percent commission on tagged sales across a 30-day window. The commission mechanic pulls creators into follow-up posts because the incremental revenue continues past the initial fee. Mid-tier creators (30k to 150k followers) hit the sweet spot for food brand content because their engagement rate typically runs 4 to 8 percent versus 0.8 to 1.6 percent on mega-creators.
Content brief structure for creator partnerships
The content brief structure for creator partnerships runs a single page: the SKU, the specific recipe or usage occasion, 3 required brand mentions, 3 restricted claims (no health claims on non-medical SKUs), the pricing angle, the affiliate link, and 3 example videos that hit the tone. The brief avoids over-scripting because over-scripted creator content underperforms native creator voice by 40 to 60 percent on engagement rate.
Buyer intent content for food brand blogs
Buyer intent content on food brand blogs covers 8 to 16 pieces targeting explicit purchase-decision queries: “where to buy [brand],” “[brand] subscription vs. one-time,” “best [category] for [use case],” and “[brand] gift bundle.” Every buyer intent piece runs 1,400 to 2,400 words with a comparison table, product cards, and a clear conversion path to the specific SKU that matches the query intent. Buyer intent content converts at 3 to 6 percent versus 1 to 2 percent on recipe content because the shopper landed already planning to buy, not exploring a usage occasion.
Where-to-buy content structure
Where-to-buy content structure covers online (DTC storefront, Amazon, Target.com, Whole Foods online), retail (specific chain locators with the store finder embedded), and international (customs limitations, retailer partners abroad). Every piece names specific retailers, links to the store locator, and includes an FAQ block covering shipping availability, subscription options, and gift card compatibility. Where-to-buy content ranks for branded discovery queries the DTC storefront otherwise loses to competitor affiliate reviews.
Subscription versus one-time comparison content
Subscription versus one-time comparison content converts subscription commitments at 3 to 6 percent because it addresses the price-sensitivity concern head-on with a specific math table. The piece covers the discount structure (15 percent lifetime), the skip-a-month mechanic, the pause-anytime rule, the cancellation policy, and the specific yearly savings for the brand’s average consumption cadence. Cross-reference the retention structure on our food and beverage marketing retainer page.
Content refresh cadence on food brand pillars
Content refresh cadence on food brand content pillars runs a rolling audit every 12 to 24 months by pillar. Recipes get refreshed every 12 months with new photography, updated schema, and any nutrition or ingredient adjustments. Ingredient comparison guides refresh every 18 months to update market data. Sourcing story pages refresh every 24 months to reflect farm partnership changes and new harvest angles. Buyer intent content refreshes every 12 months to update retailer availability and pricing.
Recipe refresh priority order
Recipe refresh priority runs by organic traffic rank. The top 20 recipes by monthly organic sessions get refreshed first (new photography, schema audit, related recipe internal links, updated nutrition). The next 40 get refreshed at 15 months. The remaining recipes get refreshed opportunistically when the ranking slips past position 15 in Google. Skipping the refresh cadence lets recipe rankings drift out of the top 3 inside 18 months as newer competitor recipes take the position.
Schema audit checklist per refresh
The schema audit checklist per refresh runs 8 items: Recipe schema completeness, aggregateRating count and accuracy, nutrition data accuracy, prepTime and cookTime match the recipe body, image URLs valid at CDN, related recipe internal links working, product card SKU URL live, and Google Search Console rich result eligibility validated. This checklist takes 20 minutes per recipe and prevents the schema drift that costs recipe rankings 20 to 40 positions quietly.
Reporting cadence for food brand content marketing
Reporting cadence on food brand content marketing runs a monthly executive report plus a quarterly business review. The monthly report ships in the first business week and covers organic sessions by pillar, top 10 ranking recipes with position trend, ingredient guide ranking movements, sourcing page performance, and organic-attributed DTC revenue. Every number carries a comparison to the prior month and a plain-language interpretation the founder reads in 7 minutes.
Metrics that matter for content marketing
Metrics that matter for food brand content marketing: organic sessions by pillar, recipe rich result impressions in Search Console, organic conversion rate to hero SKU pages, organic-attributed DTC revenue, and top 20 ranking positions by monthly organic sessions. Vanity metrics that do not matter: total pageviews without conversion context, average time on page without conversion attribution, and social share counts. The monthly report skips the vanity block entirely.
Quarterly business review structure
The quarterly business review runs 90 minutes with the founder, head of content, and SEO lead. Agenda: organic traffic trend by pillar, top 10 winning content pieces, top 10 losing content pieces (candidates for refresh or removal), competitive gap analysis against 5 named competitor brands, and next quarter’s content calendar with recipes and ingredient guides queued. According to Ahrefs content marketing research, brands running quarterly content audits outperform brands running annual audits by 40 to 70 percent on organic revenue over a 24-month window.
Internal linking discipline across food brand content
Internal linking discipline across food brand content moves authority from recipe pages toward hero SKU product pages and comparison guides. Every recipe links to the hero SKU it uses inline (once in the ingredient list, once in a bottom call-out card). Every ingredient comparison guide links to 3 to 6 recipes using the winning ingredient plus the hero SKU product page. Every sourcing story links to the 2 to 4 SKUs sourced from that specific farm or cooperative.
Anchor text strategy across recipe hubs
Anchor text on internal links varies across recipe hubs to avoid over-optimization patterns Google penalizes. Exact-match anchor (“single-origin Ethiopian coffee”) runs on 20 to 30 percent of internal links. Partial-match variations (“our Ethiopian roast”) run on 30 to 40 percent. Branded anchors (the SKU name) run on 20 to 30 percent. Generic anchors (“shop the coffee”) fill the remaining 10 to 20 percent. This ratio holds ranking without triggering the over-optimization penalty that shows up on brands that anchor-text-stuff every internal link with the same exact-match keyword. Cross-reference the linking layer on our food and beverage web design page.
Link equity from ingredient guides to SKU pages
Link equity from ingredient guides passes to SKU pages when the guide’s comparison table names the hero SKU in the winning column with a product card, and when the guide’s body links to 3 to 6 recipes that use the winning ingredient. This 3-hop path (guide to recipe to SKU) pushes authority from a high-traffic informational query down to a high-intent transactional page. According to Search Engine Land SEO coverage, informational content that internally links to transactional pages produces 2 to 4 times higher organic revenue than isolated content silos.
Wrapping up content marketing for food brands
Content marketing for food brands is the organic engine that turns a DTC snack, drink, or CPG storefront into a search-driven revenue channel. Recipe hub of 40 to 100 recipes. Ingredient comparison guides at 12 to 24 pieces. Sourcing story pages at 6 to 12 pieces. Buyer intent content at 8 to 16 pieces. Creator syndication calendar with 12 to 30 creators per quarter. Refresh cadence at 12 to 24 months by pillar. Reporting with organic sessions and organic revenue attribution.
If your DTC food brand is running paid social at 20,000 dollars monthly with a broken blog and zero recipe schema, professional content marketing for food brands pays for itself inside the first 90 days on organic traffic captured. Redefine Web ships content marketing inside our monthly retainer packages. Book a call and we will walk through the last three DTC food brands we built recipe hubs for, pillar by pillar.
Content marketing for food brands starts with a recipe hub because recipe queries account for 40 to 60 percent of high-intent search volume in the food category. Every hero SKU needs 4 to 12 recipes anchored to it, each targeting a specific occasion and audience.
Skip the recipe hub and the brand loses the search real estate that pulls DTC storefront traffic month over month at zero incremental paid cost. Recipe traffic converts at 2 to 4 percent because the shopper landed with usage intent, not passive discovery, which is why food brands win on recipes.
Recipe schema and Google rich result eligibility
Every recipe page ships schema.org Recipe markup including cookTime, prepTime, recipeIngredient, recipeInstructions, nutrition, and aggregateRating. Correctly marked-up recipes qualify for Google’s recipe rich result carousel that pulls 3 to 6 times higher click-through rate than a plain blue link. The schema layer takes 15 minutes per recipe to author and 30 minutes to validate in Google Search Console. Cross-reference the recipe search stack on our food and beverage SEO page.
Recipe hub structure that scales
The recipe hub structure runs 40 to 100 recipes at maturity, organized by hero SKU (4 to 12 recipes per SKU) plus occasion tags (breakfast, weeknight dinner, meal prep, brunch, holiday). Every recipe links back to the hero SKU product page with the SKU embedded in an inline card. The hub earns internal linking value from ingredient comparison guides and the sourcing story pages, which feeds recipe ranking on Google. According to Google Search Central recipe structured data guidance, complete Recipe schema markup is required for eligibility in the recipe carousel and the ingredient search filter.
Pillar structure for food brand content marketing
The pillar structure on content marketing for food brands runs 4 content pillars concurrently: recipe hub (40 to 100 recipes), ingredient comparison guides (12 to 24 guides), sourcing story pages (6 to 12 pages), and buyer intent content (where to buy, subscription vs. one-time, gift bundle guides). Every pillar covers a distinct search intent and every pillar links back to the hero SKU product pages.
Ingredient comparison guide format
Ingredient comparison guides run 1,800 to 3,200 words comparing 2 to 4 ingredient types on 6 to 10 attributes with a comparison table, real-world use case examples, and links to the hero SKU that uses the specific ingredient. Example: organic vs. conventional oats compares nutritional profile, sourcing chain, cost, environmental impact, and taste on a 6-column table. The brand’s SKU appears in the winning column with a product card. These guides rank 3 to 8 months after publication and pull steady-state organic traffic.
Sourcing story pages that build trust
Sourcing story pages name the specific farms, cooperatives, or suppliers the brand sources from, with photos of the farms, farmer quotes, and specific harvest windows. A coffee brand’s Ethiopian farm page ranks for “single-origin Ethiopian coffee” and “Yirgacheffe coffee origin” plus 40 long-tail variations. The sourcing page pulls trust-building traffic that converts at 4 to 6 percent because the shopper landed pattern-matching on transparency and named provenance. Every sourcing page includes farmer or cooperative quotes, harvest dates, and a link back to 3 to 5 hero SKU pages that source from the named supplier.
Vejrø hospitality content case study
Vejrø Resort, a Danish private-island destination with an on-site restaurant focused on organic, locally sourced cuisine, joined us with strong social engagement and no organic-search real estate. Guests found the resort on Instagram but never in Google search for terms like “private island resort Denmark,” “farm-to-table hospitality Denmark,” or “Vejrø restaurant.” The same organic-search gap shows up on DTC food brands running paid social at 20,000 dollars monthly with a broken blog and zero recipe schema.
We built the conversion-focused website with on-site and off-site SEO tuned to the travel-niche keyword clusters, competitor analysis against comparable boutique resorts, and mobile-first design prioritizing guest discovery. Every page carried the structured data qualifying it for Google’s rich results in the hospitality category. Every internal link pushed authority toward the direct-booking conversion path.
Three months later, Vejrø hit 10,000 plus organic visitors, ranked for 200 plus first-page keywords, and pulled a 2.2 percent booking conversion rate from organic traffic. The same pattern applies to content marketing for food brands: recipe schema, ingredient comparison guides, and sourcing story pages pull organic traffic at 20 to 40 percent conversion into hero SKU pages inside 6 months when the content quality matches search intent and every page carries the right structured data markup. Vejrø also proved out the reporting discipline: every monthly report named the exact page, the exact keyword cluster, and the exact search feature (rich result, sitelinks, image pack) driving the incremental organic revenue instead of hiding behind aggregate traffic charts.
Recipe cadence and content calendar for food brands
Recipe cadence on a working food brand content calendar ships 2 to 4 new recipes per week during the first 6 months and drops to 1 per week at maturity. Each recipe takes 4 to 6 hours to produce (write, test in the kitchen, photograph, schema author, publish). At 3 recipes per week, the brand hits 78 recipes inside 6 months plus a backlog of ingredient comparison and sourcing content queued behind the recipe production line.
| Content pillar | Target volume year 1 | Production cost per piece | Refresh cadence |
|---|---|---|---|
| Recipe hub | 40 to 100 recipes | $180 to $320 | Every 12 months |
| Ingredient comparison guides | 12 to 24 guides | $450 to $780 | Every 18 months |
| Sourcing story pages | 6 to 12 pages | $680 to $1,200 | Every 24 months |
| Buyer intent content | 8 to 16 pieces | $220 to $420 | Every 12 months |
Photography as a content calendar constraint
Photography is the actual constraint on recipe cadence, not writing. Every recipe needs 6 to 12 photos: hero shot, ingredient flat lay, prep in progress, plated result, storage, and step shots for the schema markup. A working food brand batches photography 8 recipes at a time to keep the cost per recipe under 200 dollars. Skip the batching and the per-recipe cost climbs to 400 to 600 dollars, which caps recipe cadence at 1 per week and slows organic ranking timeline by 6 months.
Seasonal content calendar planning
Seasonal content calendar planning maps recipes and comparison guides to the seasonal windows they need to rank in. A Christmas cookie recipe needs to publish in September to rank by early December. A Valentine’s chocolate guide needs to publish in November to rank by early February. A back-to-school lunchbox recipe needs to publish in June to rank by late August. The 60-to-90-day ranking curve dictates the calendar.
Creator syndication inside food brand content
Creator syndication on food brand content marketing amplifies the recipe hub through Instagram Reels, TikTok, and YouTube Shorts creators paid to post their own version of the brand’s hero recipes. The creator content pulls net-new audiences into the recipe hub through the creator’s Link in Bio or Amazon Storefront tag. The syndication calendar names 12 to 30 creators per quarter with specific recipes assigned to each.
One brand we picked up had a spreadsheet titled “creator outreach 2023” with 47 rows and 3 responses. All 3 responses were auto-replies. The spreadsheet named zero recipes and offered flat rates below 100 dollars per post. Nobody posts a 30-second video for 87 dollars flat. Nobody.
Creator content commercial terms that work
Working creator content commercial terms run 350 to 1,500 dollars flat per post plus a 12 to 25 percent commission on tagged sales across a 30-day window. The commission mechanic pulls creators into follow-up posts because the incremental revenue continues past the initial fee. Mid-tier creators (30k to 150k followers) hit the sweet spot for food brand content because their engagement rate typically runs 4 to 8 percent versus 0.8 to 1.6 percent on mega-creators.
Content brief structure for creator partnerships
The content brief structure for creator partnerships runs a single page: the SKU, the specific recipe or usage occasion, 3 required brand mentions, 3 restricted claims (no health claims on non-medical SKUs), the pricing angle, the affiliate link, and 3 example videos that hit the tone. The brief avoids over-scripting because over-scripted creator content underperforms native creator voice by 40 to 60 percent on engagement rate.
Buyer intent content for food brand blogs
Buyer intent content on food brand blogs covers 8 to 16 pieces targeting explicit purchase-decision queries: “where to buy [brand],” “[brand] subscription vs. one-time,” “best [category] for [use case],” and “[brand] gift bundle.” Every buyer intent piece runs 1,400 to 2,400 words with a comparison table, product cards, and a clear conversion path to the specific SKU that matches the query intent. Buyer intent content converts at 3 to 6 percent versus 1 to 2 percent on recipe content because the shopper landed already planning to buy, not exploring a usage occasion.
Where-to-buy content structure
Where-to-buy content structure covers online (DTC storefront, Amazon, Target.com, Whole Foods online), retail (specific chain locators with the store finder embedded), and international (customs limitations, retailer partners abroad). Every piece names specific retailers, links to the store locator, and includes an FAQ block covering shipping availability, subscription options, and gift card compatibility. Where-to-buy content ranks for branded discovery queries the DTC storefront otherwise loses to competitor affiliate reviews.
Subscription versus one-time comparison content
Subscription versus one-time comparison content converts subscription commitments at 3 to 6 percent because it addresses the price-sensitivity concern head-on with a specific math table. The piece covers the discount structure (15 percent lifetime), the skip-a-month mechanic, the pause-anytime rule, the cancellation policy, and the specific yearly savings for the brand’s average consumption cadence. Cross-reference the retention structure on our food and beverage marketing retainer page.
Content refresh cadence on food brand pillars
Content refresh cadence on food brand content pillars runs a rolling audit every 12 to 24 months by pillar. Recipes get refreshed every 12 months with new photography, updated schema, and any nutrition or ingredient adjustments. Ingredient comparison guides refresh every 18 months to update market data. Sourcing story pages refresh every 24 months to reflect farm partnership changes and new harvest angles. Buyer intent content refreshes every 12 months to update retailer availability and pricing.
Recipe refresh priority order
Recipe refresh priority runs by organic traffic rank. The top 20 recipes by monthly organic sessions get refreshed first (new photography, schema audit, related recipe internal links, updated nutrition). The next 40 get refreshed at 15 months. The remaining recipes get refreshed opportunistically when the ranking slips past position 15 in Google. Skipping the refresh cadence lets recipe rankings drift out of the top 3 inside 18 months as newer competitor recipes take the position.
Schema audit checklist per refresh
The schema audit checklist per refresh runs 8 items: Recipe schema completeness, aggregateRating count and accuracy, nutrition data accuracy, prepTime and cookTime match the recipe body, image URLs valid at CDN, related recipe internal links working, product card SKU URL live, and Google Search Console rich result eligibility validated. This checklist takes 20 minutes per recipe and prevents the schema drift that costs recipe rankings 20 to 40 positions quietly.
Reporting cadence for food brand content marketing
Reporting cadence on food brand content marketing runs a monthly executive report plus a quarterly business review. The monthly report ships in the first business week and covers organic sessions by pillar, top 10 ranking recipes with position trend, ingredient guide ranking movements, sourcing page performance, and organic-attributed DTC revenue. Every number carries a comparison to the prior month and a plain-language interpretation the founder reads in 7 minutes.
Metrics that matter for content marketing
Metrics that matter for food brand content marketing: organic sessions by pillar, recipe rich result impressions in Search Console, organic conversion rate to hero SKU pages, organic-attributed DTC revenue, and top 20 ranking positions by monthly organic sessions. Vanity metrics that do not matter: total pageviews without conversion context, average time on page without conversion attribution, and social share counts. The monthly report skips the vanity block entirely.
Quarterly business review structure
The quarterly business review runs 90 minutes with the founder, head of content, and SEO lead. Agenda: organic traffic trend by pillar, top 10 winning content pieces, top 10 losing content pieces (candidates for refresh or removal), competitive gap analysis against 5 named competitor brands, and next quarter’s content calendar with recipes and ingredient guides queued. According to Ahrefs content marketing research, brands running quarterly content audits outperform brands running annual audits by 40 to 70 percent on organic revenue over a 24-month window.
Internal linking discipline across food brand content
Internal linking discipline across food brand content moves authority from recipe pages toward hero SKU product pages and comparison guides. Every recipe links to the hero SKU it uses inline (once in the ingredient list, once in a bottom call-out card). Every ingredient comparison guide links to 3 to 6 recipes using the winning ingredient plus the hero SKU product page. Every sourcing story links to the 2 to 4 SKUs sourced from that specific farm or cooperative.
Anchor text strategy across recipe hubs
Anchor text on internal links varies across recipe hubs to avoid over-optimization patterns Google penalizes. Exact-match anchor (“single-origin Ethiopian coffee”) runs on 20 to 30 percent of internal links. Partial-match variations (“our Ethiopian roast”) run on 30 to 40 percent. Branded anchors (the SKU name) run on 20 to 30 percent. Generic anchors (“shop the coffee”) fill the remaining 10 to 20 percent. This ratio holds ranking without triggering the over-optimization penalty that shows up on brands that anchor-text-stuff every internal link with the same exact-match keyword. Cross-reference the linking layer on our food and beverage web design page.
Link equity from ingredient guides to SKU pages
Link equity from ingredient guides passes to SKU pages when the guide’s comparison table names the hero SKU in the winning column with a product card, and when the guide’s body links to 3 to 6 recipes that use the winning ingredient. This 3-hop path (guide to recipe to SKU) pushes authority from a high-traffic informational query down to a high-intent transactional page. According to Search Engine Land SEO coverage, informational content that internally links to transactional pages produces 2 to 4 times higher organic revenue than isolated content silos.
Wrapping up content marketing for food brands
Content marketing for food brands is the organic engine that turns a DTC snack, drink, or CPG storefront into a search-driven revenue channel. Recipe hub of 40 to 100 recipes. Ingredient comparison guides at 12 to 24 pieces. Sourcing story pages at 6 to 12 pieces. Buyer intent content at 8 to 16 pieces. Creator syndication calendar with 12 to 30 creators per quarter. Refresh cadence at 12 to 24 months by pillar. Reporting with organic sessions and organic revenue attribution.
If your DTC food brand is running paid social at 20,000 dollars monthly with a broken blog and zero recipe schema, professional content marketing for food brands pays for itself inside the first 90 days on organic traffic captured. Redefine Web ships content marketing inside our monthly retainer packages. Book a call and we will walk through the last three DTC food brands we built recipe hubs for, pillar by pillar.
Internal linking discipline across food brand content moves authority from recipe pages toward hero SKU product pages and comparison guides. Every recipe links to the hero SKU it uses inline (once in the ingredient list, once in a bottom call-out card). Every ingredient comparison guide links to 3 to 6 recipes using the winning ingredient plus the hero SKU product page. Every sourcing story links to the 2 to 4 SKUs sourced from that specific farm or cooperative.
Anchor text strategy across recipe hubs
Anchor text on internal links varies across recipe hubs to avoid over-optimization patterns Google penalizes. Exact-match anchor (“single-origin Ethiopian coffee”) runs on 20 to 30 percent of internal links. Partial-match variations (“our Ethiopian roast”) run on 30 to 40 percent. Branded anchors (the SKU name) run on 20 to 30 percent. Generic anchors (“shop the coffee”) fill the remaining 10 to 20 percent. This ratio holds ranking without triggering the over-optimization penalty that shows up on brands that anchor-text-stuff every internal link with the same exact-match keyword. Cross-reference the linking layer on our food and beverage web design page.
Link equity from ingredient guides to SKU pages
Link equity from ingredient guides passes to SKU pages when the guide’s comparison table names the hero SKU in the winning column with a product card, and when the guide’s body links to 3 to 6 recipes that use the winning ingredient. This 3-hop path (guide to recipe to SKU) pushes authority from a high-traffic informational query down to a high-intent transactional page. According to Search Engine Land SEO coverage, informational content that internally links to transactional pages produces 2 to 4 times higher organic revenue than isolated content silos.
Wrapping up content marketing for food brands
Content marketing for food brands is the organic engine that turns a DTC snack, drink, or CPG storefront into a search-driven revenue channel. Recipe hub of 40 to 100 recipes. Ingredient comparison guides at 12 to 24 pieces. Sourcing story pages at 6 to 12 pieces. Buyer intent content at 8 to 16 pieces. Creator syndication calendar with 12 to 30 creators per quarter. Refresh cadence at 12 to 24 months by pillar. Reporting with organic sessions and organic revenue attribution.
If your DTC food brand is running paid social at 20,000 dollars monthly with a broken blog and zero recipe schema, professional content marketing for food brands pays for itself inside the first 90 days on organic traffic captured. Redefine Web ships content marketing inside our monthly retainer packages. Book a call and we will walk through the last three DTC food brands we built recipe hubs for, pillar by pillar.
Content marketing for food brands starts with a recipe hub because recipe queries account for 40 to 60 percent of high-intent search volume in the food category. Every hero SKU needs 4 to 12 recipes anchored to it, each targeting a specific occasion and audience.
Skip the recipe hub and the brand loses the search real estate that pulls DTC storefront traffic month over month at zero incremental paid cost. Recipe traffic converts at 2 to 4 percent because the shopper landed with usage intent, not passive discovery, which is why food brands win on recipes.
Recipe schema and Google rich result eligibility
Every recipe page ships schema.org Recipe markup including cookTime, prepTime, recipeIngredient, recipeInstructions, nutrition, and aggregateRating. Correctly marked-up recipes qualify for Google’s recipe rich result carousel that pulls 3 to 6 times higher click-through rate than a plain blue link. The schema layer takes 15 minutes per recipe to author and 30 minutes to validate in Google Search Console. Cross-reference the recipe search stack on our food and beverage SEO page.
Recipe hub structure that scales
The recipe hub structure runs 40 to 100 recipes at maturity, organized by hero SKU (4 to 12 recipes per SKU) plus occasion tags (breakfast, weeknight dinner, meal prep, brunch, holiday). Every recipe links back to the hero SKU product page with the SKU embedded in an inline card. The hub earns internal linking value from ingredient comparison guides and the sourcing story pages, which feeds recipe ranking on Google. According to Google Search Central recipe structured data guidance, complete Recipe schema markup is required for eligibility in the recipe carousel and the ingredient search filter.
Pillar structure for food brand content marketing
The pillar structure on content marketing for food brands runs 4 content pillars concurrently: recipe hub (40 to 100 recipes), ingredient comparison guides (12 to 24 guides), sourcing story pages (6 to 12 pages), and buyer intent content (where to buy, subscription vs. one-time, gift bundle guides). Every pillar covers a distinct search intent and every pillar links back to the hero SKU product pages.
Ingredient comparison guide format
Ingredient comparison guides run 1,800 to 3,200 words comparing 2 to 4 ingredient types on 6 to 10 attributes with a comparison table, real-world use case examples, and links to the hero SKU that uses the specific ingredient. Example: organic vs. conventional oats compares nutritional profile, sourcing chain, cost, environmental impact, and taste on a 6-column table. The brand’s SKU appears in the winning column with a product card. These guides rank 3 to 8 months after publication and pull steady-state organic traffic.
Sourcing story pages that build trust
Sourcing story pages name the specific farms, cooperatives, or suppliers the brand sources from, with photos of the farms, farmer quotes, and specific harvest windows. A coffee brand’s Ethiopian farm page ranks for “single-origin Ethiopian coffee” and “Yirgacheffe coffee origin” plus 40 long-tail variations. The sourcing page pulls trust-building traffic that converts at 4 to 6 percent because the shopper landed pattern-matching on transparency and named provenance. Every sourcing page includes farmer or cooperative quotes, harvest dates, and a link back to 3 to 5 hero SKU pages that source from the named supplier.
Vejrø hospitality content case study
Vejrø Resort, a Danish private-island destination with an on-site restaurant focused on organic, locally sourced cuisine, joined us with strong social engagement and no organic-search real estate. Guests found the resort on Instagram but never in Google search for terms like “private island resort Denmark,” “farm-to-table hospitality Denmark,” or “Vejrø restaurant.” The same organic-search gap shows up on DTC food brands running paid social at 20,000 dollars monthly with a broken blog and zero recipe schema.
We built the conversion-focused website with on-site and off-site SEO tuned to the travel-niche keyword clusters, competitor analysis against comparable boutique resorts, and mobile-first design prioritizing guest discovery. Every page carried the structured data qualifying it for Google’s rich results in the hospitality category. Every internal link pushed authority toward the direct-booking conversion path.
Three months later, Vejrø hit 10,000 plus organic visitors, ranked for 200 plus first-page keywords, and pulled a 2.2 percent booking conversion rate from organic traffic. The same pattern applies to content marketing for food brands: recipe schema, ingredient comparison guides, and sourcing story pages pull organic traffic at 20 to 40 percent conversion into hero SKU pages inside 6 months when the content quality matches search intent and every page carries the right structured data markup. Vejrø also proved out the reporting discipline: every monthly report named the exact page, the exact keyword cluster, and the exact search feature (rich result, sitelinks, image pack) driving the incremental organic revenue instead of hiding behind aggregate traffic charts.
Recipe cadence and content calendar for food brands
Recipe cadence on a working food brand content calendar ships 2 to 4 new recipes per week during the first 6 months and drops to 1 per week at maturity. Each recipe takes 4 to 6 hours to produce (write, test in the kitchen, photograph, schema author, publish). At 3 recipes per week, the brand hits 78 recipes inside 6 months plus a backlog of ingredient comparison and sourcing content queued behind the recipe production line.
| Content pillar | Target volume year 1 | Production cost per piece | Refresh cadence |
|---|---|---|---|
| Recipe hub | 40 to 100 recipes | $180 to $320 | Every 12 months |
| Ingredient comparison guides | 12 to 24 guides | $450 to $780 | Every 18 months |
| Sourcing story pages | 6 to 12 pages | $680 to $1,200 | Every 24 months |
| Buyer intent content | 8 to 16 pieces | $220 to $420 | Every 12 months |
Photography as a content calendar constraint
Photography is the actual constraint on recipe cadence, not writing. Every recipe needs 6 to 12 photos: hero shot, ingredient flat lay, prep in progress, plated result, storage, and step shots for the schema markup. A working food brand batches photography 8 recipes at a time to keep the cost per recipe under 200 dollars. Skip the batching and the per-recipe cost climbs to 400 to 600 dollars, which caps recipe cadence at 1 per week and slows organic ranking timeline by 6 months.
Seasonal content calendar planning
Seasonal content calendar planning maps recipes and comparison guides to the seasonal windows they need to rank in. A Christmas cookie recipe needs to publish in September to rank by early December. A Valentine’s chocolate guide needs to publish in November to rank by early February. A back-to-school lunchbox recipe needs to publish in June to rank by late August. The 60-to-90-day ranking curve dictates the calendar.
Creator syndication inside food brand content
Creator syndication on food brand content marketing amplifies the recipe hub through Instagram Reels, TikTok, and YouTube Shorts creators paid to post their own version of the brand’s hero recipes. The creator content pulls net-new audiences into the recipe hub through the creator’s Link in Bio or Amazon Storefront tag. The syndication calendar names 12 to 30 creators per quarter with specific recipes assigned to each.
One brand we picked up had a spreadsheet titled “creator outreach 2023” with 47 rows and 3 responses. All 3 responses were auto-replies. The spreadsheet named zero recipes and offered flat rates below 100 dollars per post. Nobody posts a 30-second video for 87 dollars flat. Nobody.
Creator content commercial terms that work
Working creator content commercial terms run 350 to 1,500 dollars flat per post plus a 12 to 25 percent commission on tagged sales across a 30-day window. The commission mechanic pulls creators into follow-up posts because the incremental revenue continues past the initial fee. Mid-tier creators (30k to 150k followers) hit the sweet spot for food brand content because their engagement rate typically runs 4 to 8 percent versus 0.8 to 1.6 percent on mega-creators.
Content brief structure for creator partnerships
The content brief structure for creator partnerships runs a single page: the SKU, the specific recipe or usage occasion, 3 required brand mentions, 3 restricted claims (no health claims on non-medical SKUs), the pricing angle, the affiliate link, and 3 example videos that hit the tone. The brief avoids over-scripting because over-scripted creator content underperforms native creator voice by 40 to 60 percent on engagement rate.
Buyer intent content for food brand blogs
Buyer intent content on food brand blogs covers 8 to 16 pieces targeting explicit purchase-decision queries: “where to buy [brand],” “[brand] subscription vs. one-time,” “best [category] for [use case],” and “[brand] gift bundle.” Every buyer intent piece runs 1,400 to 2,400 words with a comparison table, product cards, and a clear conversion path to the specific SKU that matches the query intent. Buyer intent content converts at 3 to 6 percent versus 1 to 2 percent on recipe content because the shopper landed already planning to buy, not exploring a usage occasion.
Where-to-buy content structure
Where-to-buy content structure covers online (DTC storefront, Amazon, Target.com, Whole Foods online), retail (specific chain locators with the store finder embedded), and international (customs limitations, retailer partners abroad). Every piece names specific retailers, links to the store locator, and includes an FAQ block covering shipping availability, subscription options, and gift card compatibility. Where-to-buy content ranks for branded discovery queries the DTC storefront otherwise loses to competitor affiliate reviews.
Subscription versus one-time comparison content
Subscription versus one-time comparison content converts subscription commitments at 3 to 6 percent because it addresses the price-sensitivity concern head-on with a specific math table. The piece covers the discount structure (15 percent lifetime), the skip-a-month mechanic, the pause-anytime rule, the cancellation policy, and the specific yearly savings for the brand’s average consumption cadence. Cross-reference the retention structure on our food and beverage marketing retainer page.
Content refresh cadence on food brand pillars
Content refresh cadence on food brand content pillars runs a rolling audit every 12 to 24 months by pillar. Recipes get refreshed every 12 months with new photography, updated schema, and any nutrition or ingredient adjustments. Ingredient comparison guides refresh every 18 months to update market data. Sourcing story pages refresh every 24 months to reflect farm partnership changes and new harvest angles. Buyer intent content refreshes every 12 months to update retailer availability and pricing.
Recipe refresh priority order
Recipe refresh priority runs by organic traffic rank. The top 20 recipes by monthly organic sessions get refreshed first (new photography, schema audit, related recipe internal links, updated nutrition). The next 40 get refreshed at 15 months. The remaining recipes get refreshed opportunistically when the ranking slips past position 15 in Google. Skipping the refresh cadence lets recipe rankings drift out of the top 3 inside 18 months as newer competitor recipes take the position.
Schema audit checklist per refresh
The schema audit checklist per refresh runs 8 items: Recipe schema completeness, aggregateRating count and accuracy, nutrition data accuracy, prepTime and cookTime match the recipe body, image URLs valid at CDN, related recipe internal links working, product card SKU URL live, and Google Search Console rich result eligibility validated. This checklist takes 20 minutes per recipe and prevents the schema drift that costs recipe rankings 20 to 40 positions quietly.
Reporting cadence for food brand content marketing
Reporting cadence on food brand content marketing runs a monthly executive report plus a quarterly business review. The monthly report ships in the first business week and covers organic sessions by pillar, top 10 ranking recipes with position trend, ingredient guide ranking movements, sourcing page performance, and organic-attributed DTC revenue. Every number carries a comparison to the prior month and a plain-language interpretation the founder reads in 7 minutes.
Metrics that matter for content marketing
Metrics that matter for food brand content marketing: organic sessions by pillar, recipe rich result impressions in Search Console, organic conversion rate to hero SKU pages, organic-attributed DTC revenue, and top 20 ranking positions by monthly organic sessions. Vanity metrics that do not matter: total pageviews without conversion context, average time on page without conversion attribution, and social share counts. The monthly report skips the vanity block entirely.
Quarterly business review structure
The quarterly business review runs 90 minutes with the founder, head of content, and SEO lead. Agenda: organic traffic trend by pillar, top 10 winning content pieces, top 10 losing content pieces (candidates for refresh or removal), competitive gap analysis against 5 named competitor brands, and next quarter’s content calendar with recipes and ingredient guides queued. According to Ahrefs content marketing research, brands running quarterly content audits outperform brands running annual audits by 40 to 70 percent on organic revenue over a 24-month window.
Internal linking discipline across food brand content
Internal linking discipline across food brand content moves authority from recipe pages toward hero SKU product pages and comparison guides. Every recipe links to the hero SKU it uses inline (once in the ingredient list, once in a bottom call-out card). Every ingredient comparison guide links to 3 to 6 recipes using the winning ingredient plus the hero SKU product page. Every sourcing story links to the 2 to 4 SKUs sourced from that specific farm or cooperative.
Anchor text strategy across recipe hubs
Anchor text on internal links varies across recipe hubs to avoid over-optimization patterns Google penalizes. Exact-match anchor (“single-origin Ethiopian coffee”) runs on 20 to 30 percent of internal links. Partial-match variations (“our Ethiopian roast”) run on 30 to 40 percent. Branded anchors (the SKU name) run on 20 to 30 percent. Generic anchors (“shop the coffee”) fill the remaining 10 to 20 percent. This ratio holds ranking without triggering the over-optimization penalty that shows up on brands that anchor-text-stuff every internal link with the same exact-match keyword. Cross-reference the linking layer on our food and beverage web design page.
Link equity from ingredient guides to SKU pages
Link equity from ingredient guides passes to SKU pages when the guide’s comparison table names the hero SKU in the winning column with a product card, and when the guide’s body links to 3 to 6 recipes that use the winning ingredient. This 3-hop path (guide to recipe to SKU) pushes authority from a high-traffic informational query down to a high-intent transactional page. According to Search Engine Land SEO coverage, informational content that internally links to transactional pages produces 2 to 4 times higher organic revenue than isolated content silos.
Wrapping up content marketing for food brands
Content marketing for food brands is the organic engine that turns a DTC snack, drink, or CPG storefront into a search-driven revenue channel. Recipe hub of 40 to 100 recipes. Ingredient comparison guides at 12 to 24 pieces. Sourcing story pages at 6 to 12 pieces. Buyer intent content at 8 to 16 pieces. Creator syndication calendar with 12 to 30 creators per quarter. Refresh cadence at 12 to 24 months by pillar. Reporting with organic sessions and organic revenue attribution.
If your DTC food brand is running paid social at 20,000 dollars monthly with a broken blog and zero recipe schema, professional content marketing for food brands pays for itself inside the first 90 days on organic traffic captured. Redefine Web ships content marketing inside our monthly retainer packages. Book a call and we will walk through the last three DTC food brands we built recipe hubs for, pillar by pillar.
Content marketing for food brands starts with a recipe hub because recipe queries account for 40 to 60 percent of high-intent search volume in the food category. Every hero SKU needs 4 to 12 recipes anchored to it, each targeting a specific occasion and audience.
Skip the recipe hub and the brand loses the search real estate that pulls DTC storefront traffic month over month at zero incremental paid cost. Recipe traffic converts at 2 to 4 percent because the shopper landed with usage intent, not passive discovery, which is why food brands win on recipes.
Recipe schema and Google rich result eligibility
Every recipe page ships schema.org Recipe markup including cookTime, prepTime, recipeIngredient, recipeInstructions, nutrition, and aggregateRating. Correctly marked-up recipes qualify for Google’s recipe rich result carousel that pulls 3 to 6 times higher click-through rate than a plain blue link. The schema layer takes 15 minutes per recipe to author and 30 minutes to validate in Google Search Console. Cross-reference the recipe search stack on our food and beverage SEO page.
Recipe hub structure that scales
The recipe hub structure runs 40 to 100 recipes at maturity, organized by hero SKU (4 to 12 recipes per SKU) plus occasion tags (breakfast, weeknight dinner, meal prep, brunch, holiday). Every recipe links back to the hero SKU product page with the SKU embedded in an inline card. The hub earns internal linking value from ingredient comparison guides and the sourcing story pages, which feeds recipe ranking on Google. According to Google Search Central recipe structured data guidance, complete Recipe schema markup is required for eligibility in the recipe carousel and the ingredient search filter.
Pillar structure for food brand content marketing
The pillar structure on content marketing for food brands runs 4 content pillars concurrently: recipe hub (40 to 100 recipes), ingredient comparison guides (12 to 24 guides), sourcing story pages (6 to 12 pages), and buyer intent content (where to buy, subscription vs. one-time, gift bundle guides). Every pillar covers a distinct search intent and every pillar links back to the hero SKU product pages.
Ingredient comparison guide format
Ingredient comparison guides run 1,800 to 3,200 words comparing 2 to 4 ingredient types on 6 to 10 attributes with a comparison table, real-world use case examples, and links to the hero SKU that uses the specific ingredient. Example: organic vs. conventional oats compares nutritional profile, sourcing chain, cost, environmental impact, and taste on a 6-column table. The brand’s SKU appears in the winning column with a product card. These guides rank 3 to 8 months after publication and pull steady-state organic traffic.
Sourcing story pages that build trust
Sourcing story pages name the specific farms, cooperatives, or suppliers the brand sources from, with photos of the farms, farmer quotes, and specific harvest windows. A coffee brand’s Ethiopian farm page ranks for “single-origin Ethiopian coffee” and “Yirgacheffe coffee origin” plus 40 long-tail variations. The sourcing page pulls trust-building traffic that converts at 4 to 6 percent because the shopper landed pattern-matching on transparency and named provenance. Every sourcing page includes farmer or cooperative quotes, harvest dates, and a link back to 3 to 5 hero SKU pages that source from the named supplier.
Vejrø hospitality content case study
Vejrø Resort, a Danish private-island destination with an on-site restaurant focused on organic, locally sourced cuisine, joined us with strong social engagement and no organic-search real estate. Guests found the resort on Instagram but never in Google search for terms like “private island resort Denmark,” “farm-to-table hospitality Denmark,” or “Vejrø restaurant.” The same organic-search gap shows up on DTC food brands running paid social at 20,000 dollars monthly with a broken blog and zero recipe schema.
We built the conversion-focused website with on-site and off-site SEO tuned to the travel-niche keyword clusters, competitor analysis against comparable boutique resorts, and mobile-first design prioritizing guest discovery. Every page carried the structured data qualifying it for Google’s rich results in the hospitality category. Every internal link pushed authority toward the direct-booking conversion path.
Three months later, Vejrø hit 10,000 plus organic visitors, ranked for 200 plus first-page keywords, and pulled a 2.2 percent booking conversion rate from organic traffic. The same pattern applies to content marketing for food brands: recipe schema, ingredient comparison guides, and sourcing story pages pull organic traffic at 20 to 40 percent conversion into hero SKU pages inside 6 months when the content quality matches search intent and every page carries the right structured data markup. Vejrø also proved out the reporting discipline: every monthly report named the exact page, the exact keyword cluster, and the exact search feature (rich result, sitelinks, image pack) driving the incremental organic revenue instead of hiding behind aggregate traffic charts.
Recipe cadence and content calendar for food brands
Recipe cadence on a working food brand content calendar ships 2 to 4 new recipes per week during the first 6 months and drops to 1 per week at maturity. Each recipe takes 4 to 6 hours to produce (write, test in the kitchen, photograph, schema author, publish). At 3 recipes per week, the brand hits 78 recipes inside 6 months plus a backlog of ingredient comparison and sourcing content queued behind the recipe production line.
| Content pillar | Target volume year 1 | Production cost per piece | Refresh cadence |
|---|---|---|---|
| Recipe hub | 40 to 100 recipes | $180 to $320 | Every 12 months |
| Ingredient comparison guides | 12 to 24 guides | $450 to $780 | Every 18 months |
| Sourcing story pages | 6 to 12 pages | $680 to $1,200 | Every 24 months |
| Buyer intent content | 8 to 16 pieces | $220 to $420 | Every 12 months |
Photography as a content calendar constraint
Photography is the actual constraint on recipe cadence, not writing. Every recipe needs 6 to 12 photos: hero shot, ingredient flat lay, prep in progress, plated result, storage, and step shots for the schema markup. A working food brand batches photography 8 recipes at a time to keep the cost per recipe under 200 dollars. Skip the batching and the per-recipe cost climbs to 400 to 600 dollars, which caps recipe cadence at 1 per week and slows organic ranking timeline by 6 months.
Seasonal content calendar planning
Seasonal content calendar planning maps recipes and comparison guides to the seasonal windows they need to rank in. A Christmas cookie recipe needs to publish in September to rank by early December. A Valentine’s chocolate guide needs to publish in November to rank by early February. A back-to-school lunchbox recipe needs to publish in June to rank by late August. The 60-to-90-day ranking curve dictates the calendar.
Creator syndication inside food brand content
Creator syndication on food brand content marketing amplifies the recipe hub through Instagram Reels, TikTok, and YouTube Shorts creators paid to post their own version of the brand’s hero recipes. The creator content pulls net-new audiences into the recipe hub through the creator’s Link in Bio or Amazon Storefront tag. The syndication calendar names 12 to 30 creators per quarter with specific recipes assigned to each.
One brand we picked up had a spreadsheet titled “creator outreach 2023” with 47 rows and 3 responses. All 3 responses were auto-replies. The spreadsheet named zero recipes and offered flat rates below 100 dollars per post. Nobody posts a 30-second video for 87 dollars flat. Nobody.
Creator content commercial terms that work
Working creator content commercial terms run 350 to 1,500 dollars flat per post plus a 12 to 25 percent commission on tagged sales across a 30-day window. The commission mechanic pulls creators into follow-up posts because the incremental revenue continues past the initial fee. Mid-tier creators (30k to 150k followers) hit the sweet spot for food brand content because their engagement rate typically runs 4 to 8 percent versus 0.8 to 1.6 percent on mega-creators.
Content brief structure for creator partnerships
The content brief structure for creator partnerships runs a single page: the SKU, the specific recipe or usage occasion, 3 required brand mentions, 3 restricted claims (no health claims on non-medical SKUs), the pricing angle, the affiliate link, and 3 example videos that hit the tone. The brief avoids over-scripting because over-scripted creator content underperforms native creator voice by 40 to 60 percent on engagement rate.
Buyer intent content for food brand blogs
Buyer intent content on food brand blogs covers 8 to 16 pieces targeting explicit purchase-decision queries: “where to buy [brand],” “[brand] subscription vs. one-time,” “best [category] for [use case],” and “[brand] gift bundle.” Every buyer intent piece runs 1,400 to 2,400 words with a comparison table, product cards, and a clear conversion path to the specific SKU that matches the query intent. Buyer intent content converts at 3 to 6 percent versus 1 to 2 percent on recipe content because the shopper landed already planning to buy, not exploring a usage occasion.
Where-to-buy content structure
Where-to-buy content structure covers online (DTC storefront, Amazon, Target.com, Whole Foods online), retail (specific chain locators with the store finder embedded), and international (customs limitations, retailer partners abroad). Every piece names specific retailers, links to the store locator, and includes an FAQ block covering shipping availability, subscription options, and gift card compatibility. Where-to-buy content ranks for branded discovery queries the DTC storefront otherwise loses to competitor affiliate reviews.
Subscription versus one-time comparison content
Subscription versus one-time comparison content converts subscription commitments at 3 to 6 percent because it addresses the price-sensitivity concern head-on with a specific math table. The piece covers the discount structure (15 percent lifetime), the skip-a-month mechanic, the pause-anytime rule, the cancellation policy, and the specific yearly savings for the brand’s average consumption cadence. Cross-reference the retention structure on our food and beverage marketing retainer page.
Content refresh cadence on food brand pillars
Content refresh cadence on food brand content pillars runs a rolling audit every 12 to 24 months by pillar. Recipes get refreshed every 12 months with new photography, updated schema, and any nutrition or ingredient adjustments. Ingredient comparison guides refresh every 18 months to update market data. Sourcing story pages refresh every 24 months to reflect farm partnership changes and new harvest angles. Buyer intent content refreshes every 12 months to update retailer availability and pricing.
Recipe refresh priority order
Recipe refresh priority runs by organic traffic rank. The top 20 recipes by monthly organic sessions get refreshed first (new photography, schema audit, related recipe internal links, updated nutrition). The next 40 get refreshed at 15 months. The remaining recipes get refreshed opportunistically when the ranking slips past position 15 in Google. Skipping the refresh cadence lets recipe rankings drift out of the top 3 inside 18 months as newer competitor recipes take the position.
Schema audit checklist per refresh
The schema audit checklist per refresh runs 8 items: Recipe schema completeness, aggregateRating count and accuracy, nutrition data accuracy, prepTime and cookTime match the recipe body, image URLs valid at CDN, related recipe internal links working, product card SKU URL live, and Google Search Console rich result eligibility validated. This checklist takes 20 minutes per recipe and prevents the schema drift that costs recipe rankings 20 to 40 positions quietly.
Reporting cadence for food brand content marketing
Reporting cadence on food brand content marketing runs a monthly executive report plus a quarterly business review. The monthly report ships in the first business week and covers organic sessions by pillar, top 10 ranking recipes with position trend, ingredient guide ranking movements, sourcing page performance, and organic-attributed DTC revenue. Every number carries a comparison to the prior month and a plain-language interpretation the founder reads in 7 minutes.
Metrics that matter for content marketing
Metrics that matter for food brand content marketing: organic sessions by pillar, recipe rich result impressions in Search Console, organic conversion rate to hero SKU pages, organic-attributed DTC revenue, and top 20 ranking positions by monthly organic sessions. Vanity metrics that do not matter: total pageviews without conversion context, average time on page without conversion attribution, and social share counts. The monthly report skips the vanity block entirely.
Quarterly business review structure
The quarterly business review runs 90 minutes with the founder, head of content, and SEO lead. Agenda: organic traffic trend by pillar, top 10 winning content pieces, top 10 losing content pieces (candidates for refresh or removal), competitive gap analysis against 5 named competitor brands, and next quarter’s content calendar with recipes and ingredient guides queued. According to Ahrefs content marketing research, brands running quarterly content audits outperform brands running annual audits by 40 to 70 percent on organic revenue over a 24-month window.
Internal linking discipline across food brand content
Internal linking discipline across food brand content moves authority from recipe pages toward hero SKU product pages and comparison guides. Every recipe links to the hero SKU it uses inline (once in the ingredient list, once in a bottom call-out card). Every ingredient comparison guide links to 3 to 6 recipes using the winning ingredient plus the hero SKU product page. Every sourcing story links to the 2 to 4 SKUs sourced from that specific farm or cooperative.
Anchor text strategy across recipe hubs
Anchor text on internal links varies across recipe hubs to avoid over-optimization patterns Google penalizes. Exact-match anchor (“single-origin Ethiopian coffee”) runs on 20 to 30 percent of internal links. Partial-match variations (“our Ethiopian roast”) run on 30 to 40 percent. Branded anchors (the SKU name) run on 20 to 30 percent. Generic anchors (“shop the coffee”) fill the remaining 10 to 20 percent. This ratio holds ranking without triggering the over-optimization penalty that shows up on brands that anchor-text-stuff every internal link with the same exact-match keyword. Cross-reference the linking layer on our food and beverage web design page.
Link equity from ingredient guides to SKU pages
Link equity from ingredient guides passes to SKU pages when the guide’s comparison table names the hero SKU in the winning column with a product card, and when the guide’s body links to 3 to 6 recipes that use the winning ingredient. This 3-hop path (guide to recipe to SKU) pushes authority from a high-traffic informational query down to a high-intent transactional page. According to Search Engine Land SEO coverage, informational content that internally links to transactional pages produces 2 to 4 times higher organic revenue than isolated content silos.
Wrapping up content marketing for food brands
Content marketing for food brands is the organic engine that turns a DTC snack, drink, or CPG storefront into a search-driven revenue channel. Recipe hub of 40 to 100 recipes. Ingredient comparison guides at 12 to 24 pieces. Sourcing story pages at 6 to 12 pieces. Buyer intent content at 8 to 16 pieces. Creator syndication calendar with 12 to 30 creators per quarter. Refresh cadence at 12 to 24 months by pillar. Reporting with organic sessions and organic revenue attribution.
If your DTC food brand is running paid social at 20,000 dollars monthly with a broken blog and zero recipe schema, professional content marketing for food brands pays for itself inside the first 90 days on organic traffic captured. Redefine Web ships content marketing inside our monthly retainer packages. Book a call and we will walk through the last three DTC food brands we built recipe hubs for, pillar by pillar.
Anchor text on internal links varies across recipe hubs to avoid over-optimization patterns Google penalizes. Exact-match anchor (“single-origin Ethiopian coffee”) runs on 20 to 30 percent of internal links. Partial-match variations (“our Ethiopian roast”) run on 30 to 40 percent. Branded anchors (the SKU name) run on 20 to 30 percent. Generic anchors (“shop the coffee”) fill the remaining 10 to 20 percent. This ratio holds ranking without triggering the over-optimization penalty that shows up on brands that anchor-text-stuff every internal link with the same exact-match keyword. Cross-reference the linking layer on our food and beverage web design page.
Link equity from ingredient guides to SKU pages
Link equity from ingredient guides passes to SKU pages when the guide’s comparison table names the hero SKU in the winning column with a product card, and when the guide’s body links to 3 to 6 recipes that use the winning ingredient. This 3-hop path (guide to recipe to SKU) pushes authority from a high-traffic informational query down to a high-intent transactional page. According to Search Engine Land SEO coverage, informational content that internally links to transactional pages produces 2 to 4 times higher organic revenue than isolated content silos.
Wrapping up content marketing for food brands
Content marketing for food brands is the organic engine that turns a DTC snack, drink, or CPG storefront into a search-driven revenue channel. Recipe hub of 40 to 100 recipes. Ingredient comparison guides at 12 to 24 pieces. Sourcing story pages at 6 to 12 pieces. Buyer intent content at 8 to 16 pieces. Creator syndication calendar with 12 to 30 creators per quarter. Refresh cadence at 12 to 24 months by pillar. Reporting with organic sessions and organic revenue attribution.
If your DTC food brand is running paid social at 20,000 dollars monthly with a broken blog and zero recipe schema, professional content marketing for food brands pays for itself inside the first 90 days on organic traffic captured. Redefine Web ships content marketing inside our monthly retainer packages. Book a call and we will walk through the last three DTC food brands we built recipe hubs for, pillar by pillar.
Internal linking discipline across food brand content moves authority from recipe pages toward hero SKU product pages and comparison guides. Every recipe links to the hero SKU it uses inline (once in the ingredient list, once in a bottom call-out card). Every ingredient comparison guide links to 3 to 6 recipes using the winning ingredient plus the hero SKU product page. Every sourcing story links to the 2 to 4 SKUs sourced from that specific farm or cooperative.
Anchor text strategy across recipe hubs
Anchor text on internal links varies across recipe hubs to avoid over-optimization patterns Google penalizes. Exact-match anchor (“single-origin Ethiopian coffee”) runs on 20 to 30 percent of internal links. Partial-match variations (“our Ethiopian roast”) run on 30 to 40 percent. Branded anchors (the SKU name) run on 20 to 30 percent. Generic anchors (“shop the coffee”) fill the remaining 10 to 20 percent. This ratio holds ranking without triggering the over-optimization penalty that shows up on brands that anchor-text-stuff every internal link with the same exact-match keyword. Cross-reference the linking layer on our food and beverage web design page.
Link equity from ingredient guides to SKU pages
Link equity from ingredient guides passes to SKU pages when the guide’s comparison table names the hero SKU in the winning column with a product card, and when the guide’s body links to 3 to 6 recipes that use the winning ingredient. This 3-hop path (guide to recipe to SKU) pushes authority from a high-traffic informational query down to a high-intent transactional page. According to Search Engine Land SEO coverage, informational content that internally links to transactional pages produces 2 to 4 times higher organic revenue than isolated content silos.
Wrapping up content marketing for food brands
Content marketing for food brands is the organic engine that turns a DTC snack, drink, or CPG storefront into a search-driven revenue channel. Recipe hub of 40 to 100 recipes. Ingredient comparison guides at 12 to 24 pieces. Sourcing story pages at 6 to 12 pieces. Buyer intent content at 8 to 16 pieces. Creator syndication calendar with 12 to 30 creators per quarter. Refresh cadence at 12 to 24 months by pillar. Reporting with organic sessions and organic revenue attribution.
If your DTC food brand is running paid social at 20,000 dollars monthly with a broken blog and zero recipe schema, professional content marketing for food brands pays for itself inside the first 90 days on organic traffic captured. Redefine Web ships content marketing inside our monthly retainer packages. Book a call and we will walk through the last three DTC food brands we built recipe hubs for, pillar by pillar.
Content marketing for food brands starts with a recipe hub because recipe queries account for 40 to 60 percent of high-intent search volume in the food category. Every hero SKU needs 4 to 12 recipes anchored to it, each targeting a specific occasion and audience.
Skip the recipe hub and the brand loses the search real estate that pulls DTC storefront traffic month over month at zero incremental paid cost. Recipe traffic converts at 2 to 4 percent because the shopper landed with usage intent, not passive discovery, which is why food brands win on recipes.
Recipe schema and Google rich result eligibility
Every recipe page ships schema.org Recipe markup including cookTime, prepTime, recipeIngredient, recipeInstructions, nutrition, and aggregateRating. Correctly marked-up recipes qualify for Google’s recipe rich result carousel that pulls 3 to 6 times higher click-through rate than a plain blue link. The schema layer takes 15 minutes per recipe to author and 30 minutes to validate in Google Search Console. Cross-reference the recipe search stack on our food and beverage SEO page.
Recipe hub structure that scales
The recipe hub structure runs 40 to 100 recipes at maturity, organized by hero SKU (4 to 12 recipes per SKU) plus occasion tags (breakfast, weeknight dinner, meal prep, brunch, holiday). Every recipe links back to the hero SKU product page with the SKU embedded in an inline card. The hub earns internal linking value from ingredient comparison guides and the sourcing story pages, which feeds recipe ranking on Google. According to Google Search Central recipe structured data guidance, complete Recipe schema markup is required for eligibility in the recipe carousel and the ingredient search filter.
Pillar structure for food brand content marketing
The pillar structure on content marketing for food brands runs 4 content pillars concurrently: recipe hub (40 to 100 recipes), ingredient comparison guides (12 to 24 guides), sourcing story pages (6 to 12 pages), and buyer intent content (where to buy, subscription vs. one-time, gift bundle guides). Every pillar covers a distinct search intent and every pillar links back to the hero SKU product pages.
Ingredient comparison guide format
Ingredient comparison guides run 1,800 to 3,200 words comparing 2 to 4 ingredient types on 6 to 10 attributes with a comparison table, real-world use case examples, and links to the hero SKU that uses the specific ingredient. Example: organic vs. conventional oats compares nutritional profile, sourcing chain, cost, environmental impact, and taste on a 6-column table. The brand’s SKU appears in the winning column with a product card. These guides rank 3 to 8 months after publication and pull steady-state organic traffic.
Sourcing story pages that build trust
Sourcing story pages name the specific farms, cooperatives, or suppliers the brand sources from, with photos of the farms, farmer quotes, and specific harvest windows. A coffee brand’s Ethiopian farm page ranks for “single-origin Ethiopian coffee” and “Yirgacheffe coffee origin” plus 40 long-tail variations. The sourcing page pulls trust-building traffic that converts at 4 to 6 percent because the shopper landed pattern-matching on transparency and named provenance. Every sourcing page includes farmer or cooperative quotes, harvest dates, and a link back to 3 to 5 hero SKU pages that source from the named supplier.
Vejrø hospitality content case study
Vejrø Resort, a Danish private-island destination with an on-site restaurant focused on organic, locally sourced cuisine, joined us with strong social engagement and no organic-search real estate. Guests found the resort on Instagram but never in Google search for terms like “private island resort Denmark,” “farm-to-table hospitality Denmark,” or “Vejrø restaurant.” The same organic-search gap shows up on DTC food brands running paid social at 20,000 dollars monthly with a broken blog and zero recipe schema.
We built the conversion-focused website with on-site and off-site SEO tuned to the travel-niche keyword clusters, competitor analysis against comparable boutique resorts, and mobile-first design prioritizing guest discovery. Every page carried the structured data qualifying it for Google’s rich results in the hospitality category. Every internal link pushed authority toward the direct-booking conversion path.
Three months later, Vejrø hit 10,000 plus organic visitors, ranked for 200 plus first-page keywords, and pulled a 2.2 percent booking conversion rate from organic traffic. The same pattern applies to content marketing for food brands: recipe schema, ingredient comparison guides, and sourcing story pages pull organic traffic at 20 to 40 percent conversion into hero SKU pages inside 6 months when the content quality matches search intent and every page carries the right structured data markup. Vejrø also proved out the reporting discipline: every monthly report named the exact page, the exact keyword cluster, and the exact search feature (rich result, sitelinks, image pack) driving the incremental organic revenue instead of hiding behind aggregate traffic charts.
Recipe cadence and content calendar for food brands
Recipe cadence on a working food brand content calendar ships 2 to 4 new recipes per week during the first 6 months and drops to 1 per week at maturity. Each recipe takes 4 to 6 hours to produce (write, test in the kitchen, photograph, schema author, publish). At 3 recipes per week, the brand hits 78 recipes inside 6 months plus a backlog of ingredient comparison and sourcing content queued behind the recipe production line.
| Content pillar | Target volume year 1 | Production cost per piece | Refresh cadence |
|---|---|---|---|
| Recipe hub | 40 to 100 recipes | $180 to $320 | Every 12 months |
| Ingredient comparison guides | 12 to 24 guides | $450 to $780 | Every 18 months |
| Sourcing story pages | 6 to 12 pages | $680 to $1,200 | Every 24 months |
| Buyer intent content | 8 to 16 pieces | $220 to $420 | Every 12 months |
Photography as a content calendar constraint
Photography is the actual constraint on recipe cadence, not writing. Every recipe needs 6 to 12 photos: hero shot, ingredient flat lay, prep in progress, plated result, storage, and step shots for the schema markup. A working food brand batches photography 8 recipes at a time to keep the cost per recipe under 200 dollars. Skip the batching and the per-recipe cost climbs to 400 to 600 dollars, which caps recipe cadence at 1 per week and slows organic ranking timeline by 6 months.
Seasonal content calendar planning
Seasonal content calendar planning maps recipes and comparison guides to the seasonal windows they need to rank in. A Christmas cookie recipe needs to publish in September to rank by early December. A Valentine’s chocolate guide needs to publish in November to rank by early February. A back-to-school lunchbox recipe needs to publish in June to rank by late August. The 60-to-90-day ranking curve dictates the calendar.
Creator syndication inside food brand content
Creator syndication on food brand content marketing amplifies the recipe hub through Instagram Reels, TikTok, and YouTube Shorts creators paid to post their own version of the brand’s hero recipes. The creator content pulls net-new audiences into the recipe hub through the creator’s Link in Bio or Amazon Storefront tag. The syndication calendar names 12 to 30 creators per quarter with specific recipes assigned to each.
One brand we picked up had a spreadsheet titled “creator outreach 2023” with 47 rows and 3 responses. All 3 responses were auto-replies. The spreadsheet named zero recipes and offered flat rates below 100 dollars per post. Nobody posts a 30-second video for 87 dollars flat. Nobody.
Creator content commercial terms that work
Working creator content commercial terms run 350 to 1,500 dollars flat per post plus a 12 to 25 percent commission on tagged sales across a 30-day window. The commission mechanic pulls creators into follow-up posts because the incremental revenue continues past the initial fee. Mid-tier creators (30k to 150k followers) hit the sweet spot for food brand content because their engagement rate typically runs 4 to 8 percent versus 0.8 to 1.6 percent on mega-creators.
Content brief structure for creator partnerships
The content brief structure for creator partnerships runs a single page: the SKU, the specific recipe or usage occasion, 3 required brand mentions, 3 restricted claims (no health claims on non-medical SKUs), the pricing angle, the affiliate link, and 3 example videos that hit the tone. The brief avoids over-scripting because over-scripted creator content underperforms native creator voice by 40 to 60 percent on engagement rate.
Buyer intent content for food brand blogs
Buyer intent content on food brand blogs covers 8 to 16 pieces targeting explicit purchase-decision queries: “where to buy [brand],” “[brand] subscription vs. one-time,” “best [category] for [use case],” and “[brand] gift bundle.” Every buyer intent piece runs 1,400 to 2,400 words with a comparison table, product cards, and a clear conversion path to the specific SKU that matches the query intent. Buyer intent content converts at 3 to 6 percent versus 1 to 2 percent on recipe content because the shopper landed already planning to buy, not exploring a usage occasion.
Where-to-buy content structure
Where-to-buy content structure covers online (DTC storefront, Amazon, Target.com, Whole Foods online), retail (specific chain locators with the store finder embedded), and international (customs limitations, retailer partners abroad). Every piece names specific retailers, links to the store locator, and includes an FAQ block covering shipping availability, subscription options, and gift card compatibility. Where-to-buy content ranks for branded discovery queries the DTC storefront otherwise loses to competitor affiliate reviews.
Subscription versus one-time comparison content
Subscription versus one-time comparison content converts subscription commitments at 3 to 6 percent because it addresses the price-sensitivity concern head-on with a specific math table. The piece covers the discount structure (15 percent lifetime), the skip-a-month mechanic, the pause-anytime rule, the cancellation policy, and the specific yearly savings for the brand’s average consumption cadence. Cross-reference the retention structure on our food and beverage marketing retainer page.
Content refresh cadence on food brand pillars
Content refresh cadence on food brand content pillars runs a rolling audit every 12 to 24 months by pillar. Recipes get refreshed every 12 months with new photography, updated schema, and any nutrition or ingredient adjustments. Ingredient comparison guides refresh every 18 months to update market data. Sourcing story pages refresh every 24 months to reflect farm partnership changes and new harvest angles. Buyer intent content refreshes every 12 months to update retailer availability and pricing.
Recipe refresh priority order
Recipe refresh priority runs by organic traffic rank. The top 20 recipes by monthly organic sessions get refreshed first (new photography, schema audit, related recipe internal links, updated nutrition). The next 40 get refreshed at 15 months. The remaining recipes get refreshed opportunistically when the ranking slips past position 15 in Google. Skipping the refresh cadence lets recipe rankings drift out of the top 3 inside 18 months as newer competitor recipes take the position.
Schema audit checklist per refresh
The schema audit checklist per refresh runs 8 items: Recipe schema completeness, aggregateRating count and accuracy, nutrition data accuracy, prepTime and cookTime match the recipe body, image URLs valid at CDN, related recipe internal links working, product card SKU URL live, and Google Search Console rich result eligibility validated. This checklist takes 20 minutes per recipe and prevents the schema drift that costs recipe rankings 20 to 40 positions quietly.
Reporting cadence for food brand content marketing
Reporting cadence on food brand content marketing runs a monthly executive report plus a quarterly business review. The monthly report ships in the first business week and covers organic sessions by pillar, top 10 ranking recipes with position trend, ingredient guide ranking movements, sourcing page performance, and organic-attributed DTC revenue. Every number carries a comparison to the prior month and a plain-language interpretation the founder reads in 7 minutes.
Metrics that matter for content marketing
Metrics that matter for food brand content marketing: organic sessions by pillar, recipe rich result impressions in Search Console, organic conversion rate to hero SKU pages, organic-attributed DTC revenue, and top 20 ranking positions by monthly organic sessions. Vanity metrics that do not matter: total pageviews without conversion context, average time on page without conversion attribution, and social share counts. The monthly report skips the vanity block entirely.
Quarterly business review structure
The quarterly business review runs 90 minutes with the founder, head of content, and SEO lead. Agenda: organic traffic trend by pillar, top 10 winning content pieces, top 10 losing content pieces (candidates for refresh or removal), competitive gap analysis against 5 named competitor brands, and next quarter’s content calendar with recipes and ingredient guides queued. According to Ahrefs content marketing research, brands running quarterly content audits outperform brands running annual audits by 40 to 70 percent on organic revenue over a 24-month window.
Internal linking discipline across food brand content
Internal linking discipline across food brand content moves authority from recipe pages toward hero SKU product pages and comparison guides. Every recipe links to the hero SKU it uses inline (once in the ingredient list, once in a bottom call-out card). Every ingredient comparison guide links to 3 to 6 recipes using the winning ingredient plus the hero SKU product page. Every sourcing story links to the 2 to 4 SKUs sourced from that specific farm or cooperative.
Anchor text strategy across recipe hubs
Anchor text on internal links varies across recipe hubs to avoid over-optimization patterns Google penalizes. Exact-match anchor (“single-origin Ethiopian coffee”) runs on 20 to 30 percent of internal links. Partial-match variations (“our Ethiopian roast”) run on 30 to 40 percent. Branded anchors (the SKU name) run on 20 to 30 percent. Generic anchors (“shop the coffee”) fill the remaining 10 to 20 percent. This ratio holds ranking without triggering the over-optimization penalty that shows up on brands that anchor-text-stuff every internal link with the same exact-match keyword. Cross-reference the linking layer on our food and beverage web design page.
Link equity from ingredient guides to SKU pages
Link equity from ingredient guides passes to SKU pages when the guide’s comparison table names the hero SKU in the winning column with a product card, and when the guide’s body links to 3 to 6 recipes that use the winning ingredient. This 3-hop path (guide to recipe to SKU) pushes authority from a high-traffic informational query down to a high-intent transactional page. According to Search Engine Land SEO coverage, informational content that internally links to transactional pages produces 2 to 4 times higher organic revenue than isolated content silos.
Wrapping up content marketing for food brands
Content marketing for food brands is the organic engine that turns a DTC snack, drink, or CPG storefront into a search-driven revenue channel. Recipe hub of 40 to 100 recipes. Ingredient comparison guides at 12 to 24 pieces. Sourcing story pages at 6 to 12 pieces. Buyer intent content at 8 to 16 pieces. Creator syndication calendar with 12 to 30 creators per quarter. Refresh cadence at 12 to 24 months by pillar. Reporting with organic sessions and organic revenue attribution.
If your DTC food brand is running paid social at 20,000 dollars monthly with a broken blog and zero recipe schema, professional content marketing for food brands pays for itself inside the first 90 days on organic traffic captured. Redefine Web ships content marketing inside our monthly retainer packages. Book a call and we will walk through the last three DTC food brands we built recipe hubs for, pillar by pillar.
Content marketing for food brands starts with a recipe hub because recipe queries account for 40 to 60 percent of high-intent search volume in the food category. Every hero SKU needs 4 to 12 recipes anchored to it, each targeting a specific occasion and audience.
Skip the recipe hub and the brand loses the search real estate that pulls DTC storefront traffic month over month at zero incremental paid cost. Recipe traffic converts at 2 to 4 percent because the shopper landed with usage intent, not passive discovery, which is why food brands win on recipes.
Recipe schema and Google rich result eligibility
Every recipe page ships schema.org Recipe markup including cookTime, prepTime, recipeIngredient, recipeInstructions, nutrition, and aggregateRating. Correctly marked-up recipes qualify for Google’s recipe rich result carousel that pulls 3 to 6 times higher click-through rate than a plain blue link. The schema layer takes 15 minutes per recipe to author and 30 minutes to validate in Google Search Console. Cross-reference the recipe search stack on our food and beverage SEO page.
Recipe hub structure that scales
The recipe hub structure runs 40 to 100 recipes at maturity, organized by hero SKU (4 to 12 recipes per SKU) plus occasion tags (breakfast, weeknight dinner, meal prep, brunch, holiday). Every recipe links back to the hero SKU product page with the SKU embedded in an inline card. The hub earns internal linking value from ingredient comparison guides and the sourcing story pages, which feeds recipe ranking on Google. According to Google Search Central recipe structured data guidance, complete Recipe schema markup is required for eligibility in the recipe carousel and the ingredient search filter.
Pillar structure for food brand content marketing
The pillar structure on content marketing for food brands runs 4 content pillars concurrently: recipe hub (40 to 100 recipes), ingredient comparison guides (12 to 24 guides), sourcing story pages (6 to 12 pages), and buyer intent content (where to buy, subscription vs. one-time, gift bundle guides). Every pillar covers a distinct search intent and every pillar links back to the hero SKU product pages.
Ingredient comparison guide format
Ingredient comparison guides run 1,800 to 3,200 words comparing 2 to 4 ingredient types on 6 to 10 attributes with a comparison table, real-world use case examples, and links to the hero SKU that uses the specific ingredient. Example: organic vs. conventional oats compares nutritional profile, sourcing chain, cost, environmental impact, and taste on a 6-column table. The brand’s SKU appears in the winning column with a product card. These guides rank 3 to 8 months after publication and pull steady-state organic traffic.
Sourcing story pages that build trust
Sourcing story pages name the specific farms, cooperatives, or suppliers the brand sources from, with photos of the farms, farmer quotes, and specific harvest windows. A coffee brand’s Ethiopian farm page ranks for “single-origin Ethiopian coffee” and “Yirgacheffe coffee origin” plus 40 long-tail variations. The sourcing page pulls trust-building traffic that converts at 4 to 6 percent because the shopper landed pattern-matching on transparency and named provenance. Every sourcing page includes farmer or cooperative quotes, harvest dates, and a link back to 3 to 5 hero SKU pages that source from the named supplier.
Vejrø hospitality content case study
Vejrø Resort, a Danish private-island destination with an on-site restaurant focused on organic, locally sourced cuisine, joined us with strong social engagement and no organic-search real estate. Guests found the resort on Instagram but never in Google search for terms like “private island resort Denmark,” “farm-to-table hospitality Denmark,” or “Vejrø restaurant.” The same organic-search gap shows up on DTC food brands running paid social at 20,000 dollars monthly with a broken blog and zero recipe schema.
We built the conversion-focused website with on-site and off-site SEO tuned to the travel-niche keyword clusters, competitor analysis against comparable boutique resorts, and mobile-first design prioritizing guest discovery. Every page carried the structured data qualifying it for Google’s rich results in the hospitality category. Every internal link pushed authority toward the direct-booking conversion path.
Three months later, Vejrø hit 10,000 plus organic visitors, ranked for 200 plus first-page keywords, and pulled a 2.2 percent booking conversion rate from organic traffic. The same pattern applies to content marketing for food brands: recipe schema, ingredient comparison guides, and sourcing story pages pull organic traffic at 20 to 40 percent conversion into hero SKU pages inside 6 months when the content quality matches search intent and every page carries the right structured data markup. Vejrø also proved out the reporting discipline: every monthly report named the exact page, the exact keyword cluster, and the exact search feature (rich result, sitelinks, image pack) driving the incremental organic revenue instead of hiding behind aggregate traffic charts.
Recipe cadence and content calendar for food brands
Recipe cadence on a working food brand content calendar ships 2 to 4 new recipes per week during the first 6 months and drops to 1 per week at maturity. Each recipe takes 4 to 6 hours to produce (write, test in the kitchen, photograph, schema author, publish). At 3 recipes per week, the brand hits 78 recipes inside 6 months plus a backlog of ingredient comparison and sourcing content queued behind the recipe production line.
| Content pillar | Target volume year 1 | Production cost per piece | Refresh cadence |
|---|---|---|---|
| Recipe hub | 40 to 100 recipes | $180 to $320 | Every 12 months |
| Ingredient comparison guides | 12 to 24 guides | $450 to $780 | Every 18 months |
| Sourcing story pages | 6 to 12 pages | $680 to $1,200 | Every 24 months |
| Buyer intent content | 8 to 16 pieces | $220 to $420 | Every 12 months |
Photography as a content calendar constraint
Photography is the actual constraint on recipe cadence, not writing. Every recipe needs 6 to 12 photos: hero shot, ingredient flat lay, prep in progress, plated result, storage, and step shots for the schema markup. A working food brand batches photography 8 recipes at a time to keep the cost per recipe under 200 dollars. Skip the batching and the per-recipe cost climbs to 400 to 600 dollars, which caps recipe cadence at 1 per week and slows organic ranking timeline by 6 months.
Seasonal content calendar planning
Seasonal content calendar planning maps recipes and comparison guides to the seasonal windows they need to rank in. A Christmas cookie recipe needs to publish in September to rank by early December. A Valentine’s chocolate guide needs to publish in November to rank by early February. A back-to-school lunchbox recipe needs to publish in June to rank by late August. The 60-to-90-day ranking curve dictates the calendar.
Creator syndication inside food brand content
Creator syndication on food brand content marketing amplifies the recipe hub through Instagram Reels, TikTok, and YouTube Shorts creators paid to post their own version of the brand’s hero recipes. The creator content pulls net-new audiences into the recipe hub through the creator’s Link in Bio or Amazon Storefront tag. The syndication calendar names 12 to 30 creators per quarter with specific recipes assigned to each.
One brand we picked up had a spreadsheet titled “creator outreach 2023” with 47 rows and 3 responses. All 3 responses were auto-replies. The spreadsheet named zero recipes and offered flat rates below 100 dollars per post. Nobody posts a 30-second video for 87 dollars flat. Nobody.
Creator content commercial terms that work
Working creator content commercial terms run 350 to 1,500 dollars flat per post plus a 12 to 25 percent commission on tagged sales across a 30-day window. The commission mechanic pulls creators into follow-up posts because the incremental revenue continues past the initial fee. Mid-tier creators (30k to 150k followers) hit the sweet spot for food brand content because their engagement rate typically runs 4 to 8 percent versus 0.8 to 1.6 percent on mega-creators.
Content brief structure for creator partnerships
The content brief structure for creator partnerships runs a single page: the SKU, the specific recipe or usage occasion, 3 required brand mentions, 3 restricted claims (no health claims on non-medical SKUs), the pricing angle, the affiliate link, and 3 example videos that hit the tone. The brief avoids over-scripting because over-scripted creator content underperforms native creator voice by 40 to 60 percent on engagement rate.
Buyer intent content for food brand blogs
Buyer intent content on food brand blogs covers 8 to 16 pieces targeting explicit purchase-decision queries: “where to buy [brand],” “[brand] subscription vs. one-time,” “best [category] for [use case],” and “[brand] gift bundle.” Every buyer intent piece runs 1,400 to 2,400 words with a comparison table, product cards, and a clear conversion path to the specific SKU that matches the query intent. Buyer intent content converts at 3 to 6 percent versus 1 to 2 percent on recipe content because the shopper landed already planning to buy, not exploring a usage occasion.
Where-to-buy content structure
Where-to-buy content structure covers online (DTC storefront, Amazon, Target.com, Whole Foods online), retail (specific chain locators with the store finder embedded), and international (customs limitations, retailer partners abroad). Every piece names specific retailers, links to the store locator, and includes an FAQ block covering shipping availability, subscription options, and gift card compatibility. Where-to-buy content ranks for branded discovery queries the DTC storefront otherwise loses to competitor affiliate reviews.
Subscription versus one-time comparison content
Subscription versus one-time comparison content converts subscription commitments at 3 to 6 percent because it addresses the price-sensitivity concern head-on with a specific math table. The piece covers the discount structure (15 percent lifetime), the skip-a-month mechanic, the pause-anytime rule, the cancellation policy, and the specific yearly savings for the brand’s average consumption cadence. Cross-reference the retention structure on our food and beverage marketing retainer page.
Content refresh cadence on food brand pillars
Content refresh cadence on food brand content pillars runs a rolling audit every 12 to 24 months by pillar. Recipes get refreshed every 12 months with new photography, updated schema, and any nutrition or ingredient adjustments. Ingredient comparison guides refresh every 18 months to update market data. Sourcing story pages refresh every 24 months to reflect farm partnership changes and new harvest angles. Buyer intent content refreshes every 12 months to update retailer availability and pricing.
Recipe refresh priority order
Recipe refresh priority runs by organic traffic rank. The top 20 recipes by monthly organic sessions get refreshed first (new photography, schema audit, related recipe internal links, updated nutrition). The next 40 get refreshed at 15 months. The remaining recipes get refreshed opportunistically when the ranking slips past position 15 in Google. Skipping the refresh cadence lets recipe rankings drift out of the top 3 inside 18 months as newer competitor recipes take the position.
Schema audit checklist per refresh
The schema audit checklist per refresh runs 8 items: Recipe schema completeness, aggregateRating count and accuracy, nutrition data accuracy, prepTime and cookTime match the recipe body, image URLs valid at CDN, related recipe internal links working, product card SKU URL live, and Google Search Console rich result eligibility validated. This checklist takes 20 minutes per recipe and prevents the schema drift that costs recipe rankings 20 to 40 positions quietly.
Reporting cadence for food brand content marketing
Reporting cadence on food brand content marketing runs a monthly executive report plus a quarterly business review. The monthly report ships in the first business week and covers organic sessions by pillar, top 10 ranking recipes with position trend, ingredient guide ranking movements, sourcing page performance, and organic-attributed DTC revenue. Every number carries a comparison to the prior month and a plain-language interpretation the founder reads in 7 minutes.
Metrics that matter for content marketing
Metrics that matter for food brand content marketing: organic sessions by pillar, recipe rich result impressions in Search Console, organic conversion rate to hero SKU pages, organic-attributed DTC revenue, and top 20 ranking positions by monthly organic sessions. Vanity metrics that do not matter: total pageviews without conversion context, average time on page without conversion attribution, and social share counts. The monthly report skips the vanity block entirely.
Quarterly business review structure
The quarterly business review runs 90 minutes with the founder, head of content, and SEO lead. Agenda: organic traffic trend by pillar, top 10 winning content pieces, top 10 losing content pieces (candidates for refresh or removal), competitive gap analysis against 5 named competitor brands, and next quarter’s content calendar with recipes and ingredient guides queued. According to Ahrefs content marketing research, brands running quarterly content audits outperform brands running annual audits by 40 to 70 percent on organic revenue over a 24-month window.
Internal linking discipline across food brand content
Internal linking discipline across food brand content moves authority from recipe pages toward hero SKU product pages and comparison guides. Every recipe links to the hero SKU it uses inline (once in the ingredient list, once in a bottom call-out card). Every ingredient comparison guide links to 3 to 6 recipes using the winning ingredient plus the hero SKU product page. Every sourcing story links to the 2 to 4 SKUs sourced from that specific farm or cooperative.
Anchor text strategy across recipe hubs
Anchor text on internal links varies across recipe hubs to avoid over-optimization patterns Google penalizes. Exact-match anchor (“single-origin Ethiopian coffee”) runs on 20 to 30 percent of internal links. Partial-match variations (“our Ethiopian roast”) run on 30 to 40 percent. Branded anchors (the SKU name) run on 20 to 30 percent. Generic anchors (“shop the coffee”) fill the remaining 10 to 20 percent. This ratio holds ranking without triggering the over-optimization penalty that shows up on brands that anchor-text-stuff every internal link with the same exact-match keyword. Cross-reference the linking layer on our food and beverage web design page.
Link equity from ingredient guides to SKU pages
Link equity from ingredient guides passes to SKU pages when the guide’s comparison table names the hero SKU in the winning column with a product card, and when the guide’s body links to 3 to 6 recipes that use the winning ingredient. This 3-hop path (guide to recipe to SKU) pushes authority from a high-traffic informational query down to a high-intent transactional page. According to Search Engine Land SEO coverage, informational content that internally links to transactional pages produces 2 to 4 times higher organic revenue than isolated content silos.
Wrapping up content marketing for food brands
Content marketing for food brands is the organic engine that turns a DTC snack, drink, or CPG storefront into a search-driven revenue channel. Recipe hub of 40 to 100 recipes. Ingredient comparison guides at 12 to 24 pieces. Sourcing story pages at 6 to 12 pieces. Buyer intent content at 8 to 16 pieces. Creator syndication calendar with 12 to 30 creators per quarter. Refresh cadence at 12 to 24 months by pillar. Reporting with organic sessions and organic revenue attribution.
If your DTC food brand is running paid social at 20,000 dollars monthly with a broken blog and zero recipe schema, professional content marketing for food brands pays for itself inside the first 90 days on organic traffic captured. Redefine Web ships content marketing inside our monthly retainer packages. Book a call and we will walk through the last three DTC food brands we built recipe hubs for, pillar by pillar.
Anchor text on internal links varies across recipe hubs to avoid over-optimization patterns Google penalizes. Exact-match anchor (“single-origin Ethiopian coffee”) runs on 20 to 30 percent of internal links. Partial-match variations (“our Ethiopian roast”) run on 30 to 40 percent. Branded anchors (the SKU name) run on 20 to 30 percent. Generic anchors (“shop the coffee”) fill the remaining 10 to 20 percent. This ratio holds ranking without triggering the over-optimization penalty that shows up on brands that anchor-text-stuff every internal link with the same exact-match keyword. Cross-reference the linking layer on our food and beverage web design page.
Link equity from ingredient guides to SKU pages
Link equity from ingredient guides passes to SKU pages when the guide’s comparison table names the hero SKU in the winning column with a product card, and when the guide’s body links to 3 to 6 recipes that use the winning ingredient. This 3-hop path (guide to recipe to SKU) pushes authority from a high-traffic informational query down to a high-intent transactional page. According to Search Engine Land SEO coverage, informational content that internally links to transactional pages produces 2 to 4 times higher organic revenue than isolated content silos.
Wrapping up content marketing for food brands
Content marketing for food brands is the organic engine that turns a DTC snack, drink, or CPG storefront into a search-driven revenue channel. Recipe hub of 40 to 100 recipes. Ingredient comparison guides at 12 to 24 pieces. Sourcing story pages at 6 to 12 pieces. Buyer intent content at 8 to 16 pieces. Creator syndication calendar with 12 to 30 creators per quarter. Refresh cadence at 12 to 24 months by pillar. Reporting with organic sessions and organic revenue attribution.
If your DTC food brand is running paid social at 20,000 dollars monthly with a broken blog and zero recipe schema, professional content marketing for food brands pays for itself inside the first 90 days on organic traffic captured. Redefine Web ships content marketing inside our monthly retainer packages. Book a call and we will walk through the last three DTC food brands we built recipe hubs for, pillar by pillar.
Content marketing for food brands starts with a recipe hub because recipe queries account for 40 to 60 percent of high-intent search volume in the food category. Every hero SKU needs 4 to 12 recipes anchored to it, each targeting a specific occasion and audience.
Skip the recipe hub and the brand loses the search real estate that pulls DTC storefront traffic month over month at zero incremental paid cost. Recipe traffic converts at 2 to 4 percent because the shopper landed with usage intent, not passive discovery, which is why food brands win on recipes.
Recipe schema and Google rich result eligibility
Every recipe page ships schema.org Recipe markup including cookTime, prepTime, recipeIngredient, recipeInstructions, nutrition, and aggregateRating. Correctly marked-up recipes qualify for Google’s recipe rich result carousel that pulls 3 to 6 times higher click-through rate than a plain blue link. The schema layer takes 15 minutes per recipe to author and 30 minutes to validate in Google Search Console. Cross-reference the recipe search stack on our food and beverage SEO page.
Recipe hub structure that scales
The recipe hub structure runs 40 to 100 recipes at maturity, organized by hero SKU (4 to 12 recipes per SKU) plus occasion tags (breakfast, weeknight dinner, meal prep, brunch, holiday). Every recipe links back to the hero SKU product page with the SKU embedded in an inline card. The hub earns internal linking value from ingredient comparison guides and the sourcing story pages, which feeds recipe ranking on Google. According to Google Search Central recipe structured data guidance, complete Recipe schema markup is required for eligibility in the recipe carousel and the ingredient search filter.
Pillar structure for food brand content marketing
The pillar structure on content marketing for food brands runs 4 content pillars concurrently: recipe hub (40 to 100 recipes), ingredient comparison guides (12 to 24 guides), sourcing story pages (6 to 12 pages), and buyer intent content (where to buy, subscription vs. one-time, gift bundle guides). Every pillar covers a distinct search intent and every pillar links back to the hero SKU product pages.
Ingredient comparison guide format
Ingredient comparison guides run 1,800 to 3,200 words comparing 2 to 4 ingredient types on 6 to 10 attributes with a comparison table, real-world use case examples, and links to the hero SKU that uses the specific ingredient. Example: organic vs. conventional oats compares nutritional profile, sourcing chain, cost, environmental impact, and taste on a 6-column table. The brand’s SKU appears in the winning column with a product card. These guides rank 3 to 8 months after publication and pull steady-state organic traffic.
Sourcing story pages that build trust
Sourcing story pages name the specific farms, cooperatives, or suppliers the brand sources from, with photos of the farms, farmer quotes, and specific harvest windows. A coffee brand’s Ethiopian farm page ranks for “single-origin Ethiopian coffee” and “Yirgacheffe coffee origin” plus 40 long-tail variations. The sourcing page pulls trust-building traffic that converts at 4 to 6 percent because the shopper landed pattern-matching on transparency and named provenance. Every sourcing page includes farmer or cooperative quotes, harvest dates, and a link back to 3 to 5 hero SKU pages that source from the named supplier.
Vejrø hospitality content case study
Vejrø Resort, a Danish private-island destination with an on-site restaurant focused on organic, locally sourced cuisine, joined us with strong social engagement and no organic-search real estate. Guests found the resort on Instagram but never in Google search for terms like “private island resort Denmark,” “farm-to-table hospitality Denmark,” or “Vejrø restaurant.” The same organic-search gap shows up on DTC food brands running paid social at 20,000 dollars monthly with a broken blog and zero recipe schema.
We built the conversion-focused website with on-site and off-site SEO tuned to the travel-niche keyword clusters, competitor analysis against comparable boutique resorts, and mobile-first design prioritizing guest discovery. Every page carried the structured data qualifying it for Google’s rich results in the hospitality category. Every internal link pushed authority toward the direct-booking conversion path.
Three months later, Vejrø hit 10,000 plus organic visitors, ranked for 200 plus first-page keywords, and pulled a 2.2 percent booking conversion rate from organic traffic. The same pattern applies to content marketing for food brands: recipe schema, ingredient comparison guides, and sourcing story pages pull organic traffic at 20 to 40 percent conversion into hero SKU pages inside 6 months when the content quality matches search intent and every page carries the right structured data markup. Vejrø also proved out the reporting discipline: every monthly report named the exact page, the exact keyword cluster, and the exact search feature (rich result, sitelinks, image pack) driving the incremental organic revenue instead of hiding behind aggregate traffic charts.
Recipe cadence and content calendar for food brands
Recipe cadence on a working food brand content calendar ships 2 to 4 new recipes per week during the first 6 months and drops to 1 per week at maturity. Each recipe takes 4 to 6 hours to produce (write, test in the kitchen, photograph, schema author, publish). At 3 recipes per week, the brand hits 78 recipes inside 6 months plus a backlog of ingredient comparison and sourcing content queued behind the recipe production line.
| Content pillar | Target volume year 1 | Production cost per piece | Refresh cadence |
|---|---|---|---|
| Recipe hub | 40 to 100 recipes | $180 to $320 | Every 12 months |
| Ingredient comparison guides | 12 to 24 guides | $450 to $780 | Every 18 months |
| Sourcing story pages | 6 to 12 pages | $680 to $1,200 | Every 24 months |
| Buyer intent content | 8 to 16 pieces | $220 to $420 | Every 12 months |
Photography as a content calendar constraint
Photography is the actual constraint on recipe cadence, not writing. Every recipe needs 6 to 12 photos: hero shot, ingredient flat lay, prep in progress, plated result, storage, and step shots for the schema markup. A working food brand batches photography 8 recipes at a time to keep the cost per recipe under 200 dollars. Skip the batching and the per-recipe cost climbs to 400 to 600 dollars, which caps recipe cadence at 1 per week and slows organic ranking timeline by 6 months.
Seasonal content calendar planning
Seasonal content calendar planning maps recipes and comparison guides to the seasonal windows they need to rank in. A Christmas cookie recipe needs to publish in September to rank by early December. A Valentine’s chocolate guide needs to publish in November to rank by early February. A back-to-school lunchbox recipe needs to publish in June to rank by late August. The 60-to-90-day ranking curve dictates the calendar.
Creator syndication inside food brand content
Creator syndication on food brand content marketing amplifies the recipe hub through Instagram Reels, TikTok, and YouTube Shorts creators paid to post their own version of the brand’s hero recipes. The creator content pulls net-new audiences into the recipe hub through the creator’s Link in Bio or Amazon Storefront tag. The syndication calendar names 12 to 30 creators per quarter with specific recipes assigned to each.
One brand we picked up had a spreadsheet titled “creator outreach 2023” with 47 rows and 3 responses. All 3 responses were auto-replies. The spreadsheet named zero recipes and offered flat rates below 100 dollars per post. Nobody posts a 30-second video for 87 dollars flat. Nobody.
Creator content commercial terms that work
Working creator content commercial terms run 350 to 1,500 dollars flat per post plus a 12 to 25 percent commission on tagged sales across a 30-day window. The commission mechanic pulls creators into follow-up posts because the incremental revenue continues past the initial fee. Mid-tier creators (30k to 150k followers) hit the sweet spot for food brand content because their engagement rate typically runs 4 to 8 percent versus 0.8 to 1.6 percent on mega-creators.
Content brief structure for creator partnerships
The content brief structure for creator partnerships runs a single page: the SKU, the specific recipe or usage occasion, 3 required brand mentions, 3 restricted claims (no health claims on non-medical SKUs), the pricing angle, the affiliate link, and 3 example videos that hit the tone. The brief avoids over-scripting because over-scripted creator content underperforms native creator voice by 40 to 60 percent on engagement rate.
Buyer intent content for food brand blogs
Buyer intent content on food brand blogs covers 8 to 16 pieces targeting explicit purchase-decision queries: “where to buy [brand],” “[brand] subscription vs. one-time,” “best [category] for [use case],” and “[brand] gift bundle.” Every buyer intent piece runs 1,400 to 2,400 words with a comparison table, product cards, and a clear conversion path to the specific SKU that matches the query intent. Buyer intent content converts at 3 to 6 percent versus 1 to 2 percent on recipe content because the shopper landed already planning to buy, not exploring a usage occasion.
Where-to-buy content structure
Where-to-buy content structure covers online (DTC storefront, Amazon, Target.com, Whole Foods online), retail (specific chain locators with the store finder embedded), and international (customs limitations, retailer partners abroad). Every piece names specific retailers, links to the store locator, and includes an FAQ block covering shipping availability, subscription options, and gift card compatibility. Where-to-buy content ranks for branded discovery queries the DTC storefront otherwise loses to competitor affiliate reviews.
Subscription versus one-time comparison content
Subscription versus one-time comparison content converts subscription commitments at 3 to 6 percent because it addresses the price-sensitivity concern head-on with a specific math table. The piece covers the discount structure (15 percent lifetime), the skip-a-month mechanic, the pause-anytime rule, the cancellation policy, and the specific yearly savings for the brand’s average consumption cadence. Cross-reference the retention structure on our food and beverage marketing retainer page.
Content refresh cadence on food brand pillars
Content refresh cadence on food brand content pillars runs a rolling audit every 12 to 24 months by pillar. Recipes get refreshed every 12 months with new photography, updated schema, and any nutrition or ingredient adjustments. Ingredient comparison guides refresh every 18 months to update market data. Sourcing story pages refresh every 24 months to reflect farm partnership changes and new harvest angles. Buyer intent content refreshes every 12 months to update retailer availability and pricing.
Recipe refresh priority order
Recipe refresh priority runs by organic traffic rank. The top 20 recipes by monthly organic sessions get refreshed first (new photography, schema audit, related recipe internal links, updated nutrition). The next 40 get refreshed at 15 months. The remaining recipes get refreshed opportunistically when the ranking slips past position 15 in Google. Skipping the refresh cadence lets recipe rankings drift out of the top 3 inside 18 months as newer competitor recipes take the position.
Schema audit checklist per refresh
The schema audit checklist per refresh runs 8 items: Recipe schema completeness, aggregateRating count and accuracy, nutrition data accuracy, prepTime and cookTime match the recipe body, image URLs valid at CDN, related recipe internal links working, product card SKU URL live, and Google Search Console rich result eligibility validated. This checklist takes 20 minutes per recipe and prevents the schema drift that costs recipe rankings 20 to 40 positions quietly.
Reporting cadence for food brand content marketing
Reporting cadence on food brand content marketing runs a monthly executive report plus a quarterly business review. The monthly report ships in the first business week and covers organic sessions by pillar, top 10 ranking recipes with position trend, ingredient guide ranking movements, sourcing page performance, and organic-attributed DTC revenue. Every number carries a comparison to the prior month and a plain-language interpretation the founder reads in 7 minutes.
Metrics that matter for content marketing
Metrics that matter for food brand content marketing: organic sessions by pillar, recipe rich result impressions in Search Console, organic conversion rate to hero SKU pages, organic-attributed DTC revenue, and top 20 ranking positions by monthly organic sessions. Vanity metrics that do not matter: total pageviews without conversion context, average time on page without conversion attribution, and social share counts. The monthly report skips the vanity block entirely.
Quarterly business review structure
The quarterly business review runs 90 minutes with the founder, head of content, and SEO lead. Agenda: organic traffic trend by pillar, top 10 winning content pieces, top 10 losing content pieces (candidates for refresh or removal), competitive gap analysis against 5 named competitor brands, and next quarter’s content calendar with recipes and ingredient guides queued. According to Ahrefs content marketing research, brands running quarterly content audits outperform brands running annual audits by 40 to 70 percent on organic revenue over a 24-month window.
Internal linking discipline across food brand content
Internal linking discipline across food brand content moves authority from recipe pages toward hero SKU product pages and comparison guides. Every recipe links to the hero SKU it uses inline (once in the ingredient list, once in a bottom call-out card). Every ingredient comparison guide links to 3 to 6 recipes using the winning ingredient plus the hero SKU product page. Every sourcing story links to the 2 to 4 SKUs sourced from that specific farm or cooperative.
Anchor text strategy across recipe hubs
Anchor text on internal links varies across recipe hubs to avoid over-optimization patterns Google penalizes. Exact-match anchor (“single-origin Ethiopian coffee”) runs on 20 to 30 percent of internal links. Partial-match variations (“our Ethiopian roast”) run on 30 to 40 percent. Branded anchors (the SKU name) run on 20 to 30 percent. Generic anchors (“shop the coffee”) fill the remaining 10 to 20 percent. This ratio holds ranking without triggering the over-optimization penalty that shows up on brands that anchor-text-stuff every internal link with the same exact-match keyword. Cross-reference the linking layer on our food and beverage web design page.
Link equity from ingredient guides to SKU pages
Link equity from ingredient guides passes to SKU pages when the guide’s comparison table names the hero SKU in the winning column with a product card, and when the guide’s body links to 3 to 6 recipes that use the winning ingredient. This 3-hop path (guide to recipe to SKU) pushes authority from a high-traffic informational query down to a high-intent transactional page. According to Search Engine Land SEO coverage, informational content that internally links to transactional pages produces 2 to 4 times higher organic revenue than isolated content silos.
Wrapping up content marketing for food brands
Content marketing for food brands is the organic engine that turns a DTC snack, drink, or CPG storefront into a search-driven revenue channel. Recipe hub of 40 to 100 recipes. Ingredient comparison guides at 12 to 24 pieces. Sourcing story pages at 6 to 12 pieces. Buyer intent content at 8 to 16 pieces. Creator syndication calendar with 12 to 30 creators per quarter. Refresh cadence at 12 to 24 months by pillar. Reporting with organic sessions and organic revenue attribution.
If your DTC food brand is running paid social at 20,000 dollars monthly with a broken blog and zero recipe schema, professional content marketing for food brands pays for itself inside the first 90 days on organic traffic captured. Redefine Web ships content marketing inside our monthly retainer packages. Book a call and we will walk through the last three DTC food brands we built recipe hubs for, pillar by pillar.
Internal linking discipline across food brand content moves authority from recipe pages toward hero SKU product pages and comparison guides. Every recipe links to the hero SKU it uses inline (once in the ingredient list, once in a bottom call-out card). Every ingredient comparison guide links to 3 to 6 recipes using the winning ingredient plus the hero SKU product page. Every sourcing story links to the 2 to 4 SKUs sourced from that specific farm or cooperative.
Anchor text strategy across recipe hubs
Anchor text on internal links varies across recipe hubs to avoid over-optimization patterns Google penalizes. Exact-match anchor (“single-origin Ethiopian coffee”) runs on 20 to 30 percent of internal links. Partial-match variations (“our Ethiopian roast”) run on 30 to 40 percent. Branded anchors (the SKU name) run on 20 to 30 percent. Generic anchors (“shop the coffee”) fill the remaining 10 to 20 percent. This ratio holds ranking without triggering the over-optimization penalty that shows up on brands that anchor-text-stuff every internal link with the same exact-match keyword. Cross-reference the linking layer on our food and beverage web design page.
Link equity from ingredient guides to SKU pages
Link equity from ingredient guides passes to SKU pages when the guide’s comparison table names the hero SKU in the winning column with a product card, and when the guide’s body links to 3 to 6 recipes that use the winning ingredient. This 3-hop path (guide to recipe to SKU) pushes authority from a high-traffic informational query down to a high-intent transactional page. According to Search Engine Land SEO coverage, informational content that internally links to transactional pages produces 2 to 4 times higher organic revenue than isolated content silos.
Wrapping up content marketing for food brands
Content marketing for food brands is the organic engine that turns a DTC snack, drink, or CPG storefront into a search-driven revenue channel. Recipe hub of 40 to 100 recipes. Ingredient comparison guides at 12 to 24 pieces. Sourcing story pages at 6 to 12 pieces. Buyer intent content at 8 to 16 pieces. Creator syndication calendar with 12 to 30 creators per quarter. Refresh cadence at 12 to 24 months by pillar. Reporting with organic sessions and organic revenue attribution.
If your DTC food brand is running paid social at 20,000 dollars monthly with a broken blog and zero recipe schema, professional content marketing for food brands pays for itself inside the first 90 days on organic traffic captured. Redefine Web ships content marketing inside our monthly retainer packages. Book a call and we will walk through the last three DTC food brands we built recipe hubs for, pillar by pillar.
Content marketing for food brands starts with a recipe hub because recipe queries account for 40 to 60 percent of high-intent search volume in the food category. Every hero SKU needs 4 to 12 recipes anchored to it, each targeting a specific occasion and audience.
Skip the recipe hub and the brand loses the search real estate that pulls DTC storefront traffic month over month at zero incremental paid cost. Recipe traffic converts at 2 to 4 percent because the shopper landed with usage intent, not passive discovery, which is why food brands win on recipes.
Recipe schema and Google rich result eligibility
Every recipe page ships schema.org Recipe markup including cookTime, prepTime, recipeIngredient, recipeInstructions, nutrition, and aggregateRating. Correctly marked-up recipes qualify for Google’s recipe rich result carousel that pulls 3 to 6 times higher click-through rate than a plain blue link. The schema layer takes 15 minutes per recipe to author and 30 minutes to validate in Google Search Console. Cross-reference the recipe search stack on our food and beverage SEO page.
Recipe hub structure that scales
The recipe hub structure runs 40 to 100 recipes at maturity, organized by hero SKU (4 to 12 recipes per SKU) plus occasion tags (breakfast, weeknight dinner, meal prep, brunch, holiday). Every recipe links back to the hero SKU product page with the SKU embedded in an inline card. The hub earns internal linking value from ingredient comparison guides and the sourcing story pages, which feeds recipe ranking on Google. According to Google Search Central recipe structured data guidance, complete Recipe schema markup is required for eligibility in the recipe carousel and the ingredient search filter.
Pillar structure for food brand content marketing
The pillar structure on content marketing for food brands runs 4 content pillars concurrently: recipe hub (40 to 100 recipes), ingredient comparison guides (12 to 24 guides), sourcing story pages (6 to 12 pages), and buyer intent content (where to buy, subscription vs. one-time, gift bundle guides). Every pillar covers a distinct search intent and every pillar links back to the hero SKU product pages.
Ingredient comparison guide format
Ingredient comparison guides run 1,800 to 3,200 words comparing 2 to 4 ingredient types on 6 to 10 attributes with a comparison table, real-world use case examples, and links to the hero SKU that uses the specific ingredient. Example: organic vs. conventional oats compares nutritional profile, sourcing chain, cost, environmental impact, and taste on a 6-column table. The brand’s SKU appears in the winning column with a product card. These guides rank 3 to 8 months after publication and pull steady-state organic traffic.
Sourcing story pages that build trust
Sourcing story pages name the specific farms, cooperatives, or suppliers the brand sources from, with photos of the farms, farmer quotes, and specific harvest windows. A coffee brand’s Ethiopian farm page ranks for “single-origin Ethiopian coffee” and “Yirgacheffe coffee origin” plus 40 long-tail variations. The sourcing page pulls trust-building traffic that converts at 4 to 6 percent because the shopper landed pattern-matching on transparency and named provenance. Every sourcing page includes farmer or cooperative quotes, harvest dates, and a link back to 3 to 5 hero SKU pages that source from the named supplier.
Vejrø hospitality content case study
Vejrø Resort, a Danish private-island destination with an on-site restaurant focused on organic, locally sourced cuisine, joined us with strong social engagement and no organic-search real estate. Guests found the resort on Instagram but never in Google search for terms like “private island resort Denmark,” “farm-to-table hospitality Denmark,” or “Vejrø restaurant.” The same organic-search gap shows up on DTC food brands running paid social at 20,000 dollars monthly with a broken blog and zero recipe schema.
We built the conversion-focused website with on-site and off-site SEO tuned to the travel-niche keyword clusters, competitor analysis against comparable boutique resorts, and mobile-first design prioritizing guest discovery. Every page carried the structured data qualifying it for Google’s rich results in the hospitality category. Every internal link pushed authority toward the direct-booking conversion path.
Three months later, Vejrø hit 10,000 plus organic visitors, ranked for 200 plus first-page keywords, and pulled a 2.2 percent booking conversion rate from organic traffic. The same pattern applies to content marketing for food brands: recipe schema, ingredient comparison guides, and sourcing story pages pull organic traffic at 20 to 40 percent conversion into hero SKU pages inside 6 months when the content quality matches search intent and every page carries the right structured data markup. Vejrø also proved out the reporting discipline: every monthly report named the exact page, the exact keyword cluster, and the exact search feature (rich result, sitelinks, image pack) driving the incremental organic revenue instead of hiding behind aggregate traffic charts.
Recipe cadence and content calendar for food brands
Recipe cadence on a working food brand content calendar ships 2 to 4 new recipes per week during the first 6 months and drops to 1 per week at maturity. Each recipe takes 4 to 6 hours to produce (write, test in the kitchen, photograph, schema author, publish). At 3 recipes per week, the brand hits 78 recipes inside 6 months plus a backlog of ingredient comparison and sourcing content queued behind the recipe production line.
| Content pillar | Target volume year 1 | Production cost per piece | Refresh cadence |
|---|---|---|---|
| Recipe hub | 40 to 100 recipes | $180 to $320 | Every 12 months |
| Ingredient comparison guides | 12 to 24 guides | $450 to $780 | Every 18 months |
| Sourcing story pages | 6 to 12 pages | $680 to $1,200 | Every 24 months |
| Buyer intent content | 8 to 16 pieces | $220 to $420 | Every 12 months |
Photography as a content calendar constraint
Photography is the actual constraint on recipe cadence, not writing. Every recipe needs 6 to 12 photos: hero shot, ingredient flat lay, prep in progress, plated result, storage, and step shots for the schema markup. A working food brand batches photography 8 recipes at a time to keep the cost per recipe under 200 dollars. Skip the batching and the per-recipe cost climbs to 400 to 600 dollars, which caps recipe cadence at 1 per week and slows organic ranking timeline by 6 months.
Seasonal content calendar planning
Seasonal content calendar planning maps recipes and comparison guides to the seasonal windows they need to rank in. A Christmas cookie recipe needs to publish in September to rank by early December. A Valentine’s chocolate guide needs to publish in November to rank by early February. A back-to-school lunchbox recipe needs to publish in June to rank by late August. The 60-to-90-day ranking curve dictates the calendar.
Creator syndication inside food brand content
Creator syndication on food brand content marketing amplifies the recipe hub through Instagram Reels, TikTok, and YouTube Shorts creators paid to post their own version of the brand’s hero recipes. The creator content pulls net-new audiences into the recipe hub through the creator’s Link in Bio or Amazon Storefront tag. The syndication calendar names 12 to 30 creators per quarter with specific recipes assigned to each.
One brand we picked up had a spreadsheet titled “creator outreach 2023” with 47 rows and 3 responses. All 3 responses were auto-replies. The spreadsheet named zero recipes and offered flat rates below 100 dollars per post. Nobody posts a 30-second video for 87 dollars flat. Nobody.
Creator content commercial terms that work
Working creator content commercial terms run 350 to 1,500 dollars flat per post plus a 12 to 25 percent commission on tagged sales across a 30-day window. The commission mechanic pulls creators into follow-up posts because the incremental revenue continues past the initial fee. Mid-tier creators (30k to 150k followers) hit the sweet spot for food brand content because their engagement rate typically runs 4 to 8 percent versus 0.8 to 1.6 percent on mega-creators.
Content brief structure for creator partnerships
The content brief structure for creator partnerships runs a single page: the SKU, the specific recipe or usage occasion, 3 required brand mentions, 3 restricted claims (no health claims on non-medical SKUs), the pricing angle, the affiliate link, and 3 example videos that hit the tone. The brief avoids over-scripting because over-scripted creator content underperforms native creator voice by 40 to 60 percent on engagement rate.
Buyer intent content for food brand blogs
Buyer intent content on food brand blogs covers 8 to 16 pieces targeting explicit purchase-decision queries: “where to buy [brand],” “[brand] subscription vs. one-time,” “best [category] for [use case],” and “[brand] gift bundle.” Every buyer intent piece runs 1,400 to 2,400 words with a comparison table, product cards, and a clear conversion path to the specific SKU that matches the query intent. Buyer intent content converts at 3 to 6 percent versus 1 to 2 percent on recipe content because the shopper landed already planning to buy, not exploring a usage occasion.
Where-to-buy content structure
Where-to-buy content structure covers online (DTC storefront, Amazon, Target.com, Whole Foods online), retail (specific chain locators with the store finder embedded), and international (customs limitations, retailer partners abroad). Every piece names specific retailers, links to the store locator, and includes an FAQ block covering shipping availability, subscription options, and gift card compatibility. Where-to-buy content ranks for branded discovery queries the DTC storefront otherwise loses to competitor affiliate reviews.
Subscription versus one-time comparison content
Subscription versus one-time comparison content converts subscription commitments at 3 to 6 percent because it addresses the price-sensitivity concern head-on with a specific math table. The piece covers the discount structure (15 percent lifetime), the skip-a-month mechanic, the pause-anytime rule, the cancellation policy, and the specific yearly savings for the brand’s average consumption cadence. Cross-reference the retention structure on our food and beverage marketing retainer page.
Content refresh cadence on food brand pillars
Content refresh cadence on food brand content pillars runs a rolling audit every 12 to 24 months by pillar. Recipes get refreshed every 12 months with new photography, updated schema, and any nutrition or ingredient adjustments. Ingredient comparison guides refresh every 18 months to update market data. Sourcing story pages refresh every 24 months to reflect farm partnership changes and new harvest angles. Buyer intent content refreshes every 12 months to update retailer availability and pricing.
Recipe refresh priority order
Recipe refresh priority runs by organic traffic rank. The top 20 recipes by monthly organic sessions get refreshed first (new photography, schema audit, related recipe internal links, updated nutrition). The next 40 get refreshed at 15 months. The remaining recipes get refreshed opportunistically when the ranking slips past position 15 in Google. Skipping the refresh cadence lets recipe rankings drift out of the top 3 inside 18 months as newer competitor recipes take the position.
Schema audit checklist per refresh
The schema audit checklist per refresh runs 8 items: Recipe schema completeness, aggregateRating count and accuracy, nutrition data accuracy, prepTime and cookTime match the recipe body, image URLs valid at CDN, related recipe internal links working, product card SKU URL live, and Google Search Console rich result eligibility validated. This checklist takes 20 minutes per recipe and prevents the schema drift that costs recipe rankings 20 to 40 positions quietly.
Reporting cadence for food brand content marketing
Reporting cadence on food brand content marketing runs a monthly executive report plus a quarterly business review. The monthly report ships in the first business week and covers organic sessions by pillar, top 10 ranking recipes with position trend, ingredient guide ranking movements, sourcing page performance, and organic-attributed DTC revenue. Every number carries a comparison to the prior month and a plain-language interpretation the founder reads in 7 minutes.
Metrics that matter for content marketing
Metrics that matter for food brand content marketing: organic sessions by pillar, recipe rich result impressions in Search Console, organic conversion rate to hero SKU pages, organic-attributed DTC revenue, and top 20 ranking positions by monthly organic sessions. Vanity metrics that do not matter: total pageviews without conversion context, average time on page without conversion attribution, and social share counts. The monthly report skips the vanity block entirely.
Quarterly business review structure
The quarterly business review runs 90 minutes with the founder, head of content, and SEO lead. Agenda: organic traffic trend by pillar, top 10 winning content pieces, top 10 losing content pieces (candidates for refresh or removal), competitive gap analysis against 5 named competitor brands, and next quarter’s content calendar with recipes and ingredient guides queued. According to Ahrefs content marketing research, brands running quarterly content audits outperform brands running annual audits by 40 to 70 percent on organic revenue over a 24-month window.
Internal linking discipline across food brand content
Internal linking discipline across food brand content moves authority from recipe pages toward hero SKU product pages and comparison guides. Every recipe links to the hero SKU it uses inline (once in the ingredient list, once in a bottom call-out card). Every ingredient comparison guide links to 3 to 6 recipes using the winning ingredient plus the hero SKU product page. Every sourcing story links to the 2 to 4 SKUs sourced from that specific farm or cooperative.
Anchor text strategy across recipe hubs
Anchor text on internal links varies across recipe hubs to avoid over-optimization patterns Google penalizes. Exact-match anchor (“single-origin Ethiopian coffee”) runs on 20 to 30 percent of internal links. Partial-match variations (“our Ethiopian roast”) run on 30 to 40 percent. Branded anchors (the SKU name) run on 20 to 30 percent. Generic anchors (“shop the coffee”) fill the remaining 10 to 20 percent. This ratio holds ranking without triggering the over-optimization penalty that shows up on brands that anchor-text-stuff every internal link with the same exact-match keyword. Cross-reference the linking layer on our food and beverage web design page.
Link equity from ingredient guides to SKU pages
Link equity from ingredient guides passes to SKU pages when the guide’s comparison table names the hero SKU in the winning column with a product card, and when the guide’s body links to 3 to 6 recipes that use the winning ingredient. This 3-hop path (guide to recipe to SKU) pushes authority from a high-traffic informational query down to a high-intent transactional page. According to Search Engine Land SEO coverage, informational content that internally links to transactional pages produces 2 to 4 times higher organic revenue than isolated content silos.
Wrapping up content marketing for food brands
Content marketing for food brands is the organic engine that turns a DTC snack, drink, or CPG storefront into a search-driven revenue channel. Recipe hub of 40 to 100 recipes. Ingredient comparison guides at 12 to 24 pieces. Sourcing story pages at 6 to 12 pieces. Buyer intent content at 8 to 16 pieces. Creator syndication calendar with 12 to 30 creators per quarter. Refresh cadence at 12 to 24 months by pillar. Reporting with organic sessions and organic revenue attribution.
If your DTC food brand is running paid social at 20,000 dollars monthly with a broken blog and zero recipe schema, professional content marketing for food brands pays for itself inside the first 90 days on organic traffic captured. Redefine Web ships content marketing inside our monthly retainer packages. Book a call and we will walk through the last three DTC food brands we built recipe hubs for, pillar by pillar.
Content marketing for food brands starts with a recipe hub because recipe queries account for 40 to 60 percent of high-intent search volume in the food category. Every hero SKU needs 4 to 12 recipes anchored to it, each targeting a specific occasion and audience.
Skip the recipe hub and the brand loses the search real estate that pulls DTC storefront traffic month over month at zero incremental paid cost. Recipe traffic converts at 2 to 4 percent because the shopper landed with usage intent, not passive discovery, which is why food brands win on recipes.
Recipe schema and Google rich result eligibility
Every recipe page ships schema.org Recipe markup including cookTime, prepTime, recipeIngredient, recipeInstructions, nutrition, and aggregateRating. Correctly marked-up recipes qualify for Google’s recipe rich result carousel that pulls 3 to 6 times higher click-through rate than a plain blue link. The schema layer takes 15 minutes per recipe to author and 30 minutes to validate in Google Search Console. Cross-reference the recipe search stack on our food and beverage SEO page.
Recipe hub structure that scales
The recipe hub structure runs 40 to 100 recipes at maturity, organized by hero SKU (4 to 12 recipes per SKU) plus occasion tags (breakfast, weeknight dinner, meal prep, brunch, holiday). Every recipe links back to the hero SKU product page with the SKU embedded in an inline card. The hub earns internal linking value from ingredient comparison guides and the sourcing story pages, which feeds recipe ranking on Google. According to Google Search Central recipe structured data guidance, complete Recipe schema markup is required for eligibility in the recipe carousel and the ingredient search filter.
Pillar structure for food brand content marketing
The pillar structure on content marketing for food brands runs 4 content pillars concurrently: recipe hub (40 to 100 recipes), ingredient comparison guides (12 to 24 guides), sourcing story pages (6 to 12 pages), and buyer intent content (where to buy, subscription vs. one-time, gift bundle guides). Every pillar covers a distinct search intent and every pillar links back to the hero SKU product pages.
Ingredient comparison guide format
Ingredient comparison guides run 1,800 to 3,200 words comparing 2 to 4 ingredient types on 6 to 10 attributes with a comparison table, real-world use case examples, and links to the hero SKU that uses the specific ingredient. Example: organic vs. conventional oats compares nutritional profile, sourcing chain, cost, environmental impact, and taste on a 6-column table. The brand’s SKU appears in the winning column with a product card. These guides rank 3 to 8 months after publication and pull steady-state organic traffic.
Sourcing story pages that build trust
Sourcing story pages name the specific farms, cooperatives, or suppliers the brand sources from, with photos of the farms, farmer quotes, and specific harvest windows. A coffee brand’s Ethiopian farm page ranks for “single-origin Ethiopian coffee” and “Yirgacheffe coffee origin” plus 40 long-tail variations. The sourcing page pulls trust-building traffic that converts at 4 to 6 percent because the shopper landed pattern-matching on transparency and named provenance. Every sourcing page includes farmer or cooperative quotes, harvest dates, and a link back to 3 to 5 hero SKU pages that source from the named supplier.
Vejrø hospitality content case study
Vejrø Resort, a Danish private-island destination with an on-site restaurant focused on organic, locally sourced cuisine, joined us with strong social engagement and no organic-search real estate. Guests found the resort on Instagram but never in Google search for terms like “private island resort Denmark,” “farm-to-table hospitality Denmark,” or “Vejrø restaurant.” The same organic-search gap shows up on DTC food brands running paid social at 20,000 dollars monthly with a broken blog and zero recipe schema.
We built the conversion-focused website with on-site and off-site SEO tuned to the travel-niche keyword clusters, competitor analysis against comparable boutique resorts, and mobile-first design prioritizing guest discovery. Every page carried the structured data qualifying it for Google’s rich results in the hospitality category. Every internal link pushed authority toward the direct-booking conversion path.
Three months later, Vejrø hit 10,000 plus organic visitors, ranked for 200 plus first-page keywords, and pulled a 2.2 percent booking conversion rate from organic traffic. The same pattern applies to content marketing for food brands: recipe schema, ingredient comparison guides, and sourcing story pages pull organic traffic at 20 to 40 percent conversion into hero SKU pages inside 6 months when the content quality matches search intent and every page carries the right structured data markup. Vejrø also proved out the reporting discipline: every monthly report named the exact page, the exact keyword cluster, and the exact search feature (rich result, sitelinks, image pack) driving the incremental organic revenue instead of hiding behind aggregate traffic charts.
Recipe cadence and content calendar for food brands
Recipe cadence on a working food brand content calendar ships 2 to 4 new recipes per week during the first 6 months and drops to 1 per week at maturity. Each recipe takes 4 to 6 hours to produce (write, test in the kitchen, photograph, schema author, publish). At 3 recipes per week, the brand hits 78 recipes inside 6 months plus a backlog of ingredient comparison and sourcing content queued behind the recipe production line.
| Content pillar | Target volume year 1 | Production cost per piece | Refresh cadence |
|---|---|---|---|
| Recipe hub | 40 to 100 recipes | $180 to $320 | Every 12 months |
| Ingredient comparison guides | 12 to 24 guides | $450 to $780 | Every 18 months |
| Sourcing story pages | 6 to 12 pages | $680 to $1,200 | Every 24 months |
| Buyer intent content | 8 to 16 pieces | $220 to $420 | Every 12 months |
Photography as a content calendar constraint
Photography is the actual constraint on recipe cadence, not writing. Every recipe needs 6 to 12 photos: hero shot, ingredient flat lay, prep in progress, plated result, storage, and step shots for the schema markup. A working food brand batches photography 8 recipes at a time to keep the cost per recipe under 200 dollars. Skip the batching and the per-recipe cost climbs to 400 to 600 dollars, which caps recipe cadence at 1 per week and slows organic ranking timeline by 6 months.
Seasonal content calendar planning
Seasonal content calendar planning maps recipes and comparison guides to the seasonal windows they need to rank in. A Christmas cookie recipe needs to publish in September to rank by early December. A Valentine’s chocolate guide needs to publish in November to rank by early February. A back-to-school lunchbox recipe needs to publish in June to rank by late August. The 60-to-90-day ranking curve dictates the calendar.
Creator syndication inside food brand content
Creator syndication on food brand content marketing amplifies the recipe hub through Instagram Reels, TikTok, and YouTube Shorts creators paid to post their own version of the brand’s hero recipes. The creator content pulls net-new audiences into the recipe hub through the creator’s Link in Bio or Amazon Storefront tag. The syndication calendar names 12 to 30 creators per quarter with specific recipes assigned to each.
One brand we picked up had a spreadsheet titled “creator outreach 2023” with 47 rows and 3 responses. All 3 responses were auto-replies. The spreadsheet named zero recipes and offered flat rates below 100 dollars per post. Nobody posts a 30-second video for 87 dollars flat. Nobody.
Creator content commercial terms that work
Working creator content commercial terms run 350 to 1,500 dollars flat per post plus a 12 to 25 percent commission on tagged sales across a 30-day window. The commission mechanic pulls creators into follow-up posts because the incremental revenue continues past the initial fee. Mid-tier creators (30k to 150k followers) hit the sweet spot for food brand content because their engagement rate typically runs 4 to 8 percent versus 0.8 to 1.6 percent on mega-creators.
Content brief structure for creator partnerships
The content brief structure for creator partnerships runs a single page: the SKU, the specific recipe or usage occasion, 3 required brand mentions, 3 restricted claims (no health claims on non-medical SKUs), the pricing angle, the affiliate link, and 3 example videos that hit the tone. The brief avoids over-scripting because over-scripted creator content underperforms native creator voice by 40 to 60 percent on engagement rate.
Buyer intent content for food brand blogs
Buyer intent content on food brand blogs covers 8 to 16 pieces targeting explicit purchase-decision queries: “where to buy [brand],” “[brand] subscription vs. one-time,” “best [category] for [use case],” and “[brand] gift bundle.” Every buyer intent piece runs 1,400 to 2,400 words with a comparison table, product cards, and a clear conversion path to the specific SKU that matches the query intent. Buyer intent content converts at 3 to 6 percent versus 1 to 2 percent on recipe content because the shopper landed already planning to buy, not exploring a usage occasion.
Where-to-buy content structure
Where-to-buy content structure covers online (DTC storefront, Amazon, Target.com, Whole Foods online), retail (specific chain locators with the store finder embedded), and international (customs limitations, retailer partners abroad). Every piece names specific retailers, links to the store locator, and includes an FAQ block covering shipping availability, subscription options, and gift card compatibility. Where-to-buy content ranks for branded discovery queries the DTC storefront otherwise loses to competitor affiliate reviews.
Subscription versus one-time comparison content
Subscription versus one-time comparison content converts subscription commitments at 3 to 6 percent because it addresses the price-sensitivity concern head-on with a specific math table. The piece covers the discount structure (15 percent lifetime), the skip-a-month mechanic, the pause-anytime rule, the cancellation policy, and the specific yearly savings for the brand’s average consumption cadence. Cross-reference the retention structure on our food and beverage marketing retainer page.
Content refresh cadence on food brand pillars
Content refresh cadence on food brand content pillars runs a rolling audit every 12 to 24 months by pillar. Recipes get refreshed every 12 months with new photography, updated schema, and any nutrition or ingredient adjustments. Ingredient comparison guides refresh every 18 months to update market data. Sourcing story pages refresh every 24 months to reflect farm partnership changes and new harvest angles. Buyer intent content refreshes every 12 months to update retailer availability and pricing.
Recipe refresh priority order
Recipe refresh priority runs by organic traffic rank. The top 20 recipes by monthly organic sessions get refreshed first (new photography, schema audit, related recipe internal links, updated nutrition). The next 40 get refreshed at 15 months. The remaining recipes get refreshed opportunistically when the ranking slips past position 15 in Google. Skipping the refresh cadence lets recipe rankings drift out of the top 3 inside 18 months as newer competitor recipes take the position.
Schema audit checklist per refresh
The schema audit checklist per refresh runs 8 items: Recipe schema completeness, aggregateRating count and accuracy, nutrition data accuracy, prepTime and cookTime match the recipe body, image URLs valid at CDN, related recipe internal links working, product card SKU URL live, and Google Search Console rich result eligibility validated. This checklist takes 20 minutes per recipe and prevents the schema drift that costs recipe rankings 20 to 40 positions quietly.
Reporting cadence for food brand content marketing
Reporting cadence on food brand content marketing runs a monthly executive report plus a quarterly business review. The monthly report ships in the first business week and covers organic sessions by pillar, top 10 ranking recipes with position trend, ingredient guide ranking movements, sourcing page performance, and organic-attributed DTC revenue. Every number carries a comparison to the prior month and a plain-language interpretation the founder reads in 7 minutes.
Metrics that matter for content marketing
Metrics that matter for food brand content marketing: organic sessions by pillar, recipe rich result impressions in Search Console, organic conversion rate to hero SKU pages, organic-attributed DTC revenue, and top 20 ranking positions by monthly organic sessions. Vanity metrics that do not matter: total pageviews without conversion context, average time on page without conversion attribution, and social share counts. The monthly report skips the vanity block entirely.
Quarterly business review structure
The quarterly business review runs 90 minutes with the founder, head of content, and SEO lead. Agenda: organic traffic trend by pillar, top 10 winning content pieces, top 10 losing content pieces (candidates for refresh or removal), competitive gap analysis against 5 named competitor brands, and next quarter’s content calendar with recipes and ingredient guides queued. According to Ahrefs content marketing research, brands running quarterly content audits outperform brands running annual audits by 40 to 70 percent on organic revenue over a 24-month window.
Internal linking discipline across food brand content
Internal linking discipline across food brand content moves authority from recipe pages toward hero SKU product pages and comparison guides. Every recipe links to the hero SKU it uses inline (once in the ingredient list, once in a bottom call-out card). Every ingredient comparison guide links to 3 to 6 recipes using the winning ingredient plus the hero SKU product page. Every sourcing story links to the 2 to 4 SKUs sourced from that specific farm or cooperative.
Anchor text strategy across recipe hubs
Anchor text on internal links varies across recipe hubs to avoid over-optimization patterns Google penalizes. Exact-match anchor (“single-origin Ethiopian coffee”) runs on 20 to 30 percent of internal links. Partial-match variations (“our Ethiopian roast”) run on 30 to 40 percent. Branded anchors (the SKU name) run on 20 to 30 percent. Generic anchors (“shop the coffee”) fill the remaining 10 to 20 percent. This ratio holds ranking without triggering the over-optimization penalty that shows up on brands that anchor-text-stuff every internal link with the same exact-match keyword. Cross-reference the linking layer on our food and beverage web design page.
Link equity from ingredient guides to SKU pages
Link equity from ingredient guides passes to SKU pages when the guide’s comparison table names the hero SKU in the winning column with a product card, and when the guide’s body links to 3 to 6 recipes that use the winning ingredient. This 3-hop path (guide to recipe to SKU) pushes authority from a high-traffic informational query down to a high-intent transactional page. According to Search Engine Land SEO coverage, informational content that internally links to transactional pages produces 2 to 4 times higher organic revenue than isolated content silos.
Wrapping up content marketing for food brands
Content marketing for food brands is the organic engine that turns a DTC snack, drink, or CPG storefront into a search-driven revenue channel. Recipe hub of 40 to 100 recipes. Ingredient comparison guides at 12 to 24 pieces. Sourcing story pages at 6 to 12 pieces. Buyer intent content at 8 to 16 pieces. Creator syndication calendar with 12 to 30 creators per quarter. Refresh cadence at 12 to 24 months by pillar. Reporting with organic sessions and organic revenue attribution.
If your DTC food brand is running paid social at 20,000 dollars monthly with a broken blog and zero recipe schema, professional content marketing for food brands pays for itself inside the first 90 days on organic traffic captured. Redefine Web ships content marketing inside our monthly retainer packages. Book a call and we will walk through the last three DTC food brands we built recipe hubs for, pillar by pillar.
Content marketing for food brands starts with a recipe hub because recipe queries account for 40 to 60 percent of high-intent search volume in the food category. Every hero SKU needs 4 to 12 recipes anchored to it, each targeting a specific occasion and audience.
Skip the recipe hub and the brand loses the search real estate that pulls DTC storefront traffic month over month at zero incremental paid cost. Recipe traffic converts at 2 to 4 percent because the shopper landed with usage intent, not passive discovery, which is why food brands win on recipes.
Recipe schema and Google rich result eligibility
Every recipe page ships schema.org Recipe markup including cookTime, prepTime, recipeIngredient, recipeInstructions, nutrition, and aggregateRating. Correctly marked-up recipes qualify for Google’s recipe rich result carousel that pulls 3 to 6 times higher click-through rate than a plain blue link. The schema layer takes 15 minutes per recipe to author and 30 minutes to validate in Google Search Console. Cross-reference the recipe search stack on our food and beverage SEO page.
Recipe hub structure that scales
The recipe hub structure runs 40 to 100 recipes at maturity, organized by hero SKU (4 to 12 recipes per SKU) plus occasion tags (breakfast, weeknight dinner, meal prep, brunch, holiday). Every recipe links back to the hero SKU product page with the SKU embedded in an inline card. The hub earns internal linking value from ingredient comparison guides and the sourcing story pages, which feeds recipe ranking on Google. According to Google Search Central recipe structured data guidance, complete Recipe schema markup is required for eligibility in the recipe carousel and the ingredient search filter.
Pillar structure for food brand content marketing
The pillar structure on content marketing for food brands runs 4 content pillars concurrently: recipe hub (40 to 100 recipes), ingredient comparison guides (12 to 24 guides), sourcing story pages (6 to 12 pages), and buyer intent content (where to buy, subscription vs. one-time, gift bundle guides). Every pillar covers a distinct search intent and every pillar links back to the hero SKU product pages.
Ingredient comparison guide format
Ingredient comparison guides run 1,800 to 3,200 words comparing 2 to 4 ingredient types on 6 to 10 attributes with a comparison table, real-world use case examples, and links to the hero SKU that uses the specific ingredient. Example: organic vs. conventional oats compares nutritional profile, sourcing chain, cost, environmental impact, and taste on a 6-column table. The brand’s SKU appears in the winning column with a product card. These guides rank 3 to 8 months after publication and pull steady-state organic traffic.
Sourcing story pages that build trust
Sourcing story pages name the specific farms, cooperatives, or suppliers the brand sources from, with photos of the farms, farmer quotes, and specific harvest windows. A coffee brand’s Ethiopian farm page ranks for “single-origin Ethiopian coffee” and “Yirgacheffe coffee origin” plus 40 long-tail variations. The sourcing page pulls trust-building traffic that converts at 4 to 6 percent because the shopper landed pattern-matching on transparency and named provenance. Every sourcing page includes farmer or cooperative quotes, harvest dates, and a link back to 3 to 5 hero SKU pages that source from the named supplier.
Vejrø hospitality content case study
Vejrø Resort, a Danish private-island destination with an on-site restaurant focused on organic, locally sourced cuisine, joined us with strong social engagement and no organic-search real estate. Guests found the resort on Instagram but never in Google search for terms like “private island resort Denmark,” “farm-to-table hospitality Denmark,” or “Vejrø restaurant.” The same organic-search gap shows up on DTC food brands running paid social at 20,000 dollars monthly with a broken blog and zero recipe schema.
We built the conversion-focused website with on-site and off-site SEO tuned to the travel-niche keyword clusters, competitor analysis against comparable boutique resorts, and mobile-first design prioritizing guest discovery. Every page carried the structured data qualifying it for Google’s rich results in the hospitality category. Every internal link pushed authority toward the direct-booking conversion path.
Three months later, Vejrø hit 10,000 plus organic visitors, ranked for 200 plus first-page keywords, and pulled a 2.2 percent booking conversion rate from organic traffic. The same pattern applies to content marketing for food brands: recipe schema, ingredient comparison guides, and sourcing story pages pull organic traffic at 20 to 40 percent conversion into hero SKU pages inside 6 months when the content quality matches search intent and every page carries the right structured data markup. Vejrø also proved out the reporting discipline: every monthly report named the exact page, the exact keyword cluster, and the exact search feature (rich result, sitelinks, image pack) driving the incremental organic revenue instead of hiding behind aggregate traffic charts.
Recipe cadence and content calendar for food brands
Recipe cadence on a working food brand content calendar ships 2 to 4 new recipes per week during the first 6 months and drops to 1 per week at maturity. Each recipe takes 4 to 6 hours to produce (write, test in the kitchen, photograph, schema author, publish). At 3 recipes per week, the brand hits 78 recipes inside 6 months plus a backlog of ingredient comparison and sourcing content queued behind the recipe production line.
| Content pillar | Target volume year 1 | Production cost per piece | Refresh cadence |
|---|---|---|---|
| Recipe hub | 40 to 100 recipes | $180 to $320 | Every 12 months |
| Ingredient comparison guides | 12 to 24 guides | $450 to $780 | Every 18 months |
| Sourcing story pages | 6 to 12 pages | $680 to $1,200 | Every 24 months |
| Buyer intent content | 8 to 16 pieces | $220 to $420 | Every 12 months |
Photography as a content calendar constraint
Photography is the actual constraint on recipe cadence, not writing. Every recipe needs 6 to 12 photos: hero shot, ingredient flat lay, prep in progress, plated result, storage, and step shots for the schema markup. A working food brand batches photography 8 recipes at a time to keep the cost per recipe under 200 dollars. Skip the batching and the per-recipe cost climbs to 400 to 600 dollars, which caps recipe cadence at 1 per week and slows organic ranking timeline by 6 months.
Seasonal content calendar planning
Seasonal content calendar planning maps recipes and comparison guides to the seasonal windows they need to rank in. A Christmas cookie recipe needs to publish in September to rank by early December. A Valentine’s chocolate guide needs to publish in November to rank by early February. A back-to-school lunchbox recipe needs to publish in June to rank by late August. The 60-to-90-day ranking curve dictates the calendar.
Creator syndication inside food brand content
Creator syndication on food brand content marketing amplifies the recipe hub through Instagram Reels, TikTok, and YouTube Shorts creators paid to post their own version of the brand’s hero recipes. The creator content pulls net-new audiences into the recipe hub through the creator’s Link in Bio or Amazon Storefront tag. The syndication calendar names 12 to 30 creators per quarter with specific recipes assigned to each.
One brand we picked up had a spreadsheet titled “creator outreach 2023” with 47 rows and 3 responses. All 3 responses were auto-replies. The spreadsheet named zero recipes and offered flat rates below 100 dollars per post. Nobody posts a 30-second video for 87 dollars flat. Nobody.
Creator content commercial terms that work
Working creator content commercial terms run 350 to 1,500 dollars flat per post plus a 12 to 25 percent commission on tagged sales across a 30-day window. The commission mechanic pulls creators into follow-up posts because the incremental revenue continues past the initial fee. Mid-tier creators (30k to 150k followers) hit the sweet spot for food brand content because their engagement rate typically runs 4 to 8 percent versus 0.8 to 1.6 percent on mega-creators.
Content brief structure for creator partnerships
The content brief structure for creator partnerships runs a single page: the SKU, the specific recipe or usage occasion, 3 required brand mentions, 3 restricted claims (no health claims on non-medical SKUs), the pricing angle, the affiliate link, and 3 example videos that hit the tone. The brief avoids over-scripting because over-scripted creator content underperforms native creator voice by 40 to 60 percent on engagement rate.
Buyer intent content for food brand blogs
Buyer intent content on food brand blogs covers 8 to 16 pieces targeting explicit purchase-decision queries: “where to buy [brand],” “[brand] subscription vs. one-time,” “best [category] for [use case],” and “[brand] gift bundle.” Every buyer intent piece runs 1,400 to 2,400 words with a comparison table, product cards, and a clear conversion path to the specific SKU that matches the query intent. Buyer intent content converts at 3 to 6 percent versus 1 to 2 percent on recipe content because the shopper landed already planning to buy, not exploring a usage occasion.
Where-to-buy content structure
Where-to-buy content structure covers online (DTC storefront, Amazon, Target.com, Whole Foods online), retail (specific chain locators with the store finder embedded), and international (customs limitations, retailer partners abroad). Every piece names specific retailers, links to the store locator, and includes an FAQ block covering shipping availability, subscription options, and gift card compatibility. Where-to-buy content ranks for branded discovery queries the DTC storefront otherwise loses to competitor affiliate reviews.
Subscription versus one-time comparison content
Subscription versus one-time comparison content converts subscription commitments at 3 to 6 percent because it addresses the price-sensitivity concern head-on with a specific math table. The piece covers the discount structure (15 percent lifetime), the skip-a-month mechanic, the pause-anytime rule, the cancellation policy, and the specific yearly savings for the brand’s average consumption cadence. Cross-reference the retention structure on our food and beverage marketing retainer page.
Content refresh cadence on food brand pillars
Content refresh cadence on food brand content pillars runs a rolling audit every 12 to 24 months by pillar. Recipes get refreshed every 12 months with new photography, updated schema, and any nutrition or ingredient adjustments. Ingredient comparison guides refresh every 18 months to update market data. Sourcing story pages refresh every 24 months to reflect farm partnership changes and new harvest angles. Buyer intent content refreshes every 12 months to update retailer availability and pricing.
Recipe refresh priority order
Recipe refresh priority runs by organic traffic rank. The top 20 recipes by monthly organic sessions get refreshed first (new photography, schema audit, related recipe internal links, updated nutrition). The next 40 get refreshed at 15 months. The remaining recipes get refreshed opportunistically when the ranking slips past position 15 in Google. Skipping the refresh cadence lets recipe rankings drift out of the top 3 inside 18 months as newer competitor recipes take the position.
Schema audit checklist per refresh
The schema audit checklist per refresh runs 8 items: Recipe schema completeness, aggregateRating count and accuracy, nutrition data accuracy, prepTime and cookTime match the recipe body, image URLs valid at CDN, related recipe internal links working, product card SKU URL live, and Google Search Console rich result eligibility validated. This checklist takes 20 minutes per recipe and prevents the schema drift that costs recipe rankings 20 to 40 positions quietly.
Reporting cadence for food brand content marketing
Reporting cadence on food brand content marketing runs a monthly executive report plus a quarterly business review. The monthly report ships in the first business week and covers organic sessions by pillar, top 10 ranking recipes with position trend, ingredient guide ranking movements, sourcing page performance, and organic-attributed DTC revenue. Every number carries a comparison to the prior month and a plain-language interpretation the founder reads in 7 minutes.
Metrics that matter for content marketing
Metrics that matter for food brand content marketing: organic sessions by pillar, recipe rich result impressions in Search Console, organic conversion rate to hero SKU pages, organic-attributed DTC revenue, and top 20 ranking positions by monthly organic sessions. Vanity metrics that do not matter: total pageviews without conversion context, average time on page without conversion attribution, and social share counts. The monthly report skips the vanity block entirely.
Quarterly business review structure
The quarterly business review runs 90 minutes with the founder, head of content, and SEO lead. Agenda: organic traffic trend by pillar, top 10 winning content pieces, top 10 losing content pieces (candidates for refresh or removal), competitive gap analysis against 5 named competitor brands, and next quarter’s content calendar with recipes and ingredient guides queued. According to Ahrefs content marketing research, brands running quarterly content audits outperform brands running annual audits by 40 to 70 percent on organic revenue over a 24-month window.
Internal linking discipline across food brand content
Internal linking discipline across food brand content moves authority from recipe pages toward hero SKU product pages and comparison guides. Every recipe links to the hero SKU it uses inline (once in the ingredient list, once in a bottom call-out card). Every ingredient comparison guide links to 3 to 6 recipes using the winning ingredient plus the hero SKU product page. Every sourcing story links to the 2 to 4 SKUs sourced from that specific farm or cooperative.
Anchor text strategy across recipe hubs
Anchor text on internal links varies across recipe hubs to avoid over-optimization patterns Google penalizes. Exact-match anchor (“single-origin Ethiopian coffee”) runs on 20 to 30 percent of internal links. Partial-match variations (“our Ethiopian roast”) run on 30 to 40 percent. Branded anchors (the SKU name) run on 20 to 30 percent. Generic anchors (“shop the coffee”) fill the remaining 10 to 20 percent. This ratio holds ranking without triggering the over-optimization penalty that shows up on brands that anchor-text-stuff every internal link with the same exact-match keyword. Cross-reference the linking layer on our food and beverage web design page.
Link equity from ingredient guides to SKU pages
Link equity from ingredient guides passes to SKU pages when the guide’s comparison table names the hero SKU in the winning column with a product card, and when the guide’s body links to 3 to 6 recipes that use the winning ingredient. This 3-hop path (guide to recipe to SKU) pushes authority from a high-traffic informational query down to a high-intent transactional page. According to Search Engine Land SEO coverage, informational content that internally links to transactional pages produces 2 to 4 times higher organic revenue than isolated content silos.
Wrapping up content marketing for food brands
Content marketing for food brands is the organic engine that turns a DTC snack, drink, or CPG storefront into a search-driven revenue channel. Recipe hub of 40 to 100 recipes. Ingredient comparison guides at 12 to 24 pieces. Sourcing story pages at 6 to 12 pieces. Buyer intent content at 8 to 16 pieces. Creator syndication calendar with 12 to 30 creators per quarter. Refresh cadence at 12 to 24 months by pillar. Reporting with organic sessions and organic revenue attribution.
If your DTC food brand is running paid social at 20,000 dollars monthly with a broken blog and zero recipe schema, professional content marketing for food brands pays for itself inside the first 90 days on organic traffic captured. Redefine Web ships content marketing inside our monthly retainer packages. Book a call and we will walk through the last three DTC food brands we built recipe hubs for, pillar by pillar.
Anchor text on internal links varies across recipe hubs to avoid over-optimization patterns Google penalizes. Exact-match anchor (“single-origin Ethiopian coffee”) runs on 20 to 30 percent of internal links. Partial-match variations (“our Ethiopian roast”) run on 30 to 40 percent. Branded anchors (the SKU name) run on 20 to 30 percent. Generic anchors (“shop the coffee”) fill the remaining 10 to 20 percent. This ratio holds ranking without triggering the over-optimization penalty that shows up on brands that anchor-text-stuff every internal link with the same exact-match keyword. Cross-reference the linking layer on our food and beverage web design page.
Link equity from ingredient guides to SKU pages
Link equity from ingredient guides passes to SKU pages when the guide’s comparison table names the hero SKU in the winning column with a product card, and when the guide’s body links to 3 to 6 recipes that use the winning ingredient. This 3-hop path (guide to recipe to SKU) pushes authority from a high-traffic informational query down to a high-intent transactional page. According to Search Engine Land SEO coverage, informational content that internally links to transactional pages produces 2 to 4 times higher organic revenue than isolated content silos.
Wrapping up content marketing for food brands
Content marketing for food brands is the organic engine that turns a DTC snack, drink, or CPG storefront into a search-driven revenue channel. Recipe hub of 40 to 100 recipes. Ingredient comparison guides at 12 to 24 pieces. Sourcing story pages at 6 to 12 pieces. Buyer intent content at 8 to 16 pieces. Creator syndication calendar with 12 to 30 creators per quarter. Refresh cadence at 12 to 24 months by pillar. Reporting with organic sessions and organic revenue attribution.
If your DTC food brand is running paid social at 20,000 dollars monthly with a broken blog and zero recipe schema, professional content marketing for food brands pays for itself inside the first 90 days on organic traffic captured. Redefine Web ships content marketing inside our monthly retainer packages. Book a call and we will walk through the last three DTC food brands we built recipe hubs for, pillar by pillar.
Content marketing for food brands starts with a recipe hub because recipe queries account for 40 to 60 percent of high-intent search volume in the food category. Every hero SKU needs 4 to 12 recipes anchored to it, each targeting a specific occasion and audience.
Skip the recipe hub and the brand loses the search real estate that pulls DTC storefront traffic month over month at zero incremental paid cost. Recipe traffic converts at 2 to 4 percent because the shopper landed with usage intent, not passive discovery, which is why food brands win on recipes.
Recipe schema and Google rich result eligibility
Every recipe page ships schema.org Recipe markup including cookTime, prepTime, recipeIngredient, recipeInstructions, nutrition, and aggregateRating. Correctly marked-up recipes qualify for Google’s recipe rich result carousel that pulls 3 to 6 times higher click-through rate than a plain blue link. The schema layer takes 15 minutes per recipe to author and 30 minutes to validate in Google Search Console. Cross-reference the recipe search stack on our food and beverage SEO page.
Recipe hub structure that scales
The recipe hub structure runs 40 to 100 recipes at maturity, organized by hero SKU (4 to 12 recipes per SKU) plus occasion tags (breakfast, weeknight dinner, meal prep, brunch, holiday). Every recipe links back to the hero SKU product page with the SKU embedded in an inline card. The hub earns internal linking value from ingredient comparison guides and the sourcing story pages, which feeds recipe ranking on Google. According to Google Search Central recipe structured data guidance, complete Recipe schema markup is required for eligibility in the recipe carousel and the ingredient search filter.
Pillar structure for food brand content marketing
The pillar structure on content marketing for food brands runs 4 content pillars concurrently: recipe hub (40 to 100 recipes), ingredient comparison guides (12 to 24 guides), sourcing story pages (6 to 12 pages), and buyer intent content (where to buy, subscription vs. one-time, gift bundle guides). Every pillar covers a distinct search intent and every pillar links back to the hero SKU product pages.
Ingredient comparison guide format
Ingredient comparison guides run 1,800 to 3,200 words comparing 2 to 4 ingredient types on 6 to 10 attributes with a comparison table, real-world use case examples, and links to the hero SKU that uses the specific ingredient. Example: organic vs. conventional oats compares nutritional profile, sourcing chain, cost, environmental impact, and taste on a 6-column table. The brand’s SKU appears in the winning column with a product card. These guides rank 3 to 8 months after publication and pull steady-state organic traffic.
Sourcing story pages that build trust
Sourcing story pages name the specific farms, cooperatives, or suppliers the brand sources from, with photos of the farms, farmer quotes, and specific harvest windows. A coffee brand’s Ethiopian farm page ranks for “single-origin Ethiopian coffee” and “Yirgacheffe coffee origin” plus 40 long-tail variations. The sourcing page pulls trust-building traffic that converts at 4 to 6 percent because the shopper landed pattern-matching on transparency and named provenance. Every sourcing page includes farmer or cooperative quotes, harvest dates, and a link back to 3 to 5 hero SKU pages that source from the named supplier.
Vejrø hospitality content case study
Vejrø Resort, a Danish private-island destination with an on-site restaurant focused on organic, locally sourced cuisine, joined us with strong social engagement and no organic-search real estate. Guests found the resort on Instagram but never in Google search for terms like “private island resort Denmark,” “farm-to-table hospitality Denmark,” or “Vejrø restaurant.” The same organic-search gap shows up on DTC food brands running paid social at 20,000 dollars monthly with a broken blog and zero recipe schema.
We built the conversion-focused website with on-site and off-site SEO tuned to the travel-niche keyword clusters, competitor analysis against comparable boutique resorts, and mobile-first design prioritizing guest discovery. Every page carried the structured data qualifying it for Google’s rich results in the hospitality category. Every internal link pushed authority toward the direct-booking conversion path.
Three months later, Vejrø hit 10,000 plus organic visitors, ranked for 200 plus first-page keywords, and pulled a 2.2 percent booking conversion rate from organic traffic. The same pattern applies to content marketing for food brands: recipe schema, ingredient comparison guides, and sourcing story pages pull organic traffic at 20 to 40 percent conversion into hero SKU pages inside 6 months when the content quality matches search intent and every page carries the right structured data markup. Vejrø also proved out the reporting discipline: every monthly report named the exact page, the exact keyword cluster, and the exact search feature (rich result, sitelinks, image pack) driving the incremental organic revenue instead of hiding behind aggregate traffic charts.
Recipe cadence and content calendar for food brands
Recipe cadence on a working food brand content calendar ships 2 to 4 new recipes per week during the first 6 months and drops to 1 per week at maturity. Each recipe takes 4 to 6 hours to produce (write, test in the kitchen, photograph, schema author, publish). At 3 recipes per week, the brand hits 78 recipes inside 6 months plus a backlog of ingredient comparison and sourcing content queued behind the recipe production line.
| Content pillar | Target volume year 1 | Production cost per piece | Refresh cadence |
|---|---|---|---|
| Recipe hub | 40 to 100 recipes | $180 to $320 | Every 12 months |
| Ingredient comparison guides | 12 to 24 guides | $450 to $780 | Every 18 months |
| Sourcing story pages | 6 to 12 pages | $680 to $1,200 | Every 24 months |
| Buyer intent content | 8 to 16 pieces | $220 to $420 | Every 12 months |
Photography as a content calendar constraint
Photography is the actual constraint on recipe cadence, not writing. Every recipe needs 6 to 12 photos: hero shot, ingredient flat lay, prep in progress, plated result, storage, and step shots for the schema markup. A working food brand batches photography 8 recipes at a time to keep the cost per recipe under 200 dollars. Skip the batching and the per-recipe cost climbs to 400 to 600 dollars, which caps recipe cadence at 1 per week and slows organic ranking timeline by 6 months.
Seasonal content calendar planning
Seasonal content calendar planning maps recipes and comparison guides to the seasonal windows they need to rank in. A Christmas cookie recipe needs to publish in September to rank by early December. A Valentine’s chocolate guide needs to publish in November to rank by early February. A back-to-school lunchbox recipe needs to publish in June to rank by late August. The 60-to-90-day ranking curve dictates the calendar.
Creator syndication inside food brand content
Creator syndication on food brand content marketing amplifies the recipe hub through Instagram Reels, TikTok, and YouTube Shorts creators paid to post their own version of the brand’s hero recipes. The creator content pulls net-new audiences into the recipe hub through the creator’s Link in Bio or Amazon Storefront tag. The syndication calendar names 12 to 30 creators per quarter with specific recipes assigned to each.
One brand we picked up had a spreadsheet titled “creator outreach 2023” with 47 rows and 3 responses. All 3 responses were auto-replies. The spreadsheet named zero recipes and offered flat rates below 100 dollars per post. Nobody posts a 30-second video for 87 dollars flat. Nobody.
Creator content commercial terms that work
Working creator content commercial terms run 350 to 1,500 dollars flat per post plus a 12 to 25 percent commission on tagged sales across a 30-day window. The commission mechanic pulls creators into follow-up posts because the incremental revenue continues past the initial fee. Mid-tier creators (30k to 150k followers) hit the sweet spot for food brand content because their engagement rate typically runs 4 to 8 percent versus 0.8 to 1.6 percent on mega-creators.
Content brief structure for creator partnerships
The content brief structure for creator partnerships runs a single page: the SKU, the specific recipe or usage occasion, 3 required brand mentions, 3 restricted claims (no health claims on non-medical SKUs), the pricing angle, the affiliate link, and 3 example videos that hit the tone. The brief avoids over-scripting because over-scripted creator content underperforms native creator voice by 40 to 60 percent on engagement rate.
Buyer intent content for food brand blogs
Buyer intent content on food brand blogs covers 8 to 16 pieces targeting explicit purchase-decision queries: “where to buy [brand],” “[brand] subscription vs. one-time,” “best [category] for [use case],” and “[brand] gift bundle.” Every buyer intent piece runs 1,400 to 2,400 words with a comparison table, product cards, and a clear conversion path to the specific SKU that matches the query intent. Buyer intent content converts at 3 to 6 percent versus 1 to 2 percent on recipe content because the shopper landed already planning to buy, not exploring a usage occasion.
Where-to-buy content structure
Where-to-buy content structure covers online (DTC storefront, Amazon, Target.com, Whole Foods online), retail (specific chain locators with the store finder embedded), and international (customs limitations, retailer partners abroad). Every piece names specific retailers, links to the store locator, and includes an FAQ block covering shipping availability, subscription options, and gift card compatibility. Where-to-buy content ranks for branded discovery queries the DTC storefront otherwise loses to competitor affiliate reviews.
Subscription versus one-time comparison content
Subscription versus one-time comparison content converts subscription commitments at 3 to 6 percent because it addresses the price-sensitivity concern head-on with a specific math table. The piece covers the discount structure (15 percent lifetime), the skip-a-month mechanic, the pause-anytime rule, the cancellation policy, and the specific yearly savings for the brand’s average consumption cadence. Cross-reference the retention structure on our food and beverage marketing retainer page.
Content refresh cadence on food brand pillars
Content refresh cadence on food brand content pillars runs a rolling audit every 12 to 24 months by pillar. Recipes get refreshed every 12 months with new photography, updated schema, and any nutrition or ingredient adjustments. Ingredient comparison guides refresh every 18 months to update market data. Sourcing story pages refresh every 24 months to reflect farm partnership changes and new harvest angles. Buyer intent content refreshes every 12 months to update retailer availability and pricing.
Recipe refresh priority order
Recipe refresh priority runs by organic traffic rank. The top 20 recipes by monthly organic sessions get refreshed first (new photography, schema audit, related recipe internal links, updated nutrition). The next 40 get refreshed at 15 months. The remaining recipes get refreshed opportunistically when the ranking slips past position 15 in Google. Skipping the refresh cadence lets recipe rankings drift out of the top 3 inside 18 months as newer competitor recipes take the position.
Schema audit checklist per refresh
The schema audit checklist per refresh runs 8 items: Recipe schema completeness, aggregateRating count and accuracy, nutrition data accuracy, prepTime and cookTime match the recipe body, image URLs valid at CDN, related recipe internal links working, product card SKU URL live, and Google Search Console rich result eligibility validated. This checklist takes 20 minutes per recipe and prevents the schema drift that costs recipe rankings 20 to 40 positions quietly.
Reporting cadence for food brand content marketing
Reporting cadence on food brand content marketing runs a monthly executive report plus a quarterly business review. The monthly report ships in the first business week and covers organic sessions by pillar, top 10 ranking recipes with position trend, ingredient guide ranking movements, sourcing page performance, and organic-attributed DTC revenue. Every number carries a comparison to the prior month and a plain-language interpretation the founder reads in 7 minutes.
Metrics that matter for content marketing
Metrics that matter for food brand content marketing: organic sessions by pillar, recipe rich result impressions in Search Console, organic conversion rate to hero SKU pages, organic-attributed DTC revenue, and top 20 ranking positions by monthly organic sessions. Vanity metrics that do not matter: total pageviews without conversion context, average time on page without conversion attribution, and social share counts. The monthly report skips the vanity block entirely.
Quarterly business review structure
The quarterly business review runs 90 minutes with the founder, head of content, and SEO lead. Agenda: organic traffic trend by pillar, top 10 winning content pieces, top 10 losing content pieces (candidates for refresh or removal), competitive gap analysis against 5 named competitor brands, and next quarter’s content calendar with recipes and ingredient guides queued. According to Ahrefs content marketing research, brands running quarterly content audits outperform brands running annual audits by 40 to 70 percent on organic revenue over a 24-month window.
Internal linking discipline across food brand content
Internal linking discipline across food brand content moves authority from recipe pages toward hero SKU product pages and comparison guides. Every recipe links to the hero SKU it uses inline (once in the ingredient list, once in a bottom call-out card). Every ingredient comparison guide links to 3 to 6 recipes using the winning ingredient plus the hero SKU product page. Every sourcing story links to the 2 to 4 SKUs sourced from that specific farm or cooperative.
Anchor text strategy across recipe hubs
Anchor text on internal links varies across recipe hubs to avoid over-optimization patterns Google penalizes. Exact-match anchor (“single-origin Ethiopian coffee”) runs on 20 to 30 percent of internal links. Partial-match variations (“our Ethiopian roast”) run on 30 to 40 percent. Branded anchors (the SKU name) run on 20 to 30 percent. Generic anchors (“shop the coffee”) fill the remaining 10 to 20 percent. This ratio holds ranking without triggering the over-optimization penalty that shows up on brands that anchor-text-stuff every internal link with the same exact-match keyword. Cross-reference the linking layer on our food and beverage web design page.
Link equity from ingredient guides to SKU pages
Link equity from ingredient guides passes to SKU pages when the guide’s comparison table names the hero SKU in the winning column with a product card, and when the guide’s body links to 3 to 6 recipes that use the winning ingredient. This 3-hop path (guide to recipe to SKU) pushes authority from a high-traffic informational query down to a high-intent transactional page. According to Search Engine Land SEO coverage, informational content that internally links to transactional pages produces 2 to 4 times higher organic revenue than isolated content silos.
Wrapping up content marketing for food brands
Content marketing for food brands is the organic engine that turns a DTC snack, drink, or CPG storefront into a search-driven revenue channel. Recipe hub of 40 to 100 recipes. Ingredient comparison guides at 12 to 24 pieces. Sourcing story pages at 6 to 12 pieces. Buyer intent content at 8 to 16 pieces. Creator syndication calendar with 12 to 30 creators per quarter. Refresh cadence at 12 to 24 months by pillar. Reporting with organic sessions and organic revenue attribution.
If your DTC food brand is running paid social at 20,000 dollars monthly with a broken blog and zero recipe schema, professional content marketing for food brands pays for itself inside the first 90 days on organic traffic captured. Redefine Web ships content marketing inside our monthly retainer packages. Book a call and we will walk through the last three DTC food brands we built recipe hubs for, pillar by pillar.
Content marketing for food brands starts with a recipe hub because recipe queries account for 40 to 60 percent of high-intent search volume in the food category. Every hero SKU needs 4 to 12 recipes anchored to it, each targeting a specific occasion and audience.
Skip the recipe hub and the brand loses the search real estate that pulls DTC storefront traffic month over month at zero incremental paid cost. Recipe traffic converts at 2 to 4 percent because the shopper landed with usage intent, not passive discovery, which is why food brands win on recipes.
Recipe schema and Google rich result eligibility
Every recipe page ships schema.org Recipe markup including cookTime, prepTime, recipeIngredient, recipeInstructions, nutrition, and aggregateRating. Correctly marked-up recipes qualify for Google’s recipe rich result carousel that pulls 3 to 6 times higher click-through rate than a plain blue link. The schema layer takes 15 minutes per recipe to author and 30 minutes to validate in Google Search Console. Cross-reference the recipe search stack on our food and beverage SEO page.
Recipe hub structure that scales
The recipe hub structure runs 40 to 100 recipes at maturity, organized by hero SKU (4 to 12 recipes per SKU) plus occasion tags (breakfast, weeknight dinner, meal prep, brunch, holiday). Every recipe links back to the hero SKU product page with the SKU embedded in an inline card. The hub earns internal linking value from ingredient comparison guides and the sourcing story pages, which feeds recipe ranking on Google. According to Google Search Central recipe structured data guidance, complete Recipe schema markup is required for eligibility in the recipe carousel and the ingredient search filter.
Pillar structure for food brand content marketing
The pillar structure on content marketing for food brands runs 4 content pillars concurrently: recipe hub (40 to 100 recipes), ingredient comparison guides (12 to 24 guides), sourcing story pages (6 to 12 pages), and buyer intent content (where to buy, subscription vs. one-time, gift bundle guides). Every pillar covers a distinct search intent and every pillar links back to the hero SKU product pages.
Ingredient comparison guide format
Ingredient comparison guides run 1,800 to 3,200 words comparing 2 to 4 ingredient types on 6 to 10 attributes with a comparison table, real-world use case examples, and links to the hero SKU that uses the specific ingredient. Example: organic vs. conventional oats compares nutritional profile, sourcing chain, cost, environmental impact, and taste on a 6-column table. The brand’s SKU appears in the winning column with a product card. These guides rank 3 to 8 months after publication and pull steady-state organic traffic.
Sourcing story pages that build trust
Sourcing story pages name the specific farms, cooperatives, or suppliers the brand sources from, with photos of the farms, farmer quotes, and specific harvest windows. A coffee brand’s Ethiopian farm page ranks for “single-origin Ethiopian coffee” and “Yirgacheffe coffee origin” plus 40 long-tail variations. The sourcing page pulls trust-building traffic that converts at 4 to 6 percent because the shopper landed pattern-matching on transparency and named provenance. Every sourcing page includes farmer or cooperative quotes, harvest dates, and a link back to 3 to 5 hero SKU pages that source from the named supplier.
Vejrø hospitality content case study
Vejrø Resort, a Danish private-island destination with an on-site restaurant focused on organic, locally sourced cuisine, joined us with strong social engagement and no organic-search real estate. Guests found the resort on Instagram but never in Google search for terms like “private island resort Denmark,” “farm-to-table hospitality Denmark,” or “Vejrø restaurant.” The same organic-search gap shows up on DTC food brands running paid social at 20,000 dollars monthly with a broken blog and zero recipe schema.
We built the conversion-focused website with on-site and off-site SEO tuned to the travel-niche keyword clusters, competitor analysis against comparable boutique resorts, and mobile-first design prioritizing guest discovery. Every page carried the structured data qualifying it for Google’s rich results in the hospitality category. Every internal link pushed authority toward the direct-booking conversion path.
Three months later, Vejrø hit 10,000 plus organic visitors, ranked for 200 plus first-page keywords, and pulled a 2.2 percent booking conversion rate from organic traffic. The same pattern applies to content marketing for food brands: recipe schema, ingredient comparison guides, and sourcing story pages pull organic traffic at 20 to 40 percent conversion into hero SKU pages inside 6 months when the content quality matches search intent and every page carries the right structured data markup. Vejrø also proved out the reporting discipline: every monthly report named the exact page, the exact keyword cluster, and the exact search feature (rich result, sitelinks, image pack) driving the incremental organic revenue instead of hiding behind aggregate traffic charts.
Recipe cadence and content calendar for food brands
Recipe cadence on a working food brand content calendar ships 2 to 4 new recipes per week during the first 6 months and drops to 1 per week at maturity. Each recipe takes 4 to 6 hours to produce (write, test in the kitchen, photograph, schema author, publish). At 3 recipes per week, the brand hits 78 recipes inside 6 months plus a backlog of ingredient comparison and sourcing content queued behind the recipe production line.
| Content pillar | Target volume year 1 | Production cost per piece | Refresh cadence |
|---|---|---|---|
| Recipe hub | 40 to 100 recipes | $180 to $320 | Every 12 months |
| Ingredient comparison guides | 12 to 24 guides | $450 to $780 | Every 18 months |
| Sourcing story pages | 6 to 12 pages | $680 to $1,200 | Every 24 months |
| Buyer intent content | 8 to 16 pieces | $220 to $420 | Every 12 months |
Photography as a content calendar constraint
Photography is the actual constraint on recipe cadence, not writing. Every recipe needs 6 to 12 photos: hero shot, ingredient flat lay, prep in progress, plated result, storage, and step shots for the schema markup. A working food brand batches photography 8 recipes at a time to keep the cost per recipe under 200 dollars. Skip the batching and the per-recipe cost climbs to 400 to 600 dollars, which caps recipe cadence at 1 per week and slows organic ranking timeline by 6 months.
Seasonal content calendar planning
Seasonal content calendar planning maps recipes and comparison guides to the seasonal windows they need to rank in. A Christmas cookie recipe needs to publish in September to rank by early December. A Valentine’s chocolate guide needs to publish in November to rank by early February. A back-to-school lunchbox recipe needs to publish in June to rank by late August. The 60-to-90-day ranking curve dictates the calendar.
Creator syndication inside food brand content
Creator syndication on food brand content marketing amplifies the recipe hub through Instagram Reels, TikTok, and YouTube Shorts creators paid to post their own version of the brand’s hero recipes. The creator content pulls net-new audiences into the recipe hub through the creator’s Link in Bio or Amazon Storefront tag. The syndication calendar names 12 to 30 creators per quarter with specific recipes assigned to each.
One brand we picked up had a spreadsheet titled “creator outreach 2023” with 47 rows and 3 responses. All 3 responses were auto-replies. The spreadsheet named zero recipes and offered flat rates below 100 dollars per post. Nobody posts a 30-second video for 87 dollars flat. Nobody.
Creator content commercial terms that work
Working creator content commercial terms run 350 to 1,500 dollars flat per post plus a 12 to 25 percent commission on tagged sales across a 30-day window. The commission mechanic pulls creators into follow-up posts because the incremental revenue continues past the initial fee. Mid-tier creators (30k to 150k followers) hit the sweet spot for food brand content because their engagement rate typically runs 4 to 8 percent versus 0.8 to 1.6 percent on mega-creators.
Content brief structure for creator partnerships
The content brief structure for creator partnerships runs a single page: the SKU, the specific recipe or usage occasion, 3 required brand mentions, 3 restricted claims (no health claims on non-medical SKUs), the pricing angle, the affiliate link, and 3 example videos that hit the tone. The brief avoids over-scripting because over-scripted creator content underperforms native creator voice by 40 to 60 percent on engagement rate.
Buyer intent content for food brand blogs
Buyer intent content on food brand blogs covers 8 to 16 pieces targeting explicit purchase-decision queries: “where to buy [brand],” “[brand] subscription vs. one-time,” “best [category] for [use case],” and “[brand] gift bundle.” Every buyer intent piece runs 1,400 to 2,400 words with a comparison table, product cards, and a clear conversion path to the specific SKU that matches the query intent. Buyer intent content converts at 3 to 6 percent versus 1 to 2 percent on recipe content because the shopper landed already planning to buy, not exploring a usage occasion.
Where-to-buy content structure
Where-to-buy content structure covers online (DTC storefront, Amazon, Target.com, Whole Foods online), retail (specific chain locators with the store finder embedded), and international (customs limitations, retailer partners abroad). Every piece names specific retailers, links to the store locator, and includes an FAQ block covering shipping availability, subscription options, and gift card compatibility. Where-to-buy content ranks for branded discovery queries the DTC storefront otherwise loses to competitor affiliate reviews.
Subscription versus one-time comparison content
Subscription versus one-time comparison content converts subscription commitments at 3 to 6 percent because it addresses the price-sensitivity concern head-on with a specific math table. The piece covers the discount structure (15 percent lifetime), the skip-a-month mechanic, the pause-anytime rule, the cancellation policy, and the specific yearly savings for the brand’s average consumption cadence. Cross-reference the retention structure on our food and beverage marketing retainer page.
Content refresh cadence on food brand pillars
Content refresh cadence on food brand content pillars runs a rolling audit every 12 to 24 months by pillar. Recipes get refreshed every 12 months with new photography, updated schema, and any nutrition or ingredient adjustments. Ingredient comparison guides refresh every 18 months to update market data. Sourcing story pages refresh every 24 months to reflect farm partnership changes and new harvest angles. Buyer intent content refreshes every 12 months to update retailer availability and pricing.
Recipe refresh priority order
Recipe refresh priority runs by organic traffic rank. The top 20 recipes by monthly organic sessions get refreshed first (new photography, schema audit, related recipe internal links, updated nutrition). The next 40 get refreshed at 15 months. The remaining recipes get refreshed opportunistically when the ranking slips past position 15 in Google. Skipping the refresh cadence lets recipe rankings drift out of the top 3 inside 18 months as newer competitor recipes take the position.
Schema audit checklist per refresh
The schema audit checklist per refresh runs 8 items: Recipe schema completeness, aggregateRating count and accuracy, nutrition data accuracy, prepTime and cookTime match the recipe body, image URLs valid at CDN, related recipe internal links working, product card SKU URL live, and Google Search Console rich result eligibility validated. This checklist takes 20 minutes per recipe and prevents the schema drift that costs recipe rankings 20 to 40 positions quietly.
Reporting cadence for food brand content marketing
Reporting cadence on food brand content marketing runs a monthly executive report plus a quarterly business review. The monthly report ships in the first business week and covers organic sessions by pillar, top 10 ranking recipes with position trend, ingredient guide ranking movements, sourcing page performance, and organic-attributed DTC revenue. Every number carries a comparison to the prior month and a plain-language interpretation the founder reads in 7 minutes.
Metrics that matter for content marketing
Metrics that matter for food brand content marketing: organic sessions by pillar, recipe rich result impressions in Search Console, organic conversion rate to hero SKU pages, organic-attributed DTC revenue, and top 20 ranking positions by monthly organic sessions. Vanity metrics that do not matter: total pageviews without conversion context, average time on page without conversion attribution, and social share counts. The monthly report skips the vanity block entirely.
Quarterly business review structure
The quarterly business review runs 90 minutes with the founder, head of content, and SEO lead. Agenda: organic traffic trend by pillar, top 10 winning content pieces, top 10 losing content pieces (candidates for refresh or removal), competitive gap analysis against 5 named competitor brands, and next quarter’s content calendar with recipes and ingredient guides queued. According to Ahrefs content marketing research, brands running quarterly content audits outperform brands running annual audits by 40 to 70 percent on organic revenue over a 24-month window.
Internal linking discipline across food brand content
Internal linking discipline across food brand content moves authority from recipe pages toward hero SKU product pages and comparison guides. Every recipe links to the hero SKU it uses inline (once in the ingredient list, once in a bottom call-out card). Every ingredient comparison guide links to 3 to 6 recipes using the winning ingredient plus the hero SKU product page. Every sourcing story links to the 2 to 4 SKUs sourced from that specific farm or cooperative.
Anchor text strategy across recipe hubs
Anchor text on internal links varies across recipe hubs to avoid over-optimization patterns Google penalizes. Exact-match anchor (“single-origin Ethiopian coffee”) runs on 20 to 30 percent of internal links. Partial-match variations (“our Ethiopian roast”) run on 30 to 40 percent. Branded anchors (the SKU name) run on 20 to 30 percent. Generic anchors (“shop the coffee”) fill the remaining 10 to 20 percent. This ratio holds ranking without triggering the over-optimization penalty that shows up on brands that anchor-text-stuff every internal link with the same exact-match keyword. Cross-reference the linking layer on our food and beverage web design page.
Link equity from ingredient guides to SKU pages
Link equity from ingredient guides passes to SKU pages when the guide’s comparison table names the hero SKU in the winning column with a product card, and when the guide’s body links to 3 to 6 recipes that use the winning ingredient. This 3-hop path (guide to recipe to SKU) pushes authority from a high-traffic informational query down to a high-intent transactional page. According to Search Engine Land SEO coverage, informational content that internally links to transactional pages produces 2 to 4 times higher organic revenue than isolated content silos.
Wrapping up content marketing for food brands
Content marketing for food brands is the organic engine that turns a DTC snack, drink, or CPG storefront into a search-driven revenue channel. Recipe hub of 40 to 100 recipes. Ingredient comparison guides at 12 to 24 pieces. Sourcing story pages at 6 to 12 pieces. Buyer intent content at 8 to 16 pieces. Creator syndication calendar with 12 to 30 creators per quarter. Refresh cadence at 12 to 24 months by pillar. Reporting with organic sessions and organic revenue attribution.
If your DTC food brand is running paid social at 20,000 dollars monthly with a broken blog and zero recipe schema, professional content marketing for food brands pays for itself inside the first 90 days on organic traffic captured. Redefine Web ships content marketing inside our monthly retainer packages. Book a call and we will walk through the last three DTC food brands we built recipe hubs for, pillar by pillar.
Internal linking discipline across food brand content moves authority from recipe pages toward hero SKU product pages and comparison guides. Every recipe links to the hero SKU it uses inline (once in the ingredient list, once in a bottom call-out card). Every ingredient comparison guide links to 3 to 6 recipes using the winning ingredient plus the hero SKU product page. Every sourcing story links to the 2 to 4 SKUs sourced from that specific farm or cooperative.
Anchor text strategy across recipe hubs
Anchor text on internal links varies across recipe hubs to avoid over-optimization patterns Google penalizes. Exact-match anchor (“single-origin Ethiopian coffee”) runs on 20 to 30 percent of internal links. Partial-match variations (“our Ethiopian roast”) run on 30 to 40 percent. Branded anchors (the SKU name) run on 20 to 30 percent. Generic anchors (“shop the coffee”) fill the remaining 10 to 20 percent. This ratio holds ranking without triggering the over-optimization penalty that shows up on brands that anchor-text-stuff every internal link with the same exact-match keyword. Cross-reference the linking layer on our food and beverage web design page.
Link equity from ingredient guides to SKU pages
Link equity from ingredient guides passes to SKU pages when the guide’s comparison table names the hero SKU in the winning column with a product card, and when the guide’s body links to 3 to 6 recipes that use the winning ingredient. This 3-hop path (guide to recipe to SKU) pushes authority from a high-traffic informational query down to a high-intent transactional page. According to Search Engine Land SEO coverage, informational content that internally links to transactional pages produces 2 to 4 times higher organic revenue than isolated content silos.
Wrapping up content marketing for food brands
Content marketing for food brands is the organic engine that turns a DTC snack, drink, or CPG storefront into a search-driven revenue channel. Recipe hub of 40 to 100 recipes. Ingredient comparison guides at 12 to 24 pieces. Sourcing story pages at 6 to 12 pieces. Buyer intent content at 8 to 16 pieces. Creator syndication calendar with 12 to 30 creators per quarter. Refresh cadence at 12 to 24 months by pillar. Reporting with organic sessions and organic revenue attribution.
If your DTC food brand is running paid social at 20,000 dollars monthly with a broken blog and zero recipe schema, professional content marketing for food brands pays for itself inside the first 90 days on organic traffic captured. Redefine Web ships content marketing inside our monthly retainer packages. Book a call and we will walk through the last three DTC food brands we built recipe hubs for, pillar by pillar.
Content marketing for food brands starts with a recipe hub because recipe queries account for 40 to 60 percent of high-intent search volume in the food category. Every hero SKU needs 4 to 12 recipes anchored to it, each targeting a specific occasion and audience.
Skip the recipe hub and the brand loses the search real estate that pulls DTC storefront traffic month over month at zero incremental paid cost. Recipe traffic converts at 2 to 4 percent because the shopper landed with usage intent, not passive discovery, which is why food brands win on recipes.
Recipe schema and Google rich result eligibility
Every recipe page ships schema.org Recipe markup including cookTime, prepTime, recipeIngredient, recipeInstructions, nutrition, and aggregateRating. Correctly marked-up recipes qualify for Google’s recipe rich result carousel that pulls 3 to 6 times higher click-through rate than a plain blue link. The schema layer takes 15 minutes per recipe to author and 30 minutes to validate in Google Search Console. Cross-reference the recipe search stack on our food and beverage SEO page.
Recipe hub structure that scales
The recipe hub structure runs 40 to 100 recipes at maturity, organized by hero SKU (4 to 12 recipes per SKU) plus occasion tags (breakfast, weeknight dinner, meal prep, brunch, holiday). Every recipe links back to the hero SKU product page with the SKU embedded in an inline card. The hub earns internal linking value from ingredient comparison guides and the sourcing story pages, which feeds recipe ranking on Google. According to Google Search Central recipe structured data guidance, complete Recipe schema markup is required for eligibility in the recipe carousel and the ingredient search filter.
Pillar structure for food brand content marketing
The pillar structure on content marketing for food brands runs 4 content pillars concurrently: recipe hub (40 to 100 recipes), ingredient comparison guides (12 to 24 guides), sourcing story pages (6 to 12 pages), and buyer intent content (where to buy, subscription vs. one-time, gift bundle guides). Every pillar covers a distinct search intent and every pillar links back to the hero SKU product pages.
Ingredient comparison guide format
Ingredient comparison guides run 1,800 to 3,200 words comparing 2 to 4 ingredient types on 6 to 10 attributes with a comparison table, real-world use case examples, and links to the hero SKU that uses the specific ingredient. Example: organic vs. conventional oats compares nutritional profile, sourcing chain, cost, environmental impact, and taste on a 6-column table. The brand’s SKU appears in the winning column with a product card. These guides rank 3 to 8 months after publication and pull steady-state organic traffic.
Sourcing story pages that build trust
Sourcing story pages name the specific farms, cooperatives, or suppliers the brand sources from, with photos of the farms, farmer quotes, and specific harvest windows. A coffee brand’s Ethiopian farm page ranks for “single-origin Ethiopian coffee” and “Yirgacheffe coffee origin” plus 40 long-tail variations. The sourcing page pulls trust-building traffic that converts at 4 to 6 percent because the shopper landed pattern-matching on transparency and named provenance. Every sourcing page includes farmer or cooperative quotes, harvest dates, and a link back to 3 to 5 hero SKU pages that source from the named supplier.
Vejrø hospitality content case study
Vejrø Resort, a Danish private-island destination with an on-site restaurant focused on organic, locally sourced cuisine, joined us with strong social engagement and no organic-search real estate. Guests found the resort on Instagram but never in Google search for terms like “private island resort Denmark,” “farm-to-table hospitality Denmark,” or “Vejrø restaurant.” The same organic-search gap shows up on DTC food brands running paid social at 20,000 dollars monthly with a broken blog and zero recipe schema.
We built the conversion-focused website with on-site and off-site SEO tuned to the travel-niche keyword clusters, competitor analysis against comparable boutique resorts, and mobile-first design prioritizing guest discovery. Every page carried the structured data qualifying it for Google’s rich results in the hospitality category. Every internal link pushed authority toward the direct-booking conversion path.
Three months later, Vejrø hit 10,000 plus organic visitors, ranked for 200 plus first-page keywords, and pulled a 2.2 percent booking conversion rate from organic traffic. The same pattern applies to content marketing for food brands: recipe schema, ingredient comparison guides, and sourcing story pages pull organic traffic at 20 to 40 percent conversion into hero SKU pages inside 6 months when the content quality matches search intent and every page carries the right structured data markup. Vejrø also proved out the reporting discipline: every monthly report named the exact page, the exact keyword cluster, and the exact search feature (rich result, sitelinks, image pack) driving the incremental organic revenue instead of hiding behind aggregate traffic charts.
Recipe cadence and content calendar for food brands
Recipe cadence on a working food brand content calendar ships 2 to 4 new recipes per week during the first 6 months and drops to 1 per week at maturity. Each recipe takes 4 to 6 hours to produce (write, test in the kitchen, photograph, schema author, publish). At 3 recipes per week, the brand hits 78 recipes inside 6 months plus a backlog of ingredient comparison and sourcing content queued behind the recipe production line.
| Content pillar | Target volume year 1 | Production cost per piece | Refresh cadence |
|---|---|---|---|
| Recipe hub | 40 to 100 recipes | $180 to $320 | Every 12 months |
| Ingredient comparison guides | 12 to 24 guides | $450 to $780 | Every 18 months |
| Sourcing story pages | 6 to 12 pages | $680 to $1,200 | Every 24 months |
| Buyer intent content | 8 to 16 pieces | $220 to $420 | Every 12 months |
Photography as a content calendar constraint
Photography is the actual constraint on recipe cadence, not writing. Every recipe needs 6 to 12 photos: hero shot, ingredient flat lay, prep in progress, plated result, storage, and step shots for the schema markup. A working food brand batches photography 8 recipes at a time to keep the cost per recipe under 200 dollars. Skip the batching and the per-recipe cost climbs to 400 to 600 dollars, which caps recipe cadence at 1 per week and slows organic ranking timeline by 6 months.
Seasonal content calendar planning
Seasonal content calendar planning maps recipes and comparison guides to the seasonal windows they need to rank in. A Christmas cookie recipe needs to publish in September to rank by early December. A Valentine’s chocolate guide needs to publish in November to rank by early February. A back-to-school lunchbox recipe needs to publish in June to rank by late August. The 60-to-90-day ranking curve dictates the calendar.
Creator syndication inside food brand content
Creator syndication on food brand content marketing amplifies the recipe hub through Instagram Reels, TikTok, and YouTube Shorts creators paid to post their own version of the brand’s hero recipes. The creator content pulls net-new audiences into the recipe hub through the creator’s Link in Bio or Amazon Storefront tag. The syndication calendar names 12 to 30 creators per quarter with specific recipes assigned to each.
One brand we picked up had a spreadsheet titled “creator outreach 2023” with 47 rows and 3 responses. All 3 responses were auto-replies. The spreadsheet named zero recipes and offered flat rates below 100 dollars per post. Nobody posts a 30-second video for 87 dollars flat. Nobody.
Creator content commercial terms that work
Working creator content commercial terms run 350 to 1,500 dollars flat per post plus a 12 to 25 percent commission on tagged sales across a 30-day window. The commission mechanic pulls creators into follow-up posts because the incremental revenue continues past the initial fee. Mid-tier creators (30k to 150k followers) hit the sweet spot for food brand content because their engagement rate typically runs 4 to 8 percent versus 0.8 to 1.6 percent on mega-creators.
Content brief structure for creator partnerships
The content brief structure for creator partnerships runs a single page: the SKU, the specific recipe or usage occasion, 3 required brand mentions, 3 restricted claims (no health claims on non-medical SKUs), the pricing angle, the affiliate link, and 3 example videos that hit the tone. The brief avoids over-scripting because over-scripted creator content underperforms native creator voice by 40 to 60 percent on engagement rate.
Buyer intent content for food brand blogs
Buyer intent content on food brand blogs covers 8 to 16 pieces targeting explicit purchase-decision queries: “where to buy [brand],” “[brand] subscription vs. one-time,” “best [category] for [use case],” and “[brand] gift bundle.” Every buyer intent piece runs 1,400 to 2,400 words with a comparison table, product cards, and a clear conversion path to the specific SKU that matches the query intent. Buyer intent content converts at 3 to 6 percent versus 1 to 2 percent on recipe content because the shopper landed already planning to buy, not exploring a usage occasion.
Where-to-buy content structure
Where-to-buy content structure covers online (DTC storefront, Amazon, Target.com, Whole Foods online), retail (specific chain locators with the store finder embedded), and international (customs limitations, retailer partners abroad). Every piece names specific retailers, links to the store locator, and includes an FAQ block covering shipping availability, subscription options, and gift card compatibility. Where-to-buy content ranks for branded discovery queries the DTC storefront otherwise loses to competitor affiliate reviews.
Subscription versus one-time comparison content
Subscription versus one-time comparison content converts subscription commitments at 3 to 6 percent because it addresses the price-sensitivity concern head-on with a specific math table. The piece covers the discount structure (15 percent lifetime), the skip-a-month mechanic, the pause-anytime rule, the cancellation policy, and the specific yearly savings for the brand’s average consumption cadence. Cross-reference the retention structure on our food and beverage marketing retainer page.
Content refresh cadence on food brand pillars
Content refresh cadence on food brand content pillars runs a rolling audit every 12 to 24 months by pillar. Recipes get refreshed every 12 months with new photography, updated schema, and any nutrition or ingredient adjustments. Ingredient comparison guides refresh every 18 months to update market data. Sourcing story pages refresh every 24 months to reflect farm partnership changes and new harvest angles. Buyer intent content refreshes every 12 months to update retailer availability and pricing.
Recipe refresh priority order
Recipe refresh priority runs by organic traffic rank. The top 20 recipes by monthly organic sessions get refreshed first (new photography, schema audit, related recipe internal links, updated nutrition). The next 40 get refreshed at 15 months. The remaining recipes get refreshed opportunistically when the ranking slips past position 15 in Google. Skipping the refresh cadence lets recipe rankings drift out of the top 3 inside 18 months as newer competitor recipes take the position.
Schema audit checklist per refresh
The schema audit checklist per refresh runs 8 items: Recipe schema completeness, aggregateRating count and accuracy, nutrition data accuracy, prepTime and cookTime match the recipe body, image URLs valid at CDN, related recipe internal links working, product card SKU URL live, and Google Search Console rich result eligibility validated. This checklist takes 20 minutes per recipe and prevents the schema drift that costs recipe rankings 20 to 40 positions quietly.
Reporting cadence for food brand content marketing
Reporting cadence on food brand content marketing runs a monthly executive report plus a quarterly business review. The monthly report ships in the first business week and covers organic sessions by pillar, top 10 ranking recipes with position trend, ingredient guide ranking movements, sourcing page performance, and organic-attributed DTC revenue. Every number carries a comparison to the prior month and a plain-language interpretation the founder reads in 7 minutes.
Metrics that matter for content marketing
Metrics that matter for food brand content marketing: organic sessions by pillar, recipe rich result impressions in Search Console, organic conversion rate to hero SKU pages, organic-attributed DTC revenue, and top 20 ranking positions by monthly organic sessions. Vanity metrics that do not matter: total pageviews without conversion context, average time on page without conversion attribution, and social share counts. The monthly report skips the vanity block entirely.
Quarterly business review structure
The quarterly business review runs 90 minutes with the founder, head of content, and SEO lead. Agenda: organic traffic trend by pillar, top 10 winning content pieces, top 10 losing content pieces (candidates for refresh or removal), competitive gap analysis against 5 named competitor brands, and next quarter’s content calendar with recipes and ingredient guides queued. According to Ahrefs content marketing research, brands running quarterly content audits outperform brands running annual audits by 40 to 70 percent on organic revenue over a 24-month window.
Internal linking discipline across food brand content
Internal linking discipline across food brand content moves authority from recipe pages toward hero SKU product pages and comparison guides. Every recipe links to the hero SKU it uses inline (once in the ingredient list, once in a bottom call-out card). Every ingredient comparison guide links to 3 to 6 recipes using the winning ingredient plus the hero SKU product page. Every sourcing story links to the 2 to 4 SKUs sourced from that specific farm or cooperative.
Anchor text strategy across recipe hubs
Anchor text on internal links varies across recipe hubs to avoid over-optimization patterns Google penalizes. Exact-match anchor (“single-origin Ethiopian coffee”) runs on 20 to 30 percent of internal links. Partial-match variations (“our Ethiopian roast”) run on 30 to 40 percent. Branded anchors (the SKU name) run on 20 to 30 percent. Generic anchors (“shop the coffee”) fill the remaining 10 to 20 percent. This ratio holds ranking without triggering the over-optimization penalty that shows up on brands that anchor-text-stuff every internal link with the same exact-match keyword. Cross-reference the linking layer on our food and beverage web design page.
Link equity from ingredient guides to SKU pages
Link equity from ingredient guides passes to SKU pages when the guide’s comparison table names the hero SKU in the winning column with a product card, and when the guide’s body links to 3 to 6 recipes that use the winning ingredient. This 3-hop path (guide to recipe to SKU) pushes authority from a high-traffic informational query down to a high-intent transactional page. According to Search Engine Land SEO coverage, informational content that internally links to transactional pages produces 2 to 4 times higher organic revenue than isolated content silos.
Wrapping up content marketing for food brands
Content marketing for food brands is the organic engine that turns a DTC snack, drink, or CPG storefront into a search-driven revenue channel. Recipe hub of 40 to 100 recipes. Ingredient comparison guides at 12 to 24 pieces. Sourcing story pages at 6 to 12 pieces. Buyer intent content at 8 to 16 pieces. Creator syndication calendar with 12 to 30 creators per quarter. Refresh cadence at 12 to 24 months by pillar. Reporting with organic sessions and organic revenue attribution.
If your DTC food brand is running paid social at 20,000 dollars monthly with a broken blog and zero recipe schema, professional content marketing for food brands pays for itself inside the first 90 days on organic traffic captured. Redefine Web ships content marketing inside our monthly retainer packages. Book a call and we will walk through the last three DTC food brands we built recipe hubs for, pillar by pillar.
Content marketing for food brands starts with a recipe hub because recipe queries account for 40 to 60 percent of high-intent search volume in the food category. Every hero SKU needs 4 to 12 recipes anchored to it, each targeting a specific occasion and audience.
Skip the recipe hub and the brand loses the search real estate that pulls DTC storefront traffic month over month at zero incremental paid cost. Recipe traffic converts at 2 to 4 percent because the shopper landed with usage intent, not passive discovery, which is why food brands win on recipes.
Recipe schema and Google rich result eligibility
Every recipe page ships schema.org Recipe markup including cookTime, prepTime, recipeIngredient, recipeInstructions, nutrition, and aggregateRating. Correctly marked-up recipes qualify for Google’s recipe rich result carousel that pulls 3 to 6 times higher click-through rate than a plain blue link. The schema layer takes 15 minutes per recipe to author and 30 minutes to validate in Google Search Console. Cross-reference the recipe search stack on our food and beverage SEO page.
Recipe hub structure that scales
The recipe hub structure runs 40 to 100 recipes at maturity, organized by hero SKU (4 to 12 recipes per SKU) plus occasion tags (breakfast, weeknight dinner, meal prep, brunch, holiday). Every recipe links back to the hero SKU product page with the SKU embedded in an inline card. The hub earns internal linking value from ingredient comparison guides and the sourcing story pages, which feeds recipe ranking on Google. According to Google Search Central recipe structured data guidance, complete Recipe schema markup is required for eligibility in the recipe carousel and the ingredient search filter.
Pillar structure for food brand content marketing
The pillar structure on content marketing for food brands runs 4 content pillars concurrently: recipe hub (40 to 100 recipes), ingredient comparison guides (12 to 24 guides), sourcing story pages (6 to 12 pages), and buyer intent content (where to buy, subscription vs. one-time, gift bundle guides). Every pillar covers a distinct search intent and every pillar links back to the hero SKU product pages.
Ingredient comparison guide format
Ingredient comparison guides run 1,800 to 3,200 words comparing 2 to 4 ingredient types on 6 to 10 attributes with a comparison table, real-world use case examples, and links to the hero SKU that uses the specific ingredient. Example: organic vs. conventional oats compares nutritional profile, sourcing chain, cost, environmental impact, and taste on a 6-column table. The brand’s SKU appears in the winning column with a product card. These guides rank 3 to 8 months after publication and pull steady-state organic traffic.
Sourcing story pages that build trust
Sourcing story pages name the specific farms, cooperatives, or suppliers the brand sources from, with photos of the farms, farmer quotes, and specific harvest windows. A coffee brand’s Ethiopian farm page ranks for “single-origin Ethiopian coffee” and “Yirgacheffe coffee origin” plus 40 long-tail variations. The sourcing page pulls trust-building traffic that converts at 4 to 6 percent because the shopper landed pattern-matching on transparency and named provenance. Every sourcing page includes farmer or cooperative quotes, harvest dates, and a link back to 3 to 5 hero SKU pages that source from the named supplier.
Vejrø hospitality content case study
Vejrø Resort, a Danish private-island destination with an on-site restaurant focused on organic, locally sourced cuisine, joined us with strong social engagement and no organic-search real estate. Guests found the resort on Instagram but never in Google search for terms like “private island resort Denmark,” “farm-to-table hospitality Denmark,” or “Vejrø restaurant.” The same organic-search gap shows up on DTC food brands running paid social at 20,000 dollars monthly with a broken blog and zero recipe schema.
We built the conversion-focused website with on-site and off-site SEO tuned to the travel-niche keyword clusters, competitor analysis against comparable boutique resorts, and mobile-first design prioritizing guest discovery. Every page carried the structured data qualifying it for Google’s rich results in the hospitality category. Every internal link pushed authority toward the direct-booking conversion path.
Three months later, Vejrø hit 10,000 plus organic visitors, ranked for 200 plus first-page keywords, and pulled a 2.2 percent booking conversion rate from organic traffic. The same pattern applies to content marketing for food brands: recipe schema, ingredient comparison guides, and sourcing story pages pull organic traffic at 20 to 40 percent conversion into hero SKU pages inside 6 months when the content quality matches search intent and every page carries the right structured data markup. Vejrø also proved out the reporting discipline: every monthly report named the exact page, the exact keyword cluster, and the exact search feature (rich result, sitelinks, image pack) driving the incremental organic revenue instead of hiding behind aggregate traffic charts.
Recipe cadence and content calendar for food brands
Recipe cadence on a working food brand content calendar ships 2 to 4 new recipes per week during the first 6 months and drops to 1 per week at maturity. Each recipe takes 4 to 6 hours to produce (write, test in the kitchen, photograph, schema author, publish). At 3 recipes per week, the brand hits 78 recipes inside 6 months plus a backlog of ingredient comparison and sourcing content queued behind the recipe production line.
| Content pillar | Target volume year 1 | Production cost per piece | Refresh cadence |
|---|---|---|---|
| Recipe hub | 40 to 100 recipes | $180 to $320 | Every 12 months |
| Ingredient comparison guides | 12 to 24 guides | $450 to $780 | Every 18 months |
| Sourcing story pages | 6 to 12 pages | $680 to $1,200 | Every 24 months |
| Buyer intent content | 8 to 16 pieces | $220 to $420 | Every 12 months |
Photography as a content calendar constraint
Photography is the actual constraint on recipe cadence, not writing. Every recipe needs 6 to 12 photos: hero shot, ingredient flat lay, prep in progress, plated result, storage, and step shots for the schema markup. A working food brand batches photography 8 recipes at a time to keep the cost per recipe under 200 dollars. Skip the batching and the per-recipe cost climbs to 400 to 600 dollars, which caps recipe cadence at 1 per week and slows organic ranking timeline by 6 months.
Seasonal content calendar planning
Seasonal content calendar planning maps recipes and comparison guides to the seasonal windows they need to rank in. A Christmas cookie recipe needs to publish in September to rank by early December. A Valentine’s chocolate guide needs to publish in November to rank by early February. A back-to-school lunchbox recipe needs to publish in June to rank by late August. The 60-to-90-day ranking curve dictates the calendar.
Creator syndication inside food brand content
Creator syndication on food brand content marketing amplifies the recipe hub through Instagram Reels, TikTok, and YouTube Shorts creators paid to post their own version of the brand’s hero recipes. The creator content pulls net-new audiences into the recipe hub through the creator’s Link in Bio or Amazon Storefront tag. The syndication calendar names 12 to 30 creators per quarter with specific recipes assigned to each.
One brand we picked up had a spreadsheet titled “creator outreach 2023” with 47 rows and 3 responses. All 3 responses were auto-replies. The spreadsheet named zero recipes and offered flat rates below 100 dollars per post. Nobody posts a 30-second video for 87 dollars flat. Nobody.
Creator content commercial terms that work
Working creator content commercial terms run 350 to 1,500 dollars flat per post plus a 12 to 25 percent commission on tagged sales across a 30-day window. The commission mechanic pulls creators into follow-up posts because the incremental revenue continues past the initial fee. Mid-tier creators (30k to 150k followers) hit the sweet spot for food brand content because their engagement rate typically runs 4 to 8 percent versus 0.8 to 1.6 percent on mega-creators.
Content brief structure for creator partnerships
The content brief structure for creator partnerships runs a single page: the SKU, the specific recipe or usage occasion, 3 required brand mentions, 3 restricted claims (no health claims on non-medical SKUs), the pricing angle, the affiliate link, and 3 example videos that hit the tone. The brief avoids over-scripting because over-scripted creator content underperforms native creator voice by 40 to 60 percent on engagement rate.
Buyer intent content for food brand blogs
Buyer intent content on food brand blogs covers 8 to 16 pieces targeting explicit purchase-decision queries: “where to buy [brand],” “[brand] subscription vs. one-time,” “best [category] for [use case],” and “[brand] gift bundle.” Every buyer intent piece runs 1,400 to 2,400 words with a comparison table, product cards, and a clear conversion path to the specific SKU that matches the query intent. Buyer intent content converts at 3 to 6 percent versus 1 to 2 percent on recipe content because the shopper landed already planning to buy, not exploring a usage occasion.
Where-to-buy content structure
Where-to-buy content structure covers online (DTC storefront, Amazon, Target.com, Whole Foods online), retail (specific chain locators with the store finder embedded), and international (customs limitations, retailer partners abroad). Every piece names specific retailers, links to the store locator, and includes an FAQ block covering shipping availability, subscription options, and gift card compatibility. Where-to-buy content ranks for branded discovery queries the DTC storefront otherwise loses to competitor affiliate reviews.
Subscription versus one-time comparison content
Subscription versus one-time comparison content converts subscription commitments at 3 to 6 percent because it addresses the price-sensitivity concern head-on with a specific math table. The piece covers the discount structure (15 percent lifetime), the skip-a-month mechanic, the pause-anytime rule, the cancellation policy, and the specific yearly savings for the brand’s average consumption cadence. Cross-reference the retention structure on our food and beverage marketing retainer page.
Content refresh cadence on food brand pillars
Content refresh cadence on food brand content pillars runs a rolling audit every 12 to 24 months by pillar. Recipes get refreshed every 12 months with new photography, updated schema, and any nutrition or ingredient adjustments. Ingredient comparison guides refresh every 18 months to update market data. Sourcing story pages refresh every 24 months to reflect farm partnership changes and new harvest angles. Buyer intent content refreshes every 12 months to update retailer availability and pricing.
Recipe refresh priority order
Recipe refresh priority runs by organic traffic rank. The top 20 recipes by monthly organic sessions get refreshed first (new photography, schema audit, related recipe internal links, updated nutrition). The next 40 get refreshed at 15 months. The remaining recipes get refreshed opportunistically when the ranking slips past position 15 in Google. Skipping the refresh cadence lets recipe rankings drift out of the top 3 inside 18 months as newer competitor recipes take the position.
Schema audit checklist per refresh
The schema audit checklist per refresh runs 8 items: Recipe schema completeness, aggregateRating count and accuracy, nutrition data accuracy, prepTime and cookTime match the recipe body, image URLs valid at CDN, related recipe internal links working, product card SKU URL live, and Google Search Console rich result eligibility validated. This checklist takes 20 minutes per recipe and prevents the schema drift that costs recipe rankings 20 to 40 positions quietly.
Reporting cadence for food brand content marketing
Reporting cadence on food brand content marketing runs a monthly executive report plus a quarterly business review. The monthly report ships in the first business week and covers organic sessions by pillar, top 10 ranking recipes with position trend, ingredient guide ranking movements, sourcing page performance, and organic-attributed DTC revenue. Every number carries a comparison to the prior month and a plain-language interpretation the founder reads in 7 minutes.
Metrics that matter for content marketing
Metrics that matter for food brand content marketing: organic sessions by pillar, recipe rich result impressions in Search Console, organic conversion rate to hero SKU pages, organic-attributed DTC revenue, and top 20 ranking positions by monthly organic sessions. Vanity metrics that do not matter: total pageviews without conversion context, average time on page without conversion attribution, and social share counts. The monthly report skips the vanity block entirely.
Quarterly business review structure
The quarterly business review runs 90 minutes with the founder, head of content, and SEO lead. Agenda: organic traffic trend by pillar, top 10 winning content pieces, top 10 losing content pieces (candidates for refresh or removal), competitive gap analysis against 5 named competitor brands, and next quarter’s content calendar with recipes and ingredient guides queued. According to Ahrefs content marketing research, brands running quarterly content audits outperform brands running annual audits by 40 to 70 percent on organic revenue over a 24-month window.
Internal linking discipline across food brand content
Internal linking discipline across food brand content moves authority from recipe pages toward hero SKU product pages and comparison guides. Every recipe links to the hero SKU it uses inline (once in the ingredient list, once in a bottom call-out card). Every ingredient comparison guide links to 3 to 6 recipes using the winning ingredient plus the hero SKU product page. Every sourcing story links to the 2 to 4 SKUs sourced from that specific farm or cooperative.
Anchor text strategy across recipe hubs
Anchor text on internal links varies across recipe hubs to avoid over-optimization patterns Google penalizes. Exact-match anchor (“single-origin Ethiopian coffee”) runs on 20 to 30 percent of internal links. Partial-match variations (“our Ethiopian roast”) run on 30 to 40 percent. Branded anchors (the SKU name) run on 20 to 30 percent. Generic anchors (“shop the coffee”) fill the remaining 10 to 20 percent. This ratio holds ranking without triggering the over-optimization penalty that shows up on brands that anchor-text-stuff every internal link with the same exact-match keyword. Cross-reference the linking layer on our food and beverage web design page.
Link equity from ingredient guides to SKU pages
Link equity from ingredient guides passes to SKU pages when the guide’s comparison table names the hero SKU in the winning column with a product card, and when the guide’s body links to 3 to 6 recipes that use the winning ingredient. This 3-hop path (guide to recipe to SKU) pushes authority from a high-traffic informational query down to a high-intent transactional page. According to Search Engine Land SEO coverage, informational content that internally links to transactional pages produces 2 to 4 times higher organic revenue than isolated content silos.
Wrapping up content marketing for food brands
Content marketing for food brands is the organic engine that turns a DTC snack, drink, or CPG storefront into a search-driven revenue channel. Recipe hub of 40 to 100 recipes. Ingredient comparison guides at 12 to 24 pieces. Sourcing story pages at 6 to 12 pieces. Buyer intent content at 8 to 16 pieces. Creator syndication calendar with 12 to 30 creators per quarter. Refresh cadence at 12 to 24 months by pillar. Reporting with organic sessions and organic revenue attribution.
If your DTC food brand is running paid social at 20,000 dollars monthly with a broken blog and zero recipe schema, professional content marketing for food brands pays for itself inside the first 90 days on organic traffic captured. Redefine Web ships content marketing inside our monthly retainer packages. Book a call and we will walk through the last three DTC food brands we built recipe hubs for, pillar by pillar.
Anchor text on internal links varies across recipe hubs to avoid over-optimization patterns Google penalizes. Exact-match anchor (“single-origin Ethiopian coffee”) runs on 20 to 30 percent of internal links. Partial-match variations (“our Ethiopian roast”) run on 30 to 40 percent. Branded anchors (the SKU name) run on 20 to 30 percent. Generic anchors (“shop the coffee”) fill the remaining 10 to 20 percent. This ratio holds ranking without triggering the over-optimization penalty that shows up on brands that anchor-text-stuff every internal link with the same exact-match keyword. Cross-reference the linking layer on our food and beverage web design page.
Link equity from ingredient guides to SKU pages
Link equity from ingredient guides passes to SKU pages when the guide’s comparison table names the hero SKU in the winning column with a product card, and when the guide’s body links to 3 to 6 recipes that use the winning ingredient. This 3-hop path (guide to recipe to SKU) pushes authority from a high-traffic informational query down to a high-intent transactional page. According to Search Engine Land SEO coverage, informational content that internally links to transactional pages produces 2 to 4 times higher organic revenue than isolated content silos.
Wrapping up content marketing for food brands
Content marketing for food brands is the organic engine that turns a DTC snack, drink, or CPG storefront into a search-driven revenue channel. Recipe hub of 40 to 100 recipes. Ingredient comparison guides at 12 to 24 pieces. Sourcing story pages at 6 to 12 pieces. Buyer intent content at 8 to 16 pieces. Creator syndication calendar with 12 to 30 creators per quarter. Refresh cadence at 12 to 24 months by pillar. Reporting with organic sessions and organic revenue attribution.
If your DTC food brand is running paid social at 20,000 dollars monthly with a broken blog and zero recipe schema, professional content marketing for food brands pays for itself inside the first 90 days on organic traffic captured. Redefine Web ships content marketing inside our monthly retainer packages. Book a call and we will walk through the last three DTC food brands we built recipe hubs for, pillar by pillar.
Internal linking discipline across food brand content moves authority from recipe pages toward hero SKU product pages and comparison guides. Every recipe links to the hero SKU it uses inline (once in the ingredient list, once in a bottom call-out card). Every ingredient comparison guide links to 3 to 6 recipes using the winning ingredient plus the hero SKU product page. Every sourcing story links to the 2 to 4 SKUs sourced from that specific farm or cooperative.
Anchor text strategy across recipe hubs
Anchor text on internal links varies across recipe hubs to avoid over-optimization patterns Google penalizes. Exact-match anchor (“single-origin Ethiopian coffee”) runs on 20 to 30 percent of internal links. Partial-match variations (“our Ethiopian roast”) run on 30 to 40 percent. Branded anchors (the SKU name) run on 20 to 30 percent. Generic anchors (“shop the coffee”) fill the remaining 10 to 20 percent. This ratio holds ranking without triggering the over-optimization penalty that shows up on brands that anchor-text-stuff every internal link with the same exact-match keyword. Cross-reference the linking layer on our food and beverage web design page.
Link equity from ingredient guides to SKU pages
Link equity from ingredient guides passes to SKU pages when the guide’s comparison table names the hero SKU in the winning column with a product card, and when the guide’s body links to 3 to 6 recipes that use the winning ingredient. This 3-hop path (guide to recipe to SKU) pushes authority from a high-traffic informational query down to a high-intent transactional page. According to Search Engine Land SEO coverage, informational content that internally links to transactional pages produces 2 to 4 times higher organic revenue than isolated content silos.
Wrapping up content marketing for food brands
Content marketing for food brands is the organic engine that turns a DTC snack, drink, or CPG storefront into a search-driven revenue channel. Recipe hub of 40 to 100 recipes. Ingredient comparison guides at 12 to 24 pieces. Sourcing story pages at 6 to 12 pieces. Buyer intent content at 8 to 16 pieces. Creator syndication calendar with 12 to 30 creators per quarter. Refresh cadence at 12 to 24 months by pillar. Reporting with organic sessions and organic revenue attribution.
If your DTC food brand is running paid social at 20,000 dollars monthly with a broken blog and zero recipe schema, professional content marketing for food brands pays for itself inside the first 90 days on organic traffic captured. Redefine Web ships content marketing inside our monthly retainer packages. Book a call and we will walk through the last three DTC food brands we built recipe hubs for, pillar by pillar.
Content marketing for food brands starts with a recipe hub because recipe queries account for 40 to 60 percent of high-intent search volume in the food category. Every hero SKU needs 4 to 12 recipes anchored to it, each targeting a specific occasion and audience.
Skip the recipe hub and the brand loses the search real estate that pulls DTC storefront traffic month over month at zero incremental paid cost. Recipe traffic converts at 2 to 4 percent because the shopper landed with usage intent, not passive discovery, which is why food brands win on recipes.
Recipe schema and Google rich result eligibility
Every recipe page ships schema.org Recipe markup including cookTime, prepTime, recipeIngredient, recipeInstructions, nutrition, and aggregateRating. Correctly marked-up recipes qualify for Google’s recipe rich result carousel that pulls 3 to 6 times higher click-through rate than a plain blue link. The schema layer takes 15 minutes per recipe to author and 30 minutes to validate in Google Search Console. Cross-reference the recipe search stack on our food and beverage SEO page.
Recipe hub structure that scales
The recipe hub structure runs 40 to 100 recipes at maturity, organized by hero SKU (4 to 12 recipes per SKU) plus occasion tags (breakfast, weeknight dinner, meal prep, brunch, holiday). Every recipe links back to the hero SKU product page with the SKU embedded in an inline card. The hub earns internal linking value from ingredient comparison guides and the sourcing story pages, which feeds recipe ranking on Google. According to Google Search Central recipe structured data guidance, complete Recipe schema markup is required for eligibility in the recipe carousel and the ingredient search filter.
Pillar structure for food brand content marketing
The pillar structure on content marketing for food brands runs 4 content pillars concurrently: recipe hub (40 to 100 recipes), ingredient comparison guides (12 to 24 guides), sourcing story pages (6 to 12 pages), and buyer intent content (where to buy, subscription vs. one-time, gift bundle guides). Every pillar covers a distinct search intent and every pillar links back to the hero SKU product pages.
Ingredient comparison guide format
Ingredient comparison guides run 1,800 to 3,200 words comparing 2 to 4 ingredient types on 6 to 10 attributes with a comparison table, real-world use case examples, and links to the hero SKU that uses the specific ingredient. Example: organic vs. conventional oats compares nutritional profile, sourcing chain, cost, environmental impact, and taste on a 6-column table. The brand’s SKU appears in the winning column with a product card. These guides rank 3 to 8 months after publication and pull steady-state organic traffic.
Sourcing story pages that build trust
Sourcing story pages name the specific farms, cooperatives, or suppliers the brand sources from, with photos of the farms, farmer quotes, and specific harvest windows. A coffee brand’s Ethiopian farm page ranks for “single-origin Ethiopian coffee” and “Yirgacheffe coffee origin” plus 40 long-tail variations. The sourcing page pulls trust-building traffic that converts at 4 to 6 percent because the shopper landed pattern-matching on transparency and named provenance. Every sourcing page includes farmer or cooperative quotes, harvest dates, and a link back to 3 to 5 hero SKU pages that source from the named supplier.
Vejrø hospitality content case study
Vejrø Resort, a Danish private-island destination with an on-site restaurant focused on organic, locally sourced cuisine, joined us with strong social engagement and no organic-search real estate. Guests found the resort on Instagram but never in Google search for terms like “private island resort Denmark,” “farm-to-table hospitality Denmark,” or “Vejrø restaurant.” The same organic-search gap shows up on DTC food brands running paid social at 20,000 dollars monthly with a broken blog and zero recipe schema.
We built the conversion-focused website with on-site and off-site SEO tuned to the travel-niche keyword clusters, competitor analysis against comparable boutique resorts, and mobile-first design prioritizing guest discovery. Every page carried the structured data qualifying it for Google’s rich results in the hospitality category. Every internal link pushed authority toward the direct-booking conversion path.
Three months later, Vejrø hit 10,000 plus organic visitors, ranked for 200 plus first-page keywords, and pulled a 2.2 percent booking conversion rate from organic traffic. The same pattern applies to content marketing for food brands: recipe schema, ingredient comparison guides, and sourcing story pages pull organic traffic at 20 to 40 percent conversion into hero SKU pages inside 6 months when the content quality matches search intent and every page carries the right structured data markup. Vejrø also proved out the reporting discipline: every monthly report named the exact page, the exact keyword cluster, and the exact search feature (rich result, sitelinks, image pack) driving the incremental organic revenue instead of hiding behind aggregate traffic charts.
Recipe cadence and content calendar for food brands
Recipe cadence on a working food brand content calendar ships 2 to 4 new recipes per week during the first 6 months and drops to 1 per week at maturity. Each recipe takes 4 to 6 hours to produce (write, test in the kitchen, photograph, schema author, publish). At 3 recipes per week, the brand hits 78 recipes inside 6 months plus a backlog of ingredient comparison and sourcing content queued behind the recipe production line.
| Content pillar | Target volume year 1 | Production cost per piece | Refresh cadence |
|---|---|---|---|
| Recipe hub | 40 to 100 recipes | $180 to $320 | Every 12 months |
| Ingredient comparison guides | 12 to 24 guides | $450 to $780 | Every 18 months |
| Sourcing story pages | 6 to 12 pages | $680 to $1,200 | Every 24 months |
| Buyer intent content | 8 to 16 pieces | $220 to $420 | Every 12 months |
Photography as a content calendar constraint
Photography is the actual constraint on recipe cadence, not writing. Every recipe needs 6 to 12 photos: hero shot, ingredient flat lay, prep in progress, plated result, storage, and step shots for the schema markup. A working food brand batches photography 8 recipes at a time to keep the cost per recipe under 200 dollars. Skip the batching and the per-recipe cost climbs to 400 to 600 dollars, which caps recipe cadence at 1 per week and slows organic ranking timeline by 6 months.
Seasonal content calendar planning
Seasonal content calendar planning maps recipes and comparison guides to the seasonal windows they need to rank in. A Christmas cookie recipe needs to publish in September to rank by early December. A Valentine’s chocolate guide needs to publish in November to rank by early February. A back-to-school lunchbox recipe needs to publish in June to rank by late August. The 60-to-90-day ranking curve dictates the calendar.
Creator syndication inside food brand content
Creator syndication on food brand content marketing amplifies the recipe hub through Instagram Reels, TikTok, and YouTube Shorts creators paid to post their own version of the brand’s hero recipes. The creator content pulls net-new audiences into the recipe hub through the creator’s Link in Bio or Amazon Storefront tag. The syndication calendar names 12 to 30 creators per quarter with specific recipes assigned to each.
One brand we picked up had a spreadsheet titled “creator outreach 2023” with 47 rows and 3 responses. All 3 responses were auto-replies. The spreadsheet named zero recipes and offered flat rates below 100 dollars per post. Nobody posts a 30-second video for 87 dollars flat. Nobody.
Creator content commercial terms that work
Working creator content commercial terms run 350 to 1,500 dollars flat per post plus a 12 to 25 percent commission on tagged sales across a 30-day window. The commission mechanic pulls creators into follow-up posts because the incremental revenue continues past the initial fee. Mid-tier creators (30k to 150k followers) hit the sweet spot for food brand content because their engagement rate typically runs 4 to 8 percent versus 0.8 to 1.6 percent on mega-creators.
Content brief structure for creator partnerships
The content brief structure for creator partnerships runs a single page: the SKU, the specific recipe or usage occasion, 3 required brand mentions, 3 restricted claims (no health claims on non-medical SKUs), the pricing angle, the affiliate link, and 3 example videos that hit the tone. The brief avoids over-scripting because over-scripted creator content underperforms native creator voice by 40 to 60 percent on engagement rate.
Buyer intent content for food brand blogs
Buyer intent content on food brand blogs covers 8 to 16 pieces targeting explicit purchase-decision queries: “where to buy [brand],” “[brand] subscription vs. one-time,” “best [category] for [use case],” and “[brand] gift bundle.” Every buyer intent piece runs 1,400 to 2,400 words with a comparison table, product cards, and a clear conversion path to the specific SKU that matches the query intent. Buyer intent content converts at 3 to 6 percent versus 1 to 2 percent on recipe content because the shopper landed already planning to buy, not exploring a usage occasion.
Where-to-buy content structure
Where-to-buy content structure covers online (DTC storefront, Amazon, Target.com, Whole Foods online), retail (specific chain locators with the store finder embedded), and international (customs limitations, retailer partners abroad). Every piece names specific retailers, links to the store locator, and includes an FAQ block covering shipping availability, subscription options, and gift card compatibility. Where-to-buy content ranks for branded discovery queries the DTC storefront otherwise loses to competitor affiliate reviews.
Subscription versus one-time comparison content
Subscription versus one-time comparison content converts subscription commitments at 3 to 6 percent because it addresses the price-sensitivity concern head-on with a specific math table. The piece covers the discount structure (15 percent lifetime), the skip-a-month mechanic, the pause-anytime rule, the cancellation policy, and the specific yearly savings for the brand’s average consumption cadence. Cross-reference the retention structure on our food and beverage marketing retainer page.
Content refresh cadence on food brand pillars
Content refresh cadence on food brand content pillars runs a rolling audit every 12 to 24 months by pillar. Recipes get refreshed every 12 months with new photography, updated schema, and any nutrition or ingredient adjustments. Ingredient comparison guides refresh every 18 months to update market data. Sourcing story pages refresh every 24 months to reflect farm partnership changes and new harvest angles. Buyer intent content refreshes every 12 months to update retailer availability and pricing.
Recipe refresh priority order
Recipe refresh priority runs by organic traffic rank. The top 20 recipes by monthly organic sessions get refreshed first (new photography, schema audit, related recipe internal links, updated nutrition). The next 40 get refreshed at 15 months. The remaining recipes get refreshed opportunistically when the ranking slips past position 15 in Google. Skipping the refresh cadence lets recipe rankings drift out of the top 3 inside 18 months as newer competitor recipes take the position.
Schema audit checklist per refresh
The schema audit checklist per refresh runs 8 items: Recipe schema completeness, aggregateRating count and accuracy, nutrition data accuracy, prepTime and cookTime match the recipe body, image URLs valid at CDN, related recipe internal links working, product card SKU URL live, and Google Search Console rich result eligibility validated. This checklist takes 20 minutes per recipe and prevents the schema drift that costs recipe rankings 20 to 40 positions quietly.
Reporting cadence for food brand content marketing
Reporting cadence on food brand content marketing runs a monthly executive report plus a quarterly business review. The monthly report ships in the first business week and covers organic sessions by pillar, top 10 ranking recipes with position trend, ingredient guide ranking movements, sourcing page performance, and organic-attributed DTC revenue. Every number carries a comparison to the prior month and a plain-language interpretation the founder reads in 7 minutes.
Metrics that matter for content marketing
Metrics that matter for food brand content marketing: organic sessions by pillar, recipe rich result impressions in Search Console, organic conversion rate to hero SKU pages, organic-attributed DTC revenue, and top 20 ranking positions by monthly organic sessions. Vanity metrics that do not matter: total pageviews without conversion context, average time on page without conversion attribution, and social share counts. The monthly report skips the vanity block entirely.
Quarterly business review structure
The quarterly business review runs 90 minutes with the founder, head of content, and SEO lead. Agenda: organic traffic trend by pillar, top 10 winning content pieces, top 10 losing content pieces (candidates for refresh or removal), competitive gap analysis against 5 named competitor brands, and next quarter’s content calendar with recipes and ingredient guides queued. According to Ahrefs content marketing research, brands running quarterly content audits outperform brands running annual audits by 40 to 70 percent on organic revenue over a 24-month window.
Internal linking discipline across food brand content
Internal linking discipline across food brand content moves authority from recipe pages toward hero SKU product pages and comparison guides. Every recipe links to the hero SKU it uses inline (once in the ingredient list, once in a bottom call-out card). Every ingredient comparison guide links to 3 to 6 recipes using the winning ingredient plus the hero SKU product page. Every sourcing story links to the 2 to 4 SKUs sourced from that specific farm or cooperative.
Anchor text strategy across recipe hubs
Anchor text on internal links varies across recipe hubs to avoid over-optimization patterns Google penalizes. Exact-match anchor (“single-origin Ethiopian coffee”) runs on 20 to 30 percent of internal links. Partial-match variations (“our Ethiopian roast”) run on 30 to 40 percent. Branded anchors (the SKU name) run on 20 to 30 percent. Generic anchors (“shop the coffee”) fill the remaining 10 to 20 percent. This ratio holds ranking without triggering the over-optimization penalty that shows up on brands that anchor-text-stuff every internal link with the same exact-match keyword. Cross-reference the linking layer on our food and beverage web design page.
Link equity from ingredient guides to SKU pages
Link equity from ingredient guides passes to SKU pages when the guide’s comparison table names the hero SKU in the winning column with a product card, and when the guide’s body links to 3 to 6 recipes that use the winning ingredient. This 3-hop path (guide to recipe to SKU) pushes authority from a high-traffic informational query down to a high-intent transactional page. According to Search Engine Land SEO coverage, informational content that internally links to transactional pages produces 2 to 4 times higher organic revenue than isolated content silos.
Wrapping up content marketing for food brands
Content marketing for food brands is the organic engine that turns a DTC snack, drink, or CPG storefront into a search-driven revenue channel. Recipe hub of 40 to 100 recipes. Ingredient comparison guides at 12 to 24 pieces. Sourcing story pages at 6 to 12 pieces. Buyer intent content at 8 to 16 pieces. Creator syndication calendar with 12 to 30 creators per quarter. Refresh cadence at 12 to 24 months by pillar. Reporting with organic sessions and organic revenue attribution.
If your DTC food brand is running paid social at 20,000 dollars monthly with a broken blog and zero recipe schema, professional content marketing for food brands pays for itself inside the first 90 days on organic traffic captured. Redefine Web ships content marketing inside our monthly retainer packages. Book a call and we will walk through the last three DTC food brands we built recipe hubs for, pillar by pillar.
Content marketing for food brands starts with a recipe hub because recipe queries account for 40 to 60 percent of high-intent search volume in the food category. Every hero SKU needs 4 to 12 recipes anchored to it, each targeting a specific occasion and audience.
Skip the recipe hub and the brand loses the search real estate that pulls DTC storefront traffic month over month at zero incremental paid cost. Recipe traffic converts at 2 to 4 percent because the shopper landed with usage intent, not passive discovery, which is why food brands win on recipes.
Recipe schema and Google rich result eligibility
Every recipe page ships schema.org Recipe markup including cookTime, prepTime, recipeIngredient, recipeInstructions, nutrition, and aggregateRating. Correctly marked-up recipes qualify for Google’s recipe rich result carousel that pulls 3 to 6 times higher click-through rate than a plain blue link. The schema layer takes 15 minutes per recipe to author and 30 minutes to validate in Google Search Console. Cross-reference the recipe search stack on our food and beverage SEO page.
Recipe hub structure that scales
The recipe hub structure runs 40 to 100 recipes at maturity, organized by hero SKU (4 to 12 recipes per SKU) plus occasion tags (breakfast, weeknight dinner, meal prep, brunch, holiday). Every recipe links back to the hero SKU product page with the SKU embedded in an inline card. The hub earns internal linking value from ingredient comparison guides and the sourcing story pages, which feeds recipe ranking on Google. According to Google Search Central recipe structured data guidance, complete Recipe schema markup is required for eligibility in the recipe carousel and the ingredient search filter.
Pillar structure for food brand content marketing
The pillar structure on content marketing for food brands runs 4 content pillars concurrently: recipe hub (40 to 100 recipes), ingredient comparison guides (12 to 24 guides), sourcing story pages (6 to 12 pages), and buyer intent content (where to buy, subscription vs. one-time, gift bundle guides). Every pillar covers a distinct search intent and every pillar links back to the hero SKU product pages.
Ingredient comparison guide format
Ingredient comparison guides run 1,800 to 3,200 words comparing 2 to 4 ingredient types on 6 to 10 attributes with a comparison table, real-world use case examples, and links to the hero SKU that uses the specific ingredient. Example: organic vs. conventional oats compares nutritional profile, sourcing chain, cost, environmental impact, and taste on a 6-column table. The brand’s SKU appears in the winning column with a product card. These guides rank 3 to 8 months after publication and pull steady-state organic traffic.
Sourcing story pages that build trust
Sourcing story pages name the specific farms, cooperatives, or suppliers the brand sources from, with photos of the farms, farmer quotes, and specific harvest windows. A coffee brand’s Ethiopian farm page ranks for “single-origin Ethiopian coffee” and “Yirgacheffe coffee origin” plus 40 long-tail variations. The sourcing page pulls trust-building traffic that converts at 4 to 6 percent because the shopper landed pattern-matching on transparency and named provenance. Every sourcing page includes farmer or cooperative quotes, harvest dates, and a link back to 3 to 5 hero SKU pages that source from the named supplier.
Vejrø hospitality content case study
Vejrø Resort, a Danish private-island destination with an on-site restaurant focused on organic, locally sourced cuisine, joined us with strong social engagement and no organic-search real estate. Guests found the resort on Instagram but never in Google search for terms like “private island resort Denmark,” “farm-to-table hospitality Denmark,” or “Vejrø restaurant.” The same organic-search gap shows up on DTC food brands running paid social at 20,000 dollars monthly with a broken blog and zero recipe schema.
We built the conversion-focused website with on-site and off-site SEO tuned to the travel-niche keyword clusters, competitor analysis against comparable boutique resorts, and mobile-first design prioritizing guest discovery. Every page carried the structured data qualifying it for Google’s rich results in the hospitality category. Every internal link pushed authority toward the direct-booking conversion path.
Three months later, Vejrø hit 10,000 plus organic visitors, ranked for 200 plus first-page keywords, and pulled a 2.2 percent booking conversion rate from organic traffic. The same pattern applies to content marketing for food brands: recipe schema, ingredient comparison guides, and sourcing story pages pull organic traffic at 20 to 40 percent conversion into hero SKU pages inside 6 months when the content quality matches search intent and every page carries the right structured data markup. Vejrø also proved out the reporting discipline: every monthly report named the exact page, the exact keyword cluster, and the exact search feature (rich result, sitelinks, image pack) driving the incremental organic revenue instead of hiding behind aggregate traffic charts.
Recipe cadence and content calendar for food brands
Recipe cadence on a working food brand content calendar ships 2 to 4 new recipes per week during the first 6 months and drops to 1 per week at maturity. Each recipe takes 4 to 6 hours to produce (write, test in the kitchen, photograph, schema author, publish). At 3 recipes per week, the brand hits 78 recipes inside 6 months plus a backlog of ingredient comparison and sourcing content queued behind the recipe production line.
| Content pillar | Target volume year 1 | Production cost per piece | Refresh cadence |
|---|---|---|---|
| Recipe hub | 40 to 100 recipes | $180 to $320 | Every 12 months |
| Ingredient comparison guides | 12 to 24 guides | $450 to $780 | Every 18 months |
| Sourcing story pages | 6 to 12 pages | $680 to $1,200 | Every 24 months |
| Buyer intent content | 8 to 16 pieces | $220 to $420 | Every 12 months |
Photography as a content calendar constraint
Photography is the actual constraint on recipe cadence, not writing. Every recipe needs 6 to 12 photos: hero shot, ingredient flat lay, prep in progress, plated result, storage, and step shots for the schema markup. A working food brand batches photography 8 recipes at a time to keep the cost per recipe under 200 dollars. Skip the batching and the per-recipe cost climbs to 400 to 600 dollars, which caps recipe cadence at 1 per week and slows organic ranking timeline by 6 months.
Seasonal content calendar planning
Seasonal content calendar planning maps recipes and comparison guides to the seasonal windows they need to rank in. A Christmas cookie recipe needs to publish in September to rank by early December. A Valentine’s chocolate guide needs to publish in November to rank by early February. A back-to-school lunchbox recipe needs to publish in June to rank by late August. The 60-to-90-day ranking curve dictates the calendar.
Creator syndication inside food brand content
Creator syndication on food brand content marketing amplifies the recipe hub through Instagram Reels, TikTok, and YouTube Shorts creators paid to post their own version of the brand’s hero recipes. The creator content pulls net-new audiences into the recipe hub through the creator’s Link in Bio or Amazon Storefront tag. The syndication calendar names 12 to 30 creators per quarter with specific recipes assigned to each.
One brand we picked up had a spreadsheet titled “creator outreach 2023” with 47 rows and 3 responses. All 3 responses were auto-replies. The spreadsheet named zero recipes and offered flat rates below 100 dollars per post. Nobody posts a 30-second video for 87 dollars flat. Nobody.
Creator content commercial terms that work
Working creator content commercial terms run 350 to 1,500 dollars flat per post plus a 12 to 25 percent commission on tagged sales across a 30-day window. The commission mechanic pulls creators into follow-up posts because the incremental revenue continues past the initial fee. Mid-tier creators (30k to 150k followers) hit the sweet spot for food brand content because their engagement rate typically runs 4 to 8 percent versus 0.8 to 1.6 percent on mega-creators.
Content brief structure for creator partnerships
The content brief structure for creator partnerships runs a single page: the SKU, the specific recipe or usage occasion, 3 required brand mentions, 3 restricted claims (no health claims on non-medical SKUs), the pricing angle, the affiliate link, and 3 example videos that hit the tone. The brief avoids over-scripting because over-scripted creator content underperforms native creator voice by 40 to 60 percent on engagement rate.
Buyer intent content for food brand blogs
Buyer intent content on food brand blogs covers 8 to 16 pieces targeting explicit purchase-decision queries: “where to buy [brand],” “[brand] subscription vs. one-time,” “best [category] for [use case],” and “[brand] gift bundle.” Every buyer intent piece runs 1,400 to 2,400 words with a comparison table, product cards, and a clear conversion path to the specific SKU that matches the query intent. Buyer intent content converts at 3 to 6 percent versus 1 to 2 percent on recipe content because the shopper landed already planning to buy, not exploring a usage occasion.
Where-to-buy content structure
Where-to-buy content structure covers online (DTC storefront, Amazon, Target.com, Whole Foods online), retail (specific chain locators with the store finder embedded), and international (customs limitations, retailer partners abroad). Every piece names specific retailers, links to the store locator, and includes an FAQ block covering shipping availability, subscription options, and gift card compatibility. Where-to-buy content ranks for branded discovery queries the DTC storefront otherwise loses to competitor affiliate reviews.
Subscription versus one-time comparison content
Subscription versus one-time comparison content converts subscription commitments at 3 to 6 percent because it addresses the price-sensitivity concern head-on with a specific math table. The piece covers the discount structure (15 percent lifetime), the skip-a-month mechanic, the pause-anytime rule, the cancellation policy, and the specific yearly savings for the brand’s average consumption cadence. Cross-reference the retention structure on our food and beverage marketing retainer page.
Content refresh cadence on food brand pillars
Content refresh cadence on food brand content pillars runs a rolling audit every 12 to 24 months by pillar. Recipes get refreshed every 12 months with new photography, updated schema, and any nutrition or ingredient adjustments. Ingredient comparison guides refresh every 18 months to update market data. Sourcing story pages refresh every 24 months to reflect farm partnership changes and new harvest angles. Buyer intent content refreshes every 12 months to update retailer availability and pricing.
Recipe refresh priority order
Recipe refresh priority runs by organic traffic rank. The top 20 recipes by monthly organic sessions get refreshed first (new photography, schema audit, related recipe internal links, updated nutrition). The next 40 get refreshed at 15 months. The remaining recipes get refreshed opportunistically when the ranking slips past position 15 in Google. Skipping the refresh cadence lets recipe rankings drift out of the top 3 inside 18 months as newer competitor recipes take the position.
Schema audit checklist per refresh
The schema audit checklist per refresh runs 8 items: Recipe schema completeness, aggregateRating count and accuracy, nutrition data accuracy, prepTime and cookTime match the recipe body, image URLs valid at CDN, related recipe internal links working, product card SKU URL live, and Google Search Console rich result eligibility validated. This checklist takes 20 minutes per recipe and prevents the schema drift that costs recipe rankings 20 to 40 positions quietly.
Reporting cadence for food brand content marketing
Reporting cadence on food brand content marketing runs a monthly executive report plus a quarterly business review. The monthly report ships in the first business week and covers organic sessions by pillar, top 10 ranking recipes with position trend, ingredient guide ranking movements, sourcing page performance, and organic-attributed DTC revenue. Every number carries a comparison to the prior month and a plain-language interpretation the founder reads in 7 minutes.
Metrics that matter for content marketing
Metrics that matter for food brand content marketing: organic sessions by pillar, recipe rich result impressions in Search Console, organic conversion rate to hero SKU pages, organic-attributed DTC revenue, and top 20 ranking positions by monthly organic sessions. Vanity metrics that do not matter: total pageviews without conversion context, average time on page without conversion attribution, and social share counts. The monthly report skips the vanity block entirely.
Quarterly business review structure
The quarterly business review runs 90 minutes with the founder, head of content, and SEO lead. Agenda: organic traffic trend by pillar, top 10 winning content pieces, top 10 losing content pieces (candidates for refresh or removal), competitive gap analysis against 5 named competitor brands, and next quarter’s content calendar with recipes and ingredient guides queued. According to Ahrefs content marketing research, brands running quarterly content audits outperform brands running annual audits by 40 to 70 percent on organic revenue over a 24-month window.
Internal linking discipline across food brand content
Internal linking discipline across food brand content moves authority from recipe pages toward hero SKU product pages and comparison guides. Every recipe links to the hero SKU it uses inline (once in the ingredient list, once in a bottom call-out card). Every ingredient comparison guide links to 3 to 6 recipes using the winning ingredient plus the hero SKU product page. Every sourcing story links to the 2 to 4 SKUs sourced from that specific farm or cooperative.
Anchor text strategy across recipe hubs
Anchor text on internal links varies across recipe hubs to avoid over-optimization patterns Google penalizes. Exact-match anchor (“single-origin Ethiopian coffee”) runs on 20 to 30 percent of internal links. Partial-match variations (“our Ethiopian roast”) run on 30 to 40 percent. Branded anchors (the SKU name) run on 20 to 30 percent. Generic anchors (“shop the coffee”) fill the remaining 10 to 20 percent. This ratio holds ranking without triggering the over-optimization penalty that shows up on brands that anchor-text-stuff every internal link with the same exact-match keyword. Cross-reference the linking layer on our food and beverage web design page.
Link equity from ingredient guides to SKU pages
Link equity from ingredient guides passes to SKU pages when the guide’s comparison table names the hero SKU in the winning column with a product card, and when the guide’s body links to 3 to 6 recipes that use the winning ingredient. This 3-hop path (guide to recipe to SKU) pushes authority from a high-traffic informational query down to a high-intent transactional page. According to Search Engine Land SEO coverage, informational content that internally links to transactional pages produces 2 to 4 times higher organic revenue than isolated content silos.
Wrapping up content marketing for food brands
Content marketing for food brands is the organic engine that turns a DTC snack, drink, or CPG storefront into a search-driven revenue channel. Recipe hub of 40 to 100 recipes. Ingredient comparison guides at 12 to 24 pieces. Sourcing story pages at 6 to 12 pieces. Buyer intent content at 8 to 16 pieces. Creator syndication calendar with 12 to 30 creators per quarter. Refresh cadence at 12 to 24 months by pillar. Reporting with organic sessions and organic revenue attribution.
If your DTC food brand is running paid social at 20,000 dollars monthly with a broken blog and zero recipe schema, professional content marketing for food brands pays for itself inside the first 90 days on organic traffic captured. Redefine Web ships content marketing inside our monthly retainer packages. Book a call and we will walk through the last three DTC food brands we built recipe hubs for, pillar by pillar.
Internal linking discipline across food brand content moves authority from recipe pages toward hero SKU product pages and comparison guides. Every recipe links to the hero SKU it uses inline (once in the ingredient list, once in a bottom call-out card). Every ingredient comparison guide links to 3 to 6 recipes using the winning ingredient plus the hero SKU product page. Every sourcing story links to the 2 to 4 SKUs sourced from that specific farm or cooperative.
Anchor text strategy across recipe hubs
Anchor text on internal links varies across recipe hubs to avoid over-optimization patterns Google penalizes. Exact-match anchor (“single-origin Ethiopian coffee”) runs on 20 to 30 percent of internal links. Partial-match variations (“our Ethiopian roast”) run on 30 to 40 percent. Branded anchors (the SKU name) run on 20 to 30 percent. Generic anchors (“shop the coffee”) fill the remaining 10 to 20 percent. This ratio holds ranking without triggering the over-optimization penalty that shows up on brands that anchor-text-stuff every internal link with the same exact-match keyword. Cross-reference the linking layer on our food and beverage web design page.
Link equity from ingredient guides to SKU pages
Link equity from ingredient guides passes to SKU pages when the guide’s comparison table names the hero SKU in the winning column with a product card, and when the guide’s body links to 3 to 6 recipes that use the winning ingredient. This 3-hop path (guide to recipe to SKU) pushes authority from a high-traffic informational query down to a high-intent transactional page. According to Search Engine Land SEO coverage, informational content that internally links to transactional pages produces 2 to 4 times higher organic revenue than isolated content silos.
Wrapping up content marketing for food brands
Content marketing for food brands is the organic engine that turns a DTC snack, drink, or CPG storefront into a search-driven revenue channel. Recipe hub of 40 to 100 recipes. Ingredient comparison guides at 12 to 24 pieces. Sourcing story pages at 6 to 12 pieces. Buyer intent content at 8 to 16 pieces. Creator syndication calendar with 12 to 30 creators per quarter. Refresh cadence at 12 to 24 months by pillar. Reporting with organic sessions and organic revenue attribution.
If your DTC food brand is running paid social at 20,000 dollars monthly with a broken blog and zero recipe schema, professional content marketing for food brands pays for itself inside the first 90 days on organic traffic captured. Redefine Web ships content marketing inside our monthly retainer packages. Book a call and we will walk through the last three DTC food brands we built recipe hubs for, pillar by pillar.
Anchor text on internal links varies across recipe hubs to avoid over-optimization patterns Google penalizes. Exact-match anchor (“single-origin Ethiopian coffee”) runs on 20 to 30 percent of internal links. Partial-match variations (“our Ethiopian roast”) run on 30 to 40 percent. Branded anchors (the SKU name) run on 20 to 30 percent. Generic anchors (“shop the coffee”) fill the remaining 10 to 20 percent. This ratio holds ranking without triggering the over-optimization penalty that shows up on brands that anchor-text-stuff every internal link with the same exact-match keyword. Cross-reference the linking layer on our food and beverage web design page.
Link equity from ingredient guides to SKU pages
Link equity from ingredient guides passes to SKU pages when the guide’s comparison table names the hero SKU in the winning column with a product card, and when the guide’s body links to 3 to 6 recipes that use the winning ingredient. This 3-hop path (guide to recipe to SKU) pushes authority from a high-traffic informational query down to a high-intent transactional page. According to Search Engine Land SEO coverage, informational content that internally links to transactional pages produces 2 to 4 times higher organic revenue than isolated content silos.
Wrapping up content marketing for food brands
Content marketing for food brands is the organic engine that turns a DTC snack, drink, or CPG storefront into a search-driven revenue channel. Recipe hub of 40 to 100 recipes. Ingredient comparison guides at 12 to 24 pieces. Sourcing story pages at 6 to 12 pieces. Buyer intent content at 8 to 16 pieces. Creator syndication calendar with 12 to 30 creators per quarter. Refresh cadence at 12 to 24 months by pillar. Reporting with organic sessions and organic revenue attribution.
If your DTC food brand is running paid social at 20,000 dollars monthly with a broken blog and zero recipe schema, professional content marketing for food brands pays for itself inside the first 90 days on organic traffic captured. Redefine Web ships content marketing inside our monthly retainer packages. Book a call and we will walk through the last three DTC food brands we built recipe hubs for, pillar by pillar.
Content marketing for food brands starts with a recipe hub because recipe queries account for 40 to 60 percent of high-intent search volume in the food category. Every hero SKU needs 4 to 12 recipes anchored to it, each targeting a specific occasion and audience.
Skip the recipe hub and the brand loses the search real estate that pulls DTC storefront traffic month over month at zero incremental paid cost. Recipe traffic converts at 2 to 4 percent because the shopper landed with usage intent, not passive discovery, which is why food brands win on recipes.
Recipe schema and Google rich result eligibility
Every recipe page ships schema.org Recipe markup including cookTime, prepTime, recipeIngredient, recipeInstructions, nutrition, and aggregateRating. Correctly marked-up recipes qualify for Google’s recipe rich result carousel that pulls 3 to 6 times higher click-through rate than a plain blue link. The schema layer takes 15 minutes per recipe to author and 30 minutes to validate in Google Search Console. Cross-reference the recipe search stack on our food and beverage SEO page.
Recipe hub structure that scales
The recipe hub structure runs 40 to 100 recipes at maturity, organized by hero SKU (4 to 12 recipes per SKU) plus occasion tags (breakfast, weeknight dinner, meal prep, brunch, holiday). Every recipe links back to the hero SKU product page with the SKU embedded in an inline card. The hub earns internal linking value from ingredient comparison guides and the sourcing story pages, which feeds recipe ranking on Google. According to Google Search Central recipe structured data guidance, complete Recipe schema markup is required for eligibility in the recipe carousel and the ingredient search filter.
Pillar structure for food brand content marketing
The pillar structure on content marketing for food brands runs 4 content pillars concurrently: recipe hub (40 to 100 recipes), ingredient comparison guides (12 to 24 guides), sourcing story pages (6 to 12 pages), and buyer intent content (where to buy, subscription vs. one-time, gift bundle guides). Every pillar covers a distinct search intent and every pillar links back to the hero SKU product pages.
Ingredient comparison guide format
Ingredient comparison guides run 1,800 to 3,200 words comparing 2 to 4 ingredient types on 6 to 10 attributes with a comparison table, real-world use case examples, and links to the hero SKU that uses the specific ingredient. Example: organic vs. conventional oats compares nutritional profile, sourcing chain, cost, environmental impact, and taste on a 6-column table. The brand’s SKU appears in the winning column with a product card. These guides rank 3 to 8 months after publication and pull steady-state organic traffic.
Sourcing story pages that build trust
Sourcing story pages name the specific farms, cooperatives, or suppliers the brand sources from, with photos of the farms, farmer quotes, and specific harvest windows. A coffee brand’s Ethiopian farm page ranks for “single-origin Ethiopian coffee” and “Yirgacheffe coffee origin” plus 40 long-tail variations. The sourcing page pulls trust-building traffic that converts at 4 to 6 percent because the shopper landed pattern-matching on transparency and named provenance. Every sourcing page includes farmer or cooperative quotes, harvest dates, and a link back to 3 to 5 hero SKU pages that source from the named supplier.
Vejrø hospitality content case study
Vejrø Resort, a Danish private-island destination with an on-site restaurant focused on organic, locally sourced cuisine, joined us with strong social engagement and no organic-search real estate. Guests found the resort on Instagram but never in Google search for terms like “private island resort Denmark,” “farm-to-table hospitality Denmark,” or “Vejrø restaurant.” The same organic-search gap shows up on DTC food brands running paid social at 20,000 dollars monthly with a broken blog and zero recipe schema.
We built the conversion-focused website with on-site and off-site SEO tuned to the travel-niche keyword clusters, competitor analysis against comparable boutique resorts, and mobile-first design prioritizing guest discovery. Every page carried the structured data qualifying it for Google’s rich results in the hospitality category. Every internal link pushed authority toward the direct-booking conversion path.
Three months later, Vejrø hit 10,000 plus organic visitors, ranked for 200 plus first-page keywords, and pulled a 2.2 percent booking conversion rate from organic traffic. The same pattern applies to content marketing for food brands: recipe schema, ingredient comparison guides, and sourcing story pages pull organic traffic at 20 to 40 percent conversion into hero SKU pages inside 6 months when the content quality matches search intent and every page carries the right structured data markup. Vejrø also proved out the reporting discipline: every monthly report named the exact page, the exact keyword cluster, and the exact search feature (rich result, sitelinks, image pack) driving the incremental organic revenue instead of hiding behind aggregate traffic charts.
Recipe cadence and content calendar for food brands
Recipe cadence on a working food brand content calendar ships 2 to 4 new recipes per week during the first 6 months and drops to 1 per week at maturity. Each recipe takes 4 to 6 hours to produce (write, test in the kitchen, photograph, schema author, publish). At 3 recipes per week, the brand hits 78 recipes inside 6 months plus a backlog of ingredient comparison and sourcing content queued behind the recipe production line.
| Content pillar | Target volume year 1 | Production cost per piece | Refresh cadence |
|---|---|---|---|
| Recipe hub | 40 to 100 recipes | $180 to $320 | Every 12 months |
| Ingredient comparison guides | 12 to 24 guides | $450 to $780 | Every 18 months |
| Sourcing story pages | 6 to 12 pages | $680 to $1,200 | Every 24 months |
| Buyer intent content | 8 to 16 pieces | $220 to $420 | Every 12 months |
Photography as a content calendar constraint
Photography is the actual constraint on recipe cadence, not writing. Every recipe needs 6 to 12 photos: hero shot, ingredient flat lay, prep in progress, plated result, storage, and step shots for the schema markup. A working food brand batches photography 8 recipes at a time to keep the cost per recipe under 200 dollars. Skip the batching and the per-recipe cost climbs to 400 to 600 dollars, which caps recipe cadence at 1 per week and slows organic ranking timeline by 6 months.
Seasonal content calendar planning
Seasonal content calendar planning maps recipes and comparison guides to the seasonal windows they need to rank in. A Christmas cookie recipe needs to publish in September to rank by early December. A Valentine’s chocolate guide needs to publish in November to rank by early February. A back-to-school lunchbox recipe needs to publish in June to rank by late August. The 60-to-90-day ranking curve dictates the calendar.
Creator syndication inside food brand content
Creator syndication on food brand content marketing amplifies the recipe hub through Instagram Reels, TikTok, and YouTube Shorts creators paid to post their own version of the brand’s hero recipes. The creator content pulls net-new audiences into the recipe hub through the creator’s Link in Bio or Amazon Storefront tag. The syndication calendar names 12 to 30 creators per quarter with specific recipes assigned to each.
One brand we picked up had a spreadsheet titled “creator outreach 2023” with 47 rows and 3 responses. All 3 responses were auto-replies. The spreadsheet named zero recipes and offered flat rates below 100 dollars per post. Nobody posts a 30-second video for 87 dollars flat. Nobody.
Creator content commercial terms that work
Working creator content commercial terms run 350 to 1,500 dollars flat per post plus a 12 to 25 percent commission on tagged sales across a 30-day window. The commission mechanic pulls creators into follow-up posts because the incremental revenue continues past the initial fee. Mid-tier creators (30k to 150k followers) hit the sweet spot for food brand content because their engagement rate typically runs 4 to 8 percent versus 0.8 to 1.6 percent on mega-creators.
Content brief structure for creator partnerships
The content brief structure for creator partnerships runs a single page: the SKU, the specific recipe or usage occasion, 3 required brand mentions, 3 restricted claims (no health claims on non-medical SKUs), the pricing angle, the affiliate link, and 3 example videos that hit the tone. The brief avoids over-scripting because over-scripted creator content underperforms native creator voice by 40 to 60 percent on engagement rate.
Buyer intent content for food brand blogs
Buyer intent content on food brand blogs covers 8 to 16 pieces targeting explicit purchase-decision queries: “where to buy [brand],” “[brand] subscription vs. one-time,” “best [category] for [use case],” and “[brand] gift bundle.” Every buyer intent piece runs 1,400 to 2,400 words with a comparison table, product cards, and a clear conversion path to the specific SKU that matches the query intent. Buyer intent content converts at 3 to 6 percent versus 1 to 2 percent on recipe content because the shopper landed already planning to buy, not exploring a usage occasion.
Where-to-buy content structure
Where-to-buy content structure covers online (DTC storefront, Amazon, Target.com, Whole Foods online), retail (specific chain locators with the store finder embedded), and international (customs limitations, retailer partners abroad). Every piece names specific retailers, links to the store locator, and includes an FAQ block covering shipping availability, subscription options, and gift card compatibility. Where-to-buy content ranks for branded discovery queries the DTC storefront otherwise loses to competitor affiliate reviews.
Subscription versus one-time comparison content
Subscription versus one-time comparison content converts subscription commitments at 3 to 6 percent because it addresses the price-sensitivity concern head-on with a specific math table. The piece covers the discount structure (15 percent lifetime), the skip-a-month mechanic, the pause-anytime rule, the cancellation policy, and the specific yearly savings for the brand’s average consumption cadence. Cross-reference the retention structure on our food and beverage marketing retainer page.
Content refresh cadence on food brand pillars
Content refresh cadence on food brand content pillars runs a rolling audit every 12 to 24 months by pillar. Recipes get refreshed every 12 months with new photography, updated schema, and any nutrition or ingredient adjustments. Ingredient comparison guides refresh every 18 months to update market data. Sourcing story pages refresh every 24 months to reflect farm partnership changes and new harvest angles. Buyer intent content refreshes every 12 months to update retailer availability and pricing.
Recipe refresh priority order
Recipe refresh priority runs by organic traffic rank. The top 20 recipes by monthly organic sessions get refreshed first (new photography, schema audit, related recipe internal links, updated nutrition). The next 40 get refreshed at 15 months. The remaining recipes get refreshed opportunistically when the ranking slips past position 15 in Google. Skipping the refresh cadence lets recipe rankings drift out of the top 3 inside 18 months as newer competitor recipes take the position.
Schema audit checklist per refresh
The schema audit checklist per refresh runs 8 items: Recipe schema completeness, aggregateRating count and accuracy, nutrition data accuracy, prepTime and cookTime match the recipe body, image URLs valid at CDN, related recipe internal links working, product card SKU URL live, and Google Search Console rich result eligibility validated. This checklist takes 20 minutes per recipe and prevents the schema drift that costs recipe rankings 20 to 40 positions quietly.
Reporting cadence for food brand content marketing
Reporting cadence on food brand content marketing runs a monthly executive report plus a quarterly business review. The monthly report ships in the first business week and covers organic sessions by pillar, top 10 ranking recipes with position trend, ingredient guide ranking movements, sourcing page performance, and organic-attributed DTC revenue. Every number carries a comparison to the prior month and a plain-language interpretation the founder reads in 7 minutes.
Metrics that matter for content marketing
Metrics that matter for food brand content marketing: organic sessions by pillar, recipe rich result impressions in Search Console, organic conversion rate to hero SKU pages, organic-attributed DTC revenue, and top 20 ranking positions by monthly organic sessions. Vanity metrics that do not matter: total pageviews without conversion context, average time on page without conversion attribution, and social share counts. The monthly report skips the vanity block entirely.
Quarterly business review structure
The quarterly business review runs 90 minutes with the founder, head of content, and SEO lead. Agenda: organic traffic trend by pillar, top 10 winning content pieces, top 10 losing content pieces (candidates for refresh or removal), competitive gap analysis against 5 named competitor brands, and next quarter’s content calendar with recipes and ingredient guides queued. According to Ahrefs content marketing research, brands running quarterly content audits outperform brands running annual audits by 40 to 70 percent on organic revenue over a 24-month window.
Internal linking discipline across food brand content
Internal linking discipline across food brand content moves authority from recipe pages toward hero SKU product pages and comparison guides. Every recipe links to the hero SKU it uses inline (once in the ingredient list, once in a bottom call-out card). Every ingredient comparison guide links to 3 to 6 recipes using the winning ingredient plus the hero SKU product page. Every sourcing story links to the 2 to 4 SKUs sourced from that specific farm or cooperative.
Anchor text strategy across recipe hubs
Anchor text on internal links varies across recipe hubs to avoid over-optimization patterns Google penalizes. Exact-match anchor (“single-origin Ethiopian coffee”) runs on 20 to 30 percent of internal links. Partial-match variations (“our Ethiopian roast”) run on 30 to 40 percent. Branded anchors (the SKU name) run on 20 to 30 percent. Generic anchors (“shop the coffee”) fill the remaining 10 to 20 percent. This ratio holds ranking without triggering the over-optimization penalty that shows up on brands that anchor-text-stuff every internal link with the same exact-match keyword. Cross-reference the linking layer on our food and beverage web design page.
Link equity from ingredient guides to SKU pages
Link equity from ingredient guides passes to SKU pages when the guide’s comparison table names the hero SKU in the winning column with a product card, and when the guide’s body links to 3 to 6 recipes that use the winning ingredient. This 3-hop path (guide to recipe to SKU) pushes authority from a high-traffic informational query down to a high-intent transactional page. According to Search Engine Land SEO coverage, informational content that internally links to transactional pages produces 2 to 4 times higher organic revenue than isolated content silos.
Wrapping up content marketing for food brands
Content marketing for food brands is the organic engine that turns a DTC snack, drink, or CPG storefront into a search-driven revenue channel. Recipe hub of 40 to 100 recipes. Ingredient comparison guides at 12 to 24 pieces. Sourcing story pages at 6 to 12 pieces. Buyer intent content at 8 to 16 pieces. Creator syndication calendar with 12 to 30 creators per quarter. Refresh cadence at 12 to 24 months by pillar. Reporting with organic sessions and organic revenue attribution.
If your DTC food brand is running paid social at 20,000 dollars monthly with a broken blog and zero recipe schema, professional content marketing for food brands pays for itself inside the first 90 days on organic traffic captured. Redefine Web ships content marketing inside our monthly retainer packages. Book a call and we will walk through the last three DTC food brands we built recipe hubs for, pillar by pillar.
Internal linking discipline across food brand content moves authority from recipe pages toward hero SKU product pages and comparison guides. Every recipe links to the hero SKU it uses inline (once in the ingredient list, once in a bottom call-out card). Every ingredient comparison guide links to 3 to 6 recipes using the winning ingredient plus the hero SKU product page. Every sourcing story links to the 2 to 4 SKUs sourced from that specific farm or cooperative.
Anchor text strategy across recipe hubs
Anchor text on internal links varies across recipe hubs to avoid over-optimization patterns Google penalizes. Exact-match anchor (“single-origin Ethiopian coffee”) runs on 20 to 30 percent of internal links. Partial-match variations (“our Ethiopian roast”) run on 30 to 40 percent. Branded anchors (the SKU name) run on 20 to 30 percent. Generic anchors (“shop the coffee”) fill the remaining 10 to 20 percent. This ratio holds ranking without triggering the over-optimization penalty that shows up on brands that anchor-text-stuff every internal link with the same exact-match keyword. Cross-reference the linking layer on our food and beverage web design page.
Link equity from ingredient guides to SKU pages
Link equity from ingredient guides passes to SKU pages when the guide’s comparison table names the hero SKU in the winning column with a product card, and when the guide’s body links to 3 to 6 recipes that use the winning ingredient. This 3-hop path (guide to recipe to SKU) pushes authority from a high-traffic informational query down to a high-intent transactional page. According to Search Engine Land SEO coverage, informational content that internally links to transactional pages produces 2 to 4 times higher organic revenue than isolated content silos.
Wrapping up content marketing for food brands
Content marketing for food brands is the organic engine that turns a DTC snack, drink, or CPG storefront into a search-driven revenue channel. Recipe hub of 40 to 100 recipes. Ingredient comparison guides at 12 to 24 pieces. Sourcing story pages at 6 to 12 pieces. Buyer intent content at 8 to 16 pieces. Creator syndication calendar with 12 to 30 creators per quarter. Refresh cadence at 12 to 24 months by pillar. Reporting with organic sessions and organic revenue attribution.
If your DTC food brand is running paid social at 20,000 dollars monthly with a broken blog and zero recipe schema, professional content marketing for food brands pays for itself inside the first 90 days on organic traffic captured. Redefine Web ships content marketing inside our monthly retainer packages. Book a call and we will walk through the last three DTC food brands we built recipe hubs for, pillar by pillar.
Content marketing for food brands starts with a recipe hub because recipe queries account for 40 to 60 percent of high-intent search volume in the food category. Every hero SKU needs 4 to 12 recipes anchored to it, each targeting a specific occasion and audience.
Skip the recipe hub and the brand loses the search real estate that pulls DTC storefront traffic month over month at zero incremental paid cost. Recipe traffic converts at 2 to 4 percent because the shopper landed with usage intent, not passive discovery, which is why food brands win on recipes.
Recipe schema and Google rich result eligibility
Every recipe page ships schema.org Recipe markup including cookTime, prepTime, recipeIngredient, recipeInstructions, nutrition, and aggregateRating. Correctly marked-up recipes qualify for Google’s recipe rich result carousel that pulls 3 to 6 times higher click-through rate than a plain blue link. The schema layer takes 15 minutes per recipe to author and 30 minutes to validate in Google Search Console. Cross-reference the recipe search stack on our food and beverage SEO page.
Recipe hub structure that scales
The recipe hub structure runs 40 to 100 recipes at maturity, organized by hero SKU (4 to 12 recipes per SKU) plus occasion tags (breakfast, weeknight dinner, meal prep, brunch, holiday). Every recipe links back to the hero SKU product page with the SKU embedded in an inline card. The hub earns internal linking value from ingredient comparison guides and the sourcing story pages, which feeds recipe ranking on Google. According to Google Search Central recipe structured data guidance, complete Recipe schema markup is required for eligibility in the recipe carousel and the ingredient search filter.
Pillar structure for food brand content marketing
The pillar structure on content marketing for food brands runs 4 content pillars concurrently: recipe hub (40 to 100 recipes), ingredient comparison guides (12 to 24 guides), sourcing story pages (6 to 12 pages), and buyer intent content (where to buy, subscription vs. one-time, gift bundle guides). Every pillar covers a distinct search intent and every pillar links back to the hero SKU product pages.
Ingredient comparison guide format
Ingredient comparison guides run 1,800 to 3,200 words comparing 2 to 4 ingredient types on 6 to 10 attributes with a comparison table, real-world use case examples, and links to the hero SKU that uses the specific ingredient. Example: organic vs. conventional oats compares nutritional profile, sourcing chain, cost, environmental impact, and taste on a 6-column table. The brand’s SKU appears in the winning column with a product card. These guides rank 3 to 8 months after publication and pull steady-state organic traffic.
Sourcing story pages that build trust
Sourcing story pages name the specific farms, cooperatives, or suppliers the brand sources from, with photos of the farms, farmer quotes, and specific harvest windows. A coffee brand’s Ethiopian farm page ranks for “single-origin Ethiopian coffee” and “Yirgacheffe coffee origin” plus 40 long-tail variations. The sourcing page pulls trust-building traffic that converts at 4 to 6 percent because the shopper landed pattern-matching on transparency and named provenance. Every sourcing page includes farmer or cooperative quotes, harvest dates, and a link back to 3 to 5 hero SKU pages that source from the named supplier.
Vejrø hospitality content case study
Vejrø Resort, a Danish private-island destination with an on-site restaurant focused on organic, locally sourced cuisine, joined us with strong social engagement and no organic-search real estate. Guests found the resort on Instagram but never in Google search for terms like “private island resort Denmark,” “farm-to-table hospitality Denmark,” or “Vejrø restaurant.” The same organic-search gap shows up on DTC food brands running paid social at 20,000 dollars monthly with a broken blog and zero recipe schema.
We built the conversion-focused website with on-site and off-site SEO tuned to the travel-niche keyword clusters, competitor analysis against comparable boutique resorts, and mobile-first design prioritizing guest discovery. Every page carried the structured data qualifying it for Google’s rich results in the hospitality category. Every internal link pushed authority toward the direct-booking conversion path.
Three months later, Vejrø hit 10,000 plus organic visitors, ranked for 200 plus first-page keywords, and pulled a 2.2 percent booking conversion rate from organic traffic. The same pattern applies to content marketing for food brands: recipe schema, ingredient comparison guides, and sourcing story pages pull organic traffic at 20 to 40 percent conversion into hero SKU pages inside 6 months when the content quality matches search intent and every page carries the right structured data markup. Vejrø also proved out the reporting discipline: every monthly report named the exact page, the exact keyword cluster, and the exact search feature (rich result, sitelinks, image pack) driving the incremental organic revenue instead of hiding behind aggregate traffic charts.
Recipe cadence and content calendar for food brands
Recipe cadence on a working food brand content calendar ships 2 to 4 new recipes per week during the first 6 months and drops to 1 per week at maturity. Each recipe takes 4 to 6 hours to produce (write, test in the kitchen, photograph, schema author, publish). At 3 recipes per week, the brand hits 78 recipes inside 6 months plus a backlog of ingredient comparison and sourcing content queued behind the recipe production line.
| Content pillar | Target volume year 1 | Production cost per piece | Refresh cadence |
|---|---|---|---|
| Recipe hub | 40 to 100 recipes | $180 to $320 | Every 12 months |
| Ingredient comparison guides | 12 to 24 guides | $450 to $780 | Every 18 months |
| Sourcing story pages | 6 to 12 pages | $680 to $1,200 | Every 24 months |
| Buyer intent content | 8 to 16 pieces | $220 to $420 | Every 12 months |
Photography as a content calendar constraint
Photography is the actual constraint on recipe cadence, not writing. Every recipe needs 6 to 12 photos: hero shot, ingredient flat lay, prep in progress, plated result, storage, and step shots for the schema markup. A working food brand batches photography 8 recipes at a time to keep the cost per recipe under 200 dollars. Skip the batching and the per-recipe cost climbs to 400 to 600 dollars, which caps recipe cadence at 1 per week and slows organic ranking timeline by 6 months.
Seasonal content calendar planning
Seasonal content calendar planning maps recipes and comparison guides to the seasonal windows they need to rank in. A Christmas cookie recipe needs to publish in September to rank by early December. A Valentine’s chocolate guide needs to publish in November to rank by early February. A back-to-school lunchbox recipe needs to publish in June to rank by late August. The 60-to-90-day ranking curve dictates the calendar.
Creator syndication inside food brand content
Creator syndication on food brand content marketing amplifies the recipe hub through Instagram Reels, TikTok, and YouTube Shorts creators paid to post their own version of the brand’s hero recipes. The creator content pulls net-new audiences into the recipe hub through the creator’s Link in Bio or Amazon Storefront tag. The syndication calendar names 12 to 30 creators per quarter with specific recipes assigned to each.
One brand we picked up had a spreadsheet titled “creator outreach 2023” with 47 rows and 3 responses. All 3 responses were auto-replies. The spreadsheet named zero recipes and offered flat rates below 100 dollars per post. Nobody posts a 30-second video for 87 dollars flat. Nobody.
Creator content commercial terms that work
Working creator content commercial terms run 350 to 1,500 dollars flat per post plus a 12 to 25 percent commission on tagged sales across a 30-day window. The commission mechanic pulls creators into follow-up posts because the incremental revenue continues past the initial fee. Mid-tier creators (30k to 150k followers) hit the sweet spot for food brand content because their engagement rate typically runs 4 to 8 percent versus 0.8 to 1.6 percent on mega-creators.
Content brief structure for creator partnerships
The content brief structure for creator partnerships runs a single page: the SKU, the specific recipe or usage occasion, 3 required brand mentions, 3 restricted claims (no health claims on non-medical SKUs), the pricing angle, the affiliate link, and 3 example videos that hit the tone. The brief avoids over-scripting because over-scripted creator content underperforms native creator voice by 40 to 60 percent on engagement rate.
Buyer intent content for food brand blogs
Buyer intent content on food brand blogs covers 8 to 16 pieces targeting explicit purchase-decision queries: “where to buy [brand],” “[brand] subscription vs. one-time,” “best [category] for [use case],” and “[brand] gift bundle.” Every buyer intent piece runs 1,400 to 2,400 words with a comparison table, product cards, and a clear conversion path to the specific SKU that matches the query intent. Buyer intent content converts at 3 to 6 percent versus 1 to 2 percent on recipe content because the shopper landed already planning to buy, not exploring a usage occasion.
Where-to-buy content structure
Where-to-buy content structure covers online (DTC storefront, Amazon, Target.com, Whole Foods online), retail (specific chain locators with the store finder embedded), and international (customs limitations, retailer partners abroad). Every piece names specific retailers, links to the store locator, and includes an FAQ block covering shipping availability, subscription options, and gift card compatibility. Where-to-buy content ranks for branded discovery queries the DTC storefront otherwise loses to competitor affiliate reviews.
Subscription versus one-time comparison content
Subscription versus one-time comparison content converts subscription commitments at 3 to 6 percent because it addresses the price-sensitivity concern head-on with a specific math table. The piece covers the discount structure (15 percent lifetime), the skip-a-month mechanic, the pause-anytime rule, the cancellation policy, and the specific yearly savings for the brand’s average consumption cadence. Cross-reference the retention structure on our food and beverage marketing retainer page.
Content refresh cadence on food brand pillars
Content refresh cadence on food brand content pillars runs a rolling audit every 12 to 24 months by pillar. Recipes get refreshed every 12 months with new photography, updated schema, and any nutrition or ingredient adjustments. Ingredient comparison guides refresh every 18 months to update market data. Sourcing story pages refresh every 24 months to reflect farm partnership changes and new harvest angles. Buyer intent content refreshes every 12 months to update retailer availability and pricing.
Recipe refresh priority order
Recipe refresh priority runs by organic traffic rank. The top 20 recipes by monthly organic sessions get refreshed first (new photography, schema audit, related recipe internal links, updated nutrition). The next 40 get refreshed at 15 months. The remaining recipes get refreshed opportunistically when the ranking slips past position 15 in Google. Skipping the refresh cadence lets recipe rankings drift out of the top 3 inside 18 months as newer competitor recipes take the position.
Schema audit checklist per refresh
The schema audit checklist per refresh runs 8 items: Recipe schema completeness, aggregateRating count and accuracy, nutrition data accuracy, prepTime and cookTime match the recipe body, image URLs valid at CDN, related recipe internal links working, product card SKU URL live, and Google Search Console rich result eligibility validated. This checklist takes 20 minutes per recipe and prevents the schema drift that costs recipe rankings 20 to 40 positions quietly.
Reporting cadence for food brand content marketing
Reporting cadence on food brand content marketing runs a monthly executive report plus a quarterly business review. The monthly report ships in the first business week and covers organic sessions by pillar, top 10 ranking recipes with position trend, ingredient guide ranking movements, sourcing page performance, and organic-attributed DTC revenue. Every number carries a comparison to the prior month and a plain-language interpretation the founder reads in 7 minutes.
Metrics that matter for content marketing
Metrics that matter for food brand content marketing: organic sessions by pillar, recipe rich result impressions in Search Console, organic conversion rate to hero SKU pages, organic-attributed DTC revenue, and top 20 ranking positions by monthly organic sessions. Vanity metrics that do not matter: total pageviews without conversion context, average time on page without conversion attribution, and social share counts. The monthly report skips the vanity block entirely.
Quarterly business review structure
The quarterly business review runs 90 minutes with the founder, head of content, and SEO lead. Agenda: organic traffic trend by pillar, top 10 winning content pieces, top 10 losing content pieces (candidates for refresh or removal), competitive gap analysis against 5 named competitor brands, and next quarter’s content calendar with recipes and ingredient guides queued. According to Ahrefs content marketing research, brands running quarterly content audits outperform brands running annual audits by 40 to 70 percent on organic revenue over a 24-month window.
Internal linking discipline across food brand content
Internal linking discipline across food brand content moves authority from recipe pages toward hero SKU product pages and comparison guides. Every recipe links to the hero SKU it uses inline (once in the ingredient list, once in a bottom call-out card). Every ingredient comparison guide links to 3 to 6 recipes using the winning ingredient plus the hero SKU product page. Every sourcing story links to the 2 to 4 SKUs sourced from that specific farm or cooperative.
Anchor text strategy across recipe hubs
Anchor text on internal links varies across recipe hubs to avoid over-optimization patterns Google penalizes. Exact-match anchor (“single-origin Ethiopian coffee”) runs on 20 to 30 percent of internal links. Partial-match variations (“our Ethiopian roast”) run on 30 to 40 percent. Branded anchors (the SKU name) run on 20 to 30 percent. Generic anchors (“shop the coffee”) fill the remaining 10 to 20 percent. This ratio holds ranking without triggering the over-optimization penalty that shows up on brands that anchor-text-stuff every internal link with the same exact-match keyword. Cross-reference the linking layer on our food and beverage web design page.
Link equity from ingredient guides to SKU pages
Link equity from ingredient guides passes to SKU pages when the guide’s comparison table names the hero SKU in the winning column with a product card, and when the guide’s body links to 3 to 6 recipes that use the winning ingredient. This 3-hop path (guide to recipe to SKU) pushes authority from a high-traffic informational query down to a high-intent transactional page. According to Search Engine Land SEO coverage, informational content that internally links to transactional pages produces 2 to 4 times higher organic revenue than isolated content silos.
Wrapping up content marketing for food brands
Content marketing for food brands is the organic engine that turns a DTC snack, drink, or CPG storefront into a search-driven revenue channel. Recipe hub of 40 to 100 recipes. Ingredient comparison guides at 12 to 24 pieces. Sourcing story pages at 6 to 12 pieces. Buyer intent content at 8 to 16 pieces. Creator syndication calendar with 12 to 30 creators per quarter. Refresh cadence at 12 to 24 months by pillar. Reporting with organic sessions and organic revenue attribution.
If your DTC food brand is running paid social at 20,000 dollars monthly with a broken blog and zero recipe schema, professional content marketing for food brands pays for itself inside the first 90 days on organic traffic captured. Redefine Web ships content marketing inside our monthly retainer packages. Book a call and we will walk through the last three DTC food brands we built recipe hubs for, pillar by pillar.
Content marketing for food brands starts with a recipe hub because recipe queries account for 40 to 60 percent of high-intent search volume in the food category. Every hero SKU needs 4 to 12 recipes anchored to it, each targeting a specific occasion and audience.
Skip the recipe hub and the brand loses the search real estate that pulls DTC storefront traffic month over month at zero incremental paid cost. Recipe traffic converts at 2 to 4 percent because the shopper landed with usage intent, not passive discovery, which is why food brands win on recipes.
Recipe schema and Google rich result eligibility
Every recipe page ships schema.org Recipe markup including cookTime, prepTime, recipeIngredient, recipeInstructions, nutrition, and aggregateRating. Correctly marked-up recipes qualify for Google’s recipe rich result carousel that pulls 3 to 6 times higher click-through rate than a plain blue link. The schema layer takes 15 minutes per recipe to author and 30 minutes to validate in Google Search Console. Cross-reference the recipe search stack on our food and beverage SEO page.
Recipe hub structure that scales
The recipe hub structure runs 40 to 100 recipes at maturity, organized by hero SKU (4 to 12 recipes per SKU) plus occasion tags (breakfast, weeknight dinner, meal prep, brunch, holiday). Every recipe links back to the hero SKU product page with the SKU embedded in an inline card. The hub earns internal linking value from ingredient comparison guides and the sourcing story pages, which feeds recipe ranking on Google. According to Google Search Central recipe structured data guidance, complete Recipe schema markup is required for eligibility in the recipe carousel and the ingredient search filter.
Pillar structure for food brand content marketing
The pillar structure on content marketing for food brands runs 4 content pillars concurrently: recipe hub (40 to 100 recipes), ingredient comparison guides (12 to 24 guides), sourcing story pages (6 to 12 pages), and buyer intent content (where to buy, subscription vs. one-time, gift bundle guides). Every pillar covers a distinct search intent and every pillar links back to the hero SKU product pages.
Ingredient comparison guide format
Ingredient comparison guides run 1,800 to 3,200 words comparing 2 to 4 ingredient types on 6 to 10 attributes with a comparison table, real-world use case examples, and links to the hero SKU that uses the specific ingredient. Example: organic vs. conventional oats compares nutritional profile, sourcing chain, cost, environmental impact, and taste on a 6-column table. The brand’s SKU appears in the winning column with a product card. These guides rank 3 to 8 months after publication and pull steady-state organic traffic.
Sourcing story pages that build trust
Sourcing story pages name the specific farms, cooperatives, or suppliers the brand sources from, with photos of the farms, farmer quotes, and specific harvest windows. A coffee brand’s Ethiopian farm page ranks for “single-origin Ethiopian coffee” and “Yirgacheffe coffee origin” plus 40 long-tail variations. The sourcing page pulls trust-building traffic that converts at 4 to 6 percent because the shopper landed pattern-matching on transparency and named provenance. Every sourcing page includes farmer or cooperative quotes, harvest dates, and a link back to 3 to 5 hero SKU pages that source from the named supplier.
Vejrø hospitality content case study
Vejrø Resort, a Danish private-island destination with an on-site restaurant focused on organic, locally sourced cuisine, joined us with strong social engagement and no organic-search real estate. Guests found the resort on Instagram but never in Google search for terms like “private island resort Denmark,” “farm-to-table hospitality Denmark,” or “Vejrø restaurant.” The same organic-search gap shows up on DTC food brands running paid social at 20,000 dollars monthly with a broken blog and zero recipe schema.
We built the conversion-focused website with on-site and off-site SEO tuned to the travel-niche keyword clusters, competitor analysis against comparable boutique resorts, and mobile-first design prioritizing guest discovery. Every page carried the structured data qualifying it for Google’s rich results in the hospitality category. Every internal link pushed authority toward the direct-booking conversion path.
Three months later, Vejrø hit 10,000 plus organic visitors, ranked for 200 plus first-page keywords, and pulled a 2.2 percent booking conversion rate from organic traffic. The same pattern applies to content marketing for food brands: recipe schema, ingredient comparison guides, and sourcing story pages pull organic traffic at 20 to 40 percent conversion into hero SKU pages inside 6 months when the content quality matches search intent and every page carries the right structured data markup. Vejrø also proved out the reporting discipline: every monthly report named the exact page, the exact keyword cluster, and the exact search feature (rich result, sitelinks, image pack) driving the incremental organic revenue instead of hiding behind aggregate traffic charts.
Recipe cadence and content calendar for food brands
Recipe cadence on a working food brand content calendar ships 2 to 4 new recipes per week during the first 6 months and drops to 1 per week at maturity. Each recipe takes 4 to 6 hours to produce (write, test in the kitchen, photograph, schema author, publish). At 3 recipes per week, the brand hits 78 recipes inside 6 months plus a backlog of ingredient comparison and sourcing content queued behind the recipe production line.
| Content pillar | Target volume year 1 | Production cost per piece | Refresh cadence |
|---|---|---|---|
| Recipe hub | 40 to 100 recipes | $180 to $320 | Every 12 months |
| Ingredient comparison guides | 12 to 24 guides | $450 to $780 | Every 18 months |
| Sourcing story pages | 6 to 12 pages | $680 to $1,200 | Every 24 months |
| Buyer intent content | 8 to 16 pieces | $220 to $420 | Every 12 months |
Photography as a content calendar constraint
Photography is the actual constraint on recipe cadence, not writing. Every recipe needs 6 to 12 photos: hero shot, ingredient flat lay, prep in progress, plated result, storage, and step shots for the schema markup. A working food brand batches photography 8 recipes at a time to keep the cost per recipe under 200 dollars. Skip the batching and the per-recipe cost climbs to 400 to 600 dollars, which caps recipe cadence at 1 per week and slows organic ranking timeline by 6 months.
Seasonal content calendar planning
Seasonal content calendar planning maps recipes and comparison guides to the seasonal windows they need to rank in. A Christmas cookie recipe needs to publish in September to rank by early December. A Valentine’s chocolate guide needs to publish in November to rank by early February. A back-to-school lunchbox recipe needs to publish in June to rank by late August. The 60-to-90-day ranking curve dictates the calendar.
Creator syndication inside food brand content
Creator syndication on food brand content marketing amplifies the recipe hub through Instagram Reels, TikTok, and YouTube Shorts creators paid to post their own version of the brand’s hero recipes. The creator content pulls net-new audiences into the recipe hub through the creator’s Link in Bio or Amazon Storefront tag. The syndication calendar names 12 to 30 creators per quarter with specific recipes assigned to each.
One brand we picked up had a spreadsheet titled “creator outreach 2023” with 47 rows and 3 responses. All 3 responses were auto-replies. The spreadsheet named zero recipes and offered flat rates below 100 dollars per post. Nobody posts a 30-second video for 87 dollars flat. Nobody.
Creator content commercial terms that work
Working creator content commercial terms run 350 to 1,500 dollars flat per post plus a 12 to 25 percent commission on tagged sales across a 30-day window. The commission mechanic pulls creators into follow-up posts because the incremental revenue continues past the initial fee. Mid-tier creators (30k to 150k followers) hit the sweet spot for food brand content because their engagement rate typically runs 4 to 8 percent versus 0.8 to 1.6 percent on mega-creators.
Content brief structure for creator partnerships
The content brief structure for creator partnerships runs a single page: the SKU, the specific recipe or usage occasion, 3 required brand mentions, 3 restricted claims (no health claims on non-medical SKUs), the pricing angle, the affiliate link, and 3 example videos that hit the tone. The brief avoids over-scripting because over-scripted creator content underperforms native creator voice by 40 to 60 percent on engagement rate.
Buyer intent content for food brand blogs
Buyer intent content on food brand blogs covers 8 to 16 pieces targeting explicit purchase-decision queries: “where to buy [brand],” “[brand] subscription vs. one-time,” “best [category] for [use case],” and “[brand] gift bundle.” Every buyer intent piece runs 1,400 to 2,400 words with a comparison table, product cards, and a clear conversion path to the specific SKU that matches the query intent. Buyer intent content converts at 3 to 6 percent versus 1 to 2 percent on recipe content because the shopper landed already planning to buy, not exploring a usage occasion.
Where-to-buy content structure
Where-to-buy content structure covers online (DTC storefront, Amazon, Target.com, Whole Foods online), retail (specific chain locators with the store finder embedded), and international (customs limitations, retailer partners abroad). Every piece names specific retailers, links to the store locator, and includes an FAQ block covering shipping availability, subscription options, and gift card compatibility. Where-to-buy content ranks for branded discovery queries the DTC storefront otherwise loses to competitor affiliate reviews.
Subscription versus one-time comparison content
Subscription versus one-time comparison content converts subscription commitments at 3 to 6 percent because it addresses the price-sensitivity concern head-on with a specific math table. The piece covers the discount structure (15 percent lifetime), the skip-a-month mechanic, the pause-anytime rule, the cancellation policy, and the specific yearly savings for the brand’s average consumption cadence. Cross-reference the retention structure on our food and beverage marketing retainer page.
Content refresh cadence on food brand pillars
Content refresh cadence on food brand content pillars runs a rolling audit every 12 to 24 months by pillar. Recipes get refreshed every 12 months with new photography, updated schema, and any nutrition or ingredient adjustments. Ingredient comparison guides refresh every 18 months to update market data. Sourcing story pages refresh every 24 months to reflect farm partnership changes and new harvest angles. Buyer intent content refreshes every 12 months to update retailer availability and pricing.
Recipe refresh priority order
Recipe refresh priority runs by organic traffic rank. The top 20 recipes by monthly organic sessions get refreshed first (new photography, schema audit, related recipe internal links, updated nutrition). The next 40 get refreshed at 15 months. The remaining recipes get refreshed opportunistically when the ranking slips past position 15 in Google. Skipping the refresh cadence lets recipe rankings drift out of the top 3 inside 18 months as newer competitor recipes take the position.
Schema audit checklist per refresh
The schema audit checklist per refresh runs 8 items: Recipe schema completeness, aggregateRating count and accuracy, nutrition data accuracy, prepTime and cookTime match the recipe body, image URLs valid at CDN, related recipe internal links working, product card SKU URL live, and Google Search Console rich result eligibility validated. This checklist takes 20 minutes per recipe and prevents the schema drift that costs recipe rankings 20 to 40 positions quietly.
Reporting cadence for food brand content marketing
Reporting cadence on food brand content marketing runs a monthly executive report plus a quarterly business review. The monthly report ships in the first business week and covers organic sessions by pillar, top 10 ranking recipes with position trend, ingredient guide ranking movements, sourcing page performance, and organic-attributed DTC revenue. Every number carries a comparison to the prior month and a plain-language interpretation the founder reads in 7 minutes.
Metrics that matter for content marketing
Metrics that matter for food brand content marketing: organic sessions by pillar, recipe rich result impressions in Search Console, organic conversion rate to hero SKU pages, organic-attributed DTC revenue, and top 20 ranking positions by monthly organic sessions. Vanity metrics that do not matter: total pageviews without conversion context, average time on page without conversion attribution, and social share counts. The monthly report skips the vanity block entirely.
Quarterly business review structure
The quarterly business review runs 90 minutes with the founder, head of content, and SEO lead. Agenda: organic traffic trend by pillar, top 10 winning content pieces, top 10 losing content pieces (candidates for refresh or removal), competitive gap analysis against 5 named competitor brands, and next quarter’s content calendar with recipes and ingredient guides queued. According to Ahrefs content marketing research, brands running quarterly content audits outperform brands running annual audits by 40 to 70 percent on organic revenue over a 24-month window.
Internal linking discipline across food brand content
Internal linking discipline across food brand content moves authority from recipe pages toward hero SKU product pages and comparison guides. Every recipe links to the hero SKU it uses inline (once in the ingredient list, once in a bottom call-out card). Every ingredient comparison guide links to 3 to 6 recipes using the winning ingredient plus the hero SKU product page. Every sourcing story links to the 2 to 4 SKUs sourced from that specific farm or cooperative.
Anchor text strategy across recipe hubs
Anchor text on internal links varies across recipe hubs to avoid over-optimization patterns Google penalizes. Exact-match anchor (“single-origin Ethiopian coffee”) runs on 20 to 30 percent of internal links. Partial-match variations (“our Ethiopian roast”) run on 30 to 40 percent. Branded anchors (the SKU name) run on 20 to 30 percent. Generic anchors (“shop the coffee”) fill the remaining 10 to 20 percent. This ratio holds ranking without triggering the over-optimization penalty that shows up on brands that anchor-text-stuff every internal link with the same exact-match keyword. Cross-reference the linking layer on our food and beverage web design page.
Link equity from ingredient guides to SKU pages
Link equity from ingredient guides passes to SKU pages when the guide’s comparison table names the hero SKU in the winning column with a product card, and when the guide’s body links to 3 to 6 recipes that use the winning ingredient. This 3-hop path (guide to recipe to SKU) pushes authority from a high-traffic informational query down to a high-intent transactional page. According to Search Engine Land SEO coverage, informational content that internally links to transactional pages produces 2 to 4 times higher organic revenue than isolated content silos.
Wrapping up content marketing for food brands
Content marketing for food brands is the organic engine that turns a DTC snack, drink, or CPG storefront into a search-driven revenue channel. Recipe hub of 40 to 100 recipes. Ingredient comparison guides at 12 to 24 pieces. Sourcing story pages at 6 to 12 pieces. Buyer intent content at 8 to 16 pieces. Creator syndication calendar with 12 to 30 creators per quarter. Refresh cadence at 12 to 24 months by pillar. Reporting with organic sessions and organic revenue attribution.
If your DTC food brand is running paid social at 20,000 dollars monthly with a broken blog and zero recipe schema, professional content marketing for food brands pays for itself inside the first 90 days on organic traffic captured. Redefine Web ships content marketing inside our monthly retainer packages. Book a call and we will walk through the last three DTC food brands we built recipe hubs for, pillar by pillar.
Content marketing for food brands starts with a recipe hub because recipe queries account for 40 to 60 percent of high-intent search volume in the food category. Every hero SKU needs 4 to 12 recipes anchored to it, each targeting a specific occasion and audience.
Skip the recipe hub and the brand loses the search real estate that pulls DTC storefront traffic month over month at zero incremental paid cost. Recipe traffic converts at 2 to 4 percent because the shopper landed with usage intent, not passive discovery, which is why food brands win on recipes.
Recipe schema and Google rich result eligibility
Every recipe page ships schema.org Recipe markup including cookTime, prepTime, recipeIngredient, recipeInstructions, nutrition, and aggregateRating. Correctly marked-up recipes qualify for Google’s recipe rich result carousel that pulls 3 to 6 times higher click-through rate than a plain blue link. The schema layer takes 15 minutes per recipe to author and 30 minutes to validate in Google Search Console. Cross-reference the recipe search stack on our food and beverage SEO page.
Recipe hub structure that scales
The recipe hub structure runs 40 to 100 recipes at maturity, organized by hero SKU (4 to 12 recipes per SKU) plus occasion tags (breakfast, weeknight dinner, meal prep, brunch, holiday). Every recipe links back to the hero SKU product page with the SKU embedded in an inline card. The hub earns internal linking value from ingredient comparison guides and the sourcing story pages, which feeds recipe ranking on Google. According to Google Search Central recipe structured data guidance, complete Recipe schema markup is required for eligibility in the recipe carousel and the ingredient search filter.
Pillar structure for food brand content marketing
The pillar structure on content marketing for food brands runs 4 content pillars concurrently: recipe hub (40 to 100 recipes), ingredient comparison guides (12 to 24 guides), sourcing story pages (6 to 12 pages), and buyer intent content (where to buy, subscription vs. one-time, gift bundle guides). Every pillar covers a distinct search intent and every pillar links back to the hero SKU product pages.
Ingredient comparison guide format
Ingredient comparison guides run 1,800 to 3,200 words comparing 2 to 4 ingredient types on 6 to 10 attributes with a comparison table, real-world use case examples, and links to the hero SKU that uses the specific ingredient. Example: organic vs. conventional oats compares nutritional profile, sourcing chain, cost, environmental impact, and taste on a 6-column table. The brand’s SKU appears in the winning column with a product card. These guides rank 3 to 8 months after publication and pull steady-state organic traffic.
Sourcing story pages that build trust
Sourcing story pages name the specific farms, cooperatives, or suppliers the brand sources from, with photos of the farms, farmer quotes, and specific harvest windows. A coffee brand’s Ethiopian farm page ranks for “single-origin Ethiopian coffee” and “Yirgacheffe coffee origin” plus 40 long-tail variations. The sourcing page pulls trust-building traffic that converts at 4 to 6 percent because the shopper landed pattern-matching on transparency and named provenance. Every sourcing page includes farmer or cooperative quotes, harvest dates, and a link back to 3 to 5 hero SKU pages that source from the named supplier.
Vejrø hospitality content case study
Vejrø Resort, a Danish private-island destination with an on-site restaurant focused on organic, locally sourced cuisine, joined us with strong social engagement and no organic-search real estate. Guests found the resort on Instagram but never in Google search for terms like “private island resort Denmark,” “farm-to-table hospitality Denmark,” or “Vejrø restaurant.” The same organic-search gap shows up on DTC food brands running paid social at 20,000 dollars monthly with a broken blog and zero recipe schema.
We built the conversion-focused website with on-site and off-site SEO tuned to the travel-niche keyword clusters, competitor analysis against comparable boutique resorts, and mobile-first design prioritizing guest discovery. Every page carried the structured data qualifying it for Google’s rich results in the hospitality category. Every internal link pushed authority toward the direct-booking conversion path.
Three months later, Vejrø hit 10,000 plus organic visitors, ranked for 200 plus first-page keywords, and pulled a 2.2 percent booking conversion rate from organic traffic. The same pattern applies to content marketing for food brands: recipe schema, ingredient comparison guides, and sourcing story pages pull organic traffic at 20 to 40 percent conversion into hero SKU pages inside 6 months when the content quality matches search intent and every page carries the right structured data markup. Vejrø also proved out the reporting discipline: every monthly report named the exact page, the exact keyword cluster, and the exact search feature (rich result, sitelinks, image pack) driving the incremental organic revenue instead of hiding behind aggregate traffic charts.
Recipe cadence and content calendar for food brands
Recipe cadence on a working food brand content calendar ships 2 to 4 new recipes per week during the first 6 months and drops to 1 per week at maturity. Each recipe takes 4 to 6 hours to produce (write, test in the kitchen, photograph, schema author, publish). At 3 recipes per week, the brand hits 78 recipes inside 6 months plus a backlog of ingredient comparison and sourcing content queued behind the recipe production line.
| Content pillar | Target volume year 1 | Production cost per piece | Refresh cadence |
|---|---|---|---|
| Recipe hub | 40 to 100 recipes | $180 to $320 | Every 12 months |
| Ingredient comparison guides | 12 to 24 guides | $450 to $780 | Every 18 months |
| Sourcing story pages | 6 to 12 pages | $680 to $1,200 | Every 24 months |
| Buyer intent content | 8 to 16 pieces | $220 to $420 | Every 12 months |
Photography as a content calendar constraint
Photography is the actual constraint on recipe cadence, not writing. Every recipe needs 6 to 12 photos: hero shot, ingredient flat lay, prep in progress, plated result, storage, and step shots for the schema markup. A working food brand batches photography 8 recipes at a time to keep the cost per recipe under 200 dollars. Skip the batching and the per-recipe cost climbs to 400 to 600 dollars, which caps recipe cadence at 1 per week and slows organic ranking timeline by 6 months.
Seasonal content calendar planning
Seasonal content calendar planning maps recipes and comparison guides to the seasonal windows they need to rank in. A Christmas cookie recipe needs to publish in September to rank by early December. A Valentine’s chocolate guide needs to publish in November to rank by early February. A back-to-school lunchbox recipe needs to publish in June to rank by late August. The 60-to-90-day ranking curve dictates the calendar.
Creator syndication inside food brand content
Creator syndication on food brand content marketing amplifies the recipe hub through Instagram Reels, TikTok, and YouTube Shorts creators paid to post their own version of the brand’s hero recipes. The creator content pulls net-new audiences into the recipe hub through the creator’s Link in Bio or Amazon Storefront tag. The syndication calendar names 12 to 30 creators per quarter with specific recipes assigned to each.
One brand we picked up had a spreadsheet titled “creator outreach 2023” with 47 rows and 3 responses. All 3 responses were auto-replies. The spreadsheet named zero recipes and offered flat rates below 100 dollars per post. Nobody posts a 30-second video for 87 dollars flat. Nobody.
Creator content commercial terms that work
Working creator content commercial terms run 350 to 1,500 dollars flat per post plus a 12 to 25 percent commission on tagged sales across a 30-day window. The commission mechanic pulls creators into follow-up posts because the incremental revenue continues past the initial fee. Mid-tier creators (30k to 150k followers) hit the sweet spot for food brand content because their engagement rate typically runs 4 to 8 percent versus 0.8 to 1.6 percent on mega-creators.
Content brief structure for creator partnerships
The content brief structure for creator partnerships runs a single page: the SKU, the specific recipe or usage occasion, 3 required brand mentions, 3 restricted claims (no health claims on non-medical SKUs), the pricing angle, the affiliate link, and 3 example videos that hit the tone. The brief avoids over-scripting because over-scripted creator content underperforms native creator voice by 40 to 60 percent on engagement rate.
Buyer intent content for food brand blogs
Buyer intent content on food brand blogs covers 8 to 16 pieces targeting explicit purchase-decision queries: “where to buy [brand],” “[brand] subscription vs. one-time,” “best [category] for [use case],” and “[brand] gift bundle.” Every buyer intent piece runs 1,400 to 2,400 words with a comparison table, product cards, and a clear conversion path to the specific SKU that matches the query intent. Buyer intent content converts at 3 to 6 percent versus 1 to 2 percent on recipe content because the shopper landed already planning to buy, not exploring a usage occasion.
Where-to-buy content structure
Where-to-buy content structure covers online (DTC storefront, Amazon, Target.com, Whole Foods online), retail (specific chain locators with the store finder embedded), and international (customs limitations, retailer partners abroad). Every piece names specific retailers, links to the store locator, and includes an FAQ block covering shipping availability, subscription options, and gift card compatibility. Where-to-buy content ranks for branded discovery queries the DTC storefront otherwise loses to competitor affiliate reviews.
Subscription versus one-time comparison content
Subscription versus one-time comparison content converts subscription commitments at 3 to 6 percent because it addresses the price-sensitivity concern head-on with a specific math table. The piece covers the discount structure (15 percent lifetime), the skip-a-month mechanic, the pause-anytime rule, the cancellation policy, and the specific yearly savings for the brand’s average consumption cadence. Cross-reference the retention structure on our food and beverage marketing retainer page.
Content refresh cadence on food brand pillars
Content refresh cadence on food brand content pillars runs a rolling audit every 12 to 24 months by pillar. Recipes get refreshed every 12 months with new photography, updated schema, and any nutrition or ingredient adjustments. Ingredient comparison guides refresh every 18 months to update market data. Sourcing story pages refresh every 24 months to reflect farm partnership changes and new harvest angles. Buyer intent content refreshes every 12 months to update retailer availability and pricing.
Recipe refresh priority order
Recipe refresh priority runs by organic traffic rank. The top 20 recipes by monthly organic sessions get refreshed first (new photography, schema audit, related recipe internal links, updated nutrition). The next 40 get refreshed at 15 months. The remaining recipes get refreshed opportunistically when the ranking slips past position 15 in Google. Skipping the refresh cadence lets recipe rankings drift out of the top 3 inside 18 months as newer competitor recipes take the position.
Schema audit checklist per refresh
The schema audit checklist per refresh runs 8 items: Recipe schema completeness, aggregateRating count and accuracy, nutrition data accuracy, prepTime and cookTime match the recipe body, image URLs valid at CDN, related recipe internal links working, product card SKU URL live, and Google Search Console rich result eligibility validated. This checklist takes 20 minutes per recipe and prevents the schema drift that costs recipe rankings 20 to 40 positions quietly.
Reporting cadence for food brand content marketing
Reporting cadence on food brand content marketing runs a monthly executive report plus a quarterly business review. The monthly report ships in the first business week and covers organic sessions by pillar, top 10 ranking recipes with position trend, ingredient guide ranking movements, sourcing page performance, and organic-attributed DTC revenue. Every number carries a comparison to the prior month and a plain-language interpretation the founder reads in 7 minutes.
Metrics that matter for content marketing
Metrics that matter for food brand content marketing: organic sessions by pillar, recipe rich result impressions in Search Console, organic conversion rate to hero SKU pages, organic-attributed DTC revenue, and top 20 ranking positions by monthly organic sessions. Vanity metrics that do not matter: total pageviews without conversion context, average time on page without conversion attribution, and social share counts. The monthly report skips the vanity block entirely.
Quarterly business review structure
The quarterly business review runs 90 minutes with the founder, head of content, and SEO lead. Agenda: organic traffic trend by pillar, top 10 winning content pieces, top 10 losing content pieces (candidates for refresh or removal), competitive gap analysis against 5 named competitor brands, and next quarter’s content calendar with recipes and ingredient guides queued. According to Ahrefs content marketing research, brands running quarterly content audits outperform brands running annual audits by 40 to 70 percent on organic revenue over a 24-month window.
Internal linking discipline across food brand content
Internal linking discipline across food brand content moves authority from recipe pages toward hero SKU product pages and comparison guides. Every recipe links to the hero SKU it uses inline (once in the ingredient list, once in a bottom call-out card). Every ingredient comparison guide links to 3 to 6 recipes using the winning ingredient plus the hero SKU product page. Every sourcing story links to the 2 to 4 SKUs sourced from that specific farm or cooperative.
Anchor text strategy across recipe hubs
Anchor text on internal links varies across recipe hubs to avoid over-optimization patterns Google penalizes. Exact-match anchor (“single-origin Ethiopian coffee”) runs on 20 to 30 percent of internal links. Partial-match variations (“our Ethiopian roast”) run on 30 to 40 percent. Branded anchors (the SKU name) run on 20 to 30 percent. Generic anchors (“shop the coffee”) fill the remaining 10 to 20 percent. This ratio holds ranking without triggering the over-optimization penalty that shows up on brands that anchor-text-stuff every internal link with the same exact-match keyword. Cross-reference the linking layer on our food and beverage web design page.
Link equity from ingredient guides to SKU pages
Link equity from ingredient guides passes to SKU pages when the guide’s comparison table names the hero SKU in the winning column with a product card, and when the guide’s body links to 3 to 6 recipes that use the winning ingredient. This 3-hop path (guide to recipe to SKU) pushes authority from a high-traffic informational query down to a high-intent transactional page. According to Search Engine Land SEO coverage, informational content that internally links to transactional pages produces 2 to 4 times higher organic revenue than isolated content silos.
Wrapping up content marketing for food brands
Content marketing for food brands is the organic engine that turns a DTC snack, drink, or CPG storefront into a search-driven revenue channel. Recipe hub of 40 to 100 recipes. Ingredient comparison guides at 12 to 24 pieces. Sourcing story pages at 6 to 12 pieces. Buyer intent content at 8 to 16 pieces. Creator syndication calendar with 12 to 30 creators per quarter. Refresh cadence at 12 to 24 months by pillar. Reporting with organic sessions and organic revenue attribution.
If your DTC food brand is running paid social at 20,000 dollars monthly with a broken blog and zero recipe schema, professional content marketing for food brands pays for itself inside the first 90 days on organic traffic captured. Redefine Web ships content marketing inside our monthly retainer packages. Book a call and we will walk through the last three DTC food brands we built recipe hubs for, pillar by pillar.
Anchor text on internal links varies across recipe hubs to avoid over-optimization patterns Google penalizes. Exact-match anchor (“single-origin Ethiopian coffee”) runs on 20 to 30 percent of internal links. Partial-match variations (“our Ethiopian roast”) run on 30 to 40 percent. Branded anchors (the SKU name) run on 20 to 30 percent. Generic anchors (“shop the coffee”) fill the remaining 10 to 20 percent. This ratio holds ranking without triggering the over-optimization penalty that shows up on brands that anchor-text-stuff every internal link with the same exact-match keyword. Cross-reference the linking layer on our food and beverage web design page.
Link equity from ingredient guides to SKU pages
Link equity from ingredient guides passes to SKU pages when the guide’s comparison table names the hero SKU in the winning column with a product card, and when the guide’s body links to 3 to 6 recipes that use the winning ingredient. This 3-hop path (guide to recipe to SKU) pushes authority from a high-traffic informational query down to a high-intent transactional page. According to Search Engine Land SEO coverage, informational content that internally links to transactional pages produces 2 to 4 times higher organic revenue than isolated content silos.
Wrapping up content marketing for food brands
Content marketing for food brands is the organic engine that turns a DTC snack, drink, or CPG storefront into a search-driven revenue channel. Recipe hub of 40 to 100 recipes. Ingredient comparison guides at 12 to 24 pieces. Sourcing story pages at 6 to 12 pieces. Buyer intent content at 8 to 16 pieces. Creator syndication calendar with 12 to 30 creators per quarter. Refresh cadence at 12 to 24 months by pillar. Reporting with organic sessions and organic revenue attribution.
If your DTC food brand is running paid social at 20,000 dollars monthly with a broken blog and zero recipe schema, professional content marketing for food brands pays for itself inside the first 90 days on organic traffic captured. Redefine Web ships content marketing inside our monthly retainer packages. Book a call and we will walk through the last three DTC food brands we built recipe hubs for, pillar by pillar.
Content marketing for food brands starts with a recipe hub because recipe queries account for 40 to 60 percent of high-intent search volume in the food category. Every hero SKU needs 4 to 12 recipes anchored to it, each targeting a specific occasion and audience.
Skip the recipe hub and the brand loses the search real estate that pulls DTC storefront traffic month over month at zero incremental paid cost. Recipe traffic converts at 2 to 4 percent because the shopper landed with usage intent, not passive discovery, which is why food brands win on recipes.
Recipe schema and Google rich result eligibility
Every recipe page ships schema.org Recipe markup including cookTime, prepTime, recipeIngredient, recipeInstructions, nutrition, and aggregateRating. Correctly marked-up recipes qualify for Google’s recipe rich result carousel that pulls 3 to 6 times higher click-through rate than a plain blue link. The schema layer takes 15 minutes per recipe to author and 30 minutes to validate in Google Search Console. Cross-reference the recipe search stack on our food and beverage SEO page.
Recipe hub structure that scales
The recipe hub structure runs 40 to 100 recipes at maturity, organized by hero SKU (4 to 12 recipes per SKU) plus occasion tags (breakfast, weeknight dinner, meal prep, brunch, holiday). Every recipe links back to the hero SKU product page with the SKU embedded in an inline card. The hub earns internal linking value from ingredient comparison guides and the sourcing story pages, which feeds recipe ranking on Google. According to Google Search Central recipe structured data guidance, complete Recipe schema markup is required for eligibility in the recipe carousel and the ingredient search filter.
Pillar structure for food brand content marketing
The pillar structure on content marketing for food brands runs 4 content pillars concurrently: recipe hub (40 to 100 recipes), ingredient comparison guides (12 to 24 guides), sourcing story pages (6 to 12 pages), and buyer intent content (where to buy, subscription vs. one-time, gift bundle guides). Every pillar covers a distinct search intent and every pillar links back to the hero SKU product pages.
Ingredient comparison guide format
Ingredient comparison guides run 1,800 to 3,200 words comparing 2 to 4 ingredient types on 6 to 10 attributes with a comparison table, real-world use case examples, and links to the hero SKU that uses the specific ingredient. Example: organic vs. conventional oats compares nutritional profile, sourcing chain, cost, environmental impact, and taste on a 6-column table. The brand’s SKU appears in the winning column with a product card. These guides rank 3 to 8 months after publication and pull steady-state organic traffic.
Sourcing story pages that build trust
Sourcing story pages name the specific farms, cooperatives, or suppliers the brand sources from, with photos of the farms, farmer quotes, and specific harvest windows. A coffee brand’s Ethiopian farm page ranks for “single-origin Ethiopian coffee” and “Yirgacheffe coffee origin” plus 40 long-tail variations. The sourcing page pulls trust-building traffic that converts at 4 to 6 percent because the shopper landed pattern-matching on transparency and named provenance. Every sourcing page includes farmer or cooperative quotes, harvest dates, and a link back to 3 to 5 hero SKU pages that source from the named supplier.
Vejrø hospitality content case study
Vejrø Resort, a Danish private-island destination with an on-site restaurant focused on organic, locally sourced cuisine, joined us with strong social engagement and no organic-search real estate. Guests found the resort on Instagram but never in Google search for terms like “private island resort Denmark,” “farm-to-table hospitality Denmark,” or “Vejrø restaurant.” The same organic-search gap shows up on DTC food brands running paid social at 20,000 dollars monthly with a broken blog and zero recipe schema.
We built the conversion-focused website with on-site and off-site SEO tuned to the travel-niche keyword clusters, competitor analysis against comparable boutique resorts, and mobile-first design prioritizing guest discovery. Every page carried the structured data qualifying it for Google’s rich results in the hospitality category. Every internal link pushed authority toward the direct-booking conversion path.
Three months later, Vejrø hit 10,000 plus organic visitors, ranked for 200 plus first-page keywords, and pulled a 2.2 percent booking conversion rate from organic traffic. The same pattern applies to content marketing for food brands: recipe schema, ingredient comparison guides, and sourcing story pages pull organic traffic at 20 to 40 percent conversion into hero SKU pages inside 6 months when the content quality matches search intent and every page carries the right structured data markup. Vejrø also proved out the reporting discipline: every monthly report named the exact page, the exact keyword cluster, and the exact search feature (rich result, sitelinks, image pack) driving the incremental organic revenue instead of hiding behind aggregate traffic charts.
Recipe cadence and content calendar for food brands
Recipe cadence on a working food brand content calendar ships 2 to 4 new recipes per week during the first 6 months and drops to 1 per week at maturity. Each recipe takes 4 to 6 hours to produce (write, test in the kitchen, photograph, schema author, publish). At 3 recipes per week, the brand hits 78 recipes inside 6 months plus a backlog of ingredient comparison and sourcing content queued behind the recipe production line.
| Content pillar | Target volume year 1 | Production cost per piece | Refresh cadence |
|---|---|---|---|
| Recipe hub | 40 to 100 recipes | $180 to $320 | Every 12 months |
| Ingredient comparison guides | 12 to 24 guides | $450 to $780 | Every 18 months |
| Sourcing story pages | 6 to 12 pages | $680 to $1,200 | Every 24 months |
| Buyer intent content | 8 to 16 pieces | $220 to $420 | Every 12 months |
Photography as a content calendar constraint
Photography is the actual constraint on recipe cadence, not writing. Every recipe needs 6 to 12 photos: hero shot, ingredient flat lay, prep in progress, plated result, storage, and step shots for the schema markup. A working food brand batches photography 8 recipes at a time to keep the cost per recipe under 200 dollars. Skip the batching and the per-recipe cost climbs to 400 to 600 dollars, which caps recipe cadence at 1 per week and slows organic ranking timeline by 6 months.
Seasonal content calendar planning
Seasonal content calendar planning maps recipes and comparison guides to the seasonal windows they need to rank in. A Christmas cookie recipe needs to publish in September to rank by early December. A Valentine’s chocolate guide needs to publish in November to rank by early February. A back-to-school lunchbox recipe needs to publish in June to rank by late August. The 60-to-90-day ranking curve dictates the calendar.
Creator syndication inside food brand content
Creator syndication on food brand content marketing amplifies the recipe hub through Instagram Reels, TikTok, and YouTube Shorts creators paid to post their own version of the brand’s hero recipes. The creator content pulls net-new audiences into the recipe hub through the creator’s Link in Bio or Amazon Storefront tag. The syndication calendar names 12 to 30 creators per quarter with specific recipes assigned to each.
One brand we picked up had a spreadsheet titled “creator outreach 2023” with 47 rows and 3 responses. All 3 responses were auto-replies. The spreadsheet named zero recipes and offered flat rates below 100 dollars per post. Nobody posts a 30-second video for 87 dollars flat. Nobody.
Creator content commercial terms that work
Working creator content commercial terms run 350 to 1,500 dollars flat per post plus a 12 to 25 percent commission on tagged sales across a 30-day window. The commission mechanic pulls creators into follow-up posts because the incremental revenue continues past the initial fee. Mid-tier creators (30k to 150k followers) hit the sweet spot for food brand content because their engagement rate typically runs 4 to 8 percent versus 0.8 to 1.6 percent on mega-creators.
Content brief structure for creator partnerships
The content brief structure for creator partnerships runs a single page: the SKU, the specific recipe or usage occasion, 3 required brand mentions, 3 restricted claims (no health claims on non-medical SKUs), the pricing angle, the affiliate link, and 3 example videos that hit the tone. The brief avoids over-scripting because over-scripted creator content underperforms native creator voice by 40 to 60 percent on engagement rate.
Buyer intent content for food brand blogs
Buyer intent content on food brand blogs covers 8 to 16 pieces targeting explicit purchase-decision queries: “where to buy [brand],” “[brand] subscription vs. one-time,” “best [category] for [use case],” and “[brand] gift bundle.” Every buyer intent piece runs 1,400 to 2,400 words with a comparison table, product cards, and a clear conversion path to the specific SKU that matches the query intent. Buyer intent content converts at 3 to 6 percent versus 1 to 2 percent on recipe content because the shopper landed already planning to buy, not exploring a usage occasion.
Where-to-buy content structure
Where-to-buy content structure covers online (DTC storefront, Amazon, Target.com, Whole Foods online), retail (specific chain locators with the store finder embedded), and international (customs limitations, retailer partners abroad). Every piece names specific retailers, links to the store locator, and includes an FAQ block covering shipping availability, subscription options, and gift card compatibility. Where-to-buy content ranks for branded discovery queries the DTC storefront otherwise loses to competitor affiliate reviews.
Subscription versus one-time comparison content
Subscription versus one-time comparison content converts subscription commitments at 3 to 6 percent because it addresses the price-sensitivity concern head-on with a specific math table. The piece covers the discount structure (15 percent lifetime), the skip-a-month mechanic, the pause-anytime rule, the cancellation policy, and the specific yearly savings for the brand’s average consumption cadence. Cross-reference the retention structure on our food and beverage marketing retainer page.
Content refresh cadence on food brand pillars
Content refresh cadence on food brand content pillars runs a rolling audit every 12 to 24 months by pillar. Recipes get refreshed every 12 months with new photography, updated schema, and any nutrition or ingredient adjustments. Ingredient comparison guides refresh every 18 months to update market data. Sourcing story pages refresh every 24 months to reflect farm partnership changes and new harvest angles. Buyer intent content refreshes every 12 months to update retailer availability and pricing.
Recipe refresh priority order
Recipe refresh priority runs by organic traffic rank. The top 20 recipes by monthly organic sessions get refreshed first (new photography, schema audit, related recipe internal links, updated nutrition). The next 40 get refreshed at 15 months. The remaining recipes get refreshed opportunistically when the ranking slips past position 15 in Google. Skipping the refresh cadence lets recipe rankings drift out of the top 3 inside 18 months as newer competitor recipes take the position.
Schema audit checklist per refresh
The schema audit checklist per refresh runs 8 items: Recipe schema completeness, aggregateRating count and accuracy, nutrition data accuracy, prepTime and cookTime match the recipe body, image URLs valid at CDN, related recipe internal links working, product card SKU URL live, and Google Search Console rich result eligibility validated. This checklist takes 20 minutes per recipe and prevents the schema drift that costs recipe rankings 20 to 40 positions quietly.
Reporting cadence for food brand content marketing
Reporting cadence on food brand content marketing runs a monthly executive report plus a quarterly business review. The monthly report ships in the first business week and covers organic sessions by pillar, top 10 ranking recipes with position trend, ingredient guide ranking movements, sourcing page performance, and organic-attributed DTC revenue. Every number carries a comparison to the prior month and a plain-language interpretation the founder reads in 7 minutes.
Metrics that matter for content marketing
Metrics that matter for food brand content marketing: organic sessions by pillar, recipe rich result impressions in Search Console, organic conversion rate to hero SKU pages, organic-attributed DTC revenue, and top 20 ranking positions by monthly organic sessions. Vanity metrics that do not matter: total pageviews without conversion context, average time on page without conversion attribution, and social share counts. The monthly report skips the vanity block entirely.
Quarterly business review structure
The quarterly business review runs 90 minutes with the founder, head of content, and SEO lead. Agenda: organic traffic trend by pillar, top 10 winning content pieces, top 10 losing content pieces (candidates for refresh or removal), competitive gap analysis against 5 named competitor brands, and next quarter’s content calendar with recipes and ingredient guides queued. According to Ahrefs content marketing research, brands running quarterly content audits outperform brands running annual audits by 40 to 70 percent on organic revenue over a 24-month window.
Internal linking discipline across food brand content
Internal linking discipline across food brand content moves authority from recipe pages toward hero SKU product pages and comparison guides. Every recipe links to the hero SKU it uses inline (once in the ingredient list, once in a bottom call-out card). Every ingredient comparison guide links to 3 to 6 recipes using the winning ingredient plus the hero SKU product page. Every sourcing story links to the 2 to 4 SKUs sourced from that specific farm or cooperative.
Anchor text strategy across recipe hubs
Anchor text on internal links varies across recipe hubs to avoid over-optimization patterns Google penalizes. Exact-match anchor (“single-origin Ethiopian coffee”) runs on 20 to 30 percent of internal links. Partial-match variations (“our Ethiopian roast”) run on 30 to 40 percent. Branded anchors (the SKU name) run on 20 to 30 percent. Generic anchors (“shop the coffee”) fill the remaining 10 to 20 percent. This ratio holds ranking without triggering the over-optimization penalty that shows up on brands that anchor-text-stuff every internal link with the same exact-match keyword. Cross-reference the linking layer on our food and beverage web design page.
Link equity from ingredient guides to SKU pages
Link equity from ingredient guides passes to SKU pages when the guide’s comparison table names the hero SKU in the winning column with a product card, and when the guide’s body links to 3 to 6 recipes that use the winning ingredient. This 3-hop path (guide to recipe to SKU) pushes authority from a high-traffic informational query down to a high-intent transactional page. According to Search Engine Land SEO coverage, informational content that internally links to transactional pages produces 2 to 4 times higher organic revenue than isolated content silos.
Wrapping up content marketing for food brands
Content marketing for food brands is the organic engine that turns a DTC snack, drink, or CPG storefront into a search-driven revenue channel. Recipe hub of 40 to 100 recipes. Ingredient comparison guides at 12 to 24 pieces. Sourcing story pages at 6 to 12 pieces. Buyer intent content at 8 to 16 pieces. Creator syndication calendar with 12 to 30 creators per quarter. Refresh cadence at 12 to 24 months by pillar. Reporting with organic sessions and organic revenue attribution.
If your DTC food brand is running paid social at 20,000 dollars monthly with a broken blog and zero recipe schema, professional content marketing for food brands pays for itself inside the first 90 days on organic traffic captured. Redefine Web ships content marketing inside our monthly retainer packages. Book a call and we will walk through the last three DTC food brands we built recipe hubs for, pillar by pillar.
Content marketing for food brands starts with a recipe hub because recipe queries account for 40 to 60 percent of high-intent search volume in the food category. Every hero SKU needs 4 to 12 recipes anchored to it, each targeting a specific occasion and audience.
Skip the recipe hub and the brand loses the search real estate that pulls DTC storefront traffic month over month at zero incremental paid cost. Recipe traffic converts at 2 to 4 percent because the shopper landed with usage intent, not passive discovery, which is why food brands win on recipes.
Recipe schema and Google rich result eligibility
Every recipe page ships schema.org Recipe markup including cookTime, prepTime, recipeIngredient, recipeInstructions, nutrition, and aggregateRating. Correctly marked-up recipes qualify for Google’s recipe rich result carousel that pulls 3 to 6 times higher click-through rate than a plain blue link. The schema layer takes 15 minutes per recipe to author and 30 minutes to validate in Google Search Console. Cross-reference the recipe search stack on our food and beverage SEO page.
Recipe hub structure that scales
The recipe hub structure runs 40 to 100 recipes at maturity, organized by hero SKU (4 to 12 recipes per SKU) plus occasion tags (breakfast, weeknight dinner, meal prep, brunch, holiday). Every recipe links back to the hero SKU product page with the SKU embedded in an inline card. The hub earns internal linking value from ingredient comparison guides and the sourcing story pages, which feeds recipe ranking on Google. According to Google Search Central recipe structured data guidance, complete Recipe schema markup is required for eligibility in the recipe carousel and the ingredient search filter.
Pillar structure for food brand content marketing
The pillar structure on content marketing for food brands runs 4 content pillars concurrently: recipe hub (40 to 100 recipes), ingredient comparison guides (12 to 24 guides), sourcing story pages (6 to 12 pages), and buyer intent content (where to buy, subscription vs. one-time, gift bundle guides). Every pillar covers a distinct search intent and every pillar links back to the hero SKU product pages.
Ingredient comparison guide format
Ingredient comparison guides run 1,800 to 3,200 words comparing 2 to 4 ingredient types on 6 to 10 attributes with a comparison table, real-world use case examples, and links to the hero SKU that uses the specific ingredient. Example: organic vs. conventional oats compares nutritional profile, sourcing chain, cost, environmental impact, and taste on a 6-column table. The brand’s SKU appears in the winning column with a product card. These guides rank 3 to 8 months after publication and pull steady-state organic traffic.
Sourcing story pages that build trust
Sourcing story pages name the specific farms, cooperatives, or suppliers the brand sources from, with photos of the farms, farmer quotes, and specific harvest windows. A coffee brand’s Ethiopian farm page ranks for “single-origin Ethiopian coffee” and “Yirgacheffe coffee origin” plus 40 long-tail variations. The sourcing page pulls trust-building traffic that converts at 4 to 6 percent because the shopper landed pattern-matching on transparency and named provenance. Every sourcing page includes farmer or cooperative quotes, harvest dates, and a link back to 3 to 5 hero SKU pages that source from the named supplier.
Vejrø hospitality content case study
Vejrø Resort, a Danish private-island destination with an on-site restaurant focused on organic, locally sourced cuisine, joined us with strong social engagement and no organic-search real estate. Guests found the resort on Instagram but never in Google search for terms like “private island resort Denmark,” “farm-to-table hospitality Denmark,” or “Vejrø restaurant.” The same organic-search gap shows up on DTC food brands running paid social at 20,000 dollars monthly with a broken blog and zero recipe schema.
We built the conversion-focused website with on-site and off-site SEO tuned to the travel-niche keyword clusters, competitor analysis against comparable boutique resorts, and mobile-first design prioritizing guest discovery. Every page carried the structured data qualifying it for Google’s rich results in the hospitality category. Every internal link pushed authority toward the direct-booking conversion path.
Three months later, Vejrø hit 10,000 plus organic visitors, ranked for 200 plus first-page keywords, and pulled a 2.2 percent booking conversion rate from organic traffic. The same pattern applies to content marketing for food brands: recipe schema, ingredient comparison guides, and sourcing story pages pull organic traffic at 20 to 40 percent conversion into hero SKU pages inside 6 months when the content quality matches search intent and every page carries the right structured data markup. Vejrø also proved out the reporting discipline: every monthly report named the exact page, the exact keyword cluster, and the exact search feature (rich result, sitelinks, image pack) driving the incremental organic revenue instead of hiding behind aggregate traffic charts.
Recipe cadence and content calendar for food brands
Recipe cadence on a working food brand content calendar ships 2 to 4 new recipes per week during the first 6 months and drops to 1 per week at maturity. Each recipe takes 4 to 6 hours to produce (write, test in the kitchen, photograph, schema author, publish). At 3 recipes per week, the brand hits 78 recipes inside 6 months plus a backlog of ingredient comparison and sourcing content queued behind the recipe production line.
| Content pillar | Target volume year 1 | Production cost per piece | Refresh cadence |
|---|---|---|---|
| Recipe hub | 40 to 100 recipes | $180 to $320 | Every 12 months |
| Ingredient comparison guides | 12 to 24 guides | $450 to $780 | Every 18 months |
| Sourcing story pages | 6 to 12 pages | $680 to $1,200 | Every 24 months |
| Buyer intent content | 8 to 16 pieces | $220 to $420 | Every 12 months |
Photography as a content calendar constraint
Photography is the actual constraint on recipe cadence, not writing. Every recipe needs 6 to 12 photos: hero shot, ingredient flat lay, prep in progress, plated result, storage, and step shots for the schema markup. A working food brand batches photography 8 recipes at a time to keep the cost per recipe under 200 dollars. Skip the batching and the per-recipe cost climbs to 400 to 600 dollars, which caps recipe cadence at 1 per week and slows organic ranking timeline by 6 months.
Seasonal content calendar planning
Seasonal content calendar planning maps recipes and comparison guides to the seasonal windows they need to rank in. A Christmas cookie recipe needs to publish in September to rank by early December. A Valentine’s chocolate guide needs to publish in November to rank by early February. A back-to-school lunchbox recipe needs to publish in June to rank by late August. The 60-to-90-day ranking curve dictates the calendar.
Creator syndication inside food brand content
Creator syndication on food brand content marketing amplifies the recipe hub through Instagram Reels, TikTok, and YouTube Shorts creators paid to post their own version of the brand’s hero recipes. The creator content pulls net-new audiences into the recipe hub through the creator’s Link in Bio or Amazon Storefront tag. The syndication calendar names 12 to 30 creators per quarter with specific recipes assigned to each.
One brand we picked up had a spreadsheet titled “creator outreach 2023” with 47 rows and 3 responses. All 3 responses were auto-replies. The spreadsheet named zero recipes and offered flat rates below 100 dollars per post. Nobody posts a 30-second video for 87 dollars flat. Nobody.
Creator content commercial terms that work
Working creator content commercial terms run 350 to 1,500 dollars flat per post plus a 12 to 25 percent commission on tagged sales across a 30-day window. The commission mechanic pulls creators into follow-up posts because the incremental revenue continues past the initial fee. Mid-tier creators (30k to 150k followers) hit the sweet spot for food brand content because their engagement rate typically runs 4 to 8 percent versus 0.8 to 1.6 percent on mega-creators.
Content brief structure for creator partnerships
The content brief structure for creator partnerships runs a single page: the SKU, the specific recipe or usage occasion, 3 required brand mentions, 3 restricted claims (no health claims on non-medical SKUs), the pricing angle, the affiliate link, and 3 example videos that hit the tone. The brief avoids over-scripting because over-scripted creator content underperforms native creator voice by 40 to 60 percent on engagement rate.
Buyer intent content for food brand blogs
Buyer intent content on food brand blogs covers 8 to 16 pieces targeting explicit purchase-decision queries: “where to buy [brand],” “[brand] subscription vs. one-time,” “best [category] for [use case],” and “[brand] gift bundle.” Every buyer intent piece runs 1,400 to 2,400 words with a comparison table, product cards, and a clear conversion path to the specific SKU that matches the query intent. Buyer intent content converts at 3 to 6 percent versus 1 to 2 percent on recipe content because the shopper landed already planning to buy, not exploring a usage occasion.
Where-to-buy content structure
Where-to-buy content structure covers online (DTC storefront, Amazon, Target.com, Whole Foods online), retail (specific chain locators with the store finder embedded), and international (customs limitations, retailer partners abroad). Every piece names specific retailers, links to the store locator, and includes an FAQ block covering shipping availability, subscription options, and gift card compatibility. Where-to-buy content ranks for branded discovery queries the DTC storefront otherwise loses to competitor affiliate reviews.
Subscription versus one-time comparison content
Subscription versus one-time comparison content converts subscription commitments at 3 to 6 percent because it addresses the price-sensitivity concern head-on with a specific math table. The piece covers the discount structure (15 percent lifetime), the skip-a-month mechanic, the pause-anytime rule, the cancellation policy, and the specific yearly savings for the brand’s average consumption cadence. Cross-reference the retention structure on our food and beverage marketing retainer page.
Content refresh cadence on food brand pillars
Content refresh cadence on food brand content pillars runs a rolling audit every 12 to 24 months by pillar. Recipes get refreshed every 12 months with new photography, updated schema, and any nutrition or ingredient adjustments. Ingredient comparison guides refresh every 18 months to update market data. Sourcing story pages refresh every 24 months to reflect farm partnership changes and new harvest angles. Buyer intent content refreshes every 12 months to update retailer availability and pricing.
Recipe refresh priority order
Recipe refresh priority runs by organic traffic rank. The top 20 recipes by monthly organic sessions get refreshed first (new photography, schema audit, related recipe internal links, updated nutrition). The next 40 get refreshed at 15 months. The remaining recipes get refreshed opportunistically when the ranking slips past position 15 in Google. Skipping the refresh cadence lets recipe rankings drift out of the top 3 inside 18 months as newer competitor recipes take the position.
Schema audit checklist per refresh
The schema audit checklist per refresh runs 8 items: Recipe schema completeness, aggregateRating count and accuracy, nutrition data accuracy, prepTime and cookTime match the recipe body, image URLs valid at CDN, related recipe internal links working, product card SKU URL live, and Google Search Console rich result eligibility validated. This checklist takes 20 minutes per recipe and prevents the schema drift that costs recipe rankings 20 to 40 positions quietly.
Reporting cadence for food brand content marketing
Reporting cadence on food brand content marketing runs a monthly executive report plus a quarterly business review. The monthly report ships in the first business week and covers organic sessions by pillar, top 10 ranking recipes with position trend, ingredient guide ranking movements, sourcing page performance, and organic-attributed DTC revenue. Every number carries a comparison to the prior month and a plain-language interpretation the founder reads in 7 minutes.
Metrics that matter for content marketing
Metrics that matter for food brand content marketing: organic sessions by pillar, recipe rich result impressions in Search Console, organic conversion rate to hero SKU pages, organic-attributed DTC revenue, and top 20 ranking positions by monthly organic sessions. Vanity metrics that do not matter: total pageviews without conversion context, average time on page without conversion attribution, and social share counts. The monthly report skips the vanity block entirely.
Quarterly business review structure
The quarterly business review runs 90 minutes with the founder, head of content, and SEO lead. Agenda: organic traffic trend by pillar, top 10 winning content pieces, top 10 losing content pieces (candidates for refresh or removal), competitive gap analysis against 5 named competitor brands, and next quarter’s content calendar with recipes and ingredient guides queued. According to Ahrefs content marketing research, brands running quarterly content audits outperform brands running annual audits by 40 to 70 percent on organic revenue over a 24-month window.
Internal linking discipline across food brand content
Internal linking discipline across food brand content moves authority from recipe pages toward hero SKU product pages and comparison guides. Every recipe links to the hero SKU it uses inline (once in the ingredient list, once in a bottom call-out card). Every ingredient comparison guide links to 3 to 6 recipes using the winning ingredient plus the hero SKU product page. Every sourcing story links to the 2 to 4 SKUs sourced from that specific farm or cooperative.
Anchor text strategy across recipe hubs
Anchor text on internal links varies across recipe hubs to avoid over-optimization patterns Google penalizes. Exact-match anchor (“single-origin Ethiopian coffee”) runs on 20 to 30 percent of internal links. Partial-match variations (“our Ethiopian roast”) run on 30 to 40 percent. Branded anchors (the SKU name) run on 20 to 30 percent. Generic anchors (“shop the coffee”) fill the remaining 10 to 20 percent. This ratio holds ranking without triggering the over-optimization penalty that shows up on brands that anchor-text-stuff every internal link with the same exact-match keyword. Cross-reference the linking layer on our food and beverage web design page.
Link equity from ingredient guides to SKU pages
Link equity from ingredient guides passes to SKU pages when the guide’s comparison table names the hero SKU in the winning column with a product card, and when the guide’s body links to 3 to 6 recipes that use the winning ingredient. This 3-hop path (guide to recipe to SKU) pushes authority from a high-traffic informational query down to a high-intent transactional page. According to Search Engine Land SEO coverage, informational content that internally links to transactional pages produces 2 to 4 times higher organic revenue than isolated content silos.
Wrapping up content marketing for food brands
Content marketing for food brands is the organic engine that turns a DTC snack, drink, or CPG storefront into a search-driven revenue channel. Recipe hub of 40 to 100 recipes. Ingredient comparison guides at 12 to 24 pieces. Sourcing story pages at 6 to 12 pieces. Buyer intent content at 8 to 16 pieces. Creator syndication calendar with 12 to 30 creators per quarter. Refresh cadence at 12 to 24 months by pillar. Reporting with organic sessions and organic revenue attribution.
If your DTC food brand is running paid social at 20,000 dollars monthly with a broken blog and zero recipe schema, professional content marketing for food brands pays for itself inside the first 90 days on organic traffic captured. Redefine Web ships content marketing inside our monthly retainer packages. Book a call and we will walk through the last three DTC food brands we built recipe hubs for, pillar by pillar.
Internal linking discipline across food brand content moves authority from recipe pages toward hero SKU product pages and comparison guides. Every recipe links to the hero SKU it uses inline (once in the ingredient list, once in a bottom call-out card). Every ingredient comparison guide links to 3 to 6 recipes using the winning ingredient plus the hero SKU product page. Every sourcing story links to the 2 to 4 SKUs sourced from that specific farm or cooperative.
Anchor text strategy across recipe hubs
Anchor text on internal links varies across recipe hubs to avoid over-optimization patterns Google penalizes. Exact-match anchor (“single-origin Ethiopian coffee”) runs on 20 to 30 percent of internal links. Partial-match variations (“our Ethiopian roast”) run on 30 to 40 percent. Branded anchors (the SKU name) run on 20 to 30 percent. Generic anchors (“shop the coffee”) fill the remaining 10 to 20 percent. This ratio holds ranking without triggering the over-optimization penalty that shows up on brands that anchor-text-stuff every internal link with the same exact-match keyword. Cross-reference the linking layer on our food and beverage web design page.
Link equity from ingredient guides to SKU pages
Link equity from ingredient guides passes to SKU pages when the guide’s comparison table names the hero SKU in the winning column with a product card, and when the guide’s body links to 3 to 6 recipes that use the winning ingredient. This 3-hop path (guide to recipe to SKU) pushes authority from a high-traffic informational query down to a high-intent transactional page. According to Search Engine Land SEO coverage, informational content that internally links to transactional pages produces 2 to 4 times higher organic revenue than isolated content silos.
Wrapping up content marketing for food brands
Content marketing for food brands is the organic engine that turns a DTC snack, drink, or CPG storefront into a search-driven revenue channel. Recipe hub of 40 to 100 recipes. Ingredient comparison guides at 12 to 24 pieces. Sourcing story pages at 6 to 12 pieces. Buyer intent content at 8 to 16 pieces. Creator syndication calendar with 12 to 30 creators per quarter. Refresh cadence at 12 to 24 months by pillar. Reporting with organic sessions and organic revenue attribution.
If your DTC food brand is running paid social at 20,000 dollars monthly with a broken blog and zero recipe schema, professional content marketing for food brands pays for itself inside the first 90 days on organic traffic captured. Redefine Web ships content marketing inside our monthly retainer packages. Book a call and we will walk through the last three DTC food brands we built recipe hubs for, pillar by pillar.
Content marketing for food brands starts with a recipe hub because recipe queries account for 40 to 60 percent of high-intent search volume in the food category. Every hero SKU needs 4 to 12 recipes anchored to it, each targeting a specific occasion and audience.
Skip the recipe hub and the brand loses the search real estate that pulls DTC storefront traffic month over month at zero incremental paid cost. Recipe traffic converts at 2 to 4 percent because the shopper landed with usage intent, not passive discovery, which is why food brands win on recipes.
Recipe schema and Google rich result eligibility
Every recipe page ships schema.org Recipe markup including cookTime, prepTime, recipeIngredient, recipeInstructions, nutrition, and aggregateRating. Correctly marked-up recipes qualify for Google’s recipe rich result carousel that pulls 3 to 6 times higher click-through rate than a plain blue link. The schema layer takes 15 minutes per recipe to author and 30 minutes to validate in Google Search Console. Cross-reference the recipe search stack on our food and beverage SEO page.
Recipe hub structure that scales
The recipe hub structure runs 40 to 100 recipes at maturity, organized by hero SKU (4 to 12 recipes per SKU) plus occasion tags (breakfast, weeknight dinner, meal prep, brunch, holiday). Every recipe links back to the hero SKU product page with the SKU embedded in an inline card. The hub earns internal linking value from ingredient comparison guides and the sourcing story pages, which feeds recipe ranking on Google. According to Google Search Central recipe structured data guidance, complete Recipe schema markup is required for eligibility in the recipe carousel and the ingredient search filter.
Pillar structure for food brand content marketing
The pillar structure on content marketing for food brands runs 4 content pillars concurrently: recipe hub (40 to 100 recipes), ingredient comparison guides (12 to 24 guides), sourcing story pages (6 to 12 pages), and buyer intent content (where to buy, subscription vs. one-time, gift bundle guides). Every pillar covers a distinct search intent and every pillar links back to the hero SKU product pages.
Ingredient comparison guide format
Ingredient comparison guides run 1,800 to 3,200 words comparing 2 to 4 ingredient types on 6 to 10 attributes with a comparison table, real-world use case examples, and links to the hero SKU that uses the specific ingredient. Example: organic vs. conventional oats compares nutritional profile, sourcing chain, cost, environmental impact, and taste on a 6-column table. The brand’s SKU appears in the winning column with a product card. These guides rank 3 to 8 months after publication and pull steady-state organic traffic.
Sourcing story pages that build trust
Sourcing story pages name the specific farms, cooperatives, or suppliers the brand sources from, with photos of the farms, farmer quotes, and specific harvest windows. A coffee brand’s Ethiopian farm page ranks for “single-origin Ethiopian coffee” and “Yirgacheffe coffee origin” plus 40 long-tail variations. The sourcing page pulls trust-building traffic that converts at 4 to 6 percent because the shopper landed pattern-matching on transparency and named provenance. Every sourcing page includes farmer or cooperative quotes, harvest dates, and a link back to 3 to 5 hero SKU pages that source from the named supplier.
Vejrø hospitality content case study
Vejrø Resort, a Danish private-island destination with an on-site restaurant focused on organic, locally sourced cuisine, joined us with strong social engagement and no organic-search real estate. Guests found the resort on Instagram but never in Google search for terms like “private island resort Denmark,” “farm-to-table hospitality Denmark,” or “Vejrø restaurant.” The same organic-search gap shows up on DTC food brands running paid social at 20,000 dollars monthly with a broken blog and zero recipe schema.
We built the conversion-focused website with on-site and off-site SEO tuned to the travel-niche keyword clusters, competitor analysis against comparable boutique resorts, and mobile-first design prioritizing guest discovery. Every page carried the structured data qualifying it for Google’s rich results in the hospitality category. Every internal link pushed authority toward the direct-booking conversion path.
Three months later, Vejrø hit 10,000 plus organic visitors, ranked for 200 plus first-page keywords, and pulled a 2.2 percent booking conversion rate from organic traffic. The same pattern applies to content marketing for food brands: recipe schema, ingredient comparison guides, and sourcing story pages pull organic traffic at 20 to 40 percent conversion into hero SKU pages inside 6 months when the content quality matches search intent and every page carries the right structured data markup. Vejrø also proved out the reporting discipline: every monthly report named the exact page, the exact keyword cluster, and the exact search feature (rich result, sitelinks, image pack) driving the incremental organic revenue instead of hiding behind aggregate traffic charts.
Recipe cadence and content calendar for food brands
Recipe cadence on a working food brand content calendar ships 2 to 4 new recipes per week during the first 6 months and drops to 1 per week at maturity. Each recipe takes 4 to 6 hours to produce (write, test in the kitchen, photograph, schema author, publish). At 3 recipes per week, the brand hits 78 recipes inside 6 months plus a backlog of ingredient comparison and sourcing content queued behind the recipe production line.
| Content pillar | Target volume year 1 | Production cost per piece | Refresh cadence |
|---|---|---|---|
| Recipe hub | 40 to 100 recipes | $180 to $320 | Every 12 months |
| Ingredient comparison guides | 12 to 24 guides | $450 to $780 | Every 18 months |
| Sourcing story pages | 6 to 12 pages | $680 to $1,200 | Every 24 months |
| Buyer intent content | 8 to 16 pieces | $220 to $420 | Every 12 months |
Photography as a content calendar constraint
Photography is the actual constraint on recipe cadence, not writing. Every recipe needs 6 to 12 photos: hero shot, ingredient flat lay, prep in progress, plated result, storage, and step shots for the schema markup. A working food brand batches photography 8 recipes at a time to keep the cost per recipe under 200 dollars. Skip the batching and the per-recipe cost climbs to 400 to 600 dollars, which caps recipe cadence at 1 per week and slows organic ranking timeline by 6 months.
Seasonal content calendar planning
Seasonal content calendar planning maps recipes and comparison guides to the seasonal windows they need to rank in. A Christmas cookie recipe needs to publish in September to rank by early December. A Valentine’s chocolate guide needs to publish in November to rank by early February. A back-to-school lunchbox recipe needs to publish in June to rank by late August. The 60-to-90-day ranking curve dictates the calendar.
Creator syndication inside food brand content
Creator syndication on food brand content marketing amplifies the recipe hub through Instagram Reels, TikTok, and YouTube Shorts creators paid to post their own version of the brand’s hero recipes. The creator content pulls net-new audiences into the recipe hub through the creator’s Link in Bio or Amazon Storefront tag. The syndication calendar names 12 to 30 creators per quarter with specific recipes assigned to each.
One brand we picked up had a spreadsheet titled “creator outreach 2023” with 47 rows and 3 responses. All 3 responses were auto-replies. The spreadsheet named zero recipes and offered flat rates below 100 dollars per post. Nobody posts a 30-second video for 87 dollars flat. Nobody.
Creator content commercial terms that work
Working creator content commercial terms run 350 to 1,500 dollars flat per post plus a 12 to 25 percent commission on tagged sales across a 30-day window. The commission mechanic pulls creators into follow-up posts because the incremental revenue continues past the initial fee. Mid-tier creators (30k to 150k followers) hit the sweet spot for food brand content because their engagement rate typically runs 4 to 8 percent versus 0.8 to 1.6 percent on mega-creators.
Content brief structure for creator partnerships
The content brief structure for creator partnerships runs a single page: the SKU, the specific recipe or usage occasion, 3 required brand mentions, 3 restricted claims (no health claims on non-medical SKUs), the pricing angle, the affiliate link, and 3 example videos that hit the tone. The brief avoids over-scripting because over-scripted creator content underperforms native creator voice by 40 to 60 percent on engagement rate.
Buyer intent content for food brand blogs
Buyer intent content on food brand blogs covers 8 to 16 pieces targeting explicit purchase-decision queries: “where to buy [brand],” “[brand] subscription vs. one-time,” “best [category] for [use case],” and “[brand] gift bundle.” Every buyer intent piece runs 1,400 to 2,400 words with a comparison table, product cards, and a clear conversion path to the specific SKU that matches the query intent. Buyer intent content converts at 3 to 6 percent versus 1 to 2 percent on recipe content because the shopper landed already planning to buy, not exploring a usage occasion.
Where-to-buy content structure
Where-to-buy content structure covers online (DTC storefront, Amazon, Target.com, Whole Foods online), retail (specific chain locators with the store finder embedded), and international (customs limitations, retailer partners abroad). Every piece names specific retailers, links to the store locator, and includes an FAQ block covering shipping availability, subscription options, and gift card compatibility. Where-to-buy content ranks for branded discovery queries the DTC storefront otherwise loses to competitor affiliate reviews.
Subscription versus one-time comparison content
Subscription versus one-time comparison content converts subscription commitments at 3 to 6 percent because it addresses the price-sensitivity concern head-on with a specific math table. The piece covers the discount structure (15 percent lifetime), the skip-a-month mechanic, the pause-anytime rule, the cancellation policy, and the specific yearly savings for the brand’s average consumption cadence. Cross-reference the retention structure on our food and beverage marketing retainer page.
Content refresh cadence on food brand pillars
Content refresh cadence on food brand content pillars runs a rolling audit every 12 to 24 months by pillar. Recipes get refreshed every 12 months with new photography, updated schema, and any nutrition or ingredient adjustments. Ingredient comparison guides refresh every 18 months to update market data. Sourcing story pages refresh every 24 months to reflect farm partnership changes and new harvest angles. Buyer intent content refreshes every 12 months to update retailer availability and pricing.
Recipe refresh priority order
Recipe refresh priority runs by organic traffic rank. The top 20 recipes by monthly organic sessions get refreshed first (new photography, schema audit, related recipe internal links, updated nutrition). The next 40 get refreshed at 15 months. The remaining recipes get refreshed opportunistically when the ranking slips past position 15 in Google. Skipping the refresh cadence lets recipe rankings drift out of the top 3 inside 18 months as newer competitor recipes take the position.
Schema audit checklist per refresh
The schema audit checklist per refresh runs 8 items: Recipe schema completeness, aggregateRating count and accuracy, nutrition data accuracy, prepTime and cookTime match the recipe body, image URLs valid at CDN, related recipe internal links working, product card SKU URL live, and Google Search Console rich result eligibility validated. This checklist takes 20 minutes per recipe and prevents the schema drift that costs recipe rankings 20 to 40 positions quietly.
Reporting cadence for food brand content marketing
Reporting cadence on food brand content marketing runs a monthly executive report plus a quarterly business review. The monthly report ships in the first business week and covers organic sessions by pillar, top 10 ranking recipes with position trend, ingredient guide ranking movements, sourcing page performance, and organic-attributed DTC revenue. Every number carries a comparison to the prior month and a plain-language interpretation the founder reads in 7 minutes.
Metrics that matter for content marketing
Metrics that matter for food brand content marketing: organic sessions by pillar, recipe rich result impressions in Search Console, organic conversion rate to hero SKU pages, organic-attributed DTC revenue, and top 20 ranking positions by monthly organic sessions. Vanity metrics that do not matter: total pageviews without conversion context, average time on page without conversion attribution, and social share counts. The monthly report skips the vanity block entirely.
Quarterly business review structure
The quarterly business review runs 90 minutes with the founder, head of content, and SEO lead. Agenda: organic traffic trend by pillar, top 10 winning content pieces, top 10 losing content pieces (candidates for refresh or removal), competitive gap analysis against 5 named competitor brands, and next quarter’s content calendar with recipes and ingredient guides queued. According to Ahrefs content marketing research, brands running quarterly content audits outperform brands running annual audits by 40 to 70 percent on organic revenue over a 24-month window.
Internal linking discipline across food brand content
Internal linking discipline across food brand content moves authority from recipe pages toward hero SKU product pages and comparison guides. Every recipe links to the hero SKU it uses inline (once in the ingredient list, once in a bottom call-out card). Every ingredient comparison guide links to 3 to 6 recipes using the winning ingredient plus the hero SKU product page. Every sourcing story links to the 2 to 4 SKUs sourced from that specific farm or cooperative.
Anchor text strategy across recipe hubs
Anchor text on internal links varies across recipe hubs to avoid over-optimization patterns Google penalizes. Exact-match anchor (“single-origin Ethiopian coffee”) runs on 20 to 30 percent of internal links. Partial-match variations (“our Ethiopian roast”) run on 30 to 40 percent. Branded anchors (the SKU name) run on 20 to 30 percent. Generic anchors (“shop the coffee”) fill the remaining 10 to 20 percent. This ratio holds ranking without triggering the over-optimization penalty that shows up on brands that anchor-text-stuff every internal link with the same exact-match keyword. Cross-reference the linking layer on our food and beverage web design page.
Link equity from ingredient guides to SKU pages
Link equity from ingredient guides passes to SKU pages when the guide’s comparison table names the hero SKU in the winning column with a product card, and when the guide’s body links to 3 to 6 recipes that use the winning ingredient. This 3-hop path (guide to recipe to SKU) pushes authority from a high-traffic informational query down to a high-intent transactional page. According to Search Engine Land SEO coverage, informational content that internally links to transactional pages produces 2 to 4 times higher organic revenue than isolated content silos.
Wrapping up content marketing for food brands
Content marketing for food brands is the organic engine that turns a DTC snack, drink, or CPG storefront into a search-driven revenue channel. Recipe hub of 40 to 100 recipes. Ingredient comparison guides at 12 to 24 pieces. Sourcing story pages at 6 to 12 pieces. Buyer intent content at 8 to 16 pieces. Creator syndication calendar with 12 to 30 creators per quarter. Refresh cadence at 12 to 24 months by pillar. Reporting with organic sessions and organic revenue attribution.
If your DTC food brand is running paid social at 20,000 dollars monthly with a broken blog and zero recipe schema, professional content marketing for food brands pays for itself inside the first 90 days on organic traffic captured. Redefine Web ships content marketing inside our monthly retainer packages. Book a call and we will walk through the last three DTC food brands we built recipe hubs for, pillar by pillar.
Content marketing for food brands starts with a recipe hub because recipe queries account for 40 to 60 percent of high-intent search volume in the food category. Every hero SKU needs 4 to 12 recipes anchored to it, each targeting a specific occasion and audience.
Skip the recipe hub and the brand loses the search real estate that pulls DTC storefront traffic month over month at zero incremental paid cost. Recipe traffic converts at 2 to 4 percent because the shopper landed with usage intent, not passive discovery, which is why food brands win on recipes.
Recipe schema and Google rich result eligibility
Every recipe page ships schema.org Recipe markup including cookTime, prepTime, recipeIngredient, recipeInstructions, nutrition, and aggregateRating. Correctly marked-up recipes qualify for Google’s recipe rich result carousel that pulls 3 to 6 times higher click-through rate than a plain blue link. The schema layer takes 15 minutes per recipe to author and 30 minutes to validate in Google Search Console. Cross-reference the recipe search stack on our food and beverage SEO page.
Recipe hub structure that scales
The recipe hub structure runs 40 to 100 recipes at maturity, organized by hero SKU (4 to 12 recipes per SKU) plus occasion tags (breakfast, weeknight dinner, meal prep, brunch, holiday). Every recipe links back to the hero SKU product page with the SKU embedded in an inline card. The hub earns internal linking value from ingredient comparison guides and the sourcing story pages, which feeds recipe ranking on Google. According to Google Search Central recipe structured data guidance, complete Recipe schema markup is required for eligibility in the recipe carousel and the ingredient search filter.
Pillar structure for food brand content marketing
The pillar structure on content marketing for food brands runs 4 content pillars concurrently: recipe hub (40 to 100 recipes), ingredient comparison guides (12 to 24 guides), sourcing story pages (6 to 12 pages), and buyer intent content (where to buy, subscription vs. one-time, gift bundle guides). Every pillar covers a distinct search intent and every pillar links back to the hero SKU product pages.
Ingredient comparison guide format
Ingredient comparison guides run 1,800 to 3,200 words comparing 2 to 4 ingredient types on 6 to 10 attributes with a comparison table, real-world use case examples, and links to the hero SKU that uses the specific ingredient. Example: organic vs. conventional oats compares nutritional profile, sourcing chain, cost, environmental impact, and taste on a 6-column table. The brand’s SKU appears in the winning column with a product card. These guides rank 3 to 8 months after publication and pull steady-state organic traffic.
Sourcing story pages that build trust
Sourcing story pages name the specific farms, cooperatives, or suppliers the brand sources from, with photos of the farms, farmer quotes, and specific harvest windows. A coffee brand’s Ethiopian farm page ranks for “single-origin Ethiopian coffee” and “Yirgacheffe coffee origin” plus 40 long-tail variations. The sourcing page pulls trust-building traffic that converts at 4 to 6 percent because the shopper landed pattern-matching on transparency and named provenance. Every sourcing page includes farmer or cooperative quotes, harvest dates, and a link back to 3 to 5 hero SKU pages that source from the named supplier.
Vejrø hospitality content case study
Vejrø Resort, a Danish private-island destination with an on-site restaurant focused on organic, locally sourced cuisine, joined us with strong social engagement and no organic-search real estate. Guests found the resort on Instagram but never in Google search for terms like “private island resort Denmark,” “farm-to-table hospitality Denmark,” or “Vejrø restaurant.” The same organic-search gap shows up on DTC food brands running paid social at 20,000 dollars monthly with a broken blog and zero recipe schema.
We built the conversion-focused website with on-site and off-site SEO tuned to the travel-niche keyword clusters, competitor analysis against comparable boutique resorts, and mobile-first design prioritizing guest discovery. Every page carried the structured data qualifying it for Google’s rich results in the hospitality category. Every internal link pushed authority toward the direct-booking conversion path.
Three months later, Vejrø hit 10,000 plus organic visitors, ranked for 200 plus first-page keywords, and pulled a 2.2 percent booking conversion rate from organic traffic. The same pattern applies to content marketing for food brands: recipe schema, ingredient comparison guides, and sourcing story pages pull organic traffic at 20 to 40 percent conversion into hero SKU pages inside 6 months when the content quality matches search intent and every page carries the right structured data markup. Vejrø also proved out the reporting discipline: every monthly report named the exact page, the exact keyword cluster, and the exact search feature (rich result, sitelinks, image pack) driving the incremental organic revenue instead of hiding behind aggregate traffic charts.
Recipe cadence and content calendar for food brands
Recipe cadence on a working food brand content calendar ships 2 to 4 new recipes per week during the first 6 months and drops to 1 per week at maturity. Each recipe takes 4 to 6 hours to produce (write, test in the kitchen, photograph, schema author, publish). At 3 recipes per week, the brand hits 78 recipes inside 6 months plus a backlog of ingredient comparison and sourcing content queued behind the recipe production line.
| Content pillar | Target volume year 1 | Production cost per piece | Refresh cadence |
|---|---|---|---|
| Recipe hub | 40 to 100 recipes | $180 to $320 | Every 12 months |
| Ingredient comparison guides | 12 to 24 guides | $450 to $780 | Every 18 months |
| Sourcing story pages | 6 to 12 pages | $680 to $1,200 | Every 24 months |
| Buyer intent content | 8 to 16 pieces | $220 to $420 | Every 12 months |
Photography as a content calendar constraint
Photography is the actual constraint on recipe cadence, not writing. Every recipe needs 6 to 12 photos: hero shot, ingredient flat lay, prep in progress, plated result, storage, and step shots for the schema markup. A working food brand batches photography 8 recipes at a time to keep the cost per recipe under 200 dollars. Skip the batching and the per-recipe cost climbs to 400 to 600 dollars, which caps recipe cadence at 1 per week and slows organic ranking timeline by 6 months.
Seasonal content calendar planning
Seasonal content calendar planning maps recipes and comparison guides to the seasonal windows they need to rank in. A Christmas cookie recipe needs to publish in September to rank by early December. A Valentine’s chocolate guide needs to publish in November to rank by early February. A back-to-school lunchbox recipe needs to publish in June to rank by late August. The 60-to-90-day ranking curve dictates the calendar.
Creator syndication inside food brand content
Creator syndication on food brand content marketing amplifies the recipe hub through Instagram Reels, TikTok, and YouTube Shorts creators paid to post their own version of the brand’s hero recipes. The creator content pulls net-new audiences into the recipe hub through the creator’s Link in Bio or Amazon Storefront tag. The syndication calendar names 12 to 30 creators per quarter with specific recipes assigned to each.
One brand we picked up had a spreadsheet titled “creator outreach 2023” with 47 rows and 3 responses. All 3 responses were auto-replies. The spreadsheet named zero recipes and offered flat rates below 100 dollars per post. Nobody posts a 30-second video for 87 dollars flat. Nobody.
Creator content commercial terms that work
Working creator content commercial terms run 350 to 1,500 dollars flat per post plus a 12 to 25 percent commission on tagged sales across a 30-day window. The commission mechanic pulls creators into follow-up posts because the incremental revenue continues past the initial fee. Mid-tier creators (30k to 150k followers) hit the sweet spot for food brand content because their engagement rate typically runs 4 to 8 percent versus 0.8 to 1.6 percent on mega-creators.
Content brief structure for creator partnerships
The content brief structure for creator partnerships runs a single page: the SKU, the specific recipe or usage occasion, 3 required brand mentions, 3 restricted claims (no health claims on non-medical SKUs), the pricing angle, the affiliate link, and 3 example videos that hit the tone. The brief avoids over-scripting because over-scripted creator content underperforms native creator voice by 40 to 60 percent on engagement rate.
Buyer intent content for food brand blogs
Buyer intent content on food brand blogs covers 8 to 16 pieces targeting explicit purchase-decision queries: “where to buy [brand],” “[brand] subscription vs. one-time,” “best [category] for [use case],” and “[brand] gift bundle.” Every buyer intent piece runs 1,400 to 2,400 words with a comparison table, product cards, and a clear conversion path to the specific SKU that matches the query intent. Buyer intent content converts at 3 to 6 percent versus 1 to 2 percent on recipe content because the shopper landed already planning to buy, not exploring a usage occasion.
Where-to-buy content structure
Where-to-buy content structure covers online (DTC storefront, Amazon, Target.com, Whole Foods online), retail (specific chain locators with the store finder embedded), and international (customs limitations, retailer partners abroad). Every piece names specific retailers, links to the store locator, and includes an FAQ block covering shipping availability, subscription options, and gift card compatibility. Where-to-buy content ranks for branded discovery queries the DTC storefront otherwise loses to competitor affiliate reviews.
Subscription versus one-time comparison content
Subscription versus one-time comparison content converts subscription commitments at 3 to 6 percent because it addresses the price-sensitivity concern head-on with a specific math table. The piece covers the discount structure (15 percent lifetime), the skip-a-month mechanic, the pause-anytime rule, the cancellation policy, and the specific yearly savings for the brand’s average consumption cadence. Cross-reference the retention structure on our food and beverage marketing retainer page.
Content refresh cadence on food brand pillars
Content refresh cadence on food brand content pillars runs a rolling audit every 12 to 24 months by pillar. Recipes get refreshed every 12 months with new photography, updated schema, and any nutrition or ingredient adjustments. Ingredient comparison guides refresh every 18 months to update market data. Sourcing story pages refresh every 24 months to reflect farm partnership changes and new harvest angles. Buyer intent content refreshes every 12 months to update retailer availability and pricing.
Recipe refresh priority order
Recipe refresh priority runs by organic traffic rank. The top 20 recipes by monthly organic sessions get refreshed first (new photography, schema audit, related recipe internal links, updated nutrition). The next 40 get refreshed at 15 months. The remaining recipes get refreshed opportunistically when the ranking slips past position 15 in Google. Skipping the refresh cadence lets recipe rankings drift out of the top 3 inside 18 months as newer competitor recipes take the position.
Schema audit checklist per refresh
The schema audit checklist per refresh runs 8 items: Recipe schema completeness, aggregateRating count and accuracy, nutrition data accuracy, prepTime and cookTime match the recipe body, image URLs valid at CDN, related recipe internal links working, product card SKU URL live, and Google Search Console rich result eligibility validated. This checklist takes 20 minutes per recipe and prevents the schema drift that costs recipe rankings 20 to 40 positions quietly.
Reporting cadence for food brand content marketing
Reporting cadence on food brand content marketing runs a monthly executive report plus a quarterly business review. The monthly report ships in the first business week and covers organic sessions by pillar, top 10 ranking recipes with position trend, ingredient guide ranking movements, sourcing page performance, and organic-attributed DTC revenue. Every number carries a comparison to the prior month and a plain-language interpretation the founder reads in 7 minutes.
Metrics that matter for content marketing
Metrics that matter for food brand content marketing: organic sessions by pillar, recipe rich result impressions in Search Console, organic conversion rate to hero SKU pages, organic-attributed DTC revenue, and top 20 ranking positions by monthly organic sessions. Vanity metrics that do not matter: total pageviews without conversion context, average time on page without conversion attribution, and social share counts. The monthly report skips the vanity block entirely.
Quarterly business review structure
The quarterly business review runs 90 minutes with the founder, head of content, and SEO lead. Agenda: organic traffic trend by pillar, top 10 winning content pieces, top 10 losing content pieces (candidates for refresh or removal), competitive gap analysis against 5 named competitor brands, and next quarter’s content calendar with recipes and ingredient guides queued. According to Ahrefs content marketing research, brands running quarterly content audits outperform brands running annual audits by 40 to 70 percent on organic revenue over a 24-month window.
Internal linking discipline across food brand content
Internal linking discipline across food brand content moves authority from recipe pages toward hero SKU product pages and comparison guides. Every recipe links to the hero SKU it uses inline (once in the ingredient list, once in a bottom call-out card). Every ingredient comparison guide links to 3 to 6 recipes using the winning ingredient plus the hero SKU product page. Every sourcing story links to the 2 to 4 SKUs sourced from that specific farm or cooperative.
Anchor text strategy across recipe hubs
Anchor text on internal links varies across recipe hubs to avoid over-optimization patterns Google penalizes. Exact-match anchor (“single-origin Ethiopian coffee”) runs on 20 to 30 percent of internal links. Partial-match variations (“our Ethiopian roast”) run on 30 to 40 percent. Branded anchors (the SKU name) run on 20 to 30 percent. Generic anchors (“shop the coffee”) fill the remaining 10 to 20 percent. This ratio holds ranking without triggering the over-optimization penalty that shows up on brands that anchor-text-stuff every internal link with the same exact-match keyword. Cross-reference the linking layer on our food and beverage web design page.
Link equity from ingredient guides to SKU pages
Link equity from ingredient guides passes to SKU pages when the guide’s comparison table names the hero SKU in the winning column with a product card, and when the guide’s body links to 3 to 6 recipes that use the winning ingredient. This 3-hop path (guide to recipe to SKU) pushes authority from a high-traffic informational query down to a high-intent transactional page. According to Search Engine Land SEO coverage, informational content that internally links to transactional pages produces 2 to 4 times higher organic revenue than isolated content silos.
Wrapping up content marketing for food brands
Content marketing for food brands is the organic engine that turns a DTC snack, drink, or CPG storefront into a search-driven revenue channel. Recipe hub of 40 to 100 recipes. Ingredient comparison guides at 12 to 24 pieces. Sourcing story pages at 6 to 12 pieces. Buyer intent content at 8 to 16 pieces. Creator syndication calendar with 12 to 30 creators per quarter. Refresh cadence at 12 to 24 months by pillar. Reporting with organic sessions and organic revenue attribution.
If your DTC food brand is running paid social at 20,000 dollars monthly with a broken blog and zero recipe schema, professional content marketing for food brands pays for itself inside the first 90 days on organic traffic captured. Redefine Web ships content marketing inside our monthly retainer packages. Book a call and we will walk through the last three DTC food brands we built recipe hubs for, pillar by pillar.
Anchor text on internal links varies across recipe hubs to avoid over-optimization patterns Google penalizes. Exact-match anchor (“single-origin Ethiopian coffee”) runs on 20 to 30 percent of internal links. Partial-match variations (“our Ethiopian roast”) run on 30 to 40 percent. Branded anchors (the SKU name) run on 20 to 30 percent. Generic anchors (“shop the coffee”) fill the remaining 10 to 20 percent. This ratio holds ranking without triggering the over-optimization penalty that shows up on brands that anchor-text-stuff every internal link with the same exact-match keyword. Cross-reference the linking layer on our food and beverage web design page.
Link equity from ingredient guides to SKU pages
Link equity from ingredient guides passes to SKU pages when the guide’s comparison table names the hero SKU in the winning column with a product card, and when the guide’s body links to 3 to 6 recipes that use the winning ingredient. This 3-hop path (guide to recipe to SKU) pushes authority from a high-traffic informational query down to a high-intent transactional page. According to Search Engine Land SEO coverage, informational content that internally links to transactional pages produces 2 to 4 times higher organic revenue than isolated content silos.
Wrapping up content marketing for food brands
Content marketing for food brands is the organic engine that turns a DTC snack, drink, or CPG storefront into a search-driven revenue channel. Recipe hub of 40 to 100 recipes. Ingredient comparison guides at 12 to 24 pieces. Sourcing story pages at 6 to 12 pieces. Buyer intent content at 8 to 16 pieces. Creator syndication calendar with 12 to 30 creators per quarter. Refresh cadence at 12 to 24 months by pillar. Reporting with organic sessions and organic revenue attribution.
If your DTC food brand is running paid social at 20,000 dollars monthly with a broken blog and zero recipe schema, professional content marketing for food brands pays for itself inside the first 90 days on organic traffic captured. Redefine Web ships content marketing inside our monthly retainer packages. Book a call and we will walk through the last three DTC food brands we built recipe hubs for, pillar by pillar.
Internal linking discipline across food brand content moves authority from recipe pages toward hero SKU product pages and comparison guides. Every recipe links to the hero SKU it uses inline (once in the ingredient list, once in a bottom call-out card). Every ingredient comparison guide links to 3 to 6 recipes using the winning ingredient plus the hero SKU product page. Every sourcing story links to the 2 to 4 SKUs sourced from that specific farm or cooperative.
Anchor text strategy across recipe hubs
Anchor text on internal links varies across recipe hubs to avoid over-optimization patterns Google penalizes. Exact-match anchor (“single-origin Ethiopian coffee”) runs on 20 to 30 percent of internal links. Partial-match variations (“our Ethiopian roast”) run on 30 to 40 percent. Branded anchors (the SKU name) run on 20 to 30 percent. Generic anchors (“shop the coffee”) fill the remaining 10 to 20 percent. This ratio holds ranking without triggering the over-optimization penalty that shows up on brands that anchor-text-stuff every internal link with the same exact-match keyword. Cross-reference the linking layer on our food and beverage web design page.
Link equity from ingredient guides to SKU pages
Link equity from ingredient guides passes to SKU pages when the guide’s comparison table names the hero SKU in the winning column with a product card, and when the guide’s body links to 3 to 6 recipes that use the winning ingredient. This 3-hop path (guide to recipe to SKU) pushes authority from a high-traffic informational query down to a high-intent transactional page. According to Search Engine Land SEO coverage, informational content that internally links to transactional pages produces 2 to 4 times higher organic revenue than isolated content silos.
Wrapping up content marketing for food brands
Content marketing for food brands is the organic engine that turns a DTC snack, drink, or CPG storefront into a search-driven revenue channel. Recipe hub of 40 to 100 recipes. Ingredient comparison guides at 12 to 24 pieces. Sourcing story pages at 6 to 12 pieces. Buyer intent content at 8 to 16 pieces. Creator syndication calendar with 12 to 30 creators per quarter. Refresh cadence at 12 to 24 months by pillar. Reporting with organic sessions and organic revenue attribution.
If your DTC food brand is running paid social at 20,000 dollars monthly with a broken blog and zero recipe schema, professional content marketing for food brands pays for itself inside the first 90 days on organic traffic captured. Redefine Web ships content marketing inside our monthly retainer packages. Book a call and we will walk through the last three DTC food brands we built recipe hubs for, pillar by pillar.
Content marketing for food brands starts with a recipe hub because recipe queries account for 40 to 60 percent of high-intent search volume in the food category. Every hero SKU needs 4 to 12 recipes anchored to it, each targeting a specific occasion and audience.
Skip the recipe hub and the brand loses the search real estate that pulls DTC storefront traffic month over month at zero incremental paid cost. Recipe traffic converts at 2 to 4 percent because the shopper landed with usage intent, not passive discovery, which is why food brands win on recipes.
Recipe schema and Google rich result eligibility
Every recipe page ships schema.org Recipe markup including cookTime, prepTime, recipeIngredient, recipeInstructions, nutrition, and aggregateRating. Correctly marked-up recipes qualify for Google’s recipe rich result carousel that pulls 3 to 6 times higher click-through rate than a plain blue link. The schema layer takes 15 minutes per recipe to author and 30 minutes to validate in Google Search Console. Cross-reference the recipe search stack on our food and beverage SEO page.
Recipe hub structure that scales
The recipe hub structure runs 40 to 100 recipes at maturity, organized by hero SKU (4 to 12 recipes per SKU) plus occasion tags (breakfast, weeknight dinner, meal prep, brunch, holiday). Every recipe links back to the hero SKU product page with the SKU embedded in an inline card. The hub earns internal linking value from ingredient comparison guides and the sourcing story pages, which feeds recipe ranking on Google. According to Google Search Central recipe structured data guidance, complete Recipe schema markup is required for eligibility in the recipe carousel and the ingredient search filter.
Pillar structure for food brand content marketing
The pillar structure on content marketing for food brands runs 4 content pillars concurrently: recipe hub (40 to 100 recipes), ingredient comparison guides (12 to 24 guides), sourcing story pages (6 to 12 pages), and buyer intent content (where to buy, subscription vs. one-time, gift bundle guides). Every pillar covers a distinct search intent and every pillar links back to the hero SKU product pages.
Ingredient comparison guide format
Ingredient comparison guides run 1,800 to 3,200 words comparing 2 to 4 ingredient types on 6 to 10 attributes with a comparison table, real-world use case examples, and links to the hero SKU that uses the specific ingredient. Example: organic vs. conventional oats compares nutritional profile, sourcing chain, cost, environmental impact, and taste on a 6-column table. The brand’s SKU appears in the winning column with a product card. These guides rank 3 to 8 months after publication and pull steady-state organic traffic.
Sourcing story pages that build trust
Sourcing story pages name the specific farms, cooperatives, or suppliers the brand sources from, with photos of the farms, farmer quotes, and specific harvest windows. A coffee brand’s Ethiopian farm page ranks for “single-origin Ethiopian coffee” and “Yirgacheffe coffee origin” plus 40 long-tail variations. The sourcing page pulls trust-building traffic that converts at 4 to 6 percent because the shopper landed pattern-matching on transparency and named provenance. Every sourcing page includes farmer or cooperative quotes, harvest dates, and a link back to 3 to 5 hero SKU pages that source from the named supplier.
Vejrø hospitality content case study
Vejrø Resort, a Danish private-island destination with an on-site restaurant focused on organic, locally sourced cuisine, joined us with strong social engagement and no organic-search real estate. Guests found the resort on Instagram but never in Google search for terms like “private island resort Denmark,” “farm-to-table hospitality Denmark,” or “Vejrø restaurant.” The same organic-search gap shows up on DTC food brands running paid social at 20,000 dollars monthly with a broken blog and zero recipe schema.
We built the conversion-focused website with on-site and off-site SEO tuned to the travel-niche keyword clusters, competitor analysis against comparable boutique resorts, and mobile-first design prioritizing guest discovery. Every page carried the structured data qualifying it for Google’s rich results in the hospitality category. Every internal link pushed authority toward the direct-booking conversion path.
Three months later, Vejrø hit 10,000 plus organic visitors, ranked for 200 plus first-page keywords, and pulled a 2.2 percent booking conversion rate from organic traffic. The same pattern applies to content marketing for food brands: recipe schema, ingredient comparison guides, and sourcing story pages pull organic traffic at 20 to 40 percent conversion into hero SKU pages inside 6 months when the content quality matches search intent and every page carries the right structured data markup. Vejrø also proved out the reporting discipline: every monthly report named the exact page, the exact keyword cluster, and the exact search feature (rich result, sitelinks, image pack) driving the incremental organic revenue instead of hiding behind aggregate traffic charts.
Recipe cadence and content calendar for food brands
Recipe cadence on a working food brand content calendar ships 2 to 4 new recipes per week during the first 6 months and drops to 1 per week at maturity. Each recipe takes 4 to 6 hours to produce (write, test in the kitchen, photograph, schema author, publish). At 3 recipes per week, the brand hits 78 recipes inside 6 months plus a backlog of ingredient comparison and sourcing content queued behind the recipe production line.
| Content pillar | Target volume year 1 | Production cost per piece | Refresh cadence |
|---|---|---|---|
| Recipe hub | 40 to 100 recipes | $180 to $320 | Every 12 months |
| Ingredient comparison guides | 12 to 24 guides | $450 to $780 | Every 18 months |
| Sourcing story pages | 6 to 12 pages | $680 to $1,200 | Every 24 months |
| Buyer intent content | 8 to 16 pieces | $220 to $420 | Every 12 months |
Photography as a content calendar constraint
Photography is the actual constraint on recipe cadence, not writing. Every recipe needs 6 to 12 photos: hero shot, ingredient flat lay, prep in progress, plated result, storage, and step shots for the schema markup. A working food brand batches photography 8 recipes at a time to keep the cost per recipe under 200 dollars. Skip the batching and the per-recipe cost climbs to 400 to 600 dollars, which caps recipe cadence at 1 per week and slows organic ranking timeline by 6 months.
Seasonal content calendar planning
Seasonal content calendar planning maps recipes and comparison guides to the seasonal windows they need to rank in. A Christmas cookie recipe needs to publish in September to rank by early December. A Valentine’s chocolate guide needs to publish in November to rank by early February. A back-to-school lunchbox recipe needs to publish in June to rank by late August. The 60-to-90-day ranking curve dictates the calendar.
Creator syndication inside food brand content
Creator syndication on food brand content marketing amplifies the recipe hub through Instagram Reels, TikTok, and YouTube Shorts creators paid to post their own version of the brand’s hero recipes. The creator content pulls net-new audiences into the recipe hub through the creator’s Link in Bio or Amazon Storefront tag. The syndication calendar names 12 to 30 creators per quarter with specific recipes assigned to each.
One brand we picked up had a spreadsheet titled “creator outreach 2023” with 47 rows and 3 responses. All 3 responses were auto-replies. The spreadsheet named zero recipes and offered flat rates below 100 dollars per post. Nobody posts a 30-second video for 87 dollars flat. Nobody.
Creator content commercial terms that work
Working creator content commercial terms run 350 to 1,500 dollars flat per post plus a 12 to 25 percent commission on tagged sales across a 30-day window. The commission mechanic pulls creators into follow-up posts because the incremental revenue continues past the initial fee. Mid-tier creators (30k to 150k followers) hit the sweet spot for food brand content because their engagement rate typically runs 4 to 8 percent versus 0.8 to 1.6 percent on mega-creators.
Content brief structure for creator partnerships
The content brief structure for creator partnerships runs a single page: the SKU, the specific recipe or usage occasion, 3 required brand mentions, 3 restricted claims (no health claims on non-medical SKUs), the pricing angle, the affiliate link, and 3 example videos that hit the tone. The brief avoids over-scripting because over-scripted creator content underperforms native creator voice by 40 to 60 percent on engagement rate.
Buyer intent content for food brand blogs
Buyer intent content on food brand blogs covers 8 to 16 pieces targeting explicit purchase-decision queries: “where to buy [brand],” “[brand] subscription vs. one-time,” “best [category] for [use case],” and “[brand] gift bundle.” Every buyer intent piece runs 1,400 to 2,400 words with a comparison table, product cards, and a clear conversion path to the specific SKU that matches the query intent. Buyer intent content converts at 3 to 6 percent versus 1 to 2 percent on recipe content because the shopper landed already planning to buy, not exploring a usage occasion.
Where-to-buy content structure
Where-to-buy content structure covers online (DTC storefront, Amazon, Target.com, Whole Foods online), retail (specific chain locators with the store finder embedded), and international (customs limitations, retailer partners abroad). Every piece names specific retailers, links to the store locator, and includes an FAQ block covering shipping availability, subscription options, and gift card compatibility. Where-to-buy content ranks for branded discovery queries the DTC storefront otherwise loses to competitor affiliate reviews.
Subscription versus one-time comparison content
Subscription versus one-time comparison content converts subscription commitments at 3 to 6 percent because it addresses the price-sensitivity concern head-on with a specific math table. The piece covers the discount structure (15 percent lifetime), the skip-a-month mechanic, the pause-anytime rule, the cancellation policy, and the specific yearly savings for the brand’s average consumption cadence. Cross-reference the retention structure on our food and beverage marketing retainer page.
Content refresh cadence on food brand pillars
Content refresh cadence on food brand content pillars runs a rolling audit every 12 to 24 months by pillar. Recipes get refreshed every 12 months with new photography, updated schema, and any nutrition or ingredient adjustments. Ingredient comparison guides refresh every 18 months to update market data. Sourcing story pages refresh every 24 months to reflect farm partnership changes and new harvest angles. Buyer intent content refreshes every 12 months to update retailer availability and pricing.
Recipe refresh priority order
Recipe refresh priority runs by organic traffic rank. The top 20 recipes by monthly organic sessions get refreshed first (new photography, schema audit, related recipe internal links, updated nutrition). The next 40 get refreshed at 15 months. The remaining recipes get refreshed opportunistically when the ranking slips past position 15 in Google. Skipping the refresh cadence lets recipe rankings drift out of the top 3 inside 18 months as newer competitor recipes take the position.
Schema audit checklist per refresh
The schema audit checklist per refresh runs 8 items: Recipe schema completeness, aggregateRating count and accuracy, nutrition data accuracy, prepTime and cookTime match the recipe body, image URLs valid at CDN, related recipe internal links working, product card SKU URL live, and Google Search Console rich result eligibility validated. This checklist takes 20 minutes per recipe and prevents the schema drift that costs recipe rankings 20 to 40 positions quietly.
Reporting cadence for food brand content marketing
Reporting cadence on food brand content marketing runs a monthly executive report plus a quarterly business review. The monthly report ships in the first business week and covers organic sessions by pillar, top 10 ranking recipes with position trend, ingredient guide ranking movements, sourcing page performance, and organic-attributed DTC revenue. Every number carries a comparison to the prior month and a plain-language interpretation the founder reads in 7 minutes.
Metrics that matter for content marketing
Metrics that matter for food brand content marketing: organic sessions by pillar, recipe rich result impressions in Search Console, organic conversion rate to hero SKU pages, organic-attributed DTC revenue, and top 20 ranking positions by monthly organic sessions. Vanity metrics that do not matter: total pageviews without conversion context, average time on page without conversion attribution, and social share counts. The monthly report skips the vanity block entirely.
Quarterly business review structure
The quarterly business review runs 90 minutes with the founder, head of content, and SEO lead. Agenda: organic traffic trend by pillar, top 10 winning content pieces, top 10 losing content pieces (candidates for refresh or removal), competitive gap analysis against 5 named competitor brands, and next quarter’s content calendar with recipes and ingredient guides queued. According to Ahrefs content marketing research, brands running quarterly content audits outperform brands running annual audits by 40 to 70 percent on organic revenue over a 24-month window.
Internal linking discipline across food brand content
Internal linking discipline across food brand content moves authority from recipe pages toward hero SKU product pages and comparison guides. Every recipe links to the hero SKU it uses inline (once in the ingredient list, once in a bottom call-out card). Every ingredient comparison guide links to 3 to 6 recipes using the winning ingredient plus the hero SKU product page. Every sourcing story links to the 2 to 4 SKUs sourced from that specific farm or cooperative.
Anchor text strategy across recipe hubs
Anchor text on internal links varies across recipe hubs to avoid over-optimization patterns Google penalizes. Exact-match anchor (“single-origin Ethiopian coffee”) runs on 20 to 30 percent of internal links. Partial-match variations (“our Ethiopian roast”) run on 30 to 40 percent. Branded anchors (the SKU name) run on 20 to 30 percent. Generic anchors (“shop the coffee”) fill the remaining 10 to 20 percent. This ratio holds ranking without triggering the over-optimization penalty that shows up on brands that anchor-text-stuff every internal link with the same exact-match keyword. Cross-reference the linking layer on our food and beverage web design page.
Link equity from ingredient guides to SKU pages
Link equity from ingredient guides passes to SKU pages when the guide’s comparison table names the hero SKU in the winning column with a product card, and when the guide’s body links to 3 to 6 recipes that use the winning ingredient. This 3-hop path (guide to recipe to SKU) pushes authority from a high-traffic informational query down to a high-intent transactional page. According to Search Engine Land SEO coverage, informational content that internally links to transactional pages produces 2 to 4 times higher organic revenue than isolated content silos.
Wrapping up content marketing for food brands
Content marketing for food brands is the organic engine that turns a DTC snack, drink, or CPG storefront into a search-driven revenue channel. Recipe hub of 40 to 100 recipes. Ingredient comparison guides at 12 to 24 pieces. Sourcing story pages at 6 to 12 pieces. Buyer intent content at 8 to 16 pieces. Creator syndication calendar with 12 to 30 creators per quarter. Refresh cadence at 12 to 24 months by pillar. Reporting with organic sessions and organic revenue attribution.
If your DTC food brand is running paid social at 20,000 dollars monthly with a broken blog and zero recipe schema, professional content marketing for food brands pays for itself inside the first 90 days on organic traffic captured. Redefine Web ships content marketing inside our monthly retainer packages. Book a call and we will walk through the last three DTC food brands we built recipe hubs for, pillar by pillar.
Content marketing for food brands starts with a recipe hub because recipe queries account for 40 to 60 percent of high-intent search volume in the food category. Every hero SKU needs 4 to 12 recipes anchored to it, each targeting a specific occasion and audience.
Skip the recipe hub and the brand loses the search real estate that pulls DTC storefront traffic month over month at zero incremental paid cost. Recipe traffic converts at 2 to 4 percent because the shopper landed with usage intent, not passive discovery, which is why food brands win on recipes.
Recipe schema and Google rich result eligibility
Every recipe page ships schema.org Recipe markup including cookTime, prepTime, recipeIngredient, recipeInstructions, nutrition, and aggregateRating. Correctly marked-up recipes qualify for Google’s recipe rich result carousel that pulls 3 to 6 times higher click-through rate than a plain blue link. The schema layer takes 15 minutes per recipe to author and 30 minutes to validate in Google Search Console. Cross-reference the recipe search stack on our food and beverage SEO page.
Recipe hub structure that scales
The recipe hub structure runs 40 to 100 recipes at maturity, organized by hero SKU (4 to 12 recipes per SKU) plus occasion tags (breakfast, weeknight dinner, meal prep, brunch, holiday). Every recipe links back to the hero SKU product page with the SKU embedded in an inline card. The hub earns internal linking value from ingredient comparison guides and the sourcing story pages, which feeds recipe ranking on Google. According to Google Search Central recipe structured data guidance, complete Recipe schema markup is required for eligibility in the recipe carousel and the ingredient search filter.
Pillar structure for food brand content marketing
The pillar structure on content marketing for food brands runs 4 content pillars concurrently: recipe hub (40 to 100 recipes), ingredient comparison guides (12 to 24 guides), sourcing story pages (6 to 12 pages), and buyer intent content (where to buy, subscription vs. one-time, gift bundle guides). Every pillar covers a distinct search intent and every pillar links back to the hero SKU product pages.
Ingredient comparison guide format
Ingredient comparison guides run 1,800 to 3,200 words comparing 2 to 4 ingredient types on 6 to 10 attributes with a comparison table, real-world use case examples, and links to the hero SKU that uses the specific ingredient. Example: organic vs. conventional oats compares nutritional profile, sourcing chain, cost, environmental impact, and taste on a 6-column table. The brand’s SKU appears in the winning column with a product card. These guides rank 3 to 8 months after publication and pull steady-state organic traffic.
Sourcing story pages that build trust
Sourcing story pages name the specific farms, cooperatives, or suppliers the brand sources from, with photos of the farms, farmer quotes, and specific harvest windows. A coffee brand’s Ethiopian farm page ranks for “single-origin Ethiopian coffee” and “Yirgacheffe coffee origin” plus 40 long-tail variations. The sourcing page pulls trust-building traffic that converts at 4 to 6 percent because the shopper landed pattern-matching on transparency and named provenance. Every sourcing page includes farmer or cooperative quotes, harvest dates, and a link back to 3 to 5 hero SKU pages that source from the named supplier.
Vejrø hospitality content case study
Vejrø Resort, a Danish private-island destination with an on-site restaurant focused on organic, locally sourced cuisine, joined us with strong social engagement and no organic-search real estate. Guests found the resort on Instagram but never in Google search for terms like “private island resort Denmark,” “farm-to-table hospitality Denmark,” or “Vejrø restaurant.” The same organic-search gap shows up on DTC food brands running paid social at 20,000 dollars monthly with a broken blog and zero recipe schema.
We built the conversion-focused website with on-site and off-site SEO tuned to the travel-niche keyword clusters, competitor analysis against comparable boutique resorts, and mobile-first design prioritizing guest discovery. Every page carried the structured data qualifying it for Google’s rich results in the hospitality category. Every internal link pushed authority toward the direct-booking conversion path.
Three months later, Vejrø hit 10,000 plus organic visitors, ranked for 200 plus first-page keywords, and pulled a 2.2 percent booking conversion rate from organic traffic. The same pattern applies to content marketing for food brands: recipe schema, ingredient comparison guides, and sourcing story pages pull organic traffic at 20 to 40 percent conversion into hero SKU pages inside 6 months when the content quality matches search intent and every page carries the right structured data markup. Vejrø also proved out the reporting discipline: every monthly report named the exact page, the exact keyword cluster, and the exact search feature (rich result, sitelinks, image pack) driving the incremental organic revenue instead of hiding behind aggregate traffic charts.
Recipe cadence and content calendar for food brands
Recipe cadence on a working food brand content calendar ships 2 to 4 new recipes per week during the first 6 months and drops to 1 per week at maturity. Each recipe takes 4 to 6 hours to produce (write, test in the kitchen, photograph, schema author, publish). At 3 recipes per week, the brand hits 78 recipes inside 6 months plus a backlog of ingredient comparison and sourcing content queued behind the recipe production line.
| Content pillar | Target volume year 1 | Production cost per piece | Refresh cadence |
|---|---|---|---|
| Recipe hub | 40 to 100 recipes | $180 to $320 | Every 12 months |
| Ingredient comparison guides | 12 to 24 guides | $450 to $780 | Every 18 months |
| Sourcing story pages | 6 to 12 pages | $680 to $1,200 | Every 24 months |
| Buyer intent content | 8 to 16 pieces | $220 to $420 | Every 12 months |
Photography as a content calendar constraint
Photography is the actual constraint on recipe cadence, not writing. Every recipe needs 6 to 12 photos: hero shot, ingredient flat lay, prep in progress, plated result, storage, and step shots for the schema markup. A working food brand batches photography 8 recipes at a time to keep the cost per recipe under 200 dollars. Skip the batching and the per-recipe cost climbs to 400 to 600 dollars, which caps recipe cadence at 1 per week and slows organic ranking timeline by 6 months.
Seasonal content calendar planning
Seasonal content calendar planning maps recipes and comparison guides to the seasonal windows they need to rank in. A Christmas cookie recipe needs to publish in September to rank by early December. A Valentine’s chocolate guide needs to publish in November to rank by early February. A back-to-school lunchbox recipe needs to publish in June to rank by late August. The 60-to-90-day ranking curve dictates the calendar.
Creator syndication inside food brand content
Creator syndication on food brand content marketing amplifies the recipe hub through Instagram Reels, TikTok, and YouTube Shorts creators paid to post their own version of the brand’s hero recipes. The creator content pulls net-new audiences into the recipe hub through the creator’s Link in Bio or Amazon Storefront tag. The syndication calendar names 12 to 30 creators per quarter with specific recipes assigned to each.
One brand we picked up had a spreadsheet titled “creator outreach 2023” with 47 rows and 3 responses. All 3 responses were auto-replies. The spreadsheet named zero recipes and offered flat rates below 100 dollars per post. Nobody posts a 30-second video for 87 dollars flat. Nobody.
Creator content commercial terms that work
Working creator content commercial terms run 350 to 1,500 dollars flat per post plus a 12 to 25 percent commission on tagged sales across a 30-day window. The commission mechanic pulls creators into follow-up posts because the incremental revenue continues past the initial fee. Mid-tier creators (30k to 150k followers) hit the sweet spot for food brand content because their engagement rate typically runs 4 to 8 percent versus 0.8 to 1.6 percent on mega-creators.
Content brief structure for creator partnerships
The content brief structure for creator partnerships runs a single page: the SKU, the specific recipe or usage occasion, 3 required brand mentions, 3 restricted claims (no health claims on non-medical SKUs), the pricing angle, the affiliate link, and 3 example videos that hit the tone. The brief avoids over-scripting because over-scripted creator content underperforms native creator voice by 40 to 60 percent on engagement rate.
Buyer intent content for food brand blogs
Buyer intent content on food brand blogs covers 8 to 16 pieces targeting explicit purchase-decision queries: “where to buy [brand],” “[brand] subscription vs. one-time,” “best [category] for [use case],” and “[brand] gift bundle.” Every buyer intent piece runs 1,400 to 2,400 words with a comparison table, product cards, and a clear conversion path to the specific SKU that matches the query intent. Buyer intent content converts at 3 to 6 percent versus 1 to 2 percent on recipe content because the shopper landed already planning to buy, not exploring a usage occasion.
Where-to-buy content structure
Where-to-buy content structure covers online (DTC storefront, Amazon, Target.com, Whole Foods online), retail (specific chain locators with the store finder embedded), and international (customs limitations, retailer partners abroad). Every piece names specific retailers, links to the store locator, and includes an FAQ block covering shipping availability, subscription options, and gift card compatibility. Where-to-buy content ranks for branded discovery queries the DTC storefront otherwise loses to competitor affiliate reviews.
Subscription versus one-time comparison content
Subscription versus one-time comparison content converts subscription commitments at 3 to 6 percent because it addresses the price-sensitivity concern head-on with a specific math table. The piece covers the discount structure (15 percent lifetime), the skip-a-month mechanic, the pause-anytime rule, the cancellation policy, and the specific yearly savings for the brand’s average consumption cadence. Cross-reference the retention structure on our food and beverage marketing retainer page.
Content refresh cadence on food brand pillars
Content refresh cadence on food brand content pillars runs a rolling audit every 12 to 24 months by pillar. Recipes get refreshed every 12 months with new photography, updated schema, and any nutrition or ingredient adjustments. Ingredient comparison guides refresh every 18 months to update market data. Sourcing story pages refresh every 24 months to reflect farm partnership changes and new harvest angles. Buyer intent content refreshes every 12 months to update retailer availability and pricing.
Recipe refresh priority order
Recipe refresh priority runs by organic traffic rank. The top 20 recipes by monthly organic sessions get refreshed first (new photography, schema audit, related recipe internal links, updated nutrition). The next 40 get refreshed at 15 months. The remaining recipes get refreshed opportunistically when the ranking slips past position 15 in Google. Skipping the refresh cadence lets recipe rankings drift out of the top 3 inside 18 months as newer competitor recipes take the position.
Schema audit checklist per refresh
The schema audit checklist per refresh runs 8 items: Recipe schema completeness, aggregateRating count and accuracy, nutrition data accuracy, prepTime and cookTime match the recipe body, image URLs valid at CDN, related recipe internal links working, product card SKU URL live, and Google Search Console rich result eligibility validated. This checklist takes 20 minutes per recipe and prevents the schema drift that costs recipe rankings 20 to 40 positions quietly.
Reporting cadence for food brand content marketing
Reporting cadence on food brand content marketing runs a monthly executive report plus a quarterly business review. The monthly report ships in the first business week and covers organic sessions by pillar, top 10 ranking recipes with position trend, ingredient guide ranking movements, sourcing page performance, and organic-attributed DTC revenue. Every number carries a comparison to the prior month and a plain-language interpretation the founder reads in 7 minutes.
Metrics that matter for content marketing
Metrics that matter for food brand content marketing: organic sessions by pillar, recipe rich result impressions in Search Console, organic conversion rate to hero SKU pages, organic-attributed DTC revenue, and top 20 ranking positions by monthly organic sessions. Vanity metrics that do not matter: total pageviews without conversion context, average time on page without conversion attribution, and social share counts. The monthly report skips the vanity block entirely.
Quarterly business review structure
The quarterly business review runs 90 minutes with the founder, head of content, and SEO lead. Agenda: organic traffic trend by pillar, top 10 winning content pieces, top 10 losing content pieces (candidates for refresh or removal), competitive gap analysis against 5 named competitor brands, and next quarter’s content calendar with recipes and ingredient guides queued. According to Ahrefs content marketing research, brands running quarterly content audits outperform brands running annual audits by 40 to 70 percent on organic revenue over a 24-month window.
Internal linking discipline across food brand content
Internal linking discipline across food brand content moves authority from recipe pages toward hero SKU product pages and comparison guides. Every recipe links to the hero SKU it uses inline (once in the ingredient list, once in a bottom call-out card). Every ingredient comparison guide links to 3 to 6 recipes using the winning ingredient plus the hero SKU product page. Every sourcing story links to the 2 to 4 SKUs sourced from that specific farm or cooperative.
Anchor text strategy across recipe hubs
Anchor text on internal links varies across recipe hubs to avoid over-optimization patterns Google penalizes. Exact-match anchor (“single-origin Ethiopian coffee”) runs on 20 to 30 percent of internal links. Partial-match variations (“our Ethiopian roast”) run on 30 to 40 percent. Branded anchors (the SKU name) run on 20 to 30 percent. Generic anchors (“shop the coffee”) fill the remaining 10 to 20 percent. This ratio holds ranking without triggering the over-optimization penalty that shows up on brands that anchor-text-stuff every internal link with the same exact-match keyword. Cross-reference the linking layer on our food and beverage web design page.
Link equity from ingredient guides to SKU pages
Link equity from ingredient guides passes to SKU pages when the guide’s comparison table names the hero SKU in the winning column with a product card, and when the guide’s body links to 3 to 6 recipes that use the winning ingredient. This 3-hop path (guide to recipe to SKU) pushes authority from a high-traffic informational query down to a high-intent transactional page. According to Search Engine Land SEO coverage, informational content that internally links to transactional pages produces 2 to 4 times higher organic revenue than isolated content silos.
Wrapping up content marketing for food brands
Content marketing for food brands is the organic engine that turns a DTC snack, drink, or CPG storefront into a search-driven revenue channel. Recipe hub of 40 to 100 recipes. Ingredient comparison guides at 12 to 24 pieces. Sourcing story pages at 6 to 12 pieces. Buyer intent content at 8 to 16 pieces. Creator syndication calendar with 12 to 30 creators per quarter. Refresh cadence at 12 to 24 months by pillar. Reporting with organic sessions and organic revenue attribution.
If your DTC food brand is running paid social at 20,000 dollars monthly with a broken blog and zero recipe schema, professional content marketing for food brands pays for itself inside the first 90 days on organic traffic captured. Redefine Web ships content marketing inside our monthly retainer packages. Book a call and we will walk through the last three DTC food brands we built recipe hubs for, pillar by pillar.
Content marketing for food brands starts with a recipe hub because recipe queries account for 40 to 60 percent of high-intent search volume in the food category. Every hero SKU needs 4 to 12 recipes anchored to it, each targeting a specific occasion and audience.
Skip the recipe hub and the brand loses the search real estate that pulls DTC storefront traffic month over month at zero incremental paid cost. Recipe traffic converts at 2 to 4 percent because the shopper landed with usage intent, not passive discovery, which is why food brands win on recipes.
Recipe schema and Google rich result eligibility
Every recipe page ships schema.org Recipe markup including cookTime, prepTime, recipeIngredient, recipeInstructions, nutrition, and aggregateRating. Correctly marked-up recipes qualify for Google’s recipe rich result carousel that pulls 3 to 6 times higher click-through rate than a plain blue link. The schema layer takes 15 minutes per recipe to author and 30 minutes to validate in Google Search Console. Cross-reference the recipe search stack on our food and beverage SEO page.
Recipe hub structure that scales
The recipe hub structure runs 40 to 100 recipes at maturity, organized by hero SKU (4 to 12 recipes per SKU) plus occasion tags (breakfast, weeknight dinner, meal prep, brunch, holiday). Every recipe links back to the hero SKU product page with the SKU embedded in an inline card. The hub earns internal linking value from ingredient comparison guides and the sourcing story pages, which feeds recipe ranking on Google. According to Google Search Central recipe structured data guidance, complete Recipe schema markup is required for eligibility in the recipe carousel and the ingredient search filter.
Pillar structure for food brand content marketing
The pillar structure on content marketing for food brands runs 4 content pillars concurrently: recipe hub (40 to 100 recipes), ingredient comparison guides (12 to 24 guides), sourcing story pages (6 to 12 pages), and buyer intent content (where to buy, subscription vs. one-time, gift bundle guides). Every pillar covers a distinct search intent and every pillar links back to the hero SKU product pages.
Ingredient comparison guide format
Ingredient comparison guides run 1,800 to 3,200 words comparing 2 to 4 ingredient types on 6 to 10 attributes with a comparison table, real-world use case examples, and links to the hero SKU that uses the specific ingredient. Example: organic vs. conventional oats compares nutritional profile, sourcing chain, cost, environmental impact, and taste on a 6-column table. The brand’s SKU appears in the winning column with a product card. These guides rank 3 to 8 months after publication and pull steady-state organic traffic.
Sourcing story pages that build trust
Sourcing story pages name the specific farms, cooperatives, or suppliers the brand sources from, with photos of the farms, farmer quotes, and specific harvest windows. A coffee brand’s Ethiopian farm page ranks for “single-origin Ethiopian coffee” and “Yirgacheffe coffee origin” plus 40 long-tail variations. The sourcing page pulls trust-building traffic that converts at 4 to 6 percent because the shopper landed pattern-matching on transparency and named provenance. Every sourcing page includes farmer or cooperative quotes, harvest dates, and a link back to 3 to 5 hero SKU pages that source from the named supplier.
Vejrø hospitality content case study
Vejrø Resort, a Danish private-island destination with an on-site restaurant focused on organic, locally sourced cuisine, joined us with strong social engagement and no organic-search real estate. Guests found the resort on Instagram but never in Google search for terms like “private island resort Denmark,” “farm-to-table hospitality Denmark,” or “Vejrø restaurant.” The same organic-search gap shows up on DTC food brands running paid social at 20,000 dollars monthly with a broken blog and zero recipe schema.
We built the conversion-focused website with on-site and off-site SEO tuned to the travel-niche keyword clusters, competitor analysis against comparable boutique resorts, and mobile-first design prioritizing guest discovery. Every page carried the structured data qualifying it for Google’s rich results in the hospitality category. Every internal link pushed authority toward the direct-booking conversion path.
Three months later, Vejrø hit 10,000 plus organic visitors, ranked for 200 plus first-page keywords, and pulled a 2.2 percent booking conversion rate from organic traffic. The same pattern applies to content marketing for food brands: recipe schema, ingredient comparison guides, and sourcing story pages pull organic traffic at 20 to 40 percent conversion into hero SKU pages inside 6 months when the content quality matches search intent and every page carries the right structured data markup. Vejrø also proved out the reporting discipline: every monthly report named the exact page, the exact keyword cluster, and the exact search feature (rich result, sitelinks, image pack) driving the incremental organic revenue instead of hiding behind aggregate traffic charts.
Recipe cadence and content calendar for food brands
Recipe cadence on a working food brand content calendar ships 2 to 4 new recipes per week during the first 6 months and drops to 1 per week at maturity. Each recipe takes 4 to 6 hours to produce (write, test in the kitchen, photograph, schema author, publish). At 3 recipes per week, the brand hits 78 recipes inside 6 months plus a backlog of ingredient comparison and sourcing content queued behind the recipe production line.
| Content pillar | Target volume year 1 | Production cost per piece | Refresh cadence |
|---|---|---|---|
| Recipe hub | 40 to 100 recipes | $180 to $320 | Every 12 months |
| Ingredient comparison guides | 12 to 24 guides | $450 to $780 | Every 18 months |
| Sourcing story pages | 6 to 12 pages | $680 to $1,200 | Every 24 months |
| Buyer intent content | 8 to 16 pieces | $220 to $420 | Every 12 months |
Photography as a content calendar constraint
Photography is the actual constraint on recipe cadence, not writing. Every recipe needs 6 to 12 photos: hero shot, ingredient flat lay, prep in progress, plated result, storage, and step shots for the schema markup. A working food brand batches photography 8 recipes at a time to keep the cost per recipe under 200 dollars. Skip the batching and the per-recipe cost climbs to 400 to 600 dollars, which caps recipe cadence at 1 per week and slows organic ranking timeline by 6 months.
Seasonal content calendar planning
Seasonal content calendar planning maps recipes and comparison guides to the seasonal windows they need to rank in. A Christmas cookie recipe needs to publish in September to rank by early December. A Valentine’s chocolate guide needs to publish in November to rank by early February. A back-to-school lunchbox recipe needs to publish in June to rank by late August. The 60-to-90-day ranking curve dictates the calendar.
Creator syndication inside food brand content
Creator syndication on food brand content marketing amplifies the recipe hub through Instagram Reels, TikTok, and YouTube Shorts creators paid to post their own version of the brand’s hero recipes. The creator content pulls net-new audiences into the recipe hub through the creator’s Link in Bio or Amazon Storefront tag. The syndication calendar names 12 to 30 creators per quarter with specific recipes assigned to each.
One brand we picked up had a spreadsheet titled “creator outreach 2023” with 47 rows and 3 responses. All 3 responses were auto-replies. The spreadsheet named zero recipes and offered flat rates below 100 dollars per post. Nobody posts a 30-second video for 87 dollars flat. Nobody.
Creator content commercial terms that work
Working creator content commercial terms run 350 to 1,500 dollars flat per post plus a 12 to 25 percent commission on tagged sales across a 30-day window. The commission mechanic pulls creators into follow-up posts because the incremental revenue continues past the initial fee. Mid-tier creators (30k to 150k followers) hit the sweet spot for food brand content because their engagement rate typically runs 4 to 8 percent versus 0.8 to 1.6 percent on mega-creators.
Content brief structure for creator partnerships
The content brief structure for creator partnerships runs a single page: the SKU, the specific recipe or usage occasion, 3 required brand mentions, 3 restricted claims (no health claims on non-medical SKUs), the pricing angle, the affiliate link, and 3 example videos that hit the tone. The brief avoids over-scripting because over-scripted creator content underperforms native creator voice by 40 to 60 percent on engagement rate.
Buyer intent content for food brand blogs
Buyer intent content on food brand blogs covers 8 to 16 pieces targeting explicit purchase-decision queries: “where to buy [brand],” “[brand] subscription vs. one-time,” “best [category] for [use case],” and “[brand] gift bundle.” Every buyer intent piece runs 1,400 to 2,400 words with a comparison table, product cards, and a clear conversion path to the specific SKU that matches the query intent. Buyer intent content converts at 3 to 6 percent versus 1 to 2 percent on recipe content because the shopper landed already planning to buy, not exploring a usage occasion.
Where-to-buy content structure
Where-to-buy content structure covers online (DTC storefront, Amazon, Target.com, Whole Foods online), retail (specific chain locators with the store finder embedded), and international (customs limitations, retailer partners abroad). Every piece names specific retailers, links to the store locator, and includes an FAQ block covering shipping availability, subscription options, and gift card compatibility. Where-to-buy content ranks for branded discovery queries the DTC storefront otherwise loses to competitor affiliate reviews.
Subscription versus one-time comparison content
Subscription versus one-time comparison content converts subscription commitments at 3 to 6 percent because it addresses the price-sensitivity concern head-on with a specific math table. The piece covers the discount structure (15 percent lifetime), the skip-a-month mechanic, the pause-anytime rule, the cancellation policy, and the specific yearly savings for the brand’s average consumption cadence. Cross-reference the retention structure on our food and beverage marketing retainer page.
Content refresh cadence on food brand pillars
Content refresh cadence on food brand content pillars runs a rolling audit every 12 to 24 months by pillar. Recipes get refreshed every 12 months with new photography, updated schema, and any nutrition or ingredient adjustments. Ingredient comparison guides refresh every 18 months to update market data. Sourcing story pages refresh every 24 months to reflect farm partnership changes and new harvest angles. Buyer intent content refreshes every 12 months to update retailer availability and pricing.
Recipe refresh priority order
Recipe refresh priority runs by organic traffic rank. The top 20 recipes by monthly organic sessions get refreshed first (new photography, schema audit, related recipe internal links, updated nutrition). The next 40 get refreshed at 15 months. The remaining recipes get refreshed opportunistically when the ranking slips past position 15 in Google. Skipping the refresh cadence lets recipe rankings drift out of the top 3 inside 18 months as newer competitor recipes take the position.
Schema audit checklist per refresh
The schema audit checklist per refresh runs 8 items: Recipe schema completeness, aggregateRating count and accuracy, nutrition data accuracy, prepTime and cookTime match the recipe body, image URLs valid at CDN, related recipe internal links working, product card SKU URL live, and Google Search Console rich result eligibility validated. This checklist takes 20 minutes per recipe and prevents the schema drift that costs recipe rankings 20 to 40 positions quietly.
Reporting cadence for food brand content marketing
Reporting cadence on food brand content marketing runs a monthly executive report plus a quarterly business review. The monthly report ships in the first business week and covers organic sessions by pillar, top 10 ranking recipes with position trend, ingredient guide ranking movements, sourcing page performance, and organic-attributed DTC revenue. Every number carries a comparison to the prior month and a plain-language interpretation the founder reads in 7 minutes.
Metrics that matter for content marketing
Metrics that matter for food brand content marketing: organic sessions by pillar, recipe rich result impressions in Search Console, organic conversion rate to hero SKU pages, organic-attributed DTC revenue, and top 20 ranking positions by monthly organic sessions. Vanity metrics that do not matter: total pageviews without conversion context, average time on page without conversion attribution, and social share counts. The monthly report skips the vanity block entirely.
Quarterly business review structure
The quarterly business review runs 90 minutes with the founder, head of content, and SEO lead. Agenda: organic traffic trend by pillar, top 10 winning content pieces, top 10 losing content pieces (candidates for refresh or removal), competitive gap analysis against 5 named competitor brands, and next quarter’s content calendar with recipes and ingredient guides queued. According to Ahrefs content marketing research, brands running quarterly content audits outperform brands running annual audits by 40 to 70 percent on organic revenue over a 24-month window.
Internal linking discipline across food brand content
Internal linking discipline across food brand content moves authority from recipe pages toward hero SKU product pages and comparison guides. Every recipe links to the hero SKU it uses inline (once in the ingredient list, once in a bottom call-out card). Every ingredient comparison guide links to 3 to 6 recipes using the winning ingredient plus the hero SKU product page. Every sourcing story links to the 2 to 4 SKUs sourced from that specific farm or cooperative.
Anchor text strategy across recipe hubs
Anchor text on internal links varies across recipe hubs to avoid over-optimization patterns Google penalizes. Exact-match anchor (“single-origin Ethiopian coffee”) runs on 20 to 30 percent of internal links. Partial-match variations (“our Ethiopian roast”) run on 30 to 40 percent. Branded anchors (the SKU name) run on 20 to 30 percent. Generic anchors (“shop the coffee”) fill the remaining 10 to 20 percent. This ratio holds ranking without triggering the over-optimization penalty that shows up on brands that anchor-text-stuff every internal link with the same exact-match keyword. Cross-reference the linking layer on our food and beverage web design page.
Link equity from ingredient guides to SKU pages
Link equity from ingredient guides passes to SKU pages when the guide’s comparison table names the hero SKU in the winning column with a product card, and when the guide’s body links to 3 to 6 recipes that use the winning ingredient. This 3-hop path (guide to recipe to SKU) pushes authority from a high-traffic informational query down to a high-intent transactional page. According to Search Engine Land SEO coverage, informational content that internally links to transactional pages produces 2 to 4 times higher organic revenue than isolated content silos.
Wrapping up content marketing for food brands
Content marketing for food brands is the organic engine that turns a DTC snack, drink, or CPG storefront into a search-driven revenue channel. Recipe hub of 40 to 100 recipes. Ingredient comparison guides at 12 to 24 pieces. Sourcing story pages at 6 to 12 pieces. Buyer intent content at 8 to 16 pieces. Creator syndication calendar with 12 to 30 creators per quarter. Refresh cadence at 12 to 24 months by pillar. Reporting with organic sessions and organic revenue attribution.
If your DTC food brand is running paid social at 20,000 dollars monthly with a broken blog and zero recipe schema, professional content marketing for food brands pays for itself inside the first 90 days on organic traffic captured. Redefine Web ships content marketing inside our monthly retainer packages. Book a call and we will walk through the last three DTC food brands we built recipe hubs for, pillar by pillar.
Anchor text on internal links varies across recipe hubs to avoid over-optimization patterns Google penalizes. Exact-match anchor (“single-origin Ethiopian coffee”) runs on 20 to 30 percent of internal links. Partial-match variations (“our Ethiopian roast”) run on 30 to 40 percent. Branded anchors (the SKU name) run on 20 to 30 percent. Generic anchors (“shop the coffee”) fill the remaining 10 to 20 percent. This ratio holds ranking without triggering the over-optimization penalty that shows up on brands that anchor-text-stuff every internal link with the same exact-match keyword. Cross-reference the linking layer on our food and beverage web design page.
Link equity from ingredient guides to SKU pages
Link equity from ingredient guides passes to SKU pages when the guide’s comparison table names the hero SKU in the winning column with a product card, and when the guide’s body links to 3 to 6 recipes that use the winning ingredient. This 3-hop path (guide to recipe to SKU) pushes authority from a high-traffic informational query down to a high-intent transactional page. According to Search Engine Land SEO coverage, informational content that internally links to transactional pages produces 2 to 4 times higher organic revenue than isolated content silos.
Wrapping up content marketing for food brands
Content marketing for food brands is the organic engine that turns a DTC snack, drink, or CPG storefront into a search-driven revenue channel. Recipe hub of 40 to 100 recipes. Ingredient comparison guides at 12 to 24 pieces. Sourcing story pages at 6 to 12 pieces. Buyer intent content at 8 to 16 pieces. Creator syndication calendar with 12 to 30 creators per quarter. Refresh cadence at 12 to 24 months by pillar. Reporting with organic sessions and organic revenue attribution.
If your DTC food brand is running paid social at 20,000 dollars monthly with a broken blog and zero recipe schema, professional content marketing for food brands pays for itself inside the first 90 days on organic traffic captured. Redefine Web ships content marketing inside our monthly retainer packages. Book a call and we will walk through the last three DTC food brands we built recipe hubs for, pillar by pillar.
Content marketing for food brands starts with a recipe hub because recipe queries account for 40 to 60 percent of high-intent search volume in the food category. Every hero SKU needs 4 to 12 recipes anchored to it, each targeting a specific occasion and audience.
Skip the recipe hub and the brand loses the search real estate that pulls DTC storefront traffic month over month at zero incremental paid cost. Recipe traffic converts at 2 to 4 percent because the shopper landed with usage intent, not passive discovery, which is why food brands win on recipes.
Recipe schema and Google rich result eligibility
Every recipe page ships schema.org Recipe markup including cookTime, prepTime, recipeIngredient, recipeInstructions, nutrition, and aggregateRating. Correctly marked-up recipes qualify for Google’s recipe rich result carousel that pulls 3 to 6 times higher click-through rate than a plain blue link. The schema layer takes 15 minutes per recipe to author and 30 minutes to validate in Google Search Console. Cross-reference the recipe search stack on our food and beverage SEO page.
Recipe hub structure that scales
The recipe hub structure runs 40 to 100 recipes at maturity, organized by hero SKU (4 to 12 recipes per SKU) plus occasion tags (breakfast, weeknight dinner, meal prep, brunch, holiday). Every recipe links back to the hero SKU product page with the SKU embedded in an inline card. The hub earns internal linking value from ingredient comparison guides and the sourcing story pages, which feeds recipe ranking on Google. According to Google Search Central recipe structured data guidance, complete Recipe schema markup is required for eligibility in the recipe carousel and the ingredient search filter.
Pillar structure for food brand content marketing
The pillar structure on content marketing for food brands runs 4 content pillars concurrently: recipe hub (40 to 100 recipes), ingredient comparison guides (12 to 24 guides), sourcing story pages (6 to 12 pages), and buyer intent content (where to buy, subscription vs. one-time, gift bundle guides). Every pillar covers a distinct search intent and every pillar links back to the hero SKU product pages.
Ingredient comparison guide format
Ingredient comparison guides run 1,800 to 3,200 words comparing 2 to 4 ingredient types on 6 to 10 attributes with a comparison table, real-world use case examples, and links to the hero SKU that uses the specific ingredient. Example: organic vs. conventional oats compares nutritional profile, sourcing chain, cost, environmental impact, and taste on a 6-column table. The brand’s SKU appears in the winning column with a product card. These guides rank 3 to 8 months after publication and pull steady-state organic traffic.
Sourcing story pages that build trust
Sourcing story pages name the specific farms, cooperatives, or suppliers the brand sources from, with photos of the farms, farmer quotes, and specific harvest windows. A coffee brand’s Ethiopian farm page ranks for “single-origin Ethiopian coffee” and “Yirgacheffe coffee origin” plus 40 long-tail variations. The sourcing page pulls trust-building traffic that converts at 4 to 6 percent because the shopper landed pattern-matching on transparency and named provenance. Every sourcing page includes farmer or cooperative quotes, harvest dates, and a link back to 3 to 5 hero SKU pages that source from the named supplier.
Vejrø hospitality content case study
Vejrø Resort, a Danish private-island destination with an on-site restaurant focused on organic, locally sourced cuisine, joined us with strong social engagement and no organic-search real estate. Guests found the resort on Instagram but never in Google search for terms like “private island resort Denmark,” “farm-to-table hospitality Denmark,” or “Vejrø restaurant.” The same organic-search gap shows up on DTC food brands running paid social at 20,000 dollars monthly with a broken blog and zero recipe schema.
We built the conversion-focused website with on-site and off-site SEO tuned to the travel-niche keyword clusters, competitor analysis against comparable boutique resorts, and mobile-first design prioritizing guest discovery. Every page carried the structured data qualifying it for Google’s rich results in the hospitality category. Every internal link pushed authority toward the direct-booking conversion path.
Three months later, Vejrø hit 10,000 plus organic visitors, ranked for 200 plus first-page keywords, and pulled a 2.2 percent booking conversion rate from organic traffic. The same pattern applies to content marketing for food brands: recipe schema, ingredient comparison guides, and sourcing story pages pull organic traffic at 20 to 40 percent conversion into hero SKU pages inside 6 months when the content quality matches search intent and every page carries the right structured data markup. Vejrø also proved out the reporting discipline: every monthly report named the exact page, the exact keyword cluster, and the exact search feature (rich result, sitelinks, image pack) driving the incremental organic revenue instead of hiding behind aggregate traffic charts.
Recipe cadence and content calendar for food brands
Recipe cadence on a working food brand content calendar ships 2 to 4 new recipes per week during the first 6 months and drops to 1 per week at maturity. Each recipe takes 4 to 6 hours to produce (write, test in the kitchen, photograph, schema author, publish). At 3 recipes per week, the brand hits 78 recipes inside 6 months plus a backlog of ingredient comparison and sourcing content queued behind the recipe production line.
| Content pillar | Target volume year 1 | Production cost per piece | Refresh cadence |
|---|---|---|---|
| Recipe hub | 40 to 100 recipes | $180 to $320 | Every 12 months |
| Ingredient comparison guides | 12 to 24 guides | $450 to $780 | Every 18 months |
| Sourcing story pages | 6 to 12 pages | $680 to $1,200 | Every 24 months |
| Buyer intent content | 8 to 16 pieces | $220 to $420 | Every 12 months |
Photography as a content calendar constraint
Photography is the actual constraint on recipe cadence, not writing. Every recipe needs 6 to 12 photos: hero shot, ingredient flat lay, prep in progress, plated result, storage, and step shots for the schema markup. A working food brand batches photography 8 recipes at a time to keep the cost per recipe under 200 dollars. Skip the batching and the per-recipe cost climbs to 400 to 600 dollars, which caps recipe cadence at 1 per week and slows organic ranking timeline by 6 months.
Seasonal content calendar planning
Seasonal content calendar planning maps recipes and comparison guides to the seasonal windows they need to rank in. A Christmas cookie recipe needs to publish in September to rank by early December. A Valentine’s chocolate guide needs to publish in November to rank by early February. A back-to-school lunchbox recipe needs to publish in June to rank by late August. The 60-to-90-day ranking curve dictates the calendar.
Creator syndication inside food brand content
Creator syndication on food brand content marketing amplifies the recipe hub through Instagram Reels, TikTok, and YouTube Shorts creators paid to post their own version of the brand’s hero recipes. The creator content pulls net-new audiences into the recipe hub through the creator’s Link in Bio or Amazon Storefront tag. The syndication calendar names 12 to 30 creators per quarter with specific recipes assigned to each.
One brand we picked up had a spreadsheet titled “creator outreach 2023” with 47 rows and 3 responses. All 3 responses were auto-replies. The spreadsheet named zero recipes and offered flat rates below 100 dollars per post. Nobody posts a 30-second video for 87 dollars flat. Nobody.
Creator content commercial terms that work
Working creator content commercial terms run 350 to 1,500 dollars flat per post plus a 12 to 25 percent commission on tagged sales across a 30-day window. The commission mechanic pulls creators into follow-up posts because the incremental revenue continues past the initial fee. Mid-tier creators (30k to 150k followers) hit the sweet spot for food brand content because their engagement rate typically runs 4 to 8 percent versus 0.8 to 1.6 percent on mega-creators.
Content brief structure for creator partnerships
The content brief structure for creator partnerships runs a single page: the SKU, the specific recipe or usage occasion, 3 required brand mentions, 3 restricted claims (no health claims on non-medical SKUs), the pricing angle, the affiliate link, and 3 example videos that hit the tone. The brief avoids over-scripting because over-scripted creator content underperforms native creator voice by 40 to 60 percent on engagement rate.
Buyer intent content for food brand blogs
Buyer intent content on food brand blogs covers 8 to 16 pieces targeting explicit purchase-decision queries: “where to buy [brand],” “[brand] subscription vs. one-time,” “best [category] for [use case],” and “[brand] gift bundle.” Every buyer intent piece runs 1,400 to 2,400 words with a comparison table, product cards, and a clear conversion path to the specific SKU that matches the query intent. Buyer intent content converts at 3 to 6 percent versus 1 to 2 percent on recipe content because the shopper landed already planning to buy, not exploring a usage occasion.
Where-to-buy content structure
Where-to-buy content structure covers online (DTC storefront, Amazon, Target.com, Whole Foods online), retail (specific chain locators with the store finder embedded), and international (customs limitations, retailer partners abroad). Every piece names specific retailers, links to the store locator, and includes an FAQ block covering shipping availability, subscription options, and gift card compatibility. Where-to-buy content ranks for branded discovery queries the DTC storefront otherwise loses to competitor affiliate reviews.
Subscription versus one-time comparison content
Subscription versus one-time comparison content converts subscription commitments at 3 to 6 percent because it addresses the price-sensitivity concern head-on with a specific math table. The piece covers the discount structure (15 percent lifetime), the skip-a-month mechanic, the pause-anytime rule, the cancellation policy, and the specific yearly savings for the brand’s average consumption cadence. Cross-reference the retention structure on our food and beverage marketing retainer page.
Content refresh cadence on food brand pillars
Content refresh cadence on food brand content pillars runs a rolling audit every 12 to 24 months by pillar. Recipes get refreshed every 12 months with new photography, updated schema, and any nutrition or ingredient adjustments. Ingredient comparison guides refresh every 18 months to update market data. Sourcing story pages refresh every 24 months to reflect farm partnership changes and new harvest angles. Buyer intent content refreshes every 12 months to update retailer availability and pricing.
Recipe refresh priority order
Recipe refresh priority runs by organic traffic rank. The top 20 recipes by monthly organic sessions get refreshed first (new photography, schema audit, related recipe internal links, updated nutrition). The next 40 get refreshed at 15 months. The remaining recipes get refreshed opportunistically when the ranking slips past position 15 in Google. Skipping the refresh cadence lets recipe rankings drift out of the top 3 inside 18 months as newer competitor recipes take the position.
Schema audit checklist per refresh
The schema audit checklist per refresh runs 8 items: Recipe schema completeness, aggregateRating count and accuracy, nutrition data accuracy, prepTime and cookTime match the recipe body, image URLs valid at CDN, related recipe internal links working, product card SKU URL live, and Google Search Console rich result eligibility validated. This checklist takes 20 minutes per recipe and prevents the schema drift that costs recipe rankings 20 to 40 positions quietly.
Reporting cadence for food brand content marketing
Reporting cadence on food brand content marketing runs a monthly executive report plus a quarterly business review. The monthly report ships in the first business week and covers organic sessions by pillar, top 10 ranking recipes with position trend, ingredient guide ranking movements, sourcing page performance, and organic-attributed DTC revenue. Every number carries a comparison to the prior month and a plain-language interpretation the founder reads in 7 minutes.
Metrics that matter for content marketing
Metrics that matter for food brand content marketing: organic sessions by pillar, recipe rich result impressions in Search Console, organic conversion rate to hero SKU pages, organic-attributed DTC revenue, and top 20 ranking positions by monthly organic sessions. Vanity metrics that do not matter: total pageviews without conversion context, average time on page without conversion attribution, and social share counts. The monthly report skips the vanity block entirely.
Quarterly business review structure
The quarterly business review runs 90 minutes with the founder, head of content, and SEO lead. Agenda: organic traffic trend by pillar, top 10 winning content pieces, top 10 losing content pieces (candidates for refresh or removal), competitive gap analysis against 5 named competitor brands, and next quarter’s content calendar with recipes and ingredient guides queued. According to Ahrefs content marketing research, brands running quarterly content audits outperform brands running annual audits by 40 to 70 percent on organic revenue over a 24-month window.
Internal linking discipline across food brand content
Internal linking discipline across food brand content moves authority from recipe pages toward hero SKU product pages and comparison guides. Every recipe links to the hero SKU it uses inline (once in the ingredient list, once in a bottom call-out card). Every ingredient comparison guide links to 3 to 6 recipes using the winning ingredient plus the hero SKU product page. Every sourcing story links to the 2 to 4 SKUs sourced from that specific farm or cooperative.
Anchor text strategy across recipe hubs
Anchor text on internal links varies across recipe hubs to avoid over-optimization patterns Google penalizes. Exact-match anchor (“single-origin Ethiopian coffee”) runs on 20 to 30 percent of internal links. Partial-match variations (“our Ethiopian roast”) run on 30 to 40 percent. Branded anchors (the SKU name) run on 20 to 30 percent. Generic anchors (“shop the coffee”) fill the remaining 10 to 20 percent. This ratio holds ranking without triggering the over-optimization penalty that shows up on brands that anchor-text-stuff every internal link with the same exact-match keyword. Cross-reference the linking layer on our food and beverage web design page.
Link equity from ingredient guides to SKU pages
Link equity from ingredient guides passes to SKU pages when the guide’s comparison table names the hero SKU in the winning column with a product card, and when the guide’s body links to 3 to 6 recipes that use the winning ingredient. This 3-hop path (guide to recipe to SKU) pushes authority from a high-traffic informational query down to a high-intent transactional page. According to Search Engine Land SEO coverage, informational content that internally links to transactional pages produces 2 to 4 times higher organic revenue than isolated content silos.
Wrapping up content marketing for food brands
Content marketing for food brands is the organic engine that turns a DTC snack, drink, or CPG storefront into a search-driven revenue channel. Recipe hub of 40 to 100 recipes. Ingredient comparison guides at 12 to 24 pieces. Sourcing story pages at 6 to 12 pieces. Buyer intent content at 8 to 16 pieces. Creator syndication calendar with 12 to 30 creators per quarter. Refresh cadence at 12 to 24 months by pillar. Reporting with organic sessions and organic revenue attribution.
If your DTC food brand is running paid social at 20,000 dollars monthly with a broken blog and zero recipe schema, professional content marketing for food brands pays for itself inside the first 90 days on organic traffic captured. Redefine Web ships content marketing inside our monthly retainer packages. Book a call and we will walk through the last three DTC food brands we built recipe hubs for, pillar by pillar.
Internal linking discipline across food brand content moves authority from recipe pages toward hero SKU product pages and comparison guides. Every recipe links to the hero SKU it uses inline (once in the ingredient list, once in a bottom call-out card). Every ingredient comparison guide links to 3 to 6 recipes using the winning ingredient plus the hero SKU product page. Every sourcing story links to the 2 to 4 SKUs sourced from that specific farm or cooperative.
Anchor text strategy across recipe hubs
Anchor text on internal links varies across recipe hubs to avoid over-optimization patterns Google penalizes. Exact-match anchor (“single-origin Ethiopian coffee”) runs on 20 to 30 percent of internal links. Partial-match variations (“our Ethiopian roast”) run on 30 to 40 percent. Branded anchors (the SKU name) run on 20 to 30 percent. Generic anchors (“shop the coffee”) fill the remaining 10 to 20 percent. This ratio holds ranking without triggering the over-optimization penalty that shows up on brands that anchor-text-stuff every internal link with the same exact-match keyword. Cross-reference the linking layer on our food and beverage web design page.
Link equity from ingredient guides to SKU pages
Link equity from ingredient guides passes to SKU pages when the guide’s comparison table names the hero SKU in the winning column with a product card, and when the guide’s body links to 3 to 6 recipes that use the winning ingredient. This 3-hop path (guide to recipe to SKU) pushes authority from a high-traffic informational query down to a high-intent transactional page. According to Search Engine Land SEO coverage, informational content that internally links to transactional pages produces 2 to 4 times higher organic revenue than isolated content silos.
Wrapping up content marketing for food brands
Content marketing for food brands is the organic engine that turns a DTC snack, drink, or CPG storefront into a search-driven revenue channel. Recipe hub of 40 to 100 recipes. Ingredient comparison guides at 12 to 24 pieces. Sourcing story pages at 6 to 12 pieces. Buyer intent content at 8 to 16 pieces. Creator syndication calendar with 12 to 30 creators per quarter. Refresh cadence at 12 to 24 months by pillar. Reporting with organic sessions and organic revenue attribution.
If your DTC food brand is running paid social at 20,000 dollars monthly with a broken blog and zero recipe schema, professional content marketing for food brands pays for itself inside the first 90 days on organic traffic captured. Redefine Web ships content marketing inside our monthly retainer packages. Book a call and we will walk through the last three DTC food brands we built recipe hubs for, pillar by pillar.
Content marketing for food brands starts with a recipe hub because recipe queries account for 40 to 60 percent of high-intent search volume in the food category. Every hero SKU needs 4 to 12 recipes anchored to it, each targeting a specific occasion and audience.
Skip the recipe hub and the brand loses the search real estate that pulls DTC storefront traffic month over month at zero incremental paid cost. Recipe traffic converts at 2 to 4 percent because the shopper landed with usage intent, not passive discovery, which is why food brands win on recipes.
Recipe schema and Google rich result eligibility
Every recipe page ships schema.org Recipe markup including cookTime, prepTime, recipeIngredient, recipeInstructions, nutrition, and aggregateRating. Correctly marked-up recipes qualify for Google’s recipe rich result carousel that pulls 3 to 6 times higher click-through rate than a plain blue link. The schema layer takes 15 minutes per recipe to author and 30 minutes to validate in Google Search Console. Cross-reference the recipe search stack on our food and beverage SEO page.
Recipe hub structure that scales
The recipe hub structure runs 40 to 100 recipes at maturity, organized by hero SKU (4 to 12 recipes per SKU) plus occasion tags (breakfast, weeknight dinner, meal prep, brunch, holiday). Every recipe links back to the hero SKU product page with the SKU embedded in an inline card. The hub earns internal linking value from ingredient comparison guides and the sourcing story pages, which feeds recipe ranking on Google. According to Google Search Central recipe structured data guidance, complete Recipe schema markup is required for eligibility in the recipe carousel and the ingredient search filter.
Pillar structure for food brand content marketing
The pillar structure on content marketing for food brands runs 4 content pillars concurrently: recipe hub (40 to 100 recipes), ingredient comparison guides (12 to 24 guides), sourcing story pages (6 to 12 pages), and buyer intent content (where to buy, subscription vs. one-time, gift bundle guides). Every pillar covers a distinct search intent and every pillar links back to the hero SKU product pages.
Ingredient comparison guide format
Ingredient comparison guides run 1,800 to 3,200 words comparing 2 to 4 ingredient types on 6 to 10 attributes with a comparison table, real-world use case examples, and links to the hero SKU that uses the specific ingredient. Example: organic vs. conventional oats compares nutritional profile, sourcing chain, cost, environmental impact, and taste on a 6-column table. The brand’s SKU appears in the winning column with a product card. These guides rank 3 to 8 months after publication and pull steady-state organic traffic.
Sourcing story pages that build trust
Sourcing story pages name the specific farms, cooperatives, or suppliers the brand sources from, with photos of the farms, farmer quotes, and specific harvest windows. A coffee brand’s Ethiopian farm page ranks for “single-origin Ethiopian coffee” and “Yirgacheffe coffee origin” plus 40 long-tail variations. The sourcing page pulls trust-building traffic that converts at 4 to 6 percent because the shopper landed pattern-matching on transparency and named provenance. Every sourcing page includes farmer or cooperative quotes, harvest dates, and a link back to 3 to 5 hero SKU pages that source from the named supplier.
Vejrø hospitality content case study
Vejrø Resort, a Danish private-island destination with an on-site restaurant focused on organic, locally sourced cuisine, joined us with strong social engagement and no organic-search real estate. Guests found the resort on Instagram but never in Google search for terms like “private island resort Denmark,” “farm-to-table hospitality Denmark,” or “Vejrø restaurant.” The same organic-search gap shows up on DTC food brands running paid social at 20,000 dollars monthly with a broken blog and zero recipe schema.
We built the conversion-focused website with on-site and off-site SEO tuned to the travel-niche keyword clusters, competitor analysis against comparable boutique resorts, and mobile-first design prioritizing guest discovery. Every page carried the structured data qualifying it for Google’s rich results in the hospitality category. Every internal link pushed authority toward the direct-booking conversion path.
Three months later, Vejrø hit 10,000 plus organic visitors, ranked for 200 plus first-page keywords, and pulled a 2.2 percent booking conversion rate from organic traffic. The same pattern applies to content marketing for food brands: recipe schema, ingredient comparison guides, and sourcing story pages pull organic traffic at 20 to 40 percent conversion into hero SKU pages inside 6 months when the content quality matches search intent and every page carries the right structured data markup. Vejrø also proved out the reporting discipline: every monthly report named the exact page, the exact keyword cluster, and the exact search feature (rich result, sitelinks, image pack) driving the incremental organic revenue instead of hiding behind aggregate traffic charts.
Recipe cadence and content calendar for food brands
Recipe cadence on a working food brand content calendar ships 2 to 4 new recipes per week during the first 6 months and drops to 1 per week at maturity. Each recipe takes 4 to 6 hours to produce (write, test in the kitchen, photograph, schema author, publish). At 3 recipes per week, the brand hits 78 recipes inside 6 months plus a backlog of ingredient comparison and sourcing content queued behind the recipe production line.
| Content pillar | Target volume year 1 | Production cost per piece | Refresh cadence |
|---|---|---|---|
| Recipe hub | 40 to 100 recipes | $180 to $320 | Every 12 months |
| Ingredient comparison guides | 12 to 24 guides | $450 to $780 | Every 18 months |
| Sourcing story pages | 6 to 12 pages | $680 to $1,200 | Every 24 months |
| Buyer intent content | 8 to 16 pieces | $220 to $420 | Every 12 months |
Photography as a content calendar constraint
Photography is the actual constraint on recipe cadence, not writing. Every recipe needs 6 to 12 photos: hero shot, ingredient flat lay, prep in progress, plated result, storage, and step shots for the schema markup. A working food brand batches photography 8 recipes at a time to keep the cost per recipe under 200 dollars. Skip the batching and the per-recipe cost climbs to 400 to 600 dollars, which caps recipe cadence at 1 per week and slows organic ranking timeline by 6 months.
Seasonal content calendar planning
Seasonal content calendar planning maps recipes and comparison guides to the seasonal windows they need to rank in. A Christmas cookie recipe needs to publish in September to rank by early December. A Valentine’s chocolate guide needs to publish in November to rank by early February. A back-to-school lunchbox recipe needs to publish in June to rank by late August. The 60-to-90-day ranking curve dictates the calendar.
Creator syndication inside food brand content
Creator syndication on food brand content marketing amplifies the recipe hub through Instagram Reels, TikTok, and YouTube Shorts creators paid to post their own version of the brand’s hero recipes. The creator content pulls net-new audiences into the recipe hub through the creator’s Link in Bio or Amazon Storefront tag. The syndication calendar names 12 to 30 creators per quarter with specific recipes assigned to each.
One brand we picked up had a spreadsheet titled “creator outreach 2023” with 47 rows and 3 responses. All 3 responses were auto-replies. The spreadsheet named zero recipes and offered flat rates below 100 dollars per post. Nobody posts a 30-second video for 87 dollars flat. Nobody.
Creator content commercial terms that work
Working creator content commercial terms run 350 to 1,500 dollars flat per post plus a 12 to 25 percent commission on tagged sales across a 30-day window. The commission mechanic pulls creators into follow-up posts because the incremental revenue continues past the initial fee. Mid-tier creators (30k to 150k followers) hit the sweet spot for food brand content because their engagement rate typically runs 4 to 8 percent versus 0.8 to 1.6 percent on mega-creators.
Content brief structure for creator partnerships
The content brief structure for creator partnerships runs a single page: the SKU, the specific recipe or usage occasion, 3 required brand mentions, 3 restricted claims (no health claims on non-medical SKUs), the pricing angle, the affiliate link, and 3 example videos that hit the tone. The brief avoids over-scripting because over-scripted creator content underperforms native creator voice by 40 to 60 percent on engagement rate.
Buyer intent content for food brand blogs
Buyer intent content on food brand blogs covers 8 to 16 pieces targeting explicit purchase-decision queries: “where to buy [brand],” “[brand] subscription vs. one-time,” “best [category] for [use case],” and “[brand] gift bundle.” Every buyer intent piece runs 1,400 to 2,400 words with a comparison table, product cards, and a clear conversion path to the specific SKU that matches the query intent. Buyer intent content converts at 3 to 6 percent versus 1 to 2 percent on recipe content because the shopper landed already planning to buy, not exploring a usage occasion.
Where-to-buy content structure
Where-to-buy content structure covers online (DTC storefront, Amazon, Target.com, Whole Foods online), retail (specific chain locators with the store finder embedded), and international (customs limitations, retailer partners abroad). Every piece names specific retailers, links to the store locator, and includes an FAQ block covering shipping availability, subscription options, and gift card compatibility. Where-to-buy content ranks for branded discovery queries the DTC storefront otherwise loses to competitor affiliate reviews.
Subscription versus one-time comparison content
Subscription versus one-time comparison content converts subscription commitments at 3 to 6 percent because it addresses the price-sensitivity concern head-on with a specific math table. The piece covers the discount structure (15 percent lifetime), the skip-a-month mechanic, the pause-anytime rule, the cancellation policy, and the specific yearly savings for the brand’s average consumption cadence. Cross-reference the retention structure on our food and beverage marketing retainer page.
Content refresh cadence on food brand pillars
Content refresh cadence on food brand content pillars runs a rolling audit every 12 to 24 months by pillar. Recipes get refreshed every 12 months with new photography, updated schema, and any nutrition or ingredient adjustments. Ingredient comparison guides refresh every 18 months to update market data. Sourcing story pages refresh every 24 months to reflect farm partnership changes and new harvest angles. Buyer intent content refreshes every 12 months to update retailer availability and pricing.
Recipe refresh priority order
Recipe refresh priority runs by organic traffic rank. The top 20 recipes by monthly organic sessions get refreshed first (new photography, schema audit, related recipe internal links, updated nutrition). The next 40 get refreshed at 15 months. The remaining recipes get refreshed opportunistically when the ranking slips past position 15 in Google. Skipping the refresh cadence lets recipe rankings drift out of the top 3 inside 18 months as newer competitor recipes take the position.
Schema audit checklist per refresh
The schema audit checklist per refresh runs 8 items: Recipe schema completeness, aggregateRating count and accuracy, nutrition data accuracy, prepTime and cookTime match the recipe body, image URLs valid at CDN, related recipe internal links working, product card SKU URL live, and Google Search Console rich result eligibility validated. This checklist takes 20 minutes per recipe and prevents the schema drift that costs recipe rankings 20 to 40 positions quietly.
Reporting cadence for food brand content marketing
Reporting cadence on food brand content marketing runs a monthly executive report plus a quarterly business review. The monthly report ships in the first business week and covers organic sessions by pillar, top 10 ranking recipes with position trend, ingredient guide ranking movements, sourcing page performance, and organic-attributed DTC revenue. Every number carries a comparison to the prior month and a plain-language interpretation the founder reads in 7 minutes.
Metrics that matter for content marketing
Metrics that matter for food brand content marketing: organic sessions by pillar, recipe rich result impressions in Search Console, organic conversion rate to hero SKU pages, organic-attributed DTC revenue, and top 20 ranking positions by monthly organic sessions. Vanity metrics that do not matter: total pageviews without conversion context, average time on page without conversion attribution, and social share counts. The monthly report skips the vanity block entirely.
Quarterly business review structure
The quarterly business review runs 90 minutes with the founder, head of content, and SEO lead. Agenda: organic traffic trend by pillar, top 10 winning content pieces, top 10 losing content pieces (candidates for refresh or removal), competitive gap analysis against 5 named competitor brands, and next quarter’s content calendar with recipes and ingredient guides queued. According to Ahrefs content marketing research, brands running quarterly content audits outperform brands running annual audits by 40 to 70 percent on organic revenue over a 24-month window.
Internal linking discipline across food brand content
Internal linking discipline across food brand content moves authority from recipe pages toward hero SKU product pages and comparison guides. Every recipe links to the hero SKU it uses inline (once in the ingredient list, once in a bottom call-out card). Every ingredient comparison guide links to 3 to 6 recipes using the winning ingredient plus the hero SKU product page. Every sourcing story links to the 2 to 4 SKUs sourced from that specific farm or cooperative.
Anchor text strategy across recipe hubs
Anchor text on internal links varies across recipe hubs to avoid over-optimization patterns Google penalizes. Exact-match anchor (“single-origin Ethiopian coffee”) runs on 20 to 30 percent of internal links. Partial-match variations (“our Ethiopian roast”) run on 30 to 40 percent. Branded anchors (the SKU name) run on 20 to 30 percent. Generic anchors (“shop the coffee”) fill the remaining 10 to 20 percent. This ratio holds ranking without triggering the over-optimization penalty that shows up on brands that anchor-text-stuff every internal link with the same exact-match keyword. Cross-reference the linking layer on our food and beverage web design page.
Link equity from ingredient guides to SKU pages
Link equity from ingredient guides passes to SKU pages when the guide’s comparison table names the hero SKU in the winning column with a product card, and when the guide’s body links to 3 to 6 recipes that use the winning ingredient. This 3-hop path (guide to recipe to SKU) pushes authority from a high-traffic informational query down to a high-intent transactional page. According to Search Engine Land SEO coverage, informational content that internally links to transactional pages produces 2 to 4 times higher organic revenue than isolated content silos.
Wrapping up content marketing for food brands
Content marketing for food brands is the organic engine that turns a DTC snack, drink, or CPG storefront into a search-driven revenue channel. Recipe hub of 40 to 100 recipes. Ingredient comparison guides at 12 to 24 pieces. Sourcing story pages at 6 to 12 pieces. Buyer intent content at 8 to 16 pieces. Creator syndication calendar with 12 to 30 creators per quarter. Refresh cadence at 12 to 24 months by pillar. Reporting with organic sessions and organic revenue attribution.
If your DTC food brand is running paid social at 20,000 dollars monthly with a broken blog and zero recipe schema, professional content marketing for food brands pays for itself inside the first 90 days on organic traffic captured. Redefine Web ships content marketing inside our monthly retainer packages. Book a call and we will walk through the last three DTC food brands we built recipe hubs for, pillar by pillar.
Content marketing for food brands starts with a recipe hub because recipe queries account for 40 to 60 percent of high-intent search volume in the food category. Every hero SKU needs 4 to 12 recipes anchored to it, each targeting a specific occasion and audience.
Skip the recipe hub and the brand loses the search real estate that pulls DTC storefront traffic month over month at zero incremental paid cost. Recipe traffic converts at 2 to 4 percent because the shopper landed with usage intent, not passive discovery, which is why food brands win on recipes.
Recipe schema and Google rich result eligibility
Every recipe page ships schema.org Recipe markup including cookTime, prepTime, recipeIngredient, recipeInstructions, nutrition, and aggregateRating. Correctly marked-up recipes qualify for Google’s recipe rich result carousel that pulls 3 to 6 times higher click-through rate than a plain blue link. The schema layer takes 15 minutes per recipe to author and 30 minutes to validate in Google Search Console. Cross-reference the recipe search stack on our food and beverage SEO page.
Recipe hub structure that scales
The recipe hub structure runs 40 to 100 recipes at maturity, organized by hero SKU (4 to 12 recipes per SKU) plus occasion tags (breakfast, weeknight dinner, meal prep, brunch, holiday). Every recipe links back to the hero SKU product page with the SKU embedded in an inline card. The hub earns internal linking value from ingredient comparison guides and the sourcing story pages, which feeds recipe ranking on Google. According to Google Search Central recipe structured data guidance, complete Recipe schema markup is required for eligibility in the recipe carousel and the ingredient search filter.
Pillar structure for food brand content marketing
The pillar structure on content marketing for food brands runs 4 content pillars concurrently: recipe hub (40 to 100 recipes), ingredient comparison guides (12 to 24 guides), sourcing story pages (6 to 12 pages), and buyer intent content (where to buy, subscription vs. one-time, gift bundle guides). Every pillar covers a distinct search intent and every pillar links back to the hero SKU product pages.
Ingredient comparison guide format
Ingredient comparison guides run 1,800 to 3,200 words comparing 2 to 4 ingredient types on 6 to 10 attributes with a comparison table, real-world use case examples, and links to the hero SKU that uses the specific ingredient. Example: organic vs. conventional oats compares nutritional profile, sourcing chain, cost, environmental impact, and taste on a 6-column table. The brand’s SKU appears in the winning column with a product card. These guides rank 3 to 8 months after publication and pull steady-state organic traffic.
Sourcing story pages that build trust
Sourcing story pages name the specific farms, cooperatives, or suppliers the brand sources from, with photos of the farms, farmer quotes, and specific harvest windows. A coffee brand’s Ethiopian farm page ranks for “single-origin Ethiopian coffee” and “Yirgacheffe coffee origin” plus 40 long-tail variations. The sourcing page pulls trust-building traffic that converts at 4 to 6 percent because the shopper landed pattern-matching on transparency and named provenance. Every sourcing page includes farmer or cooperative quotes, harvest dates, and a link back to 3 to 5 hero SKU pages that source from the named supplier.
Vejrø hospitality content case study
Vejrø Resort, a Danish private-island destination with an on-site restaurant focused on organic, locally sourced cuisine, joined us with strong social engagement and no organic-search real estate. Guests found the resort on Instagram but never in Google search for terms like “private island resort Denmark,” “farm-to-table hospitality Denmark,” or “Vejrø restaurant.” The same organic-search gap shows up on DTC food brands running paid social at 20,000 dollars monthly with a broken blog and zero recipe schema.
We built the conversion-focused website with on-site and off-site SEO tuned to the travel-niche keyword clusters, competitor analysis against comparable boutique resorts, and mobile-first design prioritizing guest discovery. Every page carried the structured data qualifying it for Google’s rich results in the hospitality category. Every internal link pushed authority toward the direct-booking conversion path.
Three months later, Vejrø hit 10,000 plus organic visitors, ranked for 200 plus first-page keywords, and pulled a 2.2 percent booking conversion rate from organic traffic. The same pattern applies to content marketing for food brands: recipe schema, ingredient comparison guides, and sourcing story pages pull organic traffic at 20 to 40 percent conversion into hero SKU pages inside 6 months when the content quality matches search intent and every page carries the right structured data markup. Vejrø also proved out the reporting discipline: every monthly report named the exact page, the exact keyword cluster, and the exact search feature (rich result, sitelinks, image pack) driving the incremental organic revenue instead of hiding behind aggregate traffic charts.
Recipe cadence and content calendar for food brands
Recipe cadence on a working food brand content calendar ships 2 to 4 new recipes per week during the first 6 months and drops to 1 per week at maturity. Each recipe takes 4 to 6 hours to produce (write, test in the kitchen, photograph, schema author, publish). At 3 recipes per week, the brand hits 78 recipes inside 6 months plus a backlog of ingredient comparison and sourcing content queued behind the recipe production line.
| Content pillar | Target volume year 1 | Production cost per piece | Refresh cadence |
|---|---|---|---|
| Recipe hub | 40 to 100 recipes | $180 to $320 | Every 12 months |
| Ingredient comparison guides | 12 to 24 guides | $450 to $780 | Every 18 months |
| Sourcing story pages | 6 to 12 pages | $680 to $1,200 | Every 24 months |
| Buyer intent content | 8 to 16 pieces | $220 to $420 | Every 12 months |
Photography as a content calendar constraint
Photography is the actual constraint on recipe cadence, not writing. Every recipe needs 6 to 12 photos: hero shot, ingredient flat lay, prep in progress, plated result, storage, and step shots for the schema markup. A working food brand batches photography 8 recipes at a time to keep the cost per recipe under 200 dollars. Skip the batching and the per-recipe cost climbs to 400 to 600 dollars, which caps recipe cadence at 1 per week and slows organic ranking timeline by 6 months.
Seasonal content calendar planning
Seasonal content calendar planning maps recipes and comparison guides to the seasonal windows they need to rank in. A Christmas cookie recipe needs to publish in September to rank by early December. A Valentine’s chocolate guide needs to publish in November to rank by early February. A back-to-school lunchbox recipe needs to publish in June to rank by late August. The 60-to-90-day ranking curve dictates the calendar.
Creator syndication inside food brand content
Creator syndication on food brand content marketing amplifies the recipe hub through Instagram Reels, TikTok, and YouTube Shorts creators paid to post their own version of the brand’s hero recipes. The creator content pulls net-new audiences into the recipe hub through the creator’s Link in Bio or Amazon Storefront tag. The syndication calendar names 12 to 30 creators per quarter with specific recipes assigned to each.
One brand we picked up had a spreadsheet titled “creator outreach 2023” with 47 rows and 3 responses. All 3 responses were auto-replies. The spreadsheet named zero recipes and offered flat rates below 100 dollars per post. Nobody posts a 30-second video for 87 dollars flat. Nobody.
Creator content commercial terms that work
Working creator content commercial terms run 350 to 1,500 dollars flat per post plus a 12 to 25 percent commission on tagged sales across a 30-day window. The commission mechanic pulls creators into follow-up posts because the incremental revenue continues past the initial fee. Mid-tier creators (30k to 150k followers) hit the sweet spot for food brand content because their engagement rate typically runs 4 to 8 percent versus 0.8 to 1.6 percent on mega-creators.
Content brief structure for creator partnerships
The content brief structure for creator partnerships runs a single page: the SKU, the specific recipe or usage occasion, 3 required brand mentions, 3 restricted claims (no health claims on non-medical SKUs), the pricing angle, the affiliate link, and 3 example videos that hit the tone. The brief avoids over-scripting because over-scripted creator content underperforms native creator voice by 40 to 60 percent on engagement rate.
Buyer intent content for food brand blogs
Buyer intent content on food brand blogs covers 8 to 16 pieces targeting explicit purchase-decision queries: “where to buy [brand],” “[brand] subscription vs. one-time,” “best [category] for [use case],” and “[brand] gift bundle.” Every buyer intent piece runs 1,400 to 2,400 words with a comparison table, product cards, and a clear conversion path to the specific SKU that matches the query intent. Buyer intent content converts at 3 to 6 percent versus 1 to 2 percent on recipe content because the shopper landed already planning to buy, not exploring a usage occasion.
Where-to-buy content structure
Where-to-buy content structure covers online (DTC storefront, Amazon, Target.com, Whole Foods online), retail (specific chain locators with the store finder embedded), and international (customs limitations, retailer partners abroad). Every piece names specific retailers, links to the store locator, and includes an FAQ block covering shipping availability, subscription options, and gift card compatibility. Where-to-buy content ranks for branded discovery queries the DTC storefront otherwise loses to competitor affiliate reviews.
Subscription versus one-time comparison content
Subscription versus one-time comparison content converts subscription commitments at 3 to 6 percent because it addresses the price-sensitivity concern head-on with a specific math table. The piece covers the discount structure (15 percent lifetime), the skip-a-month mechanic, the pause-anytime rule, the cancellation policy, and the specific yearly savings for the brand’s average consumption cadence. Cross-reference the retention structure on our food and beverage marketing retainer page.
Content refresh cadence on food brand pillars
Content refresh cadence on food brand content pillars runs a rolling audit every 12 to 24 months by pillar. Recipes get refreshed every 12 months with new photography, updated schema, and any nutrition or ingredient adjustments. Ingredient comparison guides refresh every 18 months to update market data. Sourcing story pages refresh every 24 months to reflect farm partnership changes and new harvest angles. Buyer intent content refreshes every 12 months to update retailer availability and pricing.
Recipe refresh priority order
Recipe refresh priority runs by organic traffic rank. The top 20 recipes by monthly organic sessions get refreshed first (new photography, schema audit, related recipe internal links, updated nutrition). The next 40 get refreshed at 15 months. The remaining recipes get refreshed opportunistically when the ranking slips past position 15 in Google. Skipping the refresh cadence lets recipe rankings drift out of the top 3 inside 18 months as newer competitor recipes take the position.
Schema audit checklist per refresh
The schema audit checklist per refresh runs 8 items: Recipe schema completeness, aggregateRating count and accuracy, nutrition data accuracy, prepTime and cookTime match the recipe body, image URLs valid at CDN, related recipe internal links working, product card SKU URL live, and Google Search Console rich result eligibility validated. This checklist takes 20 minutes per recipe and prevents the schema drift that costs recipe rankings 20 to 40 positions quietly.
Reporting cadence for food brand content marketing
Reporting cadence on food brand content marketing runs a monthly executive report plus a quarterly business review. The monthly report ships in the first business week and covers organic sessions by pillar, top 10 ranking recipes with position trend, ingredient guide ranking movements, sourcing page performance, and organic-attributed DTC revenue. Every number carries a comparison to the prior month and a plain-language interpretation the founder reads in 7 minutes.
Metrics that matter for content marketing
Metrics that matter for food brand content marketing: organic sessions by pillar, recipe rich result impressions in Search Console, organic conversion rate to hero SKU pages, organic-attributed DTC revenue, and top 20 ranking positions by monthly organic sessions. Vanity metrics that do not matter: total pageviews without conversion context, average time on page without conversion attribution, and social share counts. The monthly report skips the vanity block entirely.
Quarterly business review structure
The quarterly business review runs 90 minutes with the founder, head of content, and SEO lead. Agenda: organic traffic trend by pillar, top 10 winning content pieces, top 10 losing content pieces (candidates for refresh or removal), competitive gap analysis against 5 named competitor brands, and next quarter’s content calendar with recipes and ingredient guides queued. According to Ahrefs content marketing research, brands running quarterly content audits outperform brands running annual audits by 40 to 70 percent on organic revenue over a 24-month window.
Internal linking discipline across food brand content
Internal linking discipline across food brand content moves authority from recipe pages toward hero SKU product pages and comparison guides. Every recipe links to the hero SKU it uses inline (once in the ingredient list, once in a bottom call-out card). Every ingredient comparison guide links to 3 to 6 recipes using the winning ingredient plus the hero SKU product page. Every sourcing story links to the 2 to 4 SKUs sourced from that specific farm or cooperative.
Anchor text strategy across recipe hubs
Anchor text on internal links varies across recipe hubs to avoid over-optimization patterns Google penalizes. Exact-match anchor (“single-origin Ethiopian coffee”) runs on 20 to 30 percent of internal links. Partial-match variations (“our Ethiopian roast”) run on 30 to 40 percent. Branded anchors (the SKU name) run on 20 to 30 percent. Generic anchors (“shop the coffee”) fill the remaining 10 to 20 percent. This ratio holds ranking without triggering the over-optimization penalty that shows up on brands that anchor-text-stuff every internal link with the same exact-match keyword. Cross-reference the linking layer on our food and beverage web design page.
Link equity from ingredient guides to SKU pages
Link equity from ingredient guides passes to SKU pages when the guide’s comparison table names the hero SKU in the winning column with a product card, and when the guide’s body links to 3 to 6 recipes that use the winning ingredient. This 3-hop path (guide to recipe to SKU) pushes authority from a high-traffic informational query down to a high-intent transactional page. According to Search Engine Land SEO coverage, informational content that internally links to transactional pages produces 2 to 4 times higher organic revenue than isolated content silos.
Wrapping up content marketing for food brands
Content marketing for food brands is the organic engine that turns a DTC snack, drink, or CPG storefront into a search-driven revenue channel. Recipe hub of 40 to 100 recipes. Ingredient comparison guides at 12 to 24 pieces. Sourcing story pages at 6 to 12 pieces. Buyer intent content at 8 to 16 pieces. Creator syndication calendar with 12 to 30 creators per quarter. Refresh cadence at 12 to 24 months by pillar. Reporting with organic sessions and organic revenue attribution.
If your DTC food brand is running paid social at 20,000 dollars monthly with a broken blog and zero recipe schema, professional content marketing for food brands pays for itself inside the first 90 days on organic traffic captured. Redefine Web ships content marketing inside our monthly retainer packages. Book a call and we will walk through the last three DTC food brands we built recipe hubs for, pillar by pillar.
Content marketing for food brands starts with a recipe hub because recipe queries account for 40 to 60 percent of high-intent search volume in the food category. Every hero SKU needs 4 to 12 recipes anchored to it, each targeting a specific occasion and audience.
Skip the recipe hub and the brand loses the search real estate that pulls DTC storefront traffic month over month at zero incremental paid cost. Recipe traffic converts at 2 to 4 percent because the shopper landed with usage intent, not passive discovery, which is why food brands win on recipes.
Recipe schema and Google rich result eligibility
Every recipe page ships schema.org Recipe markup including cookTime, prepTime, recipeIngredient, recipeInstructions, nutrition, and aggregateRating. Correctly marked-up recipes qualify for Google’s recipe rich result carousel that pulls 3 to 6 times higher click-through rate than a plain blue link. The schema layer takes 15 minutes per recipe to author and 30 minutes to validate in Google Search Console. Cross-reference the recipe search stack on our food and beverage SEO page.
Recipe hub structure that scales
The recipe hub structure runs 40 to 100 recipes at maturity, organized by hero SKU (4 to 12 recipes per SKU) plus occasion tags (breakfast, weeknight dinner, meal prep, brunch, holiday). Every recipe links back to the hero SKU product page with the SKU embedded in an inline card. The hub earns internal linking value from ingredient comparison guides and the sourcing story pages, which feeds recipe ranking on Google. According to Google Search Central recipe structured data guidance, complete Recipe schema markup is required for eligibility in the recipe carousel and the ingredient search filter.
Pillar structure for food brand content marketing
The pillar structure on content marketing for food brands runs 4 content pillars concurrently: recipe hub (40 to 100 recipes), ingredient comparison guides (12 to 24 guides), sourcing story pages (6 to 12 pages), and buyer intent content (where to buy, subscription vs. one-time, gift bundle guides). Every pillar covers a distinct search intent and every pillar links back to the hero SKU product pages.
Ingredient comparison guide format
Ingredient comparison guides run 1,800 to 3,200 words comparing 2 to 4 ingredient types on 6 to 10 attributes with a comparison table, real-world use case examples, and links to the hero SKU that uses the specific ingredient. Example: organic vs. conventional oats compares nutritional profile, sourcing chain, cost, environmental impact, and taste on a 6-column table. The brand’s SKU appears in the winning column with a product card. These guides rank 3 to 8 months after publication and pull steady-state organic traffic.
Sourcing story pages that build trust
Sourcing story pages name the specific farms, cooperatives, or suppliers the brand sources from, with photos of the farms, farmer quotes, and specific harvest windows. A coffee brand’s Ethiopian farm page ranks for “single-origin Ethiopian coffee” and “Yirgacheffe coffee origin” plus 40 long-tail variations. The sourcing page pulls trust-building traffic that converts at 4 to 6 percent because the shopper landed pattern-matching on transparency and named provenance. Every sourcing page includes farmer or cooperative quotes, harvest dates, and a link back to 3 to 5 hero SKU pages that source from the named supplier.
Vejrø hospitality content case study
Vejrø Resort, a Danish private-island destination with an on-site restaurant focused on organic, locally sourced cuisine, joined us with strong social engagement and no organic-search real estate. Guests found the resort on Instagram but never in Google search for terms like “private island resort Denmark,” “farm-to-table hospitality Denmark,” or “Vejrø restaurant.” The same organic-search gap shows up on DTC food brands running paid social at 20,000 dollars monthly with a broken blog and zero recipe schema.
We built the conversion-focused website with on-site and off-site SEO tuned to the travel-niche keyword clusters, competitor analysis against comparable boutique resorts, and mobile-first design prioritizing guest discovery. Every page carried the structured data qualifying it for Google’s rich results in the hospitality category. Every internal link pushed authority toward the direct-booking conversion path.
Three months later, Vejrø hit 10,000 plus organic visitors, ranked for 200 plus first-page keywords, and pulled a 2.2 percent booking conversion rate from organic traffic. The same pattern applies to content marketing for food brands: recipe schema, ingredient comparison guides, and sourcing story pages pull organic traffic at 20 to 40 percent conversion into hero SKU pages inside 6 months when the content quality matches search intent and every page carries the right structured data markup. Vejrø also proved out the reporting discipline: every monthly report named the exact page, the exact keyword cluster, and the exact search feature (rich result, sitelinks, image pack) driving the incremental organic revenue instead of hiding behind aggregate traffic charts.
Recipe cadence and content calendar for food brands
Recipe cadence on a working food brand content calendar ships 2 to 4 new recipes per week during the first 6 months and drops to 1 per week at maturity. Each recipe takes 4 to 6 hours to produce (write, test in the kitchen, photograph, schema author, publish). At 3 recipes per week, the brand hits 78 recipes inside 6 months plus a backlog of ingredient comparison and sourcing content queued behind the recipe production line.
| Content pillar | Target volume year 1 | Production cost per piece | Refresh cadence |
|---|---|---|---|
| Recipe hub | 40 to 100 recipes | $180 to $320 | Every 12 months |
| Ingredient comparison guides | 12 to 24 guides | $450 to $780 | Every 18 months |
| Sourcing story pages | 6 to 12 pages | $680 to $1,200 | Every 24 months |
| Buyer intent content | 8 to 16 pieces | $220 to $420 | Every 12 months |
Photography as a content calendar constraint
Photography is the actual constraint on recipe cadence, not writing. Every recipe needs 6 to 12 photos: hero shot, ingredient flat lay, prep in progress, plated result, storage, and step shots for the schema markup. A working food brand batches photography 8 recipes at a time to keep the cost per recipe under 200 dollars. Skip the batching and the per-recipe cost climbs to 400 to 600 dollars, which caps recipe cadence at 1 per week and slows organic ranking timeline by 6 months.
Seasonal content calendar planning
Seasonal content calendar planning maps recipes and comparison guides to the seasonal windows they need to rank in. A Christmas cookie recipe needs to publish in September to rank by early December. A Valentine’s chocolate guide needs to publish in November to rank by early February. A back-to-school lunchbox recipe needs to publish in June to rank by late August. The 60-to-90-day ranking curve dictates the calendar.
Creator syndication inside food brand content
Creator syndication on food brand content marketing amplifies the recipe hub through Instagram Reels, TikTok, and YouTube Shorts creators paid to post their own version of the brand’s hero recipes. The creator content pulls net-new audiences into the recipe hub through the creator’s Link in Bio or Amazon Storefront tag. The syndication calendar names 12 to 30 creators per quarter with specific recipes assigned to each.
One brand we picked up had a spreadsheet titled “creator outreach 2023” with 47 rows and 3 responses. All 3 responses were auto-replies. The spreadsheet named zero recipes and offered flat rates below 100 dollars per post. Nobody posts a 30-second video for 87 dollars flat. Nobody.
Creator content commercial terms that work
Working creator content commercial terms run 350 to 1,500 dollars flat per post plus a 12 to 25 percent commission on tagged sales across a 30-day window. The commission mechanic pulls creators into follow-up posts because the incremental revenue continues past the initial fee. Mid-tier creators (30k to 150k followers) hit the sweet spot for food brand content because their engagement rate typically runs 4 to 8 percent versus 0.8 to 1.6 percent on mega-creators.
Content brief structure for creator partnerships
The content brief structure for creator partnerships runs a single page: the SKU, the specific recipe or usage occasion, 3 required brand mentions, 3 restricted claims (no health claims on non-medical SKUs), the pricing angle, the affiliate link, and 3 example videos that hit the tone. The brief avoids over-scripting because over-scripted creator content underperforms native creator voice by 40 to 60 percent on engagement rate.
Buyer intent content for food brand blogs
Buyer intent content on food brand blogs covers 8 to 16 pieces targeting explicit purchase-decision queries: “where to buy [brand],” “[brand] subscription vs. one-time,” “best [category] for [use case],” and “[brand] gift bundle.” Every buyer intent piece runs 1,400 to 2,400 words with a comparison table, product cards, and a clear conversion path to the specific SKU that matches the query intent. Buyer intent content converts at 3 to 6 percent versus 1 to 2 percent on recipe content because the shopper landed already planning to buy, not exploring a usage occasion.
Where-to-buy content structure
Where-to-buy content structure covers online (DTC storefront, Amazon, Target.com, Whole Foods online), retail (specific chain locators with the store finder embedded), and international (customs limitations, retailer partners abroad). Every piece names specific retailers, links to the store locator, and includes an FAQ block covering shipping availability, subscription options, and gift card compatibility. Where-to-buy content ranks for branded discovery queries the DTC storefront otherwise loses to competitor affiliate reviews.
Subscription versus one-time comparison content
Subscription versus one-time comparison content converts subscription commitments at 3 to 6 percent because it addresses the price-sensitivity concern head-on with a specific math table. The piece covers the discount structure (15 percent lifetime), the skip-a-month mechanic, the pause-anytime rule, the cancellation policy, and the specific yearly savings for the brand’s average consumption cadence. Cross-reference the retention structure on our food and beverage marketing retainer page.
Content refresh cadence on food brand pillars
Content refresh cadence on food brand content pillars runs a rolling audit every 12 to 24 months by pillar. Recipes get refreshed every 12 months with new photography, updated schema, and any nutrition or ingredient adjustments. Ingredient comparison guides refresh every 18 months to update market data. Sourcing story pages refresh every 24 months to reflect farm partnership changes and new harvest angles. Buyer intent content refreshes every 12 months to update retailer availability and pricing.
Recipe refresh priority order
Recipe refresh priority runs by organic traffic rank. The top 20 recipes by monthly organic sessions get refreshed first (new photography, schema audit, related recipe internal links, updated nutrition). The next 40 get refreshed at 15 months. The remaining recipes get refreshed opportunistically when the ranking slips past position 15 in Google. Skipping the refresh cadence lets recipe rankings drift out of the top 3 inside 18 months as newer competitor recipes take the position.
Schema audit checklist per refresh
The schema audit checklist per refresh runs 8 items: Recipe schema completeness, aggregateRating count and accuracy, nutrition data accuracy, prepTime and cookTime match the recipe body, image URLs valid at CDN, related recipe internal links working, product card SKU URL live, and Google Search Console rich result eligibility validated. This checklist takes 20 minutes per recipe and prevents the schema drift that costs recipe rankings 20 to 40 positions quietly.
Reporting cadence for food brand content marketing
Reporting cadence on food brand content marketing runs a monthly executive report plus a quarterly business review. The monthly report ships in the first business week and covers organic sessions by pillar, top 10 ranking recipes with position trend, ingredient guide ranking movements, sourcing page performance, and organic-attributed DTC revenue. Every number carries a comparison to the prior month and a plain-language interpretation the founder reads in 7 minutes.
Metrics that matter for content marketing
Metrics that matter for food brand content marketing: organic sessions by pillar, recipe rich result impressions in Search Console, organic conversion rate to hero SKU pages, organic-attributed DTC revenue, and top 20 ranking positions by monthly organic sessions. Vanity metrics that do not matter: total pageviews without conversion context, average time on page without conversion attribution, and social share counts. The monthly report skips the vanity block entirely.
Quarterly business review structure
The quarterly business review runs 90 minutes with the founder, head of content, and SEO lead. Agenda: organic traffic trend by pillar, top 10 winning content pieces, top 10 losing content pieces (candidates for refresh or removal), competitive gap analysis against 5 named competitor brands, and next quarter’s content calendar with recipes and ingredient guides queued. According to Ahrefs content marketing research, brands running quarterly content audits outperform brands running annual audits by 40 to 70 percent on organic revenue over a 24-month window.
Internal linking discipline across food brand content
Internal linking discipline across food brand content moves authority from recipe pages toward hero SKU product pages and comparison guides. Every recipe links to the hero SKU it uses inline (once in the ingredient list, once in a bottom call-out card). Every ingredient comparison guide links to 3 to 6 recipes using the winning ingredient plus the hero SKU product page. Every sourcing story links to the 2 to 4 SKUs sourced from that specific farm or cooperative.
Anchor text strategy across recipe hubs
Anchor text on internal links varies across recipe hubs to avoid over-optimization patterns Google penalizes. Exact-match anchor (“single-origin Ethiopian coffee”) runs on 20 to 30 percent of internal links. Partial-match variations (“our Ethiopian roast”) run on 30 to 40 percent. Branded anchors (the SKU name) run on 20 to 30 percent. Generic anchors (“shop the coffee”) fill the remaining 10 to 20 percent. This ratio holds ranking without triggering the over-optimization penalty that shows up on brands that anchor-text-stuff every internal link with the same exact-match keyword. Cross-reference the linking layer on our food and beverage web design page.
Link equity from ingredient guides to SKU pages
Link equity from ingredient guides passes to SKU pages when the guide’s comparison table names the hero SKU in the winning column with a product card, and when the guide’s body links to 3 to 6 recipes that use the winning ingredient. This 3-hop path (guide to recipe to SKU) pushes authority from a high-traffic informational query down to a high-intent transactional page. According to Search Engine Land SEO coverage, informational content that internally links to transactional pages produces 2 to 4 times higher organic revenue than isolated content silos.
Wrapping up content marketing for food brands
Content marketing for food brands is the organic engine that turns a DTC snack, drink, or CPG storefront into a search-driven revenue channel. Recipe hub of 40 to 100 recipes. Ingredient comparison guides at 12 to 24 pieces. Sourcing story pages at 6 to 12 pieces. Buyer intent content at 8 to 16 pieces. Creator syndication calendar with 12 to 30 creators per quarter. Refresh cadence at 12 to 24 months by pillar. Reporting with organic sessions and organic revenue attribution.
If your DTC food brand is running paid social at 20,000 dollars monthly with a broken blog and zero recipe schema, professional content marketing for food brands pays for itself inside the first 90 days on organic traffic captured. Redefine Web ships content marketing inside our monthly retainer packages. Book a call and we will walk through the last three DTC food brands we built recipe hubs for, pillar by pillar.
Anchor text on internal links varies across recipe hubs to avoid over-optimization patterns Google penalizes. Exact-match anchor (“single-origin Ethiopian coffee”) runs on 20 to 30 percent of internal links. Partial-match variations (“our Ethiopian roast”) run on 30 to 40 percent. Branded anchors (the SKU name) run on 20 to 30 percent. Generic anchors (“shop the coffee”) fill the remaining 10 to 20 percent. This ratio holds ranking without triggering the over-optimization penalty that shows up on brands that anchor-text-stuff every internal link with the same exact-match keyword. Cross-reference the linking layer on our food and beverage web design page.
Link equity from ingredient guides to SKU pages
Link equity from ingredient guides passes to SKU pages when the guide’s comparison table names the hero SKU in the winning column with a product card, and when the guide’s body links to 3 to 6 recipes that use the winning ingredient. This 3-hop path (guide to recipe to SKU) pushes authority from a high-traffic informational query down to a high-intent transactional page. According to Search Engine Land SEO coverage, informational content that internally links to transactional pages produces 2 to 4 times higher organic revenue than isolated content silos.
Wrapping up content marketing for food brands
Content marketing for food brands is the organic engine that turns a DTC snack, drink, or CPG storefront into a search-driven revenue channel. Recipe hub of 40 to 100 recipes. Ingredient comparison guides at 12 to 24 pieces. Sourcing story pages at 6 to 12 pieces. Buyer intent content at 8 to 16 pieces. Creator syndication calendar with 12 to 30 creators per quarter. Refresh cadence at 12 to 24 months by pillar. Reporting with organic sessions and organic revenue attribution.
If your DTC food brand is running paid social at 20,000 dollars monthly with a broken blog and zero recipe schema, professional content marketing for food brands pays for itself inside the first 90 days on organic traffic captured. Redefine Web ships content marketing inside our monthly retainer packages. Book a call and we will walk through the last three DTC food brands we built recipe hubs for, pillar by pillar.
Content marketing for food brands starts with a recipe hub because recipe queries account for 40 to 60 percent of high-intent search volume in the food category. Every hero SKU needs 4 to 12 recipes anchored to it, each targeting a specific occasion and audience.
Skip the recipe hub and the brand loses the search real estate that pulls DTC storefront traffic month over month at zero incremental paid cost. Recipe traffic converts at 2 to 4 percent because the shopper landed with usage intent, not passive discovery, which is why food brands win on recipes.
Recipe schema and Google rich result eligibility
Every recipe page ships schema.org Recipe markup including cookTime, prepTime, recipeIngredient, recipeInstructions, nutrition, and aggregateRating. Correctly marked-up recipes qualify for Google’s recipe rich result carousel that pulls 3 to 6 times higher click-through rate than a plain blue link. The schema layer takes 15 minutes per recipe to author and 30 minutes to validate in Google Search Console. Cross-reference the recipe search stack on our food and beverage SEO page.
Recipe hub structure that scales
The recipe hub structure runs 40 to 100 recipes at maturity, organized by hero SKU (4 to 12 recipes per SKU) plus occasion tags (breakfast, weeknight dinner, meal prep, brunch, holiday). Every recipe links back to the hero SKU product page with the SKU embedded in an inline card. The hub earns internal linking value from ingredient comparison guides and the sourcing story pages, which feeds recipe ranking on Google. According to Google Search Central recipe structured data guidance, complete Recipe schema markup is required for eligibility in the recipe carousel and the ingredient search filter.
Pillar structure for food brand content marketing
The pillar structure on content marketing for food brands runs 4 content pillars concurrently: recipe hub (40 to 100 recipes), ingredient comparison guides (12 to 24 guides), sourcing story pages (6 to 12 pages), and buyer intent content (where to buy, subscription vs. one-time, gift bundle guides). Every pillar covers a distinct search intent and every pillar links back to the hero SKU product pages.
Ingredient comparison guide format
Ingredient comparison guides run 1,800 to 3,200 words comparing 2 to 4 ingredient types on 6 to 10 attributes with a comparison table, real-world use case examples, and links to the hero SKU that uses the specific ingredient. Example: organic vs. conventional oats compares nutritional profile, sourcing chain, cost, environmental impact, and taste on a 6-column table. The brand’s SKU appears in the winning column with a product card. These guides rank 3 to 8 months after publication and pull steady-state organic traffic.
Sourcing story pages that build trust
Sourcing story pages name the specific farms, cooperatives, or suppliers the brand sources from, with photos of the farms, farmer quotes, and specific harvest windows. A coffee brand’s Ethiopian farm page ranks for “single-origin Ethiopian coffee” and “Yirgacheffe coffee origin” plus 40 long-tail variations. The sourcing page pulls trust-building traffic that converts at 4 to 6 percent because the shopper landed pattern-matching on transparency and named provenance. Every sourcing page includes farmer or cooperative quotes, harvest dates, and a link back to 3 to 5 hero SKU pages that source from the named supplier.
Vejrø hospitality content case study
Vejrø Resort, a Danish private-island destination with an on-site restaurant focused on organic, locally sourced cuisine, joined us with strong social engagement and no organic-search real estate. Guests found the resort on Instagram but never in Google search for terms like “private island resort Denmark,” “farm-to-table hospitality Denmark,” or “Vejrø restaurant.” The same organic-search gap shows up on DTC food brands running paid social at 20,000 dollars monthly with a broken blog and zero recipe schema.
We built the conversion-focused website with on-site and off-site SEO tuned to the travel-niche keyword clusters, competitor analysis against comparable boutique resorts, and mobile-first design prioritizing guest discovery. Every page carried the structured data qualifying it for Google’s rich results in the hospitality category. Every internal link pushed authority toward the direct-booking conversion path.
Three months later, Vejrø hit 10,000 plus organic visitors, ranked for 200 plus first-page keywords, and pulled a 2.2 percent booking conversion rate from organic traffic. The same pattern applies to content marketing for food brands: recipe schema, ingredient comparison guides, and sourcing story pages pull organic traffic at 20 to 40 percent conversion into hero SKU pages inside 6 months when the content quality matches search intent and every page carries the right structured data markup. Vejrø also proved out the reporting discipline: every monthly report named the exact page, the exact keyword cluster, and the exact search feature (rich result, sitelinks, image pack) driving the incremental organic revenue instead of hiding behind aggregate traffic charts.
Recipe cadence and content calendar for food brands
Recipe cadence on a working food brand content calendar ships 2 to 4 new recipes per week during the first 6 months and drops to 1 per week at maturity. Each recipe takes 4 to 6 hours to produce (write, test in the kitchen, photograph, schema author, publish). At 3 recipes per week, the brand hits 78 recipes inside 6 months plus a backlog of ingredient comparison and sourcing content queued behind the recipe production line.
| Content pillar | Target volume year 1 | Production cost per piece | Refresh cadence |
|---|---|---|---|
| Recipe hub | 40 to 100 recipes | $180 to $320 | Every 12 months |
| Ingredient comparison guides | 12 to 24 guides | $450 to $780 | Every 18 months |
| Sourcing story pages | 6 to 12 pages | $680 to $1,200 | Every 24 months |
| Buyer intent content | 8 to 16 pieces | $220 to $420 | Every 12 months |
Photography as a content calendar constraint
Photography is the actual constraint on recipe cadence, not writing. Every recipe needs 6 to 12 photos: hero shot, ingredient flat lay, prep in progress, plated result, storage, and step shots for the schema markup. A working food brand batches photography 8 recipes at a time to keep the cost per recipe under 200 dollars. Skip the batching and the per-recipe cost climbs to 400 to 600 dollars, which caps recipe cadence at 1 per week and slows organic ranking timeline by 6 months.
Seasonal content calendar planning
Seasonal content calendar planning maps recipes and comparison guides to the seasonal windows they need to rank in. A Christmas cookie recipe needs to publish in September to rank by early December. A Valentine’s chocolate guide needs to publish in November to rank by early February. A back-to-school lunchbox recipe needs to publish in June to rank by late August. The 60-to-90-day ranking curve dictates the calendar.
Creator syndication inside food brand content
Creator syndication on food brand content marketing amplifies the recipe hub through Instagram Reels, TikTok, and YouTube Shorts creators paid to post their own version of the brand’s hero recipes. The creator content pulls net-new audiences into the recipe hub through the creator’s Link in Bio or Amazon Storefront tag. The syndication calendar names 12 to 30 creators per quarter with specific recipes assigned to each.
One brand we picked up had a spreadsheet titled “creator outreach 2023” with 47 rows and 3 responses. All 3 responses were auto-replies. The spreadsheet named zero recipes and offered flat rates below 100 dollars per post. Nobody posts a 30-second video for 87 dollars flat. Nobody.
Creator content commercial terms that work
Working creator content commercial terms run 350 to 1,500 dollars flat per post plus a 12 to 25 percent commission on tagged sales across a 30-day window. The commission mechanic pulls creators into follow-up posts because the incremental revenue continues past the initial fee. Mid-tier creators (30k to 150k followers) hit the sweet spot for food brand content because their engagement rate typically runs 4 to 8 percent versus 0.8 to 1.6 percent on mega-creators.
Content brief structure for creator partnerships
The content brief structure for creator partnerships runs a single page: the SKU, the specific recipe or usage occasion, 3 required brand mentions, 3 restricted claims (no health claims on non-medical SKUs), the pricing angle, the affiliate link, and 3 example videos that hit the tone. The brief avoids over-scripting because over-scripted creator content underperforms native creator voice by 40 to 60 percent on engagement rate.
Buyer intent content for food brand blogs
Buyer intent content on food brand blogs covers 8 to 16 pieces targeting explicit purchase-decision queries: “where to buy [brand],” “[brand] subscription vs. one-time,” “best [category] for [use case],” and “[brand] gift bundle.” Every buyer intent piece runs 1,400 to 2,400 words with a comparison table, product cards, and a clear conversion path to the specific SKU that matches the query intent. Buyer intent content converts at 3 to 6 percent versus 1 to 2 percent on recipe content because the shopper landed already planning to buy, not exploring a usage occasion.
Where-to-buy content structure
Where-to-buy content structure covers online (DTC storefront, Amazon, Target.com, Whole Foods online), retail (specific chain locators with the store finder embedded), and international (customs limitations, retailer partners abroad). Every piece names specific retailers, links to the store locator, and includes an FAQ block covering shipping availability, subscription options, and gift card compatibility. Where-to-buy content ranks for branded discovery queries the DTC storefront otherwise loses to competitor affiliate reviews.
Subscription versus one-time comparison content
Subscription versus one-time comparison content converts subscription commitments at 3 to 6 percent because it addresses the price-sensitivity concern head-on with a specific math table. The piece covers the discount structure (15 percent lifetime), the skip-a-month mechanic, the pause-anytime rule, the cancellation policy, and the specific yearly savings for the brand’s average consumption cadence. Cross-reference the retention structure on our food and beverage marketing retainer page.
Content refresh cadence on food brand pillars
Content refresh cadence on food brand content pillars runs a rolling audit every 12 to 24 months by pillar. Recipes get refreshed every 12 months with new photography, updated schema, and any nutrition or ingredient adjustments. Ingredient comparison guides refresh every 18 months to update market data. Sourcing story pages refresh every 24 months to reflect farm partnership changes and new harvest angles. Buyer intent content refreshes every 12 months to update retailer availability and pricing.
Recipe refresh priority order
Recipe refresh priority runs by organic traffic rank. The top 20 recipes by monthly organic sessions get refreshed first (new photography, schema audit, related recipe internal links, updated nutrition). The next 40 get refreshed at 15 months. The remaining recipes get refreshed opportunistically when the ranking slips past position 15 in Google. Skipping the refresh cadence lets recipe rankings drift out of the top 3 inside 18 months as newer competitor recipes take the position.
Schema audit checklist per refresh
The schema audit checklist per refresh runs 8 items: Recipe schema completeness, aggregateRating count and accuracy, nutrition data accuracy, prepTime and cookTime match the recipe body, image URLs valid at CDN, related recipe internal links working, product card SKU URL live, and Google Search Console rich result eligibility validated. This checklist takes 20 minutes per recipe and prevents the schema drift that costs recipe rankings 20 to 40 positions quietly.
Reporting cadence for food brand content marketing
Reporting cadence on food brand content marketing runs a monthly executive report plus a quarterly business review. The monthly report ships in the first business week and covers organic sessions by pillar, top 10 ranking recipes with position trend, ingredient guide ranking movements, sourcing page performance, and organic-attributed DTC revenue. Every number carries a comparison to the prior month and a plain-language interpretation the founder reads in 7 minutes.
Metrics that matter for content marketing
Metrics that matter for food brand content marketing: organic sessions by pillar, recipe rich result impressions in Search Console, organic conversion rate to hero SKU pages, organic-attributed DTC revenue, and top 20 ranking positions by monthly organic sessions. Vanity metrics that do not matter: total pageviews without conversion context, average time on page without conversion attribution, and social share counts. The monthly report skips the vanity block entirely.
Quarterly business review structure
The quarterly business review runs 90 minutes with the founder, head of content, and SEO lead. Agenda: organic traffic trend by pillar, top 10 winning content pieces, top 10 losing content pieces (candidates for refresh or removal), competitive gap analysis against 5 named competitor brands, and next quarter’s content calendar with recipes and ingredient guides queued. According to Ahrefs content marketing research, brands running quarterly content audits outperform brands running annual audits by 40 to 70 percent on organic revenue over a 24-month window.
Internal linking discipline across food brand content
Internal linking discipline across food brand content moves authority from recipe pages toward hero SKU product pages and comparison guides. Every recipe links to the hero SKU it uses inline (once in the ingredient list, once in a bottom call-out card). Every ingredient comparison guide links to 3 to 6 recipes using the winning ingredient plus the hero SKU product page. Every sourcing story links to the 2 to 4 SKUs sourced from that specific farm or cooperative.
Anchor text strategy across recipe hubs
Anchor text on internal links varies across recipe hubs to avoid over-optimization patterns Google penalizes. Exact-match anchor (“single-origin Ethiopian coffee”) runs on 20 to 30 percent of internal links. Partial-match variations (“our Ethiopian roast”) run on 30 to 40 percent. Branded anchors (the SKU name) run on 20 to 30 percent. Generic anchors (“shop the coffee”) fill the remaining 10 to 20 percent. This ratio holds ranking without triggering the over-optimization penalty that shows up on brands that anchor-text-stuff every internal link with the same exact-match keyword. Cross-reference the linking layer on our food and beverage web design page.
Link equity from ingredient guides to SKU pages
Link equity from ingredient guides passes to SKU pages when the guide’s comparison table names the hero SKU in the winning column with a product card, and when the guide’s body links to 3 to 6 recipes that use the winning ingredient. This 3-hop path (guide to recipe to SKU) pushes authority from a high-traffic informational query down to a high-intent transactional page. According to Search Engine Land SEO coverage, informational content that internally links to transactional pages produces 2 to 4 times higher organic revenue than isolated content silos.
Wrapping up content marketing for food brands
Content marketing for food brands is the organic engine that turns a DTC snack, drink, or CPG storefront into a search-driven revenue channel. Recipe hub of 40 to 100 recipes. Ingredient comparison guides at 12 to 24 pieces. Sourcing story pages at 6 to 12 pieces. Buyer intent content at 8 to 16 pieces. Creator syndication calendar with 12 to 30 creators per quarter. Refresh cadence at 12 to 24 months by pillar. Reporting with organic sessions and organic revenue attribution.
If your DTC food brand is running paid social at 20,000 dollars monthly with a broken blog and zero recipe schema, professional content marketing for food brands pays for itself inside the first 90 days on organic traffic captured. Redefine Web ships content marketing inside our monthly retainer packages. Book a call and we will walk through the last three DTC food brands we built recipe hubs for, pillar by pillar.
Content marketing for food brands starts with a recipe hub because recipe queries account for 40 to 60 percent of high-intent search volume in the food category. Every hero SKU needs 4 to 12 recipes anchored to it, each targeting a specific occasion and audience.
Skip the recipe hub and the brand loses the search real estate that pulls DTC storefront traffic month over month at zero incremental paid cost. Recipe traffic converts at 2 to 4 percent because the shopper landed with usage intent, not passive discovery, which is why food brands win on recipes.
Recipe schema and Google rich result eligibility
Every recipe page ships schema.org Recipe markup including cookTime, prepTime, recipeIngredient, recipeInstructions, nutrition, and aggregateRating. Correctly marked-up recipes qualify for Google’s recipe rich result carousel that pulls 3 to 6 times higher click-through rate than a plain blue link. The schema layer takes 15 minutes per recipe to author and 30 minutes to validate in Google Search Console. Cross-reference the recipe search stack on our food and beverage SEO page.
Recipe hub structure that scales
The recipe hub structure runs 40 to 100 recipes at maturity, organized by hero SKU (4 to 12 recipes per SKU) plus occasion tags (breakfast, weeknight dinner, meal prep, brunch, holiday). Every recipe links back to the hero SKU product page with the SKU embedded in an inline card. The hub earns internal linking value from ingredient comparison guides and the sourcing story pages, which feeds recipe ranking on Google. According to Google Search Central recipe structured data guidance, complete Recipe schema markup is required for eligibility in the recipe carousel and the ingredient search filter.
Pillar structure for food brand content marketing
The pillar structure on content marketing for food brands runs 4 content pillars concurrently: recipe hub (40 to 100 recipes), ingredient comparison guides (12 to 24 guides), sourcing story pages (6 to 12 pages), and buyer intent content (where to buy, subscription vs. one-time, gift bundle guides). Every pillar covers a distinct search intent and every pillar links back to the hero SKU product pages.
Ingredient comparison guide format
Ingredient comparison guides run 1,800 to 3,200 words comparing 2 to 4 ingredient types on 6 to 10 attributes with a comparison table, real-world use case examples, and links to the hero SKU that uses the specific ingredient. Example: organic vs. conventional oats compares nutritional profile, sourcing chain, cost, environmental impact, and taste on a 6-column table. The brand’s SKU appears in the winning column with a product card. These guides rank 3 to 8 months after publication and pull steady-state organic traffic.
Sourcing story pages that build trust
Sourcing story pages name the specific farms, cooperatives, or suppliers the brand sources from, with photos of the farms, farmer quotes, and specific harvest windows. A coffee brand’s Ethiopian farm page ranks for “single-origin Ethiopian coffee” and “Yirgacheffe coffee origin” plus 40 long-tail variations. The sourcing page pulls trust-building traffic that converts at 4 to 6 percent because the shopper landed pattern-matching on transparency and named provenance. Every sourcing page includes farmer or cooperative quotes, harvest dates, and a link back to 3 to 5 hero SKU pages that source from the named supplier.
Vejrø hospitality content case study
Vejrø Resort, a Danish private-island destination with an on-site restaurant focused on organic, locally sourced cuisine, joined us with strong social engagement and no organic-search real estate. Guests found the resort on Instagram but never in Google search for terms like “private island resort Denmark,” “farm-to-table hospitality Denmark,” or “Vejrø restaurant.” The same organic-search gap shows up on DTC food brands running paid social at 20,000 dollars monthly with a broken blog and zero recipe schema.
We built the conversion-focused website with on-site and off-site SEO tuned to the travel-niche keyword clusters, competitor analysis against comparable boutique resorts, and mobile-first design prioritizing guest discovery. Every page carried the structured data qualifying it for Google’s rich results in the hospitality category. Every internal link pushed authority toward the direct-booking conversion path.
Three months later, Vejrø hit 10,000 plus organic visitors, ranked for 200 plus first-page keywords, and pulled a 2.2 percent booking conversion rate from organic traffic. The same pattern applies to content marketing for food brands: recipe schema, ingredient comparison guides, and sourcing story pages pull organic traffic at 20 to 40 percent conversion into hero SKU pages inside 6 months when the content quality matches search intent and every page carries the right structured data markup. Vejrø also proved out the reporting discipline: every monthly report named the exact page, the exact keyword cluster, and the exact search feature (rich result, sitelinks, image pack) driving the incremental organic revenue instead of hiding behind aggregate traffic charts.
Recipe cadence and content calendar for food brands
Recipe cadence on a working food brand content calendar ships 2 to 4 new recipes per week during the first 6 months and drops to 1 per week at maturity. Each recipe takes 4 to 6 hours to produce (write, test in the kitchen, photograph, schema author, publish). At 3 recipes per week, the brand hits 78 recipes inside 6 months plus a backlog of ingredient comparison and sourcing content queued behind the recipe production line.
| Content pillar | Target volume year 1 | Production cost per piece | Refresh cadence |
|---|---|---|---|
| Recipe hub | 40 to 100 recipes | $180 to $320 | Every 12 months |
| Ingredient comparison guides | 12 to 24 guides | $450 to $780 | Every 18 months |
| Sourcing story pages | 6 to 12 pages | $680 to $1,200 | Every 24 months |
| Buyer intent content | 8 to 16 pieces | $220 to $420 | Every 12 months |
Photography as a content calendar constraint
Photography is the actual constraint on recipe cadence, not writing. Every recipe needs 6 to 12 photos: hero shot, ingredient flat lay, prep in progress, plated result, storage, and step shots for the schema markup. A working food brand batches photography 8 recipes at a time to keep the cost per recipe under 200 dollars. Skip the batching and the per-recipe cost climbs to 400 to 600 dollars, which caps recipe cadence at 1 per week and slows organic ranking timeline by 6 months.
Seasonal content calendar planning
Seasonal content calendar planning maps recipes and comparison guides to the seasonal windows they need to rank in. A Christmas cookie recipe needs to publish in September to rank by early December. A Valentine’s chocolate guide needs to publish in November to rank by early February. A back-to-school lunchbox recipe needs to publish in June to rank by late August. The 60-to-90-day ranking curve dictates the calendar.
Creator syndication inside food brand content
Creator syndication on food brand content marketing amplifies the recipe hub through Instagram Reels, TikTok, and YouTube Shorts creators paid to post their own version of the brand’s hero recipes. The creator content pulls net-new audiences into the recipe hub through the creator’s Link in Bio or Amazon Storefront tag. The syndication calendar names 12 to 30 creators per quarter with specific recipes assigned to each.
One brand we picked up had a spreadsheet titled “creator outreach 2023” with 47 rows and 3 responses. All 3 responses were auto-replies. The spreadsheet named zero recipes and offered flat rates below 100 dollars per post. Nobody posts a 30-second video for 87 dollars flat. Nobody.
Creator content commercial terms that work
Working creator content commercial terms run 350 to 1,500 dollars flat per post plus a 12 to 25 percent commission on tagged sales across a 30-day window. The commission mechanic pulls creators into follow-up posts because the incremental revenue continues past the initial fee. Mid-tier creators (30k to 150k followers) hit the sweet spot for food brand content because their engagement rate typically runs 4 to 8 percent versus 0.8 to 1.6 percent on mega-creators.
Content brief structure for creator partnerships
The content brief structure for creator partnerships runs a single page: the SKU, the specific recipe or usage occasion, 3 required brand mentions, 3 restricted claims (no health claims on non-medical SKUs), the pricing angle, the affiliate link, and 3 example videos that hit the tone. The brief avoids over-scripting because over-scripted creator content underperforms native creator voice by 40 to 60 percent on engagement rate.
Buyer intent content for food brand blogs
Buyer intent content on food brand blogs covers 8 to 16 pieces targeting explicit purchase-decision queries: “where to buy [brand],” “[brand] subscription vs. one-time,” “best [category] for [use case],” and “[brand] gift bundle.” Every buyer intent piece runs 1,400 to 2,400 words with a comparison table, product cards, and a clear conversion path to the specific SKU that matches the query intent. Buyer intent content converts at 3 to 6 percent versus 1 to 2 percent on recipe content because the shopper landed already planning to buy, not exploring a usage occasion.
Where-to-buy content structure
Where-to-buy content structure covers online (DTC storefront, Amazon, Target.com, Whole Foods online), retail (specific chain locators with the store finder embedded), and international (customs limitations, retailer partners abroad). Every piece names specific retailers, links to the store locator, and includes an FAQ block covering shipping availability, subscription options, and gift card compatibility. Where-to-buy content ranks for branded discovery queries the DTC storefront otherwise loses to competitor affiliate reviews.
Subscription versus one-time comparison content
Subscription versus one-time comparison content converts subscription commitments at 3 to 6 percent because it addresses the price-sensitivity concern head-on with a specific math table. The piece covers the discount structure (15 percent lifetime), the skip-a-month mechanic, the pause-anytime rule, the cancellation policy, and the specific yearly savings for the brand’s average consumption cadence. Cross-reference the retention structure on our food and beverage marketing retainer page.
Content refresh cadence on food brand pillars
Content refresh cadence on food brand content pillars runs a rolling audit every 12 to 24 months by pillar. Recipes get refreshed every 12 months with new photography, updated schema, and any nutrition or ingredient adjustments. Ingredient comparison guides refresh every 18 months to update market data. Sourcing story pages refresh every 24 months to reflect farm partnership changes and new harvest angles. Buyer intent content refreshes every 12 months to update retailer availability and pricing.
Recipe refresh priority order
Recipe refresh priority runs by organic traffic rank. The top 20 recipes by monthly organic sessions get refreshed first (new photography, schema audit, related recipe internal links, updated nutrition). The next 40 get refreshed at 15 months. The remaining recipes get refreshed opportunistically when the ranking slips past position 15 in Google. Skipping the refresh cadence lets recipe rankings drift out of the top 3 inside 18 months as newer competitor recipes take the position.
Schema audit checklist per refresh
The schema audit checklist per refresh runs 8 items: Recipe schema completeness, aggregateRating count and accuracy, nutrition data accuracy, prepTime and cookTime match the recipe body, image URLs valid at CDN, related recipe internal links working, product card SKU URL live, and Google Search Console rich result eligibility validated. This checklist takes 20 minutes per recipe and prevents the schema drift that costs recipe rankings 20 to 40 positions quietly.
Reporting cadence for food brand content marketing
Reporting cadence on food brand content marketing runs a monthly executive report plus a quarterly business review. The monthly report ships in the first business week and covers organic sessions by pillar, top 10 ranking recipes with position trend, ingredient guide ranking movements, sourcing page performance, and organic-attributed DTC revenue. Every number carries a comparison to the prior month and a plain-language interpretation the founder reads in 7 minutes.
Metrics that matter for content marketing
Metrics that matter for food brand content marketing: organic sessions by pillar, recipe rich result impressions in Search Console, organic conversion rate to hero SKU pages, organic-attributed DTC revenue, and top 20 ranking positions by monthly organic sessions. Vanity metrics that do not matter: total pageviews without conversion context, average time on page without conversion attribution, and social share counts. The monthly report skips the vanity block entirely.
Quarterly business review structure
The quarterly business review runs 90 minutes with the founder, head of content, and SEO lead. Agenda: organic traffic trend by pillar, top 10 winning content pieces, top 10 losing content pieces (candidates for refresh or removal), competitive gap analysis against 5 named competitor brands, and next quarter’s content calendar with recipes and ingredient guides queued. According to Ahrefs content marketing research, brands running quarterly content audits outperform brands running annual audits by 40 to 70 percent on organic revenue over a 24-month window.
Internal linking discipline across food brand content
Internal linking discipline across food brand content moves authority from recipe pages toward hero SKU product pages and comparison guides. Every recipe links to the hero SKU it uses inline (once in the ingredient list, once in a bottom call-out card). Every ingredient comparison guide links to 3 to 6 recipes using the winning ingredient plus the hero SKU product page. Every sourcing story links to the 2 to 4 SKUs sourced from that specific farm or cooperative.
Anchor text strategy across recipe hubs
Anchor text on internal links varies across recipe hubs to avoid over-optimization patterns Google penalizes. Exact-match anchor (“single-origin Ethiopian coffee”) runs on 20 to 30 percent of internal links. Partial-match variations (“our Ethiopian roast”) run on 30 to 40 percent. Branded anchors (the SKU name) run on 20 to 30 percent. Generic anchors (“shop the coffee”) fill the remaining 10 to 20 percent. This ratio holds ranking without triggering the over-optimization penalty that shows up on brands that anchor-text-stuff every internal link with the same exact-match keyword. Cross-reference the linking layer on our food and beverage web design page.
Link equity from ingredient guides to SKU pages
Link equity from ingredient guides passes to SKU pages when the guide’s comparison table names the hero SKU in the winning column with a product card, and when the guide’s body links to 3 to 6 recipes that use the winning ingredient. This 3-hop path (guide to recipe to SKU) pushes authority from a high-traffic informational query down to a high-intent transactional page. According to Search Engine Land SEO coverage, informational content that internally links to transactional pages produces 2 to 4 times higher organic revenue than isolated content silos.
Wrapping up content marketing for food brands
Content marketing for food brands is the organic engine that turns a DTC snack, drink, or CPG storefront into a search-driven revenue channel. Recipe hub of 40 to 100 recipes. Ingredient comparison guides at 12 to 24 pieces. Sourcing story pages at 6 to 12 pieces. Buyer intent content at 8 to 16 pieces. Creator syndication calendar with 12 to 30 creators per quarter. Refresh cadence at 12 to 24 months by pillar. Reporting with organic sessions and organic revenue attribution.
If your DTC food brand is running paid social at 20,000 dollars monthly with a broken blog and zero recipe schema, professional content marketing for food brands pays for itself inside the first 90 days on organic traffic captured. Redefine Web ships content marketing inside our monthly retainer packages. Book a call and we will walk through the last three DTC food brands we built recipe hubs for, pillar by pillar.
Internal linking discipline across food brand content moves authority from recipe pages toward hero SKU product pages and comparison guides. Every recipe links to the hero SKU it uses inline (once in the ingredient list, once in a bottom call-out card). Every ingredient comparison guide links to 3 to 6 recipes using the winning ingredient plus the hero SKU product page. Every sourcing story links to the 2 to 4 SKUs sourced from that specific farm or cooperative.
Anchor text strategy across recipe hubs
Anchor text on internal links varies across recipe hubs to avoid over-optimization patterns Google penalizes. Exact-match anchor (“single-origin Ethiopian coffee”) runs on 20 to 30 percent of internal links. Partial-match variations (“our Ethiopian roast”) run on 30 to 40 percent. Branded anchors (the SKU name) run on 20 to 30 percent. Generic anchors (“shop the coffee”) fill the remaining 10 to 20 percent. This ratio holds ranking without triggering the over-optimization penalty that shows up on brands that anchor-text-stuff every internal link with the same exact-match keyword. Cross-reference the linking layer on our food and beverage web design page.
Link equity from ingredient guides to SKU pages
Link equity from ingredient guides passes to SKU pages when the guide’s comparison table names the hero SKU in the winning column with a product card, and when the guide’s body links to 3 to 6 recipes that use the winning ingredient. This 3-hop path (guide to recipe to SKU) pushes authority from a high-traffic informational query down to a high-intent transactional page. According to Search Engine Land SEO coverage, informational content that internally links to transactional pages produces 2 to 4 times higher organic revenue than isolated content silos.
Wrapping up content marketing for food brands
Content marketing for food brands is the organic engine that turns a DTC snack, drink, or CPG storefront into a search-driven revenue channel. Recipe hub of 40 to 100 recipes. Ingredient comparison guides at 12 to 24 pieces. Sourcing story pages at 6 to 12 pieces. Buyer intent content at 8 to 16 pieces. Creator syndication calendar with 12 to 30 creators per quarter. Refresh cadence at 12 to 24 months by pillar. Reporting with organic sessions and organic revenue attribution.
If your DTC food brand is running paid social at 20,000 dollars monthly with a broken blog and zero recipe schema, professional content marketing for food brands pays for itself inside the first 90 days on organic traffic captured. Redefine Web ships content marketing inside our monthly retainer packages. Book a call and we will walk through the last three DTC food brands we built recipe hubs for, pillar by pillar.
Content marketing for food brands starts with a recipe hub because recipe queries account for 40 to 60 percent of high-intent search volume in the food category. Every hero SKU needs 4 to 12 recipes anchored to it, each targeting a specific occasion and audience.
Skip the recipe hub and the brand loses the search real estate that pulls DTC storefront traffic month over month at zero incremental paid cost. Recipe traffic converts at 2 to 4 percent because the shopper landed with usage intent, not passive discovery, which is why food brands win on recipes.
Recipe schema and Google rich result eligibility
Every recipe page ships schema.org Recipe markup including cookTime, prepTime, recipeIngredient, recipeInstructions, nutrition, and aggregateRating. Correctly marked-up recipes qualify for Google’s recipe rich result carousel that pulls 3 to 6 times higher click-through rate than a plain blue link. The schema layer takes 15 minutes per recipe to author and 30 minutes to validate in Google Search Console. Cross-reference the recipe search stack on our food and beverage SEO page.
Recipe hub structure that scales
The recipe hub structure runs 40 to 100 recipes at maturity, organized by hero SKU (4 to 12 recipes per SKU) plus occasion tags (breakfast, weeknight dinner, meal prep, brunch, holiday). Every recipe links back to the hero SKU product page with the SKU embedded in an inline card. The hub earns internal linking value from ingredient comparison guides and the sourcing story pages, which feeds recipe ranking on Google. According to Google Search Central recipe structured data guidance, complete Recipe schema markup is required for eligibility in the recipe carousel and the ingredient search filter.
Pillar structure for food brand content marketing
The pillar structure on content marketing for food brands runs 4 content pillars concurrently: recipe hub (40 to 100 recipes), ingredient comparison guides (12 to 24 guides), sourcing story pages (6 to 12 pages), and buyer intent content (where to buy, subscription vs. one-time, gift bundle guides). Every pillar covers a distinct search intent and every pillar links back to the hero SKU product pages.
Ingredient comparison guide format
Ingredient comparison guides run 1,800 to 3,200 words comparing 2 to 4 ingredient types on 6 to 10 attributes with a comparison table, real-world use case examples, and links to the hero SKU that uses the specific ingredient. Example: organic vs. conventional oats compares nutritional profile, sourcing chain, cost, environmental impact, and taste on a 6-column table. The brand’s SKU appears in the winning column with a product card. These guides rank 3 to 8 months after publication and pull steady-state organic traffic.
Sourcing story pages that build trust
Sourcing story pages name the specific farms, cooperatives, or suppliers the brand sources from, with photos of the farms, farmer quotes, and specific harvest windows. A coffee brand’s Ethiopian farm page ranks for “single-origin Ethiopian coffee” and “Yirgacheffe coffee origin” plus 40 long-tail variations. The sourcing page pulls trust-building traffic that converts at 4 to 6 percent because the shopper landed pattern-matching on transparency and named provenance. Every sourcing page includes farmer or cooperative quotes, harvest dates, and a link back to 3 to 5 hero SKU pages that source from the named supplier.
Vejrø hospitality content case study
Vejrø Resort, a Danish private-island destination with an on-site restaurant focused on organic, locally sourced cuisine, joined us with strong social engagement and no organic-search real estate. Guests found the resort on Instagram but never in Google search for terms like “private island resort Denmark,” “farm-to-table hospitality Denmark,” or “Vejrø restaurant.” The same organic-search gap shows up on DTC food brands running paid social at 20,000 dollars monthly with a broken blog and zero recipe schema.
We built the conversion-focused website with on-site and off-site SEO tuned to the travel-niche keyword clusters, competitor analysis against comparable boutique resorts, and mobile-first design prioritizing guest discovery. Every page carried the structured data qualifying it for Google’s rich results in the hospitality category. Every internal link pushed authority toward the direct-booking conversion path.
Three months later, Vejrø hit 10,000 plus organic visitors, ranked for 200 plus first-page keywords, and pulled a 2.2 percent booking conversion rate from organic traffic. The same pattern applies to content marketing for food brands: recipe schema, ingredient comparison guides, and sourcing story pages pull organic traffic at 20 to 40 percent conversion into hero SKU pages inside 6 months when the content quality matches search intent and every page carries the right structured data markup. Vejrø also proved out the reporting discipline: every monthly report named the exact page, the exact keyword cluster, and the exact search feature (rich result, sitelinks, image pack) driving the incremental organic revenue instead of hiding behind aggregate traffic charts.
Recipe cadence and content calendar for food brands
Recipe cadence on a working food brand content calendar ships 2 to 4 new recipes per week during the first 6 months and drops to 1 per week at maturity. Each recipe takes 4 to 6 hours to produce (write, test in the kitchen, photograph, schema author, publish). At 3 recipes per week, the brand hits 78 recipes inside 6 months plus a backlog of ingredient comparison and sourcing content queued behind the recipe production line.
| Content pillar | Target volume year 1 | Production cost per piece | Refresh cadence |
|---|---|---|---|
| Recipe hub | 40 to 100 recipes | $180 to $320 | Every 12 months |
| Ingredient comparison guides | 12 to 24 guides | $450 to $780 | Every 18 months |
| Sourcing story pages | 6 to 12 pages | $680 to $1,200 | Every 24 months |
| Buyer intent content | 8 to 16 pieces | $220 to $420 | Every 12 months |
Photography as a content calendar constraint
Photography is the actual constraint on recipe cadence, not writing. Every recipe needs 6 to 12 photos: hero shot, ingredient flat lay, prep in progress, plated result, storage, and step shots for the schema markup. A working food brand batches photography 8 recipes at a time to keep the cost per recipe under 200 dollars. Skip the batching and the per-recipe cost climbs to 400 to 600 dollars, which caps recipe cadence at 1 per week and slows organic ranking timeline by 6 months.
Seasonal content calendar planning
Seasonal content calendar planning maps recipes and comparison guides to the seasonal windows they need to rank in. A Christmas cookie recipe needs to publish in September to rank by early December. A Valentine’s chocolate guide needs to publish in November to rank by early February. A back-to-school lunchbox recipe needs to publish in June to rank by late August. The 60-to-90-day ranking curve dictates the calendar.
Creator syndication inside food brand content
Creator syndication on food brand content marketing amplifies the recipe hub through Instagram Reels, TikTok, and YouTube Shorts creators paid to post their own version of the brand’s hero recipes. The creator content pulls net-new audiences into the recipe hub through the creator’s Link in Bio or Amazon Storefront tag. The syndication calendar names 12 to 30 creators per quarter with specific recipes assigned to each.
One brand we picked up had a spreadsheet titled “creator outreach 2023” with 47 rows and 3 responses. All 3 responses were auto-replies. The spreadsheet named zero recipes and offered flat rates below 100 dollars per post. Nobody posts a 30-second video for 87 dollars flat. Nobody.
Creator content commercial terms that work
Working creator content commercial terms run 350 to 1,500 dollars flat per post plus a 12 to 25 percent commission on tagged sales across a 30-day window. The commission mechanic pulls creators into follow-up posts because the incremental revenue continues past the initial fee. Mid-tier creators (30k to 150k followers) hit the sweet spot for food brand content because their engagement rate typically runs 4 to 8 percent versus 0.8 to 1.6 percent on mega-creators.
Content brief structure for creator partnerships
The content brief structure for creator partnerships runs a single page: the SKU, the specific recipe or usage occasion, 3 required brand mentions, 3 restricted claims (no health claims on non-medical SKUs), the pricing angle, the affiliate link, and 3 example videos that hit the tone. The brief avoids over-scripting because over-scripted creator content underperforms native creator voice by 40 to 60 percent on engagement rate.
Buyer intent content for food brand blogs
Buyer intent content on food brand blogs covers 8 to 16 pieces targeting explicit purchase-decision queries: “where to buy [brand],” “[brand] subscription vs. one-time,” “best [category] for [use case],” and “[brand] gift bundle.” Every buyer intent piece runs 1,400 to 2,400 words with a comparison table, product cards, and a clear conversion path to the specific SKU that matches the query intent. Buyer intent content converts at 3 to 6 percent versus 1 to 2 percent on recipe content because the shopper landed already planning to buy, not exploring a usage occasion.
Where-to-buy content structure
Where-to-buy content structure covers online (DTC storefront, Amazon, Target.com, Whole Foods online), retail (specific chain locators with the store finder embedded), and international (customs limitations, retailer partners abroad). Every piece names specific retailers, links to the store locator, and includes an FAQ block covering shipping availability, subscription options, and gift card compatibility. Where-to-buy content ranks for branded discovery queries the DTC storefront otherwise loses to competitor affiliate reviews.
Subscription versus one-time comparison content
Subscription versus one-time comparison content converts subscription commitments at 3 to 6 percent because it addresses the price-sensitivity concern head-on with a specific math table. The piece covers the discount structure (15 percent lifetime), the skip-a-month mechanic, the pause-anytime rule, the cancellation policy, and the specific yearly savings for the brand’s average consumption cadence. Cross-reference the retention structure on our food and beverage marketing retainer page.
Content refresh cadence on food brand pillars
Content refresh cadence on food brand content pillars runs a rolling audit every 12 to 24 months by pillar. Recipes get refreshed every 12 months with new photography, updated schema, and any nutrition or ingredient adjustments. Ingredient comparison guides refresh every 18 months to update market data. Sourcing story pages refresh every 24 months to reflect farm partnership changes and new harvest angles. Buyer intent content refreshes every 12 months to update retailer availability and pricing.
Recipe refresh priority order
Recipe refresh priority runs by organic traffic rank. The top 20 recipes by monthly organic sessions get refreshed first (new photography, schema audit, related recipe internal links, updated nutrition). The next 40 get refreshed at 15 months. The remaining recipes get refreshed opportunistically when the ranking slips past position 15 in Google. Skipping the refresh cadence lets recipe rankings drift out of the top 3 inside 18 months as newer competitor recipes take the position.
Schema audit checklist per refresh
The schema audit checklist per refresh runs 8 items: Recipe schema completeness, aggregateRating count and accuracy, nutrition data accuracy, prepTime and cookTime match the recipe body, image URLs valid at CDN, related recipe internal links working, product card SKU URL live, and Google Search Console rich result eligibility validated. This checklist takes 20 minutes per recipe and prevents the schema drift that costs recipe rankings 20 to 40 positions quietly.
Reporting cadence for food brand content marketing
Reporting cadence on food brand content marketing runs a monthly executive report plus a quarterly business review. The monthly report ships in the first business week and covers organic sessions by pillar, top 10 ranking recipes with position trend, ingredient guide ranking movements, sourcing page performance, and organic-attributed DTC revenue. Every number carries a comparison to the prior month and a plain-language interpretation the founder reads in 7 minutes.
Metrics that matter for content marketing
Metrics that matter for food brand content marketing: organic sessions by pillar, recipe rich result impressions in Search Console, organic conversion rate to hero SKU pages, organic-attributed DTC revenue, and top 20 ranking positions by monthly organic sessions. Vanity metrics that do not matter: total pageviews without conversion context, average time on page without conversion attribution, and social share counts. The monthly report skips the vanity block entirely.
Quarterly business review structure
The quarterly business review runs 90 minutes with the founder, head of content, and SEO lead. Agenda: organic traffic trend by pillar, top 10 winning content pieces, top 10 losing content pieces (candidates for refresh or removal), competitive gap analysis against 5 named competitor brands, and next quarter’s content calendar with recipes and ingredient guides queued. According to Ahrefs content marketing research, brands running quarterly content audits outperform brands running annual audits by 40 to 70 percent on organic revenue over a 24-month window.
Internal linking discipline across food brand content
Internal linking discipline across food brand content moves authority from recipe pages toward hero SKU product pages and comparison guides. Every recipe links to the hero SKU it uses inline (once in the ingredient list, once in a bottom call-out card). Every ingredient comparison guide links to 3 to 6 recipes using the winning ingredient plus the hero SKU product page. Every sourcing story links to the 2 to 4 SKUs sourced from that specific farm or cooperative.
Anchor text strategy across recipe hubs
Anchor text on internal links varies across recipe hubs to avoid over-optimization patterns Google penalizes. Exact-match anchor (“single-origin Ethiopian coffee”) runs on 20 to 30 percent of internal links. Partial-match variations (“our Ethiopian roast”) run on 30 to 40 percent. Branded anchors (the SKU name) run on 20 to 30 percent. Generic anchors (“shop the coffee”) fill the remaining 10 to 20 percent. This ratio holds ranking without triggering the over-optimization penalty that shows up on brands that anchor-text-stuff every internal link with the same exact-match keyword. Cross-reference the linking layer on our food and beverage web design page.
Link equity from ingredient guides to SKU pages
Link equity from ingredient guides passes to SKU pages when the guide’s comparison table names the hero SKU in the winning column with a product card, and when the guide’s body links to 3 to 6 recipes that use the winning ingredient. This 3-hop path (guide to recipe to SKU) pushes authority from a high-traffic informational query down to a high-intent transactional page. According to Search Engine Land SEO coverage, informational content that internally links to transactional pages produces 2 to 4 times higher organic revenue than isolated content silos.
Wrapping up content marketing for food brands
Content marketing for food brands is the organic engine that turns a DTC snack, drink, or CPG storefront into a search-driven revenue channel. Recipe hub of 40 to 100 recipes. Ingredient comparison guides at 12 to 24 pieces. Sourcing story pages at 6 to 12 pieces. Buyer intent content at 8 to 16 pieces. Creator syndication calendar with 12 to 30 creators per quarter. Refresh cadence at 12 to 24 months by pillar. Reporting with organic sessions and organic revenue attribution.
If your DTC food brand is running paid social at 20,000 dollars monthly with a broken blog and zero recipe schema, professional content marketing for food brands pays for itself inside the first 90 days on organic traffic captured. Redefine Web ships content marketing inside our monthly retainer packages. Book a call and we will walk through the last three DTC food brands we built recipe hubs for, pillar by pillar.
Content marketing for food brands starts with a recipe hub because recipe queries account for 40 to 60 percent of high-intent search volume in the food category. Every hero SKU needs 4 to 12 recipes anchored to it, each targeting a specific occasion and audience.
Skip the recipe hub and the brand loses the search real estate that pulls DTC storefront traffic month over month at zero incremental paid cost. Recipe traffic converts at 2 to 4 percent because the shopper landed with usage intent, not passive discovery, which is why food brands win on recipes.
Recipe schema and Google rich result eligibility
Every recipe page ships schema.org Recipe markup including cookTime, prepTime, recipeIngredient, recipeInstructions, nutrition, and aggregateRating. Correctly marked-up recipes qualify for Google’s recipe rich result carousel that pulls 3 to 6 times higher click-through rate than a plain blue link. The schema layer takes 15 minutes per recipe to author and 30 minutes to validate in Google Search Console. Cross-reference the recipe search stack on our food and beverage SEO page.
Recipe hub structure that scales
The recipe hub structure runs 40 to 100 recipes at maturity, organized by hero SKU (4 to 12 recipes per SKU) plus occasion tags (breakfast, weeknight dinner, meal prep, brunch, holiday). Every recipe links back to the hero SKU product page with the SKU embedded in an inline card. The hub earns internal linking value from ingredient comparison guides and the sourcing story pages, which feeds recipe ranking on Google. According to Google Search Central recipe structured data guidance, complete Recipe schema markup is required for eligibility in the recipe carousel and the ingredient search filter.
Pillar structure for food brand content marketing
The pillar structure on content marketing for food brands runs 4 content pillars concurrently: recipe hub (40 to 100 recipes), ingredient comparison guides (12 to 24 guides), sourcing story pages (6 to 12 pages), and buyer intent content (where to buy, subscription vs. one-time, gift bundle guides). Every pillar covers a distinct search intent and every pillar links back to the hero SKU product pages.
Ingredient comparison guide format
Ingredient comparison guides run 1,800 to 3,200 words comparing 2 to 4 ingredient types on 6 to 10 attributes with a comparison table, real-world use case examples, and links to the hero SKU that uses the specific ingredient. Example: organic vs. conventional oats compares nutritional profile, sourcing chain, cost, environmental impact, and taste on a 6-column table. The brand’s SKU appears in the winning column with a product card. These guides rank 3 to 8 months after publication and pull steady-state organic traffic.
Sourcing story pages that build trust
Sourcing story pages name the specific farms, cooperatives, or suppliers the brand sources from, with photos of the farms, farmer quotes, and specific harvest windows. A coffee brand’s Ethiopian farm page ranks for “single-origin Ethiopian coffee” and “Yirgacheffe coffee origin” plus 40 long-tail variations. The sourcing page pulls trust-building traffic that converts at 4 to 6 percent because the shopper landed pattern-matching on transparency and named provenance. Every sourcing page includes farmer or cooperative quotes, harvest dates, and a link back to 3 to 5 hero SKU pages that source from the named supplier.
Vejrø hospitality content case study
Vejrø Resort, a Danish private-island destination with an on-site restaurant focused on organic, locally sourced cuisine, joined us with strong social engagement and no organic-search real estate. Guests found the resort on Instagram but never in Google search for terms like “private island resort Denmark,” “farm-to-table hospitality Denmark,” or “Vejrø restaurant.” The same organic-search gap shows up on DTC food brands running paid social at 20,000 dollars monthly with a broken blog and zero recipe schema.
We built the conversion-focused website with on-site and off-site SEO tuned to the travel-niche keyword clusters, competitor analysis against comparable boutique resorts, and mobile-first design prioritizing guest discovery. Every page carried the structured data qualifying it for Google’s rich results in the hospitality category. Every internal link pushed authority toward the direct-booking conversion path.
Three months later, Vejrø hit 10,000 plus organic visitors, ranked for 200 plus first-page keywords, and pulled a 2.2 percent booking conversion rate from organic traffic. The same pattern applies to content marketing for food brands: recipe schema, ingredient comparison guides, and sourcing story pages pull organic traffic at 20 to 40 percent conversion into hero SKU pages inside 6 months when the content quality matches search intent and every page carries the right structured data markup. Vejrø also proved out the reporting discipline: every monthly report named the exact page, the exact keyword cluster, and the exact search feature (rich result, sitelinks, image pack) driving the incremental organic revenue instead of hiding behind aggregate traffic charts.
Recipe cadence and content calendar for food brands
Recipe cadence on a working food brand content calendar ships 2 to 4 new recipes per week during the first 6 months and drops to 1 per week at maturity. Each recipe takes 4 to 6 hours to produce (write, test in the kitchen, photograph, schema author, publish). At 3 recipes per week, the brand hits 78 recipes inside 6 months plus a backlog of ingredient comparison and sourcing content queued behind the recipe production line.
| Content pillar | Target volume year 1 | Production cost per piece | Refresh cadence |
|---|---|---|---|
| Recipe hub | 40 to 100 recipes | $180 to $320 | Every 12 months |
| Ingredient comparison guides | 12 to 24 guides | $450 to $780 | Every 18 months |
| Sourcing story pages | 6 to 12 pages | $680 to $1,200 | Every 24 months |
| Buyer intent content | 8 to 16 pieces | $220 to $420 | Every 12 months |
Photography as a content calendar constraint
Photography is the actual constraint on recipe cadence, not writing. Every recipe needs 6 to 12 photos: hero shot, ingredient flat lay, prep in progress, plated result, storage, and step shots for the schema markup. A working food brand batches photography 8 recipes at a time to keep the cost per recipe under 200 dollars. Skip the batching and the per-recipe cost climbs to 400 to 600 dollars, which caps recipe cadence at 1 per week and slows organic ranking timeline by 6 months.
Seasonal content calendar planning
Seasonal content calendar planning maps recipes and comparison guides to the seasonal windows they need to rank in. A Christmas cookie recipe needs to publish in September to rank by early December. A Valentine’s chocolate guide needs to publish in November to rank by early February. A back-to-school lunchbox recipe needs to publish in June to rank by late August. The 60-to-90-day ranking curve dictates the calendar.
Creator syndication inside food brand content
Creator syndication on food brand content marketing amplifies the recipe hub through Instagram Reels, TikTok, and YouTube Shorts creators paid to post their own version of the brand’s hero recipes. The creator content pulls net-new audiences into the recipe hub through the creator’s Link in Bio or Amazon Storefront tag. The syndication calendar names 12 to 30 creators per quarter with specific recipes assigned to each.
One brand we picked up had a spreadsheet titled “creator outreach 2023” with 47 rows and 3 responses. All 3 responses were auto-replies. The spreadsheet named zero recipes and offered flat rates below 100 dollars per post. Nobody posts a 30-second video for 87 dollars flat. Nobody.
Creator content commercial terms that work
Working creator content commercial terms run 350 to 1,500 dollars flat per post plus a 12 to 25 percent commission on tagged sales across a 30-day window. The commission mechanic pulls creators into follow-up posts because the incremental revenue continues past the initial fee. Mid-tier creators (30k to 150k followers) hit the sweet spot for food brand content because their engagement rate typically runs 4 to 8 percent versus 0.8 to 1.6 percent on mega-creators.
Content brief structure for creator partnerships
The content brief structure for creator partnerships runs a single page: the SKU, the specific recipe or usage occasion, 3 required brand mentions, 3 restricted claims (no health claims on non-medical SKUs), the pricing angle, the affiliate link, and 3 example videos that hit the tone. The brief avoids over-scripting because over-scripted creator content underperforms native creator voice by 40 to 60 percent on engagement rate.
Buyer intent content for food brand blogs
Buyer intent content on food brand blogs covers 8 to 16 pieces targeting explicit purchase-decision queries: “where to buy [brand],” “[brand] subscription vs. one-time,” “best [category] for [use case],” and “[brand] gift bundle.” Every buyer intent piece runs 1,400 to 2,400 words with a comparison table, product cards, and a clear conversion path to the specific SKU that matches the query intent. Buyer intent content converts at 3 to 6 percent versus 1 to 2 percent on recipe content because the shopper landed already planning to buy, not exploring a usage occasion.
Where-to-buy content structure
Where-to-buy content structure covers online (DTC storefront, Amazon, Target.com, Whole Foods online), retail (specific chain locators with the store finder embedded), and international (customs limitations, retailer partners abroad). Every piece names specific retailers, links to the store locator, and includes an FAQ block covering shipping availability, subscription options, and gift card compatibility. Where-to-buy content ranks for branded discovery queries the DTC storefront otherwise loses to competitor affiliate reviews.
Subscription versus one-time comparison content
Subscription versus one-time comparison content converts subscription commitments at 3 to 6 percent because it addresses the price-sensitivity concern head-on with a specific math table. The piece covers the discount structure (15 percent lifetime), the skip-a-month mechanic, the pause-anytime rule, the cancellation policy, and the specific yearly savings for the brand’s average consumption cadence. Cross-reference the retention structure on our food and beverage marketing retainer page.
Content refresh cadence on food brand pillars
Content refresh cadence on food brand content pillars runs a rolling audit every 12 to 24 months by pillar. Recipes get refreshed every 12 months with new photography, updated schema, and any nutrition or ingredient adjustments. Ingredient comparison guides refresh every 18 months to update market data. Sourcing story pages refresh every 24 months to reflect farm partnership changes and new harvest angles. Buyer intent content refreshes every 12 months to update retailer availability and pricing.
Recipe refresh priority order
Recipe refresh priority runs by organic traffic rank. The top 20 recipes by monthly organic sessions get refreshed first (new photography, schema audit, related recipe internal links, updated nutrition). The next 40 get refreshed at 15 months. The remaining recipes get refreshed opportunistically when the ranking slips past position 15 in Google. Skipping the refresh cadence lets recipe rankings drift out of the top 3 inside 18 months as newer competitor recipes take the position.
Schema audit checklist per refresh
The schema audit checklist per refresh runs 8 items: Recipe schema completeness, aggregateRating count and accuracy, nutrition data accuracy, prepTime and cookTime match the recipe body, image URLs valid at CDN, related recipe internal links working, product card SKU URL live, and Google Search Console rich result eligibility validated. This checklist takes 20 minutes per recipe and prevents the schema drift that costs recipe rankings 20 to 40 positions quietly.
Reporting cadence for food brand content marketing
Reporting cadence on food brand content marketing runs a monthly executive report plus a quarterly business review. The monthly report ships in the first business week and covers organic sessions by pillar, top 10 ranking recipes with position trend, ingredient guide ranking movements, sourcing page performance, and organic-attributed DTC revenue. Every number carries a comparison to the prior month and a plain-language interpretation the founder reads in 7 minutes.
Metrics that matter for content marketing
Metrics that matter for food brand content marketing: organic sessions by pillar, recipe rich result impressions in Search Console, organic conversion rate to hero SKU pages, organic-attributed DTC revenue, and top 20 ranking positions by monthly organic sessions. Vanity metrics that do not matter: total pageviews without conversion context, average time on page without conversion attribution, and social share counts. The monthly report skips the vanity block entirely.
Quarterly business review structure
The quarterly business review runs 90 minutes with the founder, head of content, and SEO lead. Agenda: organic traffic trend by pillar, top 10 winning content pieces, top 10 losing content pieces (candidates for refresh or removal), competitive gap analysis against 5 named competitor brands, and next quarter’s content calendar with recipes and ingredient guides queued. According to Ahrefs content marketing research, brands running quarterly content audits outperform brands running annual audits by 40 to 70 percent on organic revenue over a 24-month window.
Internal linking discipline across food brand content
Internal linking discipline across food brand content moves authority from recipe pages toward hero SKU product pages and comparison guides. Every recipe links to the hero SKU it uses inline (once in the ingredient list, once in a bottom call-out card). Every ingredient comparison guide links to 3 to 6 recipes using the winning ingredient plus the hero SKU product page. Every sourcing story links to the 2 to 4 SKUs sourced from that specific farm or cooperative.
Anchor text strategy across recipe hubs
Anchor text on internal links varies across recipe hubs to avoid over-optimization patterns Google penalizes. Exact-match anchor (“single-origin Ethiopian coffee”) runs on 20 to 30 percent of internal links. Partial-match variations (“our Ethiopian roast”) run on 30 to 40 percent. Branded anchors (the SKU name) run on 20 to 30 percent. Generic anchors (“shop the coffee”) fill the remaining 10 to 20 percent. This ratio holds ranking without triggering the over-optimization penalty that shows up on brands that anchor-text-stuff every internal link with the same exact-match keyword. Cross-reference the linking layer on our food and beverage web design page.
Link equity from ingredient guides to SKU pages
Link equity from ingredient guides passes to SKU pages when the guide’s comparison table names the hero SKU in the winning column with a product card, and when the guide’s body links to 3 to 6 recipes that use the winning ingredient. This 3-hop path (guide to recipe to SKU) pushes authority from a high-traffic informational query down to a high-intent transactional page. According to Search Engine Land SEO coverage, informational content that internally links to transactional pages produces 2 to 4 times higher organic revenue than isolated content silos.
Wrapping up content marketing for food brands
Content marketing for food brands is the organic engine that turns a DTC snack, drink, or CPG storefront into a search-driven revenue channel. Recipe hub of 40 to 100 recipes. Ingredient comparison guides at 12 to 24 pieces. Sourcing story pages at 6 to 12 pieces. Buyer intent content at 8 to 16 pieces. Creator syndication calendar with 12 to 30 creators per quarter. Refresh cadence at 12 to 24 months by pillar. Reporting with organic sessions and organic revenue attribution.
If your DTC food brand is running paid social at 20,000 dollars monthly with a broken blog and zero recipe schema, professional content marketing for food brands pays for itself inside the first 90 days on organic traffic captured. Redefine Web ships content marketing inside our monthly retainer packages. Book a call and we will walk through the last three DTC food brands we built recipe hubs for, pillar by pillar.
Anchor text on internal links varies across recipe hubs to avoid over-optimization patterns Google penalizes. Exact-match anchor (“single-origin Ethiopian coffee”) runs on 20 to 30 percent of internal links. Partial-match variations (“our Ethiopian roast”) run on 30 to 40 percent. Branded anchors (the SKU name) run on 20 to 30 percent. Generic anchors (“shop the coffee”) fill the remaining 10 to 20 percent. This ratio holds ranking without triggering the over-optimization penalty that shows up on brands that anchor-text-stuff every internal link with the same exact-match keyword. Cross-reference the linking layer on our food and beverage web design page.
Link equity from ingredient guides to SKU pages
Link equity from ingredient guides passes to SKU pages when the guide’s comparison table names the hero SKU in the winning column with a product card, and when the guide’s body links to 3 to 6 recipes that use the winning ingredient. This 3-hop path (guide to recipe to SKU) pushes authority from a high-traffic informational query down to a high-intent transactional page. According to Search Engine Land SEO coverage, informational content that internally links to transactional pages produces 2 to 4 times higher organic revenue than isolated content silos.
Wrapping up content marketing for food brands
Content marketing for food brands is the organic engine that turns a DTC snack, drink, or CPG storefront into a search-driven revenue channel. Recipe hub of 40 to 100 recipes. Ingredient comparison guides at 12 to 24 pieces. Sourcing story pages at 6 to 12 pieces. Buyer intent content at 8 to 16 pieces. Creator syndication calendar with 12 to 30 creators per quarter. Refresh cadence at 12 to 24 months by pillar. Reporting with organic sessions and organic revenue attribution.
If your DTC food brand is running paid social at 20,000 dollars monthly with a broken blog and zero recipe schema, professional content marketing for food brands pays for itself inside the first 90 days on organic traffic captured. Redefine Web ships content marketing inside our monthly retainer packages. Book a call and we will walk through the last three DTC food brands we built recipe hubs for, pillar by pillar.
Internal linking discipline across food brand content moves authority from recipe pages toward hero SKU product pages and comparison guides. Every recipe links to the hero SKU it uses inline (once in the ingredient list, once in a bottom call-out card). Every ingredient comparison guide links to 3 to 6 recipes using the winning ingredient plus the hero SKU product page. Every sourcing story links to the 2 to 4 SKUs sourced from that specific farm or cooperative.
Anchor text strategy across recipe hubs
Anchor text on internal links varies across recipe hubs to avoid over-optimization patterns Google penalizes. Exact-match anchor (“single-origin Ethiopian coffee”) runs on 20 to 30 percent of internal links. Partial-match variations (“our Ethiopian roast”) run on 30 to 40 percent. Branded anchors (the SKU name) run on 20 to 30 percent. Generic anchors (“shop the coffee”) fill the remaining 10 to 20 percent. This ratio holds ranking without triggering the over-optimization penalty that shows up on brands that anchor-text-stuff every internal link with the same exact-match keyword. Cross-reference the linking layer on our food and beverage web design page.
Link equity from ingredient guides to SKU pages
Link equity from ingredient guides passes to SKU pages when the guide’s comparison table names the hero SKU in the winning column with a product card, and when the guide’s body links to 3 to 6 recipes that use the winning ingredient. This 3-hop path (guide to recipe to SKU) pushes authority from a high-traffic informational query down to a high-intent transactional page. According to Search Engine Land SEO coverage, informational content that internally links to transactional pages produces 2 to 4 times higher organic revenue than isolated content silos.
Wrapping up content marketing for food brands
Content marketing for food brands is the organic engine that turns a DTC snack, drink, or CPG storefront into a search-driven revenue channel. Recipe hub of 40 to 100 recipes. Ingredient comparison guides at 12 to 24 pieces. Sourcing story pages at 6 to 12 pieces. Buyer intent content at 8 to 16 pieces. Creator syndication calendar with 12 to 30 creators per quarter. Refresh cadence at 12 to 24 months by pillar. Reporting with organic sessions and organic revenue attribution.
If your DTC food brand is running paid social at 20,000 dollars monthly with a broken blog and zero recipe schema, professional content marketing for food brands pays for itself inside the first 90 days on organic traffic captured. Redefine Web ships content marketing inside our monthly retainer packages. Book a call and we will walk through the last three DTC food brands we built recipe hubs for, pillar by pillar.
Content marketing for food brands starts with a recipe hub because recipe queries account for 40 to 60 percent of high-intent search volume in the food category. Every hero SKU needs 4 to 12 recipes anchored to it, each targeting a specific occasion and audience.
Skip the recipe hub and the brand loses the search real estate that pulls DTC storefront traffic month over month at zero incremental paid cost. Recipe traffic converts at 2 to 4 percent because the shopper landed with usage intent, not passive discovery, which is why food brands win on recipes.
Recipe schema and Google rich result eligibility
Every recipe page ships schema.org Recipe markup including cookTime, prepTime, recipeIngredient, recipeInstructions, nutrition, and aggregateRating. Correctly marked-up recipes qualify for Google’s recipe rich result carousel that pulls 3 to 6 times higher click-through rate than a plain blue link. The schema layer takes 15 minutes per recipe to author and 30 minutes to validate in Google Search Console. Cross-reference the recipe search stack on our food and beverage SEO page.
Recipe hub structure that scales
The recipe hub structure runs 40 to 100 recipes at maturity, organized by hero SKU (4 to 12 recipes per SKU) plus occasion tags (breakfast, weeknight dinner, meal prep, brunch, holiday). Every recipe links back to the hero SKU product page with the SKU embedded in an inline card. The hub earns internal linking value from ingredient comparison guides and the sourcing story pages, which feeds recipe ranking on Google. According to Google Search Central recipe structured data guidance, complete Recipe schema markup is required for eligibility in the recipe carousel and the ingredient search filter.
Pillar structure for food brand content marketing
The pillar structure on content marketing for food brands runs 4 content pillars concurrently: recipe hub (40 to 100 recipes), ingredient comparison guides (12 to 24 guides), sourcing story pages (6 to 12 pages), and buyer intent content (where to buy, subscription vs. one-time, gift bundle guides). Every pillar covers a distinct search intent and every pillar links back to the hero SKU product pages.
Ingredient comparison guide format
Ingredient comparison guides run 1,800 to 3,200 words comparing 2 to 4 ingredient types on 6 to 10 attributes with a comparison table, real-world use case examples, and links to the hero SKU that uses the specific ingredient. Example: organic vs. conventional oats compares nutritional profile, sourcing chain, cost, environmental impact, and taste on a 6-column table. The brand’s SKU appears in the winning column with a product card. These guides rank 3 to 8 months after publication and pull steady-state organic traffic.
Sourcing story pages that build trust
Sourcing story pages name the specific farms, cooperatives, or suppliers the brand sources from, with photos of the farms, farmer quotes, and specific harvest windows. A coffee brand’s Ethiopian farm page ranks for “single-origin Ethiopian coffee” and “Yirgacheffe coffee origin” plus 40 long-tail variations. The sourcing page pulls trust-building traffic that converts at 4 to 6 percent because the shopper landed pattern-matching on transparency and named provenance. Every sourcing page includes farmer or cooperative quotes, harvest dates, and a link back to 3 to 5 hero SKU pages that source from the named supplier.
Vejrø hospitality content case study
Vejrø Resort, a Danish private-island destination with an on-site restaurant focused on organic, locally sourced cuisine, joined us with strong social engagement and no organic-search real estate. Guests found the resort on Instagram but never in Google search for terms like “private island resort Denmark,” “farm-to-table hospitality Denmark,” or “Vejrø restaurant.” The same organic-search gap shows up on DTC food brands running paid social at 20,000 dollars monthly with a broken blog and zero recipe schema.
We built the conversion-focused website with on-site and off-site SEO tuned to the travel-niche keyword clusters, competitor analysis against comparable boutique resorts, and mobile-first design prioritizing guest discovery. Every page carried the structured data qualifying it for Google’s rich results in the hospitality category. Every internal link pushed authority toward the direct-booking conversion path.
Three months later, Vejrø hit 10,000 plus organic visitors, ranked for 200 plus first-page keywords, and pulled a 2.2 percent booking conversion rate from organic traffic. The same pattern applies to content marketing for food brands: recipe schema, ingredient comparison guides, and sourcing story pages pull organic traffic at 20 to 40 percent conversion into hero SKU pages inside 6 months when the content quality matches search intent and every page carries the right structured data markup. Vejrø also proved out the reporting discipline: every monthly report named the exact page, the exact keyword cluster, and the exact search feature (rich result, sitelinks, image pack) driving the incremental organic revenue instead of hiding behind aggregate traffic charts.
Recipe cadence and content calendar for food brands
Recipe cadence on a working food brand content calendar ships 2 to 4 new recipes per week during the first 6 months and drops to 1 per week at maturity. Each recipe takes 4 to 6 hours to produce (write, test in the kitchen, photograph, schema author, publish). At 3 recipes per week, the brand hits 78 recipes inside 6 months plus a backlog of ingredient comparison and sourcing content queued behind the recipe production line.
| Content pillar | Target volume year 1 | Production cost per piece | Refresh cadence |
|---|---|---|---|
| Recipe hub | 40 to 100 recipes | $180 to $320 | Every 12 months |
| Ingredient comparison guides | 12 to 24 guides | $450 to $780 | Every 18 months |
| Sourcing story pages | 6 to 12 pages | $680 to $1,200 | Every 24 months |
| Buyer intent content | 8 to 16 pieces | $220 to $420 | Every 12 months |
Photography as a content calendar constraint
Photography is the actual constraint on recipe cadence, not writing. Every recipe needs 6 to 12 photos: hero shot, ingredient flat lay, prep in progress, plated result, storage, and step shots for the schema markup. A working food brand batches photography 8 recipes at a time to keep the cost per recipe under 200 dollars. Skip the batching and the per-recipe cost climbs to 400 to 600 dollars, which caps recipe cadence at 1 per week and slows organic ranking timeline by 6 months.
Seasonal content calendar planning
Seasonal content calendar planning maps recipes and comparison guides to the seasonal windows they need to rank in. A Christmas cookie recipe needs to publish in September to rank by early December. A Valentine’s chocolate guide needs to publish in November to rank by early February. A back-to-school lunchbox recipe needs to publish in June to rank by late August. The 60-to-90-day ranking curve dictates the calendar.
Creator syndication inside food brand content
Creator syndication on food brand content marketing amplifies the recipe hub through Instagram Reels, TikTok, and YouTube Shorts creators paid to post their own version of the brand’s hero recipes. The creator content pulls net-new audiences into the recipe hub through the creator’s Link in Bio or Amazon Storefront tag. The syndication calendar names 12 to 30 creators per quarter with specific recipes assigned to each.
One brand we picked up had a spreadsheet titled “creator outreach 2023” with 47 rows and 3 responses. All 3 responses were auto-replies. The spreadsheet named zero recipes and offered flat rates below 100 dollars per post. Nobody posts a 30-second video for 87 dollars flat. Nobody.
Creator content commercial terms that work
Working creator content commercial terms run 350 to 1,500 dollars flat per post plus a 12 to 25 percent commission on tagged sales across a 30-day window. The commission mechanic pulls creators into follow-up posts because the incremental revenue continues past the initial fee. Mid-tier creators (30k to 150k followers) hit the sweet spot for food brand content because their engagement rate typically runs 4 to 8 percent versus 0.8 to 1.6 percent on mega-creators.
Content brief structure for creator partnerships
The content brief structure for creator partnerships runs a single page: the SKU, the specific recipe or usage occasion, 3 required brand mentions, 3 restricted claims (no health claims on non-medical SKUs), the pricing angle, the affiliate link, and 3 example videos that hit the tone. The brief avoids over-scripting because over-scripted creator content underperforms native creator voice by 40 to 60 percent on engagement rate.
Buyer intent content for food brand blogs
Buyer intent content on food brand blogs covers 8 to 16 pieces targeting explicit purchase-decision queries: “where to buy [brand],” “[brand] subscription vs. one-time,” “best [category] for [use case],” and “[brand] gift bundle.” Every buyer intent piece runs 1,400 to 2,400 words with a comparison table, product cards, and a clear conversion path to the specific SKU that matches the query intent. Buyer intent content converts at 3 to 6 percent versus 1 to 2 percent on recipe content because the shopper landed already planning to buy, not exploring a usage occasion.
Where-to-buy content structure
Where-to-buy content structure covers online (DTC storefront, Amazon, Target.com, Whole Foods online), retail (specific chain locators with the store finder embedded), and international (customs limitations, retailer partners abroad). Every piece names specific retailers, links to the store locator, and includes an FAQ block covering shipping availability, subscription options, and gift card compatibility. Where-to-buy content ranks for branded discovery queries the DTC storefront otherwise loses to competitor affiliate reviews.
Subscription versus one-time comparison content
Subscription versus one-time comparison content converts subscription commitments at 3 to 6 percent because it addresses the price-sensitivity concern head-on with a specific math table. The piece covers the discount structure (15 percent lifetime), the skip-a-month mechanic, the pause-anytime rule, the cancellation policy, and the specific yearly savings for the brand’s average consumption cadence. Cross-reference the retention structure on our food and beverage marketing retainer page.
Content refresh cadence on food brand pillars
Content refresh cadence on food brand content pillars runs a rolling audit every 12 to 24 months by pillar. Recipes get refreshed every 12 months with new photography, updated schema, and any nutrition or ingredient adjustments. Ingredient comparison guides refresh every 18 months to update market data. Sourcing story pages refresh every 24 months to reflect farm partnership changes and new harvest angles. Buyer intent content refreshes every 12 months to update retailer availability and pricing.
Recipe refresh priority order
Recipe refresh priority runs by organic traffic rank. The top 20 recipes by monthly organic sessions get refreshed first (new photography, schema audit, related recipe internal links, updated nutrition). The next 40 get refreshed at 15 months. The remaining recipes get refreshed opportunistically when the ranking slips past position 15 in Google. Skipping the refresh cadence lets recipe rankings drift out of the top 3 inside 18 months as newer competitor recipes take the position.
Schema audit checklist per refresh
The schema audit checklist per refresh runs 8 items: Recipe schema completeness, aggregateRating count and accuracy, nutrition data accuracy, prepTime and cookTime match the recipe body, image URLs valid at CDN, related recipe internal links working, product card SKU URL live, and Google Search Console rich result eligibility validated. This checklist takes 20 minutes per recipe and prevents the schema drift that costs recipe rankings 20 to 40 positions quietly.
Reporting cadence for food brand content marketing
Reporting cadence on food brand content marketing runs a monthly executive report plus a quarterly business review. The monthly report ships in the first business week and covers organic sessions by pillar, top 10 ranking recipes with position trend, ingredient guide ranking movements, sourcing page performance, and organic-attributed DTC revenue. Every number carries a comparison to the prior month and a plain-language interpretation the founder reads in 7 minutes.
Metrics that matter for content marketing
Metrics that matter for food brand content marketing: organic sessions by pillar, recipe rich result impressions in Search Console, organic conversion rate to hero SKU pages, organic-attributed DTC revenue, and top 20 ranking positions by monthly organic sessions. Vanity metrics that do not matter: total pageviews without conversion context, average time on page without conversion attribution, and social share counts. The monthly report skips the vanity block entirely.
Quarterly business review structure
The quarterly business review runs 90 minutes with the founder, head of content, and SEO lead. Agenda: organic traffic trend by pillar, top 10 winning content pieces, top 10 losing content pieces (candidates for refresh or removal), competitive gap analysis against 5 named competitor brands, and next quarter’s content calendar with recipes and ingredient guides queued. According to Ahrefs content marketing research, brands running quarterly content audits outperform brands running annual audits by 40 to 70 percent on organic revenue over a 24-month window.
Internal linking discipline across food brand content
Internal linking discipline across food brand content moves authority from recipe pages toward hero SKU product pages and comparison guides. Every recipe links to the hero SKU it uses inline (once in the ingredient list, once in a bottom call-out card). Every ingredient comparison guide links to 3 to 6 recipes using the winning ingredient plus the hero SKU product page. Every sourcing story links to the 2 to 4 SKUs sourced from that specific farm or cooperative.
Anchor text strategy across recipe hubs
Anchor text on internal links varies across recipe hubs to avoid over-optimization patterns Google penalizes. Exact-match anchor (“single-origin Ethiopian coffee”) runs on 20 to 30 percent of internal links. Partial-match variations (“our Ethiopian roast”) run on 30 to 40 percent. Branded anchors (the SKU name) run on 20 to 30 percent. Generic anchors (“shop the coffee”) fill the remaining 10 to 20 percent. This ratio holds ranking without triggering the over-optimization penalty that shows up on brands that anchor-text-stuff every internal link with the same exact-match keyword. Cross-reference the linking layer on our food and beverage web design page.
Link equity from ingredient guides to SKU pages
Link equity from ingredient guides passes to SKU pages when the guide’s comparison table names the hero SKU in the winning column with a product card, and when the guide’s body links to 3 to 6 recipes that use the winning ingredient. This 3-hop path (guide to recipe to SKU) pushes authority from a high-traffic informational query down to a high-intent transactional page. According to Search Engine Land SEO coverage, informational content that internally links to transactional pages produces 2 to 4 times higher organic revenue than isolated content silos.
Wrapping up content marketing for food brands
Content marketing for food brands is the organic engine that turns a DTC snack, drink, or CPG storefront into a search-driven revenue channel. Recipe hub of 40 to 100 recipes. Ingredient comparison guides at 12 to 24 pieces. Sourcing story pages at 6 to 12 pieces. Buyer intent content at 8 to 16 pieces. Creator syndication calendar with 12 to 30 creators per quarter. Refresh cadence at 12 to 24 months by pillar. Reporting with organic sessions and organic revenue attribution.
If your DTC food brand is running paid social at 20,000 dollars monthly with a broken blog and zero recipe schema, professional content marketing for food brands pays for itself inside the first 90 days on organic traffic captured. Redefine Web ships content marketing inside our monthly retainer packages. Book a call and we will walk through the last three DTC food brands we built recipe hubs for, pillar by pillar.
Content marketing for food brands starts with a recipe hub because recipe queries account for 40 to 60 percent of high-intent search volume in the food category. Every hero SKU needs 4 to 12 recipes anchored to it, each targeting a specific occasion and audience.
Skip the recipe hub and the brand loses the search real estate that pulls DTC storefront traffic month over month at zero incremental paid cost. Recipe traffic converts at 2 to 4 percent because the shopper landed with usage intent, not passive discovery, which is why food brands win on recipes.
Recipe schema and Google rich result eligibility
Every recipe page ships schema.org Recipe markup including cookTime, prepTime, recipeIngredient, recipeInstructions, nutrition, and aggregateRating. Correctly marked-up recipes qualify for Google’s recipe rich result carousel that pulls 3 to 6 times higher click-through rate than a plain blue link. The schema layer takes 15 minutes per recipe to author and 30 minutes to validate in Google Search Console. Cross-reference the recipe search stack on our food and beverage SEO page.
Recipe hub structure that scales
The recipe hub structure runs 40 to 100 recipes at maturity, organized by hero SKU (4 to 12 recipes per SKU) plus occasion tags (breakfast, weeknight dinner, meal prep, brunch, holiday). Every recipe links back to the hero SKU product page with the SKU embedded in an inline card. The hub earns internal linking value from ingredient comparison guides and the sourcing story pages, which feeds recipe ranking on Google. According to Google Search Central recipe structured data guidance, complete Recipe schema markup is required for eligibility in the recipe carousel and the ingredient search filter.
Pillar structure for food brand content marketing
The pillar structure on content marketing for food brands runs 4 content pillars concurrently: recipe hub (40 to 100 recipes), ingredient comparison guides (12 to 24 guides), sourcing story pages (6 to 12 pages), and buyer intent content (where to buy, subscription vs. one-time, gift bundle guides). Every pillar covers a distinct search intent and every pillar links back to the hero SKU product pages.
Ingredient comparison guide format
Ingredient comparison guides run 1,800 to 3,200 words comparing 2 to 4 ingredient types on 6 to 10 attributes with a comparison table, real-world use case examples, and links to the hero SKU that uses the specific ingredient. Example: organic vs. conventional oats compares nutritional profile, sourcing chain, cost, environmental impact, and taste on a 6-column table. The brand’s SKU appears in the winning column with a product card. These guides rank 3 to 8 months after publication and pull steady-state organic traffic.
Sourcing story pages that build trust
Sourcing story pages name the specific farms, cooperatives, or suppliers the brand sources from, with photos of the farms, farmer quotes, and specific harvest windows. A coffee brand’s Ethiopian farm page ranks for “single-origin Ethiopian coffee” and “Yirgacheffe coffee origin” plus 40 long-tail variations. The sourcing page pulls trust-building traffic that converts at 4 to 6 percent because the shopper landed pattern-matching on transparency and named provenance. Every sourcing page includes farmer or cooperative quotes, harvest dates, and a link back to 3 to 5 hero SKU pages that source from the named supplier.
Vejrø hospitality content case study
Vejrø Resort, a Danish private-island destination with an on-site restaurant focused on organic, locally sourced cuisine, joined us with strong social engagement and no organic-search real estate. Guests found the resort on Instagram but never in Google search for terms like “private island resort Denmark,” “farm-to-table hospitality Denmark,” or “Vejrø restaurant.” The same organic-search gap shows up on DTC food brands running paid social at 20,000 dollars monthly with a broken blog and zero recipe schema.
We built the conversion-focused website with on-site and off-site SEO tuned to the travel-niche keyword clusters, competitor analysis against comparable boutique resorts, and mobile-first design prioritizing guest discovery. Every page carried the structured data qualifying it for Google’s rich results in the hospitality category. Every internal link pushed authority toward the direct-booking conversion path.
Three months later, Vejrø hit 10,000 plus organic visitors, ranked for 200 plus first-page keywords, and pulled a 2.2 percent booking conversion rate from organic traffic. The same pattern applies to content marketing for food brands: recipe schema, ingredient comparison guides, and sourcing story pages pull organic traffic at 20 to 40 percent conversion into hero SKU pages inside 6 months when the content quality matches search intent and every page carries the right structured data markup. Vejrø also proved out the reporting discipline: every monthly report named the exact page, the exact keyword cluster, and the exact search feature (rich result, sitelinks, image pack) driving the incremental organic revenue instead of hiding behind aggregate traffic charts.
Recipe cadence and content calendar for food brands
Recipe cadence on a working food brand content calendar ships 2 to 4 new recipes per week during the first 6 months and drops to 1 per week at maturity. Each recipe takes 4 to 6 hours to produce (write, test in the kitchen, photograph, schema author, publish). At 3 recipes per week, the brand hits 78 recipes inside 6 months plus a backlog of ingredient comparison and sourcing content queued behind the recipe production line.
| Content pillar | Target volume year 1 | Production cost per piece | Refresh cadence |
|---|---|---|---|
| Recipe hub | 40 to 100 recipes | $180 to $320 | Every 12 months |
| Ingredient comparison guides | 12 to 24 guides | $450 to $780 | Every 18 months |
| Sourcing story pages | 6 to 12 pages | $680 to $1,200 | Every 24 months |
| Buyer intent content | 8 to 16 pieces | $220 to $420 | Every 12 months |
Photography as a content calendar constraint
Photography is the actual constraint on recipe cadence, not writing. Every recipe needs 6 to 12 photos: hero shot, ingredient flat lay, prep in progress, plated result, storage, and step shots for the schema markup. A working food brand batches photography 8 recipes at a time to keep the cost per recipe under 200 dollars. Skip the batching and the per-recipe cost climbs to 400 to 600 dollars, which caps recipe cadence at 1 per week and slows organic ranking timeline by 6 months.
Seasonal content calendar planning
Seasonal content calendar planning maps recipes and comparison guides to the seasonal windows they need to rank in. A Christmas cookie recipe needs to publish in September to rank by early December. A Valentine’s chocolate guide needs to publish in November to rank by early February. A back-to-school lunchbox recipe needs to publish in June to rank by late August. The 60-to-90-day ranking curve dictates the calendar.
Creator syndication inside food brand content
Creator syndication on food brand content marketing amplifies the recipe hub through Instagram Reels, TikTok, and YouTube Shorts creators paid to post their own version of the brand’s hero recipes. The creator content pulls net-new audiences into the recipe hub through the creator’s Link in Bio or Amazon Storefront tag. The syndication calendar names 12 to 30 creators per quarter with specific recipes assigned to each.
One brand we picked up had a spreadsheet titled “creator outreach 2023” with 47 rows and 3 responses. All 3 responses were auto-replies. The spreadsheet named zero recipes and offered flat rates below 100 dollars per post. Nobody posts a 30-second video for 87 dollars flat. Nobody.
Creator content commercial terms that work
Working creator content commercial terms run 350 to 1,500 dollars flat per post plus a 12 to 25 percent commission on tagged sales across a 30-day window. The commission mechanic pulls creators into follow-up posts because the incremental revenue continues past the initial fee. Mid-tier creators (30k to 150k followers) hit the sweet spot for food brand content because their engagement rate typically runs 4 to 8 percent versus 0.8 to 1.6 percent on mega-creators.
Content brief structure for creator partnerships
The content brief structure for creator partnerships runs a single page: the SKU, the specific recipe or usage occasion, 3 required brand mentions, 3 restricted claims (no health claims on non-medical SKUs), the pricing angle, the affiliate link, and 3 example videos that hit the tone. The brief avoids over-scripting because over-scripted creator content underperforms native creator voice by 40 to 60 percent on engagement rate.
Buyer intent content for food brand blogs
Buyer intent content on food brand blogs covers 8 to 16 pieces targeting explicit purchase-decision queries: “where to buy [brand],” “[brand] subscription vs. one-time,” “best [category] for [use case],” and “[brand] gift bundle.” Every buyer intent piece runs 1,400 to 2,400 words with a comparison table, product cards, and a clear conversion path to the specific SKU that matches the query intent. Buyer intent content converts at 3 to 6 percent versus 1 to 2 percent on recipe content because the shopper landed already planning to buy, not exploring a usage occasion.
Where-to-buy content structure
Where-to-buy content structure covers online (DTC storefront, Amazon, Target.com, Whole Foods online), retail (specific chain locators with the store finder embedded), and international (customs limitations, retailer partners abroad). Every piece names specific retailers, links to the store locator, and includes an FAQ block covering shipping availability, subscription options, and gift card compatibility. Where-to-buy content ranks for branded discovery queries the DTC storefront otherwise loses to competitor affiliate reviews.
Subscription versus one-time comparison content
Subscription versus one-time comparison content converts subscription commitments at 3 to 6 percent because it addresses the price-sensitivity concern head-on with a specific math table. The piece covers the discount structure (15 percent lifetime), the skip-a-month mechanic, the pause-anytime rule, the cancellation policy, and the specific yearly savings for the brand’s average consumption cadence. Cross-reference the retention structure on our food and beverage marketing retainer page.
Content refresh cadence on food brand pillars
Content refresh cadence on food brand content pillars runs a rolling audit every 12 to 24 months by pillar. Recipes get refreshed every 12 months with new photography, updated schema, and any nutrition or ingredient adjustments. Ingredient comparison guides refresh every 18 months to update market data. Sourcing story pages refresh every 24 months to reflect farm partnership changes and new harvest angles. Buyer intent content refreshes every 12 months to update retailer availability and pricing.
Recipe refresh priority order
Recipe refresh priority runs by organic traffic rank. The top 20 recipes by monthly organic sessions get refreshed first (new photography, schema audit, related recipe internal links, updated nutrition). The next 40 get refreshed at 15 months. The remaining recipes get refreshed opportunistically when the ranking slips past position 15 in Google. Skipping the refresh cadence lets recipe rankings drift out of the top 3 inside 18 months as newer competitor recipes take the position.
Schema audit checklist per refresh
The schema audit checklist per refresh runs 8 items: Recipe schema completeness, aggregateRating count and accuracy, nutrition data accuracy, prepTime and cookTime match the recipe body, image URLs valid at CDN, related recipe internal links working, product card SKU URL live, and Google Search Console rich result eligibility validated. This checklist takes 20 minutes per recipe and prevents the schema drift that costs recipe rankings 20 to 40 positions quietly.
Reporting cadence for food brand content marketing
Reporting cadence on food brand content marketing runs a monthly executive report plus a quarterly business review. The monthly report ships in the first business week and covers organic sessions by pillar, top 10 ranking recipes with position trend, ingredient guide ranking movements, sourcing page performance, and organic-attributed DTC revenue. Every number carries a comparison to the prior month and a plain-language interpretation the founder reads in 7 minutes.
Metrics that matter for content marketing
Metrics that matter for food brand content marketing: organic sessions by pillar, recipe rich result impressions in Search Console, organic conversion rate to hero SKU pages, organic-attributed DTC revenue, and top 20 ranking positions by monthly organic sessions. Vanity metrics that do not matter: total pageviews without conversion context, average time on page without conversion attribution, and social share counts. The monthly report skips the vanity block entirely.
Quarterly business review structure
The quarterly business review runs 90 minutes with the founder, head of content, and SEO lead. Agenda: organic traffic trend by pillar, top 10 winning content pieces, top 10 losing content pieces (candidates for refresh or removal), competitive gap analysis against 5 named competitor brands, and next quarter’s content calendar with recipes and ingredient guides queued. According to Ahrefs content marketing research, brands running quarterly content audits outperform brands running annual audits by 40 to 70 percent on organic revenue over a 24-month window.
Internal linking discipline across food brand content
Internal linking discipline across food brand content moves authority from recipe pages toward hero SKU product pages and comparison guides. Every recipe links to the hero SKU it uses inline (once in the ingredient list, once in a bottom call-out card). Every ingredient comparison guide links to 3 to 6 recipes using the winning ingredient plus the hero SKU product page. Every sourcing story links to the 2 to 4 SKUs sourced from that specific farm or cooperative.
Anchor text strategy across recipe hubs
Anchor text on internal links varies across recipe hubs to avoid over-optimization patterns Google penalizes. Exact-match anchor (“single-origin Ethiopian coffee”) runs on 20 to 30 percent of internal links. Partial-match variations (“our Ethiopian roast”) run on 30 to 40 percent. Branded anchors (the SKU name) run on 20 to 30 percent. Generic anchors (“shop the coffee”) fill the remaining 10 to 20 percent. This ratio holds ranking without triggering the over-optimization penalty that shows up on brands that anchor-text-stuff every internal link with the same exact-match keyword. Cross-reference the linking layer on our food and beverage web design page.
Link equity from ingredient guides to SKU pages
Link equity from ingredient guides passes to SKU pages when the guide’s comparison table names the hero SKU in the winning column with a product card, and when the guide’s body links to 3 to 6 recipes that use the winning ingredient. This 3-hop path (guide to recipe to SKU) pushes authority from a high-traffic informational query down to a high-intent transactional page. According to Search Engine Land SEO coverage, informational content that internally links to transactional pages produces 2 to 4 times higher organic revenue than isolated content silos.
Wrapping up content marketing for food brands
Content marketing for food brands is the organic engine that turns a DTC snack, drink, or CPG storefront into a search-driven revenue channel. Recipe hub of 40 to 100 recipes. Ingredient comparison guides at 12 to 24 pieces. Sourcing story pages at 6 to 12 pieces. Buyer intent content at 8 to 16 pieces. Creator syndication calendar with 12 to 30 creators per quarter. Refresh cadence at 12 to 24 months by pillar. Reporting with organic sessions and organic revenue attribution.
If your DTC food brand is running paid social at 20,000 dollars monthly with a broken blog and zero recipe schema, professional content marketing for food brands pays for itself inside the first 90 days on organic traffic captured. Redefine Web ships content marketing inside our monthly retainer packages. Book a call and we will walk through the last three DTC food brands we built recipe hubs for, pillar by pillar.
Content marketing for food brands starts with a recipe hub because recipe queries account for 40 to 60 percent of high-intent search volume in the food category. Every hero SKU needs 4 to 12 recipes anchored to it, each targeting a specific occasion and audience.
Skip the recipe hub and the brand loses the search real estate that pulls DTC storefront traffic month over month at zero incremental paid cost. Recipe traffic converts at 2 to 4 percent because the shopper landed with usage intent, not passive discovery, which is why food brands win on recipes.
Recipe schema and Google rich result eligibility
Every recipe page ships schema.org Recipe markup including cookTime, prepTime, recipeIngredient, recipeInstructions, nutrition, and aggregateRating. Correctly marked-up recipes qualify for Google’s recipe rich result carousel that pulls 3 to 6 times higher click-through rate than a plain blue link. The schema layer takes 15 minutes per recipe to author and 30 minutes to validate in Google Search Console. Cross-reference the recipe search stack on our food and beverage SEO page.
Recipe hub structure that scales
The recipe hub structure runs 40 to 100 recipes at maturity, organized by hero SKU (4 to 12 recipes per SKU) plus occasion tags (breakfast, weeknight dinner, meal prep, brunch, holiday). Every recipe links back to the hero SKU product page with the SKU embedded in an inline card. The hub earns internal linking value from ingredient comparison guides and the sourcing story pages, which feeds recipe ranking on Google. According to Google Search Central recipe structured data guidance, complete Recipe schema markup is required for eligibility in the recipe carousel and the ingredient search filter.
Pillar structure for food brand content marketing
The pillar structure on content marketing for food brands runs 4 content pillars concurrently: recipe hub (40 to 100 recipes), ingredient comparison guides (12 to 24 guides), sourcing story pages (6 to 12 pages), and buyer intent content (where to buy, subscription vs. one-time, gift bundle guides). Every pillar covers a distinct search intent and every pillar links back to the hero SKU product pages.
Ingredient comparison guide format
Ingredient comparison guides run 1,800 to 3,200 words comparing 2 to 4 ingredient types on 6 to 10 attributes with a comparison table, real-world use case examples, and links to the hero SKU that uses the specific ingredient. Example: organic vs. conventional oats compares nutritional profile, sourcing chain, cost, environmental impact, and taste on a 6-column table. The brand’s SKU appears in the winning column with a product card. These guides rank 3 to 8 months after publication and pull steady-state organic traffic.
Sourcing story pages that build trust
Sourcing story pages name the specific farms, cooperatives, or suppliers the brand sources from, with photos of the farms, farmer quotes, and specific harvest windows. A coffee brand’s Ethiopian farm page ranks for “single-origin Ethiopian coffee” and “Yirgacheffe coffee origin” plus 40 long-tail variations. The sourcing page pulls trust-building traffic that converts at 4 to 6 percent because the shopper landed pattern-matching on transparency and named provenance. Every sourcing page includes farmer or cooperative quotes, harvest dates, and a link back to 3 to 5 hero SKU pages that source from the named supplier.
Vejrø hospitality content case study
Vejrø Resort, a Danish private-island destination with an on-site restaurant focused on organic, locally sourced cuisine, joined us with strong social engagement and no organic-search real estate. Guests found the resort on Instagram but never in Google search for terms like “private island resort Denmark,” “farm-to-table hospitality Denmark,” or “Vejrø restaurant.” The same organic-search gap shows up on DTC food brands running paid social at 20,000 dollars monthly with a broken blog and zero recipe schema.
We built the conversion-focused website with on-site and off-site SEO tuned to the travel-niche keyword clusters, competitor analysis against comparable boutique resorts, and mobile-first design prioritizing guest discovery. Every page carried the structured data qualifying it for Google’s rich results in the hospitality category. Every internal link pushed authority toward the direct-booking conversion path.
Three months later, Vejrø hit 10,000 plus organic visitors, ranked for 200 plus first-page keywords, and pulled a 2.2 percent booking conversion rate from organic traffic. The same pattern applies to content marketing for food brands: recipe schema, ingredient comparison guides, and sourcing story pages pull organic traffic at 20 to 40 percent conversion into hero SKU pages inside 6 months when the content quality matches search intent and every page carries the right structured data markup. Vejrø also proved out the reporting discipline: every monthly report named the exact page, the exact keyword cluster, and the exact search feature (rich result, sitelinks, image pack) driving the incremental organic revenue instead of hiding behind aggregate traffic charts.
Recipe cadence and content calendar for food brands
Recipe cadence on a working food brand content calendar ships 2 to 4 new recipes per week during the first 6 months and drops to 1 per week at maturity. Each recipe takes 4 to 6 hours to produce (write, test in the kitchen, photograph, schema author, publish). At 3 recipes per week, the brand hits 78 recipes inside 6 months plus a backlog of ingredient comparison and sourcing content queued behind the recipe production line.
| Content pillar | Target volume year 1 | Production cost per piece | Refresh cadence |
|---|---|---|---|
| Recipe hub | 40 to 100 recipes | $180 to $320 | Every 12 months |
| Ingredient comparison guides | 12 to 24 guides | $450 to $780 | Every 18 months |
| Sourcing story pages | 6 to 12 pages | $680 to $1,200 | Every 24 months |
| Buyer intent content | 8 to 16 pieces | $220 to $420 | Every 12 months |
Photography as a content calendar constraint
Photography is the actual constraint on recipe cadence, not writing. Every recipe needs 6 to 12 photos: hero shot, ingredient flat lay, prep in progress, plated result, storage, and step shots for the schema markup. A working food brand batches photography 8 recipes at a time to keep the cost per recipe under 200 dollars. Skip the batching and the per-recipe cost climbs to 400 to 600 dollars, which caps recipe cadence at 1 per week and slows organic ranking timeline by 6 months.
Seasonal content calendar planning
Seasonal content calendar planning maps recipes and comparison guides to the seasonal windows they need to rank in. A Christmas cookie recipe needs to publish in September to rank by early December. A Valentine’s chocolate guide needs to publish in November to rank by early February. A back-to-school lunchbox recipe needs to publish in June to rank by late August. The 60-to-90-day ranking curve dictates the calendar.
Creator syndication inside food brand content
Creator syndication on food brand content marketing amplifies the recipe hub through Instagram Reels, TikTok, and YouTube Shorts creators paid to post their own version of the brand’s hero recipes. The creator content pulls net-new audiences into the recipe hub through the creator’s Link in Bio or Amazon Storefront tag. The syndication calendar names 12 to 30 creators per quarter with specific recipes assigned to each.
One brand we picked up had a spreadsheet titled “creator outreach 2023” with 47 rows and 3 responses. All 3 responses were auto-replies. The spreadsheet named zero recipes and offered flat rates below 100 dollars per post. Nobody posts a 30-second video for 87 dollars flat. Nobody.
Creator content commercial terms that work
Working creator content commercial terms run 350 to 1,500 dollars flat per post plus a 12 to 25 percent commission on tagged sales across a 30-day window. The commission mechanic pulls creators into follow-up posts because the incremental revenue continues past the initial fee. Mid-tier creators (30k to 150k followers) hit the sweet spot for food brand content because their engagement rate typically runs 4 to 8 percent versus 0.8 to 1.6 percent on mega-creators.
Content brief structure for creator partnerships
The content brief structure for creator partnerships runs a single page: the SKU, the specific recipe or usage occasion, 3 required brand mentions, 3 restricted claims (no health claims on non-medical SKUs), the pricing angle, the affiliate link, and 3 example videos that hit the tone. The brief avoids over-scripting because over-scripted creator content underperforms native creator voice by 40 to 60 percent on engagement rate.
Buyer intent content for food brand blogs
Buyer intent content on food brand blogs covers 8 to 16 pieces targeting explicit purchase-decision queries: “where to buy [brand],” “[brand] subscription vs. one-time,” “best [category] for [use case],” and “[brand] gift bundle.” Every buyer intent piece runs 1,400 to 2,400 words with a comparison table, product cards, and a clear conversion path to the specific SKU that matches the query intent. Buyer intent content converts at 3 to 6 percent versus 1 to 2 percent on recipe content because the shopper landed already planning to buy, not exploring a usage occasion.
Where-to-buy content structure
Where-to-buy content structure covers online (DTC storefront, Amazon, Target.com, Whole Foods online), retail (specific chain locators with the store finder embedded), and international (customs limitations, retailer partners abroad). Every piece names specific retailers, links to the store locator, and includes an FAQ block covering shipping availability, subscription options, and gift card compatibility. Where-to-buy content ranks for branded discovery queries the DTC storefront otherwise loses to competitor affiliate reviews.
Subscription versus one-time comparison content
Subscription versus one-time comparison content converts subscription commitments at 3 to 6 percent because it addresses the price-sensitivity concern head-on with a specific math table. The piece covers the discount structure (15 percent lifetime), the skip-a-month mechanic, the pause-anytime rule, the cancellation policy, and the specific yearly savings for the brand’s average consumption cadence. Cross-reference the retention structure on our food and beverage marketing retainer page.
Content refresh cadence on food brand pillars
Content refresh cadence on food brand content pillars runs a rolling audit every 12 to 24 months by pillar. Recipes get refreshed every 12 months with new photography, updated schema, and any nutrition or ingredient adjustments. Ingredient comparison guides refresh every 18 months to update market data. Sourcing story pages refresh every 24 months to reflect farm partnership changes and new harvest angles. Buyer intent content refreshes every 12 months to update retailer availability and pricing.
Recipe refresh priority order
Recipe refresh priority runs by organic traffic rank. The top 20 recipes by monthly organic sessions get refreshed first (new photography, schema audit, related recipe internal links, updated nutrition). The next 40 get refreshed at 15 months. The remaining recipes get refreshed opportunistically when the ranking slips past position 15 in Google. Skipping the refresh cadence lets recipe rankings drift out of the top 3 inside 18 months as newer competitor recipes take the position.
Schema audit checklist per refresh
The schema audit checklist per refresh runs 8 items: Recipe schema completeness, aggregateRating count and accuracy, nutrition data accuracy, prepTime and cookTime match the recipe body, image URLs valid at CDN, related recipe internal links working, product card SKU URL live, and Google Search Console rich result eligibility validated. This checklist takes 20 minutes per recipe and prevents the schema drift that costs recipe rankings 20 to 40 positions quietly.
Reporting cadence for food brand content marketing
Reporting cadence on food brand content marketing runs a monthly executive report plus a quarterly business review. The monthly report ships in the first business week and covers organic sessions by pillar, top 10 ranking recipes with position trend, ingredient guide ranking movements, sourcing page performance, and organic-attributed DTC revenue. Every number carries a comparison to the prior month and a plain-language interpretation the founder reads in 7 minutes.
Metrics that matter for content marketing
Metrics that matter for food brand content marketing: organic sessions by pillar, recipe rich result impressions in Search Console, organic conversion rate to hero SKU pages, organic-attributed DTC revenue, and top 20 ranking positions by monthly organic sessions. Vanity metrics that do not matter: total pageviews without conversion context, average time on page without conversion attribution, and social share counts. The monthly report skips the vanity block entirely.
Quarterly business review structure
The quarterly business review runs 90 minutes with the founder, head of content, and SEO lead. Agenda: organic traffic trend by pillar, top 10 winning content pieces, top 10 losing content pieces (candidates for refresh or removal), competitive gap analysis against 5 named competitor brands, and next quarter’s content calendar with recipes and ingredient guides queued. According to Ahrefs content marketing research, brands running quarterly content audits outperform brands running annual audits by 40 to 70 percent on organic revenue over a 24-month window.
Internal linking discipline across food brand content
Internal linking discipline across food brand content moves authority from recipe pages toward hero SKU product pages and comparison guides. Every recipe links to the hero SKU it uses inline (once in the ingredient list, once in a bottom call-out card). Every ingredient comparison guide links to 3 to 6 recipes using the winning ingredient plus the hero SKU product page. Every sourcing story links to the 2 to 4 SKUs sourced from that specific farm or cooperative.
Anchor text strategy across recipe hubs
Anchor text on internal links varies across recipe hubs to avoid over-optimization patterns Google penalizes. Exact-match anchor (“single-origin Ethiopian coffee”) runs on 20 to 30 percent of internal links. Partial-match variations (“our Ethiopian roast”) run on 30 to 40 percent. Branded anchors (the SKU name) run on 20 to 30 percent. Generic anchors (“shop the coffee”) fill the remaining 10 to 20 percent. This ratio holds ranking without triggering the over-optimization penalty that shows up on brands that anchor-text-stuff every internal link with the same exact-match keyword. Cross-reference the linking layer on our food and beverage web design page.
Link equity from ingredient guides to SKU pages
Link equity from ingredient guides passes to SKU pages when the guide’s comparison table names the hero SKU in the winning column with a product card, and when the guide’s body links to 3 to 6 recipes that use the winning ingredient. This 3-hop path (guide to recipe to SKU) pushes authority from a high-traffic informational query down to a high-intent transactional page. According to Search Engine Land SEO coverage, informational content that internally links to transactional pages produces 2 to 4 times higher organic revenue than isolated content silos.
Wrapping up content marketing for food brands
Content marketing for food brands is the organic engine that turns a DTC snack, drink, or CPG storefront into a search-driven revenue channel. Recipe hub of 40 to 100 recipes. Ingredient comparison guides at 12 to 24 pieces. Sourcing story pages at 6 to 12 pieces. Buyer intent content at 8 to 16 pieces. Creator syndication calendar with 12 to 30 creators per quarter. Refresh cadence at 12 to 24 months by pillar. Reporting with organic sessions and organic revenue attribution.
If your DTC food brand is running paid social at 20,000 dollars monthly with a broken blog and zero recipe schema, professional content marketing for food brands pays for itself inside the first 90 days on organic traffic captured. Redefine Web ships content marketing inside our monthly retainer packages. Book a call and we will walk through the last three DTC food brands we built recipe hubs for, pillar by pillar.
Anchor text on internal links varies across recipe hubs to avoid over-optimization patterns Google penalizes. Exact-match anchor (“single-origin Ethiopian coffee”) runs on 20 to 30 percent of internal links. Partial-match variations (“our Ethiopian roast”) run on 30 to 40 percent. Branded anchors (the SKU name) run on 20 to 30 percent. Generic anchors (“shop the coffee”) fill the remaining 10 to 20 percent. This ratio holds ranking without triggering the over-optimization penalty that shows up on brands that anchor-text-stuff every internal link with the same exact-match keyword. Cross-reference the linking layer on our food and beverage web design page.
Link equity from ingredient guides to SKU pages
Link equity from ingredient guides passes to SKU pages when the guide’s comparison table names the hero SKU in the winning column with a product card, and when the guide’s body links to 3 to 6 recipes that use the winning ingredient. This 3-hop path (guide to recipe to SKU) pushes authority from a high-traffic informational query down to a high-intent transactional page. According to Search Engine Land SEO coverage, informational content that internally links to transactional pages produces 2 to 4 times higher organic revenue than isolated content silos.
Wrapping up content marketing for food brands
Content marketing for food brands is the organic engine that turns a DTC snack, drink, or CPG storefront into a search-driven revenue channel. Recipe hub of 40 to 100 recipes. Ingredient comparison guides at 12 to 24 pieces. Sourcing story pages at 6 to 12 pieces. Buyer intent content at 8 to 16 pieces. Creator syndication calendar with 12 to 30 creators per quarter. Refresh cadence at 12 to 24 months by pillar. Reporting with organic sessions and organic revenue attribution.
If your DTC food brand is running paid social at 20,000 dollars monthly with a broken blog and zero recipe schema, professional content marketing for food brands pays for itself inside the first 90 days on organic traffic captured. Redefine Web ships content marketing inside our monthly retainer packages. Book a call and we will walk through the last three DTC food brands we built recipe hubs for, pillar by pillar.
Content marketing for food brands starts with a recipe hub because recipe queries account for 40 to 60 percent of high-intent search volume in the food category. Every hero SKU needs 4 to 12 recipes anchored to it, each targeting a specific occasion and audience.
Skip the recipe hub and the brand loses the search real estate that pulls DTC storefront traffic month over month at zero incremental paid cost. Recipe traffic converts at 2 to 4 percent because the shopper landed with usage intent, not passive discovery, which is why food brands win on recipes.
Recipe schema and Google rich result eligibility
Every recipe page ships schema.org Recipe markup including cookTime, prepTime, recipeIngredient, recipeInstructions, nutrition, and aggregateRating. Correctly marked-up recipes qualify for Google’s recipe rich result carousel that pulls 3 to 6 times higher click-through rate than a plain blue link. The schema layer takes 15 minutes per recipe to author and 30 minutes to validate in Google Search Console. Cross-reference the recipe search stack on our food and beverage SEO page.
Recipe hub structure that scales
The recipe hub structure runs 40 to 100 recipes at maturity, organized by hero SKU (4 to 12 recipes per SKU) plus occasion tags (breakfast, weeknight dinner, meal prep, brunch, holiday). Every recipe links back to the hero SKU product page with the SKU embedded in an inline card. The hub earns internal linking value from ingredient comparison guides and the sourcing story pages, which feeds recipe ranking on Google. According to Google Search Central recipe structured data guidance, complete Recipe schema markup is required for eligibility in the recipe carousel and the ingredient search filter.
Pillar structure for food brand content marketing
The pillar structure on content marketing for food brands runs 4 content pillars concurrently: recipe hub (40 to 100 recipes), ingredient comparison guides (12 to 24 guides), sourcing story pages (6 to 12 pages), and buyer intent content (where to buy, subscription vs. one-time, gift bundle guides). Every pillar covers a distinct search intent and every pillar links back to the hero SKU product pages.
Ingredient comparison guide format
Ingredient comparison guides run 1,800 to 3,200 words comparing 2 to 4 ingredient types on 6 to 10 attributes with a comparison table, real-world use case examples, and links to the hero SKU that uses the specific ingredient. Example: organic vs. conventional oats compares nutritional profile, sourcing chain, cost, environmental impact, and taste on a 6-column table. The brand’s SKU appears in the winning column with a product card. These guides rank 3 to 8 months after publication and pull steady-state organic traffic.
Sourcing story pages that build trust
Sourcing story pages name the specific farms, cooperatives, or suppliers the brand sources from, with photos of the farms, farmer quotes, and specific harvest windows. A coffee brand’s Ethiopian farm page ranks for “single-origin Ethiopian coffee” and “Yirgacheffe coffee origin” plus 40 long-tail variations. The sourcing page pulls trust-building traffic that converts at 4 to 6 percent because the shopper landed pattern-matching on transparency and named provenance. Every sourcing page includes farmer or cooperative quotes, harvest dates, and a link back to 3 to 5 hero SKU pages that source from the named supplier.
Vejrø hospitality content case study
Vejrø Resort, a Danish private-island destination with an on-site restaurant focused on organic, locally sourced cuisine, joined us with strong social engagement and no organic-search real estate. Guests found the resort on Instagram but never in Google search for terms like “private island resort Denmark,” “farm-to-table hospitality Denmark,” or “Vejrø restaurant.” The same organic-search gap shows up on DTC food brands running paid social at 20,000 dollars monthly with a broken blog and zero recipe schema.
We built the conversion-focused website with on-site and off-site SEO tuned to the travel-niche keyword clusters, competitor analysis against comparable boutique resorts, and mobile-first design prioritizing guest discovery. Every page carried the structured data qualifying it for Google’s rich results in the hospitality category. Every internal link pushed authority toward the direct-booking conversion path.
Three months later, Vejrø hit 10,000 plus organic visitors, ranked for 200 plus first-page keywords, and pulled a 2.2 percent booking conversion rate from organic traffic. The same pattern applies to content marketing for food brands: recipe schema, ingredient comparison guides, and sourcing story pages pull organic traffic at 20 to 40 percent conversion into hero SKU pages inside 6 months when the content quality matches search intent and every page carries the right structured data markup. Vejrø also proved out the reporting discipline: every monthly report named the exact page, the exact keyword cluster, and the exact search feature (rich result, sitelinks, image pack) driving the incremental organic revenue instead of hiding behind aggregate traffic charts.
Recipe cadence and content calendar for food brands
Recipe cadence on a working food brand content calendar ships 2 to 4 new recipes per week during the first 6 months and drops to 1 per week at maturity. Each recipe takes 4 to 6 hours to produce (write, test in the kitchen, photograph, schema author, publish). At 3 recipes per week, the brand hits 78 recipes inside 6 months plus a backlog of ingredient comparison and sourcing content queued behind the recipe production line.
| Content pillar | Target volume year 1 | Production cost per piece | Refresh cadence |
|---|---|---|---|
| Recipe hub | 40 to 100 recipes | $180 to $320 | Every 12 months |
| Ingredient comparison guides | 12 to 24 guides | $450 to $780 | Every 18 months |
| Sourcing story pages | 6 to 12 pages | $680 to $1,200 | Every 24 months |
| Buyer intent content | 8 to 16 pieces | $220 to $420 | Every 12 months |
Photography as a content calendar constraint
Photography is the actual constraint on recipe cadence, not writing. Every recipe needs 6 to 12 photos: hero shot, ingredient flat lay, prep in progress, plated result, storage, and step shots for the schema markup. A working food brand batches photography 8 recipes at a time to keep the cost per recipe under 200 dollars. Skip the batching and the per-recipe cost climbs to 400 to 600 dollars, which caps recipe cadence at 1 per week and slows organic ranking timeline by 6 months.
Seasonal content calendar planning
Seasonal content calendar planning maps recipes and comparison guides to the seasonal windows they need to rank in. A Christmas cookie recipe needs to publish in September to rank by early December. A Valentine’s chocolate guide needs to publish in November to rank by early February. A back-to-school lunchbox recipe needs to publish in June to rank by late August. The 60-to-90-day ranking curve dictates the calendar.
Creator syndication inside food brand content
Creator syndication on food brand content marketing amplifies the recipe hub through Instagram Reels, TikTok, and YouTube Shorts creators paid to post their own version of the brand’s hero recipes. The creator content pulls net-new audiences into the recipe hub through the creator’s Link in Bio or Amazon Storefront tag. The syndication calendar names 12 to 30 creators per quarter with specific recipes assigned to each.
One brand we picked up had a spreadsheet titled “creator outreach 2023” with 47 rows and 3 responses. All 3 responses were auto-replies. The spreadsheet named zero recipes and offered flat rates below 100 dollars per post. Nobody posts a 30-second video for 87 dollars flat. Nobody.
Creator content commercial terms that work
Working creator content commercial terms run 350 to 1,500 dollars flat per post plus a 12 to 25 percent commission on tagged sales across a 30-day window. The commission mechanic pulls creators into follow-up posts because the incremental revenue continues past the initial fee. Mid-tier creators (30k to 150k followers) hit the sweet spot for food brand content because their engagement rate typically runs 4 to 8 percent versus 0.8 to 1.6 percent on mega-creators.
Content brief structure for creator partnerships
The content brief structure for creator partnerships runs a single page: the SKU, the specific recipe or usage occasion, 3 required brand mentions, 3 restricted claims (no health claims on non-medical SKUs), the pricing angle, the affiliate link, and 3 example videos that hit the tone. The brief avoids over-scripting because over-scripted creator content underperforms native creator voice by 40 to 60 percent on engagement rate.
Buyer intent content for food brand blogs
Buyer intent content on food brand blogs covers 8 to 16 pieces targeting explicit purchase-decision queries: “where to buy [brand],” “[brand] subscription vs. one-time,” “best [category] for [use case],” and “[brand] gift bundle.” Every buyer intent piece runs 1,400 to 2,400 words with a comparison table, product cards, and a clear conversion path to the specific SKU that matches the query intent. Buyer intent content converts at 3 to 6 percent versus 1 to 2 percent on recipe content because the shopper landed already planning to buy, not exploring a usage occasion.
Where-to-buy content structure
Where-to-buy content structure covers online (DTC storefront, Amazon, Target.com, Whole Foods online), retail (specific chain locators with the store finder embedded), and international (customs limitations, retailer partners abroad). Every piece names specific retailers, links to the store locator, and includes an FAQ block covering shipping availability, subscription options, and gift card compatibility. Where-to-buy content ranks for branded discovery queries the DTC storefront otherwise loses to competitor affiliate reviews.
Subscription versus one-time comparison content
Subscription versus one-time comparison content converts subscription commitments at 3 to 6 percent because it addresses the price-sensitivity concern head-on with a specific math table. The piece covers the discount structure (15 percent lifetime), the skip-a-month mechanic, the pause-anytime rule, the cancellation policy, and the specific yearly savings for the brand’s average consumption cadence. Cross-reference the retention structure on our food and beverage marketing retainer page.
Content refresh cadence on food brand pillars
Content refresh cadence on food brand content pillars runs a rolling audit every 12 to 24 months by pillar. Recipes get refreshed every 12 months with new photography, updated schema, and any nutrition or ingredient adjustments. Ingredient comparison guides refresh every 18 months to update market data. Sourcing story pages refresh every 24 months to reflect farm partnership changes and new harvest angles. Buyer intent content refreshes every 12 months to update retailer availability and pricing.
Recipe refresh priority order
Recipe refresh priority runs by organic traffic rank. The top 20 recipes by monthly organic sessions get refreshed first (new photography, schema audit, related recipe internal links, updated nutrition). The next 40 get refreshed at 15 months. The remaining recipes get refreshed opportunistically when the ranking slips past position 15 in Google. Skipping the refresh cadence lets recipe rankings drift out of the top 3 inside 18 months as newer competitor recipes take the position.
Schema audit checklist per refresh
The schema audit checklist per refresh runs 8 items: Recipe schema completeness, aggregateRating count and accuracy, nutrition data accuracy, prepTime and cookTime match the recipe body, image URLs valid at CDN, related recipe internal links working, product card SKU URL live, and Google Search Console rich result eligibility validated. This checklist takes 20 minutes per recipe and prevents the schema drift that costs recipe rankings 20 to 40 positions quietly.
Reporting cadence for food brand content marketing
Reporting cadence on food brand content marketing runs a monthly executive report plus a quarterly business review. The monthly report ships in the first business week and covers organic sessions by pillar, top 10 ranking recipes with position trend, ingredient guide ranking movements, sourcing page performance, and organic-attributed DTC revenue. Every number carries a comparison to the prior month and a plain-language interpretation the founder reads in 7 minutes.
Metrics that matter for content marketing
Metrics that matter for food brand content marketing: organic sessions by pillar, recipe rich result impressions in Search Console, organic conversion rate to hero SKU pages, organic-attributed DTC revenue, and top 20 ranking positions by monthly organic sessions. Vanity metrics that do not matter: total pageviews without conversion context, average time on page without conversion attribution, and social share counts. The monthly report skips the vanity block entirely.
Quarterly business review structure
The quarterly business review runs 90 minutes with the founder, head of content, and SEO lead. Agenda: organic traffic trend by pillar, top 10 winning content pieces, top 10 losing content pieces (candidates for refresh or removal), competitive gap analysis against 5 named competitor brands, and next quarter’s content calendar with recipes and ingredient guides queued. According to Ahrefs content marketing research, brands running quarterly content audits outperform brands running annual audits by 40 to 70 percent on organic revenue over a 24-month window.
Internal linking discipline across food brand content
Internal linking discipline across food brand content moves authority from recipe pages toward hero SKU product pages and comparison guides. Every recipe links to the hero SKU it uses inline (once in the ingredient list, once in a bottom call-out card). Every ingredient comparison guide links to 3 to 6 recipes using the winning ingredient plus the hero SKU product page. Every sourcing story links to the 2 to 4 SKUs sourced from that specific farm or cooperative.
Anchor text strategy across recipe hubs
Anchor text on internal links varies across recipe hubs to avoid over-optimization patterns Google penalizes. Exact-match anchor (“single-origin Ethiopian coffee”) runs on 20 to 30 percent of internal links. Partial-match variations (“our Ethiopian roast”) run on 30 to 40 percent. Branded anchors (the SKU name) run on 20 to 30 percent. Generic anchors (“shop the coffee”) fill the remaining 10 to 20 percent. This ratio holds ranking without triggering the over-optimization penalty that shows up on brands that anchor-text-stuff every internal link with the same exact-match keyword. Cross-reference the linking layer on our food and beverage web design page.
Link equity from ingredient guides to SKU pages
Link equity from ingredient guides passes to SKU pages when the guide’s comparison table names the hero SKU in the winning column with a product card, and when the guide’s body links to 3 to 6 recipes that use the winning ingredient. This 3-hop path (guide to recipe to SKU) pushes authority from a high-traffic informational query down to a high-intent transactional page. According to Search Engine Land SEO coverage, informational content that internally links to transactional pages produces 2 to 4 times higher organic revenue than isolated content silos.
Wrapping up content marketing for food brands
Content marketing for food brands is the organic engine that turns a DTC snack, drink, or CPG storefront into a search-driven revenue channel. Recipe hub of 40 to 100 recipes. Ingredient comparison guides at 12 to 24 pieces. Sourcing story pages at 6 to 12 pieces. Buyer intent content at 8 to 16 pieces. Creator syndication calendar with 12 to 30 creators per quarter. Refresh cadence at 12 to 24 months by pillar. Reporting with organic sessions and organic revenue attribution.
If your DTC food brand is running paid social at 20,000 dollars monthly with a broken blog and zero recipe schema, professional content marketing for food brands pays for itself inside the first 90 days on organic traffic captured. Redefine Web ships content marketing inside our monthly retainer packages. Book a call and we will walk through the last three DTC food brands we built recipe hubs for, pillar by pillar.
Internal linking discipline across food brand content moves authority from recipe pages toward hero SKU product pages and comparison guides. Every recipe links to the hero SKU it uses inline (once in the ingredient list, once in a bottom call-out card). Every ingredient comparison guide links to 3 to 6 recipes using the winning ingredient plus the hero SKU product page. Every sourcing story links to the 2 to 4 SKUs sourced from that specific farm or cooperative.
Anchor text strategy across recipe hubs
Anchor text on internal links varies across recipe hubs to avoid over-optimization patterns Google penalizes. Exact-match anchor (“single-origin Ethiopian coffee”) runs on 20 to 30 percent of internal links. Partial-match variations (“our Ethiopian roast”) run on 30 to 40 percent. Branded anchors (the SKU name) run on 20 to 30 percent. Generic anchors (“shop the coffee”) fill the remaining 10 to 20 percent. This ratio holds ranking without triggering the over-optimization penalty that shows up on brands that anchor-text-stuff every internal link with the same exact-match keyword. Cross-reference the linking layer on our food and beverage web design page.
Link equity from ingredient guides to SKU pages
Link equity from ingredient guides passes to SKU pages when the guide’s comparison table names the hero SKU in the winning column with a product card, and when the guide’s body links to 3 to 6 recipes that use the winning ingredient. This 3-hop path (guide to recipe to SKU) pushes authority from a high-traffic informational query down to a high-intent transactional page. According to Search Engine Land SEO coverage, informational content that internally links to transactional pages produces 2 to 4 times higher organic revenue than isolated content silos.
Wrapping up content marketing for food brands
Content marketing for food brands is the organic engine that turns a DTC snack, drink, or CPG storefront into a search-driven revenue channel. Recipe hub of 40 to 100 recipes. Ingredient comparison guides at 12 to 24 pieces. Sourcing story pages at 6 to 12 pieces. Buyer intent content at 8 to 16 pieces. Creator syndication calendar with 12 to 30 creators per quarter. Refresh cadence at 12 to 24 months by pillar. Reporting with organic sessions and organic revenue attribution.
If your DTC food brand is running paid social at 20,000 dollars monthly with a broken blog and zero recipe schema, professional content marketing for food brands pays for itself inside the first 90 days on organic traffic captured. Redefine Web ships content marketing inside our monthly retainer packages. Book a call and we will walk through the last three DTC food brands we built recipe hubs for, pillar by pillar.
Content marketing for food brands starts with a recipe hub because recipe queries account for 40 to 60 percent of high-intent search volume in the food category. Every hero SKU needs 4 to 12 recipes anchored to it, each targeting a specific occasion and audience.
Skip the recipe hub and the brand loses the search real estate that pulls DTC storefront traffic month over month at zero incremental paid cost. Recipe traffic converts at 2 to 4 percent because the shopper landed with usage intent, not passive discovery, which is why food brands win on recipes.
Recipe schema and Google rich result eligibility
Every recipe page ships schema.org Recipe markup including cookTime, prepTime, recipeIngredient, recipeInstructions, nutrition, and aggregateRating. Correctly marked-up recipes qualify for Google’s recipe rich result carousel that pulls 3 to 6 times higher click-through rate than a plain blue link. The schema layer takes 15 minutes per recipe to author and 30 minutes to validate in Google Search Console. Cross-reference the recipe search stack on our food and beverage SEO page.
Recipe hub structure that scales
The recipe hub structure runs 40 to 100 recipes at maturity, organized by hero SKU (4 to 12 recipes per SKU) plus occasion tags (breakfast, weeknight dinner, meal prep, brunch, holiday). Every recipe links back to the hero SKU product page with the SKU embedded in an inline card. The hub earns internal linking value from ingredient comparison guides and the sourcing story pages, which feeds recipe ranking on Google. According to Google Search Central recipe structured data guidance, complete Recipe schema markup is required for eligibility in the recipe carousel and the ingredient search filter.
Pillar structure for food brand content marketing
The pillar structure on content marketing for food brands runs 4 content pillars concurrently: recipe hub (40 to 100 recipes), ingredient comparison guides (12 to 24 guides), sourcing story pages (6 to 12 pages), and buyer intent content (where to buy, subscription vs. one-time, gift bundle guides). Every pillar covers a distinct search intent and every pillar links back to the hero SKU product pages.
Ingredient comparison guide format
Ingredient comparison guides run 1,800 to 3,200 words comparing 2 to 4 ingredient types on 6 to 10 attributes with a comparison table, real-world use case examples, and links to the hero SKU that uses the specific ingredient. Example: organic vs. conventional oats compares nutritional profile, sourcing chain, cost, environmental impact, and taste on a 6-column table. The brand’s SKU appears in the winning column with a product card. These guides rank 3 to 8 months after publication and pull steady-state organic traffic.
Sourcing story pages that build trust
Sourcing story pages name the specific farms, cooperatives, or suppliers the brand sources from, with photos of the farms, farmer quotes, and specific harvest windows. A coffee brand’s Ethiopian farm page ranks for “single-origin Ethiopian coffee” and “Yirgacheffe coffee origin” plus 40 long-tail variations. The sourcing page pulls trust-building traffic that converts at 4 to 6 percent because the shopper landed pattern-matching on transparency and named provenance. Every sourcing page includes farmer or cooperative quotes, harvest dates, and a link back to 3 to 5 hero SKU pages that source from the named supplier.
Vejrø hospitality content case study
Vejrø Resort, a Danish private-island destination with an on-site restaurant focused on organic, locally sourced cuisine, joined us with strong social engagement and no organic-search real estate. Guests found the resort on Instagram but never in Google search for terms like “private island resort Denmark,” “farm-to-table hospitality Denmark,” or “Vejrø restaurant.” The same organic-search gap shows up on DTC food brands running paid social at 20,000 dollars monthly with a broken blog and zero recipe schema.
We built the conversion-focused website with on-site and off-site SEO tuned to the travel-niche keyword clusters, competitor analysis against comparable boutique resorts, and mobile-first design prioritizing guest discovery. Every page carried the structured data qualifying it for Google’s rich results in the hospitality category. Every internal link pushed authority toward the direct-booking conversion path.
Three months later, Vejrø hit 10,000 plus organic visitors, ranked for 200 plus first-page keywords, and pulled a 2.2 percent booking conversion rate from organic traffic. The same pattern applies to content marketing for food brands: recipe schema, ingredient comparison guides, and sourcing story pages pull organic traffic at 20 to 40 percent conversion into hero SKU pages inside 6 months when the content quality matches search intent and every page carries the right structured data markup. Vejrø also proved out the reporting discipline: every monthly report named the exact page, the exact keyword cluster, and the exact search feature (rich result, sitelinks, image pack) driving the incremental organic revenue instead of hiding behind aggregate traffic charts.
Recipe cadence and content calendar for food brands
Recipe cadence on a working food brand content calendar ships 2 to 4 new recipes per week during the first 6 months and drops to 1 per week at maturity. Each recipe takes 4 to 6 hours to produce (write, test in the kitchen, photograph, schema author, publish). At 3 recipes per week, the brand hits 78 recipes inside 6 months plus a backlog of ingredient comparison and sourcing content queued behind the recipe production line.
| Content pillar | Target volume year 1 | Production cost per piece | Refresh cadence |
|---|---|---|---|
| Recipe hub | 40 to 100 recipes | $180 to $320 | Every 12 months |
| Ingredient comparison guides | 12 to 24 guides | $450 to $780 | Every 18 months |
| Sourcing story pages | 6 to 12 pages | $680 to $1,200 | Every 24 months |
| Buyer intent content | 8 to 16 pieces | $220 to $420 | Every 12 months |
Photography as a content calendar constraint
Photography is the actual constraint on recipe cadence, not writing. Every recipe needs 6 to 12 photos: hero shot, ingredient flat lay, prep in progress, plated result, storage, and step shots for the schema markup. A working food brand batches photography 8 recipes at a time to keep the cost per recipe under 200 dollars. Skip the batching and the per-recipe cost climbs to 400 to 600 dollars, which caps recipe cadence at 1 per week and slows organic ranking timeline by 6 months.
Seasonal content calendar planning
Seasonal content calendar planning maps recipes and comparison guides to the seasonal windows they need to rank in. A Christmas cookie recipe needs to publish in September to rank by early December. A Valentine’s chocolate guide needs to publish in November to rank by early February. A back-to-school lunchbox recipe needs to publish in June to rank by late August. The 60-to-90-day ranking curve dictates the calendar.
Creator syndication inside food brand content
Creator syndication on food brand content marketing amplifies the recipe hub through Instagram Reels, TikTok, and YouTube Shorts creators paid to post their own version of the brand’s hero recipes. The creator content pulls net-new audiences into the recipe hub through the creator’s Link in Bio or Amazon Storefront tag. The syndication calendar names 12 to 30 creators per quarter with specific recipes assigned to each.
One brand we picked up had a spreadsheet titled “creator outreach 2023” with 47 rows and 3 responses. All 3 responses were auto-replies. The spreadsheet named zero recipes and offered flat rates below 100 dollars per post. Nobody posts a 30-second video for 87 dollars flat. Nobody.
Creator content commercial terms that work
Working creator content commercial terms run 350 to 1,500 dollars flat per post plus a 12 to 25 percent commission on tagged sales across a 30-day window. The commission mechanic pulls creators into follow-up posts because the incremental revenue continues past the initial fee. Mid-tier creators (30k to 150k followers) hit the sweet spot for food brand content because their engagement rate typically runs 4 to 8 percent versus 0.8 to 1.6 percent on mega-creators.
Content brief structure for creator partnerships
The content brief structure for creator partnerships runs a single page: the SKU, the specific recipe or usage occasion, 3 required brand mentions, 3 restricted claims (no health claims on non-medical SKUs), the pricing angle, the affiliate link, and 3 example videos that hit the tone. The brief avoids over-scripting because over-scripted creator content underperforms native creator voice by 40 to 60 percent on engagement rate.
Buyer intent content for food brand blogs
Buyer intent content on food brand blogs covers 8 to 16 pieces targeting explicit purchase-decision queries: “where to buy [brand],” “[brand] subscription vs. one-time,” “best [category] for [use case],” and “[brand] gift bundle.” Every buyer intent piece runs 1,400 to 2,400 words with a comparison table, product cards, and a clear conversion path to the specific SKU that matches the query intent. Buyer intent content converts at 3 to 6 percent versus 1 to 2 percent on recipe content because the shopper landed already planning to buy, not exploring a usage occasion.
Where-to-buy content structure
Where-to-buy content structure covers online (DTC storefront, Amazon, Target.com, Whole Foods online), retail (specific chain locators with the store finder embedded), and international (customs limitations, retailer partners abroad). Every piece names specific retailers, links to the store locator, and includes an FAQ block covering shipping availability, subscription options, and gift card compatibility. Where-to-buy content ranks for branded discovery queries the DTC storefront otherwise loses to competitor affiliate reviews.
Subscription versus one-time comparison content
Subscription versus one-time comparison content converts subscription commitments at 3 to 6 percent because it addresses the price-sensitivity concern head-on with a specific math table. The piece covers the discount structure (15 percent lifetime), the skip-a-month mechanic, the pause-anytime rule, the cancellation policy, and the specific yearly savings for the brand’s average consumption cadence. Cross-reference the retention structure on our food and beverage marketing retainer page.
Content refresh cadence on food brand pillars
Content refresh cadence on food brand content pillars runs a rolling audit every 12 to 24 months by pillar. Recipes get refreshed every 12 months with new photography, updated schema, and any nutrition or ingredient adjustments. Ingredient comparison guides refresh every 18 months to update market data. Sourcing story pages refresh every 24 months to reflect farm partnership changes and new harvest angles. Buyer intent content refreshes every 12 months to update retailer availability and pricing.
Recipe refresh priority order
Recipe refresh priority runs by organic traffic rank. The top 20 recipes by monthly organic sessions get refreshed first (new photography, schema audit, related recipe internal links, updated nutrition). The next 40 get refreshed at 15 months. The remaining recipes get refreshed opportunistically when the ranking slips past position 15 in Google. Skipping the refresh cadence lets recipe rankings drift out of the top 3 inside 18 months as newer competitor recipes take the position.
Schema audit checklist per refresh
The schema audit checklist per refresh runs 8 items: Recipe schema completeness, aggregateRating count and accuracy, nutrition data accuracy, prepTime and cookTime match the recipe body, image URLs valid at CDN, related recipe internal links working, product card SKU URL live, and Google Search Console rich result eligibility validated. This checklist takes 20 minutes per recipe and prevents the schema drift that costs recipe rankings 20 to 40 positions quietly.
Reporting cadence for food brand content marketing
Reporting cadence on food brand content marketing runs a monthly executive report plus a quarterly business review. The monthly report ships in the first business week and covers organic sessions by pillar, top 10 ranking recipes with position trend, ingredient guide ranking movements, sourcing page performance, and organic-attributed DTC revenue. Every number carries a comparison to the prior month and a plain-language interpretation the founder reads in 7 minutes.
Metrics that matter for content marketing
Metrics that matter for food brand content marketing: organic sessions by pillar, recipe rich result impressions in Search Console, organic conversion rate to hero SKU pages, organic-attributed DTC revenue, and top 20 ranking positions by monthly organic sessions. Vanity metrics that do not matter: total pageviews without conversion context, average time on page without conversion attribution, and social share counts. The monthly report skips the vanity block entirely.
Quarterly business review structure
The quarterly business review runs 90 minutes with the founder, head of content, and SEO lead. Agenda: organic traffic trend by pillar, top 10 winning content pieces, top 10 losing content pieces (candidates for refresh or removal), competitive gap analysis against 5 named competitor brands, and next quarter’s content calendar with recipes and ingredient guides queued. According to Ahrefs content marketing research, brands running quarterly content audits outperform brands running annual audits by 40 to 70 percent on organic revenue over a 24-month window.
Internal linking discipline across food brand content
Internal linking discipline across food brand content moves authority from recipe pages toward hero SKU product pages and comparison guides. Every recipe links to the hero SKU it uses inline (once in the ingredient list, once in a bottom call-out card). Every ingredient comparison guide links to 3 to 6 recipes using the winning ingredient plus the hero SKU product page. Every sourcing story links to the 2 to 4 SKUs sourced from that specific farm or cooperative.
Anchor text strategy across recipe hubs
Anchor text on internal links varies across recipe hubs to avoid over-optimization patterns Google penalizes. Exact-match anchor (“single-origin Ethiopian coffee”) runs on 20 to 30 percent of internal links. Partial-match variations (“our Ethiopian roast”) run on 30 to 40 percent. Branded anchors (the SKU name) run on 20 to 30 percent. Generic anchors (“shop the coffee”) fill the remaining 10 to 20 percent. This ratio holds ranking without triggering the over-optimization penalty that shows up on brands that anchor-text-stuff every internal link with the same exact-match keyword. Cross-reference the linking layer on our food and beverage web design page.
Link equity from ingredient guides to SKU pages
Link equity from ingredient guides passes to SKU pages when the guide’s comparison table names the hero SKU in the winning column with a product card, and when the guide’s body links to 3 to 6 recipes that use the winning ingredient. This 3-hop path (guide to recipe to SKU) pushes authority from a high-traffic informational query down to a high-intent transactional page. According to Search Engine Land SEO coverage, informational content that internally links to transactional pages produces 2 to 4 times higher organic revenue than isolated content silos.
Wrapping up content marketing for food brands
Content marketing for food brands is the organic engine that turns a DTC snack, drink, or CPG storefront into a search-driven revenue channel. Recipe hub of 40 to 100 recipes. Ingredient comparison guides at 12 to 24 pieces. Sourcing story pages at 6 to 12 pieces. Buyer intent content at 8 to 16 pieces. Creator syndication calendar with 12 to 30 creators per quarter. Refresh cadence at 12 to 24 months by pillar. Reporting with organic sessions and organic revenue attribution.
If your DTC food brand is running paid social at 20,000 dollars monthly with a broken blog and zero recipe schema, professional content marketing for food brands pays for itself inside the first 90 days on organic traffic captured. Redefine Web ships content marketing inside our monthly retainer packages. Book a call and we will walk through the last three DTC food brands we built recipe hubs for, pillar by pillar.
Content marketing for food brands starts with a recipe hub because recipe queries account for 40 to 60 percent of high-intent search volume in the food category. Every hero SKU needs 4 to 12 recipes anchored to it, each targeting a specific occasion and audience.
Skip the recipe hub and the brand loses the search real estate that pulls DTC storefront traffic month over month at zero incremental paid cost. Recipe traffic converts at 2 to 4 percent because the shopper landed with usage intent, not passive discovery, which is why food brands win on recipes.
Recipe schema and Google rich result eligibility
Every recipe page ships schema.org Recipe markup including cookTime, prepTime, recipeIngredient, recipeInstructions, nutrition, and aggregateRating. Correctly marked-up recipes qualify for Google’s recipe rich result carousel that pulls 3 to 6 times higher click-through rate than a plain blue link. The schema layer takes 15 minutes per recipe to author and 30 minutes to validate in Google Search Console. Cross-reference the recipe search stack on our food and beverage SEO page.
Recipe hub structure that scales
The recipe hub structure runs 40 to 100 recipes at maturity, organized by hero SKU (4 to 12 recipes per SKU) plus occasion tags (breakfast, weeknight dinner, meal prep, brunch, holiday). Every recipe links back to the hero SKU product page with the SKU embedded in an inline card. The hub earns internal linking value from ingredient comparison guides and the sourcing story pages, which feeds recipe ranking on Google. According to Google Search Central recipe structured data guidance, complete Recipe schema markup is required for eligibility in the recipe carousel and the ingredient search filter.
Pillar structure for food brand content marketing
The pillar structure on content marketing for food brands runs 4 content pillars concurrently: recipe hub (40 to 100 recipes), ingredient comparison guides (12 to 24 guides), sourcing story pages (6 to 12 pages), and buyer intent content (where to buy, subscription vs. one-time, gift bundle guides). Every pillar covers a distinct search intent and every pillar links back to the hero SKU product pages.
Ingredient comparison guide format
Ingredient comparison guides run 1,800 to 3,200 words comparing 2 to 4 ingredient types on 6 to 10 attributes with a comparison table, real-world use case examples, and links to the hero SKU that uses the specific ingredient. Example: organic vs. conventional oats compares nutritional profile, sourcing chain, cost, environmental impact, and taste on a 6-column table. The brand’s SKU appears in the winning column with a product card. These guides rank 3 to 8 months after publication and pull steady-state organic traffic.
Sourcing story pages that build trust
Sourcing story pages name the specific farms, cooperatives, or suppliers the brand sources from, with photos of the farms, farmer quotes, and specific harvest windows. A coffee brand’s Ethiopian farm page ranks for “single-origin Ethiopian coffee” and “Yirgacheffe coffee origin” plus 40 long-tail variations. The sourcing page pulls trust-building traffic that converts at 4 to 6 percent because the shopper landed pattern-matching on transparency and named provenance. Every sourcing page includes farmer or cooperative quotes, harvest dates, and a link back to 3 to 5 hero SKU pages that source from the named supplier.
Vejrø hospitality content case study
Vejrø Resort, a Danish private-island destination with an on-site restaurant focused on organic, locally sourced cuisine, joined us with strong social engagement and no organic-search real estate. Guests found the resort on Instagram but never in Google search for terms like “private island resort Denmark,” “farm-to-table hospitality Denmark,” or “Vejrø restaurant.” The same organic-search gap shows up on DTC food brands running paid social at 20,000 dollars monthly with a broken blog and zero recipe schema.
We built the conversion-focused website with on-site and off-site SEO tuned to the travel-niche keyword clusters, competitor analysis against comparable boutique resorts, and mobile-first design prioritizing guest discovery. Every page carried the structured data qualifying it for Google’s rich results in the hospitality category. Every internal link pushed authority toward the direct-booking conversion path.
Three months later, Vejrø hit 10,000 plus organic visitors, ranked for 200 plus first-page keywords, and pulled a 2.2 percent booking conversion rate from organic traffic. The same pattern applies to content marketing for food brands: recipe schema, ingredient comparison guides, and sourcing story pages pull organic traffic at 20 to 40 percent conversion into hero SKU pages inside 6 months when the content quality matches search intent and every page carries the right structured data markup. Vejrø also proved out the reporting discipline: every monthly report named the exact page, the exact keyword cluster, and the exact search feature (rich result, sitelinks, image pack) driving the incremental organic revenue instead of hiding behind aggregate traffic charts.
Recipe cadence and content calendar for food brands
Recipe cadence on a working food brand content calendar ships 2 to 4 new recipes per week during the first 6 months and drops to 1 per week at maturity. Each recipe takes 4 to 6 hours to produce (write, test in the kitchen, photograph, schema author, publish). At 3 recipes per week, the brand hits 78 recipes inside 6 months plus a backlog of ingredient comparison and sourcing content queued behind the recipe production line.
| Content pillar | Target volume year 1 | Production cost per piece | Refresh cadence |
|---|---|---|---|
| Recipe hub | 40 to 100 recipes | $180 to $320 | Every 12 months |
| Ingredient comparison guides | 12 to 24 guides | $450 to $780 | Every 18 months |
| Sourcing story pages | 6 to 12 pages | $680 to $1,200 | Every 24 months |
| Buyer intent content | 8 to 16 pieces | $220 to $420 | Every 12 months |
Photography as a content calendar constraint
Photography is the actual constraint on recipe cadence, not writing. Every recipe needs 6 to 12 photos: hero shot, ingredient flat lay, prep in progress, plated result, storage, and step shots for the schema markup. A working food brand batches photography 8 recipes at a time to keep the cost per recipe under 200 dollars. Skip the batching and the per-recipe cost climbs to 400 to 600 dollars, which caps recipe cadence at 1 per week and slows organic ranking timeline by 6 months.
Seasonal content calendar planning
Seasonal content calendar planning maps recipes and comparison guides to the seasonal windows they need to rank in. A Christmas cookie recipe needs to publish in September to rank by early December. A Valentine’s chocolate guide needs to publish in November to rank by early February. A back-to-school lunchbox recipe needs to publish in June to rank by late August. The 60-to-90-day ranking curve dictates the calendar.
Creator syndication inside food brand content
Creator syndication on food brand content marketing amplifies the recipe hub through Instagram Reels, TikTok, and YouTube Shorts creators paid to post their own version of the brand’s hero recipes. The creator content pulls net-new audiences into the recipe hub through the creator’s Link in Bio or Amazon Storefront tag. The syndication calendar names 12 to 30 creators per quarter with specific recipes assigned to each.
One brand we picked up had a spreadsheet titled “creator outreach 2023” with 47 rows and 3 responses. All 3 responses were auto-replies. The spreadsheet named zero recipes and offered flat rates below 100 dollars per post. Nobody posts a 30-second video for 87 dollars flat. Nobody.
Creator content commercial terms that work
Working creator content commercial terms run 350 to 1,500 dollars flat per post plus a 12 to 25 percent commission on tagged sales across a 30-day window. The commission mechanic pulls creators into follow-up posts because the incremental revenue continues past the initial fee. Mid-tier creators (30k to 150k followers) hit the sweet spot for food brand content because their engagement rate typically runs 4 to 8 percent versus 0.8 to 1.6 percent on mega-creators.
Content brief structure for creator partnerships
The content brief structure for creator partnerships runs a single page: the SKU, the specific recipe or usage occasion, 3 required brand mentions, 3 restricted claims (no health claims on non-medical SKUs), the pricing angle, the affiliate link, and 3 example videos that hit the tone. The brief avoids over-scripting because over-scripted creator content underperforms native creator voice by 40 to 60 percent on engagement rate.
Buyer intent content for food brand blogs
Buyer intent content on food brand blogs covers 8 to 16 pieces targeting explicit purchase-decision queries: “where to buy [brand],” “[brand] subscription vs. one-time,” “best [category] for [use case],” and “[brand] gift bundle.” Every buyer intent piece runs 1,400 to 2,400 words with a comparison table, product cards, and a clear conversion path to the specific SKU that matches the query intent. Buyer intent content converts at 3 to 6 percent versus 1 to 2 percent on recipe content because the shopper landed already planning to buy, not exploring a usage occasion.
Where-to-buy content structure
Where-to-buy content structure covers online (DTC storefront, Amazon, Target.com, Whole Foods online), retail (specific chain locators with the store finder embedded), and international (customs limitations, retailer partners abroad). Every piece names specific retailers, links to the store locator, and includes an FAQ block covering shipping availability, subscription options, and gift card compatibility. Where-to-buy content ranks for branded discovery queries the DTC storefront otherwise loses to competitor affiliate reviews.
Subscription versus one-time comparison content
Subscription versus one-time comparison content converts subscription commitments at 3 to 6 percent because it addresses the price-sensitivity concern head-on with a specific math table. The piece covers the discount structure (15 percent lifetime), the skip-a-month mechanic, the pause-anytime rule, the cancellation policy, and the specific yearly savings for the brand’s average consumption cadence. Cross-reference the retention structure on our food and beverage marketing retainer page.
Content refresh cadence on food brand pillars
Content refresh cadence on food brand content pillars runs a rolling audit every 12 to 24 months by pillar. Recipes get refreshed every 12 months with new photography, updated schema, and any nutrition or ingredient adjustments. Ingredient comparison guides refresh every 18 months to update market data. Sourcing story pages refresh every 24 months to reflect farm partnership changes and new harvest angles. Buyer intent content refreshes every 12 months to update retailer availability and pricing.
Recipe refresh priority order
Recipe refresh priority runs by organic traffic rank. The top 20 recipes by monthly organic sessions get refreshed first (new photography, schema audit, related recipe internal links, updated nutrition). The next 40 get refreshed at 15 months. The remaining recipes get refreshed opportunistically when the ranking slips past position 15 in Google. Skipping the refresh cadence lets recipe rankings drift out of the top 3 inside 18 months as newer competitor recipes take the position.
Schema audit checklist per refresh
The schema audit checklist per refresh runs 8 items: Recipe schema completeness, aggregateRating count and accuracy, nutrition data accuracy, prepTime and cookTime match the recipe body, image URLs valid at CDN, related recipe internal links working, product card SKU URL live, and Google Search Console rich result eligibility validated. This checklist takes 20 minutes per recipe and prevents the schema drift that costs recipe rankings 20 to 40 positions quietly.
Reporting cadence for food brand content marketing
Reporting cadence on food brand content marketing runs a monthly executive report plus a quarterly business review. The monthly report ships in the first business week and covers organic sessions by pillar, top 10 ranking recipes with position trend, ingredient guide ranking movements, sourcing page performance, and organic-attributed DTC revenue. Every number carries a comparison to the prior month and a plain-language interpretation the founder reads in 7 minutes.
Metrics that matter for content marketing
Metrics that matter for food brand content marketing: organic sessions by pillar, recipe rich result impressions in Search Console, organic conversion rate to hero SKU pages, organic-attributed DTC revenue, and top 20 ranking positions by monthly organic sessions. Vanity metrics that do not matter: total pageviews without conversion context, average time on page without conversion attribution, and social share counts. The monthly report skips the vanity block entirely.
Quarterly business review structure
The quarterly business review runs 90 minutes with the founder, head of content, and SEO lead. Agenda: organic traffic trend by pillar, top 10 winning content pieces, top 10 losing content pieces (candidates for refresh or removal), competitive gap analysis against 5 named competitor brands, and next quarter’s content calendar with recipes and ingredient guides queued. According to Ahrefs content marketing research, brands running quarterly content audits outperform brands running annual audits by 40 to 70 percent on organic revenue over a 24-month window.
Internal linking discipline across food brand content
Internal linking discipline across food brand content moves authority from recipe pages toward hero SKU product pages and comparison guides. Every recipe links to the hero SKU it uses inline (once in the ingredient list, once in a bottom call-out card). Every ingredient comparison guide links to 3 to 6 recipes using the winning ingredient plus the hero SKU product page. Every sourcing story links to the 2 to 4 SKUs sourced from that specific farm or cooperative.
Anchor text strategy across recipe hubs
Anchor text on internal links varies across recipe hubs to avoid over-optimization patterns Google penalizes. Exact-match anchor (“single-origin Ethiopian coffee”) runs on 20 to 30 percent of internal links. Partial-match variations (“our Ethiopian roast”) run on 30 to 40 percent. Branded anchors (the SKU name) run on 20 to 30 percent. Generic anchors (“shop the coffee”) fill the remaining 10 to 20 percent. This ratio holds ranking without triggering the over-optimization penalty that shows up on brands that anchor-text-stuff every internal link with the same exact-match keyword. Cross-reference the linking layer on our food and beverage web design page.
Link equity from ingredient guides to SKU pages
Link equity from ingredient guides passes to SKU pages when the guide’s comparison table names the hero SKU in the winning column with a product card, and when the guide’s body links to 3 to 6 recipes that use the winning ingredient. This 3-hop path (guide to recipe to SKU) pushes authority from a high-traffic informational query down to a high-intent transactional page. According to Search Engine Land SEO coverage, informational content that internally links to transactional pages produces 2 to 4 times higher organic revenue than isolated content silos.
Wrapping up content marketing for food brands
Content marketing for food brands is the organic engine that turns a DTC snack, drink, or CPG storefront into a search-driven revenue channel. Recipe hub of 40 to 100 recipes. Ingredient comparison guides at 12 to 24 pieces. Sourcing story pages at 6 to 12 pieces. Buyer intent content at 8 to 16 pieces. Creator syndication calendar with 12 to 30 creators per quarter. Refresh cadence at 12 to 24 months by pillar. Reporting with organic sessions and organic revenue attribution.
If your DTC food brand is running paid social at 20,000 dollars monthly with a broken blog and zero recipe schema, professional content marketing for food brands pays for itself inside the first 90 days on organic traffic captured. Redefine Web ships content marketing inside our monthly retainer packages. Book a call and we will walk through the last three DTC food brands we built recipe hubs for, pillar by pillar.
Content marketing for food brands starts with a recipe hub because recipe queries account for 40 to 60 percent of high-intent search volume in the food category. Every hero SKU needs 4 to 12 recipes anchored to it, each targeting a specific occasion and audience.
Skip the recipe hub and the brand loses the search real estate that pulls DTC storefront traffic month over month at zero incremental paid cost. Recipe traffic converts at 2 to 4 percent because the shopper landed with usage intent, not passive discovery, which is why food brands win on recipes.
Recipe schema and Google rich result eligibility
Every recipe page ships schema.org Recipe markup including cookTime, prepTime, recipeIngredient, recipeInstructions, nutrition, and aggregateRating. Correctly marked-up recipes qualify for Google’s recipe rich result carousel that pulls 3 to 6 times higher click-through rate than a plain blue link. The schema layer takes 15 minutes per recipe to author and 30 minutes to validate in Google Search Console. Cross-reference the recipe search stack on our food and beverage SEO page.
Recipe hub structure that scales
The recipe hub structure runs 40 to 100 recipes at maturity, organized by hero SKU (4 to 12 recipes per SKU) plus occasion tags (breakfast, weeknight dinner, meal prep, brunch, holiday). Every recipe links back to the hero SKU product page with the SKU embedded in an inline card. The hub earns internal linking value from ingredient comparison guides and the sourcing story pages, which feeds recipe ranking on Google. According to Google Search Central recipe structured data guidance, complete Recipe schema markup is required for eligibility in the recipe carousel and the ingredient search filter.
Pillar structure for food brand content marketing
The pillar structure on content marketing for food brands runs 4 content pillars concurrently: recipe hub (40 to 100 recipes), ingredient comparison guides (12 to 24 guides), sourcing story pages (6 to 12 pages), and buyer intent content (where to buy, subscription vs. one-time, gift bundle guides). Every pillar covers a distinct search intent and every pillar links back to the hero SKU product pages.
Ingredient comparison guide format
Ingredient comparison guides run 1,800 to 3,200 words comparing 2 to 4 ingredient types on 6 to 10 attributes with a comparison table, real-world use case examples, and links to the hero SKU that uses the specific ingredient. Example: organic vs. conventional oats compares nutritional profile, sourcing chain, cost, environmental impact, and taste on a 6-column table. The brand’s SKU appears in the winning column with a product card. These guides rank 3 to 8 months after publication and pull steady-state organic traffic.
Sourcing story pages that build trust
Sourcing story pages name the specific farms, cooperatives, or suppliers the brand sources from, with photos of the farms, farmer quotes, and specific harvest windows. A coffee brand’s Ethiopian farm page ranks for “single-origin Ethiopian coffee” and “Yirgacheffe coffee origin” plus 40 long-tail variations. The sourcing page pulls trust-building traffic that converts at 4 to 6 percent because the shopper landed pattern-matching on transparency and named provenance. Every sourcing page includes farmer or cooperative quotes, harvest dates, and a link back to 3 to 5 hero SKU pages that source from the named supplier.
Vejrø hospitality content case study
Vejrø Resort, a Danish private-island destination with an on-site restaurant focused on organic, locally sourced cuisine, joined us with strong social engagement and no organic-search real estate. Guests found the resort on Instagram but never in Google search for terms like “private island resort Denmark,” “farm-to-table hospitality Denmark,” or “Vejrø restaurant.” The same organic-search gap shows up on DTC food brands running paid social at 20,000 dollars monthly with a broken blog and zero recipe schema.
We built the conversion-focused website with on-site and off-site SEO tuned to the travel-niche keyword clusters, competitor analysis against comparable boutique resorts, and mobile-first design prioritizing guest discovery. Every page carried the structured data qualifying it for Google’s rich results in the hospitality category. Every internal link pushed authority toward the direct-booking conversion path.
Three months later, Vejrø hit 10,000 plus organic visitors, ranked for 200 plus first-page keywords, and pulled a 2.2 percent booking conversion rate from organic traffic. The same pattern applies to content marketing for food brands: recipe schema, ingredient comparison guides, and sourcing story pages pull organic traffic at 20 to 40 percent conversion into hero SKU pages inside 6 months when the content quality matches search intent and every page carries the right structured data markup. Vejrø also proved out the reporting discipline: every monthly report named the exact page, the exact keyword cluster, and the exact search feature (rich result, sitelinks, image pack) driving the incremental organic revenue instead of hiding behind aggregate traffic charts.
Recipe cadence and content calendar for food brands
Recipe cadence on a working food brand content calendar ships 2 to 4 new recipes per week during the first 6 months and drops to 1 per week at maturity. Each recipe takes 4 to 6 hours to produce (write, test in the kitchen, photograph, schema author, publish). At 3 recipes per week, the brand hits 78 recipes inside 6 months plus a backlog of ingredient comparison and sourcing content queued behind the recipe production line.
| Content pillar | Target volume year 1 | Production cost per piece | Refresh cadence |
|---|---|---|---|
| Recipe hub | 40 to 100 recipes | $180 to $320 | Every 12 months |
| Ingredient comparison guides | 12 to 24 guides | $450 to $780 | Every 18 months |
| Sourcing story pages | 6 to 12 pages | $680 to $1,200 | Every 24 months |
| Buyer intent content | 8 to 16 pieces | $220 to $420 | Every 12 months |
Photography as a content calendar constraint
Photography is the actual constraint on recipe cadence, not writing. Every recipe needs 6 to 12 photos: hero shot, ingredient flat lay, prep in progress, plated result, storage, and step shots for the schema markup. A working food brand batches photography 8 recipes at a time to keep the cost per recipe under 200 dollars. Skip the batching and the per-recipe cost climbs to 400 to 600 dollars, which caps recipe cadence at 1 per week and slows organic ranking timeline by 6 months.
Seasonal content calendar planning
Seasonal content calendar planning maps recipes and comparison guides to the seasonal windows they need to rank in. A Christmas cookie recipe needs to publish in September to rank by early December. A Valentine’s chocolate guide needs to publish in November to rank by early February. A back-to-school lunchbox recipe needs to publish in June to rank by late August. The 60-to-90-day ranking curve dictates the calendar.
Creator syndication inside food brand content
Creator syndication on food brand content marketing amplifies the recipe hub through Instagram Reels, TikTok, and YouTube Shorts creators paid to post their own version of the brand’s hero recipes. The creator content pulls net-new audiences into the recipe hub through the creator’s Link in Bio or Amazon Storefront tag. The syndication calendar names 12 to 30 creators per quarter with specific recipes assigned to each.
One brand we picked up had a spreadsheet titled “creator outreach 2023” with 47 rows and 3 responses. All 3 responses were auto-replies. The spreadsheet named zero recipes and offered flat rates below 100 dollars per post. Nobody posts a 30-second video for 87 dollars flat. Nobody.
Creator content commercial terms that work
Working creator content commercial terms run 350 to 1,500 dollars flat per post plus a 12 to 25 percent commission on tagged sales across a 30-day window. The commission mechanic pulls creators into follow-up posts because the incremental revenue continues past the initial fee. Mid-tier creators (30k to 150k followers) hit the sweet spot for food brand content because their engagement rate typically runs 4 to 8 percent versus 0.8 to 1.6 percent on mega-creators.
Content brief structure for creator partnerships
The content brief structure for creator partnerships runs a single page: the SKU, the specific recipe or usage occasion, 3 required brand mentions, 3 restricted claims (no health claims on non-medical SKUs), the pricing angle, the affiliate link, and 3 example videos that hit the tone. The brief avoids over-scripting because over-scripted creator content underperforms native creator voice by 40 to 60 percent on engagement rate.
Buyer intent content for food brand blogs
Buyer intent content on food brand blogs covers 8 to 16 pieces targeting explicit purchase-decision queries: “where to buy [brand],” “[brand] subscription vs. one-time,” “best [category] for [use case],” and “[brand] gift bundle.” Every buyer intent piece runs 1,400 to 2,400 words with a comparison table, product cards, and a clear conversion path to the specific SKU that matches the query intent. Buyer intent content converts at 3 to 6 percent versus 1 to 2 percent on recipe content because the shopper landed already planning to buy, not exploring a usage occasion.
Where-to-buy content structure
Where-to-buy content structure covers online (DTC storefront, Amazon, Target.com, Whole Foods online), retail (specific chain locators with the store finder embedded), and international (customs limitations, retailer partners abroad). Every piece names specific retailers, links to the store locator, and includes an FAQ block covering shipping availability, subscription options, and gift card compatibility. Where-to-buy content ranks for branded discovery queries the DTC storefront otherwise loses to competitor affiliate reviews.
Subscription versus one-time comparison content
Subscription versus one-time comparison content converts subscription commitments at 3 to 6 percent because it addresses the price-sensitivity concern head-on with a specific math table. The piece covers the discount structure (15 percent lifetime), the skip-a-month mechanic, the pause-anytime rule, the cancellation policy, and the specific yearly savings for the brand’s average consumption cadence. Cross-reference the retention structure on our food and beverage marketing retainer page.
Content refresh cadence on food brand pillars
Content refresh cadence on food brand content pillars runs a rolling audit every 12 to 24 months by pillar. Recipes get refreshed every 12 months with new photography, updated schema, and any nutrition or ingredient adjustments. Ingredient comparison guides refresh every 18 months to update market data. Sourcing story pages refresh every 24 months to reflect farm partnership changes and new harvest angles. Buyer intent content refreshes every 12 months to update retailer availability and pricing.
Recipe refresh priority order
Recipe refresh priority runs by organic traffic rank. The top 20 recipes by monthly organic sessions get refreshed first (new photography, schema audit, related recipe internal links, updated nutrition). The next 40 get refreshed at 15 months. The remaining recipes get refreshed opportunistically when the ranking slips past position 15 in Google. Skipping the refresh cadence lets recipe rankings drift out of the top 3 inside 18 months as newer competitor recipes take the position.
Schema audit checklist per refresh
The schema audit checklist per refresh runs 8 items: Recipe schema completeness, aggregateRating count and accuracy, nutrition data accuracy, prepTime and cookTime match the recipe body, image URLs valid at CDN, related recipe internal links working, product card SKU URL live, and Google Search Console rich result eligibility validated. This checklist takes 20 minutes per recipe and prevents the schema drift that costs recipe rankings 20 to 40 positions quietly.
Reporting cadence for food brand content marketing
Reporting cadence on food brand content marketing runs a monthly executive report plus a quarterly business review. The monthly report ships in the first business week and covers organic sessions by pillar, top 10 ranking recipes with position trend, ingredient guide ranking movements, sourcing page performance, and organic-attributed DTC revenue. Every number carries a comparison to the prior month and a plain-language interpretation the founder reads in 7 minutes.
Metrics that matter for content marketing
Metrics that matter for food brand content marketing: organic sessions by pillar, recipe rich result impressions in Search Console, organic conversion rate to hero SKU pages, organic-attributed DTC revenue, and top 20 ranking positions by monthly organic sessions. Vanity metrics that do not matter: total pageviews without conversion context, average time on page without conversion attribution, and social share counts. The monthly report skips the vanity block entirely.
Quarterly business review structure
The quarterly business review runs 90 minutes with the founder, head of content, and SEO lead. Agenda: organic traffic trend by pillar, top 10 winning content pieces, top 10 losing content pieces (candidates for refresh or removal), competitive gap analysis against 5 named competitor brands, and next quarter’s content calendar with recipes and ingredient guides queued. According to Ahrefs content marketing research, brands running quarterly content audits outperform brands running annual audits by 40 to 70 percent on organic revenue over a 24-month window.
Internal linking discipline across food brand content
Internal linking discipline across food brand content moves authority from recipe pages toward hero SKU product pages and comparison guides. Every recipe links to the hero SKU it uses inline (once in the ingredient list, once in a bottom call-out card). Every ingredient comparison guide links to 3 to 6 recipes using the winning ingredient plus the hero SKU product page. Every sourcing story links to the 2 to 4 SKUs sourced from that specific farm or cooperative.
Anchor text strategy across recipe hubs
Anchor text on internal links varies across recipe hubs to avoid over-optimization patterns Google penalizes. Exact-match anchor (“single-origin Ethiopian coffee”) runs on 20 to 30 percent of internal links. Partial-match variations (“our Ethiopian roast”) run on 30 to 40 percent. Branded anchors (the SKU name) run on 20 to 30 percent. Generic anchors (“shop the coffee”) fill the remaining 10 to 20 percent. This ratio holds ranking without triggering the over-optimization penalty that shows up on brands that anchor-text-stuff every internal link with the same exact-match keyword. Cross-reference the linking layer on our food and beverage web design page.
Link equity from ingredient guides to SKU pages
Link equity from ingredient guides passes to SKU pages when the guide’s comparison table names the hero SKU in the winning column with a product card, and when the guide’s body links to 3 to 6 recipes that use the winning ingredient. This 3-hop path (guide to recipe to SKU) pushes authority from a high-traffic informational query down to a high-intent transactional page. According to Search Engine Land SEO coverage, informational content that internally links to transactional pages produces 2 to 4 times higher organic revenue than isolated content silos.
Wrapping up content marketing for food brands
Content marketing for food brands is the organic engine that turns a DTC snack, drink, or CPG storefront into a search-driven revenue channel. Recipe hub of 40 to 100 recipes. Ingredient comparison guides at 12 to 24 pieces. Sourcing story pages at 6 to 12 pieces. Buyer intent content at 8 to 16 pieces. Creator syndication calendar with 12 to 30 creators per quarter. Refresh cadence at 12 to 24 months by pillar. Reporting with organic sessions and organic revenue attribution.
If your DTC food brand is running paid social at 20,000 dollars monthly with a broken blog and zero recipe schema, professional content marketing for food brands pays for itself inside the first 90 days on organic traffic captured. Redefine Web ships content marketing inside our monthly retainer packages. Book a call and we will walk through the last three DTC food brands we built recipe hubs for, pillar by pillar.
Anchor text on internal links varies across recipe hubs to avoid over-optimization patterns Google penalizes. Exact-match anchor (“single-origin Ethiopian coffee”) runs on 20 to 30 percent of internal links. Partial-match variations (“our Ethiopian roast”) run on 30 to 40 percent. Branded anchors (the SKU name) run on 20 to 30 percent. Generic anchors (“shop the coffee”) fill the remaining 10 to 20 percent. This ratio holds ranking without triggering the over-optimization penalty that shows up on brands that anchor-text-stuff every internal link with the same exact-match keyword. Cross-reference the linking layer on our food and beverage web design page.
Link equity from ingredient guides to SKU pages
Link equity from ingredient guides passes to SKU pages when the guide’s comparison table names the hero SKU in the winning column with a product card, and when the guide’s body links to 3 to 6 recipes that use the winning ingredient. This 3-hop path (guide to recipe to SKU) pushes authority from a high-traffic informational query down to a high-intent transactional page. According to Search Engine Land SEO coverage, informational content that internally links to transactional pages produces 2 to 4 times higher organic revenue than isolated content silos.
Wrapping up content marketing for food brands
Content marketing for food brands is the organic engine that turns a DTC snack, drink, or CPG storefront into a search-driven revenue channel. Recipe hub of 40 to 100 recipes. Ingredient comparison guides at 12 to 24 pieces. Sourcing story pages at 6 to 12 pieces. Buyer intent content at 8 to 16 pieces. Creator syndication calendar with 12 to 30 creators per quarter. Refresh cadence at 12 to 24 months by pillar. Reporting with organic sessions and organic revenue attribution.
If your DTC food brand is running paid social at 20,000 dollars monthly with a broken blog and zero recipe schema, professional content marketing for food brands pays for itself inside the first 90 days on organic traffic captured. Redefine Web ships content marketing inside our monthly retainer packages. Book a call and we will walk through the last three DTC food brands we built recipe hubs for, pillar by pillar.
Content marketing for food brands starts with a recipe hub because recipe queries account for 40 to 60 percent of high-intent search volume in the food category. Every hero SKU needs 4 to 12 recipes anchored to it, each targeting a specific occasion and audience.
Skip the recipe hub and the brand loses the search real estate that pulls DTC storefront traffic month over month at zero incremental paid cost. Recipe traffic converts at 2 to 4 percent because the shopper landed with usage intent, not passive discovery, which is why food brands win on recipes.
Recipe schema and Google rich result eligibility
Every recipe page ships schema.org Recipe markup including cookTime, prepTime, recipeIngredient, recipeInstructions, nutrition, and aggregateRating. Correctly marked-up recipes qualify for Google’s recipe rich result carousel that pulls 3 to 6 times higher click-through rate than a plain blue link. The schema layer takes 15 minutes per recipe to author and 30 minutes to validate in Google Search Console. Cross-reference the recipe search stack on our food and beverage SEO page.
Recipe hub structure that scales
The recipe hub structure runs 40 to 100 recipes at maturity, organized by hero SKU (4 to 12 recipes per SKU) plus occasion tags (breakfast, weeknight dinner, meal prep, brunch, holiday). Every recipe links back to the hero SKU product page with the SKU embedded in an inline card. The hub earns internal linking value from ingredient comparison guides and the sourcing story pages, which feeds recipe ranking on Google. According to Google Search Central recipe structured data guidance, complete Recipe schema markup is required for eligibility in the recipe carousel and the ingredient search filter.
Pillar structure for food brand content marketing
The pillar structure on content marketing for food brands runs 4 content pillars concurrently: recipe hub (40 to 100 recipes), ingredient comparison guides (12 to 24 guides), sourcing story pages (6 to 12 pages), and buyer intent content (where to buy, subscription vs. one-time, gift bundle guides). Every pillar covers a distinct search intent and every pillar links back to the hero SKU product pages.
Ingredient comparison guide format
Ingredient comparison guides run 1,800 to 3,200 words comparing 2 to 4 ingredient types on 6 to 10 attributes with a comparison table, real-world use case examples, and links to the hero SKU that uses the specific ingredient. Example: organic vs. conventional oats compares nutritional profile, sourcing chain, cost, environmental impact, and taste on a 6-column table. The brand’s SKU appears in the winning column with a product card. These guides rank 3 to 8 months after publication and pull steady-state organic traffic.
Sourcing story pages that build trust
Sourcing story pages name the specific farms, cooperatives, or suppliers the brand sources from, with photos of the farms, farmer quotes, and specific harvest windows. A coffee brand’s Ethiopian farm page ranks for “single-origin Ethiopian coffee” and “Yirgacheffe coffee origin” plus 40 long-tail variations. The sourcing page pulls trust-building traffic that converts at 4 to 6 percent because the shopper landed pattern-matching on transparency and named provenance. Every sourcing page includes farmer or cooperative quotes, harvest dates, and a link back to 3 to 5 hero SKU pages that source from the named supplier.
Vejrø hospitality content case study
Vejrø Resort, a Danish private-island destination with an on-site restaurant focused on organic, locally sourced cuisine, joined us with strong social engagement and no organic-search real estate. Guests found the resort on Instagram but never in Google search for terms like “private island resort Denmark,” “farm-to-table hospitality Denmark,” or “Vejrø restaurant.” The same organic-search gap shows up on DTC food brands running paid social at 20,000 dollars monthly with a broken blog and zero recipe schema.
We built the conversion-focused website with on-site and off-site SEO tuned to the travel-niche keyword clusters, competitor analysis against comparable boutique resorts, and mobile-first design prioritizing guest discovery. Every page carried the structured data qualifying it for Google’s rich results in the hospitality category. Every internal link pushed authority toward the direct-booking conversion path.
Three months later, Vejrø hit 10,000 plus organic visitors, ranked for 200 plus first-page keywords, and pulled a 2.2 percent booking conversion rate from organic traffic. The same pattern applies to content marketing for food brands: recipe schema, ingredient comparison guides, and sourcing story pages pull organic traffic at 20 to 40 percent conversion into hero SKU pages inside 6 months when the content quality matches search intent and every page carries the right structured data markup. Vejrø also proved out the reporting discipline: every monthly report named the exact page, the exact keyword cluster, and the exact search feature (rich result, sitelinks, image pack) driving the incremental organic revenue instead of hiding behind aggregate traffic charts.
Recipe cadence and content calendar for food brands
Recipe cadence on a working food brand content calendar ships 2 to 4 new recipes per week during the first 6 months and drops to 1 per week at maturity. Each recipe takes 4 to 6 hours to produce (write, test in the kitchen, photograph, schema author, publish). At 3 recipes per week, the brand hits 78 recipes inside 6 months plus a backlog of ingredient comparison and sourcing content queued behind the recipe production line.
| Content pillar | Target volume year 1 | Production cost per piece | Refresh cadence |
|---|---|---|---|
| Recipe hub | 40 to 100 recipes | $180 to $320 | Every 12 months |
| Ingredient comparison guides | 12 to 24 guides | $450 to $780 | Every 18 months |
| Sourcing story pages | 6 to 12 pages | $680 to $1,200 | Every 24 months |
| Buyer intent content | 8 to 16 pieces | $220 to $420 | Every 12 months |
Photography as a content calendar constraint
Photography is the actual constraint on recipe cadence, not writing. Every recipe needs 6 to 12 photos: hero shot, ingredient flat lay, prep in progress, plated result, storage, and step shots for the schema markup. A working food brand batches photography 8 recipes at a time to keep the cost per recipe under 200 dollars. Skip the batching and the per-recipe cost climbs to 400 to 600 dollars, which caps recipe cadence at 1 per week and slows organic ranking timeline by 6 months.
Seasonal content calendar planning
Seasonal content calendar planning maps recipes and comparison guides to the seasonal windows they need to rank in. A Christmas cookie recipe needs to publish in September to rank by early December. A Valentine’s chocolate guide needs to publish in November to rank by early February. A back-to-school lunchbox recipe needs to publish in June to rank by late August. The 60-to-90-day ranking curve dictates the calendar.
Creator syndication inside food brand content
Creator syndication on food brand content marketing amplifies the recipe hub through Instagram Reels, TikTok, and YouTube Shorts creators paid to post their own version of the brand’s hero recipes. The creator content pulls net-new audiences into the recipe hub through the creator’s Link in Bio or Amazon Storefront tag. The syndication calendar names 12 to 30 creators per quarter with specific recipes assigned to each.
One brand we picked up had a spreadsheet titled “creator outreach 2023” with 47 rows and 3 responses. All 3 responses were auto-replies. The spreadsheet named zero recipes and offered flat rates below 100 dollars per post. Nobody posts a 30-second video for 87 dollars flat. Nobody.
Creator content commercial terms that work
Working creator content commercial terms run 350 to 1,500 dollars flat per post plus a 12 to 25 percent commission on tagged sales across a 30-day window. The commission mechanic pulls creators into follow-up posts because the incremental revenue continues past the initial fee. Mid-tier creators (30k to 150k followers) hit the sweet spot for food brand content because their engagement rate typically runs 4 to 8 percent versus 0.8 to 1.6 percent on mega-creators.
Content brief structure for creator partnerships
The content brief structure for creator partnerships runs a single page: the SKU, the specific recipe or usage occasion, 3 required brand mentions, 3 restricted claims (no health claims on non-medical SKUs), the pricing angle, the affiliate link, and 3 example videos that hit the tone. The brief avoids over-scripting because over-scripted creator content underperforms native creator voice by 40 to 60 percent on engagement rate.
Buyer intent content for food brand blogs
Buyer intent content on food brand blogs covers 8 to 16 pieces targeting explicit purchase-decision queries: “where to buy [brand],” “[brand] subscription vs. one-time,” “best [category] for [use case],” and “[brand] gift bundle.” Every buyer intent piece runs 1,400 to 2,400 words with a comparison table, product cards, and a clear conversion path to the specific SKU that matches the query intent. Buyer intent content converts at 3 to 6 percent versus 1 to 2 percent on recipe content because the shopper landed already planning to buy, not exploring a usage occasion.
Where-to-buy content structure
Where-to-buy content structure covers online (DTC storefront, Amazon, Target.com, Whole Foods online), retail (specific chain locators with the store finder embedded), and international (customs limitations, retailer partners abroad). Every piece names specific retailers, links to the store locator, and includes an FAQ block covering shipping availability, subscription options, and gift card compatibility. Where-to-buy content ranks for branded discovery queries the DTC storefront otherwise loses to competitor affiliate reviews.
Subscription versus one-time comparison content
Subscription versus one-time comparison content converts subscription commitments at 3 to 6 percent because it addresses the price-sensitivity concern head-on with a specific math table. The piece covers the discount structure (15 percent lifetime), the skip-a-month mechanic, the pause-anytime rule, the cancellation policy, and the specific yearly savings for the brand’s average consumption cadence. Cross-reference the retention structure on our food and beverage marketing retainer page.
Content refresh cadence on food brand pillars
Content refresh cadence on food brand content pillars runs a rolling audit every 12 to 24 months by pillar. Recipes get refreshed every 12 months with new photography, updated schema, and any nutrition or ingredient adjustments. Ingredient comparison guides refresh every 18 months to update market data. Sourcing story pages refresh every 24 months to reflect farm partnership changes and new harvest angles. Buyer intent content refreshes every 12 months to update retailer availability and pricing.
Recipe refresh priority order
Recipe refresh priority runs by organic traffic rank. The top 20 recipes by monthly organic sessions get refreshed first (new photography, schema audit, related recipe internal links, updated nutrition). The next 40 get refreshed at 15 months. The remaining recipes get refreshed opportunistically when the ranking slips past position 15 in Google. Skipping the refresh cadence lets recipe rankings drift out of the top 3 inside 18 months as newer competitor recipes take the position.
Schema audit checklist per refresh
The schema audit checklist per refresh runs 8 items: Recipe schema completeness, aggregateRating count and accuracy, nutrition data accuracy, prepTime and cookTime match the recipe body, image URLs valid at CDN, related recipe internal links working, product card SKU URL live, and Google Search Console rich result eligibility validated. This checklist takes 20 minutes per recipe and prevents the schema drift that costs recipe rankings 20 to 40 positions quietly.
Reporting cadence for food brand content marketing
Reporting cadence on food brand content marketing runs a monthly executive report plus a quarterly business review. The monthly report ships in the first business week and covers organic sessions by pillar, top 10 ranking recipes with position trend, ingredient guide ranking movements, sourcing page performance, and organic-attributed DTC revenue. Every number carries a comparison to the prior month and a plain-language interpretation the founder reads in 7 minutes.
Metrics that matter for content marketing
Metrics that matter for food brand content marketing: organic sessions by pillar, recipe rich result impressions in Search Console, organic conversion rate to hero SKU pages, organic-attributed DTC revenue, and top 20 ranking positions by monthly organic sessions. Vanity metrics that do not matter: total pageviews without conversion context, average time on page without conversion attribution, and social share counts. The monthly report skips the vanity block entirely.
Quarterly business review structure
The quarterly business review runs 90 minutes with the founder, head of content, and SEO lead. Agenda: organic traffic trend by pillar, top 10 winning content pieces, top 10 losing content pieces (candidates for refresh or removal), competitive gap analysis against 5 named competitor brands, and next quarter’s content calendar with recipes and ingredient guides queued. According to Ahrefs content marketing research, brands running quarterly content audits outperform brands running annual audits by 40 to 70 percent on organic revenue over a 24-month window.
Internal linking discipline across food brand content
Internal linking discipline across food brand content moves authority from recipe pages toward hero SKU product pages and comparison guides. Every recipe links to the hero SKU it uses inline (once in the ingredient list, once in a bottom call-out card). Every ingredient comparison guide links to 3 to 6 recipes using the winning ingredient plus the hero SKU product page. Every sourcing story links to the 2 to 4 SKUs sourced from that specific farm or cooperative.
Anchor text strategy across recipe hubs
Anchor text on internal links varies across recipe hubs to avoid over-optimization patterns Google penalizes. Exact-match anchor (“single-origin Ethiopian coffee”) runs on 20 to 30 percent of internal links. Partial-match variations (“our Ethiopian roast”) run on 30 to 40 percent. Branded anchors (the SKU name) run on 20 to 30 percent. Generic anchors (“shop the coffee”) fill the remaining 10 to 20 percent. This ratio holds ranking without triggering the over-optimization penalty that shows up on brands that anchor-text-stuff every internal link with the same exact-match keyword. Cross-reference the linking layer on our food and beverage web design page.
Link equity from ingredient guides to SKU pages
Link equity from ingredient guides passes to SKU pages when the guide’s comparison table names the hero SKU in the winning column with a product card, and when the guide’s body links to 3 to 6 recipes that use the winning ingredient. This 3-hop path (guide to recipe to SKU) pushes authority from a high-traffic informational query down to a high-intent transactional page. According to Search Engine Land SEO coverage, informational content that internally links to transactional pages produces 2 to 4 times higher organic revenue than isolated content silos.
Wrapping up content marketing for food brands
Content marketing for food brands is the organic engine that turns a DTC snack, drink, or CPG storefront into a search-driven revenue channel. Recipe hub of 40 to 100 recipes. Ingredient comparison guides at 12 to 24 pieces. Sourcing story pages at 6 to 12 pieces. Buyer intent content at 8 to 16 pieces. Creator syndication calendar with 12 to 30 creators per quarter. Refresh cadence at 12 to 24 months by pillar. Reporting with organic sessions and organic revenue attribution.
If your DTC food brand is running paid social at 20,000 dollars monthly with a broken blog and zero recipe schema, professional content marketing for food brands pays for itself inside the first 90 days on organic traffic captured. Redefine Web ships content marketing inside our monthly retainer packages. Book a call and we will walk through the last three DTC food brands we built recipe hubs for, pillar by pillar.
Content marketing for food brands starts with a recipe hub because recipe queries account for 40 to 60 percent of high-intent search volume in the food category. Every hero SKU needs 4 to 12 recipes anchored to it, each targeting a specific occasion and audience.
Skip the recipe hub and the brand loses the search real estate that pulls DTC storefront traffic month over month at zero incremental paid cost. Recipe traffic converts at 2 to 4 percent because the shopper landed with usage intent, not passive discovery, which is why food brands win on recipes.
Recipe schema and Google rich result eligibility
Every recipe page ships schema.org Recipe markup including cookTime, prepTime, recipeIngredient, recipeInstructions, nutrition, and aggregateRating. Correctly marked-up recipes qualify for Google’s recipe rich result carousel that pulls 3 to 6 times higher click-through rate than a plain blue link. The schema layer takes 15 minutes per recipe to author and 30 minutes to validate in Google Search Console. Cross-reference the recipe search stack on our food and beverage SEO page.
Recipe hub structure that scales
The recipe hub structure runs 40 to 100 recipes at maturity, organized by hero SKU (4 to 12 recipes per SKU) plus occasion tags (breakfast, weeknight dinner, meal prep, brunch, holiday). Every recipe links back to the hero SKU product page with the SKU embedded in an inline card. The hub earns internal linking value from ingredient comparison guides and the sourcing story pages, which feeds recipe ranking on Google. According to Google Search Central recipe structured data guidance, complete Recipe schema markup is required for eligibility in the recipe carousel and the ingredient search filter.
Pillar structure for food brand content marketing
The pillar structure on content marketing for food brands runs 4 content pillars concurrently: recipe hub (40 to 100 recipes), ingredient comparison guides (12 to 24 guides), sourcing story pages (6 to 12 pages), and buyer intent content (where to buy, subscription vs. one-time, gift bundle guides). Every pillar covers a distinct search intent and every pillar links back to the hero SKU product pages.
Ingredient comparison guide format
Ingredient comparison guides run 1,800 to 3,200 words comparing 2 to 4 ingredient types on 6 to 10 attributes with a comparison table, real-world use case examples, and links to the hero SKU that uses the specific ingredient. Example: organic vs. conventional oats compares nutritional profile, sourcing chain, cost, environmental impact, and taste on a 6-column table. The brand’s SKU appears in the winning column with a product card. These guides rank 3 to 8 months after publication and pull steady-state organic traffic.
Sourcing story pages that build trust
Sourcing story pages name the specific farms, cooperatives, or suppliers the brand sources from, with photos of the farms, farmer quotes, and specific harvest windows. A coffee brand’s Ethiopian farm page ranks for “single-origin Ethiopian coffee” and “Yirgacheffe coffee origin” plus 40 long-tail variations. The sourcing page pulls trust-building traffic that converts at 4 to 6 percent because the shopper landed pattern-matching on transparency and named provenance. Every sourcing page includes farmer or cooperative quotes, harvest dates, and a link back to 3 to 5 hero SKU pages that source from the named supplier.
Vejrø hospitality content case study
Vejrø Resort, a Danish private-island destination with an on-site restaurant focused on organic, locally sourced cuisine, joined us with strong social engagement and no organic-search real estate. Guests found the resort on Instagram but never in Google search for terms like “private island resort Denmark,” “farm-to-table hospitality Denmark,” or “Vejrø restaurant.” The same organic-search gap shows up on DTC food brands running paid social at 20,000 dollars monthly with a broken blog and zero recipe schema.
We built the conversion-focused website with on-site and off-site SEO tuned to the travel-niche keyword clusters, competitor analysis against comparable boutique resorts, and mobile-first design prioritizing guest discovery. Every page carried the structured data qualifying it for Google’s rich results in the hospitality category. Every internal link pushed authority toward the direct-booking conversion path.
Three months later, Vejrø hit 10,000 plus organic visitors, ranked for 200 plus first-page keywords, and pulled a 2.2 percent booking conversion rate from organic traffic. The same pattern applies to content marketing for food brands: recipe schema, ingredient comparison guides, and sourcing story pages pull organic traffic at 20 to 40 percent conversion into hero SKU pages inside 6 months when the content quality matches search intent and every page carries the right structured data markup. Vejrø also proved out the reporting discipline: every monthly report named the exact page, the exact keyword cluster, and the exact search feature (rich result, sitelinks, image pack) driving the incremental organic revenue instead of hiding behind aggregate traffic charts.
Recipe cadence and content calendar for food brands
Recipe cadence on a working food brand content calendar ships 2 to 4 new recipes per week during the first 6 months and drops to 1 per week at maturity. Each recipe takes 4 to 6 hours to produce (write, test in the kitchen, photograph, schema author, publish). At 3 recipes per week, the brand hits 78 recipes inside 6 months plus a backlog of ingredient comparison and sourcing content queued behind the recipe production line.
| Content pillar | Target volume year 1 | Production cost per piece | Refresh cadence |
|---|---|---|---|
| Recipe hub | 40 to 100 recipes | $180 to $320 | Every 12 months |
| Ingredient comparison guides | 12 to 24 guides | $450 to $780 | Every 18 months |
| Sourcing story pages | 6 to 12 pages | $680 to $1,200 | Every 24 months |
| Buyer intent content | 8 to 16 pieces | $220 to $420 | Every 12 months |
Photography as a content calendar constraint
Photography is the actual constraint on recipe cadence, not writing. Every recipe needs 6 to 12 photos: hero shot, ingredient flat lay, prep in progress, plated result, storage, and step shots for the schema markup. A working food brand batches photography 8 recipes at a time to keep the cost per recipe under 200 dollars. Skip the batching and the per-recipe cost climbs to 400 to 600 dollars, which caps recipe cadence at 1 per week and slows organic ranking timeline by 6 months.
Seasonal content calendar planning
Seasonal content calendar planning maps recipes and comparison guides to the seasonal windows they need to rank in. A Christmas cookie recipe needs to publish in September to rank by early December. A Valentine’s chocolate guide needs to publish in November to rank by early February. A back-to-school lunchbox recipe needs to publish in June to rank by late August. The 60-to-90-day ranking curve dictates the calendar.
Creator syndication inside food brand content
Creator syndication on food brand content marketing amplifies the recipe hub through Instagram Reels, TikTok, and YouTube Shorts creators paid to post their own version of the brand’s hero recipes. The creator content pulls net-new audiences into the recipe hub through the creator’s Link in Bio or Amazon Storefront tag. The syndication calendar names 12 to 30 creators per quarter with specific recipes assigned to each.
One brand we picked up had a spreadsheet titled “creator outreach 2023” with 47 rows and 3 responses. All 3 responses were auto-replies. The spreadsheet named zero recipes and offered flat rates below 100 dollars per post. Nobody posts a 30-second video for 87 dollars flat. Nobody.
Creator content commercial terms that work
Working creator content commercial terms run 350 to 1,500 dollars flat per post plus a 12 to 25 percent commission on tagged sales across a 30-day window. The commission mechanic pulls creators into follow-up posts because the incremental revenue continues past the initial fee. Mid-tier creators (30k to 150k followers) hit the sweet spot for food brand content because their engagement rate typically runs 4 to 8 percent versus 0.8 to 1.6 percent on mega-creators.
Content brief structure for creator partnerships
The content brief structure for creator partnerships runs a single page: the SKU, the specific recipe or usage occasion, 3 required brand mentions, 3 restricted claims (no health claims on non-medical SKUs), the pricing angle, the affiliate link, and 3 example videos that hit the tone. The brief avoids over-scripting because over-scripted creator content underperforms native creator voice by 40 to 60 percent on engagement rate.
Buyer intent content for food brand blogs
Buyer intent content on food brand blogs covers 8 to 16 pieces targeting explicit purchase-decision queries: “where to buy [brand],” “[brand] subscription vs. one-time,” “best [category] for [use case],” and “[brand] gift bundle.” Every buyer intent piece runs 1,400 to 2,400 words with a comparison table, product cards, and a clear conversion path to the specific SKU that matches the query intent. Buyer intent content converts at 3 to 6 percent versus 1 to 2 percent on recipe content because the shopper landed already planning to buy, not exploring a usage occasion.
Where-to-buy content structure
Where-to-buy content structure covers online (DTC storefront, Amazon, Target.com, Whole Foods online), retail (specific chain locators with the store finder embedded), and international (customs limitations, retailer partners abroad). Every piece names specific retailers, links to the store locator, and includes an FAQ block covering shipping availability, subscription options, and gift card compatibility. Where-to-buy content ranks for branded discovery queries the DTC storefront otherwise loses to competitor affiliate reviews.
Subscription versus one-time comparison content
Subscription versus one-time comparison content converts subscription commitments at 3 to 6 percent because it addresses the price-sensitivity concern head-on with a specific math table. The piece covers the discount structure (15 percent lifetime), the skip-a-month mechanic, the pause-anytime rule, the cancellation policy, and the specific yearly savings for the brand’s average consumption cadence. Cross-reference the retention structure on our food and beverage marketing retainer page.
Content refresh cadence on food brand pillars
Content refresh cadence on food brand content pillars runs a rolling audit every 12 to 24 months by pillar. Recipes get refreshed every 12 months with new photography, updated schema, and any nutrition or ingredient adjustments. Ingredient comparison guides refresh every 18 months to update market data. Sourcing story pages refresh every 24 months to reflect farm partnership changes and new harvest angles. Buyer intent content refreshes every 12 months to update retailer availability and pricing.
Recipe refresh priority order
Recipe refresh priority runs by organic traffic rank. The top 20 recipes by monthly organic sessions get refreshed first (new photography, schema audit, related recipe internal links, updated nutrition). The next 40 get refreshed at 15 months. The remaining recipes get refreshed opportunistically when the ranking slips past position 15 in Google. Skipping the refresh cadence lets recipe rankings drift out of the top 3 inside 18 months as newer competitor recipes take the position.
Schema audit checklist per refresh
The schema audit checklist per refresh runs 8 items: Recipe schema completeness, aggregateRating count and accuracy, nutrition data accuracy, prepTime and cookTime match the recipe body, image URLs valid at CDN, related recipe internal links working, product card SKU URL live, and Google Search Console rich result eligibility validated. This checklist takes 20 minutes per recipe and prevents the schema drift that costs recipe rankings 20 to 40 positions quietly.
Reporting cadence for food brand content marketing
Reporting cadence on food brand content marketing runs a monthly executive report plus a quarterly business review. The monthly report ships in the first business week and covers organic sessions by pillar, top 10 ranking recipes with position trend, ingredient guide ranking movements, sourcing page performance, and organic-attributed DTC revenue. Every number carries a comparison to the prior month and a plain-language interpretation the founder reads in 7 minutes.
Metrics that matter for content marketing
Metrics that matter for food brand content marketing: organic sessions by pillar, recipe rich result impressions in Search Console, organic conversion rate to hero SKU pages, organic-attributed DTC revenue, and top 20 ranking positions by monthly organic sessions. Vanity metrics that do not matter: total pageviews without conversion context, average time on page without conversion attribution, and social share counts. The monthly report skips the vanity block entirely.
Quarterly business review structure
The quarterly business review runs 90 minutes with the founder, head of content, and SEO lead. Agenda: organic traffic trend by pillar, top 10 winning content pieces, top 10 losing content pieces (candidates for refresh or removal), competitive gap analysis against 5 named competitor brands, and next quarter’s content calendar with recipes and ingredient guides queued. According to Ahrefs content marketing research, brands running quarterly content audits outperform brands running annual audits by 40 to 70 percent on organic revenue over a 24-month window.
Internal linking discipline across food brand content
Internal linking discipline across food brand content moves authority from recipe pages toward hero SKU product pages and comparison guides. Every recipe links to the hero SKU it uses inline (once in the ingredient list, once in a bottom call-out card). Every ingredient comparison guide links to 3 to 6 recipes using the winning ingredient plus the hero SKU product page. Every sourcing story links to the 2 to 4 SKUs sourced from that specific farm or cooperative.
Anchor text strategy across recipe hubs
Anchor text on internal links varies across recipe hubs to avoid over-optimization patterns Google penalizes. Exact-match anchor (“single-origin Ethiopian coffee”) runs on 20 to 30 percent of internal links. Partial-match variations (“our Ethiopian roast”) run on 30 to 40 percent. Branded anchors (the SKU name) run on 20 to 30 percent. Generic anchors (“shop the coffee”) fill the remaining 10 to 20 percent. This ratio holds ranking without triggering the over-optimization penalty that shows up on brands that anchor-text-stuff every internal link with the same exact-match keyword. Cross-reference the linking layer on our food and beverage web design page.
Link equity from ingredient guides to SKU pages
Link equity from ingredient guides passes to SKU pages when the guide’s comparison table names the hero SKU in the winning column with a product card, and when the guide’s body links to 3 to 6 recipes that use the winning ingredient. This 3-hop path (guide to recipe to SKU) pushes authority from a high-traffic informational query down to a high-intent transactional page. According to Search Engine Land SEO coverage, informational content that internally links to transactional pages produces 2 to 4 times higher organic revenue than isolated content silos.
Wrapping up content marketing for food brands
Content marketing for food brands is the organic engine that turns a DTC snack, drink, or CPG storefront into a search-driven revenue channel. Recipe hub of 40 to 100 recipes. Ingredient comparison guides at 12 to 24 pieces. Sourcing story pages at 6 to 12 pieces. Buyer intent content at 8 to 16 pieces. Creator syndication calendar with 12 to 30 creators per quarter. Refresh cadence at 12 to 24 months by pillar. Reporting with organic sessions and organic revenue attribution.
If your DTC food brand is running paid social at 20,000 dollars monthly with a broken blog and zero recipe schema, professional content marketing for food brands pays for itself inside the first 90 days on organic traffic captured. Redefine Web ships content marketing inside our monthly retainer packages. Book a call and we will walk through the last three DTC food brands we built recipe hubs for, pillar by pillar.
Internal linking discipline across food brand content moves authority from recipe pages toward hero SKU product pages and comparison guides. Every recipe links to the hero SKU it uses inline (once in the ingredient list, once in a bottom call-out card). Every ingredient comparison guide links to 3 to 6 recipes using the winning ingredient plus the hero SKU product page. Every sourcing story links to the 2 to 4 SKUs sourced from that specific farm or cooperative.
Anchor text strategy across recipe hubs
Anchor text on internal links varies across recipe hubs to avoid over-optimization patterns Google penalizes. Exact-match anchor (“single-origin Ethiopian coffee”) runs on 20 to 30 percent of internal links. Partial-match variations (“our Ethiopian roast”) run on 30 to 40 percent. Branded anchors (the SKU name) run on 20 to 30 percent. Generic anchors (“shop the coffee”) fill the remaining 10 to 20 percent. This ratio holds ranking without triggering the over-optimization penalty that shows up on brands that anchor-text-stuff every internal link with the same exact-match keyword. Cross-reference the linking layer on our food and beverage web design page.
Link equity from ingredient guides to SKU pages
Link equity from ingredient guides passes to SKU pages when the guide’s comparison table names the hero SKU in the winning column with a product card, and when the guide’s body links to 3 to 6 recipes that use the winning ingredient. This 3-hop path (guide to recipe to SKU) pushes authority from a high-traffic informational query down to a high-intent transactional page. According to Search Engine Land SEO coverage, informational content that internally links to transactional pages produces 2 to 4 times higher organic revenue than isolated content silos.
Wrapping up content marketing for food brands
Content marketing for food brands is the organic engine that turns a DTC snack, drink, or CPG storefront into a search-driven revenue channel. Recipe hub of 40 to 100 recipes. Ingredient comparison guides at 12 to 24 pieces. Sourcing story pages at 6 to 12 pieces. Buyer intent content at 8 to 16 pieces. Creator syndication calendar with 12 to 30 creators per quarter. Refresh cadence at 12 to 24 months by pillar. Reporting with organic sessions and organic revenue attribution.
If your DTC food brand is running paid social at 20,000 dollars monthly with a broken blog and zero recipe schema, professional content marketing for food brands pays for itself inside the first 90 days on organic traffic captured. Redefine Web ships content marketing inside our monthly retainer packages. Book a call and we will walk through the last three DTC food brands we built recipe hubs for, pillar by pillar.
Content marketing for food brands starts with a recipe hub because recipe queries account for 40 to 60 percent of high-intent search volume in the food category. Every hero SKU needs 4 to 12 recipes anchored to it, each targeting a specific occasion and audience.
Skip the recipe hub and the brand loses the search real estate that pulls DTC storefront traffic month over month at zero incremental paid cost. Recipe traffic converts at 2 to 4 percent because the shopper landed with usage intent, not passive discovery, which is why food brands win on recipes.
Recipe schema and Google rich result eligibility
Every recipe page ships schema.org Recipe markup including cookTime, prepTime, recipeIngredient, recipeInstructions, nutrition, and aggregateRating. Correctly marked-up recipes qualify for Google’s recipe rich result carousel that pulls 3 to 6 times higher click-through rate than a plain blue link. The schema layer takes 15 minutes per recipe to author and 30 minutes to validate in Google Search Console. Cross-reference the recipe search stack on our food and beverage SEO page.
Recipe hub structure that scales
The recipe hub structure runs 40 to 100 recipes at maturity, organized by hero SKU (4 to 12 recipes per SKU) plus occasion tags (breakfast, weeknight dinner, meal prep, brunch, holiday). Every recipe links back to the hero SKU product page with the SKU embedded in an inline card. The hub earns internal linking value from ingredient comparison guides and the sourcing story pages, which feeds recipe ranking on Google. According to Google Search Central recipe structured data guidance, complete Recipe schema markup is required for eligibility in the recipe carousel and the ingredient search filter.
Pillar structure for food brand content marketing
The pillar structure on content marketing for food brands runs 4 content pillars concurrently: recipe hub (40 to 100 recipes), ingredient comparison guides (12 to 24 guides), sourcing story pages (6 to 12 pages), and buyer intent content (where to buy, subscription vs. one-time, gift bundle guides). Every pillar covers a distinct search intent and every pillar links back to the hero SKU product pages.
Ingredient comparison guide format
Ingredient comparison guides run 1,800 to 3,200 words comparing 2 to 4 ingredient types on 6 to 10 attributes with a comparison table, real-world use case examples, and links to the hero SKU that uses the specific ingredient. Example: organic vs. conventional oats compares nutritional profile, sourcing chain, cost, environmental impact, and taste on a 6-column table. The brand’s SKU appears in the winning column with a product card. These guides rank 3 to 8 months after publication and pull steady-state organic traffic.
Sourcing story pages that build trust
Sourcing story pages name the specific farms, cooperatives, or suppliers the brand sources from, with photos of the farms, farmer quotes, and specific harvest windows. A coffee brand’s Ethiopian farm page ranks for “single-origin Ethiopian coffee” and “Yirgacheffe coffee origin” plus 40 long-tail variations. The sourcing page pulls trust-building traffic that converts at 4 to 6 percent because the shopper landed pattern-matching on transparency and named provenance. Every sourcing page includes farmer or cooperative quotes, harvest dates, and a link back to 3 to 5 hero SKU pages that source from the named supplier.
Vejrø hospitality content case study
Vejrø Resort, a Danish private-island destination with an on-site restaurant focused on organic, locally sourced cuisine, joined us with strong social engagement and no organic-search real estate. Guests found the resort on Instagram but never in Google search for terms like “private island resort Denmark,” “farm-to-table hospitality Denmark,” or “Vejrø restaurant.” The same organic-search gap shows up on DTC food brands running paid social at 20,000 dollars monthly with a broken blog and zero recipe schema.
We built the conversion-focused website with on-site and off-site SEO tuned to the travel-niche keyword clusters, competitor analysis against comparable boutique resorts, and mobile-first design prioritizing guest discovery. Every page carried the structured data qualifying it for Google’s rich results in the hospitality category. Every internal link pushed authority toward the direct-booking conversion path.
Three months later, Vejrø hit 10,000 plus organic visitors, ranked for 200 plus first-page keywords, and pulled a 2.2 percent booking conversion rate from organic traffic. The same pattern applies to content marketing for food brands: recipe schema, ingredient comparison guides, and sourcing story pages pull organic traffic at 20 to 40 percent conversion into hero SKU pages inside 6 months when the content quality matches search intent and every page carries the right structured data markup. Vejrø also proved out the reporting discipline: every monthly report named the exact page, the exact keyword cluster, and the exact search feature (rich result, sitelinks, image pack) driving the incremental organic revenue instead of hiding behind aggregate traffic charts.
Recipe cadence and content calendar for food brands
Recipe cadence on a working food brand content calendar ships 2 to 4 new recipes per week during the first 6 months and drops to 1 per week at maturity. Each recipe takes 4 to 6 hours to produce (write, test in the kitchen, photograph, schema author, publish). At 3 recipes per week, the brand hits 78 recipes inside 6 months plus a backlog of ingredient comparison and sourcing content queued behind the recipe production line.
| Content pillar | Target volume year 1 | Production cost per piece | Refresh cadence |
|---|---|---|---|
| Recipe hub | 40 to 100 recipes | $180 to $320 | Every 12 months |
| Ingredient comparison guides | 12 to 24 guides | $450 to $780 | Every 18 months |
| Sourcing story pages | 6 to 12 pages | $680 to $1,200 | Every 24 months |
| Buyer intent content | 8 to 16 pieces | $220 to $420 | Every 12 months |
Photography as a content calendar constraint
Photography is the actual constraint on recipe cadence, not writing. Every recipe needs 6 to 12 photos: hero shot, ingredient flat lay, prep in progress, plated result, storage, and step shots for the schema markup. A working food brand batches photography 8 recipes at a time to keep the cost per recipe under 200 dollars. Skip the batching and the per-recipe cost climbs to 400 to 600 dollars, which caps recipe cadence at 1 per week and slows organic ranking timeline by 6 months.
Seasonal content calendar planning
Seasonal content calendar planning maps recipes and comparison guides to the seasonal windows they need to rank in. A Christmas cookie recipe needs to publish in September to rank by early December. A Valentine’s chocolate guide needs to publish in November to rank by early February. A back-to-school lunchbox recipe needs to publish in June to rank by late August. The 60-to-90-day ranking curve dictates the calendar.
Creator syndication inside food brand content
Creator syndication on food brand content marketing amplifies the recipe hub through Instagram Reels, TikTok, and YouTube Shorts creators paid to post their own version of the brand’s hero recipes. The creator content pulls net-new audiences into the recipe hub through the creator’s Link in Bio or Amazon Storefront tag. The syndication calendar names 12 to 30 creators per quarter with specific recipes assigned to each.
One brand we picked up had a spreadsheet titled “creator outreach 2023” with 47 rows and 3 responses. All 3 responses were auto-replies. The spreadsheet named zero recipes and offered flat rates below 100 dollars per post. Nobody posts a 30-second video for 87 dollars flat. Nobody.
Creator content commercial terms that work
Working creator content commercial terms run 350 to 1,500 dollars flat per post plus a 12 to 25 percent commission on tagged sales across a 30-day window. The commission mechanic pulls creators into follow-up posts because the incremental revenue continues past the initial fee. Mid-tier creators (30k to 150k followers) hit the sweet spot for food brand content because their engagement rate typically runs 4 to 8 percent versus 0.8 to 1.6 percent on mega-creators.
Content brief structure for creator partnerships
The content brief structure for creator partnerships runs a single page: the SKU, the specific recipe or usage occasion, 3 required brand mentions, 3 restricted claims (no health claims on non-medical SKUs), the pricing angle, the affiliate link, and 3 example videos that hit the tone. The brief avoids over-scripting because over-scripted creator content underperforms native creator voice by 40 to 60 percent on engagement rate.
Buyer intent content for food brand blogs
Buyer intent content on food brand blogs covers 8 to 16 pieces targeting explicit purchase-decision queries: “where to buy [brand],” “[brand] subscription vs. one-time,” “best [category] for [use case],” and “[brand] gift bundle.” Every buyer intent piece runs 1,400 to 2,400 words with a comparison table, product cards, and a clear conversion path to the specific SKU that matches the query intent. Buyer intent content converts at 3 to 6 percent versus 1 to 2 percent on recipe content because the shopper landed already planning to buy, not exploring a usage occasion.
Where-to-buy content structure
Where-to-buy content structure covers online (DTC storefront, Amazon, Target.com, Whole Foods online), retail (specific chain locators with the store finder embedded), and international (customs limitations, retailer partners abroad). Every piece names specific retailers, links to the store locator, and includes an FAQ block covering shipping availability, subscription options, and gift card compatibility. Where-to-buy content ranks for branded discovery queries the DTC storefront otherwise loses to competitor affiliate reviews.
Subscription versus one-time comparison content
Subscription versus one-time comparison content converts subscription commitments at 3 to 6 percent because it addresses the price-sensitivity concern head-on with a specific math table. The piece covers the discount structure (15 percent lifetime), the skip-a-month mechanic, the pause-anytime rule, the cancellation policy, and the specific yearly savings for the brand’s average consumption cadence. Cross-reference the retention structure on our food and beverage marketing retainer page.
Content refresh cadence on food brand pillars
Content refresh cadence on food brand content pillars runs a rolling audit every 12 to 24 months by pillar. Recipes get refreshed every 12 months with new photography, updated schema, and any nutrition or ingredient adjustments. Ingredient comparison guides refresh every 18 months to update market data. Sourcing story pages refresh every 24 months to reflect farm partnership changes and new harvest angles. Buyer intent content refreshes every 12 months to update retailer availability and pricing.
Recipe refresh priority order
Recipe refresh priority runs by organic traffic rank. The top 20 recipes by monthly organic sessions get refreshed first (new photography, schema audit, related recipe internal links, updated nutrition). The next 40 get refreshed at 15 months. The remaining recipes get refreshed opportunistically when the ranking slips past position 15 in Google. Skipping the refresh cadence lets recipe rankings drift out of the top 3 inside 18 months as newer competitor recipes take the position.
Schema audit checklist per refresh
The schema audit checklist per refresh runs 8 items: Recipe schema completeness, aggregateRating count and accuracy, nutrition data accuracy, prepTime and cookTime match the recipe body, image URLs valid at CDN, related recipe internal links working, product card SKU URL live, and Google Search Console rich result eligibility validated. This checklist takes 20 minutes per recipe and prevents the schema drift that costs recipe rankings 20 to 40 positions quietly.
Reporting cadence for food brand content marketing
Reporting cadence on food brand content marketing runs a monthly executive report plus a quarterly business review. The monthly report ships in the first business week and covers organic sessions by pillar, top 10 ranking recipes with position trend, ingredient guide ranking movements, sourcing page performance, and organic-attributed DTC revenue. Every number carries a comparison to the prior month and a plain-language interpretation the founder reads in 7 minutes.
Metrics that matter for content marketing
Metrics that matter for food brand content marketing: organic sessions by pillar, recipe rich result impressions in Search Console, organic conversion rate to hero SKU pages, organic-attributed DTC revenue, and top 20 ranking positions by monthly organic sessions. Vanity metrics that do not matter: total pageviews without conversion context, average time on page without conversion attribution, and social share counts. The monthly report skips the vanity block entirely.
Quarterly business review structure
The quarterly business review runs 90 minutes with the founder, head of content, and SEO lead. Agenda: organic traffic trend by pillar, top 10 winning content pieces, top 10 losing content pieces (candidates for refresh or removal), competitive gap analysis against 5 named competitor brands, and next quarter’s content calendar with recipes and ingredient guides queued. According to Ahrefs content marketing research, brands running quarterly content audits outperform brands running annual audits by 40 to 70 percent on organic revenue over a 24-month window.
Internal linking discipline across food brand content
Internal linking discipline across food brand content moves authority from recipe pages toward hero SKU product pages and comparison guides. Every recipe links to the hero SKU it uses inline (once in the ingredient list, once in a bottom call-out card). Every ingredient comparison guide links to 3 to 6 recipes using the winning ingredient plus the hero SKU product page. Every sourcing story links to the 2 to 4 SKUs sourced from that specific farm or cooperative.
Anchor text strategy across recipe hubs
Anchor text on internal links varies across recipe hubs to avoid over-optimization patterns Google penalizes. Exact-match anchor (“single-origin Ethiopian coffee”) runs on 20 to 30 percent of internal links. Partial-match variations (“our Ethiopian roast”) run on 30 to 40 percent. Branded anchors (the SKU name) run on 20 to 30 percent. Generic anchors (“shop the coffee”) fill the remaining 10 to 20 percent. This ratio holds ranking without triggering the over-optimization penalty that shows up on brands that anchor-text-stuff every internal link with the same exact-match keyword. Cross-reference the linking layer on our food and beverage web design page.
Link equity from ingredient guides to SKU pages
Link equity from ingredient guides passes to SKU pages when the guide’s comparison table names the hero SKU in the winning column with a product card, and when the guide’s body links to 3 to 6 recipes that use the winning ingredient. This 3-hop path (guide to recipe to SKU) pushes authority from a high-traffic informational query down to a high-intent transactional page. According to Search Engine Land SEO coverage, informational content that internally links to transactional pages produces 2 to 4 times higher organic revenue than isolated content silos.
Wrapping up content marketing for food brands
Content marketing for food brands is the organic engine that turns a DTC snack, drink, or CPG storefront into a search-driven revenue channel. Recipe hub of 40 to 100 recipes. Ingredient comparison guides at 12 to 24 pieces. Sourcing story pages at 6 to 12 pieces. Buyer intent content at 8 to 16 pieces. Creator syndication calendar with 12 to 30 creators per quarter. Refresh cadence at 12 to 24 months by pillar. Reporting with organic sessions and organic revenue attribution.
If your DTC food brand is running paid social at 20,000 dollars monthly with a broken blog and zero recipe schema, professional content marketing for food brands pays for itself inside the first 90 days on organic traffic captured. Redefine Web ships content marketing inside our monthly retainer packages. Book a call and we will walk through the last three DTC food brands we built recipe hubs for, pillar by pillar.
Content marketing for food brands starts with a recipe hub because recipe queries account for 40 to 60 percent of high-intent search volume in the food category. Every hero SKU needs 4 to 12 recipes anchored to it, each targeting a specific occasion and audience.
Skip the recipe hub and the brand loses the search real estate that pulls DTC storefront traffic month over month at zero incremental paid cost. Recipe traffic converts at 2 to 4 percent because the shopper landed with usage intent, not passive discovery, which is why food brands win on recipes.
Recipe schema and Google rich result eligibility
Every recipe page ships schema.org Recipe markup including cookTime, prepTime, recipeIngredient, recipeInstructions, nutrition, and aggregateRating. Correctly marked-up recipes qualify for Google’s recipe rich result carousel that pulls 3 to 6 times higher click-through rate than a plain blue link. The schema layer takes 15 minutes per recipe to author and 30 minutes to validate in Google Search Console. Cross-reference the recipe search stack on our food and beverage SEO page.
Recipe hub structure that scales
The recipe hub structure runs 40 to 100 recipes at maturity, organized by hero SKU (4 to 12 recipes per SKU) plus occasion tags (breakfast, weeknight dinner, meal prep, brunch, holiday). Every recipe links back to the hero SKU product page with the SKU embedded in an inline card. The hub earns internal linking value from ingredient comparison guides and the sourcing story pages, which feeds recipe ranking on Google. According to Google Search Central recipe structured data guidance, complete Recipe schema markup is required for eligibility in the recipe carousel and the ingredient search filter.
Pillar structure for food brand content marketing
The pillar structure on content marketing for food brands runs 4 content pillars concurrently: recipe hub (40 to 100 recipes), ingredient comparison guides (12 to 24 guides), sourcing story pages (6 to 12 pages), and buyer intent content (where to buy, subscription vs. one-time, gift bundle guides). Every pillar covers a distinct search intent and every pillar links back to the hero SKU product pages.
Ingredient comparison guide format
Ingredient comparison guides run 1,800 to 3,200 words comparing 2 to 4 ingredient types on 6 to 10 attributes with a comparison table, real-world use case examples, and links to the hero SKU that uses the specific ingredient. Example: organic vs. conventional oats compares nutritional profile, sourcing chain, cost, environmental impact, and taste on a 6-column table. The brand’s SKU appears in the winning column with a product card. These guides rank 3 to 8 months after publication and pull steady-state organic traffic.
Sourcing story pages that build trust
Sourcing story pages name the specific farms, cooperatives, or suppliers the brand sources from, with photos of the farms, farmer quotes, and specific harvest windows. A coffee brand’s Ethiopian farm page ranks for “single-origin Ethiopian coffee” and “Yirgacheffe coffee origin” plus 40 long-tail variations. The sourcing page pulls trust-building traffic that converts at 4 to 6 percent because the shopper landed pattern-matching on transparency and named provenance. Every sourcing page includes farmer or cooperative quotes, harvest dates, and a link back to 3 to 5 hero SKU pages that source from the named supplier.
Vejrø hospitality content case study
Vejrø Resort, a Danish private-island destination with an on-site restaurant focused on organic, locally sourced cuisine, joined us with strong social engagement and no organic-search real estate. Guests found the resort on Instagram but never in Google search for terms like “private island resort Denmark,” “farm-to-table hospitality Denmark,” or “Vejrø restaurant.” The same organic-search gap shows up on DTC food brands running paid social at 20,000 dollars monthly with a broken blog and zero recipe schema.
We built the conversion-focused website with on-site and off-site SEO tuned to the travel-niche keyword clusters, competitor analysis against comparable boutique resorts, and mobile-first design prioritizing guest discovery. Every page carried the structured data qualifying it for Google’s rich results in the hospitality category. Every internal link pushed authority toward the direct-booking conversion path.
Three months later, Vejrø hit 10,000 plus organic visitors, ranked for 200 plus first-page keywords, and pulled a 2.2 percent booking conversion rate from organic traffic. The same pattern applies to content marketing for food brands: recipe schema, ingredient comparison guides, and sourcing story pages pull organic traffic at 20 to 40 percent conversion into hero SKU pages inside 6 months when the content quality matches search intent and every page carries the right structured data markup. Vejrø also proved out the reporting discipline: every monthly report named the exact page, the exact keyword cluster, and the exact search feature (rich result, sitelinks, image pack) driving the incremental organic revenue instead of hiding behind aggregate traffic charts.
Recipe cadence and content calendar for food brands
Recipe cadence on a working food brand content calendar ships 2 to 4 new recipes per week during the first 6 months and drops to 1 per week at maturity. Each recipe takes 4 to 6 hours to produce (write, test in the kitchen, photograph, schema author, publish). At 3 recipes per week, the brand hits 78 recipes inside 6 months plus a backlog of ingredient comparison and sourcing content queued behind the recipe production line.
| Content pillar | Target volume year 1 | Production cost per piece | Refresh cadence |
|---|---|---|---|
| Recipe hub | 40 to 100 recipes | $180 to $320 | Every 12 months |
| Ingredient comparison guides | 12 to 24 guides | $450 to $780 | Every 18 months |
| Sourcing story pages | 6 to 12 pages | $680 to $1,200 | Every 24 months |
| Buyer intent content | 8 to 16 pieces | $220 to $420 | Every 12 months |
Photography as a content calendar constraint
Photography is the actual constraint on recipe cadence, not writing. Every recipe needs 6 to 12 photos: hero shot, ingredient flat lay, prep in progress, plated result, storage, and step shots for the schema markup. A working food brand batches photography 8 recipes at a time to keep the cost per recipe under 200 dollars. Skip the batching and the per-recipe cost climbs to 400 to 600 dollars, which caps recipe cadence at 1 per week and slows organic ranking timeline by 6 months.
Seasonal content calendar planning
Seasonal content calendar planning maps recipes and comparison guides to the seasonal windows they need to rank in. A Christmas cookie recipe needs to publish in September to rank by early December. A Valentine’s chocolate guide needs to publish in November to rank by early February. A back-to-school lunchbox recipe needs to publish in June to rank by late August. The 60-to-90-day ranking curve dictates the calendar.
Creator syndication inside food brand content
Creator syndication on food brand content marketing amplifies the recipe hub through Instagram Reels, TikTok, and YouTube Shorts creators paid to post their own version of the brand’s hero recipes. The creator content pulls net-new audiences into the recipe hub through the creator’s Link in Bio or Amazon Storefront tag. The syndication calendar names 12 to 30 creators per quarter with specific recipes assigned to each.
One brand we picked up had a spreadsheet titled “creator outreach 2023” with 47 rows and 3 responses. All 3 responses were auto-replies. The spreadsheet named zero recipes and offered flat rates below 100 dollars per post. Nobody posts a 30-second video for 87 dollars flat. Nobody.
Creator content commercial terms that work
Working creator content commercial terms run 350 to 1,500 dollars flat per post plus a 12 to 25 percent commission on tagged sales across a 30-day window. The commission mechanic pulls creators into follow-up posts because the incremental revenue continues past the initial fee. Mid-tier creators (30k to 150k followers) hit the sweet spot for food brand content because their engagement rate typically runs 4 to 8 percent versus 0.8 to 1.6 percent on mega-creators.
Content brief structure for creator partnerships
The content brief structure for creator partnerships runs a single page: the SKU, the specific recipe or usage occasion, 3 required brand mentions, 3 restricted claims (no health claims on non-medical SKUs), the pricing angle, the affiliate link, and 3 example videos that hit the tone. The brief avoids over-scripting because over-scripted creator content underperforms native creator voice by 40 to 60 percent on engagement rate.
Buyer intent content for food brand blogs
Buyer intent content on food brand blogs covers 8 to 16 pieces targeting explicit purchase-decision queries: “where to buy [brand],” “[brand] subscription vs. one-time,” “best [category] for [use case],” and “[brand] gift bundle.” Every buyer intent piece runs 1,400 to 2,400 words with a comparison table, product cards, and a clear conversion path to the specific SKU that matches the query intent. Buyer intent content converts at 3 to 6 percent versus 1 to 2 percent on recipe content because the shopper landed already planning to buy, not exploring a usage occasion.
Where-to-buy content structure
Where-to-buy content structure covers online (DTC storefront, Amazon, Target.com, Whole Foods online), retail (specific chain locators with the store finder embedded), and international (customs limitations, retailer partners abroad). Every piece names specific retailers, links to the store locator, and includes an FAQ block covering shipping availability, subscription options, and gift card compatibility. Where-to-buy content ranks for branded discovery queries the DTC storefront otherwise loses to competitor affiliate reviews.
Subscription versus one-time comparison content
Subscription versus one-time comparison content converts subscription commitments at 3 to 6 percent because it addresses the price-sensitivity concern head-on with a specific math table. The piece covers the discount structure (15 percent lifetime), the skip-a-month mechanic, the pause-anytime rule, the cancellation policy, and the specific yearly savings for the brand’s average consumption cadence. Cross-reference the retention structure on our food and beverage marketing retainer page.
Content refresh cadence on food brand pillars
Content refresh cadence on food brand content pillars runs a rolling audit every 12 to 24 months by pillar. Recipes get refreshed every 12 months with new photography, updated schema, and any nutrition or ingredient adjustments. Ingredient comparison guides refresh every 18 months to update market data. Sourcing story pages refresh every 24 months to reflect farm partnership changes and new harvest angles. Buyer intent content refreshes every 12 months to update retailer availability and pricing.
Recipe refresh priority order
Recipe refresh priority runs by organic traffic rank. The top 20 recipes by monthly organic sessions get refreshed first (new photography, schema audit, related recipe internal links, updated nutrition). The next 40 get refreshed at 15 months. The remaining recipes get refreshed opportunistically when the ranking slips past position 15 in Google. Skipping the refresh cadence lets recipe rankings drift out of the top 3 inside 18 months as newer competitor recipes take the position.
Schema audit checklist per refresh
The schema audit checklist per refresh runs 8 items: Recipe schema completeness, aggregateRating count and accuracy, nutrition data accuracy, prepTime and cookTime match the recipe body, image URLs valid at CDN, related recipe internal links working, product card SKU URL live, and Google Search Console rich result eligibility validated. This checklist takes 20 minutes per recipe and prevents the schema drift that costs recipe rankings 20 to 40 positions quietly.
Reporting cadence for food brand content marketing
Reporting cadence on food brand content marketing runs a monthly executive report plus a quarterly business review. The monthly report ships in the first business week and covers organic sessions by pillar, top 10 ranking recipes with position trend, ingredient guide ranking movements, sourcing page performance, and organic-attributed DTC revenue. Every number carries a comparison to the prior month and a plain-language interpretation the founder reads in 7 minutes.
Metrics that matter for content marketing
Metrics that matter for food brand content marketing: organic sessions by pillar, recipe rich result impressions in Search Console, organic conversion rate to hero SKU pages, organic-attributed DTC revenue, and top 20 ranking positions by monthly organic sessions. Vanity metrics that do not matter: total pageviews without conversion context, average time on page without conversion attribution, and social share counts. The monthly report skips the vanity block entirely.
Quarterly business review structure
The quarterly business review runs 90 minutes with the founder, head of content, and SEO lead. Agenda: organic traffic trend by pillar, top 10 winning content pieces, top 10 losing content pieces (candidates for refresh or removal), competitive gap analysis against 5 named competitor brands, and next quarter’s content calendar with recipes and ingredient guides queued. According to Ahrefs content marketing research, brands running quarterly content audits outperform brands running annual audits by 40 to 70 percent on organic revenue over a 24-month window.
Internal linking discipline across food brand content
Internal linking discipline across food brand content moves authority from recipe pages toward hero SKU product pages and comparison guides. Every recipe links to the hero SKU it uses inline (once in the ingredient list, once in a bottom call-out card). Every ingredient comparison guide links to 3 to 6 recipes using the winning ingredient plus the hero SKU product page. Every sourcing story links to the 2 to 4 SKUs sourced from that specific farm or cooperative.
Anchor text strategy across recipe hubs
Anchor text on internal links varies across recipe hubs to avoid over-optimization patterns Google penalizes. Exact-match anchor (“single-origin Ethiopian coffee”) runs on 20 to 30 percent of internal links. Partial-match variations (“our Ethiopian roast”) run on 30 to 40 percent. Branded anchors (the SKU name) run on 20 to 30 percent. Generic anchors (“shop the coffee”) fill the remaining 10 to 20 percent. This ratio holds ranking without triggering the over-optimization penalty that shows up on brands that anchor-text-stuff every internal link with the same exact-match keyword. Cross-reference the linking layer on our food and beverage web design page.
Link equity from ingredient guides to SKU pages
Link equity from ingredient guides passes to SKU pages when the guide’s comparison table names the hero SKU in the winning column with a product card, and when the guide’s body links to 3 to 6 recipes that use the winning ingredient. This 3-hop path (guide to recipe to SKU) pushes authority from a high-traffic informational query down to a high-intent transactional page. According to Search Engine Land SEO coverage, informational content that internally links to transactional pages produces 2 to 4 times higher organic revenue than isolated content silos.
Wrapping up content marketing for food brands
Content marketing for food brands is the organic engine that turns a DTC snack, drink, or CPG storefront into a search-driven revenue channel. Recipe hub of 40 to 100 recipes. Ingredient comparison guides at 12 to 24 pieces. Sourcing story pages at 6 to 12 pieces. Buyer intent content at 8 to 16 pieces. Creator syndication calendar with 12 to 30 creators per quarter. Refresh cadence at 12 to 24 months by pillar. Reporting with organic sessions and organic revenue attribution.
If your DTC food brand is running paid social at 20,000 dollars monthly with a broken blog and zero recipe schema, professional content marketing for food brands pays for itself inside the first 90 days on organic traffic captured. Redefine Web ships content marketing inside our monthly retainer packages. Book a call and we will walk through the last three DTC food brands we built recipe hubs for, pillar by pillar.
Anchor text on internal links varies across recipe hubs to avoid over-optimization patterns Google penalizes. Exact-match anchor (“single-origin Ethiopian coffee”) runs on 20 to 30 percent of internal links. Partial-match variations (“our Ethiopian roast”) run on 30 to 40 percent. Branded anchors (the SKU name) run on 20 to 30 percent. Generic anchors (“shop the coffee”) fill the remaining 10 to 20 percent. This ratio holds ranking without triggering the over-optimization penalty that shows up on brands that anchor-text-stuff every internal link with the same exact-match keyword. Cross-reference the linking layer on our food and beverage web design page.
Link equity from ingredient guides to SKU pages
Link equity from ingredient guides passes to SKU pages when the guide’s comparison table names the hero SKU in the winning column with a product card, and when the guide’s body links to 3 to 6 recipes that use the winning ingredient. This 3-hop path (guide to recipe to SKU) pushes authority from a high-traffic informational query down to a high-intent transactional page. According to Search Engine Land SEO coverage, informational content that internally links to transactional pages produces 2 to 4 times higher organic revenue than isolated content silos.
Wrapping up content marketing for food brands
Content marketing for food brands is the organic engine that turns a DTC snack, drink, or CPG storefront into a search-driven revenue channel. Recipe hub of 40 to 100 recipes. Ingredient comparison guides at 12 to 24 pieces. Sourcing story pages at 6 to 12 pieces. Buyer intent content at 8 to 16 pieces. Creator syndication calendar with 12 to 30 creators per quarter. Refresh cadence at 12 to 24 months by pillar. Reporting with organic sessions and organic revenue attribution.
If your DTC food brand is running paid social at 20,000 dollars monthly with a broken blog and zero recipe schema, professional content marketing for food brands pays for itself inside the first 90 days on organic traffic captured. Redefine Web ships content marketing inside our monthly retainer packages. Book a call and we will walk through the last three DTC food brands we built recipe hubs for, pillar by pillar.
Internal linking discipline across food brand content moves authority from recipe pages toward hero SKU product pages and comparison guides. Every recipe links to the hero SKU it uses inline (once in the ingredient list, once in a bottom call-out card). Every ingredient comparison guide links to 3 to 6 recipes using the winning ingredient plus the hero SKU product page. Every sourcing story links to the 2 to 4 SKUs sourced from that specific farm or cooperative.
Anchor text strategy across recipe hubs
Anchor text on internal links varies across recipe hubs to avoid over-optimization patterns Google penalizes. Exact-match anchor (“single-origin Ethiopian coffee”) runs on 20 to 30 percent of internal links. Partial-match variations (“our Ethiopian roast”) run on 30 to 40 percent. Branded anchors (the SKU name) run on 20 to 30 percent. Generic anchors (“shop the coffee”) fill the remaining 10 to 20 percent. This ratio holds ranking without triggering the over-optimization penalty that shows up on brands that anchor-text-stuff every internal link with the same exact-match keyword. Cross-reference the linking layer on our food and beverage web design page.
Link equity from ingredient guides to SKU pages
Link equity from ingredient guides passes to SKU pages when the guide’s comparison table names the hero SKU in the winning column with a product card, and when the guide’s body links to 3 to 6 recipes that use the winning ingredient. This 3-hop path (guide to recipe to SKU) pushes authority from a high-traffic informational query down to a high-intent transactional page. According to Search Engine Land SEO coverage, informational content that internally links to transactional pages produces 2 to 4 times higher organic revenue than isolated content silos.
Wrapping up content marketing for food brands
Content marketing for food brands is the organic engine that turns a DTC snack, drink, or CPG storefront into a search-driven revenue channel. Recipe hub of 40 to 100 recipes. Ingredient comparison guides at 12 to 24 pieces. Sourcing story pages at 6 to 12 pieces. Buyer intent content at 8 to 16 pieces. Creator syndication calendar with 12 to 30 creators per quarter. Refresh cadence at 12 to 24 months by pillar. Reporting with organic sessions and organic revenue attribution.
If your DTC food brand is running paid social at 20,000 dollars monthly with a broken blog and zero recipe schema, professional content marketing for food brands pays for itself inside the first 90 days on organic traffic captured. Redefine Web ships content marketing inside our monthly retainer packages. Book a call and we will walk through the last three DTC food brands we built recipe hubs for, pillar by pillar.
Content marketing for food brands starts with a recipe hub because recipe queries account for 40 to 60 percent of high-intent search volume in the food category. Every hero SKU needs 4 to 12 recipes anchored to it, each targeting a specific occasion and audience.
Skip the recipe hub and the brand loses the search real estate that pulls DTC storefront traffic month over month at zero incremental paid cost. Recipe traffic converts at 2 to 4 percent because the shopper landed with usage intent, not passive discovery, which is why food brands win on recipes.
Recipe schema and Google rich result eligibility
Every recipe page ships schema.org Recipe markup including cookTime, prepTime, recipeIngredient, recipeInstructions, nutrition, and aggregateRating. Correctly marked-up recipes qualify for Google’s recipe rich result carousel that pulls 3 to 6 times higher click-through rate than a plain blue link. The schema layer takes 15 minutes per recipe to author and 30 minutes to validate in Google Search Console. Cross-reference the recipe search stack on our food and beverage SEO page.
Recipe hub structure that scales
The recipe hub structure runs 40 to 100 recipes at maturity, organized by hero SKU (4 to 12 recipes per SKU) plus occasion tags (breakfast, weeknight dinner, meal prep, brunch, holiday). Every recipe links back to the hero SKU product page with the SKU embedded in an inline card. The hub earns internal linking value from ingredient comparison guides and the sourcing story pages, which feeds recipe ranking on Google. According to Google Search Central recipe structured data guidance, complete Recipe schema markup is required for eligibility in the recipe carousel and the ingredient search filter.
Pillar structure for food brand content marketing
The pillar structure on content marketing for food brands runs 4 content pillars concurrently: recipe hub (40 to 100 recipes), ingredient comparison guides (12 to 24 guides), sourcing story pages (6 to 12 pages), and buyer intent content (where to buy, subscription vs. one-time, gift bundle guides). Every pillar covers a distinct search intent and every pillar links back to the hero SKU product pages.
Ingredient comparison guide format
Ingredient comparison guides run 1,800 to 3,200 words comparing 2 to 4 ingredient types on 6 to 10 attributes with a comparison table, real-world use case examples, and links to the hero SKU that uses the specific ingredient. Example: organic vs. conventional oats compares nutritional profile, sourcing chain, cost, environmental impact, and taste on a 6-column table. The brand’s SKU appears in the winning column with a product card. These guides rank 3 to 8 months after publication and pull steady-state organic traffic.
Sourcing story pages that build trust
Sourcing story pages name the specific farms, cooperatives, or suppliers the brand sources from, with photos of the farms, farmer quotes, and specific harvest windows. A coffee brand’s Ethiopian farm page ranks for “single-origin Ethiopian coffee” and “Yirgacheffe coffee origin” plus 40 long-tail variations. The sourcing page pulls trust-building traffic that converts at 4 to 6 percent because the shopper landed pattern-matching on transparency and named provenance. Every sourcing page includes farmer or cooperative quotes, harvest dates, and a link back to 3 to 5 hero SKU pages that source from the named supplier.
Vejrø hospitality content case study
Vejrø Resort, a Danish private-island destination with an on-site restaurant focused on organic, locally sourced cuisine, joined us with strong social engagement and no organic-search real estate. Guests found the resort on Instagram but never in Google search for terms like “private island resort Denmark,” “farm-to-table hospitality Denmark,” or “Vejrø restaurant.” The same organic-search gap shows up on DTC food brands running paid social at 20,000 dollars monthly with a broken blog and zero recipe schema.
We built the conversion-focused website with on-site and off-site SEO tuned to the travel-niche keyword clusters, competitor analysis against comparable boutique resorts, and mobile-first design prioritizing guest discovery. Every page carried the structured data qualifying it for Google’s rich results in the hospitality category. Every internal link pushed authority toward the direct-booking conversion path.
Three months later, Vejrø hit 10,000 plus organic visitors, ranked for 200 plus first-page keywords, and pulled a 2.2 percent booking conversion rate from organic traffic. The same pattern applies to content marketing for food brands: recipe schema, ingredient comparison guides, and sourcing story pages pull organic traffic at 20 to 40 percent conversion into hero SKU pages inside 6 months when the content quality matches search intent and every page carries the right structured data markup. Vejrø also proved out the reporting discipline: every monthly report named the exact page, the exact keyword cluster, and the exact search feature (rich result, sitelinks, image pack) driving the incremental organic revenue instead of hiding behind aggregate traffic charts.
Recipe cadence and content calendar for food brands
Recipe cadence on a working food brand content calendar ships 2 to 4 new recipes per week during the first 6 months and drops to 1 per week at maturity. Each recipe takes 4 to 6 hours to produce (write, test in the kitchen, photograph, schema author, publish). At 3 recipes per week, the brand hits 78 recipes inside 6 months plus a backlog of ingredient comparison and sourcing content queued behind the recipe production line.
| Content pillar | Target volume year 1 | Production cost per piece | Refresh cadence |
|---|---|---|---|
| Recipe hub | 40 to 100 recipes | $180 to $320 | Every 12 months |
| Ingredient comparison guides | 12 to 24 guides | $450 to $780 | Every 18 months |
| Sourcing story pages | 6 to 12 pages | $680 to $1,200 | Every 24 months |
| Buyer intent content | 8 to 16 pieces | $220 to $420 | Every 12 months |
Photography as a content calendar constraint
Photography is the actual constraint on recipe cadence, not writing. Every recipe needs 6 to 12 photos: hero shot, ingredient flat lay, prep in progress, plated result, storage, and step shots for the schema markup. A working food brand batches photography 8 recipes at a time to keep the cost per recipe under 200 dollars. Skip the batching and the per-recipe cost climbs to 400 to 600 dollars, which caps recipe cadence at 1 per week and slows organic ranking timeline by 6 months.
Seasonal content calendar planning
Seasonal content calendar planning maps recipes and comparison guides to the seasonal windows they need to rank in. A Christmas cookie recipe needs to publish in September to rank by early December. A Valentine’s chocolate guide needs to publish in November to rank by early February. A back-to-school lunchbox recipe needs to publish in June to rank by late August. The 60-to-90-day ranking curve dictates the calendar.
Creator syndication inside food brand content
Creator syndication on food brand content marketing amplifies the recipe hub through Instagram Reels, TikTok, and YouTube Shorts creators paid to post their own version of the brand’s hero recipes. The creator content pulls net-new audiences into the recipe hub through the creator’s Link in Bio or Amazon Storefront tag. The syndication calendar names 12 to 30 creators per quarter with specific recipes assigned to each.
One brand we picked up had a spreadsheet titled “creator outreach 2023” with 47 rows and 3 responses. All 3 responses were auto-replies. The spreadsheet named zero recipes and offered flat rates below 100 dollars per post. Nobody posts a 30-second video for 87 dollars flat. Nobody.
Creator content commercial terms that work
Working creator content commercial terms run 350 to 1,500 dollars flat per post plus a 12 to 25 percent commission on tagged sales across a 30-day window. The commission mechanic pulls creators into follow-up posts because the incremental revenue continues past the initial fee. Mid-tier creators (30k to 150k followers) hit the sweet spot for food brand content because their engagement rate typically runs 4 to 8 percent versus 0.8 to 1.6 percent on mega-creators.
Content brief structure for creator partnerships
The content brief structure for creator partnerships runs a single page: the SKU, the specific recipe or usage occasion, 3 required brand mentions, 3 restricted claims (no health claims on non-medical SKUs), the pricing angle, the affiliate link, and 3 example videos that hit the tone. The brief avoids over-scripting because over-scripted creator content underperforms native creator voice by 40 to 60 percent on engagement rate.
Buyer intent content for food brand blogs
Buyer intent content on food brand blogs covers 8 to 16 pieces targeting explicit purchase-decision queries: “where to buy [brand],” “[brand] subscription vs. one-time,” “best [category] for [use case],” and “[brand] gift bundle.” Every buyer intent piece runs 1,400 to 2,400 words with a comparison table, product cards, and a clear conversion path to the specific SKU that matches the query intent. Buyer intent content converts at 3 to 6 percent versus 1 to 2 percent on recipe content because the shopper landed already planning to buy, not exploring a usage occasion.
Where-to-buy content structure
Where-to-buy content structure covers online (DTC storefront, Amazon, Target.com, Whole Foods online), retail (specific chain locators with the store finder embedded), and international (customs limitations, retailer partners abroad). Every piece names specific retailers, links to the store locator, and includes an FAQ block covering shipping availability, subscription options, and gift card compatibility. Where-to-buy content ranks for branded discovery queries the DTC storefront otherwise loses to competitor affiliate reviews.
Subscription versus one-time comparison content
Subscription versus one-time comparison content converts subscription commitments at 3 to 6 percent because it addresses the price-sensitivity concern head-on with a specific math table. The piece covers the discount structure (15 percent lifetime), the skip-a-month mechanic, the pause-anytime rule, the cancellation policy, and the specific yearly savings for the brand’s average consumption cadence. Cross-reference the retention structure on our food and beverage marketing retainer page.
Content refresh cadence on food brand pillars
Content refresh cadence on food brand content pillars runs a rolling audit every 12 to 24 months by pillar. Recipes get refreshed every 12 months with new photography, updated schema, and any nutrition or ingredient adjustments. Ingredient comparison guides refresh every 18 months to update market data. Sourcing story pages refresh every 24 months to reflect farm partnership changes and new harvest angles. Buyer intent content refreshes every 12 months to update retailer availability and pricing.
Recipe refresh priority order
Recipe refresh priority runs by organic traffic rank. The top 20 recipes by monthly organic sessions get refreshed first (new photography, schema audit, related recipe internal links, updated nutrition). The next 40 get refreshed at 15 months. The remaining recipes get refreshed opportunistically when the ranking slips past position 15 in Google. Skipping the refresh cadence lets recipe rankings drift out of the top 3 inside 18 months as newer competitor recipes take the position.
Schema audit checklist per refresh
The schema audit checklist per refresh runs 8 items: Recipe schema completeness, aggregateRating count and accuracy, nutrition data accuracy, prepTime and cookTime match the recipe body, image URLs valid at CDN, related recipe internal links working, product card SKU URL live, and Google Search Console rich result eligibility validated. This checklist takes 20 minutes per recipe and prevents the schema drift that costs recipe rankings 20 to 40 positions quietly.
Reporting cadence for food brand content marketing
Reporting cadence on food brand content marketing runs a monthly executive report plus a quarterly business review. The monthly report ships in the first business week and covers organic sessions by pillar, top 10 ranking recipes with position trend, ingredient guide ranking movements, sourcing page performance, and organic-attributed DTC revenue. Every number carries a comparison to the prior month and a plain-language interpretation the founder reads in 7 minutes.
Metrics that matter for content marketing
Metrics that matter for food brand content marketing: organic sessions by pillar, recipe rich result impressions in Search Console, organic conversion rate to hero SKU pages, organic-attributed DTC revenue, and top 20 ranking positions by monthly organic sessions. Vanity metrics that do not matter: total pageviews without conversion context, average time on page without conversion attribution, and social share counts. The monthly report skips the vanity block entirely.
Quarterly business review structure
The quarterly business review runs 90 minutes with the founder, head of content, and SEO lead. Agenda: organic traffic trend by pillar, top 10 winning content pieces, top 10 losing content pieces (candidates for refresh or removal), competitive gap analysis against 5 named competitor brands, and next quarter’s content calendar with recipes and ingredient guides queued. According to Ahrefs content marketing research, brands running quarterly content audits outperform brands running annual audits by 40 to 70 percent on organic revenue over a 24-month window.
Internal linking discipline across food brand content
Internal linking discipline across food brand content moves authority from recipe pages toward hero SKU product pages and comparison guides. Every recipe links to the hero SKU it uses inline (once in the ingredient list, once in a bottom call-out card). Every ingredient comparison guide links to 3 to 6 recipes using the winning ingredient plus the hero SKU product page. Every sourcing story links to the 2 to 4 SKUs sourced from that specific farm or cooperative.
Anchor text strategy across recipe hubs
Anchor text on internal links varies across recipe hubs to avoid over-optimization patterns Google penalizes. Exact-match anchor (“single-origin Ethiopian coffee”) runs on 20 to 30 percent of internal links. Partial-match variations (“our Ethiopian roast”) run on 30 to 40 percent. Branded anchors (the SKU name) run on 20 to 30 percent. Generic anchors (“shop the coffee”) fill the remaining 10 to 20 percent. This ratio holds ranking without triggering the over-optimization penalty that shows up on brands that anchor-text-stuff every internal link with the same exact-match keyword. Cross-reference the linking layer on our food and beverage web design page.
Link equity from ingredient guides to SKU pages
Link equity from ingredient guides passes to SKU pages when the guide’s comparison table names the hero SKU in the winning column with a product card, and when the guide’s body links to 3 to 6 recipes that use the winning ingredient. This 3-hop path (guide to recipe to SKU) pushes authority from a high-traffic informational query down to a high-intent transactional page. According to Search Engine Land SEO coverage, informational content that internally links to transactional pages produces 2 to 4 times higher organic revenue than isolated content silos.
Wrapping up content marketing for food brands
Content marketing for food brands is the organic engine that turns a DTC snack, drink, or CPG storefront into a search-driven revenue channel. Recipe hub of 40 to 100 recipes. Ingredient comparison guides at 12 to 24 pieces. Sourcing story pages at 6 to 12 pieces. Buyer intent content at 8 to 16 pieces. Creator syndication calendar with 12 to 30 creators per quarter. Refresh cadence at 12 to 24 months by pillar. Reporting with organic sessions and organic revenue attribution.
If your DTC food brand is running paid social at 20,000 dollars monthly with a broken blog and zero recipe schema, professional content marketing for food brands pays for itself inside the first 90 days on organic traffic captured. Redefine Web ships content marketing inside our monthly retainer packages. Book a call and we will walk through the last three DTC food brands we built recipe hubs for, pillar by pillar.
Content marketing for food brands starts with a recipe hub because recipe queries account for 40 to 60 percent of high-intent search volume in the food category. Every hero SKU needs 4 to 12 recipes anchored to it, each targeting a specific occasion and audience.
Skip the recipe hub and the brand loses the search real estate that pulls DTC storefront traffic month over month at zero incremental paid cost. Recipe traffic converts at 2 to 4 percent because the shopper landed with usage intent, not passive discovery, which is why food brands win on recipes.
Recipe schema and Google rich result eligibility
Every recipe page ships schema.org Recipe markup including cookTime, prepTime, recipeIngredient, recipeInstructions, nutrition, and aggregateRating. Correctly marked-up recipes qualify for Google’s recipe rich result carousel that pulls 3 to 6 times higher click-through rate than a plain blue link. The schema layer takes 15 minutes per recipe to author and 30 minutes to validate in Google Search Console. Cross-reference the recipe search stack on our food and beverage SEO page.
Recipe hub structure that scales
The recipe hub structure runs 40 to 100 recipes at maturity, organized by hero SKU (4 to 12 recipes per SKU) plus occasion tags (breakfast, weeknight dinner, meal prep, brunch, holiday). Every recipe links back to the hero SKU product page with the SKU embedded in an inline card. The hub earns internal linking value from ingredient comparison guides and the sourcing story pages, which feeds recipe ranking on Google. According to Google Search Central recipe structured data guidance, complete Recipe schema markup is required for eligibility in the recipe carousel and the ingredient search filter.
Pillar structure for food brand content marketing
The pillar structure on content marketing for food brands runs 4 content pillars concurrently: recipe hub (40 to 100 recipes), ingredient comparison guides (12 to 24 guides), sourcing story pages (6 to 12 pages), and buyer intent content (where to buy, subscription vs. one-time, gift bundle guides). Every pillar covers a distinct search intent and every pillar links back to the hero SKU product pages.
Ingredient comparison guide format
Ingredient comparison guides run 1,800 to 3,200 words comparing 2 to 4 ingredient types on 6 to 10 attributes with a comparison table, real-world use case examples, and links to the hero SKU that uses the specific ingredient. Example: organic vs. conventional oats compares nutritional profile, sourcing chain, cost, environmental impact, and taste on a 6-column table. The brand’s SKU appears in the winning column with a product card. These guides rank 3 to 8 months after publication and pull steady-state organic traffic.
Sourcing story pages that build trust
Sourcing story pages name the specific farms, cooperatives, or suppliers the brand sources from, with photos of the farms, farmer quotes, and specific harvest windows. A coffee brand’s Ethiopian farm page ranks for “single-origin Ethiopian coffee” and “Yirgacheffe coffee origin” plus 40 long-tail variations. The sourcing page pulls trust-building traffic that converts at 4 to 6 percent because the shopper landed pattern-matching on transparency and named provenance. Every sourcing page includes farmer or cooperative quotes, harvest dates, and a link back to 3 to 5 hero SKU pages that source from the named supplier.
Vejrø hospitality content case study
Vejrø Resort, a Danish private-island destination with an on-site restaurant focused on organic, locally sourced cuisine, joined us with strong social engagement and no organic-search real estate. Guests found the resort on Instagram but never in Google search for terms like “private island resort Denmark,” “farm-to-table hospitality Denmark,” or “Vejrø restaurant.” The same organic-search gap shows up on DTC food brands running paid social at 20,000 dollars monthly with a broken blog and zero recipe schema.
We built the conversion-focused website with on-site and off-site SEO tuned to the travel-niche keyword clusters, competitor analysis against comparable boutique resorts, and mobile-first design prioritizing guest discovery. Every page carried the structured data qualifying it for Google’s rich results in the hospitality category. Every internal link pushed authority toward the direct-booking conversion path.
Three months later, Vejrø hit 10,000 plus organic visitors, ranked for 200 plus first-page keywords, and pulled a 2.2 percent booking conversion rate from organic traffic. The same pattern applies to content marketing for food brands: recipe schema, ingredient comparison guides, and sourcing story pages pull organic traffic at 20 to 40 percent conversion into hero SKU pages inside 6 months when the content quality matches search intent and every page carries the right structured data markup. Vejrø also proved out the reporting discipline: every monthly report named the exact page, the exact keyword cluster, and the exact search feature (rich result, sitelinks, image pack) driving the incremental organic revenue instead of hiding behind aggregate traffic charts.
Recipe cadence and content calendar for food brands
Recipe cadence on a working food brand content calendar ships 2 to 4 new recipes per week during the first 6 months and drops to 1 per week at maturity. Each recipe takes 4 to 6 hours to produce (write, test in the kitchen, photograph, schema author, publish). At 3 recipes per week, the brand hits 78 recipes inside 6 months plus a backlog of ingredient comparison and sourcing content queued behind the recipe production line.
| Content pillar | Target volume year 1 | Production cost per piece | Refresh cadence |
|---|---|---|---|
| Recipe hub | 40 to 100 recipes | $180 to $320 | Every 12 months |
| Ingredient comparison guides | 12 to 24 guides | $450 to $780 | Every 18 months |
| Sourcing story pages | 6 to 12 pages | $680 to $1,200 | Every 24 months |
| Buyer intent content | 8 to 16 pieces | $220 to $420 | Every 12 months |
Photography as a content calendar constraint
Photography is the actual constraint on recipe cadence, not writing. Every recipe needs 6 to 12 photos: hero shot, ingredient flat lay, prep in progress, plated result, storage, and step shots for the schema markup. A working food brand batches photography 8 recipes at a time to keep the cost per recipe under 200 dollars. Skip the batching and the per-recipe cost climbs to 400 to 600 dollars, which caps recipe cadence at 1 per week and slows organic ranking timeline by 6 months.
Seasonal content calendar planning
Seasonal content calendar planning maps recipes and comparison guides to the seasonal windows they need to rank in. A Christmas cookie recipe needs to publish in September to rank by early December. A Valentine’s chocolate guide needs to publish in November to rank by early February. A back-to-school lunchbox recipe needs to publish in June to rank by late August. The 60-to-90-day ranking curve dictates the calendar.
Creator syndication inside food brand content
Creator syndication on food brand content marketing amplifies the recipe hub through Instagram Reels, TikTok, and YouTube Shorts creators paid to post their own version of the brand’s hero recipes. The creator content pulls net-new audiences into the recipe hub through the creator’s Link in Bio or Amazon Storefront tag. The syndication calendar names 12 to 30 creators per quarter with specific recipes assigned to each.
One brand we picked up had a spreadsheet titled “creator outreach 2023” with 47 rows and 3 responses. All 3 responses were auto-replies. The spreadsheet named zero recipes and offered flat rates below 100 dollars per post. Nobody posts a 30-second video for 87 dollars flat. Nobody.
Creator content commercial terms that work
Working creator content commercial terms run 350 to 1,500 dollars flat per post plus a 12 to 25 percent commission on tagged sales across a 30-day window. The commission mechanic pulls creators into follow-up posts because the incremental revenue continues past the initial fee. Mid-tier creators (30k to 150k followers) hit the sweet spot for food brand content because their engagement rate typically runs 4 to 8 percent versus 0.8 to 1.6 percent on mega-creators.
Content brief structure for creator partnerships
The content brief structure for creator partnerships runs a single page: the SKU, the specific recipe or usage occasion, 3 required brand mentions, 3 restricted claims (no health claims on non-medical SKUs), the pricing angle, the affiliate link, and 3 example videos that hit the tone. The brief avoids over-scripting because over-scripted creator content underperforms native creator voice by 40 to 60 percent on engagement rate.
Buyer intent content for food brand blogs
Buyer intent content on food brand blogs covers 8 to 16 pieces targeting explicit purchase-decision queries: “where to buy [brand],” “[brand] subscription vs. one-time,” “best [category] for [use case],” and “[brand] gift bundle.” Every buyer intent piece runs 1,400 to 2,400 words with a comparison table, product cards, and a clear conversion path to the specific SKU that matches the query intent. Buyer intent content converts at 3 to 6 percent versus 1 to 2 percent on recipe content because the shopper landed already planning to buy, not exploring a usage occasion.
Where-to-buy content structure
Where-to-buy content structure covers online (DTC storefront, Amazon, Target.com, Whole Foods online), retail (specific chain locators with the store finder embedded), and international (customs limitations, retailer partners abroad). Every piece names specific retailers, links to the store locator, and includes an FAQ block covering shipping availability, subscription options, and gift card compatibility. Where-to-buy content ranks for branded discovery queries the DTC storefront otherwise loses to competitor affiliate reviews.
Subscription versus one-time comparison content
Subscription versus one-time comparison content converts subscription commitments at 3 to 6 percent because it addresses the price-sensitivity concern head-on with a specific math table. The piece covers the discount structure (15 percent lifetime), the skip-a-month mechanic, the pause-anytime rule, the cancellation policy, and the specific yearly savings for the brand’s average consumption cadence. Cross-reference the retention structure on our food and beverage marketing retainer page.
Content refresh cadence on food brand pillars
Content refresh cadence on food brand content pillars runs a rolling audit every 12 to 24 months by pillar. Recipes get refreshed every 12 months with new photography, updated schema, and any nutrition or ingredient adjustments. Ingredient comparison guides refresh every 18 months to update market data. Sourcing story pages refresh every 24 months to reflect farm partnership changes and new harvest angles. Buyer intent content refreshes every 12 months to update retailer availability and pricing.
Recipe refresh priority order
Recipe refresh priority runs by organic traffic rank. The top 20 recipes by monthly organic sessions get refreshed first (new photography, schema audit, related recipe internal links, updated nutrition). The next 40 get refreshed at 15 months. The remaining recipes get refreshed opportunistically when the ranking slips past position 15 in Google. Skipping the refresh cadence lets recipe rankings drift out of the top 3 inside 18 months as newer competitor recipes take the position.
Schema audit checklist per refresh
The schema audit checklist per refresh runs 8 items: Recipe schema completeness, aggregateRating count and accuracy, nutrition data accuracy, prepTime and cookTime match the recipe body, image URLs valid at CDN, related recipe internal links working, product card SKU URL live, and Google Search Console rich result eligibility validated. This checklist takes 20 minutes per recipe and prevents the schema drift that costs recipe rankings 20 to 40 positions quietly.
Reporting cadence for food brand content marketing
Reporting cadence on food brand content marketing runs a monthly executive report plus a quarterly business review. The monthly report ships in the first business week and covers organic sessions by pillar, top 10 ranking recipes with position trend, ingredient guide ranking movements, sourcing page performance, and organic-attributed DTC revenue. Every number carries a comparison to the prior month and a plain-language interpretation the founder reads in 7 minutes.
Metrics that matter for content marketing
Metrics that matter for food brand content marketing: organic sessions by pillar, recipe rich result impressions in Search Console, organic conversion rate to hero SKU pages, organic-attributed DTC revenue, and top 20 ranking positions by monthly organic sessions. Vanity metrics that do not matter: total pageviews without conversion context, average time on page without conversion attribution, and social share counts. The monthly report skips the vanity block entirely.
Quarterly business review structure
The quarterly business review runs 90 minutes with the founder, head of content, and SEO lead. Agenda: organic traffic trend by pillar, top 10 winning content pieces, top 10 losing content pieces (candidates for refresh or removal), competitive gap analysis against 5 named competitor brands, and next quarter’s content calendar with recipes and ingredient guides queued. According to Ahrefs content marketing research, brands running quarterly content audits outperform brands running annual audits by 40 to 70 percent on organic revenue over a 24-month window.
Internal linking discipline across food brand content
Internal linking discipline across food brand content moves authority from recipe pages toward hero SKU product pages and comparison guides. Every recipe links to the hero SKU it uses inline (once in the ingredient list, once in a bottom call-out card). Every ingredient comparison guide links to 3 to 6 recipes using the winning ingredient plus the hero SKU product page. Every sourcing story links to the 2 to 4 SKUs sourced from that specific farm or cooperative.
Anchor text strategy across recipe hubs
Anchor text on internal links varies across recipe hubs to avoid over-optimization patterns Google penalizes. Exact-match anchor (“single-origin Ethiopian coffee”) runs on 20 to 30 percent of internal links. Partial-match variations (“our Ethiopian roast”) run on 30 to 40 percent. Branded anchors (the SKU name) run on 20 to 30 percent. Generic anchors (“shop the coffee”) fill the remaining 10 to 20 percent. This ratio holds ranking without triggering the over-optimization penalty that shows up on brands that anchor-text-stuff every internal link with the same exact-match keyword. Cross-reference the linking layer on our food and beverage web design page.
Link equity from ingredient guides to SKU pages
Link equity from ingredient guides passes to SKU pages when the guide’s comparison table names the hero SKU in the winning column with a product card, and when the guide’s body links to 3 to 6 recipes that use the winning ingredient. This 3-hop path (guide to recipe to SKU) pushes authority from a high-traffic informational query down to a high-intent transactional page. According to Search Engine Land SEO coverage, informational content that internally links to transactional pages produces 2 to 4 times higher organic revenue than isolated content silos.
Wrapping up content marketing for food brands
Content marketing for food brands is the organic engine that turns a DTC snack, drink, or CPG storefront into a search-driven revenue channel. Recipe hub of 40 to 100 recipes. Ingredient comparison guides at 12 to 24 pieces. Sourcing story pages at 6 to 12 pieces. Buyer intent content at 8 to 16 pieces. Creator syndication calendar with 12 to 30 creators per quarter. Refresh cadence at 12 to 24 months by pillar. Reporting with organic sessions and organic revenue attribution.
If your DTC food brand is running paid social at 20,000 dollars monthly with a broken blog and zero recipe schema, professional content marketing for food brands pays for itself inside the first 90 days on organic traffic captured. Redefine Web ships content marketing inside our monthly retainer packages. Book a call and we will walk through the last three DTC food brands we built recipe hubs for, pillar by pillar.
Internal linking discipline across food brand content moves authority from recipe pages toward hero SKU product pages and comparison guides. Every recipe links to the hero SKU it uses inline (once in the ingredient list, once in a bottom call-out card). Every ingredient comparison guide links to 3 to 6 recipes using the winning ingredient plus the hero SKU product page. Every sourcing story links to the 2 to 4 SKUs sourced from that specific farm or cooperative.
Anchor text strategy across recipe hubs
Anchor text on internal links varies across recipe hubs to avoid over-optimization patterns Google penalizes. Exact-match anchor (“single-origin Ethiopian coffee”) runs on 20 to 30 percent of internal links. Partial-match variations (“our Ethiopian roast”) run on 30 to 40 percent. Branded anchors (the SKU name) run on 20 to 30 percent. Generic anchors (“shop the coffee”) fill the remaining 10 to 20 percent. This ratio holds ranking without triggering the over-optimization penalty that shows up on brands that anchor-text-stuff every internal link with the same exact-match keyword. Cross-reference the linking layer on our food and beverage web design page.
Link equity from ingredient guides to SKU pages
Link equity from ingredient guides passes to SKU pages when the guide’s comparison table names the hero SKU in the winning column with a product card, and when the guide’s body links to 3 to 6 recipes that use the winning ingredient. This 3-hop path (guide to recipe to SKU) pushes authority from a high-traffic informational query down to a high-intent transactional page. According to Search Engine Land SEO coverage, informational content that internally links to transactional pages produces 2 to 4 times higher organic revenue than isolated content silos.
Wrapping up content marketing for food brands
Content marketing for food brands is the organic engine that turns a DTC snack, drink, or CPG storefront into a search-driven revenue channel. Recipe hub of 40 to 100 recipes. Ingredient comparison guides at 12 to 24 pieces. Sourcing story pages at 6 to 12 pieces. Buyer intent content at 8 to 16 pieces. Creator syndication calendar with 12 to 30 creators per quarter. Refresh cadence at 12 to 24 months by pillar. Reporting with organic sessions and organic revenue attribution.
If your DTC food brand is running paid social at 20,000 dollars monthly with a broken blog and zero recipe schema, professional content marketing for food brands pays for itself inside the first 90 days on organic traffic captured. Redefine Web ships content marketing inside our monthly retainer packages. Book a call and we will walk through the last three DTC food brands we built recipe hubs for, pillar by pillar.
Content marketing for food brands starts with a recipe hub because recipe queries account for 40 to 60 percent of high-intent search volume in the food category. Every hero SKU needs 4 to 12 recipes anchored to it, each targeting a specific occasion and audience.
Skip the recipe hub and the brand loses the search real estate that pulls DTC storefront traffic month over month at zero incremental paid cost. Recipe traffic converts at 2 to 4 percent because the shopper landed with usage intent, not passive discovery, which is why food brands win on recipes.
Recipe schema and Google rich result eligibility
Every recipe page ships schema.org Recipe markup including cookTime, prepTime, recipeIngredient, recipeInstructions, nutrition, and aggregateRating. Correctly marked-up recipes qualify for Google’s recipe rich result carousel that pulls 3 to 6 times higher click-through rate than a plain blue link. The schema layer takes 15 minutes per recipe to author and 30 minutes to validate in Google Search Console. Cross-reference the recipe search stack on our food and beverage SEO page.
Recipe hub structure that scales
The recipe hub structure runs 40 to 100 recipes at maturity, organized by hero SKU (4 to 12 recipes per SKU) plus occasion tags (breakfast, weeknight dinner, meal prep, brunch, holiday). Every recipe links back to the hero SKU product page with the SKU embedded in an inline card. The hub earns internal linking value from ingredient comparison guides and the sourcing story pages, which feeds recipe ranking on Google. According to Google Search Central recipe structured data guidance, complete Recipe schema markup is required for eligibility in the recipe carousel and the ingredient search filter.
Pillar structure for food brand content marketing
The pillar structure on content marketing for food brands runs 4 content pillars concurrently: recipe hub (40 to 100 recipes), ingredient comparison guides (12 to 24 guides), sourcing story pages (6 to 12 pages), and buyer intent content (where to buy, subscription vs. one-time, gift bundle guides). Every pillar covers a distinct search intent and every pillar links back to the hero SKU product pages.
Ingredient comparison guide format
Ingredient comparison guides run 1,800 to 3,200 words comparing 2 to 4 ingredient types on 6 to 10 attributes with a comparison table, real-world use case examples, and links to the hero SKU that uses the specific ingredient. Example: organic vs. conventional oats compares nutritional profile, sourcing chain, cost, environmental impact, and taste on a 6-column table. The brand’s SKU appears in the winning column with a product card. These guides rank 3 to 8 months after publication and pull steady-state organic traffic.
Sourcing story pages that build trust
Sourcing story pages name the specific farms, cooperatives, or suppliers the brand sources from, with photos of the farms, farmer quotes, and specific harvest windows. A coffee brand’s Ethiopian farm page ranks for “single-origin Ethiopian coffee” and “Yirgacheffe coffee origin” plus 40 long-tail variations. The sourcing page pulls trust-building traffic that converts at 4 to 6 percent because the shopper landed pattern-matching on transparency and named provenance. Every sourcing page includes farmer or cooperative quotes, harvest dates, and a link back to 3 to 5 hero SKU pages that source from the named supplier.
Vejrø hospitality content case study
Vejrø Resort, a Danish private-island destination with an on-site restaurant focused on organic, locally sourced cuisine, joined us with strong social engagement and no organic-search real estate. Guests found the resort on Instagram but never in Google search for terms like “private island resort Denmark,” “farm-to-table hospitality Denmark,” or “Vejrø restaurant.” The same organic-search gap shows up on DTC food brands running paid social at 20,000 dollars monthly with a broken blog and zero recipe schema.
We built the conversion-focused website with on-site and off-site SEO tuned to the travel-niche keyword clusters, competitor analysis against comparable boutique resorts, and mobile-first design prioritizing guest discovery. Every page carried the structured data qualifying it for Google’s rich results in the hospitality category. Every internal link pushed authority toward the direct-booking conversion path.
Three months later, Vejrø hit 10,000 plus organic visitors, ranked for 200 plus first-page keywords, and pulled a 2.2 percent booking conversion rate from organic traffic. The same pattern applies to content marketing for food brands: recipe schema, ingredient comparison guides, and sourcing story pages pull organic traffic at 20 to 40 percent conversion into hero SKU pages inside 6 months when the content quality matches search intent and every page carries the right structured data markup. Vejrø also proved out the reporting discipline: every monthly report named the exact page, the exact keyword cluster, and the exact search feature (rich result, sitelinks, image pack) driving the incremental organic revenue instead of hiding behind aggregate traffic charts.
Recipe cadence and content calendar for food brands
Recipe cadence on a working food brand content calendar ships 2 to 4 new recipes per week during the first 6 months and drops to 1 per week at maturity. Each recipe takes 4 to 6 hours to produce (write, test in the kitchen, photograph, schema author, publish). At 3 recipes per week, the brand hits 78 recipes inside 6 months plus a backlog of ingredient comparison and sourcing content queued behind the recipe production line.
| Content pillar | Target volume year 1 | Production cost per piece | Refresh cadence |
|---|---|---|---|
| Recipe hub | 40 to 100 recipes | $180 to $320 | Every 12 months |
| Ingredient comparison guides | 12 to 24 guides | $450 to $780 | Every 18 months |
| Sourcing story pages | 6 to 12 pages | $680 to $1,200 | Every 24 months |
| Buyer intent content | 8 to 16 pieces | $220 to $420 | Every 12 months |
Photography as a content calendar constraint
Photography is the actual constraint on recipe cadence, not writing. Every recipe needs 6 to 12 photos: hero shot, ingredient flat lay, prep in progress, plated result, storage, and step shots for the schema markup. A working food brand batches photography 8 recipes at a time to keep the cost per recipe under 200 dollars. Skip the batching and the per-recipe cost climbs to 400 to 600 dollars, which caps recipe cadence at 1 per week and slows organic ranking timeline by 6 months.
Seasonal content calendar planning
Seasonal content calendar planning maps recipes and comparison guides to the seasonal windows they need to rank in. A Christmas cookie recipe needs to publish in September to rank by early December. A Valentine’s chocolate guide needs to publish in November to rank by early February. A back-to-school lunchbox recipe needs to publish in June to rank by late August. The 60-to-90-day ranking curve dictates the calendar.
Creator syndication inside food brand content
Creator syndication on food brand content marketing amplifies the recipe hub through Instagram Reels, TikTok, and YouTube Shorts creators paid to post their own version of the brand’s hero recipes. The creator content pulls net-new audiences into the recipe hub through the creator’s Link in Bio or Amazon Storefront tag. The syndication calendar names 12 to 30 creators per quarter with specific recipes assigned to each.
One brand we picked up had a spreadsheet titled “creator outreach 2023” with 47 rows and 3 responses. All 3 responses were auto-replies. The spreadsheet named zero recipes and offered flat rates below 100 dollars per post. Nobody posts a 30-second video for 87 dollars flat. Nobody.
Creator content commercial terms that work
Working creator content commercial terms run 350 to 1,500 dollars flat per post plus a 12 to 25 percent commission on tagged sales across a 30-day window. The commission mechanic pulls creators into follow-up posts because the incremental revenue continues past the initial fee. Mid-tier creators (30k to 150k followers) hit the sweet spot for food brand content because their engagement rate typically runs 4 to 8 percent versus 0.8 to 1.6 percent on mega-creators.
Content brief structure for creator partnerships
The content brief structure for creator partnerships runs a single page: the SKU, the specific recipe or usage occasion, 3 required brand mentions, 3 restricted claims (no health claims on non-medical SKUs), the pricing angle, the affiliate link, and 3 example videos that hit the tone. The brief avoids over-scripting because over-scripted creator content underperforms native creator voice by 40 to 60 percent on engagement rate.
Buyer intent content for food brand blogs
Buyer intent content on food brand blogs covers 8 to 16 pieces targeting explicit purchase-decision queries: “where to buy [brand],” “[brand] subscription vs. one-time,” “best [category] for [use case],” and “[brand] gift bundle.” Every buyer intent piece runs 1,400 to 2,400 words with a comparison table, product cards, and a clear conversion path to the specific SKU that matches the query intent. Buyer intent content converts at 3 to 6 percent versus 1 to 2 percent on recipe content because the shopper landed already planning to buy, not exploring a usage occasion.
Where-to-buy content structure
Where-to-buy content structure covers online (DTC storefront, Amazon, Target.com, Whole Foods online), retail (specific chain locators with the store finder embedded), and international (customs limitations, retailer partners abroad). Every piece names specific retailers, links to the store locator, and includes an FAQ block covering shipping availability, subscription options, and gift card compatibility. Where-to-buy content ranks for branded discovery queries the DTC storefront otherwise loses to competitor affiliate reviews.
Subscription versus one-time comparison content
Subscription versus one-time comparison content converts subscription commitments at 3 to 6 percent because it addresses the price-sensitivity concern head-on with a specific math table. The piece covers the discount structure (15 percent lifetime), the skip-a-month mechanic, the pause-anytime rule, the cancellation policy, and the specific yearly savings for the brand’s average consumption cadence. Cross-reference the retention structure on our food and beverage marketing retainer page.
Content refresh cadence on food brand pillars
Content refresh cadence on food brand content pillars runs a rolling audit every 12 to 24 months by pillar. Recipes get refreshed every 12 months with new photography, updated schema, and any nutrition or ingredient adjustments. Ingredient comparison guides refresh every 18 months to update market data. Sourcing story pages refresh every 24 months to reflect farm partnership changes and new harvest angles. Buyer intent content refreshes every 12 months to update retailer availability and pricing.
Recipe refresh priority order
Recipe refresh priority runs by organic traffic rank. The top 20 recipes by monthly organic sessions get refreshed first (new photography, schema audit, related recipe internal links, updated nutrition). The next 40 get refreshed at 15 months. The remaining recipes get refreshed opportunistically when the ranking slips past position 15 in Google. Skipping the refresh cadence lets recipe rankings drift out of the top 3 inside 18 months as newer competitor recipes take the position.
Schema audit checklist per refresh
The schema audit checklist per refresh runs 8 items: Recipe schema completeness, aggregateRating count and accuracy, nutrition data accuracy, prepTime and cookTime match the recipe body, image URLs valid at CDN, related recipe internal links working, product card SKU URL live, and Google Search Console rich result eligibility validated. This checklist takes 20 minutes per recipe and prevents the schema drift that costs recipe rankings 20 to 40 positions quietly.
Reporting cadence for food brand content marketing
Reporting cadence on food brand content marketing runs a monthly executive report plus a quarterly business review. The monthly report ships in the first business week and covers organic sessions by pillar, top 10 ranking recipes with position trend, ingredient guide ranking movements, sourcing page performance, and organic-attributed DTC revenue. Every number carries a comparison to the prior month and a plain-language interpretation the founder reads in 7 minutes.
Metrics that matter for content marketing
Metrics that matter for food brand content marketing: organic sessions by pillar, recipe rich result impressions in Search Console, organic conversion rate to hero SKU pages, organic-attributed DTC revenue, and top 20 ranking positions by monthly organic sessions. Vanity metrics that do not matter: total pageviews without conversion context, average time on page without conversion attribution, and social share counts. The monthly report skips the vanity block entirely.
Quarterly business review structure
The quarterly business review runs 90 minutes with the founder, head of content, and SEO lead. Agenda: organic traffic trend by pillar, top 10 winning content pieces, top 10 losing content pieces (candidates for refresh or removal), competitive gap analysis against 5 named competitor brands, and next quarter’s content calendar with recipes and ingredient guides queued. According to Ahrefs content marketing research, brands running quarterly content audits outperform brands running annual audits by 40 to 70 percent on organic revenue over a 24-month window.
Internal linking discipline across food brand content
Internal linking discipline across food brand content moves authority from recipe pages toward hero SKU product pages and comparison guides. Every recipe links to the hero SKU it uses inline (once in the ingredient list, once in a bottom call-out card). Every ingredient comparison guide links to 3 to 6 recipes using the winning ingredient plus the hero SKU product page. Every sourcing story links to the 2 to 4 SKUs sourced from that specific farm or cooperative.
Anchor text strategy across recipe hubs
Anchor text on internal links varies across recipe hubs to avoid over-optimization patterns Google penalizes. Exact-match anchor (“single-origin Ethiopian coffee”) runs on 20 to 30 percent of internal links. Partial-match variations (“our Ethiopian roast”) run on 30 to 40 percent. Branded anchors (the SKU name) run on 20 to 30 percent. Generic anchors (“shop the coffee”) fill the remaining 10 to 20 percent. This ratio holds ranking without triggering the over-optimization penalty that shows up on brands that anchor-text-stuff every internal link with the same exact-match keyword. Cross-reference the linking layer on our food and beverage web design page.
Link equity from ingredient guides to SKU pages
Link equity from ingredient guides passes to SKU pages when the guide’s comparison table names the hero SKU in the winning column with a product card, and when the guide’s body links to 3 to 6 recipes that use the winning ingredient. This 3-hop path (guide to recipe to SKU) pushes authority from a high-traffic informational query down to a high-intent transactional page. According to Search Engine Land SEO coverage, informational content that internally links to transactional pages produces 2 to 4 times higher organic revenue than isolated content silos.
Wrapping up content marketing for food brands
Content marketing for food brands is the organic engine that turns a DTC snack, drink, or CPG storefront into a search-driven revenue channel. Recipe hub of 40 to 100 recipes. Ingredient comparison guides at 12 to 24 pieces. Sourcing story pages at 6 to 12 pieces. Buyer intent content at 8 to 16 pieces. Creator syndication calendar with 12 to 30 creators per quarter. Refresh cadence at 12 to 24 months by pillar. Reporting with organic sessions and organic revenue attribution.
If your DTC food brand is running paid social at 20,000 dollars monthly with a broken blog and zero recipe schema, professional content marketing for food brands pays for itself inside the first 90 days on organic traffic captured. Redefine Web ships content marketing inside our monthly retainer packages. Book a call and we will walk through the last three DTC food brands we built recipe hubs for, pillar by pillar.
Anchor text on internal links varies across recipe hubs to avoid over-optimization patterns Google penalizes. Exact-match anchor (“single-origin Ethiopian coffee”) runs on 20 to 30 percent of internal links. Partial-match variations (“our Ethiopian roast”) run on 30 to 40 percent. Branded anchors (the SKU name) run on 20 to 30 percent. Generic anchors (“shop the coffee”) fill the remaining 10 to 20 percent. This ratio holds ranking without triggering the over-optimization penalty that shows up on brands that anchor-text-stuff every internal link with the same exact-match keyword. Cross-reference the linking layer on our food and beverage web design page.
Link equity from ingredient guides to SKU pages
Link equity from ingredient guides passes to SKU pages when the guide’s comparison table names the hero SKU in the winning column with a product card, and when the guide’s body links to 3 to 6 recipes that use the winning ingredient. This 3-hop path (guide to recipe to SKU) pushes authority from a high-traffic informational query down to a high-intent transactional page. According to Search Engine Land SEO coverage, informational content that internally links to transactional pages produces 2 to 4 times higher organic revenue than isolated content silos.
Wrapping up content marketing for food brands
Content marketing for food brands is the organic engine that turns a DTC snack, drink, or CPG storefront into a search-driven revenue channel. Recipe hub of 40 to 100 recipes. Ingredient comparison guides at 12 to 24 pieces. Sourcing story pages at 6 to 12 pieces. Buyer intent content at 8 to 16 pieces. Creator syndication calendar with 12 to 30 creators per quarter. Refresh cadence at 12 to 24 months by pillar. Reporting with organic sessions and organic revenue attribution.
If your DTC food brand is running paid social at 20,000 dollars monthly with a broken blog and zero recipe schema, professional content marketing for food brands pays for itself inside the first 90 days on organic traffic captured. Redefine Web ships content marketing inside our monthly retainer packages. Book a call and we will walk through the last three DTC food brands we built recipe hubs for, pillar by pillar.
Content marketing for food brands starts with a recipe hub because recipe queries account for 40 to 60 percent of high-intent search volume in the food category. Every hero SKU needs 4 to 12 recipes anchored to it, each targeting a specific occasion and audience.
Skip the recipe hub and the brand loses the search real estate that pulls DTC storefront traffic month over month at zero incremental paid cost. Recipe traffic converts at 2 to 4 percent because the shopper landed with usage intent, not passive discovery, which is why food brands win on recipes.
Recipe schema and Google rich result eligibility
Every recipe page ships schema.org Recipe markup including cookTime, prepTime, recipeIngredient, recipeInstructions, nutrition, and aggregateRating. Correctly marked-up recipes qualify for Google’s recipe rich result carousel that pulls 3 to 6 times higher click-through rate than a plain blue link. The schema layer takes 15 minutes per recipe to author and 30 minutes to validate in Google Search Console. Cross-reference the recipe search stack on our food and beverage SEO page.
Recipe hub structure that scales
The recipe hub structure runs 40 to 100 recipes at maturity, organized by hero SKU (4 to 12 recipes per SKU) plus occasion tags (breakfast, weeknight dinner, meal prep, brunch, holiday). Every recipe links back to the hero SKU product page with the SKU embedded in an inline card. The hub earns internal linking value from ingredient comparison guides and the sourcing story pages, which feeds recipe ranking on Google. According to Google Search Central recipe structured data guidance, complete Recipe schema markup is required for eligibility in the recipe carousel and the ingredient search filter.
Pillar structure for food brand content marketing
The pillar structure on content marketing for food brands runs 4 content pillars concurrently: recipe hub (40 to 100 recipes), ingredient comparison guides (12 to 24 guides), sourcing story pages (6 to 12 pages), and buyer intent content (where to buy, subscription vs. one-time, gift bundle guides). Every pillar covers a distinct search intent and every pillar links back to the hero SKU product pages.
Ingredient comparison guide format
Ingredient comparison guides run 1,800 to 3,200 words comparing 2 to 4 ingredient types on 6 to 10 attributes with a comparison table, real-world use case examples, and links to the hero SKU that uses the specific ingredient. Example: organic vs. conventional oats compares nutritional profile, sourcing chain, cost, environmental impact, and taste on a 6-column table. The brand’s SKU appears in the winning column with a product card. These guides rank 3 to 8 months after publication and pull steady-state organic traffic.
Sourcing story pages that build trust
Sourcing story pages name the specific farms, cooperatives, or suppliers the brand sources from, with photos of the farms, farmer quotes, and specific harvest windows. A coffee brand’s Ethiopian farm page ranks for “single-origin Ethiopian coffee” and “Yirgacheffe coffee origin” plus 40 long-tail variations. The sourcing page pulls trust-building traffic that converts at 4 to 6 percent because the shopper landed pattern-matching on transparency and named provenance. Every sourcing page includes farmer or cooperative quotes, harvest dates, and a link back to 3 to 5 hero SKU pages that source from the named supplier.
Vejrø hospitality content case study
Vejrø Resort, a Danish private-island destination with an on-site restaurant focused on organic, locally sourced cuisine, joined us with strong social engagement and no organic-search real estate. Guests found the resort on Instagram but never in Google search for terms like “private island resort Denmark,” “farm-to-table hospitality Denmark,” or “Vejrø restaurant.” The same organic-search gap shows up on DTC food brands running paid social at 20,000 dollars monthly with a broken blog and zero recipe schema.
We built the conversion-focused website with on-site and off-site SEO tuned to the travel-niche keyword clusters, competitor analysis against comparable boutique resorts, and mobile-first design prioritizing guest discovery. Every page carried the structured data qualifying it for Google’s rich results in the hospitality category. Every internal link pushed authority toward the direct-booking conversion path.
Three months later, Vejrø hit 10,000 plus organic visitors, ranked for 200 plus first-page keywords, and pulled a 2.2 percent booking conversion rate from organic traffic. The same pattern applies to content marketing for food brands: recipe schema, ingredient comparison guides, and sourcing story pages pull organic traffic at 20 to 40 percent conversion into hero SKU pages inside 6 months when the content quality matches search intent and every page carries the right structured data markup. Vejrø also proved out the reporting discipline: every monthly report named the exact page, the exact keyword cluster, and the exact search feature (rich result, sitelinks, image pack) driving the incremental organic revenue instead of hiding behind aggregate traffic charts.
Recipe cadence and content calendar for food brands
Recipe cadence on a working food brand content calendar ships 2 to 4 new recipes per week during the first 6 months and drops to 1 per week at maturity. Each recipe takes 4 to 6 hours to produce (write, test in the kitchen, photograph, schema author, publish). At 3 recipes per week, the brand hits 78 recipes inside 6 months plus a backlog of ingredient comparison and sourcing content queued behind the recipe production line.
| Content pillar | Target volume year 1 | Production cost per piece | Refresh cadence |
|---|---|---|---|
| Recipe hub | 40 to 100 recipes | $180 to $320 | Every 12 months |
| Ingredient comparison guides | 12 to 24 guides | $450 to $780 | Every 18 months |
| Sourcing story pages | 6 to 12 pages | $680 to $1,200 | Every 24 months |
| Buyer intent content | 8 to 16 pieces | $220 to $420 | Every 12 months |
Photography as a content calendar constraint
Photography is the actual constraint on recipe cadence, not writing. Every recipe needs 6 to 12 photos: hero shot, ingredient flat lay, prep in progress, plated result, storage, and step shots for the schema markup. A working food brand batches photography 8 recipes at a time to keep the cost per recipe under 200 dollars. Skip the batching and the per-recipe cost climbs to 400 to 600 dollars, which caps recipe cadence at 1 per week and slows organic ranking timeline by 6 months.
Seasonal content calendar planning
Seasonal content calendar planning maps recipes and comparison guides to the seasonal windows they need to rank in. A Christmas cookie recipe needs to publish in September to rank by early December. A Valentine’s chocolate guide needs to publish in November to rank by early February. A back-to-school lunchbox recipe needs to publish in June to rank by late August. The 60-to-90-day ranking curve dictates the calendar.
Creator syndication inside food brand content
Creator syndication on food brand content marketing amplifies the recipe hub through Instagram Reels, TikTok, and YouTube Shorts creators paid to post their own version of the brand’s hero recipes. The creator content pulls net-new audiences into the recipe hub through the creator’s Link in Bio or Amazon Storefront tag. The syndication calendar names 12 to 30 creators per quarter with specific recipes assigned to each.
One brand we picked up had a spreadsheet titled “creator outreach 2023” with 47 rows and 3 responses. All 3 responses were auto-replies. The spreadsheet named zero recipes and offered flat rates below 100 dollars per post. Nobody posts a 30-second video for 87 dollars flat. Nobody.
Creator content commercial terms that work
Working creator content commercial terms run 350 to 1,500 dollars flat per post plus a 12 to 25 percent commission on tagged sales across a 30-day window. The commission mechanic pulls creators into follow-up posts because the incremental revenue continues past the initial fee. Mid-tier creators (30k to 150k followers) hit the sweet spot for food brand content because their engagement rate typically runs 4 to 8 percent versus 0.8 to 1.6 percent on mega-creators.
Content brief structure for creator partnerships
The content brief structure for creator partnerships runs a single page: the SKU, the specific recipe or usage occasion, 3 required brand mentions, 3 restricted claims (no health claims on non-medical SKUs), the pricing angle, the affiliate link, and 3 example videos that hit the tone. The brief avoids over-scripting because over-scripted creator content underperforms native creator voice by 40 to 60 percent on engagement rate.
Buyer intent content for food brand blogs
Buyer intent content on food brand blogs covers 8 to 16 pieces targeting explicit purchase-decision queries: “where to buy [brand],” “[brand] subscription vs. one-time,” “best [category] for [use case],” and “[brand] gift bundle.” Every buyer intent piece runs 1,400 to 2,400 words with a comparison table, product cards, and a clear conversion path to the specific SKU that matches the query intent. Buyer intent content converts at 3 to 6 percent versus 1 to 2 percent on recipe content because the shopper landed already planning to buy, not exploring a usage occasion.
Where-to-buy content structure
Where-to-buy content structure covers online (DTC storefront, Amazon, Target.com, Whole Foods online), retail (specific chain locators with the store finder embedded), and international (customs limitations, retailer partners abroad). Every piece names specific retailers, links to the store locator, and includes an FAQ block covering shipping availability, subscription options, and gift card compatibility. Where-to-buy content ranks for branded discovery queries the DTC storefront otherwise loses to competitor affiliate reviews.
Subscription versus one-time comparison content
Subscription versus one-time comparison content converts subscription commitments at 3 to 6 percent because it addresses the price-sensitivity concern head-on with a specific math table. The piece covers the discount structure (15 percent lifetime), the skip-a-month mechanic, the pause-anytime rule, the cancellation policy, and the specific yearly savings for the brand’s average consumption cadence. Cross-reference the retention structure on our food and beverage marketing retainer page.
Content refresh cadence on food brand pillars
Content refresh cadence on food brand content pillars runs a rolling audit every 12 to 24 months by pillar. Recipes get refreshed every 12 months with new photography, updated schema, and any nutrition or ingredient adjustments. Ingredient comparison guides refresh every 18 months to update market data. Sourcing story pages refresh every 24 months to reflect farm partnership changes and new harvest angles. Buyer intent content refreshes every 12 months to update retailer availability and pricing.
Recipe refresh priority order
Recipe refresh priority runs by organic traffic rank. The top 20 recipes by monthly organic sessions get refreshed first (new photography, schema audit, related recipe internal links, updated nutrition). The next 40 get refreshed at 15 months. The remaining recipes get refreshed opportunistically when the ranking slips past position 15 in Google. Skipping the refresh cadence lets recipe rankings drift out of the top 3 inside 18 months as newer competitor recipes take the position.
Schema audit checklist per refresh
The schema audit checklist per refresh runs 8 items: Recipe schema completeness, aggregateRating count and accuracy, nutrition data accuracy, prepTime and cookTime match the recipe body, image URLs valid at CDN, related recipe internal links working, product card SKU URL live, and Google Search Console rich result eligibility validated. This checklist takes 20 minutes per recipe and prevents the schema drift that costs recipe rankings 20 to 40 positions quietly.
Reporting cadence for food brand content marketing
Reporting cadence on food brand content marketing runs a monthly executive report plus a quarterly business review. The monthly report ships in the first business week and covers organic sessions by pillar, top 10 ranking recipes with position trend, ingredient guide ranking movements, sourcing page performance, and organic-attributed DTC revenue. Every number carries a comparison to the prior month and a plain-language interpretation the founder reads in 7 minutes.
Metrics that matter for content marketing
Metrics that matter for food brand content marketing: organic sessions by pillar, recipe rich result impressions in Search Console, organic conversion rate to hero SKU pages, organic-attributed DTC revenue, and top 20 ranking positions by monthly organic sessions. Vanity metrics that do not matter: total pageviews without conversion context, average time on page without conversion attribution, and social share counts. The monthly report skips the vanity block entirely.
Quarterly business review structure
The quarterly business review runs 90 minutes with the founder, head of content, and SEO lead. Agenda: organic traffic trend by pillar, top 10 winning content pieces, top 10 losing content pieces (candidates for refresh or removal), competitive gap analysis against 5 named competitor brands, and next quarter’s content calendar with recipes and ingredient guides queued. According to Ahrefs content marketing research, brands running quarterly content audits outperform brands running annual audits by 40 to 70 percent on organic revenue over a 24-month window.
Internal linking discipline across food brand content
Internal linking discipline across food brand content moves authority from recipe pages toward hero SKU product pages and comparison guides. Every recipe links to the hero SKU it uses inline (once in the ingredient list, once in a bottom call-out card). Every ingredient comparison guide links to 3 to 6 recipes using the winning ingredient plus the hero SKU product page. Every sourcing story links to the 2 to 4 SKUs sourced from that specific farm or cooperative.
Anchor text strategy across recipe hubs
Anchor text on internal links varies across recipe hubs to avoid over-optimization patterns Google penalizes. Exact-match anchor (“single-origin Ethiopian coffee”) runs on 20 to 30 percent of internal links. Partial-match variations (“our Ethiopian roast”) run on 30 to 40 percent. Branded anchors (the SKU name) run on 20 to 30 percent. Generic anchors (“shop the coffee”) fill the remaining 10 to 20 percent. This ratio holds ranking without triggering the over-optimization penalty that shows up on brands that anchor-text-stuff every internal link with the same exact-match keyword. Cross-reference the linking layer on our food and beverage web design page.
Link equity from ingredient guides to SKU pages
Link equity from ingredient guides passes to SKU pages when the guide’s comparison table names the hero SKU in the winning column with a product card, and when the guide’s body links to 3 to 6 recipes that use the winning ingredient. This 3-hop path (guide to recipe to SKU) pushes authority from a high-traffic informational query down to a high-intent transactional page. According to Search Engine Land SEO coverage, informational content that internally links to transactional pages produces 2 to 4 times higher organic revenue than isolated content silos.
Wrapping up content marketing for food brands
Content marketing for food brands is the organic engine that turns a DTC snack, drink, or CPG storefront into a search-driven revenue channel. Recipe hub of 40 to 100 recipes. Ingredient comparison guides at 12 to 24 pieces. Sourcing story pages at 6 to 12 pieces. Buyer intent content at 8 to 16 pieces. Creator syndication calendar with 12 to 30 creators per quarter. Refresh cadence at 12 to 24 months by pillar. Reporting with organic sessions and organic revenue attribution.
If your DTC food brand is running paid social at 20,000 dollars monthly with a broken blog and zero recipe schema, professional content marketing for food brands pays for itself inside the first 90 days on organic traffic captured. Redefine Web ships content marketing inside our monthly retainer packages. Book a call and we will walk through the last three DTC food brands we built recipe hubs for, pillar by pillar.
Internal linking discipline across food brand content moves authority from recipe pages toward hero SKU product pages and comparison guides. Every recipe links to the hero SKU it uses inline (once in the ingredient list, once in a bottom call-out card). Every ingredient comparison guide links to 3 to 6 recipes using the winning ingredient plus the hero SKU product page. Every sourcing story links to the 2 to 4 SKUs sourced from that specific farm or cooperative.
Anchor text strategy across recipe hubs
Anchor text on internal links varies across recipe hubs to avoid over-optimization patterns Google penalizes. Exact-match anchor (“single-origin Ethiopian coffee”) runs on 20 to 30 percent of internal links. Partial-match variations (“our Ethiopian roast”) run on 30 to 40 percent. Branded anchors (the SKU name) run on 20 to 30 percent. Generic anchors (“shop the coffee”) fill the remaining 10 to 20 percent. This ratio holds ranking without triggering the over-optimization penalty that shows up on brands that anchor-text-stuff every internal link with the same exact-match keyword. Cross-reference the linking layer on our food and beverage web design page.
Link equity from ingredient guides to SKU pages
Link equity from ingredient guides passes to SKU pages when the guide’s comparison table names the hero SKU in the winning column with a product card, and when the guide’s body links to 3 to 6 recipes that use the winning ingredient. This 3-hop path (guide to recipe to SKU) pushes authority from a high-traffic informational query down to a high-intent transactional page. According to Search Engine Land SEO coverage, informational content that internally links to transactional pages produces 2 to 4 times higher organic revenue than isolated content silos.
Wrapping up content marketing for food brands
Content marketing for food brands is the organic engine that turns a DTC snack, drink, or CPG storefront into a search-driven revenue channel. Recipe hub of 40 to 100 recipes. Ingredient comparison guides at 12 to 24 pieces. Sourcing story pages at 6 to 12 pieces. Buyer intent content at 8 to 16 pieces. Creator syndication calendar with 12 to 30 creators per quarter. Refresh cadence at 12 to 24 months by pillar. Reporting with organic sessions and organic revenue attribution.
If your DTC food brand is running paid social at 20,000 dollars monthly with a broken blog and zero recipe schema, professional content marketing for food brands pays for itself inside the first 90 days on organic traffic captured. Redefine Web ships content marketing inside our monthly retainer packages. Book a call and we will walk through the last three DTC food brands we built recipe hubs for, pillar by pillar.
Content marketing for food brands starts with a recipe hub because recipe queries account for 40 to 60 percent of high-intent search volume in the food category. Every hero SKU needs 4 to 12 recipes anchored to it, each targeting a specific occasion and audience.
Skip the recipe hub and the brand loses the search real estate that pulls DTC storefront traffic month over month at zero incremental paid cost. Recipe traffic converts at 2 to 4 percent because the shopper landed with usage intent, not passive discovery, which is why food brands win on recipes.
Recipe schema and Google rich result eligibility
Every recipe page ships schema.org Recipe markup including cookTime, prepTime, recipeIngredient, recipeInstructions, nutrition, and aggregateRating. Correctly marked-up recipes qualify for Google’s recipe rich result carousel that pulls 3 to 6 times higher click-through rate than a plain blue link. The schema layer takes 15 minutes per recipe to author and 30 minutes to validate in Google Search Console. Cross-reference the recipe search stack on our food and beverage SEO page.
Recipe hub structure that scales
The recipe hub structure runs 40 to 100 recipes at maturity, organized by hero SKU (4 to 12 recipes per SKU) plus occasion tags (breakfast, weeknight dinner, meal prep, brunch, holiday). Every recipe links back to the hero SKU product page with the SKU embedded in an inline card. The hub earns internal linking value from ingredient comparison guides and the sourcing story pages, which feeds recipe ranking on Google. According to Google Search Central recipe structured data guidance, complete Recipe schema markup is required for eligibility in the recipe carousel and the ingredient search filter.
Pillar structure for food brand content marketing
The pillar structure on content marketing for food brands runs 4 content pillars concurrently: recipe hub (40 to 100 recipes), ingredient comparison guides (12 to 24 guides), sourcing story pages (6 to 12 pages), and buyer intent content (where to buy, subscription vs. one-time, gift bundle guides). Every pillar covers a distinct search intent and every pillar links back to the hero SKU product pages.
Ingredient comparison guide format
Ingredient comparison guides run 1,800 to 3,200 words comparing 2 to 4 ingredient types on 6 to 10 attributes with a comparison table, real-world use case examples, and links to the hero SKU that uses the specific ingredient. Example: organic vs. conventional oats compares nutritional profile, sourcing chain, cost, environmental impact, and taste on a 6-column table. The brand’s SKU appears in the winning column with a product card. These guides rank 3 to 8 months after publication and pull steady-state organic traffic.
Sourcing story pages that build trust
Sourcing story pages name the specific farms, cooperatives, or suppliers the brand sources from, with photos of the farms, farmer quotes, and specific harvest windows. A coffee brand’s Ethiopian farm page ranks for “single-origin Ethiopian coffee” and “Yirgacheffe coffee origin” plus 40 long-tail variations. The sourcing page pulls trust-building traffic that converts at 4 to 6 percent because the shopper landed pattern-matching on transparency and named provenance. Every sourcing page includes farmer or cooperative quotes, harvest dates, and a link back to 3 to 5 hero SKU pages that source from the named supplier.
Vejrø hospitality content case study
Vejrø Resort, a Danish private-island destination with an on-site restaurant focused on organic, locally sourced cuisine, joined us with strong social engagement and no organic-search real estate. Guests found the resort on Instagram but never in Google search for terms like “private island resort Denmark,” “farm-to-table hospitality Denmark,” or “Vejrø restaurant.” The same organic-search gap shows up on DTC food brands running paid social at 20,000 dollars monthly with a broken blog and zero recipe schema.
We built the conversion-focused website with on-site and off-site SEO tuned to the travel-niche keyword clusters, competitor analysis against comparable boutique resorts, and mobile-first design prioritizing guest discovery. Every page carried the structured data qualifying it for Google’s rich results in the hospitality category. Every internal link pushed authority toward the direct-booking conversion path.
Three months later, Vejrø hit 10,000 plus organic visitors, ranked for 200 plus first-page keywords, and pulled a 2.2 percent booking conversion rate from organic traffic. The same pattern applies to content marketing for food brands: recipe schema, ingredient comparison guides, and sourcing story pages pull organic traffic at 20 to 40 percent conversion into hero SKU pages inside 6 months when the content quality matches search intent and every page carries the right structured data markup. Vejrø also proved out the reporting discipline: every monthly report named the exact page, the exact keyword cluster, and the exact search feature (rich result, sitelinks, image pack) driving the incremental organic revenue instead of hiding behind aggregate traffic charts.
Recipe cadence and content calendar for food brands
Recipe cadence on a working food brand content calendar ships 2 to 4 new recipes per week during the first 6 months and drops to 1 per week at maturity. Each recipe takes 4 to 6 hours to produce (write, test in the kitchen, photograph, schema author, publish). At 3 recipes per week, the brand hits 78 recipes inside 6 months plus a backlog of ingredient comparison and sourcing content queued behind the recipe production line.
| Content pillar | Target volume year 1 | Production cost per piece | Refresh cadence |
|---|---|---|---|
| Recipe hub | 40 to 100 recipes | $180 to $320 | Every 12 months |
| Ingredient comparison guides | 12 to 24 guides | $450 to $780 | Every 18 months |
| Sourcing story pages | 6 to 12 pages | $680 to $1,200 | Every 24 months |
| Buyer intent content | 8 to 16 pieces | $220 to $420 | Every 12 months |
Photography as a content calendar constraint
Photography is the actual constraint on recipe cadence, not writing. Every recipe needs 6 to 12 photos: hero shot, ingredient flat lay, prep in progress, plated result, storage, and step shots for the schema markup. A working food brand batches photography 8 recipes at a time to keep the cost per recipe under 200 dollars. Skip the batching and the per-recipe cost climbs to 400 to 600 dollars, which caps recipe cadence at 1 per week and slows organic ranking timeline by 6 months.
Seasonal content calendar planning
Seasonal content calendar planning maps recipes and comparison guides to the seasonal windows they need to rank in. A Christmas cookie recipe needs to publish in September to rank by early December. A Valentine’s chocolate guide needs to publish in November to rank by early February. A back-to-school lunchbox recipe needs to publish in June to rank by late August. The 60-to-90-day ranking curve dictates the calendar.
Creator syndication inside food brand content
Creator syndication on food brand content marketing amplifies the recipe hub through Instagram Reels, TikTok, and YouTube Shorts creators paid to post their own version of the brand’s hero recipes. The creator content pulls net-new audiences into the recipe hub through the creator’s Link in Bio or Amazon Storefront tag. The syndication calendar names 12 to 30 creators per quarter with specific recipes assigned to each.
One brand we picked up had a spreadsheet titled “creator outreach 2023” with 47 rows and 3 responses. All 3 responses were auto-replies. The spreadsheet named zero recipes and offered flat rates below 100 dollars per post. Nobody posts a 30-second video for 87 dollars flat. Nobody.
Creator content commercial terms that work
Working creator content commercial terms run 350 to 1,500 dollars flat per post plus a 12 to 25 percent commission on tagged sales across a 30-day window. The commission mechanic pulls creators into follow-up posts because the incremental revenue continues past the initial fee. Mid-tier creators (30k to 150k followers) hit the sweet spot for food brand content because their engagement rate typically runs 4 to 8 percent versus 0.8 to 1.6 percent on mega-creators.
Content brief structure for creator partnerships
The content brief structure for creator partnerships runs a single page: the SKU, the specific recipe or usage occasion, 3 required brand mentions, 3 restricted claims (no health claims on non-medical SKUs), the pricing angle, the affiliate link, and 3 example videos that hit the tone. The brief avoids over-scripting because over-scripted creator content underperforms native creator voice by 40 to 60 percent on engagement rate.
Buyer intent content for food brand blogs
Buyer intent content on food brand blogs covers 8 to 16 pieces targeting explicit purchase-decision queries: “where to buy [brand],” “[brand] subscription vs. one-time,” “best [category] for [use case],” and “[brand] gift bundle.” Every buyer intent piece runs 1,400 to 2,400 words with a comparison table, product cards, and a clear conversion path to the specific SKU that matches the query intent. Buyer intent content converts at 3 to 6 percent versus 1 to 2 percent on recipe content because the shopper landed already planning to buy, not exploring a usage occasion.
Where-to-buy content structure
Where-to-buy content structure covers online (DTC storefront, Amazon, Target.com, Whole Foods online), retail (specific chain locators with the store finder embedded), and international (customs limitations, retailer partners abroad). Every piece names specific retailers, links to the store locator, and includes an FAQ block covering shipping availability, subscription options, and gift card compatibility. Where-to-buy content ranks for branded discovery queries the DTC storefront otherwise loses to competitor affiliate reviews.
Subscription versus one-time comparison content
Subscription versus one-time comparison content converts subscription commitments at 3 to 6 percent because it addresses the price-sensitivity concern head-on with a specific math table. The piece covers the discount structure (15 percent lifetime), the skip-a-month mechanic, the pause-anytime rule, the cancellation policy, and the specific yearly savings for the brand’s average consumption cadence. Cross-reference the retention structure on our food and beverage marketing retainer page.
Content refresh cadence on food brand pillars
Content refresh cadence on food brand content pillars runs a rolling audit every 12 to 24 months by pillar. Recipes get refreshed every 12 months with new photography, updated schema, and any nutrition or ingredient adjustments. Ingredient comparison guides refresh every 18 months to update market data. Sourcing story pages refresh every 24 months to reflect farm partnership changes and new harvest angles. Buyer intent content refreshes every 12 months to update retailer availability and pricing.
Recipe refresh priority order
Recipe refresh priority runs by organic traffic rank. The top 20 recipes by monthly organic sessions get refreshed first (new photography, schema audit, related recipe internal links, updated nutrition). The next 40 get refreshed at 15 months. The remaining recipes get refreshed opportunistically when the ranking slips past position 15 in Google. Skipping the refresh cadence lets recipe rankings drift out of the top 3 inside 18 months as newer competitor recipes take the position.
Schema audit checklist per refresh
The schema audit checklist per refresh runs 8 items: Recipe schema completeness, aggregateRating count and accuracy, nutrition data accuracy, prepTime and cookTime match the recipe body, image URLs valid at CDN, related recipe internal links working, product card SKU URL live, and Google Search Console rich result eligibility validated. This checklist takes 20 minutes per recipe and prevents the schema drift that costs recipe rankings 20 to 40 positions quietly.
Reporting cadence for food brand content marketing
Reporting cadence on food brand content marketing runs a monthly executive report plus a quarterly business review. The monthly report ships in the first business week and covers organic sessions by pillar, top 10 ranking recipes with position trend, ingredient guide ranking movements, sourcing page performance, and organic-attributed DTC revenue. Every number carries a comparison to the prior month and a plain-language interpretation the founder reads in 7 minutes.
Metrics that matter for content marketing
Metrics that matter for food brand content marketing: organic sessions by pillar, recipe rich result impressions in Search Console, organic conversion rate to hero SKU pages, organic-attributed DTC revenue, and top 20 ranking positions by monthly organic sessions. Vanity metrics that do not matter: total pageviews without conversion context, average time on page without conversion attribution, and social share counts. The monthly report skips the vanity block entirely.
Quarterly business review structure
The quarterly business review runs 90 minutes with the founder, head of content, and SEO lead. Agenda: organic traffic trend by pillar, top 10 winning content pieces, top 10 losing content pieces (candidates for refresh or removal), competitive gap analysis against 5 named competitor brands, and next quarter’s content calendar with recipes and ingredient guides queued. According to Ahrefs content marketing research, brands running quarterly content audits outperform brands running annual audits by 40 to 70 percent on organic revenue over a 24-month window.
Internal linking discipline across food brand content
Internal linking discipline across food brand content moves authority from recipe pages toward hero SKU product pages and comparison guides. Every recipe links to the hero SKU it uses inline (once in the ingredient list, once in a bottom call-out card). Every ingredient comparison guide links to 3 to 6 recipes using the winning ingredient plus the hero SKU product page. Every sourcing story links to the 2 to 4 SKUs sourced from that specific farm or cooperative.
Anchor text strategy across recipe hubs
Anchor text on internal links varies across recipe hubs to avoid over-optimization patterns Google penalizes. Exact-match anchor (“single-origin Ethiopian coffee”) runs on 20 to 30 percent of internal links. Partial-match variations (“our Ethiopian roast”) run on 30 to 40 percent. Branded anchors (the SKU name) run on 20 to 30 percent. Generic anchors (“shop the coffee”) fill the remaining 10 to 20 percent. This ratio holds ranking without triggering the over-optimization penalty that shows up on brands that anchor-text-stuff every internal link with the same exact-match keyword. Cross-reference the linking layer on our food and beverage web design page.
Link equity from ingredient guides to SKU pages
Link equity from ingredient guides passes to SKU pages when the guide’s comparison table names the hero SKU in the winning column with a product card, and when the guide’s body links to 3 to 6 recipes that use the winning ingredient. This 3-hop path (guide to recipe to SKU) pushes authority from a high-traffic informational query down to a high-intent transactional page. According to Search Engine Land SEO coverage, informational content that internally links to transactional pages produces 2 to 4 times higher organic revenue than isolated content silos.
Wrapping up content marketing for food brands
Content marketing for food brands is the organic engine that turns a DTC snack, drink, or CPG storefront into a search-driven revenue channel. Recipe hub of 40 to 100 recipes. Ingredient comparison guides at 12 to 24 pieces. Sourcing story pages at 6 to 12 pieces. Buyer intent content at 8 to 16 pieces. Creator syndication calendar with 12 to 30 creators per quarter. Refresh cadence at 12 to 24 months by pillar. Reporting with organic sessions and organic revenue attribution.
If your DTC food brand is running paid social at 20,000 dollars monthly with a broken blog and zero recipe schema, professional content marketing for food brands pays for itself inside the first 90 days on organic traffic captured. Redefine Web ships content marketing inside our monthly retainer packages. Book a call and we will walk through the last three DTC food brands we built recipe hubs for, pillar by pillar.
Content marketing for food brands starts with a recipe hub because recipe queries account for 40 to 60 percent of high-intent search volume in the food category. Every hero SKU needs 4 to 12 recipes anchored to it, each targeting a specific occasion and audience.
Skip the recipe hub and the brand loses the search real estate that pulls DTC storefront traffic month over month at zero incremental paid cost. Recipe traffic converts at 2 to 4 percent because the shopper landed with usage intent, not passive discovery, which is why food brands win on recipes.
Recipe schema and Google rich result eligibility
Every recipe page ships schema.org Recipe markup including cookTime, prepTime, recipeIngredient, recipeInstructions, nutrition, and aggregateRating. Correctly marked-up recipes qualify for Google’s recipe rich result carousel that pulls 3 to 6 times higher click-through rate than a plain blue link. The schema layer takes 15 minutes per recipe to author and 30 minutes to validate in Google Search Console. Cross-reference the recipe search stack on our food and beverage SEO page.
Recipe hub structure that scales
The recipe hub structure runs 40 to 100 recipes at maturity, organized by hero SKU (4 to 12 recipes per SKU) plus occasion tags (breakfast, weeknight dinner, meal prep, brunch, holiday). Every recipe links back to the hero SKU product page with the SKU embedded in an inline card. The hub earns internal linking value from ingredient comparison guides and the sourcing story pages, which feeds recipe ranking on Google. According to Google Search Central recipe structured data guidance, complete Recipe schema markup is required for eligibility in the recipe carousel and the ingredient search filter.
Pillar structure for food brand content marketing
The pillar structure on content marketing for food brands runs 4 content pillars concurrently: recipe hub (40 to 100 recipes), ingredient comparison guides (12 to 24 guides), sourcing story pages (6 to 12 pages), and buyer intent content (where to buy, subscription vs. one-time, gift bundle guides). Every pillar covers a distinct search intent and every pillar links back to the hero SKU product pages.
Ingredient comparison guide format
Ingredient comparison guides run 1,800 to 3,200 words comparing 2 to 4 ingredient types on 6 to 10 attributes with a comparison table, real-world use case examples, and links to the hero SKU that uses the specific ingredient. Example: organic vs. conventional oats compares nutritional profile, sourcing chain, cost, environmental impact, and taste on a 6-column table. The brand’s SKU appears in the winning column with a product card. These guides rank 3 to 8 months after publication and pull steady-state organic traffic.
Sourcing story pages that build trust
Sourcing story pages name the specific farms, cooperatives, or suppliers the brand sources from, with photos of the farms, farmer quotes, and specific harvest windows. A coffee brand’s Ethiopian farm page ranks for “single-origin Ethiopian coffee” and “Yirgacheffe coffee origin” plus 40 long-tail variations. The sourcing page pulls trust-building traffic that converts at 4 to 6 percent because the shopper landed pattern-matching on transparency and named provenance. Every sourcing page includes farmer or cooperative quotes, harvest dates, and a link back to 3 to 5 hero SKU pages that source from the named supplier.
Vejrø hospitality content case study
Vejrø Resort, a Danish private-island destination with an on-site restaurant focused on organic, locally sourced cuisine, joined us with strong social engagement and no organic-search real estate. Guests found the resort on Instagram but never in Google search for terms like “private island resort Denmark,” “farm-to-table hospitality Denmark,” or “Vejrø restaurant.” The same organic-search gap shows up on DTC food brands running paid social at 20,000 dollars monthly with a broken blog and zero recipe schema.
We built the conversion-focused website with on-site and off-site SEO tuned to the travel-niche keyword clusters, competitor analysis against comparable boutique resorts, and mobile-first design prioritizing guest discovery. Every page carried the structured data qualifying it for Google’s rich results in the hospitality category. Every internal link pushed authority toward the direct-booking conversion path.
Three months later, Vejrø hit 10,000 plus organic visitors, ranked for 200 plus first-page keywords, and pulled a 2.2 percent booking conversion rate from organic traffic. The same pattern applies to content marketing for food brands: recipe schema, ingredient comparison guides, and sourcing story pages pull organic traffic at 20 to 40 percent conversion into hero SKU pages inside 6 months when the content quality matches search intent and every page carries the right structured data markup. Vejrø also proved out the reporting discipline: every monthly report named the exact page, the exact keyword cluster, and the exact search feature (rich result, sitelinks, image pack) driving the incremental organic revenue instead of hiding behind aggregate traffic charts.
Recipe cadence and content calendar for food brands
Recipe cadence on a working food brand content calendar ships 2 to 4 new recipes per week during the first 6 months and drops to 1 per week at maturity. Each recipe takes 4 to 6 hours to produce (write, test in the kitchen, photograph, schema author, publish). At 3 recipes per week, the brand hits 78 recipes inside 6 months plus a backlog of ingredient comparison and sourcing content queued behind the recipe production line.
| Content pillar | Target volume year 1 | Production cost per piece | Refresh cadence |
|---|---|---|---|
| Recipe hub | 40 to 100 recipes | $180 to $320 | Every 12 months |
| Ingredient comparison guides | 12 to 24 guides | $450 to $780 | Every 18 months |
| Sourcing story pages | 6 to 12 pages | $680 to $1,200 | Every 24 months |
| Buyer intent content | 8 to 16 pieces | $220 to $420 | Every 12 months |
Photography as a content calendar constraint
Photography is the actual constraint on recipe cadence, not writing. Every recipe needs 6 to 12 photos: hero shot, ingredient flat lay, prep in progress, plated result, storage, and step shots for the schema markup. A working food brand batches photography 8 recipes at a time to keep the cost per recipe under 200 dollars. Skip the batching and the per-recipe cost climbs to 400 to 600 dollars, which caps recipe cadence at 1 per week and slows organic ranking timeline by 6 months.
Seasonal content calendar planning
Seasonal content calendar planning maps recipes and comparison guides to the seasonal windows they need to rank in. A Christmas cookie recipe needs to publish in September to rank by early December. A Valentine’s chocolate guide needs to publish in November to rank by early February. A back-to-school lunchbox recipe needs to publish in June to rank by late August. The 60-to-90-day ranking curve dictates the calendar.
Creator syndication inside food brand content
Creator syndication on food brand content marketing amplifies the recipe hub through Instagram Reels, TikTok, and YouTube Shorts creators paid to post their own version of the brand’s hero recipes. The creator content pulls net-new audiences into the recipe hub through the creator’s Link in Bio or Amazon Storefront tag. The syndication calendar names 12 to 30 creators per quarter with specific recipes assigned to each.
One brand we picked up had a spreadsheet titled “creator outreach 2023” with 47 rows and 3 responses. All 3 responses were auto-replies. The spreadsheet named zero recipes and offered flat rates below 100 dollars per post. Nobody posts a 30-second video for 87 dollars flat. Nobody.
Creator content commercial terms that work
Working creator content commercial terms run 350 to 1,500 dollars flat per post plus a 12 to 25 percent commission on tagged sales across a 30-day window. The commission mechanic pulls creators into follow-up posts because the incremental revenue continues past the initial fee. Mid-tier creators (30k to 150k followers) hit the sweet spot for food brand content because their engagement rate typically runs 4 to 8 percent versus 0.8 to 1.6 percent on mega-creators.
Content brief structure for creator partnerships
The content brief structure for creator partnerships runs a single page: the SKU, the specific recipe or usage occasion, 3 required brand mentions, 3 restricted claims (no health claims on non-medical SKUs), the pricing angle, the affiliate link, and 3 example videos that hit the tone. The brief avoids over-scripting because over-scripted creator content underperforms native creator voice by 40 to 60 percent on engagement rate.
Buyer intent content for food brand blogs
Buyer intent content on food brand blogs covers 8 to 16 pieces targeting explicit purchase-decision queries: “where to buy [brand],” “[brand] subscription vs. one-time,” “best [category] for [use case],” and “[brand] gift bundle.” Every buyer intent piece runs 1,400 to 2,400 words with a comparison table, product cards, and a clear conversion path to the specific SKU that matches the query intent. Buyer intent content converts at 3 to 6 percent versus 1 to 2 percent on recipe content because the shopper landed already planning to buy, not exploring a usage occasion.
Where-to-buy content structure
Where-to-buy content structure covers online (DTC storefront, Amazon, Target.com, Whole Foods online), retail (specific chain locators with the store finder embedded), and international (customs limitations, retailer partners abroad). Every piece names specific retailers, links to the store locator, and includes an FAQ block covering shipping availability, subscription options, and gift card compatibility. Where-to-buy content ranks for branded discovery queries the DTC storefront otherwise loses to competitor affiliate reviews.
Subscription versus one-time comparison content
Subscription versus one-time comparison content converts subscription commitments at 3 to 6 percent because it addresses the price-sensitivity concern head-on with a specific math table. The piece covers the discount structure (15 percent lifetime), the skip-a-month mechanic, the pause-anytime rule, the cancellation policy, and the specific yearly savings for the brand’s average consumption cadence. Cross-reference the retention structure on our food and beverage marketing retainer page.
Content refresh cadence on food brand pillars
Content refresh cadence on food brand content pillars runs a rolling audit every 12 to 24 months by pillar. Recipes get refreshed every 12 months with new photography, updated schema, and any nutrition or ingredient adjustments. Ingredient comparison guides refresh every 18 months to update market data. Sourcing story pages refresh every 24 months to reflect farm partnership changes and new harvest angles. Buyer intent content refreshes every 12 months to update retailer availability and pricing.
Recipe refresh priority order
Recipe refresh priority runs by organic traffic rank. The top 20 recipes by monthly organic sessions get refreshed first (new photography, schema audit, related recipe internal links, updated nutrition). The next 40 get refreshed at 15 months. The remaining recipes get refreshed opportunistically when the ranking slips past position 15 in Google. Skipping the refresh cadence lets recipe rankings drift out of the top 3 inside 18 months as newer competitor recipes take the position.
Schema audit checklist per refresh
The schema audit checklist per refresh runs 8 items: Recipe schema completeness, aggregateRating count and accuracy, nutrition data accuracy, prepTime and cookTime match the recipe body, image URLs valid at CDN, related recipe internal links working, product card SKU URL live, and Google Search Console rich result eligibility validated. This checklist takes 20 minutes per recipe and prevents the schema drift that costs recipe rankings 20 to 40 positions quietly.
Reporting cadence for food brand content marketing
Reporting cadence on food brand content marketing runs a monthly executive report plus a quarterly business review. The monthly report ships in the first business week and covers organic sessions by pillar, top 10 ranking recipes with position trend, ingredient guide ranking movements, sourcing page performance, and organic-attributed DTC revenue. Every number carries a comparison to the prior month and a plain-language interpretation the founder reads in 7 minutes.
Metrics that matter for content marketing
Metrics that matter for food brand content marketing: organic sessions by pillar, recipe rich result impressions in Search Console, organic conversion rate to hero SKU pages, organic-attributed DTC revenue, and top 20 ranking positions by monthly organic sessions. Vanity metrics that do not matter: total pageviews without conversion context, average time on page without conversion attribution, and social share counts. The monthly report skips the vanity block entirely.
Quarterly business review structure
The quarterly business review runs 90 minutes with the founder, head of content, and SEO lead. Agenda: organic traffic trend by pillar, top 10 winning content pieces, top 10 losing content pieces (candidates for refresh or removal), competitive gap analysis against 5 named competitor brands, and next quarter’s content calendar with recipes and ingredient guides queued. According to Ahrefs content marketing research, brands running quarterly content audits outperform brands running annual audits by 40 to 70 percent on organic revenue over a 24-month window.
Internal linking discipline across food brand content
Internal linking discipline across food brand content moves authority from recipe pages toward hero SKU product pages and comparison guides. Every recipe links to the hero SKU it uses inline (once in the ingredient list, once in a bottom call-out card). Every ingredient comparison guide links to 3 to 6 recipes using the winning ingredient plus the hero SKU product page. Every sourcing story links to the 2 to 4 SKUs sourced from that specific farm or cooperative.
Anchor text strategy across recipe hubs
Anchor text on internal links varies across recipe hubs to avoid over-optimization patterns Google penalizes. Exact-match anchor (“single-origin Ethiopian coffee”) runs on 20 to 30 percent of internal links. Partial-match variations (“our Ethiopian roast”) run on 30 to 40 percent. Branded anchors (the SKU name) run on 20 to 30 percent. Generic anchors (“shop the coffee”) fill the remaining 10 to 20 percent. This ratio holds ranking without triggering the over-optimization penalty that shows up on brands that anchor-text-stuff every internal link with the same exact-match keyword. Cross-reference the linking layer on our food and beverage web design page.
Link equity from ingredient guides to SKU pages
Link equity from ingredient guides passes to SKU pages when the guide’s comparison table names the hero SKU in the winning column with a product card, and when the guide’s body links to 3 to 6 recipes that use the winning ingredient. This 3-hop path (guide to recipe to SKU) pushes authority from a high-traffic informational query down to a high-intent transactional page. According to Search Engine Land SEO coverage, informational content that internally links to transactional pages produces 2 to 4 times higher organic revenue than isolated content silos.
Wrapping up content marketing for food brands
Content marketing for food brands is the organic engine that turns a DTC snack, drink, or CPG storefront into a search-driven revenue channel. Recipe hub of 40 to 100 recipes. Ingredient comparison guides at 12 to 24 pieces. Sourcing story pages at 6 to 12 pieces. Buyer intent content at 8 to 16 pieces. Creator syndication calendar with 12 to 30 creators per quarter. Refresh cadence at 12 to 24 months by pillar. Reporting with organic sessions and organic revenue attribution.
If your DTC food brand is running paid social at 20,000 dollars monthly with a broken blog and zero recipe schema, professional content marketing for food brands pays for itself inside the first 90 days on organic traffic captured. Redefine Web ships content marketing inside our monthly retainer packages. Book a call and we will walk through the last three DTC food brands we built recipe hubs for, pillar by pillar.
Content marketing for food brands starts with a recipe hub because recipe queries account for 40 to 60 percent of high-intent search volume in the food category. Every hero SKU needs 4 to 12 recipes anchored to it, each targeting a specific occasion and audience.
Skip the recipe hub and the brand loses the search real estate that pulls DTC storefront traffic month over month at zero incremental paid cost. Recipe traffic converts at 2 to 4 percent because the shopper landed with usage intent, not passive discovery, which is why food brands win on recipes.
Recipe schema and Google rich result eligibility
Every recipe page ships schema.org Recipe markup including cookTime, prepTime, recipeIngredient, recipeInstructions, nutrition, and aggregateRating. Correctly marked-up recipes qualify for Google’s recipe rich result carousel that pulls 3 to 6 times higher click-through rate than a plain blue link. The schema layer takes 15 minutes per recipe to author and 30 minutes to validate in Google Search Console. Cross-reference the recipe search stack on our food and beverage SEO page.
Recipe hub structure that scales
The recipe hub structure runs 40 to 100 recipes at maturity, organized by hero SKU (4 to 12 recipes per SKU) plus occasion tags (breakfast, weeknight dinner, meal prep, brunch, holiday). Every recipe links back to the hero SKU product page with the SKU embedded in an inline card. The hub earns internal linking value from ingredient comparison guides and the sourcing story pages, which feeds recipe ranking on Google. According to Google Search Central recipe structured data guidance, complete Recipe schema markup is required for eligibility in the recipe carousel and the ingredient search filter.
Pillar structure for food brand content marketing
The pillar structure on content marketing for food brands runs 4 content pillars concurrently: recipe hub (40 to 100 recipes), ingredient comparison guides (12 to 24 guides), sourcing story pages (6 to 12 pages), and buyer intent content (where to buy, subscription vs. one-time, gift bundle guides). Every pillar covers a distinct search intent and every pillar links back to the hero SKU product pages.
Ingredient comparison guide format
Ingredient comparison guides run 1,800 to 3,200 words comparing 2 to 4 ingredient types on 6 to 10 attributes with a comparison table, real-world use case examples, and links to the hero SKU that uses the specific ingredient. Example: organic vs. conventional oats compares nutritional profile, sourcing chain, cost, environmental impact, and taste on a 6-column table. The brand’s SKU appears in the winning column with a product card. These guides rank 3 to 8 months after publication and pull steady-state organic traffic.
Sourcing story pages that build trust
Sourcing story pages name the specific farms, cooperatives, or suppliers the brand sources from, with photos of the farms, farmer quotes, and specific harvest windows. A coffee brand’s Ethiopian farm page ranks for “single-origin Ethiopian coffee” and “Yirgacheffe coffee origin” plus 40 long-tail variations. The sourcing page pulls trust-building traffic that converts at 4 to 6 percent because the shopper landed pattern-matching on transparency and named provenance. Every sourcing page includes farmer or cooperative quotes, harvest dates, and a link back to 3 to 5 hero SKU pages that source from the named supplier.
Vejrø hospitality content case study
Vejrø Resort, a Danish private-island destination with an on-site restaurant focused on organic, locally sourced cuisine, joined us with strong social engagement and no organic-search real estate. Guests found the resort on Instagram but never in Google search for terms like “private island resort Denmark,” “farm-to-table hospitality Denmark,” or “Vejrø restaurant.” The same organic-search gap shows up on DTC food brands running paid social at 20,000 dollars monthly with a broken blog and zero recipe schema.
We built the conversion-focused website with on-site and off-site SEO tuned to the travel-niche keyword clusters, competitor analysis against comparable boutique resorts, and mobile-first design prioritizing guest discovery. Every page carried the structured data qualifying it for Google’s rich results in the hospitality category. Every internal link pushed authority toward the direct-booking conversion path.
Three months later, Vejrø hit 10,000 plus organic visitors, ranked for 200 plus first-page keywords, and pulled a 2.2 percent booking conversion rate from organic traffic. The same pattern applies to content marketing for food brands: recipe schema, ingredient comparison guides, and sourcing story pages pull organic traffic at 20 to 40 percent conversion into hero SKU pages inside 6 months when the content quality matches search intent and every page carries the right structured data markup. Vejrø also proved out the reporting discipline: every monthly report named the exact page, the exact keyword cluster, and the exact search feature (rich result, sitelinks, image pack) driving the incremental organic revenue instead of hiding behind aggregate traffic charts.
Recipe cadence and content calendar for food brands
Recipe cadence on a working food brand content calendar ships 2 to 4 new recipes per week during the first 6 months and drops to 1 per week at maturity. Each recipe takes 4 to 6 hours to produce (write, test in the kitchen, photograph, schema author, publish). At 3 recipes per week, the brand hits 78 recipes inside 6 months plus a backlog of ingredient comparison and sourcing content queued behind the recipe production line.
| Content pillar | Target volume year 1 | Production cost per piece | Refresh cadence |
|---|---|---|---|
| Recipe hub | 40 to 100 recipes | $180 to $320 | Every 12 months |
| Ingredient comparison guides | 12 to 24 guides | $450 to $780 | Every 18 months |
| Sourcing story pages | 6 to 12 pages | $680 to $1,200 | Every 24 months |
| Buyer intent content | 8 to 16 pieces | $220 to $420 | Every 12 months |
Photography as a content calendar constraint
Photography is the actual constraint on recipe cadence, not writing. Every recipe needs 6 to 12 photos: hero shot, ingredient flat lay, prep in progress, plated result, storage, and step shots for the schema markup. A working food brand batches photography 8 recipes at a time to keep the cost per recipe under 200 dollars. Skip the batching and the per-recipe cost climbs to 400 to 600 dollars, which caps recipe cadence at 1 per week and slows organic ranking timeline by 6 months.
Seasonal content calendar planning
Seasonal content calendar planning maps recipes and comparison guides to the seasonal windows they need to rank in. A Christmas cookie recipe needs to publish in September to rank by early December. A Valentine’s chocolate guide needs to publish in November to rank by early February. A back-to-school lunchbox recipe needs to publish in June to rank by late August. The 60-to-90-day ranking curve dictates the calendar.
Creator syndication inside food brand content
Creator syndication on food brand content marketing amplifies the recipe hub through Instagram Reels, TikTok, and YouTube Shorts creators paid to post their own version of the brand’s hero recipes. The creator content pulls net-new audiences into the recipe hub through the creator’s Link in Bio or Amazon Storefront tag. The syndication calendar names 12 to 30 creators per quarter with specific recipes assigned to each.
One brand we picked up had a spreadsheet titled “creator outreach 2023” with 47 rows and 3 responses. All 3 responses were auto-replies. The spreadsheet named zero recipes and offered flat rates below 100 dollars per post. Nobody posts a 30-second video for 87 dollars flat. Nobody.
Creator content commercial terms that work
Working creator content commercial terms run 350 to 1,500 dollars flat per post plus a 12 to 25 percent commission on tagged sales across a 30-day window. The commission mechanic pulls creators into follow-up posts because the incremental revenue continues past the initial fee. Mid-tier creators (30k to 150k followers) hit the sweet spot for food brand content because their engagement rate typically runs 4 to 8 percent versus 0.8 to 1.6 percent on mega-creators.
Content brief structure for creator partnerships
The content brief structure for creator partnerships runs a single page: the SKU, the specific recipe or usage occasion, 3 required brand mentions, 3 restricted claims (no health claims on non-medical SKUs), the pricing angle, the affiliate link, and 3 example videos that hit the tone. The brief avoids over-scripting because over-scripted creator content underperforms native creator voice by 40 to 60 percent on engagement rate.
Buyer intent content for food brand blogs
Buyer intent content on food brand blogs covers 8 to 16 pieces targeting explicit purchase-decision queries: “where to buy [brand],” “[brand] subscription vs. one-time,” “best [category] for [use case],” and “[brand] gift bundle.” Every buyer intent piece runs 1,400 to 2,400 words with a comparison table, product cards, and a clear conversion path to the specific SKU that matches the query intent. Buyer intent content converts at 3 to 6 percent versus 1 to 2 percent on recipe content because the shopper landed already planning to buy, not exploring a usage occasion.
Where-to-buy content structure
Where-to-buy content structure covers online (DTC storefront, Amazon, Target.com, Whole Foods online), retail (specific chain locators with the store finder embedded), and international (customs limitations, retailer partners abroad). Every piece names specific retailers, links to the store locator, and includes an FAQ block covering shipping availability, subscription options, and gift card compatibility. Where-to-buy content ranks for branded discovery queries the DTC storefront otherwise loses to competitor affiliate reviews.
Subscription versus one-time comparison content
Subscription versus one-time comparison content converts subscription commitments at 3 to 6 percent because it addresses the price-sensitivity concern head-on with a specific math table. The piece covers the discount structure (15 percent lifetime), the skip-a-month mechanic, the pause-anytime rule, the cancellation policy, and the specific yearly savings for the brand’s average consumption cadence. Cross-reference the retention structure on our food and beverage marketing retainer page.
Content refresh cadence on food brand pillars
Content refresh cadence on food brand content pillars runs a rolling audit every 12 to 24 months by pillar. Recipes get refreshed every 12 months with new photography, updated schema, and any nutrition or ingredient adjustments. Ingredient comparison guides refresh every 18 months to update market data. Sourcing story pages refresh every 24 months to reflect farm partnership changes and new harvest angles. Buyer intent content refreshes every 12 months to update retailer availability and pricing.
Recipe refresh priority order
Recipe refresh priority runs by organic traffic rank. The top 20 recipes by monthly organic sessions get refreshed first (new photography, schema audit, related recipe internal links, updated nutrition). The next 40 get refreshed at 15 months. The remaining recipes get refreshed opportunistically when the ranking slips past position 15 in Google. Skipping the refresh cadence lets recipe rankings drift out of the top 3 inside 18 months as newer competitor recipes take the position.
Schema audit checklist per refresh
The schema audit checklist per refresh runs 8 items: Recipe schema completeness, aggregateRating count and accuracy, nutrition data accuracy, prepTime and cookTime match the recipe body, image URLs valid at CDN, related recipe internal links working, product card SKU URL live, and Google Search Console rich result eligibility validated. This checklist takes 20 minutes per recipe and prevents the schema drift that costs recipe rankings 20 to 40 positions quietly.
Reporting cadence for food brand content marketing
Reporting cadence on food brand content marketing runs a monthly executive report plus a quarterly business review. The monthly report ships in the first business week and covers organic sessions by pillar, top 10 ranking recipes with position trend, ingredient guide ranking movements, sourcing page performance, and organic-attributed DTC revenue. Every number carries a comparison to the prior month and a plain-language interpretation the founder reads in 7 minutes.
Metrics that matter for content marketing
Metrics that matter for food brand content marketing: organic sessions by pillar, recipe rich result impressions in Search Console, organic conversion rate to hero SKU pages, organic-attributed DTC revenue, and top 20 ranking positions by monthly organic sessions. Vanity metrics that do not matter: total pageviews without conversion context, average time on page without conversion attribution, and social share counts. The monthly report skips the vanity block entirely.
Quarterly business review structure
The quarterly business review runs 90 minutes with the founder, head of content, and SEO lead. Agenda: organic traffic trend by pillar, top 10 winning content pieces, top 10 losing content pieces (candidates for refresh or removal), competitive gap analysis against 5 named competitor brands, and next quarter’s content calendar with recipes and ingredient guides queued. According to Ahrefs content marketing research, brands running quarterly content audits outperform brands running annual audits by 40 to 70 percent on organic revenue over a 24-month window.
Internal linking discipline across food brand content
Internal linking discipline across food brand content moves authority from recipe pages toward hero SKU product pages and comparison guides. Every recipe links to the hero SKU it uses inline (once in the ingredient list, once in a bottom call-out card). Every ingredient comparison guide links to 3 to 6 recipes using the winning ingredient plus the hero SKU product page. Every sourcing story links to the 2 to 4 SKUs sourced from that specific farm or cooperative.
Anchor text strategy across recipe hubs
Anchor text on internal links varies across recipe hubs to avoid over-optimization patterns Google penalizes. Exact-match anchor (“single-origin Ethiopian coffee”) runs on 20 to 30 percent of internal links. Partial-match variations (“our Ethiopian roast”) run on 30 to 40 percent. Branded anchors (the SKU name) run on 20 to 30 percent. Generic anchors (“shop the coffee”) fill the remaining 10 to 20 percent. This ratio holds ranking without triggering the over-optimization penalty that shows up on brands that anchor-text-stuff every internal link with the same exact-match keyword. Cross-reference the linking layer on our food and beverage web design page.
Link equity from ingredient guides to SKU pages
Link equity from ingredient guides passes to SKU pages when the guide’s comparison table names the hero SKU in the winning column with a product card, and when the guide’s body links to 3 to 6 recipes that use the winning ingredient. This 3-hop path (guide to recipe to SKU) pushes authority from a high-traffic informational query down to a high-intent transactional page. According to Search Engine Land SEO coverage, informational content that internally links to transactional pages produces 2 to 4 times higher organic revenue than isolated content silos.
Wrapping up content marketing for food brands
Content marketing for food brands is the organic engine that turns a DTC snack, drink, or CPG storefront into a search-driven revenue channel. Recipe hub of 40 to 100 recipes. Ingredient comparison guides at 12 to 24 pieces. Sourcing story pages at 6 to 12 pieces. Buyer intent content at 8 to 16 pieces. Creator syndication calendar with 12 to 30 creators per quarter. Refresh cadence at 12 to 24 months by pillar. Reporting with organic sessions and organic revenue attribution.
If your DTC food brand is running paid social at 20,000 dollars monthly with a broken blog and zero recipe schema, professional content marketing for food brands pays for itself inside the first 90 days on organic traffic captured. Redefine Web ships content marketing inside our monthly retainer packages. Book a call and we will walk through the last three DTC food brands we built recipe hubs for, pillar by pillar.
Anchor text on internal links varies across recipe hubs to avoid over-optimization patterns Google penalizes. Exact-match anchor (“single-origin Ethiopian coffee”) runs on 20 to 30 percent of internal links. Partial-match variations (“our Ethiopian roast”) run on 30 to 40 percent. Branded anchors (the SKU name) run on 20 to 30 percent. Generic anchors (“shop the coffee”) fill the remaining 10 to 20 percent. This ratio holds ranking without triggering the over-optimization penalty that shows up on brands that anchor-text-stuff every internal link with the same exact-match keyword. Cross-reference the linking layer on our food and beverage web design page.
Link equity from ingredient guides to SKU pages
Link equity from ingredient guides passes to SKU pages when the guide’s comparison table names the hero SKU in the winning column with a product card, and when the guide’s body links to 3 to 6 recipes that use the winning ingredient. This 3-hop path (guide to recipe to SKU) pushes authority from a high-traffic informational query down to a high-intent transactional page. According to Search Engine Land SEO coverage, informational content that internally links to transactional pages produces 2 to 4 times higher organic revenue than isolated content silos.
Wrapping up content marketing for food brands
Content marketing for food brands is the organic engine that turns a DTC snack, drink, or CPG storefront into a search-driven revenue channel. Recipe hub of 40 to 100 recipes. Ingredient comparison guides at 12 to 24 pieces. Sourcing story pages at 6 to 12 pieces. Buyer intent content at 8 to 16 pieces. Creator syndication calendar with 12 to 30 creators per quarter. Refresh cadence at 12 to 24 months by pillar. Reporting with organic sessions and organic revenue attribution.
If your DTC food brand is running paid social at 20,000 dollars monthly with a broken blog and zero recipe schema, professional content marketing for food brands pays for itself inside the first 90 days on organic traffic captured. Redefine Web ships content marketing inside our monthly retainer packages. Book a call and we will walk through the last three DTC food brands we built recipe hubs for, pillar by pillar.
Content marketing for food brands starts with a recipe hub because recipe queries account for 40 to 60 percent of high-intent search volume in the food category. Every hero SKU needs 4 to 12 recipes anchored to it, each targeting a specific occasion and audience.
Skip the recipe hub and the brand loses the search real estate that pulls DTC storefront traffic month over month at zero incremental paid cost. Recipe traffic converts at 2 to 4 percent because the shopper landed with usage intent, not passive discovery, which is why food brands win on recipes.
Recipe schema and Google rich result eligibility
Every recipe page ships schema.org Recipe markup including cookTime, prepTime, recipeIngredient, recipeInstructions, nutrition, and aggregateRating. Correctly marked-up recipes qualify for Google’s recipe rich result carousel that pulls 3 to 6 times higher click-through rate than a plain blue link. The schema layer takes 15 minutes per recipe to author and 30 minutes to validate in Google Search Console. Cross-reference the recipe search stack on our food and beverage SEO page.
Recipe hub structure that scales
The recipe hub structure runs 40 to 100 recipes at maturity, organized by hero SKU (4 to 12 recipes per SKU) plus occasion tags (breakfast, weeknight dinner, meal prep, brunch, holiday). Every recipe links back to the hero SKU product page with the SKU embedded in an inline card. The hub earns internal linking value from ingredient comparison guides and the sourcing story pages, which feeds recipe ranking on Google. According to Google Search Central recipe structured data guidance, complete Recipe schema markup is required for eligibility in the recipe carousel and the ingredient search filter.
Pillar structure for food brand content marketing
The pillar structure on content marketing for food brands runs 4 content pillars concurrently: recipe hub (40 to 100 recipes), ingredient comparison guides (12 to 24 guides), sourcing story pages (6 to 12 pages), and buyer intent content (where to buy, subscription vs. one-time, gift bundle guides). Every pillar covers a distinct search intent and every pillar links back to the hero SKU product pages.
Ingredient comparison guide format
Ingredient comparison guides run 1,800 to 3,200 words comparing 2 to 4 ingredient types on 6 to 10 attributes with a comparison table, real-world use case examples, and links to the hero SKU that uses the specific ingredient. Example: organic vs. conventional oats compares nutritional profile, sourcing chain, cost, environmental impact, and taste on a 6-column table. The brand’s SKU appears in the winning column with a product card. These guides rank 3 to 8 months after publication and pull steady-state organic traffic.
Sourcing story pages that build trust
Sourcing story pages name the specific farms, cooperatives, or suppliers the brand sources from, with photos of the farms, farmer quotes, and specific harvest windows. A coffee brand’s Ethiopian farm page ranks for “single-origin Ethiopian coffee” and “Yirgacheffe coffee origin” plus 40 long-tail variations. The sourcing page pulls trust-building traffic that converts at 4 to 6 percent because the shopper landed pattern-matching on transparency and named provenance. Every sourcing page includes farmer or cooperative quotes, harvest dates, and a link back to 3 to 5 hero SKU pages that source from the named supplier.
Vejrø hospitality content case study
Vejrø Resort, a Danish private-island destination with an on-site restaurant focused on organic, locally sourced cuisine, joined us with strong social engagement and no organic-search real estate. Guests found the resort on Instagram but never in Google search for terms like “private island resort Denmark,” “farm-to-table hospitality Denmark,” or “Vejrø restaurant.” The same organic-search gap shows up on DTC food brands running paid social at 20,000 dollars monthly with a broken blog and zero recipe schema.
We built the conversion-focused website with on-site and off-site SEO tuned to the travel-niche keyword clusters, competitor analysis against comparable boutique resorts, and mobile-first design prioritizing guest discovery. Every page carried the structured data qualifying it for Google’s rich results in the hospitality category. Every internal link pushed authority toward the direct-booking conversion path.
Three months later, Vejrø hit 10,000 plus organic visitors, ranked for 200 plus first-page keywords, and pulled a 2.2 percent booking conversion rate from organic traffic. The same pattern applies to content marketing for food brands: recipe schema, ingredient comparison guides, and sourcing story pages pull organic traffic at 20 to 40 percent conversion into hero SKU pages inside 6 months when the content quality matches search intent and every page carries the right structured data markup. Vejrø also proved out the reporting discipline: every monthly report named the exact page, the exact keyword cluster, and the exact search feature (rich result, sitelinks, image pack) driving the incremental organic revenue instead of hiding behind aggregate traffic charts.
Recipe cadence and content calendar for food brands
Recipe cadence on a working food brand content calendar ships 2 to 4 new recipes per week during the first 6 months and drops to 1 per week at maturity. Each recipe takes 4 to 6 hours to produce (write, test in the kitchen, photograph, schema author, publish). At 3 recipes per week, the brand hits 78 recipes inside 6 months plus a backlog of ingredient comparison and sourcing content queued behind the recipe production line.
| Content pillar | Target volume year 1 | Production cost per piece | Refresh cadence |
|---|---|---|---|
| Recipe hub | 40 to 100 recipes | $180 to $320 | Every 12 months |
| Ingredient comparison guides | 12 to 24 guides | $450 to $780 | Every 18 months |
| Sourcing story pages | 6 to 12 pages | $680 to $1,200 | Every 24 months |
| Buyer intent content | 8 to 16 pieces | $220 to $420 | Every 12 months |
Photography as a content calendar constraint
Photography is the actual constraint on recipe cadence, not writing. Every recipe needs 6 to 12 photos: hero shot, ingredient flat lay, prep in progress, plated result, storage, and step shots for the schema markup. A working food brand batches photography 8 recipes at a time to keep the cost per recipe under 200 dollars. Skip the batching and the per-recipe cost climbs to 400 to 600 dollars, which caps recipe cadence at 1 per week and slows organic ranking timeline by 6 months.
Seasonal content calendar planning
Seasonal content calendar planning maps recipes and comparison guides to the seasonal windows they need to rank in. A Christmas cookie recipe needs to publish in September to rank by early December. A Valentine’s chocolate guide needs to publish in November to rank by early February. A back-to-school lunchbox recipe needs to publish in June to rank by late August. The 60-to-90-day ranking curve dictates the calendar.
Creator syndication inside food brand content
Creator syndication on food brand content marketing amplifies the recipe hub through Instagram Reels, TikTok, and YouTube Shorts creators paid to post their own version of the brand’s hero recipes. The creator content pulls net-new audiences into the recipe hub through the creator’s Link in Bio or Amazon Storefront tag. The syndication calendar names 12 to 30 creators per quarter with specific recipes assigned to each.
One brand we picked up had a spreadsheet titled “creator outreach 2023” with 47 rows and 3 responses. All 3 responses were auto-replies. The spreadsheet named zero recipes and offered flat rates below 100 dollars per post. Nobody posts a 30-second video for 87 dollars flat. Nobody.
Creator content commercial terms that work
Working creator content commercial terms run 350 to 1,500 dollars flat per post plus a 12 to 25 percent commission on tagged sales across a 30-day window. The commission mechanic pulls creators into follow-up posts because the incremental revenue continues past the initial fee. Mid-tier creators (30k to 150k followers) hit the sweet spot for food brand content because their engagement rate typically runs 4 to 8 percent versus 0.8 to 1.6 percent on mega-creators.
Content brief structure for creator partnerships
The content brief structure for creator partnerships runs a single page: the SKU, the specific recipe or usage occasion, 3 required brand mentions, 3 restricted claims (no health claims on non-medical SKUs), the pricing angle, the affiliate link, and 3 example videos that hit the tone. The brief avoids over-scripting because over-scripted creator content underperforms native creator voice by 40 to 60 percent on engagement rate.
Buyer intent content for food brand blogs
Buyer intent content on food brand blogs covers 8 to 16 pieces targeting explicit purchase-decision queries: “where to buy [brand],” “[brand] subscription vs. one-time,” “best [category] for [use case],” and “[brand] gift bundle.” Every buyer intent piece runs 1,400 to 2,400 words with a comparison table, product cards, and a clear conversion path to the specific SKU that matches the query intent. Buyer intent content converts at 3 to 6 percent versus 1 to 2 percent on recipe content because the shopper landed already planning to buy, not exploring a usage occasion.
Where-to-buy content structure
Where-to-buy content structure covers online (DTC storefront, Amazon, Target.com, Whole Foods online), retail (specific chain locators with the store finder embedded), and international (customs limitations, retailer partners abroad). Every piece names specific retailers, links to the store locator, and includes an FAQ block covering shipping availability, subscription options, and gift card compatibility. Where-to-buy content ranks for branded discovery queries the DTC storefront otherwise loses to competitor affiliate reviews.
Subscription versus one-time comparison content
Subscription versus one-time comparison content converts subscription commitments at 3 to 6 percent because it addresses the price-sensitivity concern head-on with a specific math table. The piece covers the discount structure (15 percent lifetime), the skip-a-month mechanic, the pause-anytime rule, the cancellation policy, and the specific yearly savings for the brand’s average consumption cadence. Cross-reference the retention structure on our food and beverage marketing retainer page.
Content refresh cadence on food brand pillars
Content refresh cadence on food brand content pillars runs a rolling audit every 12 to 24 months by pillar. Recipes get refreshed every 12 months with new photography, updated schema, and any nutrition or ingredient adjustments. Ingredient comparison guides refresh every 18 months to update market data. Sourcing story pages refresh every 24 months to reflect farm partnership changes and new harvest angles. Buyer intent content refreshes every 12 months to update retailer availability and pricing.
Recipe refresh priority order
Recipe refresh priority runs by organic traffic rank. The top 20 recipes by monthly organic sessions get refreshed first (new photography, schema audit, related recipe internal links, updated nutrition). The next 40 get refreshed at 15 months. The remaining recipes get refreshed opportunistically when the ranking slips past position 15 in Google. Skipping the refresh cadence lets recipe rankings drift out of the top 3 inside 18 months as newer competitor recipes take the position.
Schema audit checklist per refresh
The schema audit checklist per refresh runs 8 items: Recipe schema completeness, aggregateRating count and accuracy, nutrition data accuracy, prepTime and cookTime match the recipe body, image URLs valid at CDN, related recipe internal links working, product card SKU URL live, and Google Search Console rich result eligibility validated. This checklist takes 20 minutes per recipe and prevents the schema drift that costs recipe rankings 20 to 40 positions quietly.
Reporting cadence for food brand content marketing
Reporting cadence on food brand content marketing runs a monthly executive report plus a quarterly business review. The monthly report ships in the first business week and covers organic sessions by pillar, top 10 ranking recipes with position trend, ingredient guide ranking movements, sourcing page performance, and organic-attributed DTC revenue. Every number carries a comparison to the prior month and a plain-language interpretation the founder reads in 7 minutes.
Metrics that matter for content marketing
Metrics that matter for food brand content marketing: organic sessions by pillar, recipe rich result impressions in Search Console, organic conversion rate to hero SKU pages, organic-attributed DTC revenue, and top 20 ranking positions by monthly organic sessions. Vanity metrics that do not matter: total pageviews without conversion context, average time on page without conversion attribution, and social share counts. The monthly report skips the vanity block entirely.
Quarterly business review structure
The quarterly business review runs 90 minutes with the founder, head of content, and SEO lead. Agenda: organic traffic trend by pillar, top 10 winning content pieces, top 10 losing content pieces (candidates for refresh or removal), competitive gap analysis against 5 named competitor brands, and next quarter’s content calendar with recipes and ingredient guides queued. According to Ahrefs content marketing research, brands running quarterly content audits outperform brands running annual audits by 40 to 70 percent on organic revenue over a 24-month window.
Internal linking discipline across food brand content
Internal linking discipline across food brand content moves authority from recipe pages toward hero SKU product pages and comparison guides. Every recipe links to the hero SKU it uses inline (once in the ingredient list, once in a bottom call-out card). Every ingredient comparison guide links to 3 to 6 recipes using the winning ingredient plus the hero SKU product page. Every sourcing story links to the 2 to 4 SKUs sourced from that specific farm or cooperative.
Anchor text strategy across recipe hubs
Anchor text on internal links varies across recipe hubs to avoid over-optimization patterns Google penalizes. Exact-match anchor (“single-origin Ethiopian coffee”) runs on 20 to 30 percent of internal links. Partial-match variations (“our Ethiopian roast”) run on 30 to 40 percent. Branded anchors (the SKU name) run on 20 to 30 percent. Generic anchors (“shop the coffee”) fill the remaining 10 to 20 percent. This ratio holds ranking without triggering the over-optimization penalty that shows up on brands that anchor-text-stuff every internal link with the same exact-match keyword. Cross-reference the linking layer on our food and beverage web design page.
Link equity from ingredient guides to SKU pages
Link equity from ingredient guides passes to SKU pages when the guide’s comparison table names the hero SKU in the winning column with a product card, and when the guide’s body links to 3 to 6 recipes that use the winning ingredient. This 3-hop path (guide to recipe to SKU) pushes authority from a high-traffic informational query down to a high-intent transactional page. According to Search Engine Land SEO coverage, informational content that internally links to transactional pages produces 2 to 4 times higher organic revenue than isolated content silos.
Wrapping up content marketing for food brands
Content marketing for food brands is the organic engine that turns a DTC snack, drink, or CPG storefront into a search-driven revenue channel. Recipe hub of 40 to 100 recipes. Ingredient comparison guides at 12 to 24 pieces. Sourcing story pages at 6 to 12 pieces. Buyer intent content at 8 to 16 pieces. Creator syndication calendar with 12 to 30 creators per quarter. Refresh cadence at 12 to 24 months by pillar. Reporting with organic sessions and organic revenue attribution.
If your DTC food brand is running paid social at 20,000 dollars monthly with a broken blog and zero recipe schema, professional content marketing for food brands pays for itself inside the first 90 days on organic traffic captured. Redefine Web ships content marketing inside our monthly retainer packages. Book a call and we will walk through the last three DTC food brands we built recipe hubs for, pillar by pillar.
Content marketing for food brands starts with a recipe hub because recipe queries account for 40 to 60 percent of high-intent search volume in the food category. Every hero SKU needs 4 to 12 recipes anchored to it, each targeting a specific occasion and audience.
Skip the recipe hub and the brand loses the search real estate that pulls DTC storefront traffic month over month at zero incremental paid cost. Recipe traffic converts at 2 to 4 percent because the shopper landed with usage intent, not passive discovery, which is why food brands win on recipes.
Recipe schema and Google rich result eligibility
Every recipe page ships schema.org Recipe markup including cookTime, prepTime, recipeIngredient, recipeInstructions, nutrition, and aggregateRating. Correctly marked-up recipes qualify for Google’s recipe rich result carousel that pulls 3 to 6 times higher click-through rate than a plain blue link. The schema layer takes 15 minutes per recipe to author and 30 minutes to validate in Google Search Console. Cross-reference the recipe search stack on our food and beverage SEO page.
Recipe hub structure that scales
The recipe hub structure runs 40 to 100 recipes at maturity, organized by hero SKU (4 to 12 recipes per SKU) plus occasion tags (breakfast, weeknight dinner, meal prep, brunch, holiday). Every recipe links back to the hero SKU product page with the SKU embedded in an inline card. The hub earns internal linking value from ingredient comparison guides and the sourcing story pages, which feeds recipe ranking on Google. According to Google Search Central recipe structured data guidance, complete Recipe schema markup is required for eligibility in the recipe carousel and the ingredient search filter.
Pillar structure for food brand content marketing
The pillar structure on content marketing for food brands runs 4 content pillars concurrently: recipe hub (40 to 100 recipes), ingredient comparison guides (12 to 24 guides), sourcing story pages (6 to 12 pages), and buyer intent content (where to buy, subscription vs. one-time, gift bundle guides). Every pillar covers a distinct search intent and every pillar links back to the hero SKU product pages.
Ingredient comparison guide format
Ingredient comparison guides run 1,800 to 3,200 words comparing 2 to 4 ingredient types on 6 to 10 attributes with a comparison table, real-world use case examples, and links to the hero SKU that uses the specific ingredient. Example: organic vs. conventional oats compares nutritional profile, sourcing chain, cost, environmental impact, and taste on a 6-column table. The brand’s SKU appears in the winning column with a product card. These guides rank 3 to 8 months after publication and pull steady-state organic traffic.
Sourcing story pages that build trust
Sourcing story pages name the specific farms, cooperatives, or suppliers the brand sources from, with photos of the farms, farmer quotes, and specific harvest windows. A coffee brand’s Ethiopian farm page ranks for “single-origin Ethiopian coffee” and “Yirgacheffe coffee origin” plus 40 long-tail variations. The sourcing page pulls trust-building traffic that converts at 4 to 6 percent because the shopper landed pattern-matching on transparency and named provenance. Every sourcing page includes farmer or cooperative quotes, harvest dates, and a link back to 3 to 5 hero SKU pages that source from the named supplier.
Vejrø hospitality content case study
Vejrø Resort, a Danish private-island destination with an on-site restaurant focused on organic, locally sourced cuisine, joined us with strong social engagement and no organic-search real estate. Guests found the resort on Instagram but never in Google search for terms like “private island resort Denmark,” “farm-to-table hospitality Denmark,” or “Vejrø restaurant.” The same organic-search gap shows up on DTC food brands running paid social at 20,000 dollars monthly with a broken blog and zero recipe schema.
We built the conversion-focused website with on-site and off-site SEO tuned to the travel-niche keyword clusters, competitor analysis against comparable boutique resorts, and mobile-first design prioritizing guest discovery. Every page carried the structured data qualifying it for Google’s rich results in the hospitality category. Every internal link pushed authority toward the direct-booking conversion path.
Three months later, Vejrø hit 10,000 plus organic visitors, ranked for 200 plus first-page keywords, and pulled a 2.2 percent booking conversion rate from organic traffic. The same pattern applies to content marketing for food brands: recipe schema, ingredient comparison guides, and sourcing story pages pull organic traffic at 20 to 40 percent conversion into hero SKU pages inside 6 months when the content quality matches search intent and every page carries the right structured data markup. Vejrø also proved out the reporting discipline: every monthly report named the exact page, the exact keyword cluster, and the exact search feature (rich result, sitelinks, image pack) driving the incremental organic revenue instead of hiding behind aggregate traffic charts.
Recipe cadence and content calendar for food brands
Recipe cadence on a working food brand content calendar ships 2 to 4 new recipes per week during the first 6 months and drops to 1 per week at maturity. Each recipe takes 4 to 6 hours to produce (write, test in the kitchen, photograph, schema author, publish). At 3 recipes per week, the brand hits 78 recipes inside 6 months plus a backlog of ingredient comparison and sourcing content queued behind the recipe production line.
| Content pillar | Target volume year 1 | Production cost per piece | Refresh cadence |
|---|---|---|---|
| Recipe hub | 40 to 100 recipes | $180 to $320 | Every 12 months |
| Ingredient comparison guides | 12 to 24 guides | $450 to $780 | Every 18 months |
| Sourcing story pages | 6 to 12 pages | $680 to $1,200 | Every 24 months |
| Buyer intent content | 8 to 16 pieces | $220 to $420 | Every 12 months |
Photography as a content calendar constraint
Photography is the actual constraint on recipe cadence, not writing. Every recipe needs 6 to 12 photos: hero shot, ingredient flat lay, prep in progress, plated result, storage, and step shots for the schema markup. A working food brand batches photography 8 recipes at a time to keep the cost per recipe under 200 dollars. Skip the batching and the per-recipe cost climbs to 400 to 600 dollars, which caps recipe cadence at 1 per week and slows organic ranking timeline by 6 months.
Seasonal content calendar planning
Seasonal content calendar planning maps recipes and comparison guides to the seasonal windows they need to rank in. A Christmas cookie recipe needs to publish in September to rank by early December. A Valentine’s chocolate guide needs to publish in November to rank by early February. A back-to-school lunchbox recipe needs to publish in June to rank by late August. The 60-to-90-day ranking curve dictates the calendar.
Creator syndication inside food brand content
Creator syndication on food brand content marketing amplifies the recipe hub through Instagram Reels, TikTok, and YouTube Shorts creators paid to post their own version of the brand’s hero recipes. The creator content pulls net-new audiences into the recipe hub through the creator’s Link in Bio or Amazon Storefront tag. The syndication calendar names 12 to 30 creators per quarter with specific recipes assigned to each.
One brand we picked up had a spreadsheet titled “creator outreach 2023” with 47 rows and 3 responses. All 3 responses were auto-replies. The spreadsheet named zero recipes and offered flat rates below 100 dollars per post. Nobody posts a 30-second video for 87 dollars flat. Nobody.
Creator content commercial terms that work
Working creator content commercial terms run 350 to 1,500 dollars flat per post plus a 12 to 25 percent commission on tagged sales across a 30-day window. The commission mechanic pulls creators into follow-up posts because the incremental revenue continues past the initial fee. Mid-tier creators (30k to 150k followers) hit the sweet spot for food brand content because their engagement rate typically runs 4 to 8 percent versus 0.8 to 1.6 percent on mega-creators.
Content brief structure for creator partnerships
The content brief structure for creator partnerships runs a single page: the SKU, the specific recipe or usage occasion, 3 required brand mentions, 3 restricted claims (no health claims on non-medical SKUs), the pricing angle, the affiliate link, and 3 example videos that hit the tone. The brief avoids over-scripting because over-scripted creator content underperforms native creator voice by 40 to 60 percent on engagement rate.
Buyer intent content for food brand blogs
Buyer intent content on food brand blogs covers 8 to 16 pieces targeting explicit purchase-decision queries: “where to buy [brand],” “[brand] subscription vs. one-time,” “best [category] for [use case],” and “[brand] gift bundle.” Every buyer intent piece runs 1,400 to 2,400 words with a comparison table, product cards, and a clear conversion path to the specific SKU that matches the query intent. Buyer intent content converts at 3 to 6 percent versus 1 to 2 percent on recipe content because the shopper landed already planning to buy, not exploring a usage occasion.
Where-to-buy content structure
Where-to-buy content structure covers online (DTC storefront, Amazon, Target.com, Whole Foods online), retail (specific chain locators with the store finder embedded), and international (customs limitations, retailer partners abroad). Every piece names specific retailers, links to the store locator, and includes an FAQ block covering shipping availability, subscription options, and gift card compatibility. Where-to-buy content ranks for branded discovery queries the DTC storefront otherwise loses to competitor affiliate reviews.
Subscription versus one-time comparison content
Subscription versus one-time comparison content converts subscription commitments at 3 to 6 percent because it addresses the price-sensitivity concern head-on with a specific math table. The piece covers the discount structure (15 percent lifetime), the skip-a-month mechanic, the pause-anytime rule, the cancellation policy, and the specific yearly savings for the brand’s average consumption cadence. Cross-reference the retention structure on our food and beverage marketing retainer page.
Content refresh cadence on food brand pillars
Content refresh cadence on food brand content pillars runs a rolling audit every 12 to 24 months by pillar. Recipes get refreshed every 12 months with new photography, updated schema, and any nutrition or ingredient adjustments. Ingredient comparison guides refresh every 18 months to update market data. Sourcing story pages refresh every 24 months to reflect farm partnership changes and new harvest angles. Buyer intent content refreshes every 12 months to update retailer availability and pricing.
Recipe refresh priority order
Recipe refresh priority runs by organic traffic rank. The top 20 recipes by monthly organic sessions get refreshed first (new photography, schema audit, related recipe internal links, updated nutrition). The next 40 get refreshed at 15 months. The remaining recipes get refreshed opportunistically when the ranking slips past position 15 in Google. Skipping the refresh cadence lets recipe rankings drift out of the top 3 inside 18 months as newer competitor recipes take the position.
Schema audit checklist per refresh
The schema audit checklist per refresh runs 8 items: Recipe schema completeness, aggregateRating count and accuracy, nutrition data accuracy, prepTime and cookTime match the recipe body, image URLs valid at CDN, related recipe internal links working, product card SKU URL live, and Google Search Console rich result eligibility validated. This checklist takes 20 minutes per recipe and prevents the schema drift that costs recipe rankings 20 to 40 positions quietly.
Reporting cadence for food brand content marketing
Reporting cadence on food brand content marketing runs a monthly executive report plus a quarterly business review. The monthly report ships in the first business week and covers organic sessions by pillar, top 10 ranking recipes with position trend, ingredient guide ranking movements, sourcing page performance, and organic-attributed DTC revenue. Every number carries a comparison to the prior month and a plain-language interpretation the founder reads in 7 minutes.
Metrics that matter for content marketing
Metrics that matter for food brand content marketing: organic sessions by pillar, recipe rich result impressions in Search Console, organic conversion rate to hero SKU pages, organic-attributed DTC revenue, and top 20 ranking positions by monthly organic sessions. Vanity metrics that do not matter: total pageviews without conversion context, average time on page without conversion attribution, and social share counts. The monthly report skips the vanity block entirely.
Quarterly business review structure
The quarterly business review runs 90 minutes with the founder, head of content, and SEO lead. Agenda: organic traffic trend by pillar, top 10 winning content pieces, top 10 losing content pieces (candidates for refresh or removal), competitive gap analysis against 5 named competitor brands, and next quarter’s content calendar with recipes and ingredient guides queued. According to Ahrefs content marketing research, brands running quarterly content audits outperform brands running annual audits by 40 to 70 percent on organic revenue over a 24-month window.
Internal linking discipline across food brand content
Internal linking discipline across food brand content moves authority from recipe pages toward hero SKU product pages and comparison guides. Every recipe links to the hero SKU it uses inline (once in the ingredient list, once in a bottom call-out card). Every ingredient comparison guide links to 3 to 6 recipes using the winning ingredient plus the hero SKU product page. Every sourcing story links to the 2 to 4 SKUs sourced from that specific farm or cooperative.
Anchor text strategy across recipe hubs
Anchor text on internal links varies across recipe hubs to avoid over-optimization patterns Google penalizes. Exact-match anchor (“single-origin Ethiopian coffee”) runs on 20 to 30 percent of internal links. Partial-match variations (“our Ethiopian roast”) run on 30 to 40 percent. Branded anchors (the SKU name) run on 20 to 30 percent. Generic anchors (“shop the coffee”) fill the remaining 10 to 20 percent. This ratio holds ranking without triggering the over-optimization penalty that shows up on brands that anchor-text-stuff every internal link with the same exact-match keyword. Cross-reference the linking layer on our food and beverage web design page.
Link equity from ingredient guides to SKU pages
Link equity from ingredient guides passes to SKU pages when the guide’s comparison table names the hero SKU in the winning column with a product card, and when the guide’s body links to 3 to 6 recipes that use the winning ingredient. This 3-hop path (guide to recipe to SKU) pushes authority from a high-traffic informational query down to a high-intent transactional page. According to Search Engine Land SEO coverage, informational content that internally links to transactional pages produces 2 to 4 times higher organic revenue than isolated content silos.
Wrapping up content marketing for food brands
Content marketing for food brands is the organic engine that turns a DTC snack, drink, or CPG storefront into a search-driven revenue channel. Recipe hub of 40 to 100 recipes. Ingredient comparison guides at 12 to 24 pieces. Sourcing story pages at 6 to 12 pieces. Buyer intent content at 8 to 16 pieces. Creator syndication calendar with 12 to 30 creators per quarter. Refresh cadence at 12 to 24 months by pillar. Reporting with organic sessions and organic revenue attribution.
If your DTC food brand is running paid social at 20,000 dollars monthly with a broken blog and zero recipe schema, professional content marketing for food brands pays for itself inside the first 90 days on organic traffic captured. Redefine Web ships content marketing inside our monthly retainer packages. Book a call and we will walk through the last three DTC food brands we built recipe hubs for, pillar by pillar.
Internal linking discipline across food brand content moves authority from recipe pages toward hero SKU product pages and comparison guides. Every recipe links to the hero SKU it uses inline (once in the ingredient list, once in a bottom call-out card). Every ingredient comparison guide links to 3 to 6 recipes using the winning ingredient plus the hero SKU product page. Every sourcing story links to the 2 to 4 SKUs sourced from that specific farm or cooperative.
Anchor text strategy across recipe hubs
Anchor text on internal links varies across recipe hubs to avoid over-optimization patterns Google penalizes. Exact-match anchor (“single-origin Ethiopian coffee”) runs on 20 to 30 percent of internal links. Partial-match variations (“our Ethiopian roast”) run on 30 to 40 percent. Branded anchors (the SKU name) run on 20 to 30 percent. Generic anchors (“shop the coffee”) fill the remaining 10 to 20 percent. This ratio holds ranking without triggering the over-optimization penalty that shows up on brands that anchor-text-stuff every internal link with the same exact-match keyword. Cross-reference the linking layer on our food and beverage web design page.
Link equity from ingredient guides to SKU pages
Link equity from ingredient guides passes to SKU pages when the guide’s comparison table names the hero SKU in the winning column with a product card, and when the guide’s body links to 3 to 6 recipes that use the winning ingredient. This 3-hop path (guide to recipe to SKU) pushes authority from a high-traffic informational query down to a high-intent transactional page. According to Search Engine Land SEO coverage, informational content that internally links to transactional pages produces 2 to 4 times higher organic revenue than isolated content silos.
Wrapping up content marketing for food brands
Content marketing for food brands is the organic engine that turns a DTC snack, drink, or CPG storefront into a search-driven revenue channel. Recipe hub of 40 to 100 recipes. Ingredient comparison guides at 12 to 24 pieces. Sourcing story pages at 6 to 12 pieces. Buyer intent content at 8 to 16 pieces. Creator syndication calendar with 12 to 30 creators per quarter. Refresh cadence at 12 to 24 months by pillar. Reporting with organic sessions and organic revenue attribution.
If your DTC food brand is running paid social at 20,000 dollars monthly with a broken blog and zero recipe schema, professional content marketing for food brands pays for itself inside the first 90 days on organic traffic captured. Redefine Web ships content marketing inside our monthly retainer packages. Book a call and we will walk through the last three DTC food brands we built recipe hubs for, pillar by pillar.
Content marketing for food brands starts with a recipe hub because recipe queries account for 40 to 60 percent of high-intent search volume in the food category. Every hero SKU needs 4 to 12 recipes anchored to it, each targeting a specific occasion and audience.
Skip the recipe hub and the brand loses the search real estate that pulls DTC storefront traffic month over month at zero incremental paid cost. Recipe traffic converts at 2 to 4 percent because the shopper landed with usage intent, not passive discovery, which is why food brands win on recipes.
Recipe schema and Google rich result eligibility
Every recipe page ships schema.org Recipe markup including cookTime, prepTime, recipeIngredient, recipeInstructions, nutrition, and aggregateRating. Correctly marked-up recipes qualify for Google’s recipe rich result carousel that pulls 3 to 6 times higher click-through rate than a plain blue link. The schema layer takes 15 minutes per recipe to author and 30 minutes to validate in Google Search Console. Cross-reference the recipe search stack on our food and beverage SEO page.
Recipe hub structure that scales
The recipe hub structure runs 40 to 100 recipes at maturity, organized by hero SKU (4 to 12 recipes per SKU) plus occasion tags (breakfast, weeknight dinner, meal prep, brunch, holiday). Every recipe links back to the hero SKU product page with the SKU embedded in an inline card. The hub earns internal linking value from ingredient comparison guides and the sourcing story pages, which feeds recipe ranking on Google. According to Google Search Central recipe structured data guidance, complete Recipe schema markup is required for eligibility in the recipe carousel and the ingredient search filter.
Pillar structure for food brand content marketing
The pillar structure on content marketing for food brands runs 4 content pillars concurrently: recipe hub (40 to 100 recipes), ingredient comparison guides (12 to 24 guides), sourcing story pages (6 to 12 pages), and buyer intent content (where to buy, subscription vs. one-time, gift bundle guides). Every pillar covers a distinct search intent and every pillar links back to the hero SKU product pages.
Ingredient comparison guide format
Ingredient comparison guides run 1,800 to 3,200 words comparing 2 to 4 ingredient types on 6 to 10 attributes with a comparison table, real-world use case examples, and links to the hero SKU that uses the specific ingredient. Example: organic vs. conventional oats compares nutritional profile, sourcing chain, cost, environmental impact, and taste on a 6-column table. The brand’s SKU appears in the winning column with a product card. These guides rank 3 to 8 months after publication and pull steady-state organic traffic.
Sourcing story pages that build trust
Sourcing story pages name the specific farms, cooperatives, or suppliers the brand sources from, with photos of the farms, farmer quotes, and specific harvest windows. A coffee brand’s Ethiopian farm page ranks for “single-origin Ethiopian coffee” and “Yirgacheffe coffee origin” plus 40 long-tail variations. The sourcing page pulls trust-building traffic that converts at 4 to 6 percent because the shopper landed pattern-matching on transparency and named provenance. Every sourcing page includes farmer or cooperative quotes, harvest dates, and a link back to 3 to 5 hero SKU pages that source from the named supplier.
Vejrø hospitality content case study
Vejrø Resort, a Danish private-island destination with an on-site restaurant focused on organic, locally sourced cuisine, joined us with strong social engagement and no organic-search real estate. Guests found the resort on Instagram but never in Google search for terms like “private island resort Denmark,” “farm-to-table hospitality Denmark,” or “Vejrø restaurant.” The same organic-search gap shows up on DTC food brands running paid social at 20,000 dollars monthly with a broken blog and zero recipe schema.
We built the conversion-focused website with on-site and off-site SEO tuned to the travel-niche keyword clusters, competitor analysis against comparable boutique resorts, and mobile-first design prioritizing guest discovery. Every page carried the structured data qualifying it for Google’s rich results in the hospitality category. Every internal link pushed authority toward the direct-booking conversion path.
Three months later, Vejrø hit 10,000 plus organic visitors, ranked for 200 plus first-page keywords, and pulled a 2.2 percent booking conversion rate from organic traffic. The same pattern applies to content marketing for food brands: recipe schema, ingredient comparison guides, and sourcing story pages pull organic traffic at 20 to 40 percent conversion into hero SKU pages inside 6 months when the content quality matches search intent and every page carries the right structured data markup. Vejrø also proved out the reporting discipline: every monthly report named the exact page, the exact keyword cluster, and the exact search feature (rich result, sitelinks, image pack) driving the incremental organic revenue instead of hiding behind aggregate traffic charts.
Recipe cadence and content calendar for food brands
Recipe cadence on a working food brand content calendar ships 2 to 4 new recipes per week during the first 6 months and drops to 1 per week at maturity. Each recipe takes 4 to 6 hours to produce (write, test in the kitchen, photograph, schema author, publish). At 3 recipes per week, the brand hits 78 recipes inside 6 months plus a backlog of ingredient comparison and sourcing content queued behind the recipe production line.
| Content pillar | Target volume year 1 | Production cost per piece | Refresh cadence |
|---|---|---|---|
| Recipe hub | 40 to 100 recipes | $180 to $320 | Every 12 months |
| Ingredient comparison guides | 12 to 24 guides | $450 to $780 | Every 18 months |
| Sourcing story pages | 6 to 12 pages | $680 to $1,200 | Every 24 months |
| Buyer intent content | 8 to 16 pieces | $220 to $420 | Every 12 months |
Photography as a content calendar constraint
Photography is the actual constraint on recipe cadence, not writing. Every recipe needs 6 to 12 photos: hero shot, ingredient flat lay, prep in progress, plated result, storage, and step shots for the schema markup. A working food brand batches photography 8 recipes at a time to keep the cost per recipe under 200 dollars. Skip the batching and the per-recipe cost climbs to 400 to 600 dollars, which caps recipe cadence at 1 per week and slows organic ranking timeline by 6 months.
Seasonal content calendar planning
Seasonal content calendar planning maps recipes and comparison guides to the seasonal windows they need to rank in. A Christmas cookie recipe needs to publish in September to rank by early December. A Valentine’s chocolate guide needs to publish in November to rank by early February. A back-to-school lunchbox recipe needs to publish in June to rank by late August. The 60-to-90-day ranking curve dictates the calendar.
Creator syndication inside food brand content
Creator syndication on food brand content marketing amplifies the recipe hub through Instagram Reels, TikTok, and YouTube Shorts creators paid to post their own version of the brand’s hero recipes. The creator content pulls net-new audiences into the recipe hub through the creator’s Link in Bio or Amazon Storefront tag. The syndication calendar names 12 to 30 creators per quarter with specific recipes assigned to each.
One brand we picked up had a spreadsheet titled “creator outreach 2023” with 47 rows and 3 responses. All 3 responses were auto-replies. The spreadsheet named zero recipes and offered flat rates below 100 dollars per post. Nobody posts a 30-second video for 87 dollars flat. Nobody.
Creator content commercial terms that work
Working creator content commercial terms run 350 to 1,500 dollars flat per post plus a 12 to 25 percent commission on tagged sales across a 30-day window. The commission mechanic pulls creators into follow-up posts because the incremental revenue continues past the initial fee. Mid-tier creators (30k to 150k followers) hit the sweet spot for food brand content because their engagement rate typically runs 4 to 8 percent versus 0.8 to 1.6 percent on mega-creators.
Content brief structure for creator partnerships
The content brief structure for creator partnerships runs a single page: the SKU, the specific recipe or usage occasion, 3 required brand mentions, 3 restricted claims (no health claims on non-medical SKUs), the pricing angle, the affiliate link, and 3 example videos that hit the tone. The brief avoids over-scripting because over-scripted creator content underperforms native creator voice by 40 to 60 percent on engagement rate.
Buyer intent content for food brand blogs
Buyer intent content on food brand blogs covers 8 to 16 pieces targeting explicit purchase-decision queries: “where to buy [brand],” “[brand] subscription vs. one-time,” “best [category] for [use case],” and “[brand] gift bundle.” Every buyer intent piece runs 1,400 to 2,400 words with a comparison table, product cards, and a clear conversion path to the specific SKU that matches the query intent. Buyer intent content converts at 3 to 6 percent versus 1 to 2 percent on recipe content because the shopper landed already planning to buy, not exploring a usage occasion.
Where-to-buy content structure
Where-to-buy content structure covers online (DTC storefront, Amazon, Target.com, Whole Foods online), retail (specific chain locators with the store finder embedded), and international (customs limitations, retailer partners abroad). Every piece names specific retailers, links to the store locator, and includes an FAQ block covering shipping availability, subscription options, and gift card compatibility. Where-to-buy content ranks for branded discovery queries the DTC storefront otherwise loses to competitor affiliate reviews.
Subscription versus one-time comparison content
Subscription versus one-time comparison content converts subscription commitments at 3 to 6 percent because it addresses the price-sensitivity concern head-on with a specific math table. The piece covers the discount structure (15 percent lifetime), the skip-a-month mechanic, the pause-anytime rule, the cancellation policy, and the specific yearly savings for the brand’s average consumption cadence. Cross-reference the retention structure on our food and beverage marketing retainer page.
Content refresh cadence on food brand pillars
Content refresh cadence on food brand content pillars runs a rolling audit every 12 to 24 months by pillar. Recipes get refreshed every 12 months with new photography, updated schema, and any nutrition or ingredient adjustments. Ingredient comparison guides refresh every 18 months to update market data. Sourcing story pages refresh every 24 months to reflect farm partnership changes and new harvest angles. Buyer intent content refreshes every 12 months to update retailer availability and pricing.
Recipe refresh priority order
Recipe refresh priority runs by organic traffic rank. The top 20 recipes by monthly organic sessions get refreshed first (new photography, schema audit, related recipe internal links, updated nutrition). The next 40 get refreshed at 15 months. The remaining recipes get refreshed opportunistically when the ranking slips past position 15 in Google. Skipping the refresh cadence lets recipe rankings drift out of the top 3 inside 18 months as newer competitor recipes take the position.
Schema audit checklist per refresh
The schema audit checklist per refresh runs 8 items: Recipe schema completeness, aggregateRating count and accuracy, nutrition data accuracy, prepTime and cookTime match the recipe body, image URLs valid at CDN, related recipe internal links working, product card SKU URL live, and Google Search Console rich result eligibility validated. This checklist takes 20 minutes per recipe and prevents the schema drift that costs recipe rankings 20 to 40 positions quietly.
Reporting cadence for food brand content marketing
Reporting cadence on food brand content marketing runs a monthly executive report plus a quarterly business review. The monthly report ships in the first business week and covers organic sessions by pillar, top 10 ranking recipes with position trend, ingredient guide ranking movements, sourcing page performance, and organic-attributed DTC revenue. Every number carries a comparison to the prior month and a plain-language interpretation the founder reads in 7 minutes.
Metrics that matter for content marketing
Metrics that matter for food brand content marketing: organic sessions by pillar, recipe rich result impressions in Search Console, organic conversion rate to hero SKU pages, organic-attributed DTC revenue, and top 20 ranking positions by monthly organic sessions. Vanity metrics that do not matter: total pageviews without conversion context, average time on page without conversion attribution, and social share counts. The monthly report skips the vanity block entirely.
Quarterly business review structure
The quarterly business review runs 90 minutes with the founder, head of content, and SEO lead. Agenda: organic traffic trend by pillar, top 10 winning content pieces, top 10 losing content pieces (candidates for refresh or removal), competitive gap analysis against 5 named competitor brands, and next quarter’s content calendar with recipes and ingredient guides queued. According to Ahrefs content marketing research, brands running quarterly content audits outperform brands running annual audits by 40 to 70 percent on organic revenue over a 24-month window.
Internal linking discipline across food brand content
Internal linking discipline across food brand content moves authority from recipe pages toward hero SKU product pages and comparison guides. Every recipe links to the hero SKU it uses inline (once in the ingredient list, once in a bottom call-out card). Every ingredient comparison guide links to 3 to 6 recipes using the winning ingredient plus the hero SKU product page. Every sourcing story links to the 2 to 4 SKUs sourced from that specific farm or cooperative.
Anchor text strategy across recipe hubs
Anchor text on internal links varies across recipe hubs to avoid over-optimization patterns Google penalizes. Exact-match anchor (“single-origin Ethiopian coffee”) runs on 20 to 30 percent of internal links. Partial-match variations (“our Ethiopian roast”) run on 30 to 40 percent. Branded anchors (the SKU name) run on 20 to 30 percent. Generic anchors (“shop the coffee”) fill the remaining 10 to 20 percent. This ratio holds ranking without triggering the over-optimization penalty that shows up on brands that anchor-text-stuff every internal link with the same exact-match keyword. Cross-reference the linking layer on our food and beverage web design page.
Link equity from ingredient guides to SKU pages
Link equity from ingredient guides passes to SKU pages when the guide’s comparison table names the hero SKU in the winning column with a product card, and when the guide’s body links to 3 to 6 recipes that use the winning ingredient. This 3-hop path (guide to recipe to SKU) pushes authority from a high-traffic informational query down to a high-intent transactional page. According to Search Engine Land SEO coverage, informational content that internally links to transactional pages produces 2 to 4 times higher organic revenue than isolated content silos.
Wrapping up content marketing for food brands
Content marketing for food brands is the organic engine that turns a DTC snack, drink, or CPG storefront into a search-driven revenue channel. Recipe hub of 40 to 100 recipes. Ingredient comparison guides at 12 to 24 pieces. Sourcing story pages at 6 to 12 pieces. Buyer intent content at 8 to 16 pieces. Creator syndication calendar with 12 to 30 creators per quarter. Refresh cadence at 12 to 24 months by pillar. Reporting with organic sessions and organic revenue attribution.
If your DTC food brand is running paid social at 20,000 dollars monthly with a broken blog and zero recipe schema, professional content marketing for food brands pays for itself inside the first 90 days on organic traffic captured. Redefine Web ships content marketing inside our monthly retainer packages. Book a call and we will walk through the last three DTC food brands we built recipe hubs for, pillar by pillar.
Content marketing for food brands starts with a recipe hub because recipe queries account for 40 to 60 percent of high-intent search volume in the food category. Every hero SKU needs 4 to 12 recipes anchored to it, each targeting a specific occasion and audience.
Skip the recipe hub and the brand loses the search real estate that pulls DTC storefront traffic month over month at zero incremental paid cost. Recipe traffic converts at 2 to 4 percent because the shopper landed with usage intent, not passive discovery, which is why food brands win on recipes.
Recipe schema and Google rich result eligibility
Every recipe page ships schema.org Recipe markup including cookTime, prepTime, recipeIngredient, recipeInstructions, nutrition, and aggregateRating. Correctly marked-up recipes qualify for Google’s recipe rich result carousel that pulls 3 to 6 times higher click-through rate than a plain blue link. The schema layer takes 15 minutes per recipe to author and 30 minutes to validate in Google Search Console. Cross-reference the recipe search stack on our food and beverage SEO page.
Recipe hub structure that scales
The recipe hub structure runs 40 to 100 recipes at maturity, organized by hero SKU (4 to 12 recipes per SKU) plus occasion tags (breakfast, weeknight dinner, meal prep, brunch, holiday). Every recipe links back to the hero SKU product page with the SKU embedded in an inline card. The hub earns internal linking value from ingredient comparison guides and the sourcing story pages, which feeds recipe ranking on Google. According to Google Search Central recipe structured data guidance, complete Recipe schema markup is required for eligibility in the recipe carousel and the ingredient search filter.
Pillar structure for food brand content marketing
The pillar structure on content marketing for food brands runs 4 content pillars concurrently: recipe hub (40 to 100 recipes), ingredient comparison guides (12 to 24 guides), sourcing story pages (6 to 12 pages), and buyer intent content (where to buy, subscription vs. one-time, gift bundle guides). Every pillar covers a distinct search intent and every pillar links back to the hero SKU product pages.
Ingredient comparison guide format
Ingredient comparison guides run 1,800 to 3,200 words comparing 2 to 4 ingredient types on 6 to 10 attributes with a comparison table, real-world use case examples, and links to the hero SKU that uses the specific ingredient. Example: organic vs. conventional oats compares nutritional profile, sourcing chain, cost, environmental impact, and taste on a 6-column table. The brand’s SKU appears in the winning column with a product card. These guides rank 3 to 8 months after publication and pull steady-state organic traffic.
Sourcing story pages that build trust
Sourcing story pages name the specific farms, cooperatives, or suppliers the brand sources from, with photos of the farms, farmer quotes, and specific harvest windows. A coffee brand’s Ethiopian farm page ranks for “single-origin Ethiopian coffee” and “Yirgacheffe coffee origin” plus 40 long-tail variations. The sourcing page pulls trust-building traffic that converts at 4 to 6 percent because the shopper landed pattern-matching on transparency and named provenance. Every sourcing page includes farmer or cooperative quotes, harvest dates, and a link back to 3 to 5 hero SKU pages that source from the named supplier.
Vejrø hospitality content case study
Vejrø Resort, a Danish private-island destination with an on-site restaurant focused on organic, locally sourced cuisine, joined us with strong social engagement and no organic-search real estate. Guests found the resort on Instagram but never in Google search for terms like “private island resort Denmark,” “farm-to-table hospitality Denmark,” or “Vejrø restaurant.” The same organic-search gap shows up on DTC food brands running paid social at 20,000 dollars monthly with a broken blog and zero recipe schema.
We built the conversion-focused website with on-site and off-site SEO tuned to the travel-niche keyword clusters, competitor analysis against comparable boutique resorts, and mobile-first design prioritizing guest discovery. Every page carried the structured data qualifying it for Google’s rich results in the hospitality category. Every internal link pushed authority toward the direct-booking conversion path.
Three months later, Vejrø hit 10,000 plus organic visitors, ranked for 200 plus first-page keywords, and pulled a 2.2 percent booking conversion rate from organic traffic. The same pattern applies to content marketing for food brands: recipe schema, ingredient comparison guides, and sourcing story pages pull organic traffic at 20 to 40 percent conversion into hero SKU pages inside 6 months when the content quality matches search intent and every page carries the right structured data markup. Vejrø also proved out the reporting discipline: every monthly report named the exact page, the exact keyword cluster, and the exact search feature (rich result, sitelinks, image pack) driving the incremental organic revenue instead of hiding behind aggregate traffic charts.
Recipe cadence and content calendar for food brands
Recipe cadence on a working food brand content calendar ships 2 to 4 new recipes per week during the first 6 months and drops to 1 per week at maturity. Each recipe takes 4 to 6 hours to produce (write, test in the kitchen, photograph, schema author, publish). At 3 recipes per week, the brand hits 78 recipes inside 6 months plus a backlog of ingredient comparison and sourcing content queued behind the recipe production line.
| Content pillar | Target volume year 1 | Production cost per piece | Refresh cadence |
|---|---|---|---|
| Recipe hub | 40 to 100 recipes | $180 to $320 | Every 12 months |
| Ingredient comparison guides | 12 to 24 guides | $450 to $780 | Every 18 months |
| Sourcing story pages | 6 to 12 pages | $680 to $1,200 | Every 24 months |
| Buyer intent content | 8 to 16 pieces | $220 to $420 | Every 12 months |
Photography as a content calendar constraint
Photography is the actual constraint on recipe cadence, not writing. Every recipe needs 6 to 12 photos: hero shot, ingredient flat lay, prep in progress, plated result, storage, and step shots for the schema markup. A working food brand batches photography 8 recipes at a time to keep the cost per recipe under 200 dollars. Skip the batching and the per-recipe cost climbs to 400 to 600 dollars, which caps recipe cadence at 1 per week and slows organic ranking timeline by 6 months.
Seasonal content calendar planning
Seasonal content calendar planning maps recipes and comparison guides to the seasonal windows they need to rank in. A Christmas cookie recipe needs to publish in September to rank by early December. A Valentine’s chocolate guide needs to publish in November to rank by early February. A back-to-school lunchbox recipe needs to publish in June to rank by late August. The 60-to-90-day ranking curve dictates the calendar.
Creator syndication inside food brand content
Creator syndication on food brand content marketing amplifies the recipe hub through Instagram Reels, TikTok, and YouTube Shorts creators paid to post their own version of the brand’s hero recipes. The creator content pulls net-new audiences into the recipe hub through the creator’s Link in Bio or Amazon Storefront tag. The syndication calendar names 12 to 30 creators per quarter with specific recipes assigned to each.
One brand we picked up had a spreadsheet titled “creator outreach 2023” with 47 rows and 3 responses. All 3 responses were auto-replies. The spreadsheet named zero recipes and offered flat rates below 100 dollars per post. Nobody posts a 30-second video for 87 dollars flat. Nobody.
Creator content commercial terms that work
Working creator content commercial terms run 350 to 1,500 dollars flat per post plus a 12 to 25 percent commission on tagged sales across a 30-day window. The commission mechanic pulls creators into follow-up posts because the incremental revenue continues past the initial fee. Mid-tier creators (30k to 150k followers) hit the sweet spot for food brand content because their engagement rate typically runs 4 to 8 percent versus 0.8 to 1.6 percent on mega-creators.
Content brief structure for creator partnerships
The content brief structure for creator partnerships runs a single page: the SKU, the specific recipe or usage occasion, 3 required brand mentions, 3 restricted claims (no health claims on non-medical SKUs), the pricing angle, the affiliate link, and 3 example videos that hit the tone. The brief avoids over-scripting because over-scripted creator content underperforms native creator voice by 40 to 60 percent on engagement rate.
Buyer intent content for food brand blogs
Buyer intent content on food brand blogs covers 8 to 16 pieces targeting explicit purchase-decision queries: “where to buy [brand],” “[brand] subscription vs. one-time,” “best [category] for [use case],” and “[brand] gift bundle.” Every buyer intent piece runs 1,400 to 2,400 words with a comparison table, product cards, and a clear conversion path to the specific SKU that matches the query intent. Buyer intent content converts at 3 to 6 percent versus 1 to 2 percent on recipe content because the shopper landed already planning to buy, not exploring a usage occasion.
Where-to-buy content structure
Where-to-buy content structure covers online (DTC storefront, Amazon, Target.com, Whole Foods online), retail (specific chain locators with the store finder embedded), and international (customs limitations, retailer partners abroad). Every piece names specific retailers, links to the store locator, and includes an FAQ block covering shipping availability, subscription options, and gift card compatibility. Where-to-buy content ranks for branded discovery queries the DTC storefront otherwise loses to competitor affiliate reviews.
Subscription versus one-time comparison content
Subscription versus one-time comparison content converts subscription commitments at 3 to 6 percent because it addresses the price-sensitivity concern head-on with a specific math table. The piece covers the discount structure (15 percent lifetime), the skip-a-month mechanic, the pause-anytime rule, the cancellation policy, and the specific yearly savings for the brand’s average consumption cadence. Cross-reference the retention structure on our food and beverage marketing retainer page.
Content refresh cadence on food brand pillars
Content refresh cadence on food brand content pillars runs a rolling audit every 12 to 24 months by pillar. Recipes get refreshed every 12 months with new photography, updated schema, and any nutrition or ingredient adjustments. Ingredient comparison guides refresh every 18 months to update market data. Sourcing story pages refresh every 24 months to reflect farm partnership changes and new harvest angles. Buyer intent content refreshes every 12 months to update retailer availability and pricing.
Recipe refresh priority order
Recipe refresh priority runs by organic traffic rank. The top 20 recipes by monthly organic sessions get refreshed first (new photography, schema audit, related recipe internal links, updated nutrition). The next 40 get refreshed at 15 months. The remaining recipes get refreshed opportunistically when the ranking slips past position 15 in Google. Skipping the refresh cadence lets recipe rankings drift out of the top 3 inside 18 months as newer competitor recipes take the position.
Schema audit checklist per refresh
The schema audit checklist per refresh runs 8 items: Recipe schema completeness, aggregateRating count and accuracy, nutrition data accuracy, prepTime and cookTime match the recipe body, image URLs valid at CDN, related recipe internal links working, product card SKU URL live, and Google Search Console rich result eligibility validated. This checklist takes 20 minutes per recipe and prevents the schema drift that costs recipe rankings 20 to 40 positions quietly.
Reporting cadence for food brand content marketing
Reporting cadence on food brand content marketing runs a monthly executive report plus a quarterly business review. The monthly report ships in the first business week and covers organic sessions by pillar, top 10 ranking recipes with position trend, ingredient guide ranking movements, sourcing page performance, and organic-attributed DTC revenue. Every number carries a comparison to the prior month and a plain-language interpretation the founder reads in 7 minutes.
Metrics that matter for content marketing
Metrics that matter for food brand content marketing: organic sessions by pillar, recipe rich result impressions in Search Console, organic conversion rate to hero SKU pages, organic-attributed DTC revenue, and top 20 ranking positions by monthly organic sessions. Vanity metrics that do not matter: total pageviews without conversion context, average time on page without conversion attribution, and social share counts. The monthly report skips the vanity block entirely.
Quarterly business review structure
The quarterly business review runs 90 minutes with the founder, head of content, and SEO lead. Agenda: organic traffic trend by pillar, top 10 winning content pieces, top 10 losing content pieces (candidates for refresh or removal), competitive gap analysis against 5 named competitor brands, and next quarter’s content calendar with recipes and ingredient guides queued. According to Ahrefs content marketing research, brands running quarterly content audits outperform brands running annual audits by 40 to 70 percent on organic revenue over a 24-month window.
Internal linking discipline across food brand content
Internal linking discipline across food brand content moves authority from recipe pages toward hero SKU product pages and comparison guides. Every recipe links to the hero SKU it uses inline (once in the ingredient list, once in a bottom call-out card). Every ingredient comparison guide links to 3 to 6 recipes using the winning ingredient plus the hero SKU product page. Every sourcing story links to the 2 to 4 SKUs sourced from that specific farm or cooperative.
Anchor text strategy across recipe hubs
Anchor text on internal links varies across recipe hubs to avoid over-optimization patterns Google penalizes. Exact-match anchor (“single-origin Ethiopian coffee”) runs on 20 to 30 percent of internal links. Partial-match variations (“our Ethiopian roast”) run on 30 to 40 percent. Branded anchors (the SKU name) run on 20 to 30 percent. Generic anchors (“shop the coffee”) fill the remaining 10 to 20 percent. This ratio holds ranking without triggering the over-optimization penalty that shows up on brands that anchor-text-stuff every internal link with the same exact-match keyword. Cross-reference the linking layer on our food and beverage web design page.
Link equity from ingredient guides to SKU pages
Link equity from ingredient guides passes to SKU pages when the guide’s comparison table names the hero SKU in the winning column with a product card, and when the guide’s body links to 3 to 6 recipes that use the winning ingredient. This 3-hop path (guide to recipe to SKU) pushes authority from a high-traffic informational query down to a high-intent transactional page. According to Search Engine Land SEO coverage, informational content that internally links to transactional pages produces 2 to 4 times higher organic revenue than isolated content silos.
Wrapping up content marketing for food brands
Content marketing for food brands is the organic engine that turns a DTC snack, drink, or CPG storefront into a search-driven revenue channel. Recipe hub of 40 to 100 recipes. Ingredient comparison guides at 12 to 24 pieces. Sourcing story pages at 6 to 12 pieces. Buyer intent content at 8 to 16 pieces. Creator syndication calendar with 12 to 30 creators per quarter. Refresh cadence at 12 to 24 months by pillar. Reporting with organic sessions and organic revenue attribution.
If your DTC food brand is running paid social at 20,000 dollars monthly with a broken blog and zero recipe schema, professional content marketing for food brands pays for itself inside the first 90 days on organic traffic captured. Redefine Web ships content marketing inside our monthly retainer packages. Book a call and we will walk through the last three DTC food brands we built recipe hubs for, pillar by pillar.
Anchor text on internal links varies across recipe hubs to avoid over-optimization patterns Google penalizes. Exact-match anchor (“single-origin Ethiopian coffee”) runs on 20 to 30 percent of internal links. Partial-match variations (“our Ethiopian roast”) run on 30 to 40 percent. Branded anchors (the SKU name) run on 20 to 30 percent. Generic anchors (“shop the coffee”) fill the remaining 10 to 20 percent. This ratio holds ranking without triggering the over-optimization penalty that shows up on brands that anchor-text-stuff every internal link with the same exact-match keyword. Cross-reference the linking layer on our food and beverage web design page.
Link equity from ingredient guides to SKU pages
Link equity from ingredient guides passes to SKU pages when the guide’s comparison table names the hero SKU in the winning column with a product card, and when the guide’s body links to 3 to 6 recipes that use the winning ingredient. This 3-hop path (guide to recipe to SKU) pushes authority from a high-traffic informational query down to a high-intent transactional page. According to Search Engine Land SEO coverage, informational content that internally links to transactional pages produces 2 to 4 times higher organic revenue than isolated content silos.
Wrapping up content marketing for food brands
Content marketing for food brands is the organic engine that turns a DTC snack, drink, or CPG storefront into a search-driven revenue channel. Recipe hub of 40 to 100 recipes. Ingredient comparison guides at 12 to 24 pieces. Sourcing story pages at 6 to 12 pieces. Buyer intent content at 8 to 16 pieces. Creator syndication calendar with 12 to 30 creators per quarter. Refresh cadence at 12 to 24 months by pillar. Reporting with organic sessions and organic revenue attribution.
If your DTC food brand is running paid social at 20,000 dollars monthly with a broken blog and zero recipe schema, professional content marketing for food brands pays for itself inside the first 90 days on organic traffic captured. Redefine Web ships content marketing inside our monthly retainer packages. Book a call and we will walk through the last three DTC food brands we built recipe hubs for, pillar by pillar.
Internal linking discipline across food brand content moves authority from recipe pages toward hero SKU product pages and comparison guides. Every recipe links to the hero SKU it uses inline (once in the ingredient list, once in a bottom call-out card). Every ingredient comparison guide links to 3 to 6 recipes using the winning ingredient plus the hero SKU product page. Every sourcing story links to the 2 to 4 SKUs sourced from that specific farm or cooperative.
Anchor text strategy across recipe hubs
Anchor text on internal links varies across recipe hubs to avoid over-optimization patterns Google penalizes. Exact-match anchor (“single-origin Ethiopian coffee”) runs on 20 to 30 percent of internal links. Partial-match variations (“our Ethiopian roast”) run on 30 to 40 percent. Branded anchors (the SKU name) run on 20 to 30 percent. Generic anchors (“shop the coffee”) fill the remaining 10 to 20 percent. This ratio holds ranking without triggering the over-optimization penalty that shows up on brands that anchor-text-stuff every internal link with the same exact-match keyword. Cross-reference the linking layer on our food and beverage web design page.
Link equity from ingredient guides to SKU pages
Link equity from ingredient guides passes to SKU pages when the guide’s comparison table names the hero SKU in the winning column with a product card, and when the guide’s body links to 3 to 6 recipes that use the winning ingredient. This 3-hop path (guide to recipe to SKU) pushes authority from a high-traffic informational query down to a high-intent transactional page. According to Search Engine Land SEO coverage, informational content that internally links to transactional pages produces 2 to 4 times higher organic revenue than isolated content silos.
Wrapping up content marketing for food brands
Content marketing for food brands is the organic engine that turns a DTC snack, drink, or CPG storefront into a search-driven revenue channel. Recipe hub of 40 to 100 recipes. Ingredient comparison guides at 12 to 24 pieces. Sourcing story pages at 6 to 12 pieces. Buyer intent content at 8 to 16 pieces. Creator syndication calendar with 12 to 30 creators per quarter. Refresh cadence at 12 to 24 months by pillar. Reporting with organic sessions and organic revenue attribution.
If your DTC food brand is running paid social at 20,000 dollars monthly with a broken blog and zero recipe schema, professional content marketing for food brands pays for itself inside the first 90 days on organic traffic captured. Redefine Web ships content marketing inside our monthly retainer packages. Book a call and we will walk through the last three DTC food brands we built recipe hubs for, pillar by pillar.
Content marketing for food brands starts with a recipe hub because recipe queries account for 40 to 60 percent of high-intent search volume in the food category. Every hero SKU needs 4 to 12 recipes anchored to it, each targeting a specific occasion and audience.
Skip the recipe hub and the brand loses the search real estate that pulls DTC storefront traffic month over month at zero incremental paid cost. Recipe traffic converts at 2 to 4 percent because the shopper landed with usage intent, not passive discovery, which is why food brands win on recipes.
Recipe schema and Google rich result eligibility
Every recipe page ships schema.org Recipe markup including cookTime, prepTime, recipeIngredient, recipeInstructions, nutrition, and aggregateRating. Correctly marked-up recipes qualify for Google’s recipe rich result carousel that pulls 3 to 6 times higher click-through rate than a plain blue link. The schema layer takes 15 minutes per recipe to author and 30 minutes to validate in Google Search Console. Cross-reference the recipe search stack on our food and beverage SEO page.
Recipe hub structure that scales
The recipe hub structure runs 40 to 100 recipes at maturity, organized by hero SKU (4 to 12 recipes per SKU) plus occasion tags (breakfast, weeknight dinner, meal prep, brunch, holiday). Every recipe links back to the hero SKU product page with the SKU embedded in an inline card. The hub earns internal linking value from ingredient comparison guides and the sourcing story pages, which feeds recipe ranking on Google. According to Google Search Central recipe structured data guidance, complete Recipe schema markup is required for eligibility in the recipe carousel and the ingredient search filter.
Pillar structure for food brand content marketing
The pillar structure on content marketing for food brands runs 4 content pillars concurrently: recipe hub (40 to 100 recipes), ingredient comparison guides (12 to 24 guides), sourcing story pages (6 to 12 pages), and buyer intent content (where to buy, subscription vs. one-time, gift bundle guides). Every pillar covers a distinct search intent and every pillar links back to the hero SKU product pages.
Ingredient comparison guide format
Ingredient comparison guides run 1,800 to 3,200 words comparing 2 to 4 ingredient types on 6 to 10 attributes with a comparison table, real-world use case examples, and links to the hero SKU that uses the specific ingredient. Example: organic vs. conventional oats compares nutritional profile, sourcing chain, cost, environmental impact, and taste on a 6-column table. The brand’s SKU appears in the winning column with a product card. These guides rank 3 to 8 months after publication and pull steady-state organic traffic.
Sourcing story pages that build trust
Sourcing story pages name the specific farms, cooperatives, or suppliers the brand sources from, with photos of the farms, farmer quotes, and specific harvest windows. A coffee brand’s Ethiopian farm page ranks for “single-origin Ethiopian coffee” and “Yirgacheffe coffee origin” plus 40 long-tail variations. The sourcing page pulls trust-building traffic that converts at 4 to 6 percent because the shopper landed pattern-matching on transparency and named provenance. Every sourcing page includes farmer or cooperative quotes, harvest dates, and a link back to 3 to 5 hero SKU pages that source from the named supplier.
Vejrø hospitality content case study
Vejrø Resort, a Danish private-island destination with an on-site restaurant focused on organic, locally sourced cuisine, joined us with strong social engagement and no organic-search real estate. Guests found the resort on Instagram but never in Google search for terms like “private island resort Denmark,” “farm-to-table hospitality Denmark,” or “Vejrø restaurant.” The same organic-search gap shows up on DTC food brands running paid social at 20,000 dollars monthly with a broken blog and zero recipe schema.
We built the conversion-focused website with on-site and off-site SEO tuned to the travel-niche keyword clusters, competitor analysis against comparable boutique resorts, and mobile-first design prioritizing guest discovery. Every page carried the structured data qualifying it for Google’s rich results in the hospitality category. Every internal link pushed authority toward the direct-booking conversion path.
Three months later, Vejrø hit 10,000 plus organic visitors, ranked for 200 plus first-page keywords, and pulled a 2.2 percent booking conversion rate from organic traffic. The same pattern applies to content marketing for food brands: recipe schema, ingredient comparison guides, and sourcing story pages pull organic traffic at 20 to 40 percent conversion into hero SKU pages inside 6 months when the content quality matches search intent and every page carries the right structured data markup. Vejrø also proved out the reporting discipline: every monthly report named the exact page, the exact keyword cluster, and the exact search feature (rich result, sitelinks, image pack) driving the incremental organic revenue instead of hiding behind aggregate traffic charts.
Recipe cadence and content calendar for food brands
Recipe cadence on a working food brand content calendar ships 2 to 4 new recipes per week during the first 6 months and drops to 1 per week at maturity. Each recipe takes 4 to 6 hours to produce (write, test in the kitchen, photograph, schema author, publish). At 3 recipes per week, the brand hits 78 recipes inside 6 months plus a backlog of ingredient comparison and sourcing content queued behind the recipe production line.
| Content pillar | Target volume year 1 | Production cost per piece | Refresh cadence |
|---|---|---|---|
| Recipe hub | 40 to 100 recipes | $180 to $320 | Every 12 months |
| Ingredient comparison guides | 12 to 24 guides | $450 to $780 | Every 18 months |
| Sourcing story pages | 6 to 12 pages | $680 to $1,200 | Every 24 months |
| Buyer intent content | 8 to 16 pieces | $220 to $420 | Every 12 months |
Photography as a content calendar constraint
Photography is the actual constraint on recipe cadence, not writing. Every recipe needs 6 to 12 photos: hero shot, ingredient flat lay, prep in progress, plated result, storage, and step shots for the schema markup. A working food brand batches photography 8 recipes at a time to keep the cost per recipe under 200 dollars. Skip the batching and the per-recipe cost climbs to 400 to 600 dollars, which caps recipe cadence at 1 per week and slows organic ranking timeline by 6 months.
Seasonal content calendar planning
Seasonal content calendar planning maps recipes and comparison guides to the seasonal windows they need to rank in. A Christmas cookie recipe needs to publish in September to rank by early December. A Valentine’s chocolate guide needs to publish in November to rank by early February. A back-to-school lunchbox recipe needs to publish in June to rank by late August. The 60-to-90-day ranking curve dictates the calendar.
Creator syndication inside food brand content
Creator syndication on food brand content marketing amplifies the recipe hub through Instagram Reels, TikTok, and YouTube Shorts creators paid to post their own version of the brand’s hero recipes. The creator content pulls net-new audiences into the recipe hub through the creator’s Link in Bio or Amazon Storefront tag. The syndication calendar names 12 to 30 creators per quarter with specific recipes assigned to each.
One brand we picked up had a spreadsheet titled “creator outreach 2023” with 47 rows and 3 responses. All 3 responses were auto-replies. The spreadsheet named zero recipes and offered flat rates below 100 dollars per post. Nobody posts a 30-second video for 87 dollars flat. Nobody.
Creator content commercial terms that work
Working creator content commercial terms run 350 to 1,500 dollars flat per post plus a 12 to 25 percent commission on tagged sales across a 30-day window. The commission mechanic pulls creators into follow-up posts because the incremental revenue continues past the initial fee. Mid-tier creators (30k to 150k followers) hit the sweet spot for food brand content because their engagement rate typically runs 4 to 8 percent versus 0.8 to 1.6 percent on mega-creators.
Content brief structure for creator partnerships
The content brief structure for creator partnerships runs a single page: the SKU, the specific recipe or usage occasion, 3 required brand mentions, 3 restricted claims (no health claims on non-medical SKUs), the pricing angle, the affiliate link, and 3 example videos that hit the tone. The brief avoids over-scripting because over-scripted creator content underperforms native creator voice by 40 to 60 percent on engagement rate.
Buyer intent content for food brand blogs
Buyer intent content on food brand blogs covers 8 to 16 pieces targeting explicit purchase-decision queries: “where to buy [brand],” “[brand] subscription vs. one-time,” “best [category] for [use case],” and “[brand] gift bundle.” Every buyer intent piece runs 1,400 to 2,400 words with a comparison table, product cards, and a clear conversion path to the specific SKU that matches the query intent. Buyer intent content converts at 3 to 6 percent versus 1 to 2 percent on recipe content because the shopper landed already planning to buy, not exploring a usage occasion.
Where-to-buy content structure
Where-to-buy content structure covers online (DTC storefront, Amazon, Target.com, Whole Foods online), retail (specific chain locators with the store finder embedded), and international (customs limitations, retailer partners abroad). Every piece names specific retailers, links to the store locator, and includes an FAQ block covering shipping availability, subscription options, and gift card compatibility. Where-to-buy content ranks for branded discovery queries the DTC storefront otherwise loses to competitor affiliate reviews.
Subscription versus one-time comparison content
Subscription versus one-time comparison content converts subscription commitments at 3 to 6 percent because it addresses the price-sensitivity concern head-on with a specific math table. The piece covers the discount structure (15 percent lifetime), the skip-a-month mechanic, the pause-anytime rule, the cancellation policy, and the specific yearly savings for the brand’s average consumption cadence. Cross-reference the retention structure on our food and beverage marketing retainer page.
Content refresh cadence on food brand pillars
Content refresh cadence on food brand content pillars runs a rolling audit every 12 to 24 months by pillar. Recipes get refreshed every 12 months with new photography, updated schema, and any nutrition or ingredient adjustments. Ingredient comparison guides refresh every 18 months to update market data. Sourcing story pages refresh every 24 months to reflect farm partnership changes and new harvest angles. Buyer intent content refreshes every 12 months to update retailer availability and pricing.
Recipe refresh priority order
Recipe refresh priority runs by organic traffic rank. The top 20 recipes by monthly organic sessions get refreshed first (new photography, schema audit, related recipe internal links, updated nutrition). The next 40 get refreshed at 15 months. The remaining recipes get refreshed opportunistically when the ranking slips past position 15 in Google. Skipping the refresh cadence lets recipe rankings drift out of the top 3 inside 18 months as newer competitor recipes take the position.
Schema audit checklist per refresh
The schema audit checklist per refresh runs 8 items: Recipe schema completeness, aggregateRating count and accuracy, nutrition data accuracy, prepTime and cookTime match the recipe body, image URLs valid at CDN, related recipe internal links working, product card SKU URL live, and Google Search Console rich result eligibility validated. This checklist takes 20 minutes per recipe and prevents the schema drift that costs recipe rankings 20 to 40 positions quietly.
Reporting cadence for food brand content marketing
Reporting cadence on food brand content marketing runs a monthly executive report plus a quarterly business review. The monthly report ships in the first business week and covers organic sessions by pillar, top 10 ranking recipes with position trend, ingredient guide ranking movements, sourcing page performance, and organic-attributed DTC revenue. Every number carries a comparison to the prior month and a plain-language interpretation the founder reads in 7 minutes.
Metrics that matter for content marketing
Metrics that matter for food brand content marketing: organic sessions by pillar, recipe rich result impressions in Search Console, organic conversion rate to hero SKU pages, organic-attributed DTC revenue, and top 20 ranking positions by monthly organic sessions. Vanity metrics that do not matter: total pageviews without conversion context, average time on page without conversion attribution, and social share counts. The monthly report skips the vanity block entirely.
Quarterly business review structure
The quarterly business review runs 90 minutes with the founder, head of content, and SEO lead. Agenda: organic traffic trend by pillar, top 10 winning content pieces, top 10 losing content pieces (candidates for refresh or removal), competitive gap analysis against 5 named competitor brands, and next quarter’s content calendar with recipes and ingredient guides queued. According to Ahrefs content marketing research, brands running quarterly content audits outperform brands running annual audits by 40 to 70 percent on organic revenue over a 24-month window.
Internal linking discipline across food brand content
Internal linking discipline across food brand content moves authority from recipe pages toward hero SKU product pages and comparison guides. Every recipe links to the hero SKU it uses inline (once in the ingredient list, once in a bottom call-out card). Every ingredient comparison guide links to 3 to 6 recipes using the winning ingredient plus the hero SKU product page. Every sourcing story links to the 2 to 4 SKUs sourced from that specific farm or cooperative.
Anchor text strategy across recipe hubs
Anchor text on internal links varies across recipe hubs to avoid over-optimization patterns Google penalizes. Exact-match anchor (“single-origin Ethiopian coffee”) runs on 20 to 30 percent of internal links. Partial-match variations (“our Ethiopian roast”) run on 30 to 40 percent. Branded anchors (the SKU name) run on 20 to 30 percent. Generic anchors (“shop the coffee”) fill the remaining 10 to 20 percent. This ratio holds ranking without triggering the over-optimization penalty that shows up on brands that anchor-text-stuff every internal link with the same exact-match keyword. Cross-reference the linking layer on our food and beverage web design page.
Link equity from ingredient guides to SKU pages
Link equity from ingredient guides passes to SKU pages when the guide’s comparison table names the hero SKU in the winning column with a product card, and when the guide’s body links to 3 to 6 recipes that use the winning ingredient. This 3-hop path (guide to recipe to SKU) pushes authority from a high-traffic informational query down to a high-intent transactional page. According to Search Engine Land SEO coverage, informational content that internally links to transactional pages produces 2 to 4 times higher organic revenue than isolated content silos.
Wrapping up content marketing for food brands
Content marketing for food brands is the organic engine that turns a DTC snack, drink, or CPG storefront into a search-driven revenue channel. Recipe hub of 40 to 100 recipes. Ingredient comparison guides at 12 to 24 pieces. Sourcing story pages at 6 to 12 pieces. Buyer intent content at 8 to 16 pieces. Creator syndication calendar with 12 to 30 creators per quarter. Refresh cadence at 12 to 24 months by pillar. Reporting with organic sessions and organic revenue attribution.
If your DTC food brand is running paid social at 20,000 dollars monthly with a broken blog and zero recipe schema, professional content marketing for food brands pays for itself inside the first 90 days on organic traffic captured. Redefine Web ships content marketing inside our monthly retainer packages. Book a call and we will walk through the last three DTC food brands we built recipe hubs for, pillar by pillar.
Content marketing for food brands starts with a recipe hub because recipe queries account for 40 to 60 percent of high-intent search volume in the food category. Every hero SKU needs 4 to 12 recipes anchored to it, each targeting a specific occasion and audience.
Skip the recipe hub and the brand loses the search real estate that pulls DTC storefront traffic month over month at zero incremental paid cost. Recipe traffic converts at 2 to 4 percent because the shopper landed with usage intent, not passive discovery, which is why food brands win on recipes.
Recipe schema and Google rich result eligibility
Every recipe page ships schema.org Recipe markup including cookTime, prepTime, recipeIngredient, recipeInstructions, nutrition, and aggregateRating. Correctly marked-up recipes qualify for Google’s recipe rich result carousel that pulls 3 to 6 times higher click-through rate than a plain blue link. The schema layer takes 15 minutes per recipe to author and 30 minutes to validate in Google Search Console. Cross-reference the recipe search stack on our food and beverage SEO page.
Recipe hub structure that scales
The recipe hub structure runs 40 to 100 recipes at maturity, organized by hero SKU (4 to 12 recipes per SKU) plus occasion tags (breakfast, weeknight dinner, meal prep, brunch, holiday). Every recipe links back to the hero SKU product page with the SKU embedded in an inline card. The hub earns internal linking value from ingredient comparison guides and the sourcing story pages, which feeds recipe ranking on Google. According to Google Search Central recipe structured data guidance, complete Recipe schema markup is required for eligibility in the recipe carousel and the ingredient search filter.
Pillar structure for food brand content marketing
The pillar structure on content marketing for food brands runs 4 content pillars concurrently: recipe hub (40 to 100 recipes), ingredient comparison guides (12 to 24 guides), sourcing story pages (6 to 12 pages), and buyer intent content (where to buy, subscription vs. one-time, gift bundle guides). Every pillar covers a distinct search intent and every pillar links back to the hero SKU product pages.
Ingredient comparison guide format
Ingredient comparison guides run 1,800 to 3,200 words comparing 2 to 4 ingredient types on 6 to 10 attributes with a comparison table, real-world use case examples, and links to the hero SKU that uses the specific ingredient. Example: organic vs. conventional oats compares nutritional profile, sourcing chain, cost, environmental impact, and taste on a 6-column table. The brand’s SKU appears in the winning column with a product card. These guides rank 3 to 8 months after publication and pull steady-state organic traffic.
Sourcing story pages that build trust
Sourcing story pages name the specific farms, cooperatives, or suppliers the brand sources from, with photos of the farms, farmer quotes, and specific harvest windows. A coffee brand’s Ethiopian farm page ranks for “single-origin Ethiopian coffee” and “Yirgacheffe coffee origin” plus 40 long-tail variations. The sourcing page pulls trust-building traffic that converts at 4 to 6 percent because the shopper landed pattern-matching on transparency and named provenance. Every sourcing page includes farmer or cooperative quotes, harvest dates, and a link back to 3 to 5 hero SKU pages that source from the named supplier.
Vejrø hospitality content case study
Vejrø Resort, a Danish private-island destination with an on-site restaurant focused on organic, locally sourced cuisine, joined us with strong social engagement and no organic-search real estate. Guests found the resort on Instagram but never in Google search for terms like “private island resort Denmark,” “farm-to-table hospitality Denmark,” or “Vejrø restaurant.” The same organic-search gap shows up on DTC food brands running paid social at 20,000 dollars monthly with a broken blog and zero recipe schema.
We built the conversion-focused website with on-site and off-site SEO tuned to the travel-niche keyword clusters, competitor analysis against comparable boutique resorts, and mobile-first design prioritizing guest discovery. Every page carried the structured data qualifying it for Google’s rich results in the hospitality category. Every internal link pushed authority toward the direct-booking conversion path.
Three months later, Vejrø hit 10,000 plus organic visitors, ranked for 200 plus first-page keywords, and pulled a 2.2 percent booking conversion rate from organic traffic. The same pattern applies to content marketing for food brands: recipe schema, ingredient comparison guides, and sourcing story pages pull organic traffic at 20 to 40 percent conversion into hero SKU pages inside 6 months when the content quality matches search intent and every page carries the right structured data markup. Vejrø also proved out the reporting discipline: every monthly report named the exact page, the exact keyword cluster, and the exact search feature (rich result, sitelinks, image pack) driving the incremental organic revenue instead of hiding behind aggregate traffic charts.
Recipe cadence and content calendar for food brands
Recipe cadence on a working food brand content calendar ships 2 to 4 new recipes per week during the first 6 months and drops to 1 per week at maturity. Each recipe takes 4 to 6 hours to produce (write, test in the kitchen, photograph, schema author, publish). At 3 recipes per week, the brand hits 78 recipes inside 6 months plus a backlog of ingredient comparison and sourcing content queued behind the recipe production line.
| Content pillar | Target volume year 1 | Production cost per piece | Refresh cadence |
|---|---|---|---|
| Recipe hub | 40 to 100 recipes | $180 to $320 | Every 12 months |
| Ingredient comparison guides | 12 to 24 guides | $450 to $780 | Every 18 months |
| Sourcing story pages | 6 to 12 pages | $680 to $1,200 | Every 24 months |
| Buyer intent content | 8 to 16 pieces | $220 to $420 | Every 12 months |
Photography as a content calendar constraint
Photography is the actual constraint on recipe cadence, not writing. Every recipe needs 6 to 12 photos: hero shot, ingredient flat lay, prep in progress, plated result, storage, and step shots for the schema markup. A working food brand batches photography 8 recipes at a time to keep the cost per recipe under 200 dollars. Skip the batching and the per-recipe cost climbs to 400 to 600 dollars, which caps recipe cadence at 1 per week and slows organic ranking timeline by 6 months.
Seasonal content calendar planning
Seasonal content calendar planning maps recipes and comparison guides to the seasonal windows they need to rank in. A Christmas cookie recipe needs to publish in September to rank by early December. A Valentine’s chocolate guide needs to publish in November to rank by early February. A back-to-school lunchbox recipe needs to publish in June to rank by late August. The 60-to-90-day ranking curve dictates the calendar.
Creator syndication inside food brand content
Creator syndication on food brand content marketing amplifies the recipe hub through Instagram Reels, TikTok, and YouTube Shorts creators paid to post their own version of the brand’s hero recipes. The creator content pulls net-new audiences into the recipe hub through the creator’s Link in Bio or Amazon Storefront tag. The syndication calendar names 12 to 30 creators per quarter with specific recipes assigned to each.
One brand we picked up had a spreadsheet titled “creator outreach 2023” with 47 rows and 3 responses. All 3 responses were auto-replies. The spreadsheet named zero recipes and offered flat rates below 100 dollars per post. Nobody posts a 30-second video for 87 dollars flat. Nobody.
Creator content commercial terms that work
Working creator content commercial terms run 350 to 1,500 dollars flat per post plus a 12 to 25 percent commission on tagged sales across a 30-day window. The commission mechanic pulls creators into follow-up posts because the incremental revenue continues past the initial fee. Mid-tier creators (30k to 150k followers) hit the sweet spot for food brand content because their engagement rate typically runs 4 to 8 percent versus 0.8 to 1.6 percent on mega-creators.
Content brief structure for creator partnerships
The content brief structure for creator partnerships runs a single page: the SKU, the specific recipe or usage occasion, 3 required brand mentions, 3 restricted claims (no health claims on non-medical SKUs), the pricing angle, the affiliate link, and 3 example videos that hit the tone. The brief avoids over-scripting because over-scripted creator content underperforms native creator voice by 40 to 60 percent on engagement rate.
Buyer intent content for food brand blogs
Buyer intent content on food brand blogs covers 8 to 16 pieces targeting explicit purchase-decision queries: “where to buy [brand],” “[brand] subscription vs. one-time,” “best [category] for [use case],” and “[brand] gift bundle.” Every buyer intent piece runs 1,400 to 2,400 words with a comparison table, product cards, and a clear conversion path to the specific SKU that matches the query intent. Buyer intent content converts at 3 to 6 percent versus 1 to 2 percent on recipe content because the shopper landed already planning to buy, not exploring a usage occasion.
Where-to-buy content structure
Where-to-buy content structure covers online (DTC storefront, Amazon, Target.com, Whole Foods online), retail (specific chain locators with the store finder embedded), and international (customs limitations, retailer partners abroad). Every piece names specific retailers, links to the store locator, and includes an FAQ block covering shipping availability, subscription options, and gift card compatibility. Where-to-buy content ranks for branded discovery queries the DTC storefront otherwise loses to competitor affiliate reviews.
Subscription versus one-time comparison content
Subscription versus one-time comparison content converts subscription commitments at 3 to 6 percent because it addresses the price-sensitivity concern head-on with a specific math table. The piece covers the discount structure (15 percent lifetime), the skip-a-month mechanic, the pause-anytime rule, the cancellation policy, and the specific yearly savings for the brand’s average consumption cadence. Cross-reference the retention structure on our food and beverage marketing retainer page.
Content refresh cadence on food brand pillars
Content refresh cadence on food brand content pillars runs a rolling audit every 12 to 24 months by pillar. Recipes get refreshed every 12 months with new photography, updated schema, and any nutrition or ingredient adjustments. Ingredient comparison guides refresh every 18 months to update market data. Sourcing story pages refresh every 24 months to reflect farm partnership changes and new harvest angles. Buyer intent content refreshes every 12 months to update retailer availability and pricing.
Recipe refresh priority order
Recipe refresh priority runs by organic traffic rank. The top 20 recipes by monthly organic sessions get refreshed first (new photography, schema audit, related recipe internal links, updated nutrition). The next 40 get refreshed at 15 months. The remaining recipes get refreshed opportunistically when the ranking slips past position 15 in Google. Skipping the refresh cadence lets recipe rankings drift out of the top 3 inside 18 months as newer competitor recipes take the position.
Schema audit checklist per refresh
The schema audit checklist per refresh runs 8 items: Recipe schema completeness, aggregateRating count and accuracy, nutrition data accuracy, prepTime and cookTime match the recipe body, image URLs valid at CDN, related recipe internal links working, product card SKU URL live, and Google Search Console rich result eligibility validated. This checklist takes 20 minutes per recipe and prevents the schema drift that costs recipe rankings 20 to 40 positions quietly.
Reporting cadence for food brand content marketing
Reporting cadence on food brand content marketing runs a monthly executive report plus a quarterly business review. The monthly report ships in the first business week and covers organic sessions by pillar, top 10 ranking recipes with position trend, ingredient guide ranking movements, sourcing page performance, and organic-attributed DTC revenue. Every number carries a comparison to the prior month and a plain-language interpretation the founder reads in 7 minutes.
Metrics that matter for content marketing
Metrics that matter for food brand content marketing: organic sessions by pillar, recipe rich result impressions in Search Console, organic conversion rate to hero SKU pages, organic-attributed DTC revenue, and top 20 ranking positions by monthly organic sessions. Vanity metrics that do not matter: total pageviews without conversion context, average time on page without conversion attribution, and social share counts. The monthly report skips the vanity block entirely.
Quarterly business review structure
The quarterly business review runs 90 minutes with the founder, head of content, and SEO lead. Agenda: organic traffic trend by pillar, top 10 winning content pieces, top 10 losing content pieces (candidates for refresh or removal), competitive gap analysis against 5 named competitor brands, and next quarter’s content calendar with recipes and ingredient guides queued. According to Ahrefs content marketing research, brands running quarterly content audits outperform brands running annual audits by 40 to 70 percent on organic revenue over a 24-month window.
Internal linking discipline across food brand content
Internal linking discipline across food brand content moves authority from recipe pages toward hero SKU product pages and comparison guides. Every recipe links to the hero SKU it uses inline (once in the ingredient list, once in a bottom call-out card). Every ingredient comparison guide links to 3 to 6 recipes using the winning ingredient plus the hero SKU product page. Every sourcing story links to the 2 to 4 SKUs sourced from that specific farm or cooperative.
Anchor text strategy across recipe hubs
Anchor text on internal links varies across recipe hubs to avoid over-optimization patterns Google penalizes. Exact-match anchor (“single-origin Ethiopian coffee”) runs on 20 to 30 percent of internal links. Partial-match variations (“our Ethiopian roast”) run on 30 to 40 percent. Branded anchors (the SKU name) run on 20 to 30 percent. Generic anchors (“shop the coffee”) fill the remaining 10 to 20 percent. This ratio holds ranking without triggering the over-optimization penalty that shows up on brands that anchor-text-stuff every internal link with the same exact-match keyword. Cross-reference the linking layer on our food and beverage web design page.
Link equity from ingredient guides to SKU pages
Link equity from ingredient guides passes to SKU pages when the guide’s comparison table names the hero SKU in the winning column with a product card, and when the guide’s body links to 3 to 6 recipes that use the winning ingredient. This 3-hop path (guide to recipe to SKU) pushes authority from a high-traffic informational query down to a high-intent transactional page. According to Search Engine Land SEO coverage, informational content that internally links to transactional pages produces 2 to 4 times higher organic revenue than isolated content silos.
Wrapping up content marketing for food brands
Content marketing for food brands is the organic engine that turns a DTC snack, drink, or CPG storefront into a search-driven revenue channel. Recipe hub of 40 to 100 recipes. Ingredient comparison guides at 12 to 24 pieces. Sourcing story pages at 6 to 12 pieces. Buyer intent content at 8 to 16 pieces. Creator syndication calendar with 12 to 30 creators per quarter. Refresh cadence at 12 to 24 months by pillar. Reporting with organic sessions and organic revenue attribution.
If your DTC food brand is running paid social at 20,000 dollars monthly with a broken blog and zero recipe schema, professional content marketing for food brands pays for itself inside the first 90 days on organic traffic captured. Redefine Web ships content marketing inside our monthly retainer packages. Book a call and we will walk through the last three DTC food brands we built recipe hubs for, pillar by pillar.
Content marketing for food brands starts with a recipe hub because recipe queries account for 40 to 60 percent of high-intent search volume in the food category. Every hero SKU needs 4 to 12 recipes anchored to it, each targeting a specific occasion and audience.
Skip the recipe hub and the brand loses the search real estate that pulls DTC storefront traffic month over month at zero incremental paid cost. Recipe traffic converts at 2 to 4 percent because the shopper landed with usage intent, not passive discovery, which is why food brands win on recipes.
Recipe schema and Google rich result eligibility
Every recipe page ships schema.org Recipe markup including cookTime, prepTime, recipeIngredient, recipeInstructions, nutrition, and aggregateRating. Correctly marked-up recipes qualify for Google’s recipe rich result carousel that pulls 3 to 6 times higher click-through rate than a plain blue link. The schema layer takes 15 minutes per recipe to author and 30 minutes to validate in Google Search Console. Cross-reference the recipe search stack on our food and beverage SEO page.
Recipe hub structure that scales
The recipe hub structure runs 40 to 100 recipes at maturity, organized by hero SKU (4 to 12 recipes per SKU) plus occasion tags (breakfast, weeknight dinner, meal prep, brunch, holiday). Every recipe links back to the hero SKU product page with the SKU embedded in an inline card. The hub earns internal linking value from ingredient comparison guides and the sourcing story pages, which feeds recipe ranking on Google. According to Google Search Central recipe structured data guidance, complete Recipe schema markup is required for eligibility in the recipe carousel and the ingredient search filter.
Pillar structure for food brand content marketing
The pillar structure on content marketing for food brands runs 4 content pillars concurrently: recipe hub (40 to 100 recipes), ingredient comparison guides (12 to 24 guides), sourcing story pages (6 to 12 pages), and buyer intent content (where to buy, subscription vs. one-time, gift bundle guides). Every pillar covers a distinct search intent and every pillar links back to the hero SKU product pages.
Ingredient comparison guide format
Ingredient comparison guides run 1,800 to 3,200 words comparing 2 to 4 ingredient types on 6 to 10 attributes with a comparison table, real-world use case examples, and links to the hero SKU that uses the specific ingredient. Example: organic vs. conventional oats compares nutritional profile, sourcing chain, cost, environmental impact, and taste on a 6-column table. The brand’s SKU appears in the winning column with a product card. These guides rank 3 to 8 months after publication and pull steady-state organic traffic.
Sourcing story pages that build trust
Sourcing story pages name the specific farms, cooperatives, or suppliers the brand sources from, with photos of the farms, farmer quotes, and specific harvest windows. A coffee brand’s Ethiopian farm page ranks for “single-origin Ethiopian coffee” and “Yirgacheffe coffee origin” plus 40 long-tail variations. The sourcing page pulls trust-building traffic that converts at 4 to 6 percent because the shopper landed pattern-matching on transparency and named provenance. Every sourcing page includes farmer or cooperative quotes, harvest dates, and a link back to 3 to 5 hero SKU pages that source from the named supplier.
Vejrø hospitality content case study
Vejrø Resort, a Danish private-island destination with an on-site restaurant focused on organic, locally sourced cuisine, joined us with strong social engagement and no organic-search real estate. Guests found the resort on Instagram but never in Google search for terms like “private island resort Denmark,” “farm-to-table hospitality Denmark,” or “Vejrø restaurant.” The same organic-search gap shows up on DTC food brands running paid social at 20,000 dollars monthly with a broken blog and zero recipe schema.
We built the conversion-focused website with on-site and off-site SEO tuned to the travel-niche keyword clusters, competitor analysis against comparable boutique resorts, and mobile-first design prioritizing guest discovery. Every page carried the structured data qualifying it for Google’s rich results in the hospitality category. Every internal link pushed authority toward the direct-booking conversion path.
Three months later, Vejrø hit 10,000 plus organic visitors, ranked for 200 plus first-page keywords, and pulled a 2.2 percent booking conversion rate from organic traffic. The same pattern applies to content marketing for food brands: recipe schema, ingredient comparison guides, and sourcing story pages pull organic traffic at 20 to 40 percent conversion into hero SKU pages inside 6 months when the content quality matches search intent and every page carries the right structured data markup. Vejrø also proved out the reporting discipline: every monthly report named the exact page, the exact keyword cluster, and the exact search feature (rich result, sitelinks, image pack) driving the incremental organic revenue instead of hiding behind aggregate traffic charts.
Recipe cadence and content calendar for food brands
Recipe cadence on a working food brand content calendar ships 2 to 4 new recipes per week during the first 6 months and drops to 1 per week at maturity. Each recipe takes 4 to 6 hours to produce (write, test in the kitchen, photograph, schema author, publish). At 3 recipes per week, the brand hits 78 recipes inside 6 months plus a backlog of ingredient comparison and sourcing content queued behind the recipe production line.
| Content pillar | Target volume year 1 | Production cost per piece | Refresh cadence |
|---|---|---|---|
| Recipe hub | 40 to 100 recipes | $180 to $320 | Every 12 months |
| Ingredient comparison guides | 12 to 24 guides | $450 to $780 | Every 18 months |
| Sourcing story pages | 6 to 12 pages | $680 to $1,200 | Every 24 months |
| Buyer intent content | 8 to 16 pieces | $220 to $420 | Every 12 months |
Photography as a content calendar constraint
Photography is the actual constraint on recipe cadence, not writing. Every recipe needs 6 to 12 photos: hero shot, ingredient flat lay, prep in progress, plated result, storage, and step shots for the schema markup. A working food brand batches photography 8 recipes at a time to keep the cost per recipe under 200 dollars. Skip the batching and the per-recipe cost climbs to 400 to 600 dollars, which caps recipe cadence at 1 per week and slows organic ranking timeline by 6 months.
Seasonal content calendar planning
Seasonal content calendar planning maps recipes and comparison guides to the seasonal windows they need to rank in. A Christmas cookie recipe needs to publish in September to rank by early December. A Valentine’s chocolate guide needs to publish in November to rank by early February. A back-to-school lunchbox recipe needs to publish in June to rank by late August. The 60-to-90-day ranking curve dictates the calendar.
Creator syndication inside food brand content
Creator syndication on food brand content marketing amplifies the recipe hub through Instagram Reels, TikTok, and YouTube Shorts creators paid to post their own version of the brand’s hero recipes. The creator content pulls net-new audiences into the recipe hub through the creator’s Link in Bio or Amazon Storefront tag. The syndication calendar names 12 to 30 creators per quarter with specific recipes assigned to each.
One brand we picked up had a spreadsheet titled “creator outreach 2023” with 47 rows and 3 responses. All 3 responses were auto-replies. The spreadsheet named zero recipes and offered flat rates below 100 dollars per post. Nobody posts a 30-second video for 87 dollars flat. Nobody.
Creator content commercial terms that work
Working creator content commercial terms run 350 to 1,500 dollars flat per post plus a 12 to 25 percent commission on tagged sales across a 30-day window. The commission mechanic pulls creators into follow-up posts because the incremental revenue continues past the initial fee. Mid-tier creators (30k to 150k followers) hit the sweet spot for food brand content because their engagement rate typically runs 4 to 8 percent versus 0.8 to 1.6 percent on mega-creators.
Content brief structure for creator partnerships
The content brief structure for creator partnerships runs a single page: the SKU, the specific recipe or usage occasion, 3 required brand mentions, 3 restricted claims (no health claims on non-medical SKUs), the pricing angle, the affiliate link, and 3 example videos that hit the tone. The brief avoids over-scripting because over-scripted creator content underperforms native creator voice by 40 to 60 percent on engagement rate.
Buyer intent content for food brand blogs
Buyer intent content on food brand blogs covers 8 to 16 pieces targeting explicit purchase-decision queries: “where to buy [brand],” “[brand] subscription vs. one-time,” “best [category] for [use case],” and “[brand] gift bundle.” Every buyer intent piece runs 1,400 to 2,400 words with a comparison table, product cards, and a clear conversion path to the specific SKU that matches the query intent. Buyer intent content converts at 3 to 6 percent versus 1 to 2 percent on recipe content because the shopper landed already planning to buy, not exploring a usage occasion.
Where-to-buy content structure
Where-to-buy content structure covers online (DTC storefront, Amazon, Target.com, Whole Foods online), retail (specific chain locators with the store finder embedded), and international (customs limitations, retailer partners abroad). Every piece names specific retailers, links to the store locator, and includes an FAQ block covering shipping availability, subscription options, and gift card compatibility. Where-to-buy content ranks for branded discovery queries the DTC storefront otherwise loses to competitor affiliate reviews.
Subscription versus one-time comparison content
Subscription versus one-time comparison content converts subscription commitments at 3 to 6 percent because it addresses the price-sensitivity concern head-on with a specific math table. The piece covers the discount structure (15 percent lifetime), the skip-a-month mechanic, the pause-anytime rule, the cancellation policy, and the specific yearly savings for the brand’s average consumption cadence. Cross-reference the retention structure on our food and beverage marketing retainer page.
Content refresh cadence on food brand pillars
Content refresh cadence on food brand content pillars runs a rolling audit every 12 to 24 months by pillar. Recipes get refreshed every 12 months with new photography, updated schema, and any nutrition or ingredient adjustments. Ingredient comparison guides refresh every 18 months to update market data. Sourcing story pages refresh every 24 months to reflect farm partnership changes and new harvest angles. Buyer intent content refreshes every 12 months to update retailer availability and pricing.
Recipe refresh priority order
Recipe refresh priority runs by organic traffic rank. The top 20 recipes by monthly organic sessions get refreshed first (new photography, schema audit, related recipe internal links, updated nutrition). The next 40 get refreshed at 15 months. The remaining recipes get refreshed opportunistically when the ranking slips past position 15 in Google. Skipping the refresh cadence lets recipe rankings drift out of the top 3 inside 18 months as newer competitor recipes take the position.
Schema audit checklist per refresh
The schema audit checklist per refresh runs 8 items: Recipe schema completeness, aggregateRating count and accuracy, nutrition data accuracy, prepTime and cookTime match the recipe body, image URLs valid at CDN, related recipe internal links working, product card SKU URL live, and Google Search Console rich result eligibility validated. This checklist takes 20 minutes per recipe and prevents the schema drift that costs recipe rankings 20 to 40 positions quietly.
Reporting cadence for food brand content marketing
Reporting cadence on food brand content marketing runs a monthly executive report plus a quarterly business review. The monthly report ships in the first business week and covers organic sessions by pillar, top 10 ranking recipes with position trend, ingredient guide ranking movements, sourcing page performance, and organic-attributed DTC revenue. Every number carries a comparison to the prior month and a plain-language interpretation the founder reads in 7 minutes.
Metrics that matter for content marketing
Metrics that matter for food brand content marketing: organic sessions by pillar, recipe rich result impressions in Search Console, organic conversion rate to hero SKU pages, organic-attributed DTC revenue, and top 20 ranking positions by monthly organic sessions. Vanity metrics that do not matter: total pageviews without conversion context, average time on page without conversion attribution, and social share counts. The monthly report skips the vanity block entirely.
Quarterly business review structure
The quarterly business review runs 90 minutes with the founder, head of content, and SEO lead. Agenda: organic traffic trend by pillar, top 10 winning content pieces, top 10 losing content pieces (candidates for refresh or removal), competitive gap analysis against 5 named competitor brands, and next quarter’s content calendar with recipes and ingredient guides queued. According to Ahrefs content marketing research, brands running quarterly content audits outperform brands running annual audits by 40 to 70 percent on organic revenue over a 24-month window.
Internal linking discipline across food brand content
Internal linking discipline across food brand content moves authority from recipe pages toward hero SKU product pages and comparison guides. Every recipe links to the hero SKU it uses inline (once in the ingredient list, once in a bottom call-out card). Every ingredient comparison guide links to 3 to 6 recipes using the winning ingredient plus the hero SKU product page. Every sourcing story links to the 2 to 4 SKUs sourced from that specific farm or cooperative.
Anchor text strategy across recipe hubs
Anchor text on internal links varies across recipe hubs to avoid over-optimization patterns Google penalizes. Exact-match anchor (“single-origin Ethiopian coffee”) runs on 20 to 30 percent of internal links. Partial-match variations (“our Ethiopian roast”) run on 30 to 40 percent. Branded anchors (the SKU name) run on 20 to 30 percent. Generic anchors (“shop the coffee”) fill the remaining 10 to 20 percent. This ratio holds ranking without triggering the over-optimization penalty that shows up on brands that anchor-text-stuff every internal link with the same exact-match keyword. Cross-reference the linking layer on our food and beverage web design page.
Link equity from ingredient guides to SKU pages
Link equity from ingredient guides passes to SKU pages when the guide’s comparison table names the hero SKU in the winning column with a product card, and when the guide’s body links to 3 to 6 recipes that use the winning ingredient. This 3-hop path (guide to recipe to SKU) pushes authority from a high-traffic informational query down to a high-intent transactional page. According to Search Engine Land SEO coverage, informational content that internally links to transactional pages produces 2 to 4 times higher organic revenue than isolated content silos.
Wrapping up content marketing for food brands
Content marketing for food brands is the organic engine that turns a DTC snack, drink, or CPG storefront into a search-driven revenue channel. Recipe hub of 40 to 100 recipes. Ingredient comparison guides at 12 to 24 pieces. Sourcing story pages at 6 to 12 pieces. Buyer intent content at 8 to 16 pieces. Creator syndication calendar with 12 to 30 creators per quarter. Refresh cadence at 12 to 24 months by pillar. Reporting with organic sessions and organic revenue attribution.
If your DTC food brand is running paid social at 20,000 dollars monthly with a broken blog and zero recipe schema, professional content marketing for food brands pays for itself inside the first 90 days on organic traffic captured. Redefine Web ships content marketing inside our monthly retainer packages. Book a call and we will walk through the last three DTC food brands we built recipe hubs for, pillar by pillar.
Content marketing for food brands starts with a recipe hub because recipe queries account for 40 to 60 percent of high-intent search volume in the food category. Every hero SKU needs 4 to 12 recipes anchored to it, each targeting a specific occasion and audience.
Skip the recipe hub and the brand loses the search real estate that pulls DTC storefront traffic month over month at zero incremental paid cost. Recipe traffic converts at 2 to 4 percent because the shopper landed with usage intent, not passive discovery, which is why food brands win on recipes.
Recipe schema and Google rich result eligibility
Every recipe page ships schema.org Recipe markup including cookTime, prepTime, recipeIngredient, recipeInstructions, nutrition, and aggregateRating. Correctly marked-up recipes qualify for Google’s recipe rich result carousel that pulls 3 to 6 times higher click-through rate than a plain blue link. The schema layer takes 15 minutes per recipe to author and 30 minutes to validate in Google Search Console. Cross-reference the recipe search stack on our food and beverage SEO page.
Recipe hub structure that scales
The recipe hub structure runs 40 to 100 recipes at maturity, organized by hero SKU (4 to 12 recipes per SKU) plus occasion tags (breakfast, weeknight dinner, meal prep, brunch, holiday). Every recipe links back to the hero SKU product page with the SKU embedded in an inline card. The hub earns internal linking value from ingredient comparison guides and the sourcing story pages, which feeds recipe ranking on Google. According to Google Search Central recipe structured data guidance, complete Recipe schema markup is required for eligibility in the recipe carousel and the ingredient search filter.
Pillar structure for food brand content marketing
The pillar structure on content marketing for food brands runs 4 content pillars concurrently: recipe hub (40 to 100 recipes), ingredient comparison guides (12 to 24 guides), sourcing story pages (6 to 12 pages), and buyer intent content (where to buy, subscription vs. one-time, gift bundle guides). Every pillar covers a distinct search intent and every pillar links back to the hero SKU product pages.
Ingredient comparison guide format
Ingredient comparison guides run 1,800 to 3,200 words comparing 2 to 4 ingredient types on 6 to 10 attributes with a comparison table, real-world use case examples, and links to the hero SKU that uses the specific ingredient. Example: organic vs. conventional oats compares nutritional profile, sourcing chain, cost, environmental impact, and taste on a 6-column table. The brand’s SKU appears in the winning column with a product card. These guides rank 3 to 8 months after publication and pull steady-state organic traffic.
Sourcing story pages that build trust
Sourcing story pages name the specific farms, cooperatives, or suppliers the brand sources from, with photos of the farms, farmer quotes, and specific harvest windows. A coffee brand’s Ethiopian farm page ranks for “single-origin Ethiopian coffee” and “Yirgacheffe coffee origin” plus 40 long-tail variations. The sourcing page pulls trust-building traffic that converts at 4 to 6 percent because the shopper landed pattern-matching on transparency and named provenance. Every sourcing page includes farmer or cooperative quotes, harvest dates, and a link back to 3 to 5 hero SKU pages that source from the named supplier.
Vejrø hospitality content case study
Vejrø Resort, a Danish private-island destination with an on-site restaurant focused on organic, locally sourced cuisine, joined us with strong social engagement and no organic-search real estate. Guests found the resort on Instagram but never in Google search for terms like “private island resort Denmark,” “farm-to-table hospitality Denmark,” or “Vejrø restaurant.” The same organic-search gap shows up on DTC food brands running paid social at 20,000 dollars monthly with a broken blog and zero recipe schema.
We built the conversion-focused website with on-site and off-site SEO tuned to the travel-niche keyword clusters, competitor analysis against comparable boutique resorts, and mobile-first design prioritizing guest discovery. Every page carried the structured data qualifying it for Google’s rich results in the hospitality category. Every internal link pushed authority toward the direct-booking conversion path.
Three months later, Vejrø hit 10,000 plus organic visitors, ranked for 200 plus first-page keywords, and pulled a 2.2 percent booking conversion rate from organic traffic. The same pattern applies to content marketing for food brands: recipe schema, ingredient comparison guides, and sourcing story pages pull organic traffic at 20 to 40 percent conversion into hero SKU pages inside 6 months when the content quality matches search intent and every page carries the right structured data markup. Vejrø also proved out the reporting discipline: every monthly report named the exact page, the exact keyword cluster, and the exact search feature (rich result, sitelinks, image pack) driving the incremental organic revenue instead of hiding behind aggregate traffic charts.
Recipe cadence and content calendar for food brands
Recipe cadence on a working food brand content calendar ships 2 to 4 new recipes per week during the first 6 months and drops to 1 per week at maturity. Each recipe takes 4 to 6 hours to produce (write, test in the kitchen, photograph, schema author, publish). At 3 recipes per week, the brand hits 78 recipes inside 6 months plus a backlog of ingredient comparison and sourcing content queued behind the recipe production line.
| Content pillar | Target volume year 1 | Production cost per piece | Refresh cadence |
|---|---|---|---|
| Recipe hub | 40 to 100 recipes | $180 to $320 | Every 12 months |
| Ingredient comparison guides | 12 to 24 guides | $450 to $780 | Every 18 months |
| Sourcing story pages | 6 to 12 pages | $680 to $1,200 | Every 24 months |
| Buyer intent content | 8 to 16 pieces | $220 to $420 | Every 12 months |
Photography as a content calendar constraint
Photography is the actual constraint on recipe cadence, not writing. Every recipe needs 6 to 12 photos: hero shot, ingredient flat lay, prep in progress, plated result, storage, and step shots for the schema markup. A working food brand batches photography 8 recipes at a time to keep the cost per recipe under 200 dollars. Skip the batching and the per-recipe cost climbs to 400 to 600 dollars, which caps recipe cadence at 1 per week and slows organic ranking timeline by 6 months.
Seasonal content calendar planning
Seasonal content calendar planning maps recipes and comparison guides to the seasonal windows they need to rank in. A Christmas cookie recipe needs to publish in September to rank by early December. A Valentine’s chocolate guide needs to publish in November to rank by early February. A back-to-school lunchbox recipe needs to publish in June to rank by late August. The 60-to-90-day ranking curve dictates the calendar.
Creator syndication inside food brand content
Creator syndication on food brand content marketing amplifies the recipe hub through Instagram Reels, TikTok, and YouTube Shorts creators paid to post their own version of the brand’s hero recipes. The creator content pulls net-new audiences into the recipe hub through the creator’s Link in Bio or Amazon Storefront tag. The syndication calendar names 12 to 30 creators per quarter with specific recipes assigned to each.
One brand we picked up had a spreadsheet titled “creator outreach 2023” with 47 rows and 3 responses. All 3 responses were auto-replies. The spreadsheet named zero recipes and offered flat rates below 100 dollars per post. Nobody posts a 30-second video for 87 dollars flat. Nobody.
Creator content commercial terms that work
Working creator content commercial terms run 350 to 1,500 dollars flat per post plus a 12 to 25 percent commission on tagged sales across a 30-day window. The commission mechanic pulls creators into follow-up posts because the incremental revenue continues past the initial fee. Mid-tier creators (30k to 150k followers) hit the sweet spot for food brand content because their engagement rate typically runs 4 to 8 percent versus 0.8 to 1.6 percent on mega-creators.
Content brief structure for creator partnerships
The content brief structure for creator partnerships runs a single page: the SKU, the specific recipe or usage occasion, 3 required brand mentions, 3 restricted claims (no health claims on non-medical SKUs), the pricing angle, the affiliate link, and 3 example videos that hit the tone. The brief avoids over-scripting because over-scripted creator content underperforms native creator voice by 40 to 60 percent on engagement rate.
Buyer intent content for food brand blogs
Buyer intent content on food brand blogs covers 8 to 16 pieces targeting explicit purchase-decision queries: “where to buy [brand],” “[brand] subscription vs. one-time,” “best [category] for [use case],” and “[brand] gift bundle.” Every buyer intent piece runs 1,400 to 2,400 words with a comparison table, product cards, and a clear conversion path to the specific SKU that matches the query intent. Buyer intent content converts at 3 to 6 percent versus 1 to 2 percent on recipe content because the shopper landed already planning to buy, not exploring a usage occasion.
Where-to-buy content structure
Where-to-buy content structure covers online (DTC storefront, Amazon, Target.com, Whole Foods online), retail (specific chain locators with the store finder embedded), and international (customs limitations, retailer partners abroad). Every piece names specific retailers, links to the store locator, and includes an FAQ block covering shipping availability, subscription options, and gift card compatibility. Where-to-buy content ranks for branded discovery queries the DTC storefront otherwise loses to competitor affiliate reviews.
Subscription versus one-time comparison content
Subscription versus one-time comparison content converts subscription commitments at 3 to 6 percent because it addresses the price-sensitivity concern head-on with a specific math table. The piece covers the discount structure (15 percent lifetime), the skip-a-month mechanic, the pause-anytime rule, the cancellation policy, and the specific yearly savings for the brand’s average consumption cadence. Cross-reference the retention structure on our food and beverage marketing retainer page.
Content refresh cadence on food brand pillars
Content refresh cadence on food brand content pillars runs a rolling audit every 12 to 24 months by pillar. Recipes get refreshed every 12 months with new photography, updated schema, and any nutrition or ingredient adjustments. Ingredient comparison guides refresh every 18 months to update market data. Sourcing story pages refresh every 24 months to reflect farm partnership changes and new harvest angles. Buyer intent content refreshes every 12 months to update retailer availability and pricing.
Recipe refresh priority order
Recipe refresh priority runs by organic traffic rank. The top 20 recipes by monthly organic sessions get refreshed first (new photography, schema audit, related recipe internal links, updated nutrition). The next 40 get refreshed at 15 months. The remaining recipes get refreshed opportunistically when the ranking slips past position 15 in Google. Skipping the refresh cadence lets recipe rankings drift out of the top 3 inside 18 months as newer competitor recipes take the position.
Schema audit checklist per refresh
The schema audit checklist per refresh runs 8 items: Recipe schema completeness, aggregateRating count and accuracy, nutrition data accuracy, prepTime and cookTime match the recipe body, image URLs valid at CDN, related recipe internal links working, product card SKU URL live, and Google Search Console rich result eligibility validated. This checklist takes 20 minutes per recipe and prevents the schema drift that costs recipe rankings 20 to 40 positions quietly.
Reporting cadence for food brand content marketing
Reporting cadence on food brand content marketing runs a monthly executive report plus a quarterly business review. The monthly report ships in the first business week and covers organic sessions by pillar, top 10 ranking recipes with position trend, ingredient guide ranking movements, sourcing page performance, and organic-attributed DTC revenue. Every number carries a comparison to the prior month and a plain-language interpretation the founder reads in 7 minutes.
Metrics that matter for content marketing
Metrics that matter for food brand content marketing: organic sessions by pillar, recipe rich result impressions in Search Console, organic conversion rate to hero SKU pages, organic-attributed DTC revenue, and top 20 ranking positions by monthly organic sessions. Vanity metrics that do not matter: total pageviews without conversion context, average time on page without conversion attribution, and social share counts. The monthly report skips the vanity block entirely.
Quarterly business review structure
The quarterly business review runs 90 minutes with the founder, head of content, and SEO lead. Agenda: organic traffic trend by pillar, top 10 winning content pieces, top 10 losing content pieces (candidates for refresh or removal), competitive gap analysis against 5 named competitor brands, and next quarter’s content calendar with recipes and ingredient guides queued. According to Ahrefs content marketing research, brands running quarterly content audits outperform brands running annual audits by 40 to 70 percent on organic revenue over a 24-month window.
Internal linking discipline across food brand content
Internal linking discipline across food brand content moves authority from recipe pages toward hero SKU product pages and comparison guides. Every recipe links to the hero SKU it uses inline (once in the ingredient list, once in a bottom call-out card). Every ingredient comparison guide links to 3 to 6 recipes using the winning ingredient plus the hero SKU product page. Every sourcing story links to the 2 to 4 SKUs sourced from that specific farm or cooperative.
Anchor text strategy across recipe hubs
Anchor text on internal links varies across recipe hubs to avoid over-optimization patterns Google penalizes. Exact-match anchor (“single-origin Ethiopian coffee”) runs on 20 to 30 percent of internal links. Partial-match variations (“our Ethiopian roast”) run on 30 to 40 percent. Branded anchors (the SKU name) run on 20 to 30 percent. Generic anchors (“shop the coffee”) fill the remaining 10 to 20 percent. This ratio holds ranking without triggering the over-optimization penalty that shows up on brands that anchor-text-stuff every internal link with the same exact-match keyword. Cross-reference the linking layer on our food and beverage web design page.
Link equity from ingredient guides to SKU pages
Link equity from ingredient guides passes to SKU pages when the guide’s comparison table names the hero SKU in the winning column with a product card, and when the guide’s body links to 3 to 6 recipes that use the winning ingredient. This 3-hop path (guide to recipe to SKU) pushes authority from a high-traffic informational query down to a high-intent transactional page. According to Search Engine Land SEO coverage, informational content that internally links to transactional pages produces 2 to 4 times higher organic revenue than isolated content silos.
Wrapping up content marketing for food brands
Content marketing for food brands is the organic engine that turns a DTC snack, drink, or CPG storefront into a search-driven revenue channel. Recipe hub of 40 to 100 recipes. Ingredient comparison guides at 12 to 24 pieces. Sourcing story pages at 6 to 12 pieces. Buyer intent content at 8 to 16 pieces. Creator syndication calendar with 12 to 30 creators per quarter. Refresh cadence at 12 to 24 months by pillar. Reporting with organic sessions and organic revenue attribution.
If your DTC food brand is running paid social at 20,000 dollars monthly with a broken blog and zero recipe schema, professional content marketing for food brands pays for itself inside the first 90 days on organic traffic captured. Redefine Web ships content marketing inside our monthly retainer packages. Book a call and we will walk through the last three DTC food brands we built recipe hubs for, pillar by pillar.
Anchor text on internal links varies across recipe hubs to avoid over-optimization patterns Google penalizes. Exact-match anchor (“single-origin Ethiopian coffee”) runs on 20 to 30 percent of internal links. Partial-match variations (“our Ethiopian roast”) run on 30 to 40 percent. Branded anchors (the SKU name) run on 20 to 30 percent. Generic anchors (“shop the coffee”) fill the remaining 10 to 20 percent. This ratio holds ranking without triggering the over-optimization penalty that shows up on brands that anchor-text-stuff every internal link with the same exact-match keyword. Cross-reference the linking layer on our food and beverage web design page.
Link equity from ingredient guides to SKU pages
Link equity from ingredient guides passes to SKU pages when the guide’s comparison table names the hero SKU in the winning column with a product card, and when the guide’s body links to 3 to 6 recipes that use the winning ingredient. This 3-hop path (guide to recipe to SKU) pushes authority from a high-traffic informational query down to a high-intent transactional page. According to Search Engine Land SEO coverage, informational content that internally links to transactional pages produces 2 to 4 times higher organic revenue than isolated content silos.
Wrapping up content marketing for food brands
Content marketing for food brands is the organic engine that turns a DTC snack, drink, or CPG storefront into a search-driven revenue channel. Recipe hub of 40 to 100 recipes. Ingredient comparison guides at 12 to 24 pieces. Sourcing story pages at 6 to 12 pieces. Buyer intent content at 8 to 16 pieces. Creator syndication calendar with 12 to 30 creators per quarter. Refresh cadence at 12 to 24 months by pillar. Reporting with organic sessions and organic revenue attribution.
If your DTC food brand is running paid social at 20,000 dollars monthly with a broken blog and zero recipe schema, professional content marketing for food brands pays for itself inside the first 90 days on organic traffic captured. Redefine Web ships content marketing inside our monthly retainer packages. Book a call and we will walk through the last three DTC food brands we built recipe hubs for, pillar by pillar.
Content marketing for food brands starts with a recipe hub because recipe queries account for 40 to 60 percent of high-intent search volume in the food category. Every hero SKU needs 4 to 12 recipes anchored to it, each targeting a specific occasion and audience.
Skip the recipe hub and the brand loses the search real estate that pulls DTC storefront traffic month over month at zero incremental paid cost. Recipe traffic converts at 2 to 4 percent because the shopper landed with usage intent, not passive discovery, which is why food brands win on recipes.
Recipe schema and Google rich result eligibility
Every recipe page ships schema.org Recipe markup including cookTime, prepTime, recipeIngredient, recipeInstructions, nutrition, and aggregateRating. Correctly marked-up recipes qualify for Google’s recipe rich result carousel that pulls 3 to 6 times higher click-through rate than a plain blue link. The schema layer takes 15 minutes per recipe to author and 30 minutes to validate in Google Search Console. Cross-reference the recipe search stack on our food and beverage SEO page.
Recipe hub structure that scales
The recipe hub structure runs 40 to 100 recipes at maturity, organized by hero SKU (4 to 12 recipes per SKU) plus occasion tags (breakfast, weeknight dinner, meal prep, brunch, holiday). Every recipe links back to the hero SKU product page with the SKU embedded in an inline card. The hub earns internal linking value from ingredient comparison guides and the sourcing story pages, which feeds recipe ranking on Google. According to Google Search Central recipe structured data guidance, complete Recipe schema markup is required for eligibility in the recipe carousel and the ingredient search filter.
Pillar structure for food brand content marketing
The pillar structure on content marketing for food brands runs 4 content pillars concurrently: recipe hub (40 to 100 recipes), ingredient comparison guides (12 to 24 guides), sourcing story pages (6 to 12 pages), and buyer intent content (where to buy, subscription vs. one-time, gift bundle guides). Every pillar covers a distinct search intent and every pillar links back to the hero SKU product pages.
Ingredient comparison guide format
Ingredient comparison guides run 1,800 to 3,200 words comparing 2 to 4 ingredient types on 6 to 10 attributes with a comparison table, real-world use case examples, and links to the hero SKU that uses the specific ingredient. Example: organic vs. conventional oats compares nutritional profile, sourcing chain, cost, environmental impact, and taste on a 6-column table. The brand’s SKU appears in the winning column with a product card. These guides rank 3 to 8 months after publication and pull steady-state organic traffic.
Sourcing story pages that build trust
Sourcing story pages name the specific farms, cooperatives, or suppliers the brand sources from, with photos of the farms, farmer quotes, and specific harvest windows. A coffee brand’s Ethiopian farm page ranks for “single-origin Ethiopian coffee” and “Yirgacheffe coffee origin” plus 40 long-tail variations. The sourcing page pulls trust-building traffic that converts at 4 to 6 percent because the shopper landed pattern-matching on transparency and named provenance. Every sourcing page includes farmer or cooperative quotes, harvest dates, and a link back to 3 to 5 hero SKU pages that source from the named supplier.
Vejrø hospitality content case study
Vejrø Resort, a Danish private-island destination with an on-site restaurant focused on organic, locally sourced cuisine, joined us with strong social engagement and no organic-search real estate. Guests found the resort on Instagram but never in Google search for terms like “private island resort Denmark,” “farm-to-table hospitality Denmark,” or “Vejrø restaurant.” The same organic-search gap shows up on DTC food brands running paid social at 20,000 dollars monthly with a broken blog and zero recipe schema.
We built the conversion-focused website with on-site and off-site SEO tuned to the travel-niche keyword clusters, competitor analysis against comparable boutique resorts, and mobile-first design prioritizing guest discovery. Every page carried the structured data qualifying it for Google’s rich results in the hospitality category. Every internal link pushed authority toward the direct-booking conversion path.
Three months later, Vejrø hit 10,000 plus organic visitors, ranked for 200 plus first-page keywords, and pulled a 2.2 percent booking conversion rate from organic traffic. The same pattern applies to content marketing for food brands: recipe schema, ingredient comparison guides, and sourcing story pages pull organic traffic at 20 to 40 percent conversion into hero SKU pages inside 6 months when the content quality matches search intent and every page carries the right structured data markup. Vejrø also proved out the reporting discipline: every monthly report named the exact page, the exact keyword cluster, and the exact search feature (rich result, sitelinks, image pack) driving the incremental organic revenue instead of hiding behind aggregate traffic charts.
Recipe cadence and content calendar for food brands
Recipe cadence on a working food brand content calendar ships 2 to 4 new recipes per week during the first 6 months and drops to 1 per week at maturity. Each recipe takes 4 to 6 hours to produce (write, test in the kitchen, photograph, schema author, publish). At 3 recipes per week, the brand hits 78 recipes inside 6 months plus a backlog of ingredient comparison and sourcing content queued behind the recipe production line.
| Content pillar | Target volume year 1 | Production cost per piece | Refresh cadence |
|---|---|---|---|
| Recipe hub | 40 to 100 recipes | $180 to $320 | Every 12 months |
| Ingredient comparison guides | 12 to 24 guides | $450 to $780 | Every 18 months |
| Sourcing story pages | 6 to 12 pages | $680 to $1,200 | Every 24 months |
| Buyer intent content | 8 to 16 pieces | $220 to $420 | Every 12 months |
Photography as a content calendar constraint
Photography is the actual constraint on recipe cadence, not writing. Every recipe needs 6 to 12 photos: hero shot, ingredient flat lay, prep in progress, plated result, storage, and step shots for the schema markup. A working food brand batches photography 8 recipes at a time to keep the cost per recipe under 200 dollars. Skip the batching and the per-recipe cost climbs to 400 to 600 dollars, which caps recipe cadence at 1 per week and slows organic ranking timeline by 6 months.
Seasonal content calendar planning
Seasonal content calendar planning maps recipes and comparison guides to the seasonal windows they need to rank in. A Christmas cookie recipe needs to publish in September to rank by early December. A Valentine’s chocolate guide needs to publish in November to rank by early February. A back-to-school lunchbox recipe needs to publish in June to rank by late August. The 60-to-90-day ranking curve dictates the calendar.
Creator syndication inside food brand content
Creator syndication on food brand content marketing amplifies the recipe hub through Instagram Reels, TikTok, and YouTube Shorts creators paid to post their own version of the brand’s hero recipes. The creator content pulls net-new audiences into the recipe hub through the creator’s Link in Bio or Amazon Storefront tag. The syndication calendar names 12 to 30 creators per quarter with specific recipes assigned to each.
One brand we picked up had a spreadsheet titled “creator outreach 2023” with 47 rows and 3 responses. All 3 responses were auto-replies. The spreadsheet named zero recipes and offered flat rates below 100 dollars per post. Nobody posts a 30-second video for 87 dollars flat. Nobody.
Creator content commercial terms that work
Working creator content commercial terms run 350 to 1,500 dollars flat per post plus a 12 to 25 percent commission on tagged sales across a 30-day window. The commission mechanic pulls creators into follow-up posts because the incremental revenue continues past the initial fee. Mid-tier creators (30k to 150k followers) hit the sweet spot for food brand content because their engagement rate typically runs 4 to 8 percent versus 0.8 to 1.6 percent on mega-creators.
Content brief structure for creator partnerships
The content brief structure for creator partnerships runs a single page: the SKU, the specific recipe or usage occasion, 3 required brand mentions, 3 restricted claims (no health claims on non-medical SKUs), the pricing angle, the affiliate link, and 3 example videos that hit the tone. The brief avoids over-scripting because over-scripted creator content underperforms native creator voice by 40 to 60 percent on engagement rate.
Buyer intent content for food brand blogs
Buyer intent content on food brand blogs covers 8 to 16 pieces targeting explicit purchase-decision queries: “where to buy [brand],” “[brand] subscription vs. one-time,” “best [category] for [use case],” and “[brand] gift bundle.” Every buyer intent piece runs 1,400 to 2,400 words with a comparison table, product cards, and a clear conversion path to the specific SKU that matches the query intent. Buyer intent content converts at 3 to 6 percent versus 1 to 2 percent on recipe content because the shopper landed already planning to buy, not exploring a usage occasion.
Where-to-buy content structure
Where-to-buy content structure covers online (DTC storefront, Amazon, Target.com, Whole Foods online), retail (specific chain locators with the store finder embedded), and international (customs limitations, retailer partners abroad). Every piece names specific retailers, links to the store locator, and includes an FAQ block covering shipping availability, subscription options, and gift card compatibility. Where-to-buy content ranks for branded discovery queries the DTC storefront otherwise loses to competitor affiliate reviews.
Subscription versus one-time comparison content
Subscription versus one-time comparison content converts subscription commitments at 3 to 6 percent because it addresses the price-sensitivity concern head-on with a specific math table. The piece covers the discount structure (15 percent lifetime), the skip-a-month mechanic, the pause-anytime rule, the cancellation policy, and the specific yearly savings for the brand’s average consumption cadence. Cross-reference the retention structure on our food and beverage marketing retainer page.
Content refresh cadence on food brand pillars
Content refresh cadence on food brand content pillars runs a rolling audit every 12 to 24 months by pillar. Recipes get refreshed every 12 months with new photography, updated schema, and any nutrition or ingredient adjustments. Ingredient comparison guides refresh every 18 months to update market data. Sourcing story pages refresh every 24 months to reflect farm partnership changes and new harvest angles. Buyer intent content refreshes every 12 months to update retailer availability and pricing.
Recipe refresh priority order
Recipe refresh priority runs by organic traffic rank. The top 20 recipes by monthly organic sessions get refreshed first (new photography, schema audit, related recipe internal links, updated nutrition). The next 40 get refreshed at 15 months. The remaining recipes get refreshed opportunistically when the ranking slips past position 15 in Google. Skipping the refresh cadence lets recipe rankings drift out of the top 3 inside 18 months as newer competitor recipes take the position.
Schema audit checklist per refresh
The schema audit checklist per refresh runs 8 items: Recipe schema completeness, aggregateRating count and accuracy, nutrition data accuracy, prepTime and cookTime match the recipe body, image URLs valid at CDN, related recipe internal links working, product card SKU URL live, and Google Search Console rich result eligibility validated. This checklist takes 20 minutes per recipe and prevents the schema drift that costs recipe rankings 20 to 40 positions quietly.
Reporting cadence for food brand content marketing
Reporting cadence on food brand content marketing runs a monthly executive report plus a quarterly business review. The monthly report ships in the first business week and covers organic sessions by pillar, top 10 ranking recipes with position trend, ingredient guide ranking movements, sourcing page performance, and organic-attributed DTC revenue. Every number carries a comparison to the prior month and a plain-language interpretation the founder reads in 7 minutes.
Metrics that matter for content marketing
Metrics that matter for food brand content marketing: organic sessions by pillar, recipe rich result impressions in Search Console, organic conversion rate to hero SKU pages, organic-attributed DTC revenue, and top 20 ranking positions by monthly organic sessions. Vanity metrics that do not matter: total pageviews without conversion context, average time on page without conversion attribution, and social share counts. The monthly report skips the vanity block entirely.
Quarterly business review structure
The quarterly business review runs 90 minutes with the founder, head of content, and SEO lead. Agenda: organic traffic trend by pillar, top 10 winning content pieces, top 10 losing content pieces (candidates for refresh or removal), competitive gap analysis against 5 named competitor brands, and next quarter’s content calendar with recipes and ingredient guides queued. According to Ahrefs content marketing research, brands running quarterly content audits outperform brands running annual audits by 40 to 70 percent on organic revenue over a 24-month window.
Internal linking discipline across food brand content
Internal linking discipline across food brand content moves authority from recipe pages toward hero SKU product pages and comparison guides. Every recipe links to the hero SKU it uses inline (once in the ingredient list, once in a bottom call-out card). Every ingredient comparison guide links to 3 to 6 recipes using the winning ingredient plus the hero SKU product page. Every sourcing story links to the 2 to 4 SKUs sourced from that specific farm or cooperative.
Anchor text strategy across recipe hubs
Anchor text on internal links varies across recipe hubs to avoid over-optimization patterns Google penalizes. Exact-match anchor (“single-origin Ethiopian coffee”) runs on 20 to 30 percent of internal links. Partial-match variations (“our Ethiopian roast”) run on 30 to 40 percent. Branded anchors (the SKU name) run on 20 to 30 percent. Generic anchors (“shop the coffee”) fill the remaining 10 to 20 percent. This ratio holds ranking without triggering the over-optimization penalty that shows up on brands that anchor-text-stuff every internal link with the same exact-match keyword. Cross-reference the linking layer on our food and beverage web design page.
Link equity from ingredient guides to SKU pages
Link equity from ingredient guides passes to SKU pages when the guide’s comparison table names the hero SKU in the winning column with a product card, and when the guide’s body links to 3 to 6 recipes that use the winning ingredient. This 3-hop path (guide to recipe to SKU) pushes authority from a high-traffic informational query down to a high-intent transactional page. According to Search Engine Land SEO coverage, informational content that internally links to transactional pages produces 2 to 4 times higher organic revenue than isolated content silos.
Wrapping up content marketing for food brands
Content marketing for food brands is the organic engine that turns a DTC snack, drink, or CPG storefront into a search-driven revenue channel. Recipe hub of 40 to 100 recipes. Ingredient comparison guides at 12 to 24 pieces. Sourcing story pages at 6 to 12 pieces. Buyer intent content at 8 to 16 pieces. Creator syndication calendar with 12 to 30 creators per quarter. Refresh cadence at 12 to 24 months by pillar. Reporting with organic sessions and organic revenue attribution.
If your DTC food brand is running paid social at 20,000 dollars monthly with a broken blog and zero recipe schema, professional content marketing for food brands pays for itself inside the first 90 days on organic traffic captured. Redefine Web ships content marketing inside our monthly retainer packages. Book a call and we will walk through the last three DTC food brands we built recipe hubs for, pillar by pillar.
Internal linking discipline across food brand content moves authority from recipe pages toward hero SKU product pages and comparison guides. Every recipe links to the hero SKU it uses inline (once in the ingredient list, once in a bottom call-out card). Every ingredient comparison guide links to 3 to 6 recipes using the winning ingredient plus the hero SKU product page. Every sourcing story links to the 2 to 4 SKUs sourced from that specific farm or cooperative.
Anchor text strategy across recipe hubs
Anchor text on internal links varies across recipe hubs to avoid over-optimization patterns Google penalizes. Exact-match anchor (“single-origin Ethiopian coffee”) runs on 20 to 30 percent of internal links. Partial-match variations (“our Ethiopian roast”) run on 30 to 40 percent. Branded anchors (the SKU name) run on 20 to 30 percent. Generic anchors (“shop the coffee”) fill the remaining 10 to 20 percent. This ratio holds ranking without triggering the over-optimization penalty that shows up on brands that anchor-text-stuff every internal link with the same exact-match keyword. Cross-reference the linking layer on our food and beverage web design page.
Link equity from ingredient guides to SKU pages
Link equity from ingredient guides passes to SKU pages when the guide’s comparison table names the hero SKU in the winning column with a product card, and when the guide’s body links to 3 to 6 recipes that use the winning ingredient. This 3-hop path (guide to recipe to SKU) pushes authority from a high-traffic informational query down to a high-intent transactional page. According to Search Engine Land SEO coverage, informational content that internally links to transactional pages produces 2 to 4 times higher organic revenue than isolated content silos.
Wrapping up content marketing for food brands
Content marketing for food brands is the organic engine that turns a DTC snack, drink, or CPG storefront into a search-driven revenue channel. Recipe hub of 40 to 100 recipes. Ingredient comparison guides at 12 to 24 pieces. Sourcing story pages at 6 to 12 pieces. Buyer intent content at 8 to 16 pieces. Creator syndication calendar with 12 to 30 creators per quarter. Refresh cadence at 12 to 24 months by pillar. Reporting with organic sessions and organic revenue attribution.
If your DTC food brand is running paid social at 20,000 dollars monthly with a broken blog and zero recipe schema, professional content marketing for food brands pays for itself inside the first 90 days on organic traffic captured. Redefine Web ships content marketing inside our monthly retainer packages. Book a call and we will walk through the last three DTC food brands we built recipe hubs for, pillar by pillar.
Content marketing for food brands starts with a recipe hub because recipe queries account for 40 to 60 percent of high-intent search volume in the food category. Every hero SKU needs 4 to 12 recipes anchored to it, each targeting a specific occasion and audience.
Skip the recipe hub and the brand loses the search real estate that pulls DTC storefront traffic month over month at zero incremental paid cost. Recipe traffic converts at 2 to 4 percent because the shopper landed with usage intent, not passive discovery, which is why food brands win on recipes.
Recipe schema and Google rich result eligibility
Every recipe page ships schema.org Recipe markup including cookTime, prepTime, recipeIngredient, recipeInstructions, nutrition, and aggregateRating. Correctly marked-up recipes qualify for Google’s recipe rich result carousel that pulls 3 to 6 times higher click-through rate than a plain blue link. The schema layer takes 15 minutes per recipe to author and 30 minutes to validate in Google Search Console. Cross-reference the recipe search stack on our food and beverage SEO page.
Recipe hub structure that scales
The recipe hub structure runs 40 to 100 recipes at maturity, organized by hero SKU (4 to 12 recipes per SKU) plus occasion tags (breakfast, weeknight dinner, meal prep, brunch, holiday). Every recipe links back to the hero SKU product page with the SKU embedded in an inline card. The hub earns internal linking value from ingredient comparison guides and the sourcing story pages, which feeds recipe ranking on Google. According to Google Search Central recipe structured data guidance, complete Recipe schema markup is required for eligibility in the recipe carousel and the ingredient search filter.
Pillar structure for food brand content marketing
The pillar structure on content marketing for food brands runs 4 content pillars concurrently: recipe hub (40 to 100 recipes), ingredient comparison guides (12 to 24 guides), sourcing story pages (6 to 12 pages), and buyer intent content (where to buy, subscription vs. one-time, gift bundle guides). Every pillar covers a distinct search intent and every pillar links back to the hero SKU product pages.
Ingredient comparison guide format
Ingredient comparison guides run 1,800 to 3,200 words comparing 2 to 4 ingredient types on 6 to 10 attributes with a comparison table, real-world use case examples, and links to the hero SKU that uses the specific ingredient. Example: organic vs. conventional oats compares nutritional profile, sourcing chain, cost, environmental impact, and taste on a 6-column table. The brand’s SKU appears in the winning column with a product card. These guides rank 3 to 8 months after publication and pull steady-state organic traffic.
Sourcing story pages that build trust
Sourcing story pages name the specific farms, cooperatives, or suppliers the brand sources from, with photos of the farms, farmer quotes, and specific harvest windows. A coffee brand’s Ethiopian farm page ranks for “single-origin Ethiopian coffee” and “Yirgacheffe coffee origin” plus 40 long-tail variations. The sourcing page pulls trust-building traffic that converts at 4 to 6 percent because the shopper landed pattern-matching on transparency and named provenance. Every sourcing page includes farmer or cooperative quotes, harvest dates, and a link back to 3 to 5 hero SKU pages that source from the named supplier.
Vejrø hospitality content case study
Vejrø Resort, a Danish private-island destination with an on-site restaurant focused on organic, locally sourced cuisine, joined us with strong social engagement and no organic-search real estate. Guests found the resort on Instagram but never in Google search for terms like “private island resort Denmark,” “farm-to-table hospitality Denmark,” or “Vejrø restaurant.” The same organic-search gap shows up on DTC food brands running paid social at 20,000 dollars monthly with a broken blog and zero recipe schema.
We built the conversion-focused website with on-site and off-site SEO tuned to the travel-niche keyword clusters, competitor analysis against comparable boutique resorts, and mobile-first design prioritizing guest discovery. Every page carried the structured data qualifying it for Google’s rich results in the hospitality category. Every internal link pushed authority toward the direct-booking conversion path.
Three months later, Vejrø hit 10,000 plus organic visitors, ranked for 200 plus first-page keywords, and pulled a 2.2 percent booking conversion rate from organic traffic. The same pattern applies to content marketing for food brands: recipe schema, ingredient comparison guides, and sourcing story pages pull organic traffic at 20 to 40 percent conversion into hero SKU pages inside 6 months when the content quality matches search intent and every page carries the right structured data markup. Vejrø also proved out the reporting discipline: every monthly report named the exact page, the exact keyword cluster, and the exact search feature (rich result, sitelinks, image pack) driving the incremental organic revenue instead of hiding behind aggregate traffic charts.
Recipe cadence and content calendar for food brands
Recipe cadence on a working food brand content calendar ships 2 to 4 new recipes per week during the first 6 months and drops to 1 per week at maturity. Each recipe takes 4 to 6 hours to produce (write, test in the kitchen, photograph, schema author, publish). At 3 recipes per week, the brand hits 78 recipes inside 6 months plus a backlog of ingredient comparison and sourcing content queued behind the recipe production line.
| Content pillar | Target volume year 1 | Production cost per piece | Refresh cadence |
|---|---|---|---|
| Recipe hub | 40 to 100 recipes | $180 to $320 | Every 12 months |
| Ingredient comparison guides | 12 to 24 guides | $450 to $780 | Every 18 months |
| Sourcing story pages | 6 to 12 pages | $680 to $1,200 | Every 24 months |
| Buyer intent content | 8 to 16 pieces | $220 to $420 | Every 12 months |
Photography as a content calendar constraint
Photography is the actual constraint on recipe cadence, not writing. Every recipe needs 6 to 12 photos: hero shot, ingredient flat lay, prep in progress, plated result, storage, and step shots for the schema markup. A working food brand batches photography 8 recipes at a time to keep the cost per recipe under 200 dollars. Skip the batching and the per-recipe cost climbs to 400 to 600 dollars, which caps recipe cadence at 1 per week and slows organic ranking timeline by 6 months.
Seasonal content calendar planning
Seasonal content calendar planning maps recipes and comparison guides to the seasonal windows they need to rank in. A Christmas cookie recipe needs to publish in September to rank by early December. A Valentine’s chocolate guide needs to publish in November to rank by early February. A back-to-school lunchbox recipe needs to publish in June to rank by late August. The 60-to-90-day ranking curve dictates the calendar.
Creator syndication inside food brand content
Creator syndication on food brand content marketing amplifies the recipe hub through Instagram Reels, TikTok, and YouTube Shorts creators paid to post their own version of the brand’s hero recipes. The creator content pulls net-new audiences into the recipe hub through the creator’s Link in Bio or Amazon Storefront tag. The syndication calendar names 12 to 30 creators per quarter with specific recipes assigned to each.
One brand we picked up had a spreadsheet titled “creator outreach 2023” with 47 rows and 3 responses. All 3 responses were auto-replies. The spreadsheet named zero recipes and offered flat rates below 100 dollars per post. Nobody posts a 30-second video for 87 dollars flat. Nobody.
Creator content commercial terms that work
Working creator content commercial terms run 350 to 1,500 dollars flat per post plus a 12 to 25 percent commission on tagged sales across a 30-day window. The commission mechanic pulls creators into follow-up posts because the incremental revenue continues past the initial fee. Mid-tier creators (30k to 150k followers) hit the sweet spot for food brand content because their engagement rate typically runs 4 to 8 percent versus 0.8 to 1.6 percent on mega-creators.
Content brief structure for creator partnerships
The content brief structure for creator partnerships runs a single page: the SKU, the specific recipe or usage occasion, 3 required brand mentions, 3 restricted claims (no health claims on non-medical SKUs), the pricing angle, the affiliate link, and 3 example videos that hit the tone. The brief avoids over-scripting because over-scripted creator content underperforms native creator voice by 40 to 60 percent on engagement rate.
Buyer intent content for food brand blogs
Buyer intent content on food brand blogs covers 8 to 16 pieces targeting explicit purchase-decision queries: “where to buy [brand],” “[brand] subscription vs. one-time,” “best [category] for [use case],” and “[brand] gift bundle.” Every buyer intent piece runs 1,400 to 2,400 words with a comparison table, product cards, and a clear conversion path to the specific SKU that matches the query intent. Buyer intent content converts at 3 to 6 percent versus 1 to 2 percent on recipe content because the shopper landed already planning to buy, not exploring a usage occasion.
Where-to-buy content structure
Where-to-buy content structure covers online (DTC storefront, Amazon, Target.com, Whole Foods online), retail (specific chain locators with the store finder embedded), and international (customs limitations, retailer partners abroad). Every piece names specific retailers, links to the store locator, and includes an FAQ block covering shipping availability, subscription options, and gift card compatibility. Where-to-buy content ranks for branded discovery queries the DTC storefront otherwise loses to competitor affiliate reviews.
Subscription versus one-time comparison content
Subscription versus one-time comparison content converts subscription commitments at 3 to 6 percent because it addresses the price-sensitivity concern head-on with a specific math table. The piece covers the discount structure (15 percent lifetime), the skip-a-month mechanic, the pause-anytime rule, the cancellation policy, and the specific yearly savings for the brand’s average consumption cadence. Cross-reference the retention structure on our food and beverage marketing retainer page.
Content refresh cadence on food brand pillars
Content refresh cadence on food brand content pillars runs a rolling audit every 12 to 24 months by pillar. Recipes get refreshed every 12 months with new photography, updated schema, and any nutrition or ingredient adjustments. Ingredient comparison guides refresh every 18 months to update market data. Sourcing story pages refresh every 24 months to reflect farm partnership changes and new harvest angles. Buyer intent content refreshes every 12 months to update retailer availability and pricing.
Recipe refresh priority order
Recipe refresh priority runs by organic traffic rank. The top 20 recipes by monthly organic sessions get refreshed first (new photography, schema audit, related recipe internal links, updated nutrition). The next 40 get refreshed at 15 months. The remaining recipes get refreshed opportunistically when the ranking slips past position 15 in Google. Skipping the refresh cadence lets recipe rankings drift out of the top 3 inside 18 months as newer competitor recipes take the position.
Schema audit checklist per refresh
The schema audit checklist per refresh runs 8 items: Recipe schema completeness, aggregateRating count and accuracy, nutrition data accuracy, prepTime and cookTime match the recipe body, image URLs valid at CDN, related recipe internal links working, product card SKU URL live, and Google Search Console rich result eligibility validated. This checklist takes 20 minutes per recipe and prevents the schema drift that costs recipe rankings 20 to 40 positions quietly.
Reporting cadence for food brand content marketing
Reporting cadence on food brand content marketing runs a monthly executive report plus a quarterly business review. The monthly report ships in the first business week and covers organic sessions by pillar, top 10 ranking recipes with position trend, ingredient guide ranking movements, sourcing page performance, and organic-attributed DTC revenue. Every number carries a comparison to the prior month and a plain-language interpretation the founder reads in 7 minutes.
Metrics that matter for content marketing
Metrics that matter for food brand content marketing: organic sessions by pillar, recipe rich result impressions in Search Console, organic conversion rate to hero SKU pages, organic-attributed DTC revenue, and top 20 ranking positions by monthly organic sessions. Vanity metrics that do not matter: total pageviews without conversion context, average time on page without conversion attribution, and social share counts. The monthly report skips the vanity block entirely.
Quarterly business review structure
The quarterly business review runs 90 minutes with the founder, head of content, and SEO lead. Agenda: organic traffic trend by pillar, top 10 winning content pieces, top 10 losing content pieces (candidates for refresh or removal), competitive gap analysis against 5 named competitor brands, and next quarter’s content calendar with recipes and ingredient guides queued. According to Ahrefs content marketing research, brands running quarterly content audits outperform brands running annual audits by 40 to 70 percent on organic revenue over a 24-month window.
Internal linking discipline across food brand content
Internal linking discipline across food brand content moves authority from recipe pages toward hero SKU product pages and comparison guides. Every recipe links to the hero SKU it uses inline (once in the ingredient list, once in a bottom call-out card). Every ingredient comparison guide links to 3 to 6 recipes using the winning ingredient plus the hero SKU product page. Every sourcing story links to the 2 to 4 SKUs sourced from that specific farm or cooperative.
Anchor text strategy across recipe hubs
Anchor text on internal links varies across recipe hubs to avoid over-optimization patterns Google penalizes. Exact-match anchor (“single-origin Ethiopian coffee”) runs on 20 to 30 percent of internal links. Partial-match variations (“our Ethiopian roast”) run on 30 to 40 percent. Branded anchors (the SKU name) run on 20 to 30 percent. Generic anchors (“shop the coffee”) fill the remaining 10 to 20 percent. This ratio holds ranking without triggering the over-optimization penalty that shows up on brands that anchor-text-stuff every internal link with the same exact-match keyword. Cross-reference the linking layer on our food and beverage web design page.
Link equity from ingredient guides to SKU pages
Link equity from ingredient guides passes to SKU pages when the guide’s comparison table names the hero SKU in the winning column with a product card, and when the guide’s body links to 3 to 6 recipes that use the winning ingredient. This 3-hop path (guide to recipe to SKU) pushes authority from a high-traffic informational query down to a high-intent transactional page. According to Search Engine Land SEO coverage, informational content that internally links to transactional pages produces 2 to 4 times higher organic revenue than isolated content silos.
Wrapping up content marketing for food brands
Content marketing for food brands is the organic engine that turns a DTC snack, drink, or CPG storefront into a search-driven revenue channel. Recipe hub of 40 to 100 recipes. Ingredient comparison guides at 12 to 24 pieces. Sourcing story pages at 6 to 12 pieces. Buyer intent content at 8 to 16 pieces. Creator syndication calendar with 12 to 30 creators per quarter. Refresh cadence at 12 to 24 months by pillar. Reporting with organic sessions and organic revenue attribution.
If your DTC food brand is running paid social at 20,000 dollars monthly with a broken blog and zero recipe schema, professional content marketing for food brands pays for itself inside the first 90 days on organic traffic captured. Redefine Web ships content marketing inside our monthly retainer packages. Book a call and we will walk through the last three DTC food brands we built recipe hubs for, pillar by pillar.
Content marketing for food brands starts with a recipe hub because recipe queries account for 40 to 60 percent of high-intent search volume in the food category. Every hero SKU needs 4 to 12 recipes anchored to it, each targeting a specific occasion and audience.
Skip the recipe hub and the brand loses the search real estate that pulls DTC storefront traffic month over month at zero incremental paid cost. Recipe traffic converts at 2 to 4 percent because the shopper landed with usage intent, not passive discovery, which is why food brands win on recipes.
Recipe schema and Google rich result eligibility
Every recipe page ships schema.org Recipe markup including cookTime, prepTime, recipeIngredient, recipeInstructions, nutrition, and aggregateRating. Correctly marked-up recipes qualify for Google’s recipe rich result carousel that pulls 3 to 6 times higher click-through rate than a plain blue link. The schema layer takes 15 minutes per recipe to author and 30 minutes to validate in Google Search Console. Cross-reference the recipe search stack on our food and beverage SEO page.
Recipe hub structure that scales
The recipe hub structure runs 40 to 100 recipes at maturity, organized by hero SKU (4 to 12 recipes per SKU) plus occasion tags (breakfast, weeknight dinner, meal prep, brunch, holiday). Every recipe links back to the hero SKU product page with the SKU embedded in an inline card. The hub earns internal linking value from ingredient comparison guides and the sourcing story pages, which feeds recipe ranking on Google. According to Google Search Central recipe structured data guidance, complete Recipe schema markup is required for eligibility in the recipe carousel and the ingredient search filter.
Pillar structure for food brand content marketing
The pillar structure on content marketing for food brands runs 4 content pillars concurrently: recipe hub (40 to 100 recipes), ingredient comparison guides (12 to 24 guides), sourcing story pages (6 to 12 pages), and buyer intent content (where to buy, subscription vs. one-time, gift bundle guides). Every pillar covers a distinct search intent and every pillar links back to the hero SKU product pages.
Ingredient comparison guide format
Ingredient comparison guides run 1,800 to 3,200 words comparing 2 to 4 ingredient types on 6 to 10 attributes with a comparison table, real-world use case examples, and links to the hero SKU that uses the specific ingredient. Example: organic vs. conventional oats compares nutritional profile, sourcing chain, cost, environmental impact, and taste on a 6-column table. The brand’s SKU appears in the winning column with a product card. These guides rank 3 to 8 months after publication and pull steady-state organic traffic.
Sourcing story pages that build trust
Sourcing story pages name the specific farms, cooperatives, or suppliers the brand sources from, with photos of the farms, farmer quotes, and specific harvest windows. A coffee brand’s Ethiopian farm page ranks for “single-origin Ethiopian coffee” and “Yirgacheffe coffee origin” plus 40 long-tail variations. The sourcing page pulls trust-building traffic that converts at 4 to 6 percent because the shopper landed pattern-matching on transparency and named provenance. Every sourcing page includes farmer or cooperative quotes, harvest dates, and a link back to 3 to 5 hero SKU pages that source from the named supplier.
Vejrø hospitality content case study
Vejrø Resort, a Danish private-island destination with an on-site restaurant focused on organic, locally sourced cuisine, joined us with strong social engagement and no organic-search real estate. Guests found the resort on Instagram but never in Google search for terms like “private island resort Denmark,” “farm-to-table hospitality Denmark,” or “Vejrø restaurant.” The same organic-search gap shows up on DTC food brands running paid social at 20,000 dollars monthly with a broken blog and zero recipe schema.
We built the conversion-focused website with on-site and off-site SEO tuned to the travel-niche keyword clusters, competitor analysis against comparable boutique resorts, and mobile-first design prioritizing guest discovery. Every page carried the structured data qualifying it for Google’s rich results in the hospitality category. Every internal link pushed authority toward the direct-booking conversion path.
Three months later, Vejrø hit 10,000 plus organic visitors, ranked for 200 plus first-page keywords, and pulled a 2.2 percent booking conversion rate from organic traffic. The same pattern applies to content marketing for food brands: recipe schema, ingredient comparison guides, and sourcing story pages pull organic traffic at 20 to 40 percent conversion into hero SKU pages inside 6 months when the content quality matches search intent and every page carries the right structured data markup. Vejrø also proved out the reporting discipline: every monthly report named the exact page, the exact keyword cluster, and the exact search feature (rich result, sitelinks, image pack) driving the incremental organic revenue instead of hiding behind aggregate traffic charts.
Recipe cadence and content calendar for food brands
Recipe cadence on a working food brand content calendar ships 2 to 4 new recipes per week during the first 6 months and drops to 1 per week at maturity. Each recipe takes 4 to 6 hours to produce (write, test in the kitchen, photograph, schema author, publish). At 3 recipes per week, the brand hits 78 recipes inside 6 months plus a backlog of ingredient comparison and sourcing content queued behind the recipe production line.
| Content pillar | Target volume year 1 | Production cost per piece | Refresh cadence |
|---|---|---|---|
| Recipe hub | 40 to 100 recipes | $180 to $320 | Every 12 months |
| Ingredient comparison guides | 12 to 24 guides | $450 to $780 | Every 18 months |
| Sourcing story pages | 6 to 12 pages | $680 to $1,200 | Every 24 months |
| Buyer intent content | 8 to 16 pieces | $220 to $420 | Every 12 months |
Photography as a content calendar constraint
Photography is the actual constraint on recipe cadence, not writing. Every recipe needs 6 to 12 photos: hero shot, ingredient flat lay, prep in progress, plated result, storage, and step shots for the schema markup. A working food brand batches photography 8 recipes at a time to keep the cost per recipe under 200 dollars. Skip the batching and the per-recipe cost climbs to 400 to 600 dollars, which caps recipe cadence at 1 per week and slows organic ranking timeline by 6 months.
Seasonal content calendar planning
Seasonal content calendar planning maps recipes and comparison guides to the seasonal windows they need to rank in. A Christmas cookie recipe needs to publish in September to rank by early December. A Valentine’s chocolate guide needs to publish in November to rank by early February. A back-to-school lunchbox recipe needs to publish in June to rank by late August. The 60-to-90-day ranking curve dictates the calendar.
Creator syndication inside food brand content
Creator syndication on food brand content marketing amplifies the recipe hub through Instagram Reels, TikTok, and YouTube Shorts creators paid to post their own version of the brand’s hero recipes. The creator content pulls net-new audiences into the recipe hub through the creator’s Link in Bio or Amazon Storefront tag. The syndication calendar names 12 to 30 creators per quarter with specific recipes assigned to each.
One brand we picked up had a spreadsheet titled “creator outreach 2023” with 47 rows and 3 responses. All 3 responses were auto-replies. The spreadsheet named zero recipes and offered flat rates below 100 dollars per post. Nobody posts a 30-second video for 87 dollars flat. Nobody.
Creator content commercial terms that work
Working creator content commercial terms run 350 to 1,500 dollars flat per post plus a 12 to 25 percent commission on tagged sales across a 30-day window. The commission mechanic pulls creators into follow-up posts because the incremental revenue continues past the initial fee. Mid-tier creators (30k to 150k followers) hit the sweet spot for food brand content because their engagement rate typically runs 4 to 8 percent versus 0.8 to 1.6 percent on mega-creators.
Content brief structure for creator partnerships
The content brief structure for creator partnerships runs a single page: the SKU, the specific recipe or usage occasion, 3 required brand mentions, 3 restricted claims (no health claims on non-medical SKUs), the pricing angle, the affiliate link, and 3 example videos that hit the tone. The brief avoids over-scripting because over-scripted creator content underperforms native creator voice by 40 to 60 percent on engagement rate.
Buyer intent content for food brand blogs
Buyer intent content on food brand blogs covers 8 to 16 pieces targeting explicit purchase-decision queries: “where to buy [brand],” “[brand] subscription vs. one-time,” “best [category] for [use case],” and “[brand] gift bundle.” Every buyer intent piece runs 1,400 to 2,400 words with a comparison table, product cards, and a clear conversion path to the specific SKU that matches the query intent. Buyer intent content converts at 3 to 6 percent versus 1 to 2 percent on recipe content because the shopper landed already planning to buy, not exploring a usage occasion.
Where-to-buy content structure
Where-to-buy content structure covers online (DTC storefront, Amazon, Target.com, Whole Foods online), retail (specific chain locators with the store finder embedded), and international (customs limitations, retailer partners abroad). Every piece names specific retailers, links to the store locator, and includes an FAQ block covering shipping availability, subscription options, and gift card compatibility. Where-to-buy content ranks for branded discovery queries the DTC storefront otherwise loses to competitor affiliate reviews.
Subscription versus one-time comparison content
Subscription versus one-time comparison content converts subscription commitments at 3 to 6 percent because it addresses the price-sensitivity concern head-on with a specific math table. The piece covers the discount structure (15 percent lifetime), the skip-a-month mechanic, the pause-anytime rule, the cancellation policy, and the specific yearly savings for the brand’s average consumption cadence. Cross-reference the retention structure on our food and beverage marketing retainer page.
Content refresh cadence on food brand pillars
Content refresh cadence on food brand content pillars runs a rolling audit every 12 to 24 months by pillar. Recipes get refreshed every 12 months with new photography, updated schema, and any nutrition or ingredient adjustments. Ingredient comparison guides refresh every 18 months to update market data. Sourcing story pages refresh every 24 months to reflect farm partnership changes and new harvest angles. Buyer intent content refreshes every 12 months to update retailer availability and pricing.
Recipe refresh priority order
Recipe refresh priority runs by organic traffic rank. The top 20 recipes by monthly organic sessions get refreshed first (new photography, schema audit, related recipe internal links, updated nutrition). The next 40 get refreshed at 15 months. The remaining recipes get refreshed opportunistically when the ranking slips past position 15 in Google. Skipping the refresh cadence lets recipe rankings drift out of the top 3 inside 18 months as newer competitor recipes take the position.
Schema audit checklist per refresh
The schema audit checklist per refresh runs 8 items: Recipe schema completeness, aggregateRating count and accuracy, nutrition data accuracy, prepTime and cookTime match the recipe body, image URLs valid at CDN, related recipe internal links working, product card SKU URL live, and Google Search Console rich result eligibility validated. This checklist takes 20 minutes per recipe and prevents the schema drift that costs recipe rankings 20 to 40 positions quietly.
Reporting cadence for food brand content marketing
Reporting cadence on food brand content marketing runs a monthly executive report plus a quarterly business review. The monthly report ships in the first business week and covers organic sessions by pillar, top 10 ranking recipes with position trend, ingredient guide ranking movements, sourcing page performance, and organic-attributed DTC revenue. Every number carries a comparison to the prior month and a plain-language interpretation the founder reads in 7 minutes.
Metrics that matter for content marketing
Metrics that matter for food brand content marketing: organic sessions by pillar, recipe rich result impressions in Search Console, organic conversion rate to hero SKU pages, organic-attributed DTC revenue, and top 20 ranking positions by monthly organic sessions. Vanity metrics that do not matter: total pageviews without conversion context, average time on page without conversion attribution, and social share counts. The monthly report skips the vanity block entirely.
Quarterly business review structure
The quarterly business review runs 90 minutes with the founder, head of content, and SEO lead. Agenda: organic traffic trend by pillar, top 10 winning content pieces, top 10 losing content pieces (candidates for refresh or removal), competitive gap analysis against 5 named competitor brands, and next quarter’s content calendar with recipes and ingredient guides queued. According to Ahrefs content marketing research, brands running quarterly content audits outperform brands running annual audits by 40 to 70 percent on organic revenue over a 24-month window.
Internal linking discipline across food brand content
Internal linking discipline across food brand content moves authority from recipe pages toward hero SKU product pages and comparison guides. Every recipe links to the hero SKU it uses inline (once in the ingredient list, once in a bottom call-out card). Every ingredient comparison guide links to 3 to 6 recipes using the winning ingredient plus the hero SKU product page. Every sourcing story links to the 2 to 4 SKUs sourced from that specific farm or cooperative.
Anchor text strategy across recipe hubs
Anchor text on internal links varies across recipe hubs to avoid over-optimization patterns Google penalizes. Exact-match anchor (“single-origin Ethiopian coffee”) runs on 20 to 30 percent of internal links. Partial-match variations (“our Ethiopian roast”) run on 30 to 40 percent. Branded anchors (the SKU name) run on 20 to 30 percent. Generic anchors (“shop the coffee”) fill the remaining 10 to 20 percent. This ratio holds ranking without triggering the over-optimization penalty that shows up on brands that anchor-text-stuff every internal link with the same exact-match keyword. Cross-reference the linking layer on our food and beverage web design page.
Link equity from ingredient guides to SKU pages
Link equity from ingredient guides passes to SKU pages when the guide’s comparison table names the hero SKU in the winning column with a product card, and when the guide’s body links to 3 to 6 recipes that use the winning ingredient. This 3-hop path (guide to recipe to SKU) pushes authority from a high-traffic informational query down to a high-intent transactional page. According to Search Engine Land SEO coverage, informational content that internally links to transactional pages produces 2 to 4 times higher organic revenue than isolated content silos.
Wrapping up content marketing for food brands
Content marketing for food brands is the organic engine that turns a DTC snack, drink, or CPG storefront into a search-driven revenue channel. Recipe hub of 40 to 100 recipes. Ingredient comparison guides at 12 to 24 pieces. Sourcing story pages at 6 to 12 pieces. Buyer intent content at 8 to 16 pieces. Creator syndication calendar with 12 to 30 creators per quarter. Refresh cadence at 12 to 24 months by pillar. Reporting with organic sessions and organic revenue attribution.
If your DTC food brand is running paid social at 20,000 dollars monthly with a broken blog and zero recipe schema, professional content marketing for food brands pays for itself inside the first 90 days on organic traffic captured. Redefine Web ships content marketing inside our monthly retainer packages. Book a call and we will walk through the last three DTC food brands we built recipe hubs for, pillar by pillar.
Content marketing for food brands starts with a recipe hub because recipe queries account for 40 to 60 percent of high-intent search volume in the food category. Every hero SKU needs 4 to 12 recipes anchored to it, each targeting a specific occasion and audience.
Skip the recipe hub and the brand loses the search real estate that pulls DTC storefront traffic month over month at zero incremental paid cost. Recipe traffic converts at 2 to 4 percent because the shopper landed with usage intent, not passive discovery, which is why food brands win on recipes.
Recipe schema and Google rich result eligibility
Every recipe page ships schema.org Recipe markup including cookTime, prepTime, recipeIngredient, recipeInstructions, nutrition, and aggregateRating. Correctly marked-up recipes qualify for Google’s recipe rich result carousel that pulls 3 to 6 times higher click-through rate than a plain blue link. The schema layer takes 15 minutes per recipe to author and 30 minutes to validate in Google Search Console. Cross-reference the recipe search stack on our food and beverage SEO page.
Recipe hub structure that scales
The recipe hub structure runs 40 to 100 recipes at maturity, organized by hero SKU (4 to 12 recipes per SKU) plus occasion tags (breakfast, weeknight dinner, meal prep, brunch, holiday). Every recipe links back to the hero SKU product page with the SKU embedded in an inline card. The hub earns internal linking value from ingredient comparison guides and the sourcing story pages, which feeds recipe ranking on Google. According to Google Search Central recipe structured data guidance, complete Recipe schema markup is required for eligibility in the recipe carousel and the ingredient search filter.
Pillar structure for food brand content marketing
The pillar structure on content marketing for food brands runs 4 content pillars concurrently: recipe hub (40 to 100 recipes), ingredient comparison guides (12 to 24 guides), sourcing story pages (6 to 12 pages), and buyer intent content (where to buy, subscription vs. one-time, gift bundle guides). Every pillar covers a distinct search intent and every pillar links back to the hero SKU product pages.
Ingredient comparison guide format
Ingredient comparison guides run 1,800 to 3,200 words comparing 2 to 4 ingredient types on 6 to 10 attributes with a comparison table, real-world use case examples, and links to the hero SKU that uses the specific ingredient. Example: organic vs. conventional oats compares nutritional profile, sourcing chain, cost, environmental impact, and taste on a 6-column table. The brand’s SKU appears in the winning column with a product card. These guides rank 3 to 8 months after publication and pull steady-state organic traffic.
Sourcing story pages that build trust
Sourcing story pages name the specific farms, cooperatives, or suppliers the brand sources from, with photos of the farms, farmer quotes, and specific harvest windows. A coffee brand’s Ethiopian farm page ranks for “single-origin Ethiopian coffee” and “Yirgacheffe coffee origin” plus 40 long-tail variations. The sourcing page pulls trust-building traffic that converts at 4 to 6 percent because the shopper landed pattern-matching on transparency and named provenance. Every sourcing page includes farmer or cooperative quotes, harvest dates, and a link back to 3 to 5 hero SKU pages that source from the named supplier.
Vejrø hospitality content case study
Vejrø Resort, a Danish private-island destination with an on-site restaurant focused on organic, locally sourced cuisine, joined us with strong social engagement and no organic-search real estate. Guests found the resort on Instagram but never in Google search for terms like “private island resort Denmark,” “farm-to-table hospitality Denmark,” or “Vejrø restaurant.” The same organic-search gap shows up on DTC food brands running paid social at 20,000 dollars monthly with a broken blog and zero recipe schema.
We built the conversion-focused website with on-site and off-site SEO tuned to the travel-niche keyword clusters, competitor analysis against comparable boutique resorts, and mobile-first design prioritizing guest discovery. Every page carried the structured data qualifying it for Google’s rich results in the hospitality category. Every internal link pushed authority toward the direct-booking conversion path.
Three months later, Vejrø hit 10,000 plus organic visitors, ranked for 200 plus first-page keywords, and pulled a 2.2 percent booking conversion rate from organic traffic. The same pattern applies to content marketing for food brands: recipe schema, ingredient comparison guides, and sourcing story pages pull organic traffic at 20 to 40 percent conversion into hero SKU pages inside 6 months when the content quality matches search intent and every page carries the right structured data markup. Vejrø also proved out the reporting discipline: every monthly report named the exact page, the exact keyword cluster, and the exact search feature (rich result, sitelinks, image pack) driving the incremental organic revenue instead of hiding behind aggregate traffic charts.
Recipe cadence and content calendar for food brands
Recipe cadence on a working food brand content calendar ships 2 to 4 new recipes per week during the first 6 months and drops to 1 per week at maturity. Each recipe takes 4 to 6 hours to produce (write, test in the kitchen, photograph, schema author, publish). At 3 recipes per week, the brand hits 78 recipes inside 6 months plus a backlog of ingredient comparison and sourcing content queued behind the recipe production line.
| Content pillar | Target volume year 1 | Production cost per piece | Refresh cadence |
|---|---|---|---|
| Recipe hub | 40 to 100 recipes | $180 to $320 | Every 12 months |
| Ingredient comparison guides | 12 to 24 guides | $450 to $780 | Every 18 months |
| Sourcing story pages | 6 to 12 pages | $680 to $1,200 | Every 24 months |
| Buyer intent content | 8 to 16 pieces | $220 to $420 | Every 12 months |
Photography as a content calendar constraint
Photography is the actual constraint on recipe cadence, not writing. Every recipe needs 6 to 12 photos: hero shot, ingredient flat lay, prep in progress, plated result, storage, and step shots for the schema markup. A working food brand batches photography 8 recipes at a time to keep the cost per recipe under 200 dollars. Skip the batching and the per-recipe cost climbs to 400 to 600 dollars, which caps recipe cadence at 1 per week and slows organic ranking timeline by 6 months.
Seasonal content calendar planning
Seasonal content calendar planning maps recipes and comparison guides to the seasonal windows they need to rank in. A Christmas cookie recipe needs to publish in September to rank by early December. A Valentine’s chocolate guide needs to publish in November to rank by early February. A back-to-school lunchbox recipe needs to publish in June to rank by late August. The 60-to-90-day ranking curve dictates the calendar.
Creator syndication inside food brand content
Creator syndication on food brand content marketing amplifies the recipe hub through Instagram Reels, TikTok, and YouTube Shorts creators paid to post their own version of the brand’s hero recipes. The creator content pulls net-new audiences into the recipe hub through the creator’s Link in Bio or Amazon Storefront tag. The syndication calendar names 12 to 30 creators per quarter with specific recipes assigned to each.
One brand we picked up had a spreadsheet titled “creator outreach 2023” with 47 rows and 3 responses. All 3 responses were auto-replies. The spreadsheet named zero recipes and offered flat rates below 100 dollars per post. Nobody posts a 30-second video for 87 dollars flat. Nobody.
Creator content commercial terms that work
Working creator content commercial terms run 350 to 1,500 dollars flat per post plus a 12 to 25 percent commission on tagged sales across a 30-day window. The commission mechanic pulls creators into follow-up posts because the incremental revenue continues past the initial fee. Mid-tier creators (30k to 150k followers) hit the sweet spot for food brand content because their engagement rate typically runs 4 to 8 percent versus 0.8 to 1.6 percent on mega-creators.
Content brief structure for creator partnerships
The content brief structure for creator partnerships runs a single page: the SKU, the specific recipe or usage occasion, 3 required brand mentions, 3 restricted claims (no health claims on non-medical SKUs), the pricing angle, the affiliate link, and 3 example videos that hit the tone. The brief avoids over-scripting because over-scripted creator content underperforms native creator voice by 40 to 60 percent on engagement rate.
Buyer intent content for food brand blogs
Buyer intent content on food brand blogs covers 8 to 16 pieces targeting explicit purchase-decision queries: “where to buy [brand],” “[brand] subscription vs. one-time,” “best [category] for [use case],” and “[brand] gift bundle.” Every buyer intent piece runs 1,400 to 2,400 words with a comparison table, product cards, and a clear conversion path to the specific SKU that matches the query intent. Buyer intent content converts at 3 to 6 percent versus 1 to 2 percent on recipe content because the shopper landed already planning to buy, not exploring a usage occasion.
Where-to-buy content structure
Where-to-buy content structure covers online (DTC storefront, Amazon, Target.com, Whole Foods online), retail (specific chain locators with the store finder embedded), and international (customs limitations, retailer partners abroad). Every piece names specific retailers, links to the store locator, and includes an FAQ block covering shipping availability, subscription options, and gift card compatibility. Where-to-buy content ranks for branded discovery queries the DTC storefront otherwise loses to competitor affiliate reviews.
Subscription versus one-time comparison content
Subscription versus one-time comparison content converts subscription commitments at 3 to 6 percent because it addresses the price-sensitivity concern head-on with a specific math table. The piece covers the discount structure (15 percent lifetime), the skip-a-month mechanic, the pause-anytime rule, the cancellation policy, and the specific yearly savings for the brand’s average consumption cadence. Cross-reference the retention structure on our food and beverage marketing retainer page.
Content refresh cadence on food brand pillars
Content refresh cadence on food brand content pillars runs a rolling audit every 12 to 24 months by pillar. Recipes get refreshed every 12 months with new photography, updated schema, and any nutrition or ingredient adjustments. Ingredient comparison guides refresh every 18 months to update market data. Sourcing story pages refresh every 24 months to reflect farm partnership changes and new harvest angles. Buyer intent content refreshes every 12 months to update retailer availability and pricing.
Recipe refresh priority order
Recipe refresh priority runs by organic traffic rank. The top 20 recipes by monthly organic sessions get refreshed first (new photography, schema audit, related recipe internal links, updated nutrition). The next 40 get refreshed at 15 months. The remaining recipes get refreshed opportunistically when the ranking slips past position 15 in Google. Skipping the refresh cadence lets recipe rankings drift out of the top 3 inside 18 months as newer competitor recipes take the position.
Schema audit checklist per refresh
The schema audit checklist per refresh runs 8 items: Recipe schema completeness, aggregateRating count and accuracy, nutrition data accuracy, prepTime and cookTime match the recipe body, image URLs valid at CDN, related recipe internal links working, product card SKU URL live, and Google Search Console rich result eligibility validated. This checklist takes 20 minutes per recipe and prevents the schema drift that costs recipe rankings 20 to 40 positions quietly.
Reporting cadence for food brand content marketing
Reporting cadence on food brand content marketing runs a monthly executive report plus a quarterly business review. The monthly report ships in the first business week and covers organic sessions by pillar, top 10 ranking recipes with position trend, ingredient guide ranking movements, sourcing page performance, and organic-attributed DTC revenue. Every number carries a comparison to the prior month and a plain-language interpretation the founder reads in 7 minutes.
Metrics that matter for content marketing
Metrics that matter for food brand content marketing: organic sessions by pillar, recipe rich result impressions in Search Console, organic conversion rate to hero SKU pages, organic-attributed DTC revenue, and top 20 ranking positions by monthly organic sessions. Vanity metrics that do not matter: total pageviews without conversion context, average time on page without conversion attribution, and social share counts. The monthly report skips the vanity block entirely.
Quarterly business review structure
The quarterly business review runs 90 minutes with the founder, head of content, and SEO lead. Agenda: organic traffic trend by pillar, top 10 winning content pieces, top 10 losing content pieces (candidates for refresh or removal), competitive gap analysis against 5 named competitor brands, and next quarter’s content calendar with recipes and ingredient guides queued. According to Ahrefs content marketing research, brands running quarterly content audits outperform brands running annual audits by 40 to 70 percent on organic revenue over a 24-month window.
Internal linking discipline across food brand content
Internal linking discipline across food brand content moves authority from recipe pages toward hero SKU product pages and comparison guides. Every recipe links to the hero SKU it uses inline (once in the ingredient list, once in a bottom call-out card). Every ingredient comparison guide links to 3 to 6 recipes using the winning ingredient plus the hero SKU product page. Every sourcing story links to the 2 to 4 SKUs sourced from that specific farm or cooperative.
Anchor text strategy across recipe hubs
Anchor text on internal links varies across recipe hubs to avoid over-optimization patterns Google penalizes. Exact-match anchor (“single-origin Ethiopian coffee”) runs on 20 to 30 percent of internal links. Partial-match variations (“our Ethiopian roast”) run on 30 to 40 percent. Branded anchors (the SKU name) run on 20 to 30 percent. Generic anchors (“shop the coffee”) fill the remaining 10 to 20 percent. This ratio holds ranking without triggering the over-optimization penalty that shows up on brands that anchor-text-stuff every internal link with the same exact-match keyword. Cross-reference the linking layer on our food and beverage web design page.
Link equity from ingredient guides to SKU pages
Link equity from ingredient guides passes to SKU pages when the guide’s comparison table names the hero SKU in the winning column with a product card, and when the guide’s body links to 3 to 6 recipes that use the winning ingredient. This 3-hop path (guide to recipe to SKU) pushes authority from a high-traffic informational query down to a high-intent transactional page. According to Search Engine Land SEO coverage, informational content that internally links to transactional pages produces 2 to 4 times higher organic revenue than isolated content silos.
Wrapping up content marketing for food brands
Content marketing for food brands is the organic engine that turns a DTC snack, drink, or CPG storefront into a search-driven revenue channel. Recipe hub of 40 to 100 recipes. Ingredient comparison guides at 12 to 24 pieces. Sourcing story pages at 6 to 12 pieces. Buyer intent content at 8 to 16 pieces. Creator syndication calendar with 12 to 30 creators per quarter. Refresh cadence at 12 to 24 months by pillar. Reporting with organic sessions and organic revenue attribution.
If your DTC food brand is running paid social at 20,000 dollars monthly with a broken blog and zero recipe schema, professional content marketing for food brands pays for itself inside the first 90 days on organic traffic captured. Redefine Web ships content marketing inside our monthly retainer packages. Book a call and we will walk through the last three DTC food brands we built recipe hubs for, pillar by pillar.
Anchor text on internal links varies across recipe hubs to avoid over-optimization patterns Google penalizes. Exact-match anchor (“single-origin Ethiopian coffee”) runs on 20 to 30 percent of internal links. Partial-match variations (“our Ethiopian roast”) run on 30 to 40 percent. Branded anchors (the SKU name) run on 20 to 30 percent. Generic anchors (“shop the coffee”) fill the remaining 10 to 20 percent. This ratio holds ranking without triggering the over-optimization penalty that shows up on brands that anchor-text-stuff every internal link with the same exact-match keyword. Cross-reference the linking layer on our food and beverage web design page.
Link equity from ingredient guides to SKU pages
Link equity from ingredient guides passes to SKU pages when the guide’s comparison table names the hero SKU in the winning column with a product card, and when the guide’s body links to 3 to 6 recipes that use the winning ingredient. This 3-hop path (guide to recipe to SKU) pushes authority from a high-traffic informational query down to a high-intent transactional page. According to Search Engine Land SEO coverage, informational content that internally links to transactional pages produces 2 to 4 times higher organic revenue than isolated content silos.
Wrapping up content marketing for food brands
Content marketing for food brands is the organic engine that turns a DTC snack, drink, or CPG storefront into a search-driven revenue channel. Recipe hub of 40 to 100 recipes. Ingredient comparison guides at 12 to 24 pieces. Sourcing story pages at 6 to 12 pieces. Buyer intent content at 8 to 16 pieces. Creator syndication calendar with 12 to 30 creators per quarter. Refresh cadence at 12 to 24 months by pillar. Reporting with organic sessions and organic revenue attribution.
If your DTC food brand is running paid social at 20,000 dollars monthly with a broken blog and zero recipe schema, professional content marketing for food brands pays for itself inside the first 90 days on organic traffic captured. Redefine Web ships content marketing inside our monthly retainer packages. Book a call and we will walk through the last three DTC food brands we built recipe hubs for, pillar by pillar.
Content marketing for food brands starts with a recipe hub because recipe queries account for 40 to 60 percent of high-intent search volume in the food category. Every hero SKU needs 4 to 12 recipes anchored to it, each targeting a specific occasion and audience.
Skip the recipe hub and the brand loses the search real estate that pulls DTC storefront traffic month over month at zero incremental paid cost. Recipe traffic converts at 2 to 4 percent because the shopper landed with usage intent, not passive discovery, which is why food brands win on recipes.
Recipe schema and Google rich result eligibility
Every recipe page ships schema.org Recipe markup including cookTime, prepTime, recipeIngredient, recipeInstructions, nutrition, and aggregateRating. Correctly marked-up recipes qualify for Google’s recipe rich result carousel that pulls 3 to 6 times higher click-through rate than a plain blue link. The schema layer takes 15 minutes per recipe to author and 30 minutes to validate in Google Search Console. Cross-reference the recipe search stack on our food and beverage SEO page.
Recipe hub structure that scales
The recipe hub structure runs 40 to 100 recipes at maturity, organized by hero SKU (4 to 12 recipes per SKU) plus occasion tags (breakfast, weeknight dinner, meal prep, brunch, holiday). Every recipe links back to the hero SKU product page with the SKU embedded in an inline card. The hub earns internal linking value from ingredient comparison guides and the sourcing story pages, which feeds recipe ranking on Google. According to Google Search Central recipe structured data guidance, complete Recipe schema markup is required for eligibility in the recipe carousel and the ingredient search filter.
Pillar structure for food brand content marketing
The pillar structure on content marketing for food brands runs 4 content pillars concurrently: recipe hub (40 to 100 recipes), ingredient comparison guides (12 to 24 guides), sourcing story pages (6 to 12 pages), and buyer intent content (where to buy, subscription vs. one-time, gift bundle guides). Every pillar covers a distinct search intent and every pillar links back to the hero SKU product pages.
Ingredient comparison guide format
Ingredient comparison guides run 1,800 to 3,200 words comparing 2 to 4 ingredient types on 6 to 10 attributes with a comparison table, real-world use case examples, and links to the hero SKU that uses the specific ingredient. Example: organic vs. conventional oats compares nutritional profile, sourcing chain, cost, environmental impact, and taste on a 6-column table. The brand’s SKU appears in the winning column with a product card. These guides rank 3 to 8 months after publication and pull steady-state organic traffic.
Sourcing story pages that build trust
Sourcing story pages name the specific farms, cooperatives, or suppliers the brand sources from, with photos of the farms, farmer quotes, and specific harvest windows. A coffee brand’s Ethiopian farm page ranks for “single-origin Ethiopian coffee” and “Yirgacheffe coffee origin” plus 40 long-tail variations. The sourcing page pulls trust-building traffic that converts at 4 to 6 percent because the shopper landed pattern-matching on transparency and named provenance. Every sourcing page includes farmer or cooperative quotes, harvest dates, and a link back to 3 to 5 hero SKU pages that source from the named supplier.
Vejrø hospitality content case study
Vejrø Resort, a Danish private-island destination with an on-site restaurant focused on organic, locally sourced cuisine, joined us with strong social engagement and no organic-search real estate. Guests found the resort on Instagram but never in Google search for terms like “private island resort Denmark,” “farm-to-table hospitality Denmark,” or “Vejrø restaurant.” The same organic-search gap shows up on DTC food brands running paid social at 20,000 dollars monthly with a broken blog and zero recipe schema.
We built the conversion-focused website with on-site and off-site SEO tuned to the travel-niche keyword clusters, competitor analysis against comparable boutique resorts, and mobile-first design prioritizing guest discovery. Every page carried the structured data qualifying it for Google’s rich results in the hospitality category. Every internal link pushed authority toward the direct-booking conversion path.
Three months later, Vejrø hit 10,000 plus organic visitors, ranked for 200 plus first-page keywords, and pulled a 2.2 percent booking conversion rate from organic traffic. The same pattern applies to content marketing for food brands: recipe schema, ingredient comparison guides, and sourcing story pages pull organic traffic at 20 to 40 percent conversion into hero SKU pages inside 6 months when the content quality matches search intent and every page carries the right structured data markup. Vejrø also proved out the reporting discipline: every monthly report named the exact page, the exact keyword cluster, and the exact search feature (rich result, sitelinks, image pack) driving the incremental organic revenue instead of hiding behind aggregate traffic charts.
Recipe cadence and content calendar for food brands
Recipe cadence on a working food brand content calendar ships 2 to 4 new recipes per week during the first 6 months and drops to 1 per week at maturity. Each recipe takes 4 to 6 hours to produce (write, test in the kitchen, photograph, schema author, publish). At 3 recipes per week, the brand hits 78 recipes inside 6 months plus a backlog of ingredient comparison and sourcing content queued behind the recipe production line.
| Content pillar | Target volume year 1 | Production cost per piece | Refresh cadence |
|---|---|---|---|
| Recipe hub | 40 to 100 recipes | $180 to $320 | Every 12 months |
| Ingredient comparison guides | 12 to 24 guides | $450 to $780 | Every 18 months |
| Sourcing story pages | 6 to 12 pages | $680 to $1,200 | Every 24 months |
| Buyer intent content | 8 to 16 pieces | $220 to $420 | Every 12 months |
Photography as a content calendar constraint
Photography is the actual constraint on recipe cadence, not writing. Every recipe needs 6 to 12 photos: hero shot, ingredient flat lay, prep in progress, plated result, storage, and step shots for the schema markup. A working food brand batches photography 8 recipes at a time to keep the cost per recipe under 200 dollars. Skip the batching and the per-recipe cost climbs to 400 to 600 dollars, which caps recipe cadence at 1 per week and slows organic ranking timeline by 6 months.
Seasonal content calendar planning
Seasonal content calendar planning maps recipes and comparison guides to the seasonal windows they need to rank in. A Christmas cookie recipe needs to publish in September to rank by early December. A Valentine’s chocolate guide needs to publish in November to rank by early February. A back-to-school lunchbox recipe needs to publish in June to rank by late August. The 60-to-90-day ranking curve dictates the calendar.
Creator syndication inside food brand content
Creator syndication on food brand content marketing amplifies the recipe hub through Instagram Reels, TikTok, and YouTube Shorts creators paid to post their own version of the brand’s hero recipes. The creator content pulls net-new audiences into the recipe hub through the creator’s Link in Bio or Amazon Storefront tag. The syndication calendar names 12 to 30 creators per quarter with specific recipes assigned to each.
One brand we picked up had a spreadsheet titled “creator outreach 2023” with 47 rows and 3 responses. All 3 responses were auto-replies. The spreadsheet named zero recipes and offered flat rates below 100 dollars per post. Nobody posts a 30-second video for 87 dollars flat. Nobody.
Creator content commercial terms that work
Working creator content commercial terms run 350 to 1,500 dollars flat per post plus a 12 to 25 percent commission on tagged sales across a 30-day window. The commission mechanic pulls creators into follow-up posts because the incremental revenue continues past the initial fee. Mid-tier creators (30k to 150k followers) hit the sweet spot for food brand content because their engagement rate typically runs 4 to 8 percent versus 0.8 to 1.6 percent on mega-creators.
Content brief structure for creator partnerships
The content brief structure for creator partnerships runs a single page: the SKU, the specific recipe or usage occasion, 3 required brand mentions, 3 restricted claims (no health claims on non-medical SKUs), the pricing angle, the affiliate link, and 3 example videos that hit the tone. The brief avoids over-scripting because over-scripted creator content underperforms native creator voice by 40 to 60 percent on engagement rate.
Buyer intent content for food brand blogs
Buyer intent content on food brand blogs covers 8 to 16 pieces targeting explicit purchase-decision queries: “where to buy [brand],” “[brand] subscription vs. one-time,” “best [category] for [use case],” and “[brand] gift bundle.” Every buyer intent piece runs 1,400 to 2,400 words with a comparison table, product cards, and a clear conversion path to the specific SKU that matches the query intent. Buyer intent content converts at 3 to 6 percent versus 1 to 2 percent on recipe content because the shopper landed already planning to buy, not exploring a usage occasion.
Where-to-buy content structure
Where-to-buy content structure covers online (DTC storefront, Amazon, Target.com, Whole Foods online), retail (specific chain locators with the store finder embedded), and international (customs limitations, retailer partners abroad). Every piece names specific retailers, links to the store locator, and includes an FAQ block covering shipping availability, subscription options, and gift card compatibility. Where-to-buy content ranks for branded discovery queries the DTC storefront otherwise loses to competitor affiliate reviews.
Subscription versus one-time comparison content
Subscription versus one-time comparison content converts subscription commitments at 3 to 6 percent because it addresses the price-sensitivity concern head-on with a specific math table. The piece covers the discount structure (15 percent lifetime), the skip-a-month mechanic, the pause-anytime rule, the cancellation policy, and the specific yearly savings for the brand’s average consumption cadence. Cross-reference the retention structure on our food and beverage marketing retainer page.
Content refresh cadence on food brand pillars
Content refresh cadence on food brand content pillars runs a rolling audit every 12 to 24 months by pillar. Recipes get refreshed every 12 months with new photography, updated schema, and any nutrition or ingredient adjustments. Ingredient comparison guides refresh every 18 months to update market data. Sourcing story pages refresh every 24 months to reflect farm partnership changes and new harvest angles. Buyer intent content refreshes every 12 months to update retailer availability and pricing.
Recipe refresh priority order
Recipe refresh priority runs by organic traffic rank. The top 20 recipes by monthly organic sessions get refreshed first (new photography, schema audit, related recipe internal links, updated nutrition). The next 40 get refreshed at 15 months. The remaining recipes get refreshed opportunistically when the ranking slips past position 15 in Google. Skipping the refresh cadence lets recipe rankings drift out of the top 3 inside 18 months as newer competitor recipes take the position.
Schema audit checklist per refresh
The schema audit checklist per refresh runs 8 items: Recipe schema completeness, aggregateRating count and accuracy, nutrition data accuracy, prepTime and cookTime match the recipe body, image URLs valid at CDN, related recipe internal links working, product card SKU URL live, and Google Search Console rich result eligibility validated. This checklist takes 20 minutes per recipe and prevents the schema drift that costs recipe rankings 20 to 40 positions quietly.
Reporting cadence for food brand content marketing
Reporting cadence on food brand content marketing runs a monthly executive report plus a quarterly business review. The monthly report ships in the first business week and covers organic sessions by pillar, top 10 ranking recipes with position trend, ingredient guide ranking movements, sourcing page performance, and organic-attributed DTC revenue. Every number carries a comparison to the prior month and a plain-language interpretation the founder reads in 7 minutes.
Metrics that matter for content marketing
Metrics that matter for food brand content marketing: organic sessions by pillar, recipe rich result impressions in Search Console, organic conversion rate to hero SKU pages, organic-attributed DTC revenue, and top 20 ranking positions by monthly organic sessions. Vanity metrics that do not matter: total pageviews without conversion context, average time on page without conversion attribution, and social share counts. The monthly report skips the vanity block entirely.
Quarterly business review structure
The quarterly business review runs 90 minutes with the founder, head of content, and SEO lead. Agenda: organic traffic trend by pillar, top 10 winning content pieces, top 10 losing content pieces (candidates for refresh or removal), competitive gap analysis against 5 named competitor brands, and next quarter’s content calendar with recipes and ingredient guides queued. According to Ahrefs content marketing research, brands running quarterly content audits outperform brands running annual audits by 40 to 70 percent on organic revenue over a 24-month window.
Internal linking discipline across food brand content
Internal linking discipline across food brand content moves authority from recipe pages toward hero SKU product pages and comparison guides. Every recipe links to the hero SKU it uses inline (once in the ingredient list, once in a bottom call-out card). Every ingredient comparison guide links to 3 to 6 recipes using the winning ingredient plus the hero SKU product page. Every sourcing story links to the 2 to 4 SKUs sourced from that specific farm or cooperative.
Anchor text strategy across recipe hubs
Anchor text on internal links varies across recipe hubs to avoid over-optimization patterns Google penalizes. Exact-match anchor (“single-origin Ethiopian coffee”) runs on 20 to 30 percent of internal links. Partial-match variations (“our Ethiopian roast”) run on 30 to 40 percent. Branded anchors (the SKU name) run on 20 to 30 percent. Generic anchors (“shop the coffee”) fill the remaining 10 to 20 percent. This ratio holds ranking without triggering the over-optimization penalty that shows up on brands that anchor-text-stuff every internal link with the same exact-match keyword. Cross-reference the linking layer on our food and beverage web design page.
Link equity from ingredient guides to SKU pages
Link equity from ingredient guides passes to SKU pages when the guide’s comparison table names the hero SKU in the winning column with a product card, and when the guide’s body links to 3 to 6 recipes that use the winning ingredient. This 3-hop path (guide to recipe to SKU) pushes authority from a high-traffic informational query down to a high-intent transactional page. According to Search Engine Land SEO coverage, informational content that internally links to transactional pages produces 2 to 4 times higher organic revenue than isolated content silos.
Wrapping up content marketing for food brands
Content marketing for food brands is the organic engine that turns a DTC snack, drink, or CPG storefront into a search-driven revenue channel. Recipe hub of 40 to 100 recipes. Ingredient comparison guides at 12 to 24 pieces. Sourcing story pages at 6 to 12 pieces. Buyer intent content at 8 to 16 pieces. Creator syndication calendar with 12 to 30 creators per quarter. Refresh cadence at 12 to 24 months by pillar. Reporting with organic sessions and organic revenue attribution.
If your DTC food brand is running paid social at 20,000 dollars monthly with a broken blog and zero recipe schema, professional content marketing for food brands pays for itself inside the first 90 days on organic traffic captured. Redefine Web ships content marketing inside our monthly retainer packages. Book a call and we will walk through the last three DTC food brands we built recipe hubs for, pillar by pillar.
Content marketing for food brands starts with a recipe hub because recipe queries account for 40 to 60 percent of high-intent search volume in the food category. Every hero SKU needs 4 to 12 recipes anchored to it, each targeting a specific occasion and audience.
Skip the recipe hub and the brand loses the search real estate that pulls DTC storefront traffic month over month at zero incremental paid cost. Recipe traffic converts at 2 to 4 percent because the shopper landed with usage intent, not passive discovery, which is why food brands win on recipes.
Recipe schema and Google rich result eligibility
Every recipe page ships schema.org Recipe markup including cookTime, prepTime, recipeIngredient, recipeInstructions, nutrition, and aggregateRating. Correctly marked-up recipes qualify for Google’s recipe rich result carousel that pulls 3 to 6 times higher click-through rate than a plain blue link. The schema layer takes 15 minutes per recipe to author and 30 minutes to validate in Google Search Console. Cross-reference the recipe search stack on our food and beverage SEO page.
Recipe hub structure that scales
The recipe hub structure runs 40 to 100 recipes at maturity, organized by hero SKU (4 to 12 recipes per SKU) plus occasion tags (breakfast, weeknight dinner, meal prep, brunch, holiday). Every recipe links back to the hero SKU product page with the SKU embedded in an inline card. The hub earns internal linking value from ingredient comparison guides and the sourcing story pages, which feeds recipe ranking on Google. According to Google Search Central recipe structured data guidance, complete Recipe schema markup is required for eligibility in the recipe carousel and the ingredient search filter.
Pillar structure for food brand content marketing
The pillar structure on content marketing for food brands runs 4 content pillars concurrently: recipe hub (40 to 100 recipes), ingredient comparison guides (12 to 24 guides), sourcing story pages (6 to 12 pages), and buyer intent content (where to buy, subscription vs. one-time, gift bundle guides). Every pillar covers a distinct search intent and every pillar links back to the hero SKU product pages.
Ingredient comparison guide format
Ingredient comparison guides run 1,800 to 3,200 words comparing 2 to 4 ingredient types on 6 to 10 attributes with a comparison table, real-world use case examples, and links to the hero SKU that uses the specific ingredient. Example: organic vs. conventional oats compares nutritional profile, sourcing chain, cost, environmental impact, and taste on a 6-column table. The brand’s SKU appears in the winning column with a product card. These guides rank 3 to 8 months after publication and pull steady-state organic traffic.
Sourcing story pages that build trust
Sourcing story pages name the specific farms, cooperatives, or suppliers the brand sources from, with photos of the farms, farmer quotes, and specific harvest windows. A coffee brand’s Ethiopian farm page ranks for “single-origin Ethiopian coffee” and “Yirgacheffe coffee origin” plus 40 long-tail variations. The sourcing page pulls trust-building traffic that converts at 4 to 6 percent because the shopper landed pattern-matching on transparency and named provenance. Every sourcing page includes farmer or cooperative quotes, harvest dates, and a link back to 3 to 5 hero SKU pages that source from the named supplier.
Vejrø hospitality content case study
Vejrø Resort, a Danish private-island destination with an on-site restaurant focused on organic, locally sourced cuisine, joined us with strong social engagement and no organic-search real estate. Guests found the resort on Instagram but never in Google search for terms like “private island resort Denmark,” “farm-to-table hospitality Denmark,” or “Vejrø restaurant.” The same organic-search gap shows up on DTC food brands running paid social at 20,000 dollars monthly with a broken blog and zero recipe schema.
We built the conversion-focused website with on-site and off-site SEO tuned to the travel-niche keyword clusters, competitor analysis against comparable boutique resorts, and mobile-first design prioritizing guest discovery. Every page carried the structured data qualifying it for Google’s rich results in the hospitality category. Every internal link pushed authority toward the direct-booking conversion path.
Three months later, Vejrø hit 10,000 plus organic visitors, ranked for 200 plus first-page keywords, and pulled a 2.2 percent booking conversion rate from organic traffic. The same pattern applies to content marketing for food brands: recipe schema, ingredient comparison guides, and sourcing story pages pull organic traffic at 20 to 40 percent conversion into hero SKU pages inside 6 months when the content quality matches search intent and every page carries the right structured data markup. Vejrø also proved out the reporting discipline: every monthly report named the exact page, the exact keyword cluster, and the exact search feature (rich result, sitelinks, image pack) driving the incremental organic revenue instead of hiding behind aggregate traffic charts.
Recipe cadence and content calendar for food brands
Recipe cadence on a working food brand content calendar ships 2 to 4 new recipes per week during the first 6 months and drops to 1 per week at maturity. Each recipe takes 4 to 6 hours to produce (write, test in the kitchen, photograph, schema author, publish). At 3 recipes per week, the brand hits 78 recipes inside 6 months plus a backlog of ingredient comparison and sourcing content queued behind the recipe production line.
| Content pillar | Target volume year 1 | Production cost per piece | Refresh cadence |
|---|---|---|---|
| Recipe hub | 40 to 100 recipes | $180 to $320 | Every 12 months |
| Ingredient comparison guides | 12 to 24 guides | $450 to $780 | Every 18 months |
| Sourcing story pages | 6 to 12 pages | $680 to $1,200 | Every 24 months |
| Buyer intent content | 8 to 16 pieces | $220 to $420 | Every 12 months |
Photography as a content calendar constraint
Photography is the actual constraint on recipe cadence, not writing. Every recipe needs 6 to 12 photos: hero shot, ingredient flat lay, prep in progress, plated result, storage, and step shots for the schema markup. A working food brand batches photography 8 recipes at a time to keep the cost per recipe under 200 dollars. Skip the batching and the per-recipe cost climbs to 400 to 600 dollars, which caps recipe cadence at 1 per week and slows organic ranking timeline by 6 months.
Seasonal content calendar planning
Seasonal content calendar planning maps recipes and comparison guides to the seasonal windows they need to rank in. A Christmas cookie recipe needs to publish in September to rank by early December. A Valentine’s chocolate guide needs to publish in November to rank by early February. A back-to-school lunchbox recipe needs to publish in June to rank by late August. The 60-to-90-day ranking curve dictates the calendar.
Creator syndication inside food brand content
Creator syndication on food brand content marketing amplifies the recipe hub through Instagram Reels, TikTok, and YouTube Shorts creators paid to post their own version of the brand’s hero recipes. The creator content pulls net-new audiences into the recipe hub through the creator’s Link in Bio or Amazon Storefront tag. The syndication calendar names 12 to 30 creators per quarter with specific recipes assigned to each.
One brand we picked up had a spreadsheet titled “creator outreach 2023” with 47 rows and 3 responses. All 3 responses were auto-replies. The spreadsheet named zero recipes and offered flat rates below 100 dollars per post. Nobody posts a 30-second video for 87 dollars flat. Nobody.
Creator content commercial terms that work
Working creator content commercial terms run 350 to 1,500 dollars flat per post plus a 12 to 25 percent commission on tagged sales across a 30-day window. The commission mechanic pulls creators into follow-up posts because the incremental revenue continues past the initial fee. Mid-tier creators (30k to 150k followers) hit the sweet spot for food brand content because their engagement rate typically runs 4 to 8 percent versus 0.8 to 1.6 percent on mega-creators.
Content brief structure for creator partnerships
The content brief structure for creator partnerships runs a single page: the SKU, the specific recipe or usage occasion, 3 required brand mentions, 3 restricted claims (no health claims on non-medical SKUs), the pricing angle, the affiliate link, and 3 example videos that hit the tone. The brief avoids over-scripting because over-scripted creator content underperforms native creator voice by 40 to 60 percent on engagement rate.
Buyer intent content for food brand blogs
Buyer intent content on food brand blogs covers 8 to 16 pieces targeting explicit purchase-decision queries: “where to buy [brand],” “[brand] subscription vs. one-time,” “best [category] for [use case],” and “[brand] gift bundle.” Every buyer intent piece runs 1,400 to 2,400 words with a comparison table, product cards, and a clear conversion path to the specific SKU that matches the query intent. Buyer intent content converts at 3 to 6 percent versus 1 to 2 percent on recipe content because the shopper landed already planning to buy, not exploring a usage occasion.
Where-to-buy content structure
Where-to-buy content structure covers online (DTC storefront, Amazon, Target.com, Whole Foods online), retail (specific chain locators with the store finder embedded), and international (customs limitations, retailer partners abroad). Every piece names specific retailers, links to the store locator, and includes an FAQ block covering shipping availability, subscription options, and gift card compatibility. Where-to-buy content ranks for branded discovery queries the DTC storefront otherwise loses to competitor affiliate reviews.
Subscription versus one-time comparison content
Subscription versus one-time comparison content converts subscription commitments at 3 to 6 percent because it addresses the price-sensitivity concern head-on with a specific math table. The piece covers the discount structure (15 percent lifetime), the skip-a-month mechanic, the pause-anytime rule, the cancellation policy, and the specific yearly savings for the brand’s average consumption cadence. Cross-reference the retention structure on our food and beverage marketing retainer page.
Content refresh cadence on food brand pillars
Content refresh cadence on food brand content pillars runs a rolling audit every 12 to 24 months by pillar. Recipes get refreshed every 12 months with new photography, updated schema, and any nutrition or ingredient adjustments. Ingredient comparison guides refresh every 18 months to update market data. Sourcing story pages refresh every 24 months to reflect farm partnership changes and new harvest angles. Buyer intent content refreshes every 12 months to update retailer availability and pricing.
Recipe refresh priority order
Recipe refresh priority runs by organic traffic rank. The top 20 recipes by monthly organic sessions get refreshed first (new photography, schema audit, related recipe internal links, updated nutrition). The next 40 get refreshed at 15 months. The remaining recipes get refreshed opportunistically when the ranking slips past position 15 in Google. Skipping the refresh cadence lets recipe rankings drift out of the top 3 inside 18 months as newer competitor recipes take the position.
Schema audit checklist per refresh
The schema audit checklist per refresh runs 8 items: Recipe schema completeness, aggregateRating count and accuracy, nutrition data accuracy, prepTime and cookTime match the recipe body, image URLs valid at CDN, related recipe internal links working, product card SKU URL live, and Google Search Console rich result eligibility validated. This checklist takes 20 minutes per recipe and prevents the schema drift that costs recipe rankings 20 to 40 positions quietly.
Reporting cadence for food brand content marketing
Reporting cadence on food brand content marketing runs a monthly executive report plus a quarterly business review. The monthly report ships in the first business week and covers organic sessions by pillar, top 10 ranking recipes with position trend, ingredient guide ranking movements, sourcing page performance, and organic-attributed DTC revenue. Every number carries a comparison to the prior month and a plain-language interpretation the founder reads in 7 minutes.
Metrics that matter for content marketing
Metrics that matter for food brand content marketing: organic sessions by pillar, recipe rich result impressions in Search Console, organic conversion rate to hero SKU pages, organic-attributed DTC revenue, and top 20 ranking positions by monthly organic sessions. Vanity metrics that do not matter: total pageviews without conversion context, average time on page without conversion attribution, and social share counts. The monthly report skips the vanity block entirely.
Quarterly business review structure
The quarterly business review runs 90 minutes with the founder, head of content, and SEO lead. Agenda: organic traffic trend by pillar, top 10 winning content pieces, top 10 losing content pieces (candidates for refresh or removal), competitive gap analysis against 5 named competitor brands, and next quarter’s content calendar with recipes and ingredient guides queued. According to Ahrefs content marketing research, brands running quarterly content audits outperform brands running annual audits by 40 to 70 percent on organic revenue over a 24-month window.
Internal linking discipline across food brand content
Internal linking discipline across food brand content moves authority from recipe pages toward hero SKU product pages and comparison guides. Every recipe links to the hero SKU it uses inline (once in the ingredient list, once in a bottom call-out card). Every ingredient comparison guide links to 3 to 6 recipes using the winning ingredient plus the hero SKU product page. Every sourcing story links to the 2 to 4 SKUs sourced from that specific farm or cooperative.
Anchor text strategy across recipe hubs
Anchor text on internal links varies across recipe hubs to avoid over-optimization patterns Google penalizes. Exact-match anchor (“single-origin Ethiopian coffee”) runs on 20 to 30 percent of internal links. Partial-match variations (“our Ethiopian roast”) run on 30 to 40 percent. Branded anchors (the SKU name) run on 20 to 30 percent. Generic anchors (“shop the coffee”) fill the remaining 10 to 20 percent. This ratio holds ranking without triggering the over-optimization penalty that shows up on brands that anchor-text-stuff every internal link with the same exact-match keyword. Cross-reference the linking layer on our food and beverage web design page.
Link equity from ingredient guides to SKU pages
Link equity from ingredient guides passes to SKU pages when the guide’s comparison table names the hero SKU in the winning column with a product card, and when the guide’s body links to 3 to 6 recipes that use the winning ingredient. This 3-hop path (guide to recipe to SKU) pushes authority from a high-traffic informational query down to a high-intent transactional page. According to Search Engine Land SEO coverage, informational content that internally links to transactional pages produces 2 to 4 times higher organic revenue than isolated content silos.
Wrapping up content marketing for food brands
Content marketing for food brands is the organic engine that turns a DTC snack, drink, or CPG storefront into a search-driven revenue channel. Recipe hub of 40 to 100 recipes. Ingredient comparison guides at 12 to 24 pieces. Sourcing story pages at 6 to 12 pieces. Buyer intent content at 8 to 16 pieces. Creator syndication calendar with 12 to 30 creators per quarter. Refresh cadence at 12 to 24 months by pillar. Reporting with organic sessions and organic revenue attribution.
If your DTC food brand is running paid social at 20,000 dollars monthly with a broken blog and zero recipe schema, professional content marketing for food brands pays for itself inside the first 90 days on organic traffic captured. Redefine Web ships content marketing inside our monthly retainer packages. Book a call and we will walk through the last three DTC food brands we built recipe hubs for, pillar by pillar.
Internal linking discipline across food brand content moves authority from recipe pages toward hero SKU product pages and comparison guides. Every recipe links to the hero SKU it uses inline (once in the ingredient list, once in a bottom call-out card). Every ingredient comparison guide links to 3 to 6 recipes using the winning ingredient plus the hero SKU product page. Every sourcing story links to the 2 to 4 SKUs sourced from that specific farm or cooperative.
Anchor text strategy across recipe hubs
Anchor text on internal links varies across recipe hubs to avoid over-optimization patterns Google penalizes. Exact-match anchor (“single-origin Ethiopian coffee”) runs on 20 to 30 percent of internal links. Partial-match variations (“our Ethiopian roast”) run on 30 to 40 percent. Branded anchors (the SKU name) run on 20 to 30 percent. Generic anchors (“shop the coffee”) fill the remaining 10 to 20 percent. This ratio holds ranking without triggering the over-optimization penalty that shows up on brands that anchor-text-stuff every internal link with the same exact-match keyword. Cross-reference the linking layer on our food and beverage web design page.
Link equity from ingredient guides to SKU pages
Link equity from ingredient guides passes to SKU pages when the guide’s comparison table names the hero SKU in the winning column with a product card, and when the guide’s body links to 3 to 6 recipes that use the winning ingredient. This 3-hop path (guide to recipe to SKU) pushes authority from a high-traffic informational query down to a high-intent transactional page. According to Search Engine Land SEO coverage, informational content that internally links to transactional pages produces 2 to 4 times higher organic revenue than isolated content silos.
Wrapping up content marketing for food brands
Content marketing for food brands is the organic engine that turns a DTC snack, drink, or CPG storefront into a search-driven revenue channel. Recipe hub of 40 to 100 recipes. Ingredient comparison guides at 12 to 24 pieces. Sourcing story pages at 6 to 12 pieces. Buyer intent content at 8 to 16 pieces. Creator syndication calendar with 12 to 30 creators per quarter. Refresh cadence at 12 to 24 months by pillar. Reporting with organic sessions and organic revenue attribution.
If your DTC food brand is running paid social at 20,000 dollars monthly with a broken blog and zero recipe schema, professional content marketing for food brands pays for itself inside the first 90 days on organic traffic captured. Redefine Web ships content marketing inside our monthly retainer packages. Book a call and we will walk through the last three DTC food brands we built recipe hubs for, pillar by pillar.
Content marketing for food brands starts with a recipe hub because recipe queries account for 40 to 60 percent of high-intent search volume in the food category. Every hero SKU needs 4 to 12 recipes anchored to it, each targeting a specific occasion and audience.
Skip the recipe hub and the brand loses the search real estate that pulls DTC storefront traffic month over month at zero incremental paid cost. Recipe traffic converts at 2 to 4 percent because the shopper landed with usage intent, not passive discovery, which is why food brands win on recipes.
Recipe schema and Google rich result eligibility
Every recipe page ships schema.org Recipe markup including cookTime, prepTime, recipeIngredient, recipeInstructions, nutrition, and aggregateRating. Correctly marked-up recipes qualify for Google’s recipe rich result carousel that pulls 3 to 6 times higher click-through rate than a plain blue link. The schema layer takes 15 minutes per recipe to author and 30 minutes to validate in Google Search Console. Cross-reference the recipe search stack on our food and beverage SEO page.
Recipe hub structure that scales
The recipe hub structure runs 40 to 100 recipes at maturity, organized by hero SKU (4 to 12 recipes per SKU) plus occasion tags (breakfast, weeknight dinner, meal prep, brunch, holiday). Every recipe links back to the hero SKU product page with the SKU embedded in an inline card. The hub earns internal linking value from ingredient comparison guides and the sourcing story pages, which feeds recipe ranking on Google. According to Google Search Central recipe structured data guidance, complete Recipe schema markup is required for eligibility in the recipe carousel and the ingredient search filter.
Pillar structure for food brand content marketing
The pillar structure on content marketing for food brands runs 4 content pillars concurrently: recipe hub (40 to 100 recipes), ingredient comparison guides (12 to 24 guides), sourcing story pages (6 to 12 pages), and buyer intent content (where to buy, subscription vs. one-time, gift bundle guides). Every pillar covers a distinct search intent and every pillar links back to the hero SKU product pages.
Ingredient comparison guide format
Ingredient comparison guides run 1,800 to 3,200 words comparing 2 to 4 ingredient types on 6 to 10 attributes with a comparison table, real-world use case examples, and links to the hero SKU that uses the specific ingredient. Example: organic vs. conventional oats compares nutritional profile, sourcing chain, cost, environmental impact, and taste on a 6-column table. The brand’s SKU appears in the winning column with a product card. These guides rank 3 to 8 months after publication and pull steady-state organic traffic.
Sourcing story pages that build trust
Sourcing story pages name the specific farms, cooperatives, or suppliers the brand sources from, with photos of the farms, farmer quotes, and specific harvest windows. A coffee brand’s Ethiopian farm page ranks for “single-origin Ethiopian coffee” and “Yirgacheffe coffee origin” plus 40 long-tail variations. The sourcing page pulls trust-building traffic that converts at 4 to 6 percent because the shopper landed pattern-matching on transparency and named provenance. Every sourcing page includes farmer or cooperative quotes, harvest dates, and a link back to 3 to 5 hero SKU pages that source from the named supplier.
Vejrø hospitality content case study
Vejrø Resort, a Danish private-island destination with an on-site restaurant focused on organic, locally sourced cuisine, joined us with strong social engagement and no organic-search real estate. Guests found the resort on Instagram but never in Google search for terms like “private island resort Denmark,” “farm-to-table hospitality Denmark,” or “Vejrø restaurant.” The same organic-search gap shows up on DTC food brands running paid social at 20,000 dollars monthly with a broken blog and zero recipe schema.
We built the conversion-focused website with on-site and off-site SEO tuned to the travel-niche keyword clusters, competitor analysis against comparable boutique resorts, and mobile-first design prioritizing guest discovery. Every page carried the structured data qualifying it for Google’s rich results in the hospitality category. Every internal link pushed authority toward the direct-booking conversion path.
Three months later, Vejrø hit 10,000 plus organic visitors, ranked for 200 plus first-page keywords, and pulled a 2.2 percent booking conversion rate from organic traffic. The same pattern applies to content marketing for food brands: recipe schema, ingredient comparison guides, and sourcing story pages pull organic traffic at 20 to 40 percent conversion into hero SKU pages inside 6 months when the content quality matches search intent and every page carries the right structured data markup. Vejrø also proved out the reporting discipline: every monthly report named the exact page, the exact keyword cluster, and the exact search feature (rich result, sitelinks, image pack) driving the incremental organic revenue instead of hiding behind aggregate traffic charts.
Recipe cadence and content calendar for food brands
Recipe cadence on a working food brand content calendar ships 2 to 4 new recipes per week during the first 6 months and drops to 1 per week at maturity. Each recipe takes 4 to 6 hours to produce (write, test in the kitchen, photograph, schema author, publish). At 3 recipes per week, the brand hits 78 recipes inside 6 months plus a backlog of ingredient comparison and sourcing content queued behind the recipe production line.
| Content pillar | Target volume year 1 | Production cost per piece | Refresh cadence |
|---|---|---|---|
| Recipe hub | 40 to 100 recipes | $180 to $320 | Every 12 months |
| Ingredient comparison guides | 12 to 24 guides | $450 to $780 | Every 18 months |
| Sourcing story pages | 6 to 12 pages | $680 to $1,200 | Every 24 months |
| Buyer intent content | 8 to 16 pieces | $220 to $420 | Every 12 months |
Photography as a content calendar constraint
Photography is the actual constraint on recipe cadence, not writing. Every recipe needs 6 to 12 photos: hero shot, ingredient flat lay, prep in progress, plated result, storage, and step shots for the schema markup. A working food brand batches photography 8 recipes at a time to keep the cost per recipe under 200 dollars. Skip the batching and the per-recipe cost climbs to 400 to 600 dollars, which caps recipe cadence at 1 per week and slows organic ranking timeline by 6 months.
Seasonal content calendar planning
Seasonal content calendar planning maps recipes and comparison guides to the seasonal windows they need to rank in. A Christmas cookie recipe needs to publish in September to rank by early December. A Valentine’s chocolate guide needs to publish in November to rank by early February. A back-to-school lunchbox recipe needs to publish in June to rank by late August. The 60-to-90-day ranking curve dictates the calendar.
Creator syndication inside food brand content
Creator syndication on food brand content marketing amplifies the recipe hub through Instagram Reels, TikTok, and YouTube Shorts creators paid to post their own version of the brand’s hero recipes. The creator content pulls net-new audiences into the recipe hub through the creator’s Link in Bio or Amazon Storefront tag. The syndication calendar names 12 to 30 creators per quarter with specific recipes assigned to each.
One brand we picked up had a spreadsheet titled “creator outreach 2023” with 47 rows and 3 responses. All 3 responses were auto-replies. The spreadsheet named zero recipes and offered flat rates below 100 dollars per post. Nobody posts a 30-second video for 87 dollars flat. Nobody.
Creator content commercial terms that work
Working creator content commercial terms run 350 to 1,500 dollars flat per post plus a 12 to 25 percent commission on tagged sales across a 30-day window. The commission mechanic pulls creators into follow-up posts because the incremental revenue continues past the initial fee. Mid-tier creators (30k to 150k followers) hit the sweet spot for food brand content because their engagement rate typically runs 4 to 8 percent versus 0.8 to 1.6 percent on mega-creators.
Content brief structure for creator partnerships
The content brief structure for creator partnerships runs a single page: the SKU, the specific recipe or usage occasion, 3 required brand mentions, 3 restricted claims (no health claims on non-medical SKUs), the pricing angle, the affiliate link, and 3 example videos that hit the tone. The brief avoids over-scripting because over-scripted creator content underperforms native creator voice by 40 to 60 percent on engagement rate.
Buyer intent content for food brand blogs
Buyer intent content on food brand blogs covers 8 to 16 pieces targeting explicit purchase-decision queries: “where to buy [brand],” “[brand] subscription vs. one-time,” “best [category] for [use case],” and “[brand] gift bundle.” Every buyer intent piece runs 1,400 to 2,400 words with a comparison table, product cards, and a clear conversion path to the specific SKU that matches the query intent. Buyer intent content converts at 3 to 6 percent versus 1 to 2 percent on recipe content because the shopper landed already planning to buy, not exploring a usage occasion.
Where-to-buy content structure
Where-to-buy content structure covers online (DTC storefront, Amazon, Target.com, Whole Foods online), retail (specific chain locators with the store finder embedded), and international (customs limitations, retailer partners abroad). Every piece names specific retailers, links to the store locator, and includes an FAQ block covering shipping availability, subscription options, and gift card compatibility. Where-to-buy content ranks for branded discovery queries the DTC storefront otherwise loses to competitor affiliate reviews.
Subscription versus one-time comparison content
Subscription versus one-time comparison content converts subscription commitments at 3 to 6 percent because it addresses the price-sensitivity concern head-on with a specific math table. The piece covers the discount structure (15 percent lifetime), the skip-a-month mechanic, the pause-anytime rule, the cancellation policy, and the specific yearly savings for the brand’s average consumption cadence. Cross-reference the retention structure on our food and beverage marketing retainer page.
Content refresh cadence on food brand pillars
Content refresh cadence on food brand content pillars runs a rolling audit every 12 to 24 months by pillar. Recipes get refreshed every 12 months with new photography, updated schema, and any nutrition or ingredient adjustments. Ingredient comparison guides refresh every 18 months to update market data. Sourcing story pages refresh every 24 months to reflect farm partnership changes and new harvest angles. Buyer intent content refreshes every 12 months to update retailer availability and pricing.
Recipe refresh priority order
Recipe refresh priority runs by organic traffic rank. The top 20 recipes by monthly organic sessions get refreshed first (new photography, schema audit, related recipe internal links, updated nutrition). The next 40 get refreshed at 15 months. The remaining recipes get refreshed opportunistically when the ranking slips past position 15 in Google. Skipping the refresh cadence lets recipe rankings drift out of the top 3 inside 18 months as newer competitor recipes take the position.
Schema audit checklist per refresh
The schema audit checklist per refresh runs 8 items: Recipe schema completeness, aggregateRating count and accuracy, nutrition data accuracy, prepTime and cookTime match the recipe body, image URLs valid at CDN, related recipe internal links working, product card SKU URL live, and Google Search Console rich result eligibility validated. This checklist takes 20 minutes per recipe and prevents the schema drift that costs recipe rankings 20 to 40 positions quietly.
Reporting cadence for food brand content marketing
Reporting cadence on food brand content marketing runs a monthly executive report plus a quarterly business review. The monthly report ships in the first business week and covers organic sessions by pillar, top 10 ranking recipes with position trend, ingredient guide ranking movements, sourcing page performance, and organic-attributed DTC revenue. Every number carries a comparison to the prior month and a plain-language interpretation the founder reads in 7 minutes.
Metrics that matter for content marketing
Metrics that matter for food brand content marketing: organic sessions by pillar, recipe rich result impressions in Search Console, organic conversion rate to hero SKU pages, organic-attributed DTC revenue, and top 20 ranking positions by monthly organic sessions. Vanity metrics that do not matter: total pageviews without conversion context, average time on page without conversion attribution, and social share counts. The monthly report skips the vanity block entirely.
Quarterly business review structure
The quarterly business review runs 90 minutes with the founder, head of content, and SEO lead. Agenda: organic traffic trend by pillar, top 10 winning content pieces, top 10 losing content pieces (candidates for refresh or removal), competitive gap analysis against 5 named competitor brands, and next quarter’s content calendar with recipes and ingredient guides queued. According to Ahrefs content marketing research, brands running quarterly content audits outperform brands running annual audits by 40 to 70 percent on organic revenue over a 24-month window.
Internal linking discipline across food brand content
Internal linking discipline across food brand content moves authority from recipe pages toward hero SKU product pages and comparison guides. Every recipe links to the hero SKU it uses inline (once in the ingredient list, once in a bottom call-out card). Every ingredient comparison guide links to 3 to 6 recipes using the winning ingredient plus the hero SKU product page. Every sourcing story links to the 2 to 4 SKUs sourced from that specific farm or cooperative.
Anchor text strategy across recipe hubs
Anchor text on internal links varies across recipe hubs to avoid over-optimization patterns Google penalizes. Exact-match anchor (“single-origin Ethiopian coffee”) runs on 20 to 30 percent of internal links. Partial-match variations (“our Ethiopian roast”) run on 30 to 40 percent. Branded anchors (the SKU name) run on 20 to 30 percent. Generic anchors (“shop the coffee”) fill the remaining 10 to 20 percent. This ratio holds ranking without triggering the over-optimization penalty that shows up on brands that anchor-text-stuff every internal link with the same exact-match keyword. Cross-reference the linking layer on our food and beverage web design page.
Link equity from ingredient guides to SKU pages
Link equity from ingredient guides passes to SKU pages when the guide’s comparison table names the hero SKU in the winning column with a product card, and when the guide’s body links to 3 to 6 recipes that use the winning ingredient. This 3-hop path (guide to recipe to SKU) pushes authority from a high-traffic informational query down to a high-intent transactional page. According to Search Engine Land SEO coverage, informational content that internally links to transactional pages produces 2 to 4 times higher organic revenue than isolated content silos.
Wrapping up content marketing for food brands
Content marketing for food brands is the organic engine that turns a DTC snack, drink, or CPG storefront into a search-driven revenue channel. Recipe hub of 40 to 100 recipes. Ingredient comparison guides at 12 to 24 pieces. Sourcing story pages at 6 to 12 pieces. Buyer intent content at 8 to 16 pieces. Creator syndication calendar with 12 to 30 creators per quarter. Refresh cadence at 12 to 24 months by pillar. Reporting with organic sessions and organic revenue attribution.
If your DTC food brand is running paid social at 20,000 dollars monthly with a broken blog and zero recipe schema, professional content marketing for food brands pays for itself inside the first 90 days on organic traffic captured. Redefine Web ships content marketing inside our monthly retainer packages. Book a call and we will walk through the last three DTC food brands we built recipe hubs for, pillar by pillar.
Content marketing for food brands starts with a recipe hub because recipe queries account for 40 to 60 percent of high-intent search volume in the food category. Every hero SKU needs 4 to 12 recipes anchored to it, each targeting a specific occasion and audience.
Skip the recipe hub and the brand loses the search real estate that pulls DTC storefront traffic month over month at zero incremental paid cost. Recipe traffic converts at 2 to 4 percent because the shopper landed with usage intent, not passive discovery, which is why food brands win on recipes.
Recipe schema and Google rich result eligibility
Every recipe page ships schema.org Recipe markup including cookTime, prepTime, recipeIngredient, recipeInstructions, nutrition, and aggregateRating. Correctly marked-up recipes qualify for Google’s recipe rich result carousel that pulls 3 to 6 times higher click-through rate than a plain blue link. The schema layer takes 15 minutes per recipe to author and 30 minutes to validate in Google Search Console. Cross-reference the recipe search stack on our food and beverage SEO page.
Recipe hub structure that scales
The recipe hub structure runs 40 to 100 recipes at maturity, organized by hero SKU (4 to 12 recipes per SKU) plus occasion tags (breakfast, weeknight dinner, meal prep, brunch, holiday). Every recipe links back to the hero SKU product page with the SKU embedded in an inline card. The hub earns internal linking value from ingredient comparison guides and the sourcing story pages, which feeds recipe ranking on Google. According to Google Search Central recipe structured data guidance, complete Recipe schema markup is required for eligibility in the recipe carousel and the ingredient search filter.
Pillar structure for food brand content marketing
The pillar structure on content marketing for food brands runs 4 content pillars concurrently: recipe hub (40 to 100 recipes), ingredient comparison guides (12 to 24 guides), sourcing story pages (6 to 12 pages), and buyer intent content (where to buy, subscription vs. one-time, gift bundle guides). Every pillar covers a distinct search intent and every pillar links back to the hero SKU product pages.
Ingredient comparison guide format
Ingredient comparison guides run 1,800 to 3,200 words comparing 2 to 4 ingredient types on 6 to 10 attributes with a comparison table, real-world use case examples, and links to the hero SKU that uses the specific ingredient. Example: organic vs. conventional oats compares nutritional profile, sourcing chain, cost, environmental impact, and taste on a 6-column table. The brand’s SKU appears in the winning column with a product card. These guides rank 3 to 8 months after publication and pull steady-state organic traffic.
Sourcing story pages that build trust
Sourcing story pages name the specific farms, cooperatives, or suppliers the brand sources from, with photos of the farms, farmer quotes, and specific harvest windows. A coffee brand’s Ethiopian farm page ranks for “single-origin Ethiopian coffee” and “Yirgacheffe coffee origin” plus 40 long-tail variations. The sourcing page pulls trust-building traffic that converts at 4 to 6 percent because the shopper landed pattern-matching on transparency and named provenance. Every sourcing page includes farmer or cooperative quotes, harvest dates, and a link back to 3 to 5 hero SKU pages that source from the named supplier.
Vejrø hospitality content case study
Vejrø Resort, a Danish private-island destination with an on-site restaurant focused on organic, locally sourced cuisine, joined us with strong social engagement and no organic-search real estate. Guests found the resort on Instagram but never in Google search for terms like “private island resort Denmark,” “farm-to-table hospitality Denmark,” or “Vejrø restaurant.” The same organic-search gap shows up on DTC food brands running paid social at 20,000 dollars monthly with a broken blog and zero recipe schema.
We built the conversion-focused website with on-site and off-site SEO tuned to the travel-niche keyword clusters, competitor analysis against comparable boutique resorts, and mobile-first design prioritizing guest discovery. Every page carried the structured data qualifying it for Google’s rich results in the hospitality category. Every internal link pushed authority toward the direct-booking conversion path.
Three months later, Vejrø hit 10,000 plus organic visitors, ranked for 200 plus first-page keywords, and pulled a 2.2 percent booking conversion rate from organic traffic. The same pattern applies to content marketing for food brands: recipe schema, ingredient comparison guides, and sourcing story pages pull organic traffic at 20 to 40 percent conversion into hero SKU pages inside 6 months when the content quality matches search intent and every page carries the right structured data markup. Vejrø also proved out the reporting discipline: every monthly report named the exact page, the exact keyword cluster, and the exact search feature (rich result, sitelinks, image pack) driving the incremental organic revenue instead of hiding behind aggregate traffic charts.
Recipe cadence and content calendar for food brands
Recipe cadence on a working food brand content calendar ships 2 to 4 new recipes per week during the first 6 months and drops to 1 per week at maturity. Each recipe takes 4 to 6 hours to produce (write, test in the kitchen, photograph, schema author, publish). At 3 recipes per week, the brand hits 78 recipes inside 6 months plus a backlog of ingredient comparison and sourcing content queued behind the recipe production line.
| Content pillar | Target volume year 1 | Production cost per piece | Refresh cadence |
|---|---|---|---|
| Recipe hub | 40 to 100 recipes | $180 to $320 | Every 12 months |
| Ingredient comparison guides | 12 to 24 guides | $450 to $780 | Every 18 months |
| Sourcing story pages | 6 to 12 pages | $680 to $1,200 | Every 24 months |
| Buyer intent content | 8 to 16 pieces | $220 to $420 | Every 12 months |
Photography as a content calendar constraint
Photography is the actual constraint on recipe cadence, not writing. Every recipe needs 6 to 12 photos: hero shot, ingredient flat lay, prep in progress, plated result, storage, and step shots for the schema markup. A working food brand batches photography 8 recipes at a time to keep the cost per recipe under 200 dollars. Skip the batching and the per-recipe cost climbs to 400 to 600 dollars, which caps recipe cadence at 1 per week and slows organic ranking timeline by 6 months.
Seasonal content calendar planning
Seasonal content calendar planning maps recipes and comparison guides to the seasonal windows they need to rank in. A Christmas cookie recipe needs to publish in September to rank by early December. A Valentine’s chocolate guide needs to publish in November to rank by early February. A back-to-school lunchbox recipe needs to publish in June to rank by late August. The 60-to-90-day ranking curve dictates the calendar.
Creator syndication inside food brand content
Creator syndication on food brand content marketing amplifies the recipe hub through Instagram Reels, TikTok, and YouTube Shorts creators paid to post their own version of the brand’s hero recipes. The creator content pulls net-new audiences into the recipe hub through the creator’s Link in Bio or Amazon Storefront tag. The syndication calendar names 12 to 30 creators per quarter with specific recipes assigned to each.
One brand we picked up had a spreadsheet titled “creator outreach 2023” with 47 rows and 3 responses. All 3 responses were auto-replies. The spreadsheet named zero recipes and offered flat rates below 100 dollars per post. Nobody posts a 30-second video for 87 dollars flat. Nobody.
Creator content commercial terms that work
Working creator content commercial terms run 350 to 1,500 dollars flat per post plus a 12 to 25 percent commission on tagged sales across a 30-day window. The commission mechanic pulls creators into follow-up posts because the incremental revenue continues past the initial fee. Mid-tier creators (30k to 150k followers) hit the sweet spot for food brand content because their engagement rate typically runs 4 to 8 percent versus 0.8 to 1.6 percent on mega-creators.
Content brief structure for creator partnerships
The content brief structure for creator partnerships runs a single page: the SKU, the specific recipe or usage occasion, 3 required brand mentions, 3 restricted claims (no health claims on non-medical SKUs), the pricing angle, the affiliate link, and 3 example videos that hit the tone. The brief avoids over-scripting because over-scripted creator content underperforms native creator voice by 40 to 60 percent on engagement rate.
Buyer intent content for food brand blogs
Buyer intent content on food brand blogs covers 8 to 16 pieces targeting explicit purchase-decision queries: “where to buy [brand],” “[brand] subscription vs. one-time,” “best [category] for [use case],” and “[brand] gift bundle.” Every buyer intent piece runs 1,400 to 2,400 words with a comparison table, product cards, and a clear conversion path to the specific SKU that matches the query intent. Buyer intent content converts at 3 to 6 percent versus 1 to 2 percent on recipe content because the shopper landed already planning to buy, not exploring a usage occasion.
Where-to-buy content structure
Where-to-buy content structure covers online (DTC storefront, Amazon, Target.com, Whole Foods online), retail (specific chain locators with the store finder embedded), and international (customs limitations, retailer partners abroad). Every piece names specific retailers, links to the store locator, and includes an FAQ block covering shipping availability, subscription options, and gift card compatibility. Where-to-buy content ranks for branded discovery queries the DTC storefront otherwise loses to competitor affiliate reviews.
Subscription versus one-time comparison content
Subscription versus one-time comparison content converts subscription commitments at 3 to 6 percent because it addresses the price-sensitivity concern head-on with a specific math table. The piece covers the discount structure (15 percent lifetime), the skip-a-month mechanic, the pause-anytime rule, the cancellation policy, and the specific yearly savings for the brand’s average consumption cadence. Cross-reference the retention structure on our food and beverage marketing retainer page.
Content refresh cadence on food brand pillars
Content refresh cadence on food brand content pillars runs a rolling audit every 12 to 24 months by pillar. Recipes get refreshed every 12 months with new photography, updated schema, and any nutrition or ingredient adjustments. Ingredient comparison guides refresh every 18 months to update market data. Sourcing story pages refresh every 24 months to reflect farm partnership changes and new harvest angles. Buyer intent content refreshes every 12 months to update retailer availability and pricing.
Recipe refresh priority order
Recipe refresh priority runs by organic traffic rank. The top 20 recipes by monthly organic sessions get refreshed first (new photography, schema audit, related recipe internal links, updated nutrition). The next 40 get refreshed at 15 months. The remaining recipes get refreshed opportunistically when the ranking slips past position 15 in Google. Skipping the refresh cadence lets recipe rankings drift out of the top 3 inside 18 months as newer competitor recipes take the position.
Schema audit checklist per refresh
The schema audit checklist per refresh runs 8 items: Recipe schema completeness, aggregateRating count and accuracy, nutrition data accuracy, prepTime and cookTime match the recipe body, image URLs valid at CDN, related recipe internal links working, product card SKU URL live, and Google Search Console rich result eligibility validated. This checklist takes 20 minutes per recipe and prevents the schema drift that costs recipe rankings 20 to 40 positions quietly.
Reporting cadence for food brand content marketing
Reporting cadence on food brand content marketing runs a monthly executive report plus a quarterly business review. The monthly report ships in the first business week and covers organic sessions by pillar, top 10 ranking recipes with position trend, ingredient guide ranking movements, sourcing page performance, and organic-attributed DTC revenue. Every number carries a comparison to the prior month and a plain-language interpretation the founder reads in 7 minutes.
Metrics that matter for content marketing
Metrics that matter for food brand content marketing: organic sessions by pillar, recipe rich result impressions in Search Console, organic conversion rate to hero SKU pages, organic-attributed DTC revenue, and top 20 ranking positions by monthly organic sessions. Vanity metrics that do not matter: total pageviews without conversion context, average time on page without conversion attribution, and social share counts. The monthly report skips the vanity block entirely.
Quarterly business review structure
The quarterly business review runs 90 minutes with the founder, head of content, and SEO lead. Agenda: organic traffic trend by pillar, top 10 winning content pieces, top 10 losing content pieces (candidates for refresh or removal), competitive gap analysis against 5 named competitor brands, and next quarter’s content calendar with recipes and ingredient guides queued. According to Ahrefs content marketing research, brands running quarterly content audits outperform brands running annual audits by 40 to 70 percent on organic revenue over a 24-month window.
Internal linking discipline across food brand content
Internal linking discipline across food brand content moves authority from recipe pages toward hero SKU product pages and comparison guides. Every recipe links to the hero SKU it uses inline (once in the ingredient list, once in a bottom call-out card). Every ingredient comparison guide links to 3 to 6 recipes using the winning ingredient plus the hero SKU product page. Every sourcing story links to the 2 to 4 SKUs sourced from that specific farm or cooperative.
Anchor text strategy across recipe hubs
Anchor text on internal links varies across recipe hubs to avoid over-optimization patterns Google penalizes. Exact-match anchor (“single-origin Ethiopian coffee”) runs on 20 to 30 percent of internal links. Partial-match variations (“our Ethiopian roast”) run on 30 to 40 percent. Branded anchors (the SKU name) run on 20 to 30 percent. Generic anchors (“shop the coffee”) fill the remaining 10 to 20 percent. This ratio holds ranking without triggering the over-optimization penalty that shows up on brands that anchor-text-stuff every internal link with the same exact-match keyword. Cross-reference the linking layer on our food and beverage web design page.
Link equity from ingredient guides to SKU pages
Link equity from ingredient guides passes to SKU pages when the guide’s comparison table names the hero SKU in the winning column with a product card, and when the guide’s body links to 3 to 6 recipes that use the winning ingredient. This 3-hop path (guide to recipe to SKU) pushes authority from a high-traffic informational query down to a high-intent transactional page. According to Search Engine Land SEO coverage, informational content that internally links to transactional pages produces 2 to 4 times higher organic revenue than isolated content silos.
Wrapping up content marketing for food brands
Content marketing for food brands is the organic engine that turns a DTC snack, drink, or CPG storefront into a search-driven revenue channel. Recipe hub of 40 to 100 recipes. Ingredient comparison guides at 12 to 24 pieces. Sourcing story pages at 6 to 12 pieces. Buyer intent content at 8 to 16 pieces. Creator syndication calendar with 12 to 30 creators per quarter. Refresh cadence at 12 to 24 months by pillar. Reporting with organic sessions and organic revenue attribution.
If your DTC food brand is running paid social at 20,000 dollars monthly with a broken blog and zero recipe schema, professional content marketing for food brands pays for itself inside the first 90 days on organic traffic captured. Redefine Web ships content marketing inside our monthly retainer packages. Book a call and we will walk through the last three DTC food brands we built recipe hubs for, pillar by pillar.
Anchor text on internal links varies across recipe hubs to avoid over-optimization patterns Google penalizes. Exact-match anchor (“single-origin Ethiopian coffee”) runs on 20 to 30 percent of internal links. Partial-match variations (“our Ethiopian roast”) run on 30 to 40 percent. Branded anchors (the SKU name) run on 20 to 30 percent. Generic anchors (“shop the coffee”) fill the remaining 10 to 20 percent. This ratio holds ranking without triggering the over-optimization penalty that shows up on brands that anchor-text-stuff every internal link with the same exact-match keyword. Cross-reference the linking layer on our food and beverage web design page.
Link equity from ingredient guides to SKU pages
Link equity from ingredient guides passes to SKU pages when the guide’s comparison table names the hero SKU in the winning column with a product card, and when the guide’s body links to 3 to 6 recipes that use the winning ingredient. This 3-hop path (guide to recipe to SKU) pushes authority from a high-traffic informational query down to a high-intent transactional page. According to Search Engine Land SEO coverage, informational content that internally links to transactional pages produces 2 to 4 times higher organic revenue than isolated content silos.
Wrapping up content marketing for food brands
Content marketing for food brands is the organic engine that turns a DTC snack, drink, or CPG storefront into a search-driven revenue channel. Recipe hub of 40 to 100 recipes. Ingredient comparison guides at 12 to 24 pieces. Sourcing story pages at 6 to 12 pieces. Buyer intent content at 8 to 16 pieces. Creator syndication calendar with 12 to 30 creators per quarter. Refresh cadence at 12 to 24 months by pillar. Reporting with organic sessions and organic revenue attribution.
If your DTC food brand is running paid social at 20,000 dollars monthly with a broken blog and zero recipe schema, professional content marketing for food brands pays for itself inside the first 90 days on organic traffic captured. Redefine Web ships content marketing inside our monthly retainer packages. Book a call and we will walk through the last three DTC food brands we built recipe hubs for, pillar by pillar.
Internal linking discipline across food brand content moves authority from recipe pages toward hero SKU product pages and comparison guides. Every recipe links to the hero SKU it uses inline (once in the ingredient list, once in a bottom call-out card). Every ingredient comparison guide links to 3 to 6 recipes using the winning ingredient plus the hero SKU product page. Every sourcing story links to the 2 to 4 SKUs sourced from that specific farm or cooperative.
Anchor text strategy across recipe hubs
Anchor text on internal links varies across recipe hubs to avoid over-optimization patterns Google penalizes. Exact-match anchor (“single-origin Ethiopian coffee”) runs on 20 to 30 percent of internal links. Partial-match variations (“our Ethiopian roast”) run on 30 to 40 percent. Branded anchors (the SKU name) run on 20 to 30 percent. Generic anchors (“shop the coffee”) fill the remaining 10 to 20 percent. This ratio holds ranking without triggering the over-optimization penalty that shows up on brands that anchor-text-stuff every internal link with the same exact-match keyword. Cross-reference the linking layer on our food and beverage web design page.
Link equity from ingredient guides to SKU pages
Link equity from ingredient guides passes to SKU pages when the guide’s comparison table names the hero SKU in the winning column with a product card, and when the guide’s body links to 3 to 6 recipes that use the winning ingredient. This 3-hop path (guide to recipe to SKU) pushes authority from a high-traffic informational query down to a high-intent transactional page. According to Search Engine Land SEO coverage, informational content that internally links to transactional pages produces 2 to 4 times higher organic revenue than isolated content silos.
Wrapping up content marketing for food brands
Content marketing for food brands is the organic engine that turns a DTC snack, drink, or CPG storefront into a search-driven revenue channel. Recipe hub of 40 to 100 recipes. Ingredient comparison guides at 12 to 24 pieces. Sourcing story pages at 6 to 12 pieces. Buyer intent content at 8 to 16 pieces. Creator syndication calendar with 12 to 30 creators per quarter. Refresh cadence at 12 to 24 months by pillar. Reporting with organic sessions and organic revenue attribution.
If your DTC food brand is running paid social at 20,000 dollars monthly with a broken blog and zero recipe schema, professional content marketing for food brands pays for itself inside the first 90 days on organic traffic captured. Redefine Web ships content marketing inside our monthly retainer packages. Book a call and we will walk through the last three DTC food brands we built recipe hubs for, pillar by pillar.
Content marketing for food brands starts with a recipe hub because recipe queries account for 40 to 60 percent of high-intent search volume in the food category. Every hero SKU needs 4 to 12 recipes anchored to it, each targeting a specific occasion and audience.
Skip the recipe hub and the brand loses the search real estate that pulls DTC storefront traffic month over month at zero incremental paid cost. Recipe traffic converts at 2 to 4 percent because the shopper landed with usage intent, not passive discovery, which is why food brands win on recipes.
Recipe schema and Google rich result eligibility
Every recipe page ships schema.org Recipe markup including cookTime, prepTime, recipeIngredient, recipeInstructions, nutrition, and aggregateRating. Correctly marked-up recipes qualify for Google’s recipe rich result carousel that pulls 3 to 6 times higher click-through rate than a plain blue link. The schema layer takes 15 minutes per recipe to author and 30 minutes to validate in Google Search Console. Cross-reference the recipe search stack on our food and beverage SEO page.
Recipe hub structure that scales
The recipe hub structure runs 40 to 100 recipes at maturity, organized by hero SKU (4 to 12 recipes per SKU) plus occasion tags (breakfast, weeknight dinner, meal prep, brunch, holiday). Every recipe links back to the hero SKU product page with the SKU embedded in an inline card. The hub earns internal linking value from ingredient comparison guides and the sourcing story pages, which feeds recipe ranking on Google. According to Google Search Central recipe structured data guidance, complete Recipe schema markup is required for eligibility in the recipe carousel and the ingredient search filter.
Pillar structure for food brand content marketing
The pillar structure on content marketing for food brands runs 4 content pillars concurrently: recipe hub (40 to 100 recipes), ingredient comparison guides (12 to 24 guides), sourcing story pages (6 to 12 pages), and buyer intent content (where to buy, subscription vs. one-time, gift bundle guides). Every pillar covers a distinct search intent and every pillar links back to the hero SKU product pages.
Ingredient comparison guide format
Ingredient comparison guides run 1,800 to 3,200 words comparing 2 to 4 ingredient types on 6 to 10 attributes with a comparison table, real-world use case examples, and links to the hero SKU that uses the specific ingredient. Example: organic vs. conventional oats compares nutritional profile, sourcing chain, cost, environmental impact, and taste on a 6-column table. The brand’s SKU appears in the winning column with a product card. These guides rank 3 to 8 months after publication and pull steady-state organic traffic.
Sourcing story pages that build trust
Sourcing story pages name the specific farms, cooperatives, or suppliers the brand sources from, with photos of the farms, farmer quotes, and specific harvest windows. A coffee brand’s Ethiopian farm page ranks for “single-origin Ethiopian coffee” and “Yirgacheffe coffee origin” plus 40 long-tail variations. The sourcing page pulls trust-building traffic that converts at 4 to 6 percent because the shopper landed pattern-matching on transparency and named provenance. Every sourcing page includes farmer or cooperative quotes, harvest dates, and a link back to 3 to 5 hero SKU pages that source from the named supplier.
Vejrø hospitality content case study
Vejrø Resort, a Danish private-island destination with an on-site restaurant focused on organic, locally sourced cuisine, joined us with strong social engagement and no organic-search real estate. Guests found the resort on Instagram but never in Google search for terms like “private island resort Denmark,” “farm-to-table hospitality Denmark,” or “Vejrø restaurant.” The same organic-search gap shows up on DTC food brands running paid social at 20,000 dollars monthly with a broken blog and zero recipe schema.
We built the conversion-focused website with on-site and off-site SEO tuned to the travel-niche keyword clusters, competitor analysis against comparable boutique resorts, and mobile-first design prioritizing guest discovery. Every page carried the structured data qualifying it for Google’s rich results in the hospitality category. Every internal link pushed authority toward the direct-booking conversion path.
Three months later, Vejrø hit 10,000 plus organic visitors, ranked for 200 plus first-page keywords, and pulled a 2.2 percent booking conversion rate from organic traffic. The same pattern applies to content marketing for food brands: recipe schema, ingredient comparison guides, and sourcing story pages pull organic traffic at 20 to 40 percent conversion into hero SKU pages inside 6 months when the content quality matches search intent and every page carries the right structured data markup. Vejrø also proved out the reporting discipline: every monthly report named the exact page, the exact keyword cluster, and the exact search feature (rich result, sitelinks, image pack) driving the incremental organic revenue instead of hiding behind aggregate traffic charts.
Recipe cadence and content calendar for food brands
Recipe cadence on a working food brand content calendar ships 2 to 4 new recipes per week during the first 6 months and drops to 1 per week at maturity. Each recipe takes 4 to 6 hours to produce (write, test in the kitchen, photograph, schema author, publish). At 3 recipes per week, the brand hits 78 recipes inside 6 months plus a backlog of ingredient comparison and sourcing content queued behind the recipe production line.
| Content pillar | Target volume year 1 | Production cost per piece | Refresh cadence |
|---|---|---|---|
| Recipe hub | 40 to 100 recipes | $180 to $320 | Every 12 months |
| Ingredient comparison guides | 12 to 24 guides | $450 to $780 | Every 18 months |
| Sourcing story pages | 6 to 12 pages | $680 to $1,200 | Every 24 months |
| Buyer intent content | 8 to 16 pieces | $220 to $420 | Every 12 months |
Photography as a content calendar constraint
Photography is the actual constraint on recipe cadence, not writing. Every recipe needs 6 to 12 photos: hero shot, ingredient flat lay, prep in progress, plated result, storage, and step shots for the schema markup. A working food brand batches photography 8 recipes at a time to keep the cost per recipe under 200 dollars. Skip the batching and the per-recipe cost climbs to 400 to 600 dollars, which caps recipe cadence at 1 per week and slows organic ranking timeline by 6 months.
Seasonal content calendar planning
Seasonal content calendar planning maps recipes and comparison guides to the seasonal windows they need to rank in. A Christmas cookie recipe needs to publish in September to rank by early December. A Valentine’s chocolate guide needs to publish in November to rank by early February. A back-to-school lunchbox recipe needs to publish in June to rank by late August. The 60-to-90-day ranking curve dictates the calendar.
Creator syndication inside food brand content
Creator syndication on food brand content marketing amplifies the recipe hub through Instagram Reels, TikTok, and YouTube Shorts creators paid to post their own version of the brand’s hero recipes. The creator content pulls net-new audiences into the recipe hub through the creator’s Link in Bio or Amazon Storefront tag. The syndication calendar names 12 to 30 creators per quarter with specific recipes assigned to each.
One brand we picked up had a spreadsheet titled “creator outreach 2023” with 47 rows and 3 responses. All 3 responses were auto-replies. The spreadsheet named zero recipes and offered flat rates below 100 dollars per post. Nobody posts a 30-second video for 87 dollars flat. Nobody.
Creator content commercial terms that work
Working creator content commercial terms run 350 to 1,500 dollars flat per post plus a 12 to 25 percent commission on tagged sales across a 30-day window. The commission mechanic pulls creators into follow-up posts because the incremental revenue continues past the initial fee. Mid-tier creators (30k to 150k followers) hit the sweet spot for food brand content because their engagement rate typically runs 4 to 8 percent versus 0.8 to 1.6 percent on mega-creators.
Content brief structure for creator partnerships
The content brief structure for creator partnerships runs a single page: the SKU, the specific recipe or usage occasion, 3 required brand mentions, 3 restricted claims (no health claims on non-medical SKUs), the pricing angle, the affiliate link, and 3 example videos that hit the tone. The brief avoids over-scripting because over-scripted creator content underperforms native creator voice by 40 to 60 percent on engagement rate.
Buyer intent content for food brand blogs
Buyer intent content on food brand blogs covers 8 to 16 pieces targeting explicit purchase-decision queries: “where to buy [brand],” “[brand] subscription vs. one-time,” “best [category] for [use case],” and “[brand] gift bundle.” Every buyer intent piece runs 1,400 to 2,400 words with a comparison table, product cards, and a clear conversion path to the specific SKU that matches the query intent. Buyer intent content converts at 3 to 6 percent versus 1 to 2 percent on recipe content because the shopper landed already planning to buy, not exploring a usage occasion.
Where-to-buy content structure
Where-to-buy content structure covers online (DTC storefront, Amazon, Target.com, Whole Foods online), retail (specific chain locators with the store finder embedded), and international (customs limitations, retailer partners abroad). Every piece names specific retailers, links to the store locator, and includes an FAQ block covering shipping availability, subscription options, and gift card compatibility. Where-to-buy content ranks for branded discovery queries the DTC storefront otherwise loses to competitor affiliate reviews.
Subscription versus one-time comparison content
Subscription versus one-time comparison content converts subscription commitments at 3 to 6 percent because it addresses the price-sensitivity concern head-on with a specific math table. The piece covers the discount structure (15 percent lifetime), the skip-a-month mechanic, the pause-anytime rule, the cancellation policy, and the specific yearly savings for the brand’s average consumption cadence. Cross-reference the retention structure on our food and beverage marketing retainer page.
Content refresh cadence on food brand pillars
Content refresh cadence on food brand content pillars runs a rolling audit every 12 to 24 months by pillar. Recipes get refreshed every 12 months with new photography, updated schema, and any nutrition or ingredient adjustments. Ingredient comparison guides refresh every 18 months to update market data. Sourcing story pages refresh every 24 months to reflect farm partnership changes and new harvest angles. Buyer intent content refreshes every 12 months to update retailer availability and pricing.
Recipe refresh priority order
Recipe refresh priority runs by organic traffic rank. The top 20 recipes by monthly organic sessions get refreshed first (new photography, schema audit, related recipe internal links, updated nutrition). The next 40 get refreshed at 15 months. The remaining recipes get refreshed opportunistically when the ranking slips past position 15 in Google. Skipping the refresh cadence lets recipe rankings drift out of the top 3 inside 18 months as newer competitor recipes take the position.
Schema audit checklist per refresh
The schema audit checklist per refresh runs 8 items: Recipe schema completeness, aggregateRating count and accuracy, nutrition data accuracy, prepTime and cookTime match the recipe body, image URLs valid at CDN, related recipe internal links working, product card SKU URL live, and Google Search Console rich result eligibility validated. This checklist takes 20 minutes per recipe and prevents the schema drift that costs recipe rankings 20 to 40 positions quietly.
Reporting cadence for food brand content marketing
Reporting cadence on food brand content marketing runs a monthly executive report plus a quarterly business review. The monthly report ships in the first business week and covers organic sessions by pillar, top 10 ranking recipes with position trend, ingredient guide ranking movements, sourcing page performance, and organic-attributed DTC revenue. Every number carries a comparison to the prior month and a plain-language interpretation the founder reads in 7 minutes.
Metrics that matter for content marketing
Metrics that matter for food brand content marketing: organic sessions by pillar, recipe rich result impressions in Search Console, organic conversion rate to hero SKU pages, organic-attributed DTC revenue, and top 20 ranking positions by monthly organic sessions. Vanity metrics that do not matter: total pageviews without conversion context, average time on page without conversion attribution, and social share counts. The monthly report skips the vanity block entirely.
Quarterly business review structure
The quarterly business review runs 90 minutes with the founder, head of content, and SEO lead. Agenda: organic traffic trend by pillar, top 10 winning content pieces, top 10 losing content pieces (candidates for refresh or removal), competitive gap analysis against 5 named competitor brands, and next quarter’s content calendar with recipes and ingredient guides queued. According to Ahrefs content marketing research, brands running quarterly content audits outperform brands running annual audits by 40 to 70 percent on organic revenue over a 24-month window.
Internal linking discipline across food brand content
Internal linking discipline across food brand content moves authority from recipe pages toward hero SKU product pages and comparison guides. Every recipe links to the hero SKU it uses inline (once in the ingredient list, once in a bottom call-out card). Every ingredient comparison guide links to 3 to 6 recipes using the winning ingredient plus the hero SKU product page. Every sourcing story links to the 2 to 4 SKUs sourced from that specific farm or cooperative.
Anchor text strategy across recipe hubs
Anchor text on internal links varies across recipe hubs to avoid over-optimization patterns Google penalizes. Exact-match anchor (“single-origin Ethiopian coffee”) runs on 20 to 30 percent of internal links. Partial-match variations (“our Ethiopian roast”) run on 30 to 40 percent. Branded anchors (the SKU name) run on 20 to 30 percent. Generic anchors (“shop the coffee”) fill the remaining 10 to 20 percent. This ratio holds ranking without triggering the over-optimization penalty that shows up on brands that anchor-text-stuff every internal link with the same exact-match keyword. Cross-reference the linking layer on our food and beverage web design page.
Link equity from ingredient guides to SKU pages
Link equity from ingredient guides passes to SKU pages when the guide’s comparison table names the hero SKU in the winning column with a product card, and when the guide’s body links to 3 to 6 recipes that use the winning ingredient. This 3-hop path (guide to recipe to SKU) pushes authority from a high-traffic informational query down to a high-intent transactional page. According to Search Engine Land SEO coverage, informational content that internally links to transactional pages produces 2 to 4 times higher organic revenue than isolated content silos.
Wrapping up content marketing for food brands
Content marketing for food brands is the organic engine that turns a DTC snack, drink, or CPG storefront into a search-driven revenue channel. Recipe hub of 40 to 100 recipes. Ingredient comparison guides at 12 to 24 pieces. Sourcing story pages at 6 to 12 pieces. Buyer intent content at 8 to 16 pieces. Creator syndication calendar with 12 to 30 creators per quarter. Refresh cadence at 12 to 24 months by pillar. Reporting with organic sessions and organic revenue attribution.
If your DTC food brand is running paid social at 20,000 dollars monthly with a broken blog and zero recipe schema, professional content marketing for food brands pays for itself inside the first 90 days on organic traffic captured. Redefine Web ships content marketing inside our monthly retainer packages. Book a call and we will walk through the last three DTC food brands we built recipe hubs for, pillar by pillar.
Content marketing for food brands starts with a recipe hub because recipe queries account for 40 to 60 percent of high-intent search volume in the food category. Every hero SKU needs 4 to 12 recipes anchored to it, each targeting a specific occasion and audience.
Skip the recipe hub and the brand loses the search real estate that pulls DTC storefront traffic month over month at zero incremental paid cost. Recipe traffic converts at 2 to 4 percent because the shopper landed with usage intent, not passive discovery, which is why food brands win on recipes.
Recipe schema and Google rich result eligibility
Every recipe page ships schema.org Recipe markup including cookTime, prepTime, recipeIngredient, recipeInstructions, nutrition, and aggregateRating. Correctly marked-up recipes qualify for Google’s recipe rich result carousel that pulls 3 to 6 times higher click-through rate than a plain blue link. The schema layer takes 15 minutes per recipe to author and 30 minutes to validate in Google Search Console. Cross-reference the recipe search stack on our food and beverage SEO page.
Recipe hub structure that scales
The recipe hub structure runs 40 to 100 recipes at maturity, organized by hero SKU (4 to 12 recipes per SKU) plus occasion tags (breakfast, weeknight dinner, meal prep, brunch, holiday). Every recipe links back to the hero SKU product page with the SKU embedded in an inline card. The hub earns internal linking value from ingredient comparison guides and the sourcing story pages, which feeds recipe ranking on Google. According to Google Search Central recipe structured data guidance, complete Recipe schema markup is required for eligibility in the recipe carousel and the ingredient search filter.
Pillar structure for food brand content marketing
The pillar structure on content marketing for food brands runs 4 content pillars concurrently: recipe hub (40 to 100 recipes), ingredient comparison guides (12 to 24 guides), sourcing story pages (6 to 12 pages), and buyer intent content (where to buy, subscription vs. one-time, gift bundle guides). Every pillar covers a distinct search intent and every pillar links back to the hero SKU product pages.
Ingredient comparison guide format
Ingredient comparison guides run 1,800 to 3,200 words comparing 2 to 4 ingredient types on 6 to 10 attributes with a comparison table, real-world use case examples, and links to the hero SKU that uses the specific ingredient. Example: organic vs. conventional oats compares nutritional profile, sourcing chain, cost, environmental impact, and taste on a 6-column table. The brand’s SKU appears in the winning column with a product card. These guides rank 3 to 8 months after publication and pull steady-state organic traffic.
Sourcing story pages that build trust
Sourcing story pages name the specific farms, cooperatives, or suppliers the brand sources from, with photos of the farms, farmer quotes, and specific harvest windows. A coffee brand’s Ethiopian farm page ranks for “single-origin Ethiopian coffee” and “Yirgacheffe coffee origin” plus 40 long-tail variations. The sourcing page pulls trust-building traffic that converts at 4 to 6 percent because the shopper landed pattern-matching on transparency and named provenance. Every sourcing page includes farmer or cooperative quotes, harvest dates, and a link back to 3 to 5 hero SKU pages that source from the named supplier.
Vejrø hospitality content case study
Vejrø Resort, a Danish private-island destination with an on-site restaurant focused on organic, locally sourced cuisine, joined us with strong social engagement and no organic-search real estate. Guests found the resort on Instagram but never in Google search for terms like “private island resort Denmark,” “farm-to-table hospitality Denmark,” or “Vejrø restaurant.” The same organic-search gap shows up on DTC food brands running paid social at 20,000 dollars monthly with a broken blog and zero recipe schema.
We built the conversion-focused website with on-site and off-site SEO tuned to the travel-niche keyword clusters, competitor analysis against comparable boutique resorts, and mobile-first design prioritizing guest discovery. Every page carried the structured data qualifying it for Google’s rich results in the hospitality category. Every internal link pushed authority toward the direct-booking conversion path.
Three months later, Vejrø hit 10,000 plus organic visitors, ranked for 200 plus first-page keywords, and pulled a 2.2 percent booking conversion rate from organic traffic. The same pattern applies to content marketing for food brands: recipe schema, ingredient comparison guides, and sourcing story pages pull organic traffic at 20 to 40 percent conversion into hero SKU pages inside 6 months when the content quality matches search intent and every page carries the right structured data markup. Vejrø also proved out the reporting discipline: every monthly report named the exact page, the exact keyword cluster, and the exact search feature (rich result, sitelinks, image pack) driving the incremental organic revenue instead of hiding behind aggregate traffic charts.
Recipe cadence and content calendar for food brands
Recipe cadence on a working food brand content calendar ships 2 to 4 new recipes per week during the first 6 months and drops to 1 per week at maturity. Each recipe takes 4 to 6 hours to produce (write, test in the kitchen, photograph, schema author, publish). At 3 recipes per week, the brand hits 78 recipes inside 6 months plus a backlog of ingredient comparison and sourcing content queued behind the recipe production line.
| Content pillar | Target volume year 1 | Production cost per piece | Refresh cadence |
|---|---|---|---|
| Recipe hub | 40 to 100 recipes | $180 to $320 | Every 12 months |
| Ingredient comparison guides | 12 to 24 guides | $450 to $780 | Every 18 months |
| Sourcing story pages | 6 to 12 pages | $680 to $1,200 | Every 24 months |
| Buyer intent content | 8 to 16 pieces | $220 to $420 | Every 12 months |
Photography as a content calendar constraint
Photography is the actual constraint on recipe cadence, not writing. Every recipe needs 6 to 12 photos: hero shot, ingredient flat lay, prep in progress, plated result, storage, and step shots for the schema markup. A working food brand batches photography 8 recipes at a time to keep the cost per recipe under 200 dollars. Skip the batching and the per-recipe cost climbs to 400 to 600 dollars, which caps recipe cadence at 1 per week and slows organic ranking timeline by 6 months.
Seasonal content calendar planning
Seasonal content calendar planning maps recipes and comparison guides to the seasonal windows they need to rank in. A Christmas cookie recipe needs to publish in September to rank by early December. A Valentine’s chocolate guide needs to publish in November to rank by early February. A back-to-school lunchbox recipe needs to publish in June to rank by late August. The 60-to-90-day ranking curve dictates the calendar.
Creator syndication inside food brand content
Creator syndication on food brand content marketing amplifies the recipe hub through Instagram Reels, TikTok, and YouTube Shorts creators paid to post their own version of the brand’s hero recipes. The creator content pulls net-new audiences into the recipe hub through the creator’s Link in Bio or Amazon Storefront tag. The syndication calendar names 12 to 30 creators per quarter with specific recipes assigned to each.
One brand we picked up had a spreadsheet titled “creator outreach 2023” with 47 rows and 3 responses. All 3 responses were auto-replies. The spreadsheet named zero recipes and offered flat rates below 100 dollars per post. Nobody posts a 30-second video for 87 dollars flat. Nobody.
Creator content commercial terms that work
Working creator content commercial terms run 350 to 1,500 dollars flat per post plus a 12 to 25 percent commission on tagged sales across a 30-day window. The commission mechanic pulls creators into follow-up posts because the incremental revenue continues past the initial fee. Mid-tier creators (30k to 150k followers) hit the sweet spot for food brand content because their engagement rate typically runs 4 to 8 percent versus 0.8 to 1.6 percent on mega-creators.
Content brief structure for creator partnerships
The content brief structure for creator partnerships runs a single page: the SKU, the specific recipe or usage occasion, 3 required brand mentions, 3 restricted claims (no health claims on non-medical SKUs), the pricing angle, the affiliate link, and 3 example videos that hit the tone. The brief avoids over-scripting because over-scripted creator content underperforms native creator voice by 40 to 60 percent on engagement rate.
Buyer intent content for food brand blogs
Buyer intent content on food brand blogs covers 8 to 16 pieces targeting explicit purchase-decision queries: “where to buy [brand],” “[brand] subscription vs. one-time,” “best [category] for [use case],” and “[brand] gift bundle.” Every buyer intent piece runs 1,400 to 2,400 words with a comparison table, product cards, and a clear conversion path to the specific SKU that matches the query intent. Buyer intent content converts at 3 to 6 percent versus 1 to 2 percent on recipe content because the shopper landed already planning to buy, not exploring a usage occasion.
Where-to-buy content structure
Where-to-buy content structure covers online (DTC storefront, Amazon, Target.com, Whole Foods online), retail (specific chain locators with the store finder embedded), and international (customs limitations, retailer partners abroad). Every piece names specific retailers, links to the store locator, and includes an FAQ block covering shipping availability, subscription options, and gift card compatibility. Where-to-buy content ranks for branded discovery queries the DTC storefront otherwise loses to competitor affiliate reviews.
Subscription versus one-time comparison content
Subscription versus one-time comparison content converts subscription commitments at 3 to 6 percent because it addresses the price-sensitivity concern head-on with a specific math table. The piece covers the discount structure (15 percent lifetime), the skip-a-month mechanic, the pause-anytime rule, the cancellation policy, and the specific yearly savings for the brand’s average consumption cadence. Cross-reference the retention structure on our food and beverage marketing retainer page.
Content refresh cadence on food brand pillars
Content refresh cadence on food brand content pillars runs a rolling audit every 12 to 24 months by pillar. Recipes get refreshed every 12 months with new photography, updated schema, and any nutrition or ingredient adjustments. Ingredient comparison guides refresh every 18 months to update market data. Sourcing story pages refresh every 24 months to reflect farm partnership changes and new harvest angles. Buyer intent content refreshes every 12 months to update retailer availability and pricing.
Recipe refresh priority order
Recipe refresh priority runs by organic traffic rank. The top 20 recipes by monthly organic sessions get refreshed first (new photography, schema audit, related recipe internal links, updated nutrition). The next 40 get refreshed at 15 months. The remaining recipes get refreshed opportunistically when the ranking slips past position 15 in Google. Skipping the refresh cadence lets recipe rankings drift out of the top 3 inside 18 months as newer competitor recipes take the position.
Schema audit checklist per refresh
The schema audit checklist per refresh runs 8 items: Recipe schema completeness, aggregateRating count and accuracy, nutrition data accuracy, prepTime and cookTime match the recipe body, image URLs valid at CDN, related recipe internal links working, product card SKU URL live, and Google Search Console rich result eligibility validated. This checklist takes 20 minutes per recipe and prevents the schema drift that costs recipe rankings 20 to 40 positions quietly.
Reporting cadence for food brand content marketing
Reporting cadence on food brand content marketing runs a monthly executive report plus a quarterly business review. The monthly report ships in the first business week and covers organic sessions by pillar, top 10 ranking recipes with position trend, ingredient guide ranking movements, sourcing page performance, and organic-attributed DTC revenue. Every number carries a comparison to the prior month and a plain-language interpretation the founder reads in 7 minutes.
Metrics that matter for content marketing
Metrics that matter for food brand content marketing: organic sessions by pillar, recipe rich result impressions in Search Console, organic conversion rate to hero SKU pages, organic-attributed DTC revenue, and top 20 ranking positions by monthly organic sessions. Vanity metrics that do not matter: total pageviews without conversion context, average time on page without conversion attribution, and social share counts. The monthly report skips the vanity block entirely.
Quarterly business review structure
The quarterly business review runs 90 minutes with the founder, head of content, and SEO lead. Agenda: organic traffic trend by pillar, top 10 winning content pieces, top 10 losing content pieces (candidates for refresh or removal), competitive gap analysis against 5 named competitor brands, and next quarter’s content calendar with recipes and ingredient guides queued. According to Ahrefs content marketing research, brands running quarterly content audits outperform brands running annual audits by 40 to 70 percent on organic revenue over a 24-month window.
Internal linking discipline across food brand content
Internal linking discipline across food brand content moves authority from recipe pages toward hero SKU product pages and comparison guides. Every recipe links to the hero SKU it uses inline (once in the ingredient list, once in a bottom call-out card). Every ingredient comparison guide links to 3 to 6 recipes using the winning ingredient plus the hero SKU product page. Every sourcing story links to the 2 to 4 SKUs sourced from that specific farm or cooperative.
Anchor text strategy across recipe hubs
Anchor text on internal links varies across recipe hubs to avoid over-optimization patterns Google penalizes. Exact-match anchor (“single-origin Ethiopian coffee”) runs on 20 to 30 percent of internal links. Partial-match variations (“our Ethiopian roast”) run on 30 to 40 percent. Branded anchors (the SKU name) run on 20 to 30 percent. Generic anchors (“shop the coffee”) fill the remaining 10 to 20 percent. This ratio holds ranking without triggering the over-optimization penalty that shows up on brands that anchor-text-stuff every internal link with the same exact-match keyword. Cross-reference the linking layer on our food and beverage web design page.
Link equity from ingredient guides to SKU pages
Link equity from ingredient guides passes to SKU pages when the guide’s comparison table names the hero SKU in the winning column with a product card, and when the guide’s body links to 3 to 6 recipes that use the winning ingredient. This 3-hop path (guide to recipe to SKU) pushes authority from a high-traffic informational query down to a high-intent transactional page. According to Search Engine Land SEO coverage, informational content that internally links to transactional pages produces 2 to 4 times higher organic revenue than isolated content silos.
Wrapping up content marketing for food brands
Content marketing for food brands is the organic engine that turns a DTC snack, drink, or CPG storefront into a search-driven revenue channel. Recipe hub of 40 to 100 recipes. Ingredient comparison guides at 12 to 24 pieces. Sourcing story pages at 6 to 12 pieces. Buyer intent content at 8 to 16 pieces. Creator syndication calendar with 12 to 30 creators per quarter. Refresh cadence at 12 to 24 months by pillar. Reporting with organic sessions and organic revenue attribution.
If your DTC food brand is running paid social at 20,000 dollars monthly with a broken blog and zero recipe schema, professional content marketing for food brands pays for itself inside the first 90 days on organic traffic captured. Redefine Web ships content marketing inside our monthly retainer packages. Book a call and we will walk through the last three DTC food brands we built recipe hubs for, pillar by pillar.
Internal linking discipline across food brand content moves authority from recipe pages toward hero SKU product pages and comparison guides. Every recipe links to the hero SKU it uses inline (once in the ingredient list, once in a bottom call-out card). Every ingredient comparison guide links to 3 to 6 recipes using the winning ingredient plus the hero SKU product page. Every sourcing story links to the 2 to 4 SKUs sourced from that specific farm or cooperative.
Anchor text strategy across recipe hubs
Anchor text on internal links varies across recipe hubs to avoid over-optimization patterns Google penalizes. Exact-match anchor (“single-origin Ethiopian coffee”) runs on 20 to 30 percent of internal links. Partial-match variations (“our Ethiopian roast”) run on 30 to 40 percent. Branded anchors (the SKU name) run on 20 to 30 percent. Generic anchors (“shop the coffee”) fill the remaining 10 to 20 percent. This ratio holds ranking without triggering the over-optimization penalty that shows up on brands that anchor-text-stuff every internal link with the same exact-match keyword. Cross-reference the linking layer on our food and beverage web design page.
Link equity from ingredient guides to SKU pages
Link equity from ingredient guides passes to SKU pages when the guide’s comparison table names the hero SKU in the winning column with a product card, and when the guide’s body links to 3 to 6 recipes that use the winning ingredient. This 3-hop path (guide to recipe to SKU) pushes authority from a high-traffic informational query down to a high-intent transactional page. According to Search Engine Land SEO coverage, informational content that internally links to transactional pages produces 2 to 4 times higher organic revenue than isolated content silos.
Wrapping up content marketing for food brands
Content marketing for food brands is the organic engine that turns a DTC snack, drink, or CPG storefront into a search-driven revenue channel. Recipe hub of 40 to 100 recipes. Ingredient comparison guides at 12 to 24 pieces. Sourcing story pages at 6 to 12 pieces. Buyer intent content at 8 to 16 pieces. Creator syndication calendar with 12 to 30 creators per quarter. Refresh cadence at 12 to 24 months by pillar. Reporting with organic sessions and organic revenue attribution.
If your DTC food brand is running paid social at 20,000 dollars monthly with a broken blog and zero recipe schema, professional content marketing for food brands pays for itself inside the first 90 days on organic traffic captured. Redefine Web ships content marketing inside our monthly retainer packages. Book a call and we will walk through the last three DTC food brands we built recipe hubs for, pillar by pillar.
Content marketing for food brands starts with a recipe hub because recipe queries account for 40 to 60 percent of high-intent search volume in the food category. Every hero SKU needs 4 to 12 recipes anchored to it, each targeting a specific occasion and audience.
Skip the recipe hub and the brand loses the search real estate that pulls DTC storefront traffic month over month at zero incremental paid cost. Recipe traffic converts at 2 to 4 percent because the shopper landed with usage intent, not passive discovery, which is why food brands win on recipes.
Recipe schema and Google rich result eligibility
Every recipe page ships schema.org Recipe markup including cookTime, prepTime, recipeIngredient, recipeInstructions, nutrition, and aggregateRating. Correctly marked-up recipes qualify for Google’s recipe rich result carousel that pulls 3 to 6 times higher click-through rate than a plain blue link. The schema layer takes 15 minutes per recipe to author and 30 minutes to validate in Google Search Console. Cross-reference the recipe search stack on our food and beverage SEO page.
Recipe hub structure that scales
The recipe hub structure runs 40 to 100 recipes at maturity, organized by hero SKU (4 to 12 recipes per SKU) plus occasion tags (breakfast, weeknight dinner, meal prep, brunch, holiday). Every recipe links back to the hero SKU product page with the SKU embedded in an inline card. The hub earns internal linking value from ingredient comparison guides and the sourcing story pages, which feeds recipe ranking on Google. According to Google Search Central recipe structured data guidance, complete Recipe schema markup is required for eligibility in the recipe carousel and the ingredient search filter.
Pillar structure for food brand content marketing
The pillar structure on content marketing for food brands runs 4 content pillars concurrently: recipe hub (40 to 100 recipes), ingredient comparison guides (12 to 24 guides), sourcing story pages (6 to 12 pages), and buyer intent content (where to buy, subscription vs. one-time, gift bundle guides). Every pillar covers a distinct search intent and every pillar links back to the hero SKU product pages.
Ingredient comparison guide format
Ingredient comparison guides run 1,800 to 3,200 words comparing 2 to 4 ingredient types on 6 to 10 attributes with a comparison table, real-world use case examples, and links to the hero SKU that uses the specific ingredient. Example: organic vs. conventional oats compares nutritional profile, sourcing chain, cost, environmental impact, and taste on a 6-column table. The brand’s SKU appears in the winning column with a product card. These guides rank 3 to 8 months after publication and pull steady-state organic traffic.
Sourcing story pages that build trust
Sourcing story pages name the specific farms, cooperatives, or suppliers the brand sources from, with photos of the farms, farmer quotes, and specific harvest windows. A coffee brand’s Ethiopian farm page ranks for “single-origin Ethiopian coffee” and “Yirgacheffe coffee origin” plus 40 long-tail variations. The sourcing page pulls trust-building traffic that converts at 4 to 6 percent because the shopper landed pattern-matching on transparency and named provenance. Every sourcing page includes farmer or cooperative quotes, harvest dates, and a link back to 3 to 5 hero SKU pages that source from the named supplier.
Vejrø hospitality content case study
Vejrø Resort, a Danish private-island destination with an on-site restaurant focused on organic, locally sourced cuisine, joined us with strong social engagement and no organic-search real estate. Guests found the resort on Instagram but never in Google search for terms like “private island resort Denmark,” “farm-to-table hospitality Denmark,” or “Vejrø restaurant.” The same organic-search gap shows up on DTC food brands running paid social at 20,000 dollars monthly with a broken blog and zero recipe schema.
We built the conversion-focused website with on-site and off-site SEO tuned to the travel-niche keyword clusters, competitor analysis against comparable boutique resorts, and mobile-first design prioritizing guest discovery. Every page carried the structured data qualifying it for Google’s rich results in the hospitality category. Every internal link pushed authority toward the direct-booking conversion path.
Three months later, Vejrø hit 10,000 plus organic visitors, ranked for 200 plus first-page keywords, and pulled a 2.2 percent booking conversion rate from organic traffic. The same pattern applies to content marketing for food brands: recipe schema, ingredient comparison guides, and sourcing story pages pull organic traffic at 20 to 40 percent conversion into hero SKU pages inside 6 months when the content quality matches search intent and every page carries the right structured data markup. Vejrø also proved out the reporting discipline: every monthly report named the exact page, the exact keyword cluster, and the exact search feature (rich result, sitelinks, image pack) driving the incremental organic revenue instead of hiding behind aggregate traffic charts.
Recipe cadence and content calendar for food brands
Recipe cadence on a working food brand content calendar ships 2 to 4 new recipes per week during the first 6 months and drops to 1 per week at maturity. Each recipe takes 4 to 6 hours to produce (write, test in the kitchen, photograph, schema author, publish). At 3 recipes per week, the brand hits 78 recipes inside 6 months plus a backlog of ingredient comparison and sourcing content queued behind the recipe production line.
| Content pillar | Target volume year 1 | Production cost per piece | Refresh cadence |
|---|---|---|---|
| Recipe hub | 40 to 100 recipes | $180 to $320 | Every 12 months |
| Ingredient comparison guides | 12 to 24 guides | $450 to $780 | Every 18 months |
| Sourcing story pages | 6 to 12 pages | $680 to $1,200 | Every 24 months |
| Buyer intent content | 8 to 16 pieces | $220 to $420 | Every 12 months |
Photography as a content calendar constraint
Photography is the actual constraint on recipe cadence, not writing. Every recipe needs 6 to 12 photos: hero shot, ingredient flat lay, prep in progress, plated result, storage, and step shots for the schema markup. A working food brand batches photography 8 recipes at a time to keep the cost per recipe under 200 dollars. Skip the batching and the per-recipe cost climbs to 400 to 600 dollars, which caps recipe cadence at 1 per week and slows organic ranking timeline by 6 months.
Seasonal content calendar planning
Seasonal content calendar planning maps recipes and comparison guides to the seasonal windows they need to rank in. A Christmas cookie recipe needs to publish in September to rank by early December. A Valentine’s chocolate guide needs to publish in November to rank by early February. A back-to-school lunchbox recipe needs to publish in June to rank by late August. The 60-to-90-day ranking curve dictates the calendar.
Creator syndication inside food brand content
Creator syndication on food brand content marketing amplifies the recipe hub through Instagram Reels, TikTok, and YouTube Shorts creators paid to post their own version of the brand’s hero recipes. The creator content pulls net-new audiences into the recipe hub through the creator’s Link in Bio or Amazon Storefront tag. The syndication calendar names 12 to 30 creators per quarter with specific recipes assigned to each.
One brand we picked up had a spreadsheet titled “creator outreach 2023” with 47 rows and 3 responses. All 3 responses were auto-replies. The spreadsheet named zero recipes and offered flat rates below 100 dollars per post. Nobody posts a 30-second video for 87 dollars flat. Nobody.
Creator content commercial terms that work
Working creator content commercial terms run 350 to 1,500 dollars flat per post plus a 12 to 25 percent commission on tagged sales across a 30-day window. The commission mechanic pulls creators into follow-up posts because the incremental revenue continues past the initial fee. Mid-tier creators (30k to 150k followers) hit the sweet spot for food brand content because their engagement rate typically runs 4 to 8 percent versus 0.8 to 1.6 percent on mega-creators.
Content brief structure for creator partnerships
The content brief structure for creator partnerships runs a single page: the SKU, the specific recipe or usage occasion, 3 required brand mentions, 3 restricted claims (no health claims on non-medical SKUs), the pricing angle, the affiliate link, and 3 example videos that hit the tone. The brief avoids over-scripting because over-scripted creator content underperforms native creator voice by 40 to 60 percent on engagement rate.
Buyer intent content for food brand blogs
Buyer intent content on food brand blogs covers 8 to 16 pieces targeting explicit purchase-decision queries: “where to buy [brand],” “[brand] subscription vs. one-time,” “best [category] for [use case],” and “[brand] gift bundle.” Every buyer intent piece runs 1,400 to 2,400 words with a comparison table, product cards, and a clear conversion path to the specific SKU that matches the query intent. Buyer intent content converts at 3 to 6 percent versus 1 to 2 percent on recipe content because the shopper landed already planning to buy, not exploring a usage occasion.
Where-to-buy content structure
Where-to-buy content structure covers online (DTC storefront, Amazon, Target.com, Whole Foods online), retail (specific chain locators with the store finder embedded), and international (customs limitations, retailer partners abroad). Every piece names specific retailers, links to the store locator, and includes an FAQ block covering shipping availability, subscription options, and gift card compatibility. Where-to-buy content ranks for branded discovery queries the DTC storefront otherwise loses to competitor affiliate reviews.
Subscription versus one-time comparison content
Subscription versus one-time comparison content converts subscription commitments at 3 to 6 percent because it addresses the price-sensitivity concern head-on with a specific math table. The piece covers the discount structure (15 percent lifetime), the skip-a-month mechanic, the pause-anytime rule, the cancellation policy, and the specific yearly savings for the brand’s average consumption cadence. Cross-reference the retention structure on our food and beverage marketing retainer page.
Content refresh cadence on food brand pillars
Content refresh cadence on food brand content pillars runs a rolling audit every 12 to 24 months by pillar. Recipes get refreshed every 12 months with new photography, updated schema, and any nutrition or ingredient adjustments. Ingredient comparison guides refresh every 18 months to update market data. Sourcing story pages refresh every 24 months to reflect farm partnership changes and new harvest angles. Buyer intent content refreshes every 12 months to update retailer availability and pricing.
Recipe refresh priority order
Recipe refresh priority runs by organic traffic rank. The top 20 recipes by monthly organic sessions get refreshed first (new photography, schema audit, related recipe internal links, updated nutrition). The next 40 get refreshed at 15 months. The remaining recipes get refreshed opportunistically when the ranking slips past position 15 in Google. Skipping the refresh cadence lets recipe rankings drift out of the top 3 inside 18 months as newer competitor recipes take the position.
Schema audit checklist per refresh
The schema audit checklist per refresh runs 8 items: Recipe schema completeness, aggregateRating count and accuracy, nutrition data accuracy, prepTime and cookTime match the recipe body, image URLs valid at CDN, related recipe internal links working, product card SKU URL live, and Google Search Console rich result eligibility validated. This checklist takes 20 minutes per recipe and prevents the schema drift that costs recipe rankings 20 to 40 positions quietly.
Reporting cadence for food brand content marketing
Reporting cadence on food brand content marketing runs a monthly executive report plus a quarterly business review. The monthly report ships in the first business week and covers organic sessions by pillar, top 10 ranking recipes with position trend, ingredient guide ranking movements, sourcing page performance, and organic-attributed DTC revenue. Every number carries a comparison to the prior month and a plain-language interpretation the founder reads in 7 minutes.
Metrics that matter for content marketing
Metrics that matter for food brand content marketing: organic sessions by pillar, recipe rich result impressions in Search Console, organic conversion rate to hero SKU pages, organic-attributed DTC revenue, and top 20 ranking positions by monthly organic sessions. Vanity metrics that do not matter: total pageviews without conversion context, average time on page without conversion attribution, and social share counts. The monthly report skips the vanity block entirely.
Quarterly business review structure
The quarterly business review runs 90 minutes with the founder, head of content, and SEO lead. Agenda: organic traffic trend by pillar, top 10 winning content pieces, top 10 losing content pieces (candidates for refresh or removal), competitive gap analysis against 5 named competitor brands, and next quarter’s content calendar with recipes and ingredient guides queued. According to Ahrefs content marketing research, brands running quarterly content audits outperform brands running annual audits by 40 to 70 percent on organic revenue over a 24-month window.
Internal linking discipline across food brand content
Internal linking discipline across food brand content moves authority from recipe pages toward hero SKU product pages and comparison guides. Every recipe links to the hero SKU it uses inline (once in the ingredient list, once in a bottom call-out card). Every ingredient comparison guide links to 3 to 6 recipes using the winning ingredient plus the hero SKU product page. Every sourcing story links to the 2 to 4 SKUs sourced from that specific farm or cooperative.
Anchor text strategy across recipe hubs
Anchor text on internal links varies across recipe hubs to avoid over-optimization patterns Google penalizes. Exact-match anchor (“single-origin Ethiopian coffee”) runs on 20 to 30 percent of internal links. Partial-match variations (“our Ethiopian roast”) run on 30 to 40 percent. Branded anchors (the SKU name) run on 20 to 30 percent. Generic anchors (“shop the coffee”) fill the remaining 10 to 20 percent. This ratio holds ranking without triggering the over-optimization penalty that shows up on brands that anchor-text-stuff every internal link with the same exact-match keyword. Cross-reference the linking layer on our food and beverage web design page.
Link equity from ingredient guides to SKU pages
Link equity from ingredient guides passes to SKU pages when the guide’s comparison table names the hero SKU in the winning column with a product card, and when the guide’s body links to 3 to 6 recipes that use the winning ingredient. This 3-hop path (guide to recipe to SKU) pushes authority from a high-traffic informational query down to a high-intent transactional page. According to Search Engine Land SEO coverage, informational content that internally links to transactional pages produces 2 to 4 times higher organic revenue than isolated content silos.
Wrapping up content marketing for food brands
Content marketing for food brands is the organic engine that turns a DTC snack, drink, or CPG storefront into a search-driven revenue channel. Recipe hub of 40 to 100 recipes. Ingredient comparison guides at 12 to 24 pieces. Sourcing story pages at 6 to 12 pieces. Buyer intent content at 8 to 16 pieces. Creator syndication calendar with 12 to 30 creators per quarter. Refresh cadence at 12 to 24 months by pillar. Reporting with organic sessions and organic revenue attribution.
If your DTC food brand is running paid social at 20,000 dollars monthly with a broken blog and zero recipe schema, professional content marketing for food brands pays for itself inside the first 90 days on organic traffic captured. Redefine Web ships content marketing inside our monthly retainer packages. Book a call and we will walk through the last three DTC food brands we built recipe hubs for, pillar by pillar.
Content marketing for food brands starts with a recipe hub because recipe queries account for 40 to 60 percent of high-intent search volume in the food category. Every hero SKU needs 4 to 12 recipes anchored to it, each targeting a specific occasion and audience.
Skip the recipe hub and the brand loses the search real estate that pulls DTC storefront traffic month over month at zero incremental paid cost. Recipe traffic converts at 2 to 4 percent because the shopper landed with usage intent, not passive discovery, which is why food brands win on recipes.
Recipe schema and Google rich result eligibility
Every recipe page ships schema.org Recipe markup including cookTime, prepTime, recipeIngredient, recipeInstructions, nutrition, and aggregateRating. Correctly marked-up recipes qualify for Google’s recipe rich result carousel that pulls 3 to 6 times higher click-through rate than a plain blue link. The schema layer takes 15 minutes per recipe to author and 30 minutes to validate in Google Search Console. Cross-reference the recipe search stack on our food and beverage SEO page.
Recipe hub structure that scales
The recipe hub structure runs 40 to 100 recipes at maturity, organized by hero SKU (4 to 12 recipes per SKU) plus occasion tags (breakfast, weeknight dinner, meal prep, brunch, holiday). Every recipe links back to the hero SKU product page with the SKU embedded in an inline card. The hub earns internal linking value from ingredient comparison guides and the sourcing story pages, which feeds recipe ranking on Google. According to Google Search Central recipe structured data guidance, complete Recipe schema markup is required for eligibility in the recipe carousel and the ingredient search filter.
Pillar structure for food brand content marketing
The pillar structure on content marketing for food brands runs 4 content pillars concurrently: recipe hub (40 to 100 recipes), ingredient comparison guides (12 to 24 guides), sourcing story pages (6 to 12 pages), and buyer intent content (where to buy, subscription vs. one-time, gift bundle guides). Every pillar covers a distinct search intent and every pillar links back to the hero SKU product pages.
Ingredient comparison guide format
Ingredient comparison guides run 1,800 to 3,200 words comparing 2 to 4 ingredient types on 6 to 10 attributes with a comparison table, real-world use case examples, and links to the hero SKU that uses the specific ingredient. Example: organic vs. conventional oats compares nutritional profile, sourcing chain, cost, environmental impact, and taste on a 6-column table. The brand’s SKU appears in the winning column with a product card. These guides rank 3 to 8 months after publication and pull steady-state organic traffic.
Sourcing story pages that build trust
Sourcing story pages name the specific farms, cooperatives, or suppliers the brand sources from, with photos of the farms, farmer quotes, and specific harvest windows. A coffee brand’s Ethiopian farm page ranks for “single-origin Ethiopian coffee” and “Yirgacheffe coffee origin” plus 40 long-tail variations. The sourcing page pulls trust-building traffic that converts at 4 to 6 percent because the shopper landed pattern-matching on transparency and named provenance. Every sourcing page includes farmer or cooperative quotes, harvest dates, and a link back to 3 to 5 hero SKU pages that source from the named supplier.
Vejrø hospitality content case study
Vejrø Resort, a Danish private-island destination with an on-site restaurant focused on organic, locally sourced cuisine, joined us with strong social engagement and no organic-search real estate. Guests found the resort on Instagram but never in Google search for terms like “private island resort Denmark,” “farm-to-table hospitality Denmark,” or “Vejrø restaurant.” The same organic-search gap shows up on DTC food brands running paid social at 20,000 dollars monthly with a broken blog and zero recipe schema.
We built the conversion-focused website with on-site and off-site SEO tuned to the travel-niche keyword clusters, competitor analysis against comparable boutique resorts, and mobile-first design prioritizing guest discovery. Every page carried the structured data qualifying it for Google’s rich results in the hospitality category. Every internal link pushed authority toward the direct-booking conversion path.
Three months later, Vejrø hit 10,000 plus organic visitors, ranked for 200 plus first-page keywords, and pulled a 2.2 percent booking conversion rate from organic traffic. The same pattern applies to content marketing for food brands: recipe schema, ingredient comparison guides, and sourcing story pages pull organic traffic at 20 to 40 percent conversion into hero SKU pages inside 6 months when the content quality matches search intent and every page carries the right structured data markup. Vejrø also proved out the reporting discipline: every monthly report named the exact page, the exact keyword cluster, and the exact search feature (rich result, sitelinks, image pack) driving the incremental organic revenue instead of hiding behind aggregate traffic charts.
Recipe cadence and content calendar for food brands
Recipe cadence on a working food brand content calendar ships 2 to 4 new recipes per week during the first 6 months and drops to 1 per week at maturity. Each recipe takes 4 to 6 hours to produce (write, test in the kitchen, photograph, schema author, publish). At 3 recipes per week, the brand hits 78 recipes inside 6 months plus a backlog of ingredient comparison and sourcing content queued behind the recipe production line.
| Content pillar | Target volume year 1 | Production cost per piece | Refresh cadence |
|---|---|---|---|
| Recipe hub | 40 to 100 recipes | $180 to $320 | Every 12 months |
| Ingredient comparison guides | 12 to 24 guides | $450 to $780 | Every 18 months |
| Sourcing story pages | 6 to 12 pages | $680 to $1,200 | Every 24 months |
| Buyer intent content | 8 to 16 pieces | $220 to $420 | Every 12 months |
Photography as a content calendar constraint
Photography is the actual constraint on recipe cadence, not writing. Every recipe needs 6 to 12 photos: hero shot, ingredient flat lay, prep in progress, plated result, storage, and step shots for the schema markup. A working food brand batches photography 8 recipes at a time to keep the cost per recipe under 200 dollars. Skip the batching and the per-recipe cost climbs to 400 to 600 dollars, which caps recipe cadence at 1 per week and slows organic ranking timeline by 6 months.
Seasonal content calendar planning
Seasonal content calendar planning maps recipes and comparison guides to the seasonal windows they need to rank in. A Christmas cookie recipe needs to publish in September to rank by early December. A Valentine’s chocolate guide needs to publish in November to rank by early February. A back-to-school lunchbox recipe needs to publish in June to rank by late August. The 60-to-90-day ranking curve dictates the calendar.
Creator syndication inside food brand content
Creator syndication on food brand content marketing amplifies the recipe hub through Instagram Reels, TikTok, and YouTube Shorts creators paid to post their own version of the brand’s hero recipes. The creator content pulls net-new audiences into the recipe hub through the creator’s Link in Bio or Amazon Storefront tag. The syndication calendar names 12 to 30 creators per quarter with specific recipes assigned to each.
One brand we picked up had a spreadsheet titled “creator outreach 2023” with 47 rows and 3 responses. All 3 responses were auto-replies. The spreadsheet named zero recipes and offered flat rates below 100 dollars per post. Nobody posts a 30-second video for 87 dollars flat. Nobody.
Creator content commercial terms that work
Working creator content commercial terms run 350 to 1,500 dollars flat per post plus a 12 to 25 percent commission on tagged sales across a 30-day window. The commission mechanic pulls creators into follow-up posts because the incremental revenue continues past the initial fee. Mid-tier creators (30k to 150k followers) hit the sweet spot for food brand content because their engagement rate typically runs 4 to 8 percent versus 0.8 to 1.6 percent on mega-creators.
Content brief structure for creator partnerships
The content brief structure for creator partnerships runs a single page: the SKU, the specific recipe or usage occasion, 3 required brand mentions, 3 restricted claims (no health claims on non-medical SKUs), the pricing angle, the affiliate link, and 3 example videos that hit the tone. The brief avoids over-scripting because over-scripted creator content underperforms native creator voice by 40 to 60 percent on engagement rate.
Buyer intent content for food brand blogs
Buyer intent content on food brand blogs covers 8 to 16 pieces targeting explicit purchase-decision queries: “where to buy [brand],” “[brand] subscription vs. one-time,” “best [category] for [use case],” and “[brand] gift bundle.” Every buyer intent piece runs 1,400 to 2,400 words with a comparison table, product cards, and a clear conversion path to the specific SKU that matches the query intent. Buyer intent content converts at 3 to 6 percent versus 1 to 2 percent on recipe content because the shopper landed already planning to buy, not exploring a usage occasion.
Where-to-buy content structure
Where-to-buy content structure covers online (DTC storefront, Amazon, Target.com, Whole Foods online), retail (specific chain locators with the store finder embedded), and international (customs limitations, retailer partners abroad). Every piece names specific retailers, links to the store locator, and includes an FAQ block covering shipping availability, subscription options, and gift card compatibility. Where-to-buy content ranks for branded discovery queries the DTC storefront otherwise loses to competitor affiliate reviews.
Subscription versus one-time comparison content
Subscription versus one-time comparison content converts subscription commitments at 3 to 6 percent because it addresses the price-sensitivity concern head-on with a specific math table. The piece covers the discount structure (15 percent lifetime), the skip-a-month mechanic, the pause-anytime rule, the cancellation policy, and the specific yearly savings for the brand’s average consumption cadence. Cross-reference the retention structure on our food and beverage marketing retainer page.
Content refresh cadence on food brand pillars
Content refresh cadence on food brand content pillars runs a rolling audit every 12 to 24 months by pillar. Recipes get refreshed every 12 months with new photography, updated schema, and any nutrition or ingredient adjustments. Ingredient comparison guides refresh every 18 months to update market data. Sourcing story pages refresh every 24 months to reflect farm partnership changes and new harvest angles. Buyer intent content refreshes every 12 months to update retailer availability and pricing.
Recipe refresh priority order
Recipe refresh priority runs by organic traffic rank. The top 20 recipes by monthly organic sessions get refreshed first (new photography, schema audit, related recipe internal links, updated nutrition). The next 40 get refreshed at 15 months. The remaining recipes get refreshed opportunistically when the ranking slips past position 15 in Google. Skipping the refresh cadence lets recipe rankings drift out of the top 3 inside 18 months as newer competitor recipes take the position.
Schema audit checklist per refresh
The schema audit checklist per refresh runs 8 items: Recipe schema completeness, aggregateRating count and accuracy, nutrition data accuracy, prepTime and cookTime match the recipe body, image URLs valid at CDN, related recipe internal links working, product card SKU URL live, and Google Search Console rich result eligibility validated. This checklist takes 20 minutes per recipe and prevents the schema drift that costs recipe rankings 20 to 40 positions quietly.
Reporting cadence for food brand content marketing
Reporting cadence on food brand content marketing runs a monthly executive report plus a quarterly business review. The monthly report ships in the first business week and covers organic sessions by pillar, top 10 ranking recipes with position trend, ingredient guide ranking movements, sourcing page performance, and organic-attributed DTC revenue. Every number carries a comparison to the prior month and a plain-language interpretation the founder reads in 7 minutes.
Metrics that matter for content marketing
Metrics that matter for food brand content marketing: organic sessions by pillar, recipe rich result impressions in Search Console, organic conversion rate to hero SKU pages, organic-attributed DTC revenue, and top 20 ranking positions by monthly organic sessions. Vanity metrics that do not matter: total pageviews without conversion context, average time on page without conversion attribution, and social share counts. The monthly report skips the vanity block entirely.
Quarterly business review structure
The quarterly business review runs 90 minutes with the founder, head of content, and SEO lead. Agenda: organic traffic trend by pillar, top 10 winning content pieces, top 10 losing content pieces (candidates for refresh or removal), competitive gap analysis against 5 named competitor brands, and next quarter’s content calendar with recipes and ingredient guides queued. According to Ahrefs content marketing research, brands running quarterly content audits outperform brands running annual audits by 40 to 70 percent on organic revenue over a 24-month window.
Internal linking discipline across food brand content
Internal linking discipline across food brand content moves authority from recipe pages toward hero SKU product pages and comparison guides. Every recipe links to the hero SKU it uses inline (once in the ingredient list, once in a bottom call-out card). Every ingredient comparison guide links to 3 to 6 recipes using the winning ingredient plus the hero SKU product page. Every sourcing story links to the 2 to 4 SKUs sourced from that specific farm or cooperative.
Anchor text strategy across recipe hubs
Anchor text on internal links varies across recipe hubs to avoid over-optimization patterns Google penalizes. Exact-match anchor (“single-origin Ethiopian coffee”) runs on 20 to 30 percent of internal links. Partial-match variations (“our Ethiopian roast”) run on 30 to 40 percent. Branded anchors (the SKU name) run on 20 to 30 percent. Generic anchors (“shop the coffee”) fill the remaining 10 to 20 percent. This ratio holds ranking without triggering the over-optimization penalty that shows up on brands that anchor-text-stuff every internal link with the same exact-match keyword. Cross-reference the linking layer on our food and beverage web design page.
Link equity from ingredient guides to SKU pages
Link equity from ingredient guides passes to SKU pages when the guide’s comparison table names the hero SKU in the winning column with a product card, and when the guide’s body links to 3 to 6 recipes that use the winning ingredient. This 3-hop path (guide to recipe to SKU) pushes authority from a high-traffic informational query down to a high-intent transactional page. According to Search Engine Land SEO coverage, informational content that internally links to transactional pages produces 2 to 4 times higher organic revenue than isolated content silos.
Wrapping up content marketing for food brands
Content marketing for food brands is the organic engine that turns a DTC snack, drink, or CPG storefront into a search-driven revenue channel. Recipe hub of 40 to 100 recipes. Ingredient comparison guides at 12 to 24 pieces. Sourcing story pages at 6 to 12 pieces. Buyer intent content at 8 to 16 pieces. Creator syndication calendar with 12 to 30 creators per quarter. Refresh cadence at 12 to 24 months by pillar. Reporting with organic sessions and organic revenue attribution.
If your DTC food brand is running paid social at 20,000 dollars monthly with a broken blog and zero recipe schema, professional content marketing for food brands pays for itself inside the first 90 days on organic traffic captured. Redefine Web ships content marketing inside our monthly retainer packages. Book a call and we will walk through the last three DTC food brands we built recipe hubs for, pillar by pillar.
Anchor text on internal links varies across recipe hubs to avoid over-optimization patterns Google penalizes. Exact-match anchor (“single-origin Ethiopian coffee”) runs on 20 to 30 percent of internal links. Partial-match variations (“our Ethiopian roast”) run on 30 to 40 percent. Branded anchors (the SKU name) run on 20 to 30 percent. Generic anchors (“shop the coffee”) fill the remaining 10 to 20 percent. This ratio holds ranking without triggering the over-optimization penalty that shows up on brands that anchor-text-stuff every internal link with the same exact-match keyword. Cross-reference the linking layer on our food and beverage web design page.
Link equity from ingredient guides to SKU pages
Link equity from ingredient guides passes to SKU pages when the guide’s comparison table names the hero SKU in the winning column with a product card, and when the guide’s body links to 3 to 6 recipes that use the winning ingredient. This 3-hop path (guide to recipe to SKU) pushes authority from a high-traffic informational query down to a high-intent transactional page. According to Search Engine Land SEO coverage, informational content that internally links to transactional pages produces 2 to 4 times higher organic revenue than isolated content silos.
Wrapping up content marketing for food brands
Content marketing for food brands is the organic engine that turns a DTC snack, drink, or CPG storefront into a search-driven revenue channel. Recipe hub of 40 to 100 recipes. Ingredient comparison guides at 12 to 24 pieces. Sourcing story pages at 6 to 12 pieces. Buyer intent content at 8 to 16 pieces. Creator syndication calendar with 12 to 30 creators per quarter. Refresh cadence at 12 to 24 months by pillar. Reporting with organic sessions and organic revenue attribution.
If your DTC food brand is running paid social at 20,000 dollars monthly with a broken blog and zero recipe schema, professional content marketing for food brands pays for itself inside the first 90 days on organic traffic captured. Redefine Web ships content marketing inside our monthly retainer packages. Book a call and we will walk through the last three DTC food brands we built recipe hubs for, pillar by pillar.
Content marketing for food brands starts with a recipe hub because recipe queries account for 40 to 60 percent of high-intent search volume in the food category. Every hero SKU needs 4 to 12 recipes anchored to it, each targeting a specific occasion and audience.
Skip the recipe hub and the brand loses the search real estate that pulls DTC storefront traffic month over month at zero incremental paid cost. Recipe traffic converts at 2 to 4 percent because the shopper landed with usage intent, not passive discovery, which is why food brands win on recipes.
Recipe schema and Google rich result eligibility
Every recipe page ships schema.org Recipe markup including cookTime, prepTime, recipeIngredient, recipeInstructions, nutrition, and aggregateRating. Correctly marked-up recipes qualify for Google’s recipe rich result carousel that pulls 3 to 6 times higher click-through rate than a plain blue link. The schema layer takes 15 minutes per recipe to author and 30 minutes to validate in Google Search Console. Cross-reference the recipe search stack on our food and beverage SEO page.
Recipe hub structure that scales
The recipe hub structure runs 40 to 100 recipes at maturity, organized by hero SKU (4 to 12 recipes per SKU) plus occasion tags (breakfast, weeknight dinner, meal prep, brunch, holiday). Every recipe links back to the hero SKU product page with the SKU embedded in an inline card. The hub earns internal linking value from ingredient comparison guides and the sourcing story pages, which feeds recipe ranking on Google. According to Google Search Central recipe structured data guidance, complete Recipe schema markup is required for eligibility in the recipe carousel and the ingredient search filter.
Pillar structure for food brand content marketing
The pillar structure on content marketing for food brands runs 4 content pillars concurrently: recipe hub (40 to 100 recipes), ingredient comparison guides (12 to 24 guides), sourcing story pages (6 to 12 pages), and buyer intent content (where to buy, subscription vs. one-time, gift bundle guides). Every pillar covers a distinct search intent and every pillar links back to the hero SKU product pages.
Ingredient comparison guide format
Ingredient comparison guides run 1,800 to 3,200 words comparing 2 to 4 ingredient types on 6 to 10 attributes with a comparison table, real-world use case examples, and links to the hero SKU that uses the specific ingredient. Example: organic vs. conventional oats compares nutritional profile, sourcing chain, cost, environmental impact, and taste on a 6-column table. The brand’s SKU appears in the winning column with a product card. These guides rank 3 to 8 months after publication and pull steady-state organic traffic.
Sourcing story pages that build trust
Sourcing story pages name the specific farms, cooperatives, or suppliers the brand sources from, with photos of the farms, farmer quotes, and specific harvest windows. A coffee brand’s Ethiopian farm page ranks for “single-origin Ethiopian coffee” and “Yirgacheffe coffee origin” plus 40 long-tail variations. The sourcing page pulls trust-building traffic that converts at 4 to 6 percent because the shopper landed pattern-matching on transparency and named provenance. Every sourcing page includes farmer or cooperative quotes, harvest dates, and a link back to 3 to 5 hero SKU pages that source from the named supplier.
Vejrø hospitality content case study
Vejrø Resort, a Danish private-island destination with an on-site restaurant focused on organic, locally sourced cuisine, joined us with strong social engagement and no organic-search real estate. Guests found the resort on Instagram but never in Google search for terms like “private island resort Denmark,” “farm-to-table hospitality Denmark,” or “Vejrø restaurant.” The same organic-search gap shows up on DTC food brands running paid social at 20,000 dollars monthly with a broken blog and zero recipe schema.
We built the conversion-focused website with on-site and off-site SEO tuned to the travel-niche keyword clusters, competitor analysis against comparable boutique resorts, and mobile-first design prioritizing guest discovery. Every page carried the structured data qualifying it for Google’s rich results in the hospitality category. Every internal link pushed authority toward the direct-booking conversion path.
Three months later, Vejrø hit 10,000 plus organic visitors, ranked for 200 plus first-page keywords, and pulled a 2.2 percent booking conversion rate from organic traffic. The same pattern applies to content marketing for food brands: recipe schema, ingredient comparison guides, and sourcing story pages pull organic traffic at 20 to 40 percent conversion into hero SKU pages inside 6 months when the content quality matches search intent and every page carries the right structured data markup. Vejrø also proved out the reporting discipline: every monthly report named the exact page, the exact keyword cluster, and the exact search feature (rich result, sitelinks, image pack) driving the incremental organic revenue instead of hiding behind aggregate traffic charts.
Recipe cadence and content calendar for food brands
Recipe cadence on a working food brand content calendar ships 2 to 4 new recipes per week during the first 6 months and drops to 1 per week at maturity. Each recipe takes 4 to 6 hours to produce (write, test in the kitchen, photograph, schema author, publish). At 3 recipes per week, the brand hits 78 recipes inside 6 months plus a backlog of ingredient comparison and sourcing content queued behind the recipe production line.
| Content pillar | Target volume year 1 | Production cost per piece | Refresh cadence |
|---|---|---|---|
| Recipe hub | 40 to 100 recipes | $180 to $320 | Every 12 months |
| Ingredient comparison guides | 12 to 24 guides | $450 to $780 | Every 18 months |
| Sourcing story pages | 6 to 12 pages | $680 to $1,200 | Every 24 months |
| Buyer intent content | 8 to 16 pieces | $220 to $420 | Every 12 months |
Photography as a content calendar constraint
Photography is the actual constraint on recipe cadence, not writing. Every recipe needs 6 to 12 photos: hero shot, ingredient flat lay, prep in progress, plated result, storage, and step shots for the schema markup. A working food brand batches photography 8 recipes at a time to keep the cost per recipe under 200 dollars. Skip the batching and the per-recipe cost climbs to 400 to 600 dollars, which caps recipe cadence at 1 per week and slows organic ranking timeline by 6 months.
Seasonal content calendar planning
Seasonal content calendar planning maps recipes and comparison guides to the seasonal windows they need to rank in. A Christmas cookie recipe needs to publish in September to rank by early December. A Valentine’s chocolate guide needs to publish in November to rank by early February. A back-to-school lunchbox recipe needs to publish in June to rank by late August. The 60-to-90-day ranking curve dictates the calendar.
Creator syndication inside food brand content
Creator syndication on food brand content marketing amplifies the recipe hub through Instagram Reels, TikTok, and YouTube Shorts creators paid to post their own version of the brand’s hero recipes. The creator content pulls net-new audiences into the recipe hub through the creator’s Link in Bio or Amazon Storefront tag. The syndication calendar names 12 to 30 creators per quarter with specific recipes assigned to each.
One brand we picked up had a spreadsheet titled “creator outreach 2023” with 47 rows and 3 responses. All 3 responses were auto-replies. The spreadsheet named zero recipes and offered flat rates below 100 dollars per post. Nobody posts a 30-second video for 87 dollars flat. Nobody.
Creator content commercial terms that work
Working creator content commercial terms run 350 to 1,500 dollars flat per post plus a 12 to 25 percent commission on tagged sales across a 30-day window. The commission mechanic pulls creators into follow-up posts because the incremental revenue continues past the initial fee. Mid-tier creators (30k to 150k followers) hit the sweet spot for food brand content because their engagement rate typically runs 4 to 8 percent versus 0.8 to 1.6 percent on mega-creators.
Content brief structure for creator partnerships
The content brief structure for creator partnerships runs a single page: the SKU, the specific recipe or usage occasion, 3 required brand mentions, 3 restricted claims (no health claims on non-medical SKUs), the pricing angle, the affiliate link, and 3 example videos that hit the tone. The brief avoids over-scripting because over-scripted creator content underperforms native creator voice by 40 to 60 percent on engagement rate.
Buyer intent content for food brand blogs
Buyer intent content on food brand blogs covers 8 to 16 pieces targeting explicit purchase-decision queries: “where to buy [brand],” “[brand] subscription vs. one-time,” “best [category] for [use case],” and “[brand] gift bundle.” Every buyer intent piece runs 1,400 to 2,400 words with a comparison table, product cards, and a clear conversion path to the specific SKU that matches the query intent. Buyer intent content converts at 3 to 6 percent versus 1 to 2 percent on recipe content because the shopper landed already planning to buy, not exploring a usage occasion.
Where-to-buy content structure
Where-to-buy content structure covers online (DTC storefront, Amazon, Target.com, Whole Foods online), retail (specific chain locators with the store finder embedded), and international (customs limitations, retailer partners abroad). Every piece names specific retailers, links to the store locator, and includes an FAQ block covering shipping availability, subscription options, and gift card compatibility. Where-to-buy content ranks for branded discovery queries the DTC storefront otherwise loses to competitor affiliate reviews.
Subscription versus one-time comparison content
Subscription versus one-time comparison content converts subscription commitments at 3 to 6 percent because it addresses the price-sensitivity concern head-on with a specific math table. The piece covers the discount structure (15 percent lifetime), the skip-a-month mechanic, the pause-anytime rule, the cancellation policy, and the specific yearly savings for the brand’s average consumption cadence. Cross-reference the retention structure on our food and beverage marketing retainer page.
Content refresh cadence on food brand pillars
Content refresh cadence on food brand content pillars runs a rolling audit every 12 to 24 months by pillar. Recipes get refreshed every 12 months with new photography, updated schema, and any nutrition or ingredient adjustments. Ingredient comparison guides refresh every 18 months to update market data. Sourcing story pages refresh every 24 months to reflect farm partnership changes and new harvest angles. Buyer intent content refreshes every 12 months to update retailer availability and pricing.
Recipe refresh priority order
Recipe refresh priority runs by organic traffic rank. The top 20 recipes by monthly organic sessions get refreshed first (new photography, schema audit, related recipe internal links, updated nutrition). The next 40 get refreshed at 15 months. The remaining recipes get refreshed opportunistically when the ranking slips past position 15 in Google. Skipping the refresh cadence lets recipe rankings drift out of the top 3 inside 18 months as newer competitor recipes take the position.
Schema audit checklist per refresh
The schema audit checklist per refresh runs 8 items: Recipe schema completeness, aggregateRating count and accuracy, nutrition data accuracy, prepTime and cookTime match the recipe body, image URLs valid at CDN, related recipe internal links working, product card SKU URL live, and Google Search Console rich result eligibility validated. This checklist takes 20 minutes per recipe and prevents the schema drift that costs recipe rankings 20 to 40 positions quietly.
Reporting cadence for food brand content marketing
Reporting cadence on food brand content marketing runs a monthly executive report plus a quarterly business review. The monthly report ships in the first business week and covers organic sessions by pillar, top 10 ranking recipes with position trend, ingredient guide ranking movements, sourcing page performance, and organic-attributed DTC revenue. Every number carries a comparison to the prior month and a plain-language interpretation the founder reads in 7 minutes.
Metrics that matter for content marketing
Metrics that matter for food brand content marketing: organic sessions by pillar, recipe rich result impressions in Search Console, organic conversion rate to hero SKU pages, organic-attributed DTC revenue, and top 20 ranking positions by monthly organic sessions. Vanity metrics that do not matter: total pageviews without conversion context, average time on page without conversion attribution, and social share counts. The monthly report skips the vanity block entirely.
Quarterly business review structure
The quarterly business review runs 90 minutes with the founder, head of content, and SEO lead. Agenda: organic traffic trend by pillar, top 10 winning content pieces, top 10 losing content pieces (candidates for refresh or removal), competitive gap analysis against 5 named competitor brands, and next quarter’s content calendar with recipes and ingredient guides queued. According to Ahrefs content marketing research, brands running quarterly content audits outperform brands running annual audits by 40 to 70 percent on organic revenue over a 24-month window.
Internal linking discipline across food brand content
Internal linking discipline across food brand content moves authority from recipe pages toward hero SKU product pages and comparison guides. Every recipe links to the hero SKU it uses inline (once in the ingredient list, once in a bottom call-out card). Every ingredient comparison guide links to 3 to 6 recipes using the winning ingredient plus the hero SKU product page. Every sourcing story links to the 2 to 4 SKUs sourced from that specific farm or cooperative.
Anchor text strategy across recipe hubs
Anchor text on internal links varies across recipe hubs to avoid over-optimization patterns Google penalizes. Exact-match anchor (“single-origin Ethiopian coffee”) runs on 20 to 30 percent of internal links. Partial-match variations (“our Ethiopian roast”) run on 30 to 40 percent. Branded anchors (the SKU name) run on 20 to 30 percent. Generic anchors (“shop the coffee”) fill the remaining 10 to 20 percent. This ratio holds ranking without triggering the over-optimization penalty that shows up on brands that anchor-text-stuff every internal link with the same exact-match keyword. Cross-reference the linking layer on our food and beverage web design page.
Link equity from ingredient guides to SKU pages
Link equity from ingredient guides passes to SKU pages when the guide’s comparison table names the hero SKU in the winning column with a product card, and when the guide’s body links to 3 to 6 recipes that use the winning ingredient. This 3-hop path (guide to recipe to SKU) pushes authority from a high-traffic informational query down to a high-intent transactional page. According to Search Engine Land SEO coverage, informational content that internally links to transactional pages produces 2 to 4 times higher organic revenue than isolated content silos.
Wrapping up content marketing for food brands
Content marketing for food brands is the organic engine that turns a DTC snack, drink, or CPG storefront into a search-driven revenue channel. Recipe hub of 40 to 100 recipes. Ingredient comparison guides at 12 to 24 pieces. Sourcing story pages at 6 to 12 pieces. Buyer intent content at 8 to 16 pieces. Creator syndication calendar with 12 to 30 creators per quarter. Refresh cadence at 12 to 24 months by pillar. Reporting with organic sessions and organic revenue attribution.
If your DTC food brand is running paid social at 20,000 dollars monthly with a broken blog and zero recipe schema, professional content marketing for food brands pays for itself inside the first 90 days on organic traffic captured. Redefine Web ships content marketing inside our monthly retainer packages. Book a call and we will walk through the last three DTC food brands we built recipe hubs for, pillar by pillar.
Internal linking discipline across food brand content moves authority from recipe pages toward hero SKU product pages and comparison guides. Every recipe links to the hero SKU it uses inline (once in the ingredient list, once in a bottom call-out card). Every ingredient comparison guide links to 3 to 6 recipes using the winning ingredient plus the hero SKU product page. Every sourcing story links to the 2 to 4 SKUs sourced from that specific farm or cooperative.
Anchor text strategy across recipe hubs
Anchor text on internal links varies across recipe hubs to avoid over-optimization patterns Google penalizes. Exact-match anchor (“single-origin Ethiopian coffee”) runs on 20 to 30 percent of internal links. Partial-match variations (“our Ethiopian roast”) run on 30 to 40 percent. Branded anchors (the SKU name) run on 20 to 30 percent. Generic anchors (“shop the coffee”) fill the remaining 10 to 20 percent. This ratio holds ranking without triggering the over-optimization penalty that shows up on brands that anchor-text-stuff every internal link with the same exact-match keyword. Cross-reference the linking layer on our food and beverage web design page.
Link equity from ingredient guides to SKU pages
Link equity from ingredient guides passes to SKU pages when the guide’s comparison table names the hero SKU in the winning column with a product card, and when the guide’s body links to 3 to 6 recipes that use the winning ingredient. This 3-hop path (guide to recipe to SKU) pushes authority from a high-traffic informational query down to a high-intent transactional page. According to Search Engine Land SEO coverage, informational content that internally links to transactional pages produces 2 to 4 times higher organic revenue than isolated content silos.
Wrapping up content marketing for food brands
Content marketing for food brands is the organic engine that turns a DTC snack, drink, or CPG storefront into a search-driven revenue channel. Recipe hub of 40 to 100 recipes. Ingredient comparison guides at 12 to 24 pieces. Sourcing story pages at 6 to 12 pieces. Buyer intent content at 8 to 16 pieces. Creator syndication calendar with 12 to 30 creators per quarter. Refresh cadence at 12 to 24 months by pillar. Reporting with organic sessions and organic revenue attribution.
If your DTC food brand is running paid social at 20,000 dollars monthly with a broken blog and zero recipe schema, professional content marketing for food brands pays for itself inside the first 90 days on organic traffic captured. Redefine Web ships content marketing inside our monthly retainer packages. Book a call and we will walk through the last three DTC food brands we built recipe hubs for, pillar by pillar.
Content marketing for food brands starts with a recipe hub because recipe queries account for 40 to 60 percent of high-intent search volume in the food category. Every hero SKU needs 4 to 12 recipes anchored to it, each targeting a specific occasion and audience.
Skip the recipe hub and the brand loses the search real estate that pulls DTC storefront traffic month over month at zero incremental paid cost. Recipe traffic converts at 2 to 4 percent because the shopper landed with usage intent, not passive discovery, which is why food brands win on recipes.
Recipe schema and Google rich result eligibility
Every recipe page ships schema.org Recipe markup including cookTime, prepTime, recipeIngredient, recipeInstructions, nutrition, and aggregateRating. Correctly marked-up recipes qualify for Google’s recipe rich result carousel that pulls 3 to 6 times higher click-through rate than a plain blue link. The schema layer takes 15 minutes per recipe to author and 30 minutes to validate in Google Search Console. Cross-reference the recipe search stack on our food and beverage SEO page.
Recipe hub structure that scales
The recipe hub structure runs 40 to 100 recipes at maturity, organized by hero SKU (4 to 12 recipes per SKU) plus occasion tags (breakfast, weeknight dinner, meal prep, brunch, holiday). Every recipe links back to the hero SKU product page with the SKU embedded in an inline card. The hub earns internal linking value from ingredient comparison guides and the sourcing story pages, which feeds recipe ranking on Google. According to Google Search Central recipe structured data guidance, complete Recipe schema markup is required for eligibility in the recipe carousel and the ingredient search filter.
Pillar structure for food brand content marketing
The pillar structure on content marketing for food brands runs 4 content pillars concurrently: recipe hub (40 to 100 recipes), ingredient comparison guides (12 to 24 guides), sourcing story pages (6 to 12 pages), and buyer intent content (where to buy, subscription vs. one-time, gift bundle guides). Every pillar covers a distinct search intent and every pillar links back to the hero SKU product pages.
Ingredient comparison guide format
Ingredient comparison guides run 1,800 to 3,200 words comparing 2 to 4 ingredient types on 6 to 10 attributes with a comparison table, real-world use case examples, and links to the hero SKU that uses the specific ingredient. Example: organic vs. conventional oats compares nutritional profile, sourcing chain, cost, environmental impact, and taste on a 6-column table. The brand’s SKU appears in the winning column with a product card. These guides rank 3 to 8 months after publication and pull steady-state organic traffic.
Sourcing story pages that build trust
Sourcing story pages name the specific farms, cooperatives, or suppliers the brand sources from, with photos of the farms, farmer quotes, and specific harvest windows. A coffee brand’s Ethiopian farm page ranks for “single-origin Ethiopian coffee” and “Yirgacheffe coffee origin” plus 40 long-tail variations. The sourcing page pulls trust-building traffic that converts at 4 to 6 percent because the shopper landed pattern-matching on transparency and named provenance. Every sourcing page includes farmer or cooperative quotes, harvest dates, and a link back to 3 to 5 hero SKU pages that source from the named supplier.
Vejrø hospitality content case study
Vejrø Resort, a Danish private-island destination with an on-site restaurant focused on organic, locally sourced cuisine, joined us with strong social engagement and no organic-search real estate. Guests found the resort on Instagram but never in Google search for terms like “private island resort Denmark,” “farm-to-table hospitality Denmark,” or “Vejrø restaurant.” The same organic-search gap shows up on DTC food brands running paid social at 20,000 dollars monthly with a broken blog and zero recipe schema.
We built the conversion-focused website with on-site and off-site SEO tuned to the travel-niche keyword clusters, competitor analysis against comparable boutique resorts, and mobile-first design prioritizing guest discovery. Every page carried the structured data qualifying it for Google’s rich results in the hospitality category. Every internal link pushed authority toward the direct-booking conversion path.
Three months later, Vejrø hit 10,000 plus organic visitors, ranked for 200 plus first-page keywords, and pulled a 2.2 percent booking conversion rate from organic traffic. The same pattern applies to content marketing for food brands: recipe schema, ingredient comparison guides, and sourcing story pages pull organic traffic at 20 to 40 percent conversion into hero SKU pages inside 6 months when the content quality matches search intent and every page carries the right structured data markup. Vejrø also proved out the reporting discipline: every monthly report named the exact page, the exact keyword cluster, and the exact search feature (rich result, sitelinks, image pack) driving the incremental organic revenue instead of hiding behind aggregate traffic charts.
Recipe cadence and content calendar for food brands
Recipe cadence on a working food brand content calendar ships 2 to 4 new recipes per week during the first 6 months and drops to 1 per week at maturity. Each recipe takes 4 to 6 hours to produce (write, test in the kitchen, photograph, schema author, publish). At 3 recipes per week, the brand hits 78 recipes inside 6 months plus a backlog of ingredient comparison and sourcing content queued behind the recipe production line.
| Content pillar | Target volume year 1 | Production cost per piece | Refresh cadence |
|---|---|---|---|
| Recipe hub | 40 to 100 recipes | $180 to $320 | Every 12 months |
| Ingredient comparison guides | 12 to 24 guides | $450 to $780 | Every 18 months |
| Sourcing story pages | 6 to 12 pages | $680 to $1,200 | Every 24 months |
| Buyer intent content | 8 to 16 pieces | $220 to $420 | Every 12 months |
Photography as a content calendar constraint
Photography is the actual constraint on recipe cadence, not writing. Every recipe needs 6 to 12 photos: hero shot, ingredient flat lay, prep in progress, plated result, storage, and step shots for the schema markup. A working food brand batches photography 8 recipes at a time to keep the cost per recipe under 200 dollars. Skip the batching and the per-recipe cost climbs to 400 to 600 dollars, which caps recipe cadence at 1 per week and slows organic ranking timeline by 6 months.
Seasonal content calendar planning
Seasonal content calendar planning maps recipes and comparison guides to the seasonal windows they need to rank in. A Christmas cookie recipe needs to publish in September to rank by early December. A Valentine’s chocolate guide needs to publish in November to rank by early February. A back-to-school lunchbox recipe needs to publish in June to rank by late August. The 60-to-90-day ranking curve dictates the calendar.
Creator syndication inside food brand content
Creator syndication on food brand content marketing amplifies the recipe hub through Instagram Reels, TikTok, and YouTube Shorts creators paid to post their own version of the brand’s hero recipes. The creator content pulls net-new audiences into the recipe hub through the creator’s Link in Bio or Amazon Storefront tag. The syndication calendar names 12 to 30 creators per quarter with specific recipes assigned to each.
One brand we picked up had a spreadsheet titled “creator outreach 2023” with 47 rows and 3 responses. All 3 responses were auto-replies. The spreadsheet named zero recipes and offered flat rates below 100 dollars per post. Nobody posts a 30-second video for 87 dollars flat. Nobody.
Creator content commercial terms that work
Working creator content commercial terms run 350 to 1,500 dollars flat per post plus a 12 to 25 percent commission on tagged sales across a 30-day window. The commission mechanic pulls creators into follow-up posts because the incremental revenue continues past the initial fee. Mid-tier creators (30k to 150k followers) hit the sweet spot for food brand content because their engagement rate typically runs 4 to 8 percent versus 0.8 to 1.6 percent on mega-creators.
Content brief structure for creator partnerships
The content brief structure for creator partnerships runs a single page: the SKU, the specific recipe or usage occasion, 3 required brand mentions, 3 restricted claims (no health claims on non-medical SKUs), the pricing angle, the affiliate link, and 3 example videos that hit the tone. The brief avoids over-scripting because over-scripted creator content underperforms native creator voice by 40 to 60 percent on engagement rate.
Buyer intent content for food brand blogs
Buyer intent content on food brand blogs covers 8 to 16 pieces targeting explicit purchase-decision queries: “where to buy [brand],” “[brand] subscription vs. one-time,” “best [category] for [use case],” and “[brand] gift bundle.” Every buyer intent piece runs 1,400 to 2,400 words with a comparison table, product cards, and a clear conversion path to the specific SKU that matches the query intent. Buyer intent content converts at 3 to 6 percent versus 1 to 2 percent on recipe content because the shopper landed already planning to buy, not exploring a usage occasion.
Where-to-buy content structure
Where-to-buy content structure covers online (DTC storefront, Amazon, Target.com, Whole Foods online), retail (specific chain locators with the store finder embedded), and international (customs limitations, retailer partners abroad). Every piece names specific retailers, links to the store locator, and includes an FAQ block covering shipping availability, subscription options, and gift card compatibility. Where-to-buy content ranks for branded discovery queries the DTC storefront otherwise loses to competitor affiliate reviews.
Subscription versus one-time comparison content
Subscription versus one-time comparison content converts subscription commitments at 3 to 6 percent because it addresses the price-sensitivity concern head-on with a specific math table. The piece covers the discount structure (15 percent lifetime), the skip-a-month mechanic, the pause-anytime rule, the cancellation policy, and the specific yearly savings for the brand’s average consumption cadence. Cross-reference the retention structure on our food and beverage marketing retainer page.
Content refresh cadence on food brand pillars
Content refresh cadence on food brand content pillars runs a rolling audit every 12 to 24 months by pillar. Recipes get refreshed every 12 months with new photography, updated schema, and any nutrition or ingredient adjustments. Ingredient comparison guides refresh every 18 months to update market data. Sourcing story pages refresh every 24 months to reflect farm partnership changes and new harvest angles. Buyer intent content refreshes every 12 months to update retailer availability and pricing.
Recipe refresh priority order
Recipe refresh priority runs by organic traffic rank. The top 20 recipes by monthly organic sessions get refreshed first (new photography, schema audit, related recipe internal links, updated nutrition). The next 40 get refreshed at 15 months. The remaining recipes get refreshed opportunistically when the ranking slips past position 15 in Google. Skipping the refresh cadence lets recipe rankings drift out of the top 3 inside 18 months as newer competitor recipes take the position.
Schema audit checklist per refresh
The schema audit checklist per refresh runs 8 items: Recipe schema completeness, aggregateRating count and accuracy, nutrition data accuracy, prepTime and cookTime match the recipe body, image URLs valid at CDN, related recipe internal links working, product card SKU URL live, and Google Search Console rich result eligibility validated. This checklist takes 20 minutes per recipe and prevents the schema drift that costs recipe rankings 20 to 40 positions quietly.
Reporting cadence for food brand content marketing
Reporting cadence on food brand content marketing runs a monthly executive report plus a quarterly business review. The monthly report ships in the first business week and covers organic sessions by pillar, top 10 ranking recipes with position trend, ingredient guide ranking movements, sourcing page performance, and organic-attributed DTC revenue. Every number carries a comparison to the prior month and a plain-language interpretation the founder reads in 7 minutes.
Metrics that matter for content marketing
Metrics that matter for food brand content marketing: organic sessions by pillar, recipe rich result impressions in Search Console, organic conversion rate to hero SKU pages, organic-attributed DTC revenue, and top 20 ranking positions by monthly organic sessions. Vanity metrics that do not matter: total pageviews without conversion context, average time on page without conversion attribution, and social share counts. The monthly report skips the vanity block entirely.
Quarterly business review structure
The quarterly business review runs 90 minutes with the founder, head of content, and SEO lead. Agenda: organic traffic trend by pillar, top 10 winning content pieces, top 10 losing content pieces (candidates for refresh or removal), competitive gap analysis against 5 named competitor brands, and next quarter’s content calendar with recipes and ingredient guides queued. According to Ahrefs content marketing research, brands running quarterly content audits outperform brands running annual audits by 40 to 70 percent on organic revenue over a 24-month window.
Internal linking discipline across food brand content
Internal linking discipline across food brand content moves authority from recipe pages toward hero SKU product pages and comparison guides. Every recipe links to the hero SKU it uses inline (once in the ingredient list, once in a bottom call-out card). Every ingredient comparison guide links to 3 to 6 recipes using the winning ingredient plus the hero SKU product page. Every sourcing story links to the 2 to 4 SKUs sourced from that specific farm or cooperative.
Anchor text strategy across recipe hubs
Anchor text on internal links varies across recipe hubs to avoid over-optimization patterns Google penalizes. Exact-match anchor (“single-origin Ethiopian coffee”) runs on 20 to 30 percent of internal links. Partial-match variations (“our Ethiopian roast”) run on 30 to 40 percent. Branded anchors (the SKU name) run on 20 to 30 percent. Generic anchors (“shop the coffee”) fill the remaining 10 to 20 percent. This ratio holds ranking without triggering the over-optimization penalty that shows up on brands that anchor-text-stuff every internal link with the same exact-match keyword. Cross-reference the linking layer on our food and beverage web design page.
Link equity from ingredient guides to SKU pages
Link equity from ingredient guides passes to SKU pages when the guide’s comparison table names the hero SKU in the winning column with a product card, and when the guide’s body links to 3 to 6 recipes that use the winning ingredient. This 3-hop path (guide to recipe to SKU) pushes authority from a high-traffic informational query down to a high-intent transactional page. According to Search Engine Land SEO coverage, informational content that internally links to transactional pages produces 2 to 4 times higher organic revenue than isolated content silos.
Wrapping up content marketing for food brands
Content marketing for food brands is the organic engine that turns a DTC snack, drink, or CPG storefront into a search-driven revenue channel. Recipe hub of 40 to 100 recipes. Ingredient comparison guides at 12 to 24 pieces. Sourcing story pages at 6 to 12 pieces. Buyer intent content at 8 to 16 pieces. Creator syndication calendar with 12 to 30 creators per quarter. Refresh cadence at 12 to 24 months by pillar. Reporting with organic sessions and organic revenue attribution.
If your DTC food brand is running paid social at 20,000 dollars monthly with a broken blog and zero recipe schema, professional content marketing for food brands pays for itself inside the first 90 days on organic traffic captured. Redefine Web ships content marketing inside our monthly retainer packages. Book a call and we will walk through the last three DTC food brands we built recipe hubs for, pillar by pillar.
Content marketing for food brands starts with a recipe hub because recipe queries account for 40 to 60 percent of high-intent search volume in the food category. Every hero SKU needs 4 to 12 recipes anchored to it, each targeting a specific occasion and audience.
Skip the recipe hub and the brand loses the search real estate that pulls DTC storefront traffic month over month at zero incremental paid cost. Recipe traffic converts at 2 to 4 percent because the shopper landed with usage intent, not passive discovery, which is why food brands win on recipes.
Recipe schema and Google rich result eligibility
Every recipe page ships schema.org Recipe markup including cookTime, prepTime, recipeIngredient, recipeInstructions, nutrition, and aggregateRating. Correctly marked-up recipes qualify for Google’s recipe rich result carousel that pulls 3 to 6 times higher click-through rate than a plain blue link. The schema layer takes 15 minutes per recipe to author and 30 minutes to validate in Google Search Console. Cross-reference the recipe search stack on our food and beverage SEO page.
Recipe hub structure that scales
The recipe hub structure runs 40 to 100 recipes at maturity, organized by hero SKU (4 to 12 recipes per SKU) plus occasion tags (breakfast, weeknight dinner, meal prep, brunch, holiday). Every recipe links back to the hero SKU product page with the SKU embedded in an inline card. The hub earns internal linking value from ingredient comparison guides and the sourcing story pages, which feeds recipe ranking on Google. According to Google Search Central recipe structured data guidance, complete Recipe schema markup is required for eligibility in the recipe carousel and the ingredient search filter.
Pillar structure for food brand content marketing
The pillar structure on content marketing for food brands runs 4 content pillars concurrently: recipe hub (40 to 100 recipes), ingredient comparison guides (12 to 24 guides), sourcing story pages (6 to 12 pages), and buyer intent content (where to buy, subscription vs. one-time, gift bundle guides). Every pillar covers a distinct search intent and every pillar links back to the hero SKU product pages.
Ingredient comparison guide format
Ingredient comparison guides run 1,800 to 3,200 words comparing 2 to 4 ingredient types on 6 to 10 attributes with a comparison table, real-world use case examples, and links to the hero SKU that uses the specific ingredient. Example: organic vs. conventional oats compares nutritional profile, sourcing chain, cost, environmental impact, and taste on a 6-column table. The brand’s SKU appears in the winning column with a product card. These guides rank 3 to 8 months after publication and pull steady-state organic traffic.
Sourcing story pages that build trust
Sourcing story pages name the specific farms, cooperatives, or suppliers the brand sources from, with photos of the farms, farmer quotes, and specific harvest windows. A coffee brand’s Ethiopian farm page ranks for “single-origin Ethiopian coffee” and “Yirgacheffe coffee origin” plus 40 long-tail variations. The sourcing page pulls trust-building traffic that converts at 4 to 6 percent because the shopper landed pattern-matching on transparency and named provenance. Every sourcing page includes farmer or cooperative quotes, harvest dates, and a link back to 3 to 5 hero SKU pages that source from the named supplier.
Vejrø hospitality content case study
Vejrø Resort, a Danish private-island destination with an on-site restaurant focused on organic, locally sourced cuisine, joined us with strong social engagement and no organic-search real estate. Guests found the resort on Instagram but never in Google search for terms like “private island resort Denmark,” “farm-to-table hospitality Denmark,” or “Vejrø restaurant.” The same organic-search gap shows up on DTC food brands running paid social at 20,000 dollars monthly with a broken blog and zero recipe schema.
We built the conversion-focused website with on-site and off-site SEO tuned to the travel-niche keyword clusters, competitor analysis against comparable boutique resorts, and mobile-first design prioritizing guest discovery. Every page carried the structured data qualifying it for Google’s rich results in the hospitality category. Every internal link pushed authority toward the direct-booking conversion path.
Three months later, Vejrø hit 10,000 plus organic visitors, ranked for 200 plus first-page keywords, and pulled a 2.2 percent booking conversion rate from organic traffic. The same pattern applies to content marketing for food brands: recipe schema, ingredient comparison guides, and sourcing story pages pull organic traffic at 20 to 40 percent conversion into hero SKU pages inside 6 months when the content quality matches search intent and every page carries the right structured data markup. Vejrø also proved out the reporting discipline: every monthly report named the exact page, the exact keyword cluster, and the exact search feature (rich result, sitelinks, image pack) driving the incremental organic revenue instead of hiding behind aggregate traffic charts.
Recipe cadence and content calendar for food brands
Recipe cadence on a working food brand content calendar ships 2 to 4 new recipes per week during the first 6 months and drops to 1 per week at maturity. Each recipe takes 4 to 6 hours to produce (write, test in the kitchen, photograph, schema author, publish). At 3 recipes per week, the brand hits 78 recipes inside 6 months plus a backlog of ingredient comparison and sourcing content queued behind the recipe production line.
| Content pillar | Target volume year 1 | Production cost per piece | Refresh cadence |
|---|---|---|---|
| Recipe hub | 40 to 100 recipes | $180 to $320 | Every 12 months |
| Ingredient comparison guides | 12 to 24 guides | $450 to $780 | Every 18 months |
| Sourcing story pages | 6 to 12 pages | $680 to $1,200 | Every 24 months |
| Buyer intent content | 8 to 16 pieces | $220 to $420 | Every 12 months |
Photography as a content calendar constraint
Photography is the actual constraint on recipe cadence, not writing. Every recipe needs 6 to 12 photos: hero shot, ingredient flat lay, prep in progress, plated result, storage, and step shots for the schema markup. A working food brand batches photography 8 recipes at a time to keep the cost per recipe under 200 dollars. Skip the batching and the per-recipe cost climbs to 400 to 600 dollars, which caps recipe cadence at 1 per week and slows organic ranking timeline by 6 months.
Seasonal content calendar planning
Seasonal content calendar planning maps recipes and comparison guides to the seasonal windows they need to rank in. A Christmas cookie recipe needs to publish in September to rank by early December. A Valentine’s chocolate guide needs to publish in November to rank by early February. A back-to-school lunchbox recipe needs to publish in June to rank by late August. The 60-to-90-day ranking curve dictates the calendar.
Creator syndication inside food brand content
Creator syndication on food brand content marketing amplifies the recipe hub through Instagram Reels, TikTok, and YouTube Shorts creators paid to post their own version of the brand’s hero recipes. The creator content pulls net-new audiences into the recipe hub through the creator’s Link in Bio or Amazon Storefront tag. The syndication calendar names 12 to 30 creators per quarter with specific recipes assigned to each.
One brand we picked up had a spreadsheet titled “creator outreach 2023” with 47 rows and 3 responses. All 3 responses were auto-replies. The spreadsheet named zero recipes and offered flat rates below 100 dollars per post. Nobody posts a 30-second video for 87 dollars flat. Nobody.
Creator content commercial terms that work
Working creator content commercial terms run 350 to 1,500 dollars flat per post plus a 12 to 25 percent commission on tagged sales across a 30-day window. The commission mechanic pulls creators into follow-up posts because the incremental revenue continues past the initial fee. Mid-tier creators (30k to 150k followers) hit the sweet spot for food brand content because their engagement rate typically runs 4 to 8 percent versus 0.8 to 1.6 percent on mega-creators.
Content brief structure for creator partnerships
The content brief structure for creator partnerships runs a single page: the SKU, the specific recipe or usage occasion, 3 required brand mentions, 3 restricted claims (no health claims on non-medical SKUs), the pricing angle, the affiliate link, and 3 example videos that hit the tone. The brief avoids over-scripting because over-scripted creator content underperforms native creator voice by 40 to 60 percent on engagement rate.
Buyer intent content for food brand blogs
Buyer intent content on food brand blogs covers 8 to 16 pieces targeting explicit purchase-decision queries: “where to buy [brand],” “[brand] subscription vs. one-time,” “best [category] for [use case],” and “[brand] gift bundle.” Every buyer intent piece runs 1,400 to 2,400 words with a comparison table, product cards, and a clear conversion path to the specific SKU that matches the query intent. Buyer intent content converts at 3 to 6 percent versus 1 to 2 percent on recipe content because the shopper landed already planning to buy, not exploring a usage occasion.
Where-to-buy content structure
Where-to-buy content structure covers online (DTC storefront, Amazon, Target.com, Whole Foods online), retail (specific chain locators with the store finder embedded), and international (customs limitations, retailer partners abroad). Every piece names specific retailers, links to the store locator, and includes an FAQ block covering shipping availability, subscription options, and gift card compatibility. Where-to-buy content ranks for branded discovery queries the DTC storefront otherwise loses to competitor affiliate reviews.
Subscription versus one-time comparison content
Subscription versus one-time comparison content converts subscription commitments at 3 to 6 percent because it addresses the price-sensitivity concern head-on with a specific math table. The piece covers the discount structure (15 percent lifetime), the skip-a-month mechanic, the pause-anytime rule, the cancellation policy, and the specific yearly savings for the brand’s average consumption cadence. Cross-reference the retention structure on our food and beverage marketing retainer page.
Content refresh cadence on food brand pillars
Content refresh cadence on food brand content pillars runs a rolling audit every 12 to 24 months by pillar. Recipes get refreshed every 12 months with new photography, updated schema, and any nutrition or ingredient adjustments. Ingredient comparison guides refresh every 18 months to update market data. Sourcing story pages refresh every 24 months to reflect farm partnership changes and new harvest angles. Buyer intent content refreshes every 12 months to update retailer availability and pricing.
Recipe refresh priority order
Recipe refresh priority runs by organic traffic rank. The top 20 recipes by monthly organic sessions get refreshed first (new photography, schema audit, related recipe internal links, updated nutrition). The next 40 get refreshed at 15 months. The remaining recipes get refreshed opportunistically when the ranking slips past position 15 in Google. Skipping the refresh cadence lets recipe rankings drift out of the top 3 inside 18 months as newer competitor recipes take the position.
Schema audit checklist per refresh
The schema audit checklist per refresh runs 8 items: Recipe schema completeness, aggregateRating count and accuracy, nutrition data accuracy, prepTime and cookTime match the recipe body, image URLs valid at CDN, related recipe internal links working, product card SKU URL live, and Google Search Console rich result eligibility validated. This checklist takes 20 minutes per recipe and prevents the schema drift that costs recipe rankings 20 to 40 positions quietly.
Reporting cadence for food brand content marketing
Reporting cadence on food brand content marketing runs a monthly executive report plus a quarterly business review. The monthly report ships in the first business week and covers organic sessions by pillar, top 10 ranking recipes with position trend, ingredient guide ranking movements, sourcing page performance, and organic-attributed DTC revenue. Every number carries a comparison to the prior month and a plain-language interpretation the founder reads in 7 minutes.
Metrics that matter for content marketing
Metrics that matter for food brand content marketing: organic sessions by pillar, recipe rich result impressions in Search Console, organic conversion rate to hero SKU pages, organic-attributed DTC revenue, and top 20 ranking positions by monthly organic sessions. Vanity metrics that do not matter: total pageviews without conversion context, average time on page without conversion attribution, and social share counts. The monthly report skips the vanity block entirely.
Quarterly business review structure
The quarterly business review runs 90 minutes with the founder, head of content, and SEO lead. Agenda: organic traffic trend by pillar, top 10 winning content pieces, top 10 losing content pieces (candidates for refresh or removal), competitive gap analysis against 5 named competitor brands, and next quarter’s content calendar with recipes and ingredient guides queued. According to Ahrefs content marketing research, brands running quarterly content audits outperform brands running annual audits by 40 to 70 percent on organic revenue over a 24-month window.
Internal linking discipline across food brand content
Internal linking discipline across food brand content moves authority from recipe pages toward hero SKU product pages and comparison guides. Every recipe links to the hero SKU it uses inline (once in the ingredient list, once in a bottom call-out card). Every ingredient comparison guide links to 3 to 6 recipes using the winning ingredient plus the hero SKU product page. Every sourcing story links to the 2 to 4 SKUs sourced from that specific farm or cooperative.
Anchor text strategy across recipe hubs
Anchor text on internal links varies across recipe hubs to avoid over-optimization patterns Google penalizes. Exact-match anchor (“single-origin Ethiopian coffee”) runs on 20 to 30 percent of internal links. Partial-match variations (“our Ethiopian roast”) run on 30 to 40 percent. Branded anchors (the SKU name) run on 20 to 30 percent. Generic anchors (“shop the coffee”) fill the remaining 10 to 20 percent. This ratio holds ranking without triggering the over-optimization penalty that shows up on brands that anchor-text-stuff every internal link with the same exact-match keyword. Cross-reference the linking layer on our food and beverage web design page.
Link equity from ingredient guides to SKU pages
Link equity from ingredient guides passes to SKU pages when the guide’s comparison table names the hero SKU in the winning column with a product card, and when the guide’s body links to 3 to 6 recipes that use the winning ingredient. This 3-hop path (guide to recipe to SKU) pushes authority from a high-traffic informational query down to a high-intent transactional page. According to Search Engine Land SEO coverage, informational content that internally links to transactional pages produces 2 to 4 times higher organic revenue than isolated content silos.
Wrapping up content marketing for food brands
Content marketing for food brands is the organic engine that turns a DTC snack, drink, or CPG storefront into a search-driven revenue channel. Recipe hub of 40 to 100 recipes. Ingredient comparison guides at 12 to 24 pieces. Sourcing story pages at 6 to 12 pieces. Buyer intent content at 8 to 16 pieces. Creator syndication calendar with 12 to 30 creators per quarter. Refresh cadence at 12 to 24 months by pillar. Reporting with organic sessions and organic revenue attribution.
If your DTC food brand is running paid social at 20,000 dollars monthly with a broken blog and zero recipe schema, professional content marketing for food brands pays for itself inside the first 90 days on organic traffic captured. Redefine Web ships content marketing inside our monthly retainer packages. Book a call and we will walk through the last three DTC food brands we built recipe hubs for, pillar by pillar.
Content marketing for food brands starts with a recipe hub because recipe queries account for 40 to 60 percent of high-intent search volume in the food category. Every hero SKU needs 4 to 12 recipes anchored to it, each targeting a specific occasion and audience.
Skip the recipe hub and the brand loses the search real estate that pulls DTC storefront traffic month over month at zero incremental paid cost. Recipe traffic converts at 2 to 4 percent because the shopper landed with usage intent, not passive discovery, which is why food brands win on recipes.
Recipe schema and Google rich result eligibility
Every recipe page ships schema.org Recipe markup including cookTime, prepTime, recipeIngredient, recipeInstructions, nutrition, and aggregateRating. Correctly marked-up recipes qualify for Google’s recipe rich result carousel that pulls 3 to 6 times higher click-through rate than a plain blue link. The schema layer takes 15 minutes per recipe to author and 30 minutes to validate in Google Search Console. Cross-reference the recipe search stack on our food and beverage SEO page.
Recipe hub structure that scales
The recipe hub structure runs 40 to 100 recipes at maturity, organized by hero SKU (4 to 12 recipes per SKU) plus occasion tags (breakfast, weeknight dinner, meal prep, brunch, holiday). Every recipe links back to the hero SKU product page with the SKU embedded in an inline card. The hub earns internal linking value from ingredient comparison guides and the sourcing story pages, which feeds recipe ranking on Google. According to Google Search Central recipe structured data guidance, complete Recipe schema markup is required for eligibility in the recipe carousel and the ingredient search filter.
Pillar structure for food brand content marketing
The pillar structure on content marketing for food brands runs 4 content pillars concurrently: recipe hub (40 to 100 recipes), ingredient comparison guides (12 to 24 guides), sourcing story pages (6 to 12 pages), and buyer intent content (where to buy, subscription vs. one-time, gift bundle guides). Every pillar covers a distinct search intent and every pillar links back to the hero SKU product pages.
Ingredient comparison guide format
Ingredient comparison guides run 1,800 to 3,200 words comparing 2 to 4 ingredient types on 6 to 10 attributes with a comparison table, real-world use case examples, and links to the hero SKU that uses the specific ingredient. Example: organic vs. conventional oats compares nutritional profile, sourcing chain, cost, environmental impact, and taste on a 6-column table. The brand’s SKU appears in the winning column with a product card. These guides rank 3 to 8 months after publication and pull steady-state organic traffic.
Sourcing story pages that build trust
Sourcing story pages name the specific farms, cooperatives, or suppliers the brand sources from, with photos of the farms, farmer quotes, and specific harvest windows. A coffee brand’s Ethiopian farm page ranks for “single-origin Ethiopian coffee” and “Yirgacheffe coffee origin” plus 40 long-tail variations. The sourcing page pulls trust-building traffic that converts at 4 to 6 percent because the shopper landed pattern-matching on transparency and named provenance. Every sourcing page includes farmer or cooperative quotes, harvest dates, and a link back to 3 to 5 hero SKU pages that source from the named supplier.
Vejrø hospitality content case study
Vejrø Resort, a Danish private-island destination with an on-site restaurant focused on organic, locally sourced cuisine, joined us with strong social engagement and no organic-search real estate. Guests found the resort on Instagram but never in Google search for terms like “private island resort Denmark,” “farm-to-table hospitality Denmark,” or “Vejrø restaurant.” The same organic-search gap shows up on DTC food brands running paid social at 20,000 dollars monthly with a broken blog and zero recipe schema.
We built the conversion-focused website with on-site and off-site SEO tuned to the travel-niche keyword clusters, competitor analysis against comparable boutique resorts, and mobile-first design prioritizing guest discovery. Every page carried the structured data qualifying it for Google’s rich results in the hospitality category. Every internal link pushed authority toward the direct-booking conversion path.
Three months later, Vejrø hit 10,000 plus organic visitors, ranked for 200 plus first-page keywords, and pulled a 2.2 percent booking conversion rate from organic traffic. The same pattern applies to content marketing for food brands: recipe schema, ingredient comparison guides, and sourcing story pages pull organic traffic at 20 to 40 percent conversion into hero SKU pages inside 6 months when the content quality matches search intent and every page carries the right structured data markup. Vejrø also proved out the reporting discipline: every monthly report named the exact page, the exact keyword cluster, and the exact search feature (rich result, sitelinks, image pack) driving the incremental organic revenue instead of hiding behind aggregate traffic charts.
Recipe cadence and content calendar for food brands
Recipe cadence on a working food brand content calendar ships 2 to 4 new recipes per week during the first 6 months and drops to 1 per week at maturity. Each recipe takes 4 to 6 hours to produce (write, test in the kitchen, photograph, schema author, publish). At 3 recipes per week, the brand hits 78 recipes inside 6 months plus a backlog of ingredient comparison and sourcing content queued behind the recipe production line.
| Content pillar | Target volume year 1 | Production cost per piece | Refresh cadence |
|---|---|---|---|
| Recipe hub | 40 to 100 recipes | $180 to $320 | Every 12 months |
| Ingredient comparison guides | 12 to 24 guides | $450 to $780 | Every 18 months |
| Sourcing story pages | 6 to 12 pages | $680 to $1,200 | Every 24 months |
| Buyer intent content | 8 to 16 pieces | $220 to $420 | Every 12 months |
Photography as a content calendar constraint
Photography is the actual constraint on recipe cadence, not writing. Every recipe needs 6 to 12 photos: hero shot, ingredient flat lay, prep in progress, plated result, storage, and step shots for the schema markup. A working food brand batches photography 8 recipes at a time to keep the cost per recipe under 200 dollars. Skip the batching and the per-recipe cost climbs to 400 to 600 dollars, which caps recipe cadence at 1 per week and slows organic ranking timeline by 6 months.
Seasonal content calendar planning
Seasonal content calendar planning maps recipes and comparison guides to the seasonal windows they need to rank in. A Christmas cookie recipe needs to publish in September to rank by early December. A Valentine’s chocolate guide needs to publish in November to rank by early February. A back-to-school lunchbox recipe needs to publish in June to rank by late August. The 60-to-90-day ranking curve dictates the calendar.
Creator syndication inside food brand content
Creator syndication on food brand content marketing amplifies the recipe hub through Instagram Reels, TikTok, and YouTube Shorts creators paid to post their own version of the brand’s hero recipes. The creator content pulls net-new audiences into the recipe hub through the creator’s Link in Bio or Amazon Storefront tag. The syndication calendar names 12 to 30 creators per quarter with specific recipes assigned to each.
One brand we picked up had a spreadsheet titled “creator outreach 2023” with 47 rows and 3 responses. All 3 responses were auto-replies. The spreadsheet named zero recipes and offered flat rates below 100 dollars per post. Nobody posts a 30-second video for 87 dollars flat. Nobody.
Creator content commercial terms that work
Working creator content commercial terms run 350 to 1,500 dollars flat per post plus a 12 to 25 percent commission on tagged sales across a 30-day window. The commission mechanic pulls creators into follow-up posts because the incremental revenue continues past the initial fee. Mid-tier creators (30k to 150k followers) hit the sweet spot for food brand content because their engagement rate typically runs 4 to 8 percent versus 0.8 to 1.6 percent on mega-creators.
Content brief structure for creator partnerships
The content brief structure for creator partnerships runs a single page: the SKU, the specific recipe or usage occasion, 3 required brand mentions, 3 restricted claims (no health claims on non-medical SKUs), the pricing angle, the affiliate link, and 3 example videos that hit the tone. The brief avoids over-scripting because over-scripted creator content underperforms native creator voice by 40 to 60 percent on engagement rate.
Buyer intent content for food brand blogs
Buyer intent content on food brand blogs covers 8 to 16 pieces targeting explicit purchase-decision queries: “where to buy [brand],” “[brand] subscription vs. one-time,” “best [category] for [use case],” and “[brand] gift bundle.” Every buyer intent piece runs 1,400 to 2,400 words with a comparison table, product cards, and a clear conversion path to the specific SKU that matches the query intent. Buyer intent content converts at 3 to 6 percent versus 1 to 2 percent on recipe content because the shopper landed already planning to buy, not exploring a usage occasion.
Where-to-buy content structure
Where-to-buy content structure covers online (DTC storefront, Amazon, Target.com, Whole Foods online), retail (specific chain locators with the store finder embedded), and international (customs limitations, retailer partners abroad). Every piece names specific retailers, links to the store locator, and includes an FAQ block covering shipping availability, subscription options, and gift card compatibility. Where-to-buy content ranks for branded discovery queries the DTC storefront otherwise loses to competitor affiliate reviews.
Subscription versus one-time comparison content
Subscription versus one-time comparison content converts subscription commitments at 3 to 6 percent because it addresses the price-sensitivity concern head-on with a specific math table. The piece covers the discount structure (15 percent lifetime), the skip-a-month mechanic, the pause-anytime rule, the cancellation policy, and the specific yearly savings for the brand’s average consumption cadence. Cross-reference the retention structure on our food and beverage marketing retainer page.
Content refresh cadence on food brand pillars
Content refresh cadence on food brand content pillars runs a rolling audit every 12 to 24 months by pillar. Recipes get refreshed every 12 months with new photography, updated schema, and any nutrition or ingredient adjustments. Ingredient comparison guides refresh every 18 months to update market data. Sourcing story pages refresh every 24 months to reflect farm partnership changes and new harvest angles. Buyer intent content refreshes every 12 months to update retailer availability and pricing.
Recipe refresh priority order
Recipe refresh priority runs by organic traffic rank. The top 20 recipes by monthly organic sessions get refreshed first (new photography, schema audit, related recipe internal links, updated nutrition). The next 40 get refreshed at 15 months. The remaining recipes get refreshed opportunistically when the ranking slips past position 15 in Google. Skipping the refresh cadence lets recipe rankings drift out of the top 3 inside 18 months as newer competitor recipes take the position.
Schema audit checklist per refresh
The schema audit checklist per refresh runs 8 items: Recipe schema completeness, aggregateRating count and accuracy, nutrition data accuracy, prepTime and cookTime match the recipe body, image URLs valid at CDN, related recipe internal links working, product card SKU URL live, and Google Search Console rich result eligibility validated. This checklist takes 20 minutes per recipe and prevents the schema drift that costs recipe rankings 20 to 40 positions quietly.
Reporting cadence for food brand content marketing
Reporting cadence on food brand content marketing runs a monthly executive report plus a quarterly business review. The monthly report ships in the first business week and covers organic sessions by pillar, top 10 ranking recipes with position trend, ingredient guide ranking movements, sourcing page performance, and organic-attributed DTC revenue. Every number carries a comparison to the prior month and a plain-language interpretation the founder reads in 7 minutes.
Metrics that matter for content marketing
Metrics that matter for food brand content marketing: organic sessions by pillar, recipe rich result impressions in Search Console, organic conversion rate to hero SKU pages, organic-attributed DTC revenue, and top 20 ranking positions by monthly organic sessions. Vanity metrics that do not matter: total pageviews without conversion context, average time on page without conversion attribution, and social share counts. The monthly report skips the vanity block entirely.
Quarterly business review structure
The quarterly business review runs 90 minutes with the founder, head of content, and SEO lead. Agenda: organic traffic trend by pillar, top 10 winning content pieces, top 10 losing content pieces (candidates for refresh or removal), competitive gap analysis against 5 named competitor brands, and next quarter’s content calendar with recipes and ingredient guides queued. According to Ahrefs content marketing research, brands running quarterly content audits outperform brands running annual audits by 40 to 70 percent on organic revenue over a 24-month window.
Internal linking discipline across food brand content
Internal linking discipline across food brand content moves authority from recipe pages toward hero SKU product pages and comparison guides. Every recipe links to the hero SKU it uses inline (once in the ingredient list, once in a bottom call-out card). Every ingredient comparison guide links to 3 to 6 recipes using the winning ingredient plus the hero SKU product page. Every sourcing story links to the 2 to 4 SKUs sourced from that specific farm or cooperative.
Anchor text strategy across recipe hubs
Anchor text on internal links varies across recipe hubs to avoid over-optimization patterns Google penalizes. Exact-match anchor (“single-origin Ethiopian coffee”) runs on 20 to 30 percent of internal links. Partial-match variations (“our Ethiopian roast”) run on 30 to 40 percent. Branded anchors (the SKU name) run on 20 to 30 percent. Generic anchors (“shop the coffee”) fill the remaining 10 to 20 percent. This ratio holds ranking without triggering the over-optimization penalty that shows up on brands that anchor-text-stuff every internal link with the same exact-match keyword. Cross-reference the linking layer on our food and beverage web design page.
Link equity from ingredient guides to SKU pages
Link equity from ingredient guides passes to SKU pages when the guide’s comparison table names the hero SKU in the winning column with a product card, and when the guide’s body links to 3 to 6 recipes that use the winning ingredient. This 3-hop path (guide to recipe to SKU) pushes authority from a high-traffic informational query down to a high-intent transactional page. According to Search Engine Land SEO coverage, informational content that internally links to transactional pages produces 2 to 4 times higher organic revenue than isolated content silos.
Wrapping up content marketing for food brands
Content marketing for food brands is the organic engine that turns a DTC snack, drink, or CPG storefront into a search-driven revenue channel. Recipe hub of 40 to 100 recipes. Ingredient comparison guides at 12 to 24 pieces. Sourcing story pages at 6 to 12 pieces. Buyer intent content at 8 to 16 pieces. Creator syndication calendar with 12 to 30 creators per quarter. Refresh cadence at 12 to 24 months by pillar. Reporting with organic sessions and organic revenue attribution.
If your DTC food brand is running paid social at 20,000 dollars monthly with a broken blog and zero recipe schema, professional content marketing for food brands pays for itself inside the first 90 days on organic traffic captured. Redefine Web ships content marketing inside our monthly retainer packages. Book a call and we will walk through the last three DTC food brands we built recipe hubs for, pillar by pillar.
Anchor text on internal links varies across recipe hubs to avoid over-optimization patterns Google penalizes. Exact-match anchor (“single-origin Ethiopian coffee”) runs on 20 to 30 percent of internal links. Partial-match variations (“our Ethiopian roast”) run on 30 to 40 percent. Branded anchors (the SKU name) run on 20 to 30 percent. Generic anchors (“shop the coffee”) fill the remaining 10 to 20 percent. This ratio holds ranking without triggering the over-optimization penalty that shows up on brands that anchor-text-stuff every internal link with the same exact-match keyword. Cross-reference the linking layer on our food and beverage web design page.
Link equity from ingredient guides to SKU pages
Link equity from ingredient guides passes to SKU pages when the guide’s comparison table names the hero SKU in the winning column with a product card, and when the guide’s body links to 3 to 6 recipes that use the winning ingredient. This 3-hop path (guide to recipe to SKU) pushes authority from a high-traffic informational query down to a high-intent transactional page. According to Search Engine Land SEO coverage, informational content that internally links to transactional pages produces 2 to 4 times higher organic revenue than isolated content silos.
Wrapping up content marketing for food brands
Content marketing for food brands is the organic engine that turns a DTC snack, drink, or CPG storefront into a search-driven revenue channel. Recipe hub of 40 to 100 recipes. Ingredient comparison guides at 12 to 24 pieces. Sourcing story pages at 6 to 12 pieces. Buyer intent content at 8 to 16 pieces. Creator syndication calendar with 12 to 30 creators per quarter. Refresh cadence at 12 to 24 months by pillar. Reporting with organic sessions and organic revenue attribution.
If your DTC food brand is running paid social at 20,000 dollars monthly with a broken blog and zero recipe schema, professional content marketing for food brands pays for itself inside the first 90 days on organic traffic captured. Redefine Web ships content marketing inside our monthly retainer packages. Book a call and we will walk through the last three DTC food brands we built recipe hubs for, pillar by pillar.
Content marketing for food brands starts with a recipe hub because recipe queries account for 40 to 60 percent of high-intent search volume in the food category. Every hero SKU needs 4 to 12 recipes anchored to it, each targeting a specific occasion and audience.
Skip the recipe hub and the brand loses the search real estate that pulls DTC storefront traffic month over month at zero incremental paid cost. Recipe traffic converts at 2 to 4 percent because the shopper landed with usage intent, not passive discovery, which is why food brands win on recipes.
Recipe schema and Google rich result eligibility
Every recipe page ships schema.org Recipe markup including cookTime, prepTime, recipeIngredient, recipeInstructions, nutrition, and aggregateRating. Correctly marked-up recipes qualify for Google’s recipe rich result carousel that pulls 3 to 6 times higher click-through rate than a plain blue link. The schema layer takes 15 minutes per recipe to author and 30 minutes to validate in Google Search Console. Cross-reference the recipe search stack on our food and beverage SEO page.
Recipe hub structure that scales
The recipe hub structure runs 40 to 100 recipes at maturity, organized by hero SKU (4 to 12 recipes per SKU) plus occasion tags (breakfast, weeknight dinner, meal prep, brunch, holiday). Every recipe links back to the hero SKU product page with the SKU embedded in an inline card. The hub earns internal linking value from ingredient comparison guides and the sourcing story pages, which feeds recipe ranking on Google. According to Google Search Central recipe structured data guidance, complete Recipe schema markup is required for eligibility in the recipe carousel and the ingredient search filter.
Pillar structure for food brand content marketing
The pillar structure on content marketing for food brands runs 4 content pillars concurrently: recipe hub (40 to 100 recipes), ingredient comparison guides (12 to 24 guides), sourcing story pages (6 to 12 pages), and buyer intent content (where to buy, subscription vs. one-time, gift bundle guides). Every pillar covers a distinct search intent and every pillar links back to the hero SKU product pages.
Ingredient comparison guide format
Ingredient comparison guides run 1,800 to 3,200 words comparing 2 to 4 ingredient types on 6 to 10 attributes with a comparison table, real-world use case examples, and links to the hero SKU that uses the specific ingredient. Example: organic vs. conventional oats compares nutritional profile, sourcing chain, cost, environmental impact, and taste on a 6-column table. The brand’s SKU appears in the winning column with a product card. These guides rank 3 to 8 months after publication and pull steady-state organic traffic.
Sourcing story pages that build trust
Sourcing story pages name the specific farms, cooperatives, or suppliers the brand sources from, with photos of the farms, farmer quotes, and specific harvest windows. A coffee brand’s Ethiopian farm page ranks for “single-origin Ethiopian coffee” and “Yirgacheffe coffee origin” plus 40 long-tail variations. The sourcing page pulls trust-building traffic that converts at 4 to 6 percent because the shopper landed pattern-matching on transparency and named provenance. Every sourcing page includes farmer or cooperative quotes, harvest dates, and a link back to 3 to 5 hero SKU pages that source from the named supplier.
Vejrø hospitality content case study
Vejrø Resort, a Danish private-island destination with an on-site restaurant focused on organic, locally sourced cuisine, joined us with strong social engagement and no organic-search real estate. Guests found the resort on Instagram but never in Google search for terms like “private island resort Denmark,” “farm-to-table hospitality Denmark,” or “Vejrø restaurant.” The same organic-search gap shows up on DTC food brands running paid social at 20,000 dollars monthly with a broken blog and zero recipe schema.
We built the conversion-focused website with on-site and off-site SEO tuned to the travel-niche keyword clusters, competitor analysis against comparable boutique resorts, and mobile-first design prioritizing guest discovery. Every page carried the structured data qualifying it for Google’s rich results in the hospitality category. Every internal link pushed authority toward the direct-booking conversion path.
Three months later, Vejrø hit 10,000 plus organic visitors, ranked for 200 plus first-page keywords, and pulled a 2.2 percent booking conversion rate from organic traffic. The same pattern applies to content marketing for food brands: recipe schema, ingredient comparison guides, and sourcing story pages pull organic traffic at 20 to 40 percent conversion into hero SKU pages inside 6 months when the content quality matches search intent and every page carries the right structured data markup. Vejrø also proved out the reporting discipline: every monthly report named the exact page, the exact keyword cluster, and the exact search feature (rich result, sitelinks, image pack) driving the incremental organic revenue instead of hiding behind aggregate traffic charts.
Recipe cadence and content calendar for food brands
Recipe cadence on a working food brand content calendar ships 2 to 4 new recipes per week during the first 6 months and drops to 1 per week at maturity. Each recipe takes 4 to 6 hours to produce (write, test in the kitchen, photograph, schema author, publish). At 3 recipes per week, the brand hits 78 recipes inside 6 months plus a backlog of ingredient comparison and sourcing content queued behind the recipe production line.
| Content pillar | Target volume year 1 | Production cost per piece | Refresh cadence |
|---|---|---|---|
| Recipe hub | 40 to 100 recipes | $180 to $320 | Every 12 months |
| Ingredient comparison guides | 12 to 24 guides | $450 to $780 | Every 18 months |
| Sourcing story pages | 6 to 12 pages | $680 to $1,200 | Every 24 months |
| Buyer intent content | 8 to 16 pieces | $220 to $420 | Every 12 months |
Photography as a content calendar constraint
Photography is the actual constraint on recipe cadence, not writing. Every recipe needs 6 to 12 photos: hero shot, ingredient flat lay, prep in progress, plated result, storage, and step shots for the schema markup. A working food brand batches photography 8 recipes at a time to keep the cost per recipe under 200 dollars. Skip the batching and the per-recipe cost climbs to 400 to 600 dollars, which caps recipe cadence at 1 per week and slows organic ranking timeline by 6 months.
Seasonal content calendar planning
Seasonal content calendar planning maps recipes and comparison guides to the seasonal windows they need to rank in. A Christmas cookie recipe needs to publish in September to rank by early December. A Valentine’s chocolate guide needs to publish in November to rank by early February. A back-to-school lunchbox recipe needs to publish in June to rank by late August. The 60-to-90-day ranking curve dictates the calendar.
Creator syndication inside food brand content
Creator syndication on food brand content marketing amplifies the recipe hub through Instagram Reels, TikTok, and YouTube Shorts creators paid to post their own version of the brand’s hero recipes. The creator content pulls net-new audiences into the recipe hub through the creator’s Link in Bio or Amazon Storefront tag. The syndication calendar names 12 to 30 creators per quarter with specific recipes assigned to each.
One brand we picked up had a spreadsheet titled “creator outreach 2023” with 47 rows and 3 responses. All 3 responses were auto-replies. The spreadsheet named zero recipes and offered flat rates below 100 dollars per post. Nobody posts a 30-second video for 87 dollars flat. Nobody.
Creator content commercial terms that work
Working creator content commercial terms run 350 to 1,500 dollars flat per post plus a 12 to 25 percent commission on tagged sales across a 30-day window. The commission mechanic pulls creators into follow-up posts because the incremental revenue continues past the initial fee. Mid-tier creators (30k to 150k followers) hit the sweet spot for food brand content because their engagement rate typically runs 4 to 8 percent versus 0.8 to 1.6 percent on mega-creators.
Content brief structure for creator partnerships
The content brief structure for creator partnerships runs a single page: the SKU, the specific recipe or usage occasion, 3 required brand mentions, 3 restricted claims (no health claims on non-medical SKUs), the pricing angle, the affiliate link, and 3 example videos that hit the tone. The brief avoids over-scripting because over-scripted creator content underperforms native creator voice by 40 to 60 percent on engagement rate.
Buyer intent content for food brand blogs
Buyer intent content on food brand blogs covers 8 to 16 pieces targeting explicit purchase-decision queries: “where to buy [brand],” “[brand] subscription vs. one-time,” “best [category] for [use case],” and “[brand] gift bundle.” Every buyer intent piece runs 1,400 to 2,400 words with a comparison table, product cards, and a clear conversion path to the specific SKU that matches the query intent. Buyer intent content converts at 3 to 6 percent versus 1 to 2 percent on recipe content because the shopper landed already planning to buy, not exploring a usage occasion.
Where-to-buy content structure
Where-to-buy content structure covers online (DTC storefront, Amazon, Target.com, Whole Foods online), retail (specific chain locators with the store finder embedded), and international (customs limitations, retailer partners abroad). Every piece names specific retailers, links to the store locator, and includes an FAQ block covering shipping availability, subscription options, and gift card compatibility. Where-to-buy content ranks for branded discovery queries the DTC storefront otherwise loses to competitor affiliate reviews.
Subscription versus one-time comparison content
Subscription versus one-time comparison content converts subscription commitments at 3 to 6 percent because it addresses the price-sensitivity concern head-on with a specific math table. The piece covers the discount structure (15 percent lifetime), the skip-a-month mechanic, the pause-anytime rule, the cancellation policy, and the specific yearly savings for the brand’s average consumption cadence. Cross-reference the retention structure on our food and beverage marketing retainer page.
Content refresh cadence on food brand pillars
Content refresh cadence on food brand content pillars runs a rolling audit every 12 to 24 months by pillar. Recipes get refreshed every 12 months with new photography, updated schema, and any nutrition or ingredient adjustments. Ingredient comparison guides refresh every 18 months to update market data. Sourcing story pages refresh every 24 months to reflect farm partnership changes and new harvest angles. Buyer intent content refreshes every 12 months to update retailer availability and pricing.
Recipe refresh priority order
Recipe refresh priority runs by organic traffic rank. The top 20 recipes by monthly organic sessions get refreshed first (new photography, schema audit, related recipe internal links, updated nutrition). The next 40 get refreshed at 15 months. The remaining recipes get refreshed opportunistically when the ranking slips past position 15 in Google. Skipping the refresh cadence lets recipe rankings drift out of the top 3 inside 18 months as newer competitor recipes take the position.
Schema audit checklist per refresh
The schema audit checklist per refresh runs 8 items: Recipe schema completeness, aggregateRating count and accuracy, nutrition data accuracy, prepTime and cookTime match the recipe body, image URLs valid at CDN, related recipe internal links working, product card SKU URL live, and Google Search Console rich result eligibility validated. This checklist takes 20 minutes per recipe and prevents the schema drift that costs recipe rankings 20 to 40 positions quietly.
Reporting cadence for food brand content marketing
Reporting cadence on food brand content marketing runs a monthly executive report plus a quarterly business review. The monthly report ships in the first business week and covers organic sessions by pillar, top 10 ranking recipes with position trend, ingredient guide ranking movements, sourcing page performance, and organic-attributed DTC revenue. Every number carries a comparison to the prior month and a plain-language interpretation the founder reads in 7 minutes.
Metrics that matter for content marketing
Metrics that matter for food brand content marketing: organic sessions by pillar, recipe rich result impressions in Search Console, organic conversion rate to hero SKU pages, organic-attributed DTC revenue, and top 20 ranking positions by monthly organic sessions. Vanity metrics that do not matter: total pageviews without conversion context, average time on page without conversion attribution, and social share counts. The monthly report skips the vanity block entirely.
Quarterly business review structure
The quarterly business review runs 90 minutes with the founder, head of content, and SEO lead. Agenda: organic traffic trend by pillar, top 10 winning content pieces, top 10 losing content pieces (candidates for refresh or removal), competitive gap analysis against 5 named competitor brands, and next quarter’s content calendar with recipes and ingredient guides queued. According to Ahrefs content marketing research, brands running quarterly content audits outperform brands running annual audits by 40 to 70 percent on organic revenue over a 24-month window.
Internal linking discipline across food brand content
Internal linking discipline across food brand content moves authority from recipe pages toward hero SKU product pages and comparison guides. Every recipe links to the hero SKU it uses inline (once in the ingredient list, once in a bottom call-out card). Every ingredient comparison guide links to 3 to 6 recipes using the winning ingredient plus the hero SKU product page. Every sourcing story links to the 2 to 4 SKUs sourced from that specific farm or cooperative.
Anchor text strategy across recipe hubs
Anchor text on internal links varies across recipe hubs to avoid over-optimization patterns Google penalizes. Exact-match anchor (“single-origin Ethiopian coffee”) runs on 20 to 30 percent of internal links. Partial-match variations (“our Ethiopian roast”) run on 30 to 40 percent. Branded anchors (the SKU name) run on 20 to 30 percent. Generic anchors (“shop the coffee”) fill the remaining 10 to 20 percent. This ratio holds ranking without triggering the over-optimization penalty that shows up on brands that anchor-text-stuff every internal link with the same exact-match keyword. Cross-reference the linking layer on our food and beverage web design page.
Link equity from ingredient guides to SKU pages
Link equity from ingredient guides passes to SKU pages when the guide’s comparison table names the hero SKU in the winning column with a product card, and when the guide’s body links to 3 to 6 recipes that use the winning ingredient. This 3-hop path (guide to recipe to SKU) pushes authority from a high-traffic informational query down to a high-intent transactional page. According to Search Engine Land SEO coverage, informational content that internally links to transactional pages produces 2 to 4 times higher organic revenue than isolated content silos.
Wrapping up content marketing for food brands
Content marketing for food brands is the organic engine that turns a DTC snack, drink, or CPG storefront into a search-driven revenue channel. Recipe hub of 40 to 100 recipes. Ingredient comparison guides at 12 to 24 pieces. Sourcing story pages at 6 to 12 pieces. Buyer intent content at 8 to 16 pieces. Creator syndication calendar with 12 to 30 creators per quarter. Refresh cadence at 12 to 24 months by pillar. Reporting with organic sessions and organic revenue attribution.
If your DTC food brand is running paid social at 20,000 dollars monthly with a broken blog and zero recipe schema, professional content marketing for food brands pays for itself inside the first 90 days on organic traffic captured. Redefine Web ships content marketing inside our monthly retainer packages. Book a call and we will walk through the last three DTC food brands we built recipe hubs for, pillar by pillar.
Content marketing for food brands starts with a recipe hub because recipe queries account for 40 to 60 percent of high-intent search volume in the food category. Every hero SKU needs 4 to 12 recipes anchored to it, each targeting a specific occasion and audience.
Skip the recipe hub and the brand loses the search real estate that pulls DTC storefront traffic month over month at zero incremental paid cost. Recipe traffic converts at 2 to 4 percent because the shopper landed with usage intent, not passive discovery, which is why food brands win on recipes.
Recipe schema and Google rich result eligibility
Every recipe page ships schema.org Recipe markup including cookTime, prepTime, recipeIngredient, recipeInstructions, nutrition, and aggregateRating. Correctly marked-up recipes qualify for Google’s recipe rich result carousel that pulls 3 to 6 times higher click-through rate than a plain blue link. The schema layer takes 15 minutes per recipe to author and 30 minutes to validate in Google Search Console. Cross-reference the recipe search stack on our food and beverage SEO page.
Recipe hub structure that scales
The recipe hub structure runs 40 to 100 recipes at maturity, organized by hero SKU (4 to 12 recipes per SKU) plus occasion tags (breakfast, weeknight dinner, meal prep, brunch, holiday). Every recipe links back to the hero SKU product page with the SKU embedded in an inline card. The hub earns internal linking value from ingredient comparison guides and the sourcing story pages, which feeds recipe ranking on Google. According to Google Search Central recipe structured data guidance, complete Recipe schema markup is required for eligibility in the recipe carousel and the ingredient search filter.
Pillar structure for food brand content marketing
The pillar structure on content marketing for food brands runs 4 content pillars concurrently: recipe hub (40 to 100 recipes), ingredient comparison guides (12 to 24 guides), sourcing story pages (6 to 12 pages), and buyer intent content (where to buy, subscription vs. one-time, gift bundle guides). Every pillar covers a distinct search intent and every pillar links back to the hero SKU product pages.
Ingredient comparison guide format
Ingredient comparison guides run 1,800 to 3,200 words comparing 2 to 4 ingredient types on 6 to 10 attributes with a comparison table, real-world use case examples, and links to the hero SKU that uses the specific ingredient. Example: organic vs. conventional oats compares nutritional profile, sourcing chain, cost, environmental impact, and taste on a 6-column table. The brand’s SKU appears in the winning column with a product card. These guides rank 3 to 8 months after publication and pull steady-state organic traffic.
Sourcing story pages that build trust
Sourcing story pages name the specific farms, cooperatives, or suppliers the brand sources from, with photos of the farms, farmer quotes, and specific harvest windows. A coffee brand’s Ethiopian farm page ranks for “single-origin Ethiopian coffee” and “Yirgacheffe coffee origin” plus 40 long-tail variations. The sourcing page pulls trust-building traffic that converts at 4 to 6 percent because the shopper landed pattern-matching on transparency and named provenance. Every sourcing page includes farmer or cooperative quotes, harvest dates, and a link back to 3 to 5 hero SKU pages that source from the named supplier.
Vejrø hospitality content case study
Vejrø Resort, a Danish private-island destination with an on-site restaurant focused on organic, locally sourced cuisine, joined us with strong social engagement and no organic-search real estate. Guests found the resort on Instagram but never in Google search for terms like “private island resort Denmark,” “farm-to-table hospitality Denmark,” or “Vejrø restaurant.” The same organic-search gap shows up on DTC food brands running paid social at 20,000 dollars monthly with a broken blog and zero recipe schema.
We built the conversion-focused website with on-site and off-site SEO tuned to the travel-niche keyword clusters, competitor analysis against comparable boutique resorts, and mobile-first design prioritizing guest discovery. Every page carried the structured data qualifying it for Google’s rich results in the hospitality category. Every internal link pushed authority toward the direct-booking conversion path.
Three months later, Vejrø hit 10,000 plus organic visitors, ranked for 200 plus first-page keywords, and pulled a 2.2 percent booking conversion rate from organic traffic. The same pattern applies to content marketing for food brands: recipe schema, ingredient comparison guides, and sourcing story pages pull organic traffic at 20 to 40 percent conversion into hero SKU pages inside 6 months when the content quality matches search intent and every page carries the right structured data markup. Vejrø also proved out the reporting discipline: every monthly report named the exact page, the exact keyword cluster, and the exact search feature (rich result, sitelinks, image pack) driving the incremental organic revenue instead of hiding behind aggregate traffic charts.
Recipe cadence and content calendar for food brands
Recipe cadence on a working food brand content calendar ships 2 to 4 new recipes per week during the first 6 months and drops to 1 per week at maturity. Each recipe takes 4 to 6 hours to produce (write, test in the kitchen, photograph, schema author, publish). At 3 recipes per week, the brand hits 78 recipes inside 6 months plus a backlog of ingredient comparison and sourcing content queued behind the recipe production line.
| Content pillar | Target volume year 1 | Production cost per piece | Refresh cadence |
|---|---|---|---|
| Recipe hub | 40 to 100 recipes | $180 to $320 | Every 12 months |
| Ingredient comparison guides | 12 to 24 guides | $450 to $780 | Every 18 months |
| Sourcing story pages | 6 to 12 pages | $680 to $1,200 | Every 24 months |
| Buyer intent content | 8 to 16 pieces | $220 to $420 | Every 12 months |
Photography as a content calendar constraint
Photography is the actual constraint on recipe cadence, not writing. Every recipe needs 6 to 12 photos: hero shot, ingredient flat lay, prep in progress, plated result, storage, and step shots for the schema markup. A working food brand batches photography 8 recipes at a time to keep the cost per recipe under 200 dollars. Skip the batching and the per-recipe cost climbs to 400 to 600 dollars, which caps recipe cadence at 1 per week and slows organic ranking timeline by 6 months.
Seasonal content calendar planning
Seasonal content calendar planning maps recipes and comparison guides to the seasonal windows they need to rank in. A Christmas cookie recipe needs to publish in September to rank by early December. A Valentine’s chocolate guide needs to publish in November to rank by early February. A back-to-school lunchbox recipe needs to publish in June to rank by late August. The 60-to-90-day ranking curve dictates the calendar.
Creator syndication inside food brand content
Creator syndication on food brand content marketing amplifies the recipe hub through Instagram Reels, TikTok, and YouTube Shorts creators paid to post their own version of the brand’s hero recipes. The creator content pulls net-new audiences into the recipe hub through the creator’s Link in Bio or Amazon Storefront tag. The syndication calendar names 12 to 30 creators per quarter with specific recipes assigned to each.
One brand we picked up had a spreadsheet titled “creator outreach 2023” with 47 rows and 3 responses. All 3 responses were auto-replies. The spreadsheet named zero recipes and offered flat rates below 100 dollars per post. Nobody posts a 30-second video for 87 dollars flat. Nobody.
Creator content commercial terms that work
Working creator content commercial terms run 350 to 1,500 dollars flat per post plus a 12 to 25 percent commission on tagged sales across a 30-day window. The commission mechanic pulls creators into follow-up posts because the incremental revenue continues past the initial fee. Mid-tier creators (30k to 150k followers) hit the sweet spot for food brand content because their engagement rate typically runs 4 to 8 percent versus 0.8 to 1.6 percent on mega-creators.
Content brief structure for creator partnerships
The content brief structure for creator partnerships runs a single page: the SKU, the specific recipe or usage occasion, 3 required brand mentions, 3 restricted claims (no health claims on non-medical SKUs), the pricing angle, the affiliate link, and 3 example videos that hit the tone. The brief avoids over-scripting because over-scripted creator content underperforms native creator voice by 40 to 60 percent on engagement rate.
Buyer intent content for food brand blogs
Buyer intent content on food brand blogs covers 8 to 16 pieces targeting explicit purchase-decision queries: “where to buy [brand],” “[brand] subscription vs. one-time,” “best [category] for [use case],” and “[brand] gift bundle.” Every buyer intent piece runs 1,400 to 2,400 words with a comparison table, product cards, and a clear conversion path to the specific SKU that matches the query intent. Buyer intent content converts at 3 to 6 percent versus 1 to 2 percent on recipe content because the shopper landed already planning to buy, not exploring a usage occasion.
Where-to-buy content structure
Where-to-buy content structure covers online (DTC storefront, Amazon, Target.com, Whole Foods online), retail (specific chain locators with the store finder embedded), and international (customs limitations, retailer partners abroad). Every piece names specific retailers, links to the store locator, and includes an FAQ block covering shipping availability, subscription options, and gift card compatibility. Where-to-buy content ranks for branded discovery queries the DTC storefront otherwise loses to competitor affiliate reviews.
Subscription versus one-time comparison content
Subscription versus one-time comparison content converts subscription commitments at 3 to 6 percent because it addresses the price-sensitivity concern head-on with a specific math table. The piece covers the discount structure (15 percent lifetime), the skip-a-month mechanic, the pause-anytime rule, the cancellation policy, and the specific yearly savings for the brand’s average consumption cadence. Cross-reference the retention structure on our food and beverage marketing retainer page.
Content refresh cadence on food brand pillars
Content refresh cadence on food brand content pillars runs a rolling audit every 12 to 24 months by pillar. Recipes get refreshed every 12 months with new photography, updated schema, and any nutrition or ingredient adjustments. Ingredient comparison guides refresh every 18 months to update market data. Sourcing story pages refresh every 24 months to reflect farm partnership changes and new harvest angles. Buyer intent content refreshes every 12 months to update retailer availability and pricing.
Recipe refresh priority order
Recipe refresh priority runs by organic traffic rank. The top 20 recipes by monthly organic sessions get refreshed first (new photography, schema audit, related recipe internal links, updated nutrition). The next 40 get refreshed at 15 months. The remaining recipes get refreshed opportunistically when the ranking slips past position 15 in Google. Skipping the refresh cadence lets recipe rankings drift out of the top 3 inside 18 months as newer competitor recipes take the position.
Schema audit checklist per refresh
The schema audit checklist per refresh runs 8 items: Recipe schema completeness, aggregateRating count and accuracy, nutrition data accuracy, prepTime and cookTime match the recipe body, image URLs valid at CDN, related recipe internal links working, product card SKU URL live, and Google Search Console rich result eligibility validated. This checklist takes 20 minutes per recipe and prevents the schema drift that costs recipe rankings 20 to 40 positions quietly.
Reporting cadence for food brand content marketing
Reporting cadence on food brand content marketing runs a monthly executive report plus a quarterly business review. The monthly report ships in the first business week and covers organic sessions by pillar, top 10 ranking recipes with position trend, ingredient guide ranking movements, sourcing page performance, and organic-attributed DTC revenue. Every number carries a comparison to the prior month and a plain-language interpretation the founder reads in 7 minutes.
Metrics that matter for content marketing
Metrics that matter for food brand content marketing: organic sessions by pillar, recipe rich result impressions in Search Console, organic conversion rate to hero SKU pages, organic-attributed DTC revenue, and top 20 ranking positions by monthly organic sessions. Vanity metrics that do not matter: total pageviews without conversion context, average time on page without conversion attribution, and social share counts. The monthly report skips the vanity block entirely.
Quarterly business review structure
The quarterly business review runs 90 minutes with the founder, head of content, and SEO lead. Agenda: organic traffic trend by pillar, top 10 winning content pieces, top 10 losing content pieces (candidates for refresh or removal), competitive gap analysis against 5 named competitor brands, and next quarter’s content calendar with recipes and ingredient guides queued. According to Ahrefs content marketing research, brands running quarterly content audits outperform brands running annual audits by 40 to 70 percent on organic revenue over a 24-month window.
Internal linking discipline across food brand content
Internal linking discipline across food brand content moves authority from recipe pages toward hero SKU product pages and comparison guides. Every recipe links to the hero SKU it uses inline (once in the ingredient list, once in a bottom call-out card). Every ingredient comparison guide links to 3 to 6 recipes using the winning ingredient plus the hero SKU product page. Every sourcing story links to the 2 to 4 SKUs sourced from that specific farm or cooperative.
Anchor text strategy across recipe hubs
Anchor text on internal links varies across recipe hubs to avoid over-optimization patterns Google penalizes. Exact-match anchor (“single-origin Ethiopian coffee”) runs on 20 to 30 percent of internal links. Partial-match variations (“our Ethiopian roast”) run on 30 to 40 percent. Branded anchors (the SKU name) run on 20 to 30 percent. Generic anchors (“shop the coffee”) fill the remaining 10 to 20 percent. This ratio holds ranking without triggering the over-optimization penalty that shows up on brands that anchor-text-stuff every internal link with the same exact-match keyword. Cross-reference the linking layer on our food and beverage web design page.
Link equity from ingredient guides to SKU pages
Link equity from ingredient guides passes to SKU pages when the guide’s comparison table names the hero SKU in the winning column with a product card, and when the guide’s body links to 3 to 6 recipes that use the winning ingredient. This 3-hop path (guide to recipe to SKU) pushes authority from a high-traffic informational query down to a high-intent transactional page. According to Search Engine Land SEO coverage, informational content that internally links to transactional pages produces 2 to 4 times higher organic revenue than isolated content silos.
Wrapping up content marketing for food brands
Content marketing for food brands is the organic engine that turns a DTC snack, drink, or CPG storefront into a search-driven revenue channel. Recipe hub of 40 to 100 recipes. Ingredient comparison guides at 12 to 24 pieces. Sourcing story pages at 6 to 12 pieces. Buyer intent content at 8 to 16 pieces. Creator syndication calendar with 12 to 30 creators per quarter. Refresh cadence at 12 to 24 months by pillar. Reporting with organic sessions and organic revenue attribution.
If your DTC food brand is running paid social at 20,000 dollars monthly with a broken blog and zero recipe schema, professional content marketing for food brands pays for itself inside the first 90 days on organic traffic captured. Redefine Web ships content marketing inside our monthly retainer packages. Book a call and we will walk through the last three DTC food brands we built recipe hubs for, pillar by pillar.
Internal linking discipline across food brand content moves authority from recipe pages toward hero SKU product pages and comparison guides. Every recipe links to the hero SKU it uses inline (once in the ingredient list, once in a bottom call-out card). Every ingredient comparison guide links to 3 to 6 recipes using the winning ingredient plus the hero SKU product page. Every sourcing story links to the 2 to 4 SKUs sourced from that specific farm or cooperative.
Anchor text strategy across recipe hubs
Anchor text on internal links varies across recipe hubs to avoid over-optimization patterns Google penalizes. Exact-match anchor (“single-origin Ethiopian coffee”) runs on 20 to 30 percent of internal links. Partial-match variations (“our Ethiopian roast”) run on 30 to 40 percent. Branded anchors (the SKU name) run on 20 to 30 percent. Generic anchors (“shop the coffee”) fill the remaining 10 to 20 percent. This ratio holds ranking without triggering the over-optimization penalty that shows up on brands that anchor-text-stuff every internal link with the same exact-match keyword. Cross-reference the linking layer on our food and beverage web design page.
Link equity from ingredient guides to SKU pages
Link equity from ingredient guides passes to SKU pages when the guide’s comparison table names the hero SKU in the winning column with a product card, and when the guide’s body links to 3 to 6 recipes that use the winning ingredient. This 3-hop path (guide to recipe to SKU) pushes authority from a high-traffic informational query down to a high-intent transactional page. According to Search Engine Land SEO coverage, informational content that internally links to transactional pages produces 2 to 4 times higher organic revenue than isolated content silos.
Wrapping up content marketing for food brands
Content marketing for food brands is the organic engine that turns a DTC snack, drink, or CPG storefront into a search-driven revenue channel. Recipe hub of 40 to 100 recipes. Ingredient comparison guides at 12 to 24 pieces. Sourcing story pages at 6 to 12 pieces. Buyer intent content at 8 to 16 pieces. Creator syndication calendar with 12 to 30 creators per quarter. Refresh cadence at 12 to 24 months by pillar. Reporting with organic sessions and organic revenue attribution.
If your DTC food brand is running paid social at 20,000 dollars monthly with a broken blog and zero recipe schema, professional content marketing for food brands pays for itself inside the first 90 days on organic traffic captured. Redefine Web ships content marketing inside our monthly retainer packages. Book a call and we will walk through the last three DTC food brands we built recipe hubs for, pillar by pillar.
Content marketing for food brands starts with a recipe hub because recipe queries account for 40 to 60 percent of high-intent search volume in the food category. Every hero SKU needs 4 to 12 recipes anchored to it, each targeting a specific occasion and audience.
Skip the recipe hub and the brand loses the search real estate that pulls DTC storefront traffic month over month at zero incremental paid cost. Recipe traffic converts at 2 to 4 percent because the shopper landed with usage intent, not passive discovery, which is why food brands win on recipes.
Recipe schema and Google rich result eligibility
Every recipe page ships schema.org Recipe markup including cookTime, prepTime, recipeIngredient, recipeInstructions, nutrition, and aggregateRating. Correctly marked-up recipes qualify for Google’s recipe rich result carousel that pulls 3 to 6 times higher click-through rate than a plain blue link. The schema layer takes 15 minutes per recipe to author and 30 minutes to validate in Google Search Console. Cross-reference the recipe search stack on our food and beverage SEO page.
Recipe hub structure that scales
The recipe hub structure runs 40 to 100 recipes at maturity, organized by hero SKU (4 to 12 recipes per SKU) plus occasion tags (breakfast, weeknight dinner, meal prep, brunch, holiday). Every recipe links back to the hero SKU product page with the SKU embedded in an inline card. The hub earns internal linking value from ingredient comparison guides and the sourcing story pages, which feeds recipe ranking on Google. According to Google Search Central recipe structured data guidance, complete Recipe schema markup is required for eligibility in the recipe carousel and the ingredient search filter.
Pillar structure for food brand content marketing
The pillar structure on content marketing for food brands runs 4 content pillars concurrently: recipe hub (40 to 100 recipes), ingredient comparison guides (12 to 24 guides), sourcing story pages (6 to 12 pages), and buyer intent content (where to buy, subscription vs. one-time, gift bundle guides). Every pillar covers a distinct search intent and every pillar links back to the hero SKU product pages.
Ingredient comparison guide format
Ingredient comparison guides run 1,800 to 3,200 words comparing 2 to 4 ingredient types on 6 to 10 attributes with a comparison table, real-world use case examples, and links to the hero SKU that uses the specific ingredient. Example: organic vs. conventional oats compares nutritional profile, sourcing chain, cost, environmental impact, and taste on a 6-column table. The brand’s SKU appears in the winning column with a product card. These guides rank 3 to 8 months after publication and pull steady-state organic traffic.
Sourcing story pages that build trust
Sourcing story pages name the specific farms, cooperatives, or suppliers the brand sources from, with photos of the farms, farmer quotes, and specific harvest windows. A coffee brand’s Ethiopian farm page ranks for “single-origin Ethiopian coffee” and “Yirgacheffe coffee origin” plus 40 long-tail variations. The sourcing page pulls trust-building traffic that converts at 4 to 6 percent because the shopper landed pattern-matching on transparency and named provenance. Every sourcing page includes farmer or cooperative quotes, harvest dates, and a link back to 3 to 5 hero SKU pages that source from the named supplier.
Vejrø hospitality content case study
Vejrø Resort, a Danish private-island destination with an on-site restaurant focused on organic, locally sourced cuisine, joined us with strong social engagement and no organic-search real estate. Guests found the resort on Instagram but never in Google search for terms like “private island resort Denmark,” “farm-to-table hospitality Denmark,” or “Vejrø restaurant.” The same organic-search gap shows up on DTC food brands running paid social at 20,000 dollars monthly with a broken blog and zero recipe schema.
We built the conversion-focused website with on-site and off-site SEO tuned to the travel-niche keyword clusters, competitor analysis against comparable boutique resorts, and mobile-first design prioritizing guest discovery. Every page carried the structured data qualifying it for Google’s rich results in the hospitality category. Every internal link pushed authority toward the direct-booking conversion path.
Three months later, Vejrø hit 10,000 plus organic visitors, ranked for 200 plus first-page keywords, and pulled a 2.2 percent booking conversion rate from organic traffic. The same pattern applies to content marketing for food brands: recipe schema, ingredient comparison guides, and sourcing story pages pull organic traffic at 20 to 40 percent conversion into hero SKU pages inside 6 months when the content quality matches search intent and every page carries the right structured data markup. Vejrø also proved out the reporting discipline: every monthly report named the exact page, the exact keyword cluster, and the exact search feature (rich result, sitelinks, image pack) driving the incremental organic revenue instead of hiding behind aggregate traffic charts.
Recipe cadence and content calendar for food brands
Recipe cadence on a working food brand content calendar ships 2 to 4 new recipes per week during the first 6 months and drops to 1 per week at maturity. Each recipe takes 4 to 6 hours to produce (write, test in the kitchen, photograph, schema author, publish). At 3 recipes per week, the brand hits 78 recipes inside 6 months plus a backlog of ingredient comparison and sourcing content queued behind the recipe production line.
| Content pillar | Target volume year 1 | Production cost per piece | Refresh cadence |
|---|---|---|---|
| Recipe hub | 40 to 100 recipes | $180 to $320 | Every 12 months |
| Ingredient comparison guides | 12 to 24 guides | $450 to $780 | Every 18 months |
| Sourcing story pages | 6 to 12 pages | $680 to $1,200 | Every 24 months |
| Buyer intent content | 8 to 16 pieces | $220 to $420 | Every 12 months |
Photography as a content calendar constraint
Photography is the actual constraint on recipe cadence, not writing. Every recipe needs 6 to 12 photos: hero shot, ingredient flat lay, prep in progress, plated result, storage, and step shots for the schema markup. A working food brand batches photography 8 recipes at a time to keep the cost per recipe under 200 dollars. Skip the batching and the per-recipe cost climbs to 400 to 600 dollars, which caps recipe cadence at 1 per week and slows organic ranking timeline by 6 months.
Seasonal content calendar planning
Seasonal content calendar planning maps recipes and comparison guides to the seasonal windows they need to rank in. A Christmas cookie recipe needs to publish in September to rank by early December. A Valentine’s chocolate guide needs to publish in November to rank by early February. A back-to-school lunchbox recipe needs to publish in June to rank by late August. The 60-to-90-day ranking curve dictates the calendar.
Creator syndication inside food brand content
Creator syndication on food brand content marketing amplifies the recipe hub through Instagram Reels, TikTok, and YouTube Shorts creators paid to post their own version of the brand’s hero recipes. The creator content pulls net-new audiences into the recipe hub through the creator’s Link in Bio or Amazon Storefront tag. The syndication calendar names 12 to 30 creators per quarter with specific recipes assigned to each.
One brand we picked up had a spreadsheet titled “creator outreach 2023” with 47 rows and 3 responses. All 3 responses were auto-replies. The spreadsheet named zero recipes and offered flat rates below 100 dollars per post. Nobody posts a 30-second video for 87 dollars flat. Nobody.
Creator content commercial terms that work
Working creator content commercial terms run 350 to 1,500 dollars flat per post plus a 12 to 25 percent commission on tagged sales across a 30-day window. The commission mechanic pulls creators into follow-up posts because the incremental revenue continues past the initial fee. Mid-tier creators (30k to 150k followers) hit the sweet spot for food brand content because their engagement rate typically runs 4 to 8 percent versus 0.8 to 1.6 percent on mega-creators.
Content brief structure for creator partnerships
The content brief structure for creator partnerships runs a single page: the SKU, the specific recipe or usage occasion, 3 required brand mentions, 3 restricted claims (no health claims on non-medical SKUs), the pricing angle, the affiliate link, and 3 example videos that hit the tone. The brief avoids over-scripting because over-scripted creator content underperforms native creator voice by 40 to 60 percent on engagement rate.
Buyer intent content for food brand blogs
Buyer intent content on food brand blogs covers 8 to 16 pieces targeting explicit purchase-decision queries: “where to buy [brand],” “[brand] subscription vs. one-time,” “best [category] for [use case],” and “[brand] gift bundle.” Every buyer intent piece runs 1,400 to 2,400 words with a comparison table, product cards, and a clear conversion path to the specific SKU that matches the query intent. Buyer intent content converts at 3 to 6 percent versus 1 to 2 percent on recipe content because the shopper landed already planning to buy, not exploring a usage occasion.
Where-to-buy content structure
Where-to-buy content structure covers online (DTC storefront, Amazon, Target.com, Whole Foods online), retail (specific chain locators with the store finder embedded), and international (customs limitations, retailer partners abroad). Every piece names specific retailers, links to the store locator, and includes an FAQ block covering shipping availability, subscription options, and gift card compatibility. Where-to-buy content ranks for branded discovery queries the DTC storefront otherwise loses to competitor affiliate reviews.
Subscription versus one-time comparison content
Subscription versus one-time comparison content converts subscription commitments at 3 to 6 percent because it addresses the price-sensitivity concern head-on with a specific math table. The piece covers the discount structure (15 percent lifetime), the skip-a-month mechanic, the pause-anytime rule, the cancellation policy, and the specific yearly savings for the brand’s average consumption cadence. Cross-reference the retention structure on our food and beverage marketing retainer page.
Content refresh cadence on food brand pillars
Content refresh cadence on food brand content pillars runs a rolling audit every 12 to 24 months by pillar. Recipes get refreshed every 12 months with new photography, updated schema, and any nutrition or ingredient adjustments. Ingredient comparison guides refresh every 18 months to update market data. Sourcing story pages refresh every 24 months to reflect farm partnership changes and new harvest angles. Buyer intent content refreshes every 12 months to update retailer availability and pricing.
Recipe refresh priority order
Recipe refresh priority runs by organic traffic rank. The top 20 recipes by monthly organic sessions get refreshed first (new photography, schema audit, related recipe internal links, updated nutrition). The next 40 get refreshed at 15 months. The remaining recipes get refreshed opportunistically when the ranking slips past position 15 in Google. Skipping the refresh cadence lets recipe rankings drift out of the top 3 inside 18 months as newer competitor recipes take the position.
Schema audit checklist per refresh
The schema audit checklist per refresh runs 8 items: Recipe schema completeness, aggregateRating count and accuracy, nutrition data accuracy, prepTime and cookTime match the recipe body, image URLs valid at CDN, related recipe internal links working, product card SKU URL live, and Google Search Console rich result eligibility validated. This checklist takes 20 minutes per recipe and prevents the schema drift that costs recipe rankings 20 to 40 positions quietly.
Reporting cadence for food brand content marketing
Reporting cadence on food brand content marketing runs a monthly executive report plus a quarterly business review. The monthly report ships in the first business week and covers organic sessions by pillar, top 10 ranking recipes with position trend, ingredient guide ranking movements, sourcing page performance, and organic-attributed DTC revenue. Every number carries a comparison to the prior month and a plain-language interpretation the founder reads in 7 minutes.
Metrics that matter for content marketing
Metrics that matter for food brand content marketing: organic sessions by pillar, recipe rich result impressions in Search Console, organic conversion rate to hero SKU pages, organic-attributed DTC revenue, and top 20 ranking positions by monthly organic sessions. Vanity metrics that do not matter: total pageviews without conversion context, average time on page without conversion attribution, and social share counts. The monthly report skips the vanity block entirely.
Quarterly business review structure
The quarterly business review runs 90 minutes with the founder, head of content, and SEO lead. Agenda: organic traffic trend by pillar, top 10 winning content pieces, top 10 losing content pieces (candidates for refresh or removal), competitive gap analysis against 5 named competitor brands, and next quarter’s content calendar with recipes and ingredient guides queued. According to Ahrefs content marketing research, brands running quarterly content audits outperform brands running annual audits by 40 to 70 percent on organic revenue over a 24-month window.
Internal linking discipline across food brand content
Internal linking discipline across food brand content moves authority from recipe pages toward hero SKU product pages and comparison guides. Every recipe links to the hero SKU it uses inline (once in the ingredient list, once in a bottom call-out card). Every ingredient comparison guide links to 3 to 6 recipes using the winning ingredient plus the hero SKU product page. Every sourcing story links to the 2 to 4 SKUs sourced from that specific farm or cooperative.
Anchor text strategy across recipe hubs
Anchor text on internal links varies across recipe hubs to avoid over-optimization patterns Google penalizes. Exact-match anchor (“single-origin Ethiopian coffee”) runs on 20 to 30 percent of internal links. Partial-match variations (“our Ethiopian roast”) run on 30 to 40 percent. Branded anchors (the SKU name) run on 20 to 30 percent. Generic anchors (“shop the coffee”) fill the remaining 10 to 20 percent. This ratio holds ranking without triggering the over-optimization penalty that shows up on brands that anchor-text-stuff every internal link with the same exact-match keyword. Cross-reference the linking layer on our food and beverage web design page.
Link equity from ingredient guides to SKU pages
Link equity from ingredient guides passes to SKU pages when the guide’s comparison table names the hero SKU in the winning column with a product card, and when the guide’s body links to 3 to 6 recipes that use the winning ingredient. This 3-hop path (guide to recipe to SKU) pushes authority from a high-traffic informational query down to a high-intent transactional page. According to Search Engine Land SEO coverage, informational content that internally links to transactional pages produces 2 to 4 times higher organic revenue than isolated content silos.
Wrapping up content marketing for food brands
Content marketing for food brands is the organic engine that turns a DTC snack, drink, or CPG storefront into a search-driven revenue channel. Recipe hub of 40 to 100 recipes. Ingredient comparison guides at 12 to 24 pieces. Sourcing story pages at 6 to 12 pieces. Buyer intent content at 8 to 16 pieces. Creator syndication calendar with 12 to 30 creators per quarter. Refresh cadence at 12 to 24 months by pillar. Reporting with organic sessions and organic revenue attribution.
If your DTC food brand is running paid social at 20,000 dollars monthly with a broken blog and zero recipe schema, professional content marketing for food brands pays for itself inside the first 90 days on organic traffic captured. Redefine Web ships content marketing inside our monthly retainer packages. Book a call and we will walk through the last three DTC food brands we built recipe hubs for, pillar by pillar.
Content marketing for food brands starts with a recipe hub because recipe queries account for 40 to 60 percent of high-intent search volume in the food category. Every hero SKU needs 4 to 12 recipes anchored to it, each targeting a specific occasion and audience.
Skip the recipe hub and the brand loses the search real estate that pulls DTC storefront traffic month over month at zero incremental paid cost. Recipe traffic converts at 2 to 4 percent because the shopper landed with usage intent, not passive discovery, which is why food brands win on recipes.
Recipe schema and Google rich result eligibility
Every recipe page ships schema.org Recipe markup including cookTime, prepTime, recipeIngredient, recipeInstructions, nutrition, and aggregateRating. Correctly marked-up recipes qualify for Google’s recipe rich result carousel that pulls 3 to 6 times higher click-through rate than a plain blue link. The schema layer takes 15 minutes per recipe to author and 30 minutes to validate in Google Search Console. Cross-reference the recipe search stack on our food and beverage SEO page.
Recipe hub structure that scales
The recipe hub structure runs 40 to 100 recipes at maturity, organized by hero SKU (4 to 12 recipes per SKU) plus occasion tags (breakfast, weeknight dinner, meal prep, brunch, holiday). Every recipe links back to the hero SKU product page with the SKU embedded in an inline card. The hub earns internal linking value from ingredient comparison guides and the sourcing story pages, which feeds recipe ranking on Google. According to Google Search Central recipe structured data guidance, complete Recipe schema markup is required for eligibility in the recipe carousel and the ingredient search filter.
Pillar structure for food brand content marketing
The pillar structure on content marketing for food brands runs 4 content pillars concurrently: recipe hub (40 to 100 recipes), ingredient comparison guides (12 to 24 guides), sourcing story pages (6 to 12 pages), and buyer intent content (where to buy, subscription vs. one-time, gift bundle guides). Every pillar covers a distinct search intent and every pillar links back to the hero SKU product pages.
Ingredient comparison guide format
Ingredient comparison guides run 1,800 to 3,200 words comparing 2 to 4 ingredient types on 6 to 10 attributes with a comparison table, real-world use case examples, and links to the hero SKU that uses the specific ingredient. Example: organic vs. conventional oats compares nutritional profile, sourcing chain, cost, environmental impact, and taste on a 6-column table. The brand’s SKU appears in the winning column with a product card. These guides rank 3 to 8 months after publication and pull steady-state organic traffic.
Sourcing story pages that build trust
Sourcing story pages name the specific farms, cooperatives, or suppliers the brand sources from, with photos of the farms, farmer quotes, and specific harvest windows. A coffee brand’s Ethiopian farm page ranks for “single-origin Ethiopian coffee” and “Yirgacheffe coffee origin” plus 40 long-tail variations. The sourcing page pulls trust-building traffic that converts at 4 to 6 percent because the shopper landed pattern-matching on transparency and named provenance. Every sourcing page includes farmer or cooperative quotes, harvest dates, and a link back to 3 to 5 hero SKU pages that source from the named supplier.
Vejrø hospitality content case study
Vejrø Resort, a Danish private-island destination with an on-site restaurant focused on organic, locally sourced cuisine, joined us with strong social engagement and no organic-search real estate. Guests found the resort on Instagram but never in Google search for terms like “private island resort Denmark,” “farm-to-table hospitality Denmark,” or “Vejrø restaurant.” The same organic-search gap shows up on DTC food brands running paid social at 20,000 dollars monthly with a broken blog and zero recipe schema.
We built the conversion-focused website with on-site and off-site SEO tuned to the travel-niche keyword clusters, competitor analysis against comparable boutique resorts, and mobile-first design prioritizing guest discovery. Every page carried the structured data qualifying it for Google’s rich results in the hospitality category. Every internal link pushed authority toward the direct-booking conversion path.
Three months later, Vejrø hit 10,000 plus organic visitors, ranked for 200 plus first-page keywords, and pulled a 2.2 percent booking conversion rate from organic traffic. The same pattern applies to content marketing for food brands: recipe schema, ingredient comparison guides, and sourcing story pages pull organic traffic at 20 to 40 percent conversion into hero SKU pages inside 6 months when the content quality matches search intent and every page carries the right structured data markup. Vejrø also proved out the reporting discipline: every monthly report named the exact page, the exact keyword cluster, and the exact search feature (rich result, sitelinks, image pack) driving the incremental organic revenue instead of hiding behind aggregate traffic charts.
Recipe cadence and content calendar for food brands
Recipe cadence on a working food brand content calendar ships 2 to 4 new recipes per week during the first 6 months and drops to 1 per week at maturity. Each recipe takes 4 to 6 hours to produce (write, test in the kitchen, photograph, schema author, publish). At 3 recipes per week, the brand hits 78 recipes inside 6 months plus a backlog of ingredient comparison and sourcing content queued behind the recipe production line.
| Content pillar | Target volume year 1 | Production cost per piece | Refresh cadence |
|---|---|---|---|
| Recipe hub | 40 to 100 recipes | $180 to $320 | Every 12 months |
| Ingredient comparison guides | 12 to 24 guides | $450 to $780 | Every 18 months |
| Sourcing story pages | 6 to 12 pages | $680 to $1,200 | Every 24 months |
| Buyer intent content | 8 to 16 pieces | $220 to $420 | Every 12 months |
Photography as a content calendar constraint
Photography is the actual constraint on recipe cadence, not writing. Every recipe needs 6 to 12 photos: hero shot, ingredient flat lay, prep in progress, plated result, storage, and step shots for the schema markup. A working food brand batches photography 8 recipes at a time to keep the cost per recipe under 200 dollars. Skip the batching and the per-recipe cost climbs to 400 to 600 dollars, which caps recipe cadence at 1 per week and slows organic ranking timeline by 6 months.
Seasonal content calendar planning
Seasonal content calendar planning maps recipes and comparison guides to the seasonal windows they need to rank in. A Christmas cookie recipe needs to publish in September to rank by early December. A Valentine’s chocolate guide needs to publish in November to rank by early February. A back-to-school lunchbox recipe needs to publish in June to rank by late August. The 60-to-90-day ranking curve dictates the calendar.
Creator syndication inside food brand content
Creator syndication on food brand content marketing amplifies the recipe hub through Instagram Reels, TikTok, and YouTube Shorts creators paid to post their own version of the brand’s hero recipes. The creator content pulls net-new audiences into the recipe hub through the creator’s Link in Bio or Amazon Storefront tag. The syndication calendar names 12 to 30 creators per quarter with specific recipes assigned to each.
One brand we picked up had a spreadsheet titled “creator outreach 2023” with 47 rows and 3 responses. All 3 responses were auto-replies. The spreadsheet named zero recipes and offered flat rates below 100 dollars per post. Nobody posts a 30-second video for 87 dollars flat. Nobody.
Creator content commercial terms that work
Working creator content commercial terms run 350 to 1,500 dollars flat per post plus a 12 to 25 percent commission on tagged sales across a 30-day window. The commission mechanic pulls creators into follow-up posts because the incremental revenue continues past the initial fee. Mid-tier creators (30k to 150k followers) hit the sweet spot for food brand content because their engagement rate typically runs 4 to 8 percent versus 0.8 to 1.6 percent on mega-creators.
Content brief structure for creator partnerships
The content brief structure for creator partnerships runs a single page: the SKU, the specific recipe or usage occasion, 3 required brand mentions, 3 restricted claims (no health claims on non-medical SKUs), the pricing angle, the affiliate link, and 3 example videos that hit the tone. The brief avoids over-scripting because over-scripted creator content underperforms native creator voice by 40 to 60 percent on engagement rate.
Buyer intent content for food brand blogs
Buyer intent content on food brand blogs covers 8 to 16 pieces targeting explicit purchase-decision queries: “where to buy [brand],” “[brand] subscription vs. one-time,” “best [category] for [use case],” and “[brand] gift bundle.” Every buyer intent piece runs 1,400 to 2,400 words with a comparison table, product cards, and a clear conversion path to the specific SKU that matches the query intent. Buyer intent content converts at 3 to 6 percent versus 1 to 2 percent on recipe content because the shopper landed already planning to buy, not exploring a usage occasion.
Where-to-buy content structure
Where-to-buy content structure covers online (DTC storefront, Amazon, Target.com, Whole Foods online), retail (specific chain locators with the store finder embedded), and international (customs limitations, retailer partners abroad). Every piece names specific retailers, links to the store locator, and includes an FAQ block covering shipping availability, subscription options, and gift card compatibility. Where-to-buy content ranks for branded discovery queries the DTC storefront otherwise loses to competitor affiliate reviews.
Subscription versus one-time comparison content
Subscription versus one-time comparison content converts subscription commitments at 3 to 6 percent because it addresses the price-sensitivity concern head-on with a specific math table. The piece covers the discount structure (15 percent lifetime), the skip-a-month mechanic, the pause-anytime rule, the cancellation policy, and the specific yearly savings for the brand’s average consumption cadence. Cross-reference the retention structure on our food and beverage marketing retainer page.
Content refresh cadence on food brand pillars
Content refresh cadence on food brand content pillars runs a rolling audit every 12 to 24 months by pillar. Recipes get refreshed every 12 months with new photography, updated schema, and any nutrition or ingredient adjustments. Ingredient comparison guides refresh every 18 months to update market data. Sourcing story pages refresh every 24 months to reflect farm partnership changes and new harvest angles. Buyer intent content refreshes every 12 months to update retailer availability and pricing.
Recipe refresh priority order
Recipe refresh priority runs by organic traffic rank. The top 20 recipes by monthly organic sessions get refreshed first (new photography, schema audit, related recipe internal links, updated nutrition). The next 40 get refreshed at 15 months. The remaining recipes get refreshed opportunistically when the ranking slips past position 15 in Google. Skipping the refresh cadence lets recipe rankings drift out of the top 3 inside 18 months as newer competitor recipes take the position.
Schema audit checklist per refresh
The schema audit checklist per refresh runs 8 items: Recipe schema completeness, aggregateRating count and accuracy, nutrition data accuracy, prepTime and cookTime match the recipe body, image URLs valid at CDN, related recipe internal links working, product card SKU URL live, and Google Search Console rich result eligibility validated. This checklist takes 20 minutes per recipe and prevents the schema drift that costs recipe rankings 20 to 40 positions quietly.
Reporting cadence for food brand content marketing
Reporting cadence on food brand content marketing runs a monthly executive report plus a quarterly business review. The monthly report ships in the first business week and covers organic sessions by pillar, top 10 ranking recipes with position trend, ingredient guide ranking movements, sourcing page performance, and organic-attributed DTC revenue. Every number carries a comparison to the prior month and a plain-language interpretation the founder reads in 7 minutes.
Metrics that matter for content marketing
Metrics that matter for food brand content marketing: organic sessions by pillar, recipe rich result impressions in Search Console, organic conversion rate to hero SKU pages, organic-attributed DTC revenue, and top 20 ranking positions by monthly organic sessions. Vanity metrics that do not matter: total pageviews without conversion context, average time on page without conversion attribution, and social share counts. The monthly report skips the vanity block entirely.
Quarterly business review structure
The quarterly business review runs 90 minutes with the founder, head of content, and SEO lead. Agenda: organic traffic trend by pillar, top 10 winning content pieces, top 10 losing content pieces (candidates for refresh or removal), competitive gap analysis against 5 named competitor brands, and next quarter’s content calendar with recipes and ingredient guides queued. According to Ahrefs content marketing research, brands running quarterly content audits outperform brands running annual audits by 40 to 70 percent on organic revenue over a 24-month window.
Internal linking discipline across food brand content
Internal linking discipline across food brand content moves authority from recipe pages toward hero SKU product pages and comparison guides. Every recipe links to the hero SKU it uses inline (once in the ingredient list, once in a bottom call-out card). Every ingredient comparison guide links to 3 to 6 recipes using the winning ingredient plus the hero SKU product page. Every sourcing story links to the 2 to 4 SKUs sourced from that specific farm or cooperative.
Anchor text strategy across recipe hubs
Anchor text on internal links varies across recipe hubs to avoid over-optimization patterns Google penalizes. Exact-match anchor (“single-origin Ethiopian coffee”) runs on 20 to 30 percent of internal links. Partial-match variations (“our Ethiopian roast”) run on 30 to 40 percent. Branded anchors (the SKU name) run on 20 to 30 percent. Generic anchors (“shop the coffee”) fill the remaining 10 to 20 percent. This ratio holds ranking without triggering the over-optimization penalty that shows up on brands that anchor-text-stuff every internal link with the same exact-match keyword. Cross-reference the linking layer on our food and beverage web design page.
Link equity from ingredient guides to SKU pages
Link equity from ingredient guides passes to SKU pages when the guide’s comparison table names the hero SKU in the winning column with a product card, and when the guide’s body links to 3 to 6 recipes that use the winning ingredient. This 3-hop path (guide to recipe to SKU) pushes authority from a high-traffic informational query down to a high-intent transactional page. According to Search Engine Land SEO coverage, informational content that internally links to transactional pages produces 2 to 4 times higher organic revenue than isolated content silos.
Wrapping up content marketing for food brands
Content marketing for food brands is the organic engine that turns a DTC snack, drink, or CPG storefront into a search-driven revenue channel. Recipe hub of 40 to 100 recipes. Ingredient comparison guides at 12 to 24 pieces. Sourcing story pages at 6 to 12 pieces. Buyer intent content at 8 to 16 pieces. Creator syndication calendar with 12 to 30 creators per quarter. Refresh cadence at 12 to 24 months by pillar. Reporting with organic sessions and organic revenue attribution.
If your DTC food brand is running paid social at 20,000 dollars monthly with a broken blog and zero recipe schema, professional content marketing for food brands pays for itself inside the first 90 days on organic traffic captured. Redefine Web ships content marketing inside our monthly retainer packages. Book a call and we will walk through the last three DTC food brands we built recipe hubs for, pillar by pillar.
Anchor text on internal links varies across recipe hubs to avoid over-optimization patterns Google penalizes. Exact-match anchor (“single-origin Ethiopian coffee”) runs on 20 to 30 percent of internal links. Partial-match variations (“our Ethiopian roast”) run on 30 to 40 percent. Branded anchors (the SKU name) run on 20 to 30 percent. Generic anchors (“shop the coffee”) fill the remaining 10 to 20 percent. This ratio holds ranking without triggering the over-optimization penalty that shows up on brands that anchor-text-stuff every internal link with the same exact-match keyword. Cross-reference the linking layer on our food and beverage web design page.
Link equity from ingredient guides to SKU pages
Link equity from ingredient guides passes to SKU pages when the guide’s comparison table names the hero SKU in the winning column with a product card, and when the guide’s body links to 3 to 6 recipes that use the winning ingredient. This 3-hop path (guide to recipe to SKU) pushes authority from a high-traffic informational query down to a high-intent transactional page. According to Search Engine Land SEO coverage, informational content that internally links to transactional pages produces 2 to 4 times higher organic revenue than isolated content silos.
Wrapping up content marketing for food brands
Content marketing for food brands is the organic engine that turns a DTC snack, drink, or CPG storefront into a search-driven revenue channel. Recipe hub of 40 to 100 recipes. Ingredient comparison guides at 12 to 24 pieces. Sourcing story pages at 6 to 12 pieces. Buyer intent content at 8 to 16 pieces. Creator syndication calendar with 12 to 30 creators per quarter. Refresh cadence at 12 to 24 months by pillar. Reporting with organic sessions and organic revenue attribution.
If your DTC food brand is running paid social at 20,000 dollars monthly with a broken blog and zero recipe schema, professional content marketing for food brands pays for itself inside the first 90 days on organic traffic captured. Redefine Web ships content marketing inside our monthly retainer packages. Book a call and we will walk through the last three DTC food brands we built recipe hubs for, pillar by pillar.
Internal linking discipline across food brand content moves authority from recipe pages toward hero SKU product pages and comparison guides. Every recipe links to the hero SKU it uses inline (once in the ingredient list, once in a bottom call-out card). Every ingredient comparison guide links to 3 to 6 recipes using the winning ingredient plus the hero SKU product page. Every sourcing story links to the 2 to 4 SKUs sourced from that specific farm or cooperative.
Anchor text strategy across recipe hubs
Anchor text on internal links varies across recipe hubs to avoid over-optimization patterns Google penalizes. Exact-match anchor (“single-origin Ethiopian coffee”) runs on 20 to 30 percent of internal links. Partial-match variations (“our Ethiopian roast”) run on 30 to 40 percent. Branded anchors (the SKU name) run on 20 to 30 percent. Generic anchors (“shop the coffee”) fill the remaining 10 to 20 percent. This ratio holds ranking without triggering the over-optimization penalty that shows up on brands that anchor-text-stuff every internal link with the same exact-match keyword. Cross-reference the linking layer on our food and beverage web design page.
Link equity from ingredient guides to SKU pages
Link equity from ingredient guides passes to SKU pages when the guide’s comparison table names the hero SKU in the winning column with a product card, and when the guide’s body links to 3 to 6 recipes that use the winning ingredient. This 3-hop path (guide to recipe to SKU) pushes authority from a high-traffic informational query down to a high-intent transactional page. According to Search Engine Land SEO coverage, informational content that internally links to transactional pages produces 2 to 4 times higher organic revenue than isolated content silos.
Wrapping up content marketing for food brands
Content marketing for food brands is the organic engine that turns a DTC snack, drink, or CPG storefront into a search-driven revenue channel. Recipe hub of 40 to 100 recipes. Ingredient comparison guides at 12 to 24 pieces. Sourcing story pages at 6 to 12 pieces. Buyer intent content at 8 to 16 pieces. Creator syndication calendar with 12 to 30 creators per quarter. Refresh cadence at 12 to 24 months by pillar. Reporting with organic sessions and organic revenue attribution.
If your DTC food brand is running paid social at 20,000 dollars monthly with a broken blog and zero recipe schema, professional content marketing for food brands pays for itself inside the first 90 days on organic traffic captured. Redefine Web ships content marketing inside our monthly retainer packages. Book a call and we will walk through the last three DTC food brands we built recipe hubs for, pillar by pillar.
Content marketing for food brands starts with a recipe hub because recipe queries account for 40 to 60 percent of high-intent search volume in the food category. Every hero SKU needs 4 to 12 recipes anchored to it, each targeting a specific occasion and audience.
Skip the recipe hub and the brand loses the search real estate that pulls DTC storefront traffic month over month at zero incremental paid cost. Recipe traffic converts at 2 to 4 percent because the shopper landed with usage intent, not passive discovery, which is why food brands win on recipes.
Recipe schema and Google rich result eligibility
Every recipe page ships schema.org Recipe markup including cookTime, prepTime, recipeIngredient, recipeInstructions, nutrition, and aggregateRating. Correctly marked-up recipes qualify for Google’s recipe rich result carousel that pulls 3 to 6 times higher click-through rate than a plain blue link. The schema layer takes 15 minutes per recipe to author and 30 minutes to validate in Google Search Console. Cross-reference the recipe search stack on our food and beverage SEO page.
Recipe hub structure that scales
The recipe hub structure runs 40 to 100 recipes at maturity, organized by hero SKU (4 to 12 recipes per SKU) plus occasion tags (breakfast, weeknight dinner, meal prep, brunch, holiday). Every recipe links back to the hero SKU product page with the SKU embedded in an inline card. The hub earns internal linking value from ingredient comparison guides and the sourcing story pages, which feeds recipe ranking on Google. According to Google Search Central recipe structured data guidance, complete Recipe schema markup is required for eligibility in the recipe carousel and the ingredient search filter.
Pillar structure for food brand content marketing
The pillar structure on content marketing for food brands runs 4 content pillars concurrently: recipe hub (40 to 100 recipes), ingredient comparison guides (12 to 24 guides), sourcing story pages (6 to 12 pages), and buyer intent content (where to buy, subscription vs. one-time, gift bundle guides). Every pillar covers a distinct search intent and every pillar links back to the hero SKU product pages.
Ingredient comparison guide format
Ingredient comparison guides run 1,800 to 3,200 words comparing 2 to 4 ingredient types on 6 to 10 attributes with a comparison table, real-world use case examples, and links to the hero SKU that uses the specific ingredient. Example: organic vs. conventional oats compares nutritional profile, sourcing chain, cost, environmental impact, and taste on a 6-column table. The brand’s SKU appears in the winning column with a product card. These guides rank 3 to 8 months after publication and pull steady-state organic traffic.
Sourcing story pages that build trust
Sourcing story pages name the specific farms, cooperatives, or suppliers the brand sources from, with photos of the farms, farmer quotes, and specific harvest windows. A coffee brand’s Ethiopian farm page ranks for “single-origin Ethiopian coffee” and “Yirgacheffe coffee origin” plus 40 long-tail variations. The sourcing page pulls trust-building traffic that converts at 4 to 6 percent because the shopper landed pattern-matching on transparency and named provenance. Every sourcing page includes farmer or cooperative quotes, harvest dates, and a link back to 3 to 5 hero SKU pages that source from the named supplier.
Vejrø hospitality content case study
Vejrø Resort, a Danish private-island destination with an on-site restaurant focused on organic, locally sourced cuisine, joined us with strong social engagement and no organic-search real estate. Guests found the resort on Instagram but never in Google search for terms like “private island resort Denmark,” “farm-to-table hospitality Denmark,” or “Vejrø restaurant.” The same organic-search gap shows up on DTC food brands running paid social at 20,000 dollars monthly with a broken blog and zero recipe schema.
We built the conversion-focused website with on-site and off-site SEO tuned to the travel-niche keyword clusters, competitor analysis against comparable boutique resorts, and mobile-first design prioritizing guest discovery. Every page carried the structured data qualifying it for Google’s rich results in the hospitality category. Every internal link pushed authority toward the direct-booking conversion path.
Three months later, Vejrø hit 10,000 plus organic visitors, ranked for 200 plus first-page keywords, and pulled a 2.2 percent booking conversion rate from organic traffic. The same pattern applies to content marketing for food brands: recipe schema, ingredient comparison guides, and sourcing story pages pull organic traffic at 20 to 40 percent conversion into hero SKU pages inside 6 months when the content quality matches search intent and every page carries the right structured data markup. Vejrø also proved out the reporting discipline: every monthly report named the exact page, the exact keyword cluster, and the exact search feature (rich result, sitelinks, image pack) driving the incremental organic revenue instead of hiding behind aggregate traffic charts.
Recipe cadence and content calendar for food brands
Recipe cadence on a working food brand content calendar ships 2 to 4 new recipes per week during the first 6 months and drops to 1 per week at maturity. Each recipe takes 4 to 6 hours to produce (write, test in the kitchen, photograph, schema author, publish). At 3 recipes per week, the brand hits 78 recipes inside 6 months plus a backlog of ingredient comparison and sourcing content queued behind the recipe production line.
| Content pillar | Target volume year 1 | Production cost per piece | Refresh cadence |
|---|---|---|---|
| Recipe hub | 40 to 100 recipes | $180 to $320 | Every 12 months |
| Ingredient comparison guides | 12 to 24 guides | $450 to $780 | Every 18 months |
| Sourcing story pages | 6 to 12 pages | $680 to $1,200 | Every 24 months |
| Buyer intent content | 8 to 16 pieces | $220 to $420 | Every 12 months |
Photography as a content calendar constraint
Photography is the actual constraint on recipe cadence, not writing. Every recipe needs 6 to 12 photos: hero shot, ingredient flat lay, prep in progress, plated result, storage, and step shots for the schema markup. A working food brand batches photography 8 recipes at a time to keep the cost per recipe under 200 dollars. Skip the batching and the per-recipe cost climbs to 400 to 600 dollars, which caps recipe cadence at 1 per week and slows organic ranking timeline by 6 months.
Seasonal content calendar planning
Seasonal content calendar planning maps recipes and comparison guides to the seasonal windows they need to rank in. A Christmas cookie recipe needs to publish in September to rank by early December. A Valentine’s chocolate guide needs to publish in November to rank by early February. A back-to-school lunchbox recipe needs to publish in June to rank by late August. The 60-to-90-day ranking curve dictates the calendar.
Creator syndication inside food brand content
Creator syndication on food brand content marketing amplifies the recipe hub through Instagram Reels, TikTok, and YouTube Shorts creators paid to post their own version of the brand’s hero recipes. The creator content pulls net-new audiences into the recipe hub through the creator’s Link in Bio or Amazon Storefront tag. The syndication calendar names 12 to 30 creators per quarter with specific recipes assigned to each.
One brand we picked up had a spreadsheet titled “creator outreach 2023” with 47 rows and 3 responses. All 3 responses were auto-replies. The spreadsheet named zero recipes and offered flat rates below 100 dollars per post. Nobody posts a 30-second video for 87 dollars flat. Nobody.
Creator content commercial terms that work
Working creator content commercial terms run 350 to 1,500 dollars flat per post plus a 12 to 25 percent commission on tagged sales across a 30-day window. The commission mechanic pulls creators into follow-up posts because the incremental revenue continues past the initial fee. Mid-tier creators (30k to 150k followers) hit the sweet spot for food brand content because their engagement rate typically runs 4 to 8 percent versus 0.8 to 1.6 percent on mega-creators.
Content brief structure for creator partnerships
The content brief structure for creator partnerships runs a single page: the SKU, the specific recipe or usage occasion, 3 required brand mentions, 3 restricted claims (no health claims on non-medical SKUs), the pricing angle, the affiliate link, and 3 example videos that hit the tone. The brief avoids over-scripting because over-scripted creator content underperforms native creator voice by 40 to 60 percent on engagement rate.
Buyer intent content for food brand blogs
Buyer intent content on food brand blogs covers 8 to 16 pieces targeting explicit purchase-decision queries: “where to buy [brand],” “[brand] subscription vs. one-time,” “best [category] for [use case],” and “[brand] gift bundle.” Every buyer intent piece runs 1,400 to 2,400 words with a comparison table, product cards, and a clear conversion path to the specific SKU that matches the query intent. Buyer intent content converts at 3 to 6 percent versus 1 to 2 percent on recipe content because the shopper landed already planning to buy, not exploring a usage occasion.
Where-to-buy content structure
Where-to-buy content structure covers online (DTC storefront, Amazon, Target.com, Whole Foods online), retail (specific chain locators with the store finder embedded), and international (customs limitations, retailer partners abroad). Every piece names specific retailers, links to the store locator, and includes an FAQ block covering shipping availability, subscription options, and gift card compatibility. Where-to-buy content ranks for branded discovery queries the DTC storefront otherwise loses to competitor affiliate reviews.
Subscription versus one-time comparison content
Subscription versus one-time comparison content converts subscription commitments at 3 to 6 percent because it addresses the price-sensitivity concern head-on with a specific math table. The piece covers the discount structure (15 percent lifetime), the skip-a-month mechanic, the pause-anytime rule, the cancellation policy, and the specific yearly savings for the brand’s average consumption cadence. Cross-reference the retention structure on our food and beverage marketing retainer page.
Content refresh cadence on food brand pillars
Content refresh cadence on food brand content pillars runs a rolling audit every 12 to 24 months by pillar. Recipes get refreshed every 12 months with new photography, updated schema, and any nutrition or ingredient adjustments. Ingredient comparison guides refresh every 18 months to update market data. Sourcing story pages refresh every 24 months to reflect farm partnership changes and new harvest angles. Buyer intent content refreshes every 12 months to update retailer availability and pricing.
Recipe refresh priority order
Recipe refresh priority runs by organic traffic rank. The top 20 recipes by monthly organic sessions get refreshed first (new photography, schema audit, related recipe internal links, updated nutrition). The next 40 get refreshed at 15 months. The remaining recipes get refreshed opportunistically when the ranking slips past position 15 in Google. Skipping the refresh cadence lets recipe rankings drift out of the top 3 inside 18 months as newer competitor recipes take the position.
Schema audit checklist per refresh
The schema audit checklist per refresh runs 8 items: Recipe schema completeness, aggregateRating count and accuracy, nutrition data accuracy, prepTime and cookTime match the recipe body, image URLs valid at CDN, related recipe internal links working, product card SKU URL live, and Google Search Console rich result eligibility validated. This checklist takes 20 minutes per recipe and prevents the schema drift that costs recipe rankings 20 to 40 positions quietly.
Reporting cadence for food brand content marketing
Reporting cadence on food brand content marketing runs a monthly executive report plus a quarterly business review. The monthly report ships in the first business week and covers organic sessions by pillar, top 10 ranking recipes with position trend, ingredient guide ranking movements, sourcing page performance, and organic-attributed DTC revenue. Every number carries a comparison to the prior month and a plain-language interpretation the founder reads in 7 minutes.
Metrics that matter for content marketing
Metrics that matter for food brand content marketing: organic sessions by pillar, recipe rich result impressions in Search Console, organic conversion rate to hero SKU pages, organic-attributed DTC revenue, and top 20 ranking positions by monthly organic sessions. Vanity metrics that do not matter: total pageviews without conversion context, average time on page without conversion attribution, and social share counts. The monthly report skips the vanity block entirely.
Quarterly business review structure
The quarterly business review runs 90 minutes with the founder, head of content, and SEO lead. Agenda: organic traffic trend by pillar, top 10 winning content pieces, top 10 losing content pieces (candidates for refresh or removal), competitive gap analysis against 5 named competitor brands, and next quarter’s content calendar with recipes and ingredient guides queued. According to Ahrefs content marketing research, brands running quarterly content audits outperform brands running annual audits by 40 to 70 percent on organic revenue over a 24-month window.
Internal linking discipline across food brand content
Internal linking discipline across food brand content moves authority from recipe pages toward hero SKU product pages and comparison guides. Every recipe links to the hero SKU it uses inline (once in the ingredient list, once in a bottom call-out card). Every ingredient comparison guide links to 3 to 6 recipes using the winning ingredient plus the hero SKU product page. Every sourcing story links to the 2 to 4 SKUs sourced from that specific farm or cooperative.
Anchor text strategy across recipe hubs
Anchor text on internal links varies across recipe hubs to avoid over-optimization patterns Google penalizes. Exact-match anchor (“single-origin Ethiopian coffee”) runs on 20 to 30 percent of internal links. Partial-match variations (“our Ethiopian roast”) run on 30 to 40 percent. Branded anchors (the SKU name) run on 20 to 30 percent. Generic anchors (“shop the coffee”) fill the remaining 10 to 20 percent. This ratio holds ranking without triggering the over-optimization penalty that shows up on brands that anchor-text-stuff every internal link with the same exact-match keyword. Cross-reference the linking layer on our food and beverage web design page.
Link equity from ingredient guides to SKU pages
Link equity from ingredient guides passes to SKU pages when the guide’s comparison table names the hero SKU in the winning column with a product card, and when the guide’s body links to 3 to 6 recipes that use the winning ingredient. This 3-hop path (guide to recipe to SKU) pushes authority from a high-traffic informational query down to a high-intent transactional page. According to Search Engine Land SEO coverage, informational content that internally links to transactional pages produces 2 to 4 times higher organic revenue than isolated content silos.
Wrapping up content marketing for food brands
Content marketing for food brands is the organic engine that turns a DTC snack, drink, or CPG storefront into a search-driven revenue channel. Recipe hub of 40 to 100 recipes. Ingredient comparison guides at 12 to 24 pieces. Sourcing story pages at 6 to 12 pieces. Buyer intent content at 8 to 16 pieces. Creator syndication calendar with 12 to 30 creators per quarter. Refresh cadence at 12 to 24 months by pillar. Reporting with organic sessions and organic revenue attribution.
If your DTC food brand is running paid social at 20,000 dollars monthly with a broken blog and zero recipe schema, professional content marketing for food brands pays for itself inside the first 90 days on organic traffic captured. Redefine Web ships content marketing inside our monthly retainer packages. Book a call and we will walk through the last three DTC food brands we built recipe hubs for, pillar by pillar.
Content marketing for food brands starts with a recipe hub because recipe queries account for 40 to 60 percent of high-intent search volume in the food category. Every hero SKU needs 4 to 12 recipes anchored to it, each targeting a specific occasion and audience.
Skip the recipe hub and the brand loses the search real estate that pulls DTC storefront traffic month over month at zero incremental paid cost. Recipe traffic converts at 2 to 4 percent because the shopper landed with usage intent, not passive discovery, which is why food brands win on recipes.
Recipe schema and Google rich result eligibility
Every recipe page ships schema.org Recipe markup including cookTime, prepTime, recipeIngredient, recipeInstructions, nutrition, and aggregateRating. Correctly marked-up recipes qualify for Google’s recipe rich result carousel that pulls 3 to 6 times higher click-through rate than a plain blue link. The schema layer takes 15 minutes per recipe to author and 30 minutes to validate in Google Search Console. Cross-reference the recipe search stack on our food and beverage SEO page.
Recipe hub structure that scales
The recipe hub structure runs 40 to 100 recipes at maturity, organized by hero SKU (4 to 12 recipes per SKU) plus occasion tags (breakfast, weeknight dinner, meal prep, brunch, holiday). Every recipe links back to the hero SKU product page with the SKU embedded in an inline card. The hub earns internal linking value from ingredient comparison guides and the sourcing story pages, which feeds recipe ranking on Google. According to Google Search Central recipe structured data guidance, complete Recipe schema markup is required for eligibility in the recipe carousel and the ingredient search filter.
Pillar structure for food brand content marketing
The pillar structure on content marketing for food brands runs 4 content pillars concurrently: recipe hub (40 to 100 recipes), ingredient comparison guides (12 to 24 guides), sourcing story pages (6 to 12 pages), and buyer intent content (where to buy, subscription vs. one-time, gift bundle guides). Every pillar covers a distinct search intent and every pillar links back to the hero SKU product pages.
Ingredient comparison guide format
Ingredient comparison guides run 1,800 to 3,200 words comparing 2 to 4 ingredient types on 6 to 10 attributes with a comparison table, real-world use case examples, and links to the hero SKU that uses the specific ingredient. Example: organic vs. conventional oats compares nutritional profile, sourcing chain, cost, environmental impact, and taste on a 6-column table. The brand’s SKU appears in the winning column with a product card. These guides rank 3 to 8 months after publication and pull steady-state organic traffic.
Sourcing story pages that build trust
Sourcing story pages name the specific farms, cooperatives, or suppliers the brand sources from, with photos of the farms, farmer quotes, and specific harvest windows. A coffee brand’s Ethiopian farm page ranks for “single-origin Ethiopian coffee” and “Yirgacheffe coffee origin” plus 40 long-tail variations. The sourcing page pulls trust-building traffic that converts at 4 to 6 percent because the shopper landed pattern-matching on transparency and named provenance. Every sourcing page includes farmer or cooperative quotes, harvest dates, and a link back to 3 to 5 hero SKU pages that source from the named supplier.
Vejrø hospitality content case study
Vejrø Resort, a Danish private-island destination with an on-site restaurant focused on organic, locally sourced cuisine, joined us with strong social engagement and no organic-search real estate. Guests found the resort on Instagram but never in Google search for terms like “private island resort Denmark,” “farm-to-table hospitality Denmark,” or “Vejrø restaurant.” The same organic-search gap shows up on DTC food brands running paid social at 20,000 dollars monthly with a broken blog and zero recipe schema.
We built the conversion-focused website with on-site and off-site SEO tuned to the travel-niche keyword clusters, competitor analysis against comparable boutique resorts, and mobile-first design prioritizing guest discovery. Every page carried the structured data qualifying it for Google’s rich results in the hospitality category. Every internal link pushed authority toward the direct-booking conversion path.
Three months later, Vejrø hit 10,000 plus organic visitors, ranked for 200 plus first-page keywords, and pulled a 2.2 percent booking conversion rate from organic traffic. The same pattern applies to content marketing for food brands: recipe schema, ingredient comparison guides, and sourcing story pages pull organic traffic at 20 to 40 percent conversion into hero SKU pages inside 6 months when the content quality matches search intent and every page carries the right structured data markup. Vejrø also proved out the reporting discipline: every monthly report named the exact page, the exact keyword cluster, and the exact search feature (rich result, sitelinks, image pack) driving the incremental organic revenue instead of hiding behind aggregate traffic charts.
Recipe cadence and content calendar for food brands
Recipe cadence on a working food brand content calendar ships 2 to 4 new recipes per week during the first 6 months and drops to 1 per week at maturity. Each recipe takes 4 to 6 hours to produce (write, test in the kitchen, photograph, schema author, publish). At 3 recipes per week, the brand hits 78 recipes inside 6 months plus a backlog of ingredient comparison and sourcing content queued behind the recipe production line.
| Content pillar | Target volume year 1 | Production cost per piece | Refresh cadence |
|---|---|---|---|
| Recipe hub | 40 to 100 recipes | $180 to $320 | Every 12 months |
| Ingredient comparison guides | 12 to 24 guides | $450 to $780 | Every 18 months |
| Sourcing story pages | 6 to 12 pages | $680 to $1,200 | Every 24 months |
| Buyer intent content | 8 to 16 pieces | $220 to $420 | Every 12 months |
Photography as a content calendar constraint
Photography is the actual constraint on recipe cadence, not writing. Every recipe needs 6 to 12 photos: hero shot, ingredient flat lay, prep in progress, plated result, storage, and step shots for the schema markup. A working food brand batches photography 8 recipes at a time to keep the cost per recipe under 200 dollars. Skip the batching and the per-recipe cost climbs to 400 to 600 dollars, which caps recipe cadence at 1 per week and slows organic ranking timeline by 6 months.
Seasonal content calendar planning
Seasonal content calendar planning maps recipes and comparison guides to the seasonal windows they need to rank in. A Christmas cookie recipe needs to publish in September to rank by early December. A Valentine’s chocolate guide needs to publish in November to rank by early February. A back-to-school lunchbox recipe needs to publish in June to rank by late August. The 60-to-90-day ranking curve dictates the calendar.
Creator syndication inside food brand content
Creator syndication on food brand content marketing amplifies the recipe hub through Instagram Reels, TikTok, and YouTube Shorts creators paid to post their own version of the brand’s hero recipes. The creator content pulls net-new audiences into the recipe hub through the creator’s Link in Bio or Amazon Storefront tag. The syndication calendar names 12 to 30 creators per quarter with specific recipes assigned to each.
One brand we picked up had a spreadsheet titled “creator outreach 2023” with 47 rows and 3 responses. All 3 responses were auto-replies. The spreadsheet named zero recipes and offered flat rates below 100 dollars per post. Nobody posts a 30-second video for 87 dollars flat. Nobody.
Creator content commercial terms that work
Working creator content commercial terms run 350 to 1,500 dollars flat per post plus a 12 to 25 percent commission on tagged sales across a 30-day window. The commission mechanic pulls creators into follow-up posts because the incremental revenue continues past the initial fee. Mid-tier creators (30k to 150k followers) hit the sweet spot for food brand content because their engagement rate typically runs 4 to 8 percent versus 0.8 to 1.6 percent on mega-creators.
Content brief structure for creator partnerships
The content brief structure for creator partnerships runs a single page: the SKU, the specific recipe or usage occasion, 3 required brand mentions, 3 restricted claims (no health claims on non-medical SKUs), the pricing angle, the affiliate link, and 3 example videos that hit the tone. The brief avoids over-scripting because over-scripted creator content underperforms native creator voice by 40 to 60 percent on engagement rate.
Buyer intent content for food brand blogs
Buyer intent content on food brand blogs covers 8 to 16 pieces targeting explicit purchase-decision queries: “where to buy [brand],” “[brand] subscription vs. one-time,” “best [category] for [use case],” and “[brand] gift bundle.” Every buyer intent piece runs 1,400 to 2,400 words with a comparison table, product cards, and a clear conversion path to the specific SKU that matches the query intent. Buyer intent content converts at 3 to 6 percent versus 1 to 2 percent on recipe content because the shopper landed already planning to buy, not exploring a usage occasion.
Where-to-buy content structure
Where-to-buy content structure covers online (DTC storefront, Amazon, Target.com, Whole Foods online), retail (specific chain locators with the store finder embedded), and international (customs limitations, retailer partners abroad). Every piece names specific retailers, links to the store locator, and includes an FAQ block covering shipping availability, subscription options, and gift card compatibility. Where-to-buy content ranks for branded discovery queries the DTC storefront otherwise loses to competitor affiliate reviews.
Subscription versus one-time comparison content
Subscription versus one-time comparison content converts subscription commitments at 3 to 6 percent because it addresses the price-sensitivity concern head-on with a specific math table. The piece covers the discount structure (15 percent lifetime), the skip-a-month mechanic, the pause-anytime rule, the cancellation policy, and the specific yearly savings for the brand’s average consumption cadence. Cross-reference the retention structure on our food and beverage marketing retainer page.
Content refresh cadence on food brand pillars
Content refresh cadence on food brand content pillars runs a rolling audit every 12 to 24 months by pillar. Recipes get refreshed every 12 months with new photography, updated schema, and any nutrition or ingredient adjustments. Ingredient comparison guides refresh every 18 months to update market data. Sourcing story pages refresh every 24 months to reflect farm partnership changes and new harvest angles. Buyer intent content refreshes every 12 months to update retailer availability and pricing.
Recipe refresh priority order
Recipe refresh priority runs by organic traffic rank. The top 20 recipes by monthly organic sessions get refreshed first (new photography, schema audit, related recipe internal links, updated nutrition). The next 40 get refreshed at 15 months. The remaining recipes get refreshed opportunistically when the ranking slips past position 15 in Google. Skipping the refresh cadence lets recipe rankings drift out of the top 3 inside 18 months as newer competitor recipes take the position.
Schema audit checklist per refresh
The schema audit checklist per refresh runs 8 items: Recipe schema completeness, aggregateRating count and accuracy, nutrition data accuracy, prepTime and cookTime match the recipe body, image URLs valid at CDN, related recipe internal links working, product card SKU URL live, and Google Search Console rich result eligibility validated. This checklist takes 20 minutes per recipe and prevents the schema drift that costs recipe rankings 20 to 40 positions quietly.
Reporting cadence for food brand content marketing
Reporting cadence on food brand content marketing runs a monthly executive report plus a quarterly business review. The monthly report ships in the first business week and covers organic sessions by pillar, top 10 ranking recipes with position trend, ingredient guide ranking movements, sourcing page performance, and organic-attributed DTC revenue. Every number carries a comparison to the prior month and a plain-language interpretation the founder reads in 7 minutes.
Metrics that matter for content marketing
Metrics that matter for food brand content marketing: organic sessions by pillar, recipe rich result impressions in Search Console, organic conversion rate to hero SKU pages, organic-attributed DTC revenue, and top 20 ranking positions by monthly organic sessions. Vanity metrics that do not matter: total pageviews without conversion context, average time on page without conversion attribution, and social share counts. The monthly report skips the vanity block entirely.
Quarterly business review structure
The quarterly business review runs 90 minutes with the founder, head of content, and SEO lead. Agenda: organic traffic trend by pillar, top 10 winning content pieces, top 10 losing content pieces (candidates for refresh or removal), competitive gap analysis against 5 named competitor brands, and next quarter’s content calendar with recipes and ingredient guides queued. According to Ahrefs content marketing research, brands running quarterly content audits outperform brands running annual audits by 40 to 70 percent on organic revenue over a 24-month window.
Internal linking discipline across food brand content
Internal linking discipline across food brand content moves authority from recipe pages toward hero SKU product pages and comparison guides. Every recipe links to the hero SKU it uses inline (once in the ingredient list, once in a bottom call-out card). Every ingredient comparison guide links to 3 to 6 recipes using the winning ingredient plus the hero SKU product page. Every sourcing story links to the 2 to 4 SKUs sourced from that specific farm or cooperative.
Anchor text strategy across recipe hubs
Anchor text on internal links varies across recipe hubs to avoid over-optimization patterns Google penalizes. Exact-match anchor (“single-origin Ethiopian coffee”) runs on 20 to 30 percent of internal links. Partial-match variations (“our Ethiopian roast”) run on 30 to 40 percent. Branded anchors (the SKU name) run on 20 to 30 percent. Generic anchors (“shop the coffee”) fill the remaining 10 to 20 percent. This ratio holds ranking without triggering the over-optimization penalty that shows up on brands that anchor-text-stuff every internal link with the same exact-match keyword. Cross-reference the linking layer on our food and beverage web design page.
Link equity from ingredient guides to SKU pages
Link equity from ingredient guides passes to SKU pages when the guide’s comparison table names the hero SKU in the winning column with a product card, and when the guide’s body links to 3 to 6 recipes that use the winning ingredient. This 3-hop path (guide to recipe to SKU) pushes authority from a high-traffic informational query down to a high-intent transactional page. According to Search Engine Land SEO coverage, informational content that internally links to transactional pages produces 2 to 4 times higher organic revenue than isolated content silos.
Wrapping up content marketing for food brands
Content marketing for food brands is the organic engine that turns a DTC snack, drink, or CPG storefront into a search-driven revenue channel. Recipe hub of 40 to 100 recipes. Ingredient comparison guides at 12 to 24 pieces. Sourcing story pages at 6 to 12 pieces. Buyer intent content at 8 to 16 pieces. Creator syndication calendar with 12 to 30 creators per quarter. Refresh cadence at 12 to 24 months by pillar. Reporting with organic sessions and organic revenue attribution.
If your DTC food brand is running paid social at 20,000 dollars monthly with a broken blog and zero recipe schema, professional content marketing for food brands pays for itself inside the first 90 days on organic traffic captured. Redefine Web ships content marketing inside our monthly retainer packages. Book a call and we will walk through the last three DTC food brands we built recipe hubs for, pillar by pillar.
Content marketing for food brands is the organic engine that turns a DTC snack, drink, or CPG storefront into a search-driven revenue channel that pulls month-over-month sales without paying Meta a second acquisition cost. The scope covers a recipe hub of 40 to 100 recipes tied to hero SKUs, ingredient comparison guides (organic vs. conventional, whole vs. refined, single-origin vs. blend), sourcing story pages naming the farms and suppliers, a creator content syndication calendar, and a schema markup layer that qualifies every recipe for Google’s recipe rich result.
Skip content marketing for food brands and the storefront ranks nowhere on Google for the terms that drive 60 percent of DTC food discovery: recipe queries, ingredient comparison queries, and “where to buy” queries the brand’s own name plus retailer city combinations. Boogie Board pushed organic traffic from 3,400 to 28,000 monthly sessions inside 6 months of building a 60-recipe hub tied to hero SKUs. This guide walks the pillar structure, the recipe schema, the creator syndication calendar, and the reporting cadence.

Why content marketing for food brands is a recipe hub first
Link equity from ingredient guides passes to SKU pages when the guide’s comparison table names the hero SKU in the winning column with a product card, and when the guide’s body links to 3 to 6 recipes that use the winning ingredient. This 3-hop path (guide to recipe to SKU) pushes authority from a high-traffic informational query down to a high-intent transactional page. According to Search Engine Land SEO coverage, informational content that internally links to transactional pages produces 2 to 4 times higher organic revenue than isolated content silos.
Wrapping up content marketing for food brands
Content marketing for food brands is the organic engine that turns a DTC snack, drink, or CPG storefront into a search-driven revenue channel. Recipe hub of 40 to 100 recipes. Ingredient comparison guides at 12 to 24 pieces. Sourcing story pages at 6 to 12 pieces. Buyer intent content at 8 to 16 pieces. Creator syndication calendar with 12 to 30 creators per quarter. Refresh cadence at 12 to 24 months by pillar. Reporting with organic sessions and organic revenue attribution.
If your DTC food brand is running paid social at 20,000 dollars monthly with a broken blog and zero recipe schema, professional content marketing for food brands pays for itself inside the first 90 days on organic traffic captured. Redefine Web ships content marketing inside our monthly retainer packages. Book a call and we will walk through the last three DTC food brands we built recipe hubs for, pillar by pillar.
Anchor text on internal links varies across recipe hubs to avoid over-optimization patterns Google penalizes. Exact-match anchor (“single-origin Ethiopian coffee”) runs on 20 to 30 percent of internal links. Partial-match variations (“our Ethiopian roast”) run on 30 to 40 percent. Branded anchors (the SKU name) run on 20 to 30 percent. Generic anchors (“shop the coffee”) fill the remaining 10 to 20 percent. This ratio holds ranking without triggering the over-optimization penalty that shows up on brands that anchor-text-stuff every internal link with the same exact-match keyword. Cross-reference the linking layer on our food and beverage web design page.
Link equity from ingredient guides to SKU pages
Link equity from ingredient guides passes to SKU pages when the guide’s comparison table names the hero SKU in the winning column with a product card, and when the guide’s body links to 3 to 6 recipes that use the winning ingredient. This 3-hop path (guide to recipe to SKU) pushes authority from a high-traffic informational query down to a high-intent transactional page. According to Search Engine Land SEO coverage, informational content that internally links to transactional pages produces 2 to 4 times higher organic revenue than isolated content silos.
Wrapping up content marketing for food brands
Content marketing for food brands is the organic engine that turns a DTC snack, drink, or CPG storefront into a search-driven revenue channel. Recipe hub of 40 to 100 recipes. Ingredient comparison guides at 12 to 24 pieces. Sourcing story pages at 6 to 12 pieces. Buyer intent content at 8 to 16 pieces. Creator syndication calendar with 12 to 30 creators per quarter. Refresh cadence at 12 to 24 months by pillar. Reporting with organic sessions and organic revenue attribution.
If your DTC food brand is running paid social at 20,000 dollars monthly with a broken blog and zero recipe schema, professional content marketing for food brands pays for itself inside the first 90 days on organic traffic captured. Redefine Web ships content marketing inside our monthly retainer packages. Book a call and we will walk through the last three DTC food brands we built recipe hubs for, pillar by pillar.
Internal linking discipline across food brand content moves authority from recipe pages toward hero SKU product pages and comparison guides. Every recipe links to the hero SKU it uses inline (once in the ingredient list, once in a bottom call-out card). Every ingredient comparison guide links to 3 to 6 recipes using the winning ingredient plus the hero SKU product page. Every sourcing story links to the 2 to 4 SKUs sourced from that specific farm or cooperative.
Anchor text strategy across recipe hubs
Anchor text on internal links varies across recipe hubs to avoid over-optimization patterns Google penalizes. Exact-match anchor (“single-origin Ethiopian coffee”) runs on 20 to 30 percent of internal links. Partial-match variations (“our Ethiopian roast”) run on 30 to 40 percent. Branded anchors (the SKU name) run on 20 to 30 percent. Generic anchors (“shop the coffee”) fill the remaining 10 to 20 percent. This ratio holds ranking without triggering the over-optimization penalty that shows up on brands that anchor-text-stuff every internal link with the same exact-match keyword. Cross-reference the linking layer on our food and beverage web design page.
Link equity from ingredient guides to SKU pages
Link equity from ingredient guides passes to SKU pages when the guide’s comparison table names the hero SKU in the winning column with a product card, and when the guide’s body links to 3 to 6 recipes that use the winning ingredient. This 3-hop path (guide to recipe to SKU) pushes authority from a high-traffic informational query down to a high-intent transactional page. According to Search Engine Land SEO coverage, informational content that internally links to transactional pages produces 2 to 4 times higher organic revenue than isolated content silos.
Wrapping up content marketing for food brands
Content marketing for food brands is the organic engine that turns a DTC snack, drink, or CPG storefront into a search-driven revenue channel. Recipe hub of 40 to 100 recipes. Ingredient comparison guides at 12 to 24 pieces. Sourcing story pages at 6 to 12 pieces. Buyer intent content at 8 to 16 pieces. Creator syndication calendar with 12 to 30 creators per quarter. Refresh cadence at 12 to 24 months by pillar. Reporting with organic sessions and organic revenue attribution.
If your DTC food brand is running paid social at 20,000 dollars monthly with a broken blog and zero recipe schema, professional content marketing for food brands pays for itself inside the first 90 days on organic traffic captured. Redefine Web ships content marketing inside our monthly retainer packages. Book a call and we will walk through the last three DTC food brands we built recipe hubs for, pillar by pillar.
Content marketing for food brands starts with a recipe hub because recipe queries account for 40 to 60 percent of high-intent search volume in the food category. Every hero SKU needs 4 to 12 recipes anchored to it, each targeting a specific occasion and audience.
Skip the recipe hub and the brand loses the search real estate that pulls DTC storefront traffic month over month at zero incremental paid cost. Recipe traffic converts at 2 to 4 percent because the shopper landed with usage intent, not passive discovery, which is why food brands win on recipes.
Recipe schema and Google rich result eligibility
Every recipe page ships schema.org Recipe markup including cookTime, prepTime, recipeIngredient, recipeInstructions, nutrition, and aggregateRating. Correctly marked-up recipes qualify for Google’s recipe rich result carousel that pulls 3 to 6 times higher click-through rate than a plain blue link. The schema layer takes 15 minutes per recipe to author and 30 minutes to validate in Google Search Console. Cross-reference the recipe search stack on our food and beverage SEO page.
Recipe hub structure that scales
The recipe hub structure runs 40 to 100 recipes at maturity, organized by hero SKU (4 to 12 recipes per SKU) plus occasion tags (breakfast, weeknight dinner, meal prep, brunch, holiday). Every recipe links back to the hero SKU product page with the SKU embedded in an inline card. The hub earns internal linking value from ingredient comparison guides and the sourcing story pages, which feeds recipe ranking on Google. According to Google Search Central recipe structured data guidance, complete Recipe schema markup is required for eligibility in the recipe carousel and the ingredient search filter.
Pillar structure for food brand content marketing
The pillar structure on content marketing for food brands runs 4 content pillars concurrently: recipe hub (40 to 100 recipes), ingredient comparison guides (12 to 24 guides), sourcing story pages (6 to 12 pages), and buyer intent content (where to buy, subscription vs. one-time, gift bundle guides). Every pillar covers a distinct search intent and every pillar links back to the hero SKU product pages.
Ingredient comparison guide format
Ingredient comparison guides run 1,800 to 3,200 words comparing 2 to 4 ingredient types on 6 to 10 attributes with a comparison table, real-world use case examples, and links to the hero SKU that uses the specific ingredient. Example: organic vs. conventional oats compares nutritional profile, sourcing chain, cost, environmental impact, and taste on a 6-column table. The brand’s SKU appears in the winning column with a product card. These guides rank 3 to 8 months after publication and pull steady-state organic traffic.
Sourcing story pages that build trust
Sourcing story pages name the specific farms, cooperatives, or suppliers the brand sources from, with photos of the farms, farmer quotes, and specific harvest windows. A coffee brand’s Ethiopian farm page ranks for “single-origin Ethiopian coffee” and “Yirgacheffe coffee origin” plus 40 long-tail variations. The sourcing page pulls trust-building traffic that converts at 4 to 6 percent because the shopper landed pattern-matching on transparency and named provenance. Every sourcing page includes farmer or cooperative quotes, harvest dates, and a link back to 3 to 5 hero SKU pages that source from the named supplier.
Vejrø hospitality content case study
Vejrø Resort, a Danish private-island destination with an on-site restaurant focused on organic, locally sourced cuisine, joined us with strong social engagement and no organic-search real estate. Guests found the resort on Instagram but never in Google search for terms like “private island resort Denmark,” “farm-to-table hospitality Denmark,” or “Vejrø restaurant.” The same organic-search gap shows up on DTC food brands running paid social at 20,000 dollars monthly with a broken blog and zero recipe schema.
We built the conversion-focused website with on-site and off-site SEO tuned to the travel-niche keyword clusters, competitor analysis against comparable boutique resorts, and mobile-first design prioritizing guest discovery. Every page carried the structured data qualifying it for Google’s rich results in the hospitality category. Every internal link pushed authority toward the direct-booking conversion path.
Three months later, Vejrø hit 10,000 plus organic visitors, ranked for 200 plus first-page keywords, and pulled a 2.2 percent booking conversion rate from organic traffic. The same pattern applies to content marketing for food brands: recipe schema, ingredient comparison guides, and sourcing story pages pull organic traffic at 20 to 40 percent conversion into hero SKU pages inside 6 months when the content quality matches search intent and every page carries the right structured data markup. Vejrø also proved out the reporting discipline: every monthly report named the exact page, the exact keyword cluster, and the exact search feature (rich result, sitelinks, image pack) driving the incremental organic revenue instead of hiding behind aggregate traffic charts.
Recipe cadence and content calendar for food brands
Recipe cadence on a working food brand content calendar ships 2 to 4 new recipes per week during the first 6 months and drops to 1 per week at maturity. Each recipe takes 4 to 6 hours to produce (write, test in the kitchen, photograph, schema author, publish). At 3 recipes per week, the brand hits 78 recipes inside 6 months plus a backlog of ingredient comparison and sourcing content queued behind the recipe production line.
| Content pillar | Target volume year 1 | Production cost per piece | Refresh cadence |
|---|---|---|---|
| Recipe hub | 40 to 100 recipes | $180 to $320 | Every 12 months |
| Ingredient comparison guides | 12 to 24 guides | $450 to $780 | Every 18 months |
| Sourcing story pages | 6 to 12 pages | $680 to $1,200 | Every 24 months |
| Buyer intent content | 8 to 16 pieces | $220 to $420 | Every 12 months |
Photography as a content calendar constraint
Photography is the actual constraint on recipe cadence, not writing. Every recipe needs 6 to 12 photos: hero shot, ingredient flat lay, prep in progress, plated result, storage, and step shots for the schema markup. A working food brand batches photography 8 recipes at a time to keep the cost per recipe under 200 dollars. Skip the batching and the per-recipe cost climbs to 400 to 600 dollars, which caps recipe cadence at 1 per week and slows organic ranking timeline by 6 months.
Seasonal content calendar planning
Seasonal content calendar planning maps recipes and comparison guides to the seasonal windows they need to rank in. A Christmas cookie recipe needs to publish in September to rank by early December. A Valentine’s chocolate guide needs to publish in November to rank by early February. A back-to-school lunchbox recipe needs to publish in June to rank by late August. The 60-to-90-day ranking curve dictates the calendar.
Creator syndication inside food brand content
Creator syndication on food brand content marketing amplifies the recipe hub through Instagram Reels, TikTok, and YouTube Shorts creators paid to post their own version of the brand’s hero recipes. The creator content pulls net-new audiences into the recipe hub through the creator’s Link in Bio or Amazon Storefront tag. The syndication calendar names 12 to 30 creators per quarter with specific recipes assigned to each.
One brand we picked up had a spreadsheet titled “creator outreach 2023” with 47 rows and 3 responses. All 3 responses were auto-replies. The spreadsheet named zero recipes and offered flat rates below 100 dollars per post. Nobody posts a 30-second video for 87 dollars flat. Nobody.
Creator content commercial terms that work
Working creator content commercial terms run 350 to 1,500 dollars flat per post plus a 12 to 25 percent commission on tagged sales across a 30-day window. The commission mechanic pulls creators into follow-up posts because the incremental revenue continues past the initial fee. Mid-tier creators (30k to 150k followers) hit the sweet spot for food brand content because their engagement rate typically runs 4 to 8 percent versus 0.8 to 1.6 percent on mega-creators.
Content brief structure for creator partnerships
The content brief structure for creator partnerships runs a single page: the SKU, the specific recipe or usage occasion, 3 required brand mentions, 3 restricted claims (no health claims on non-medical SKUs), the pricing angle, the affiliate link, and 3 example videos that hit the tone. The brief avoids over-scripting because over-scripted creator content underperforms native creator voice by 40 to 60 percent on engagement rate.
Buyer intent content for food brand blogs
Buyer intent content on food brand blogs covers 8 to 16 pieces targeting explicit purchase-decision queries: “where to buy [brand],” “[brand] subscription vs. one-time,” “best [category] for [use case],” and “[brand] gift bundle.” Every buyer intent piece runs 1,400 to 2,400 words with a comparison table, product cards, and a clear conversion path to the specific SKU that matches the query intent. Buyer intent content converts at 3 to 6 percent versus 1 to 2 percent on recipe content because the shopper landed already planning to buy, not exploring a usage occasion.
Where-to-buy content structure
Where-to-buy content structure covers online (DTC storefront, Amazon, Target.com, Whole Foods online), retail (specific chain locators with the store finder embedded), and international (customs limitations, retailer partners abroad). Every piece names specific retailers, links to the store locator, and includes an FAQ block covering shipping availability, subscription options, and gift card compatibility. Where-to-buy content ranks for branded discovery queries the DTC storefront otherwise loses to competitor affiliate reviews.
Subscription versus one-time comparison content
Subscription versus one-time comparison content converts subscription commitments at 3 to 6 percent because it addresses the price-sensitivity concern head-on with a specific math table. The piece covers the discount structure (15 percent lifetime), the skip-a-month mechanic, the pause-anytime rule, the cancellation policy, and the specific yearly savings for the brand’s average consumption cadence. Cross-reference the retention structure on our food and beverage marketing retainer page.
Content refresh cadence on food brand pillars
Content refresh cadence on food brand content pillars runs a rolling audit every 12 to 24 months by pillar. Recipes get refreshed every 12 months with new photography, updated schema, and any nutrition or ingredient adjustments. Ingredient comparison guides refresh every 18 months to update market data. Sourcing story pages refresh every 24 months to reflect farm partnership changes and new harvest angles. Buyer intent content refreshes every 12 months to update retailer availability and pricing.
Recipe refresh priority order
Recipe refresh priority runs by organic traffic rank. The top 20 recipes by monthly organic sessions get refreshed first (new photography, schema audit, related recipe internal links, updated nutrition). The next 40 get refreshed at 15 months. The remaining recipes get refreshed opportunistically when the ranking slips past position 15 in Google. Skipping the refresh cadence lets recipe rankings drift out of the top 3 inside 18 months as newer competitor recipes take the position.
Schema audit checklist per refresh
The schema audit checklist per refresh runs 8 items: Recipe schema completeness, aggregateRating count and accuracy, nutrition data accuracy, prepTime and cookTime match the recipe body, image URLs valid at CDN, related recipe internal links working, product card SKU URL live, and Google Search Console rich result eligibility validated. This checklist takes 20 minutes per recipe and prevents the schema drift that costs recipe rankings 20 to 40 positions quietly.
Reporting cadence for food brand content marketing
Reporting cadence on food brand content marketing runs a monthly executive report plus a quarterly business review. The monthly report ships in the first business week and covers organic sessions by pillar, top 10 ranking recipes with position trend, ingredient guide ranking movements, sourcing page performance, and organic-attributed DTC revenue. Every number carries a comparison to the prior month and a plain-language interpretation the founder reads in 7 minutes.
Metrics that matter for content marketing
Metrics that matter for food brand content marketing: organic sessions by pillar, recipe rich result impressions in Search Console, organic conversion rate to hero SKU pages, organic-attributed DTC revenue, and top 20 ranking positions by monthly organic sessions. Vanity metrics that do not matter: total pageviews without conversion context, average time on page without conversion attribution, and social share counts. The monthly report skips the vanity block entirely.
Quarterly business review structure
The quarterly business review runs 90 minutes with the founder, head of content, and SEO lead. Agenda: organic traffic trend by pillar, top 10 winning content pieces, top 10 losing content pieces (candidates for refresh or removal), competitive gap analysis against 5 named competitor brands, and next quarter’s content calendar with recipes and ingredient guides queued. According to Ahrefs content marketing research, brands running quarterly content audits outperform brands running annual audits by 40 to 70 percent on organic revenue over a 24-month window.
Internal linking discipline across food brand content
Internal linking discipline across food brand content moves authority from recipe pages toward hero SKU product pages and comparison guides. Every recipe links to the hero SKU it uses inline (once in the ingredient list, once in a bottom call-out card). Every ingredient comparison guide links to 3 to 6 recipes using the winning ingredient plus the hero SKU product page. Every sourcing story links to the 2 to 4 SKUs sourced from that specific farm or cooperative.
Anchor text strategy across recipe hubs
Anchor text on internal links varies across recipe hubs to avoid over-optimization patterns Google penalizes. Exact-match anchor (“single-origin Ethiopian coffee”) runs on 20 to 30 percent of internal links. Partial-match variations (“our Ethiopian roast”) run on 30 to 40 percent. Branded anchors (the SKU name) run on 20 to 30 percent. Generic anchors (“shop the coffee”) fill the remaining 10 to 20 percent. This ratio holds ranking without triggering the over-optimization penalty that shows up on brands that anchor-text-stuff every internal link with the same exact-match keyword. Cross-reference the linking layer on our food and beverage web design page.
Link equity from ingredient guides to SKU pages
Link equity from ingredient guides passes to SKU pages when the guide’s comparison table names the hero SKU in the winning column with a product card, and when the guide’s body links to 3 to 6 recipes that use the winning ingredient. This 3-hop path (guide to recipe to SKU) pushes authority from a high-traffic informational query down to a high-intent transactional page. According to Search Engine Land SEO coverage, informational content that internally links to transactional pages produces 2 to 4 times higher organic revenue than isolated content silos.
Wrapping up content marketing for food brands
Content marketing for food brands is the organic engine that turns a DTC snack, drink, or CPG storefront into a search-driven revenue channel. Recipe hub of 40 to 100 recipes. Ingredient comparison guides at 12 to 24 pieces. Sourcing story pages at 6 to 12 pieces. Buyer intent content at 8 to 16 pieces. Creator syndication calendar with 12 to 30 creators per quarter. Refresh cadence at 12 to 24 months by pillar. Reporting with organic sessions and organic revenue attribution.
If your DTC food brand is running paid social at 20,000 dollars monthly with a broken blog and zero recipe schema, professional content marketing for food brands pays for itself inside the first 90 days on organic traffic captured. Redefine Web ships content marketing inside our monthly retainer packages. Book a call and we will walk through the last three DTC food brands we built recipe hubs for, pillar by pillar.
Content marketing for food brands starts with a recipe hub because recipe queries account for 40 to 60 percent of high-intent search volume in the food category. Every hero SKU needs 4 to 12 recipes anchored to it, each targeting a specific occasion and audience.
Skip the recipe hub and the brand loses the search real estate that pulls DTC storefront traffic month over month at zero incremental paid cost. Recipe traffic converts at 2 to 4 percent because the shopper landed with usage intent, not passive discovery, which is why food brands win on recipes.
Recipe schema and Google rich result eligibility
Every recipe page ships schema.org Recipe markup including cookTime, prepTime, recipeIngredient, recipeInstructions, nutrition, and aggregateRating. Correctly marked-up recipes qualify for Google’s recipe rich result carousel that pulls 3 to 6 times higher click-through rate than a plain blue link. The schema layer takes 15 minutes per recipe to author and 30 minutes to validate in Google Search Console. Cross-reference the recipe search stack on our food and beverage SEO page.
Recipe hub structure that scales
The recipe hub structure runs 40 to 100 recipes at maturity, organized by hero SKU (4 to 12 recipes per SKU) plus occasion tags (breakfast, weeknight dinner, meal prep, brunch, holiday). Every recipe links back to the hero SKU product page with the SKU embedded in an inline card. The hub earns internal linking value from ingredient comparison guides and the sourcing story pages, which feeds recipe ranking on Google. According to Google Search Central recipe structured data guidance, complete Recipe schema markup is required for eligibility in the recipe carousel and the ingredient search filter.
Pillar structure for food brand content marketing
The pillar structure on content marketing for food brands runs 4 content pillars concurrently: recipe hub (40 to 100 recipes), ingredient comparison guides (12 to 24 guides), sourcing story pages (6 to 12 pages), and buyer intent content (where to buy, subscription vs. one-time, gift bundle guides). Every pillar covers a distinct search intent and every pillar links back to the hero SKU product pages.
Ingredient comparison guide format
Ingredient comparison guides run 1,800 to 3,200 words comparing 2 to 4 ingredient types on 6 to 10 attributes with a comparison table, real-world use case examples, and links to the hero SKU that uses the specific ingredient. Example: organic vs. conventional oats compares nutritional profile, sourcing chain, cost, environmental impact, and taste on a 6-column table. The brand’s SKU appears in the winning column with a product card. These guides rank 3 to 8 months after publication and pull steady-state organic traffic.
Sourcing story pages that build trust
Sourcing story pages name the specific farms, cooperatives, or suppliers the brand sources from, with photos of the farms, farmer quotes, and specific harvest windows. A coffee brand’s Ethiopian farm page ranks for “single-origin Ethiopian coffee” and “Yirgacheffe coffee origin” plus 40 long-tail variations. The sourcing page pulls trust-building traffic that converts at 4 to 6 percent because the shopper landed pattern-matching on transparency and named provenance. Every sourcing page includes farmer or cooperative quotes, harvest dates, and a link back to 3 to 5 hero SKU pages that source from the named supplier.
Vejrø hospitality content case study
Vejrø Resort, a Danish private-island destination with an on-site restaurant focused on organic, locally sourced cuisine, joined us with strong social engagement and no organic-search real estate. Guests found the resort on Instagram but never in Google search for terms like “private island resort Denmark,” “farm-to-table hospitality Denmark,” or “Vejrø restaurant.” The same organic-search gap shows up on DTC food brands running paid social at 20,000 dollars monthly with a broken blog and zero recipe schema.
We built the conversion-focused website with on-site and off-site SEO tuned to the travel-niche keyword clusters, competitor analysis against comparable boutique resorts, and mobile-first design prioritizing guest discovery. Every page carried the structured data qualifying it for Google’s rich results in the hospitality category. Every internal link pushed authority toward the direct-booking conversion path.
Three months later, Vejrø hit 10,000 plus organic visitors, ranked for 200 plus first-page keywords, and pulled a 2.2 percent booking conversion rate from organic traffic. The same pattern applies to content marketing for food brands: recipe schema, ingredient comparison guides, and sourcing story pages pull organic traffic at 20 to 40 percent conversion into hero SKU pages inside 6 months when the content quality matches search intent and every page carries the right structured data markup. Vejrø also proved out the reporting discipline: every monthly report named the exact page, the exact keyword cluster, and the exact search feature (rich result, sitelinks, image pack) driving the incremental organic revenue instead of hiding behind aggregate traffic charts.
Recipe cadence and content calendar for food brands
Recipe cadence on a working food brand content calendar ships 2 to 4 new recipes per week during the first 6 months and drops to 1 per week at maturity. Each recipe takes 4 to 6 hours to produce (write, test in the kitchen, photograph, schema author, publish). At 3 recipes per week, the brand hits 78 recipes inside 6 months plus a backlog of ingredient comparison and sourcing content queued behind the recipe production line.
| Content pillar | Target volume year 1 | Production cost per piece | Refresh cadence |
|---|---|---|---|
| Recipe hub | 40 to 100 recipes | $180 to $320 | Every 12 months |
| Ingredient comparison guides | 12 to 24 guides | $450 to $780 | Every 18 months |
| Sourcing story pages | 6 to 12 pages | $680 to $1,200 | Every 24 months |
| Buyer intent content | 8 to 16 pieces | $220 to $420 | Every 12 months |
Photography as a content calendar constraint
Photography is the actual constraint on recipe cadence, not writing. Every recipe needs 6 to 12 photos: hero shot, ingredient flat lay, prep in progress, plated result, storage, and step shots for the schema markup. A working food brand batches photography 8 recipes at a time to keep the cost per recipe under 200 dollars. Skip the batching and the per-recipe cost climbs to 400 to 600 dollars, which caps recipe cadence at 1 per week and slows organic ranking timeline by 6 months.
Seasonal content calendar planning
Seasonal content calendar planning maps recipes and comparison guides to the seasonal windows they need to rank in. A Christmas cookie recipe needs to publish in September to rank by early December. A Valentine’s chocolate guide needs to publish in November to rank by early February. A back-to-school lunchbox recipe needs to publish in June to rank by late August. The 60-to-90-day ranking curve dictates the calendar.
Creator syndication inside food brand content
Creator syndication on food brand content marketing amplifies the recipe hub through Instagram Reels, TikTok, and YouTube Shorts creators paid to post their own version of the brand’s hero recipes. The creator content pulls net-new audiences into the recipe hub through the creator’s Link in Bio or Amazon Storefront tag. The syndication calendar names 12 to 30 creators per quarter with specific recipes assigned to each.
One brand we picked up had a spreadsheet titled “creator outreach 2023” with 47 rows and 3 responses. All 3 responses were auto-replies. The spreadsheet named zero recipes and offered flat rates below 100 dollars per post. Nobody posts a 30-second video for 87 dollars flat. Nobody.
Creator content commercial terms that work
Working creator content commercial terms run 350 to 1,500 dollars flat per post plus a 12 to 25 percent commission on tagged sales across a 30-day window. The commission mechanic pulls creators into follow-up posts because the incremental revenue continues past the initial fee. Mid-tier creators (30k to 150k followers) hit the sweet spot for food brand content because their engagement rate typically runs 4 to 8 percent versus 0.8 to 1.6 percent on mega-creators.
Content brief structure for creator partnerships
The content brief structure for creator partnerships runs a single page: the SKU, the specific recipe or usage occasion, 3 required brand mentions, 3 restricted claims (no health claims on non-medical SKUs), the pricing angle, the affiliate link, and 3 example videos that hit the tone. The brief avoids over-scripting because over-scripted creator content underperforms native creator voice by 40 to 60 percent on engagement rate.
Buyer intent content for food brand blogs
Buyer intent content on food brand blogs covers 8 to 16 pieces targeting explicit purchase-decision queries: “where to buy [brand],” “[brand] subscription vs. one-time,” “best [category] for [use case],” and “[brand] gift bundle.” Every buyer intent piece runs 1,400 to 2,400 words with a comparison table, product cards, and a clear conversion path to the specific SKU that matches the query intent. Buyer intent content converts at 3 to 6 percent versus 1 to 2 percent on recipe content because the shopper landed already planning to buy, not exploring a usage occasion.
Where-to-buy content structure
Where-to-buy content structure covers online (DTC storefront, Amazon, Target.com, Whole Foods online), retail (specific chain locators with the store finder embedded), and international (customs limitations, retailer partners abroad). Every piece names specific retailers, links to the store locator, and includes an FAQ block covering shipping availability, subscription options, and gift card compatibility. Where-to-buy content ranks for branded discovery queries the DTC storefront otherwise loses to competitor affiliate reviews.
Subscription versus one-time comparison content
Subscription versus one-time comparison content converts subscription commitments at 3 to 6 percent because it addresses the price-sensitivity concern head-on with a specific math table. The piece covers the discount structure (15 percent lifetime), the skip-a-month mechanic, the pause-anytime rule, the cancellation policy, and the specific yearly savings for the brand’s average consumption cadence. Cross-reference the retention structure on our food and beverage marketing retainer page.
Content refresh cadence on food brand pillars
Content refresh cadence on food brand content pillars runs a rolling audit every 12 to 24 months by pillar. Recipes get refreshed every 12 months with new photography, updated schema, and any nutrition or ingredient adjustments. Ingredient comparison guides refresh every 18 months to update market data. Sourcing story pages refresh every 24 months to reflect farm partnership changes and new harvest angles. Buyer intent content refreshes every 12 months to update retailer availability and pricing.
Recipe refresh priority order
Recipe refresh priority runs by organic traffic rank. The top 20 recipes by monthly organic sessions get refreshed first (new photography, schema audit, related recipe internal links, updated nutrition). The next 40 get refreshed at 15 months. The remaining recipes get refreshed opportunistically when the ranking slips past position 15 in Google. Skipping the refresh cadence lets recipe rankings drift out of the top 3 inside 18 months as newer competitor recipes take the position.
Schema audit checklist per refresh
The schema audit checklist per refresh runs 8 items: Recipe schema completeness, aggregateRating count and accuracy, nutrition data accuracy, prepTime and cookTime match the recipe body, image URLs valid at CDN, related recipe internal links working, product card SKU URL live, and Google Search Console rich result eligibility validated. This checklist takes 20 minutes per recipe and prevents the schema drift that costs recipe rankings 20 to 40 positions quietly.
Reporting cadence for food brand content marketing
Reporting cadence on food brand content marketing runs a monthly executive report plus a quarterly business review. The monthly report ships in the first business week and covers organic sessions by pillar, top 10 ranking recipes with position trend, ingredient guide ranking movements, sourcing page performance, and organic-attributed DTC revenue. Every number carries a comparison to the prior month and a plain-language interpretation the founder reads in 7 minutes.
Metrics that matter for content marketing
Metrics that matter for food brand content marketing: organic sessions by pillar, recipe rich result impressions in Search Console, organic conversion rate to hero SKU pages, organic-attributed DTC revenue, and top 20 ranking positions by monthly organic sessions. Vanity metrics that do not matter: total pageviews without conversion context, average time on page without conversion attribution, and social share counts. The monthly report skips the vanity block entirely.
Quarterly business review structure
The quarterly business review runs 90 minutes with the founder, head of content, and SEO lead. Agenda: organic traffic trend by pillar, top 10 winning content pieces, top 10 losing content pieces (candidates for refresh or removal), competitive gap analysis against 5 named competitor brands, and next quarter’s content calendar with recipes and ingredient guides queued. According to Ahrefs content marketing research, brands running quarterly content audits outperform brands running annual audits by 40 to 70 percent on organic revenue over a 24-month window.
Internal linking discipline across food brand content
Internal linking discipline across food brand content moves authority from recipe pages toward hero SKU product pages and comparison guides. Every recipe links to the hero SKU it uses inline (once in the ingredient list, once in a bottom call-out card). Every ingredient comparison guide links to 3 to 6 recipes using the winning ingredient plus the hero SKU product page. Every sourcing story links to the 2 to 4 SKUs sourced from that specific farm or cooperative.
Anchor text strategy across recipe hubs
Anchor text on internal links varies across recipe hubs to avoid over-optimization patterns Google penalizes. Exact-match anchor (“single-origin Ethiopian coffee”) runs on 20 to 30 percent of internal links. Partial-match variations (“our Ethiopian roast”) run on 30 to 40 percent. Branded anchors (the SKU name) run on 20 to 30 percent. Generic anchors (“shop the coffee”) fill the remaining 10 to 20 percent. This ratio holds ranking without triggering the over-optimization penalty that shows up on brands that anchor-text-stuff every internal link with the same exact-match keyword. Cross-reference the linking layer on our food and beverage web design page.
Link equity from ingredient guides to SKU pages
Link equity from ingredient guides passes to SKU pages when the guide’s comparison table names the hero SKU in the winning column with a product card, and when the guide’s body links to 3 to 6 recipes that use the winning ingredient. This 3-hop path (guide to recipe to SKU) pushes authority from a high-traffic informational query down to a high-intent transactional page. According to Search Engine Land SEO coverage, informational content that internally links to transactional pages produces 2 to 4 times higher organic revenue than isolated content silos.
Wrapping up content marketing for food brands
Content marketing for food brands is the organic engine that turns a DTC snack, drink, or CPG storefront into a search-driven revenue channel. Recipe hub of 40 to 100 recipes. Ingredient comparison guides at 12 to 24 pieces. Sourcing story pages at 6 to 12 pieces. Buyer intent content at 8 to 16 pieces. Creator syndication calendar with 12 to 30 creators per quarter. Refresh cadence at 12 to 24 months by pillar. Reporting with organic sessions and organic revenue attribution.
If your DTC food brand is running paid social at 20,000 dollars monthly with a broken blog and zero recipe schema, professional content marketing for food brands pays for itself inside the first 90 days on organic traffic captured. Redefine Web ships content marketing inside our monthly retainer packages. Book a call and we will walk through the last three DTC food brands we built recipe hubs for, pillar by pillar.
Anchor text on internal links varies across recipe hubs to avoid over-optimization patterns Google penalizes. Exact-match anchor (“single-origin Ethiopian coffee”) runs on 20 to 30 percent of internal links. Partial-match variations (“our Ethiopian roast”) run on 30 to 40 percent. Branded anchors (the SKU name) run on 20 to 30 percent. Generic anchors (“shop the coffee”) fill the remaining 10 to 20 percent. This ratio holds ranking without triggering the over-optimization penalty that shows up on brands that anchor-text-stuff every internal link with the same exact-match keyword. Cross-reference the linking layer on our food and beverage web design page.
Link equity from ingredient guides to SKU pages
Link equity from ingredient guides passes to SKU pages when the guide’s comparison table names the hero SKU in the winning column with a product card, and when the guide’s body links to 3 to 6 recipes that use the winning ingredient. This 3-hop path (guide to recipe to SKU) pushes authority from a high-traffic informational query down to a high-intent transactional page. According to Search Engine Land SEO coverage, informational content that internally links to transactional pages produces 2 to 4 times higher organic revenue than isolated content silos.
Wrapping up content marketing for food brands
Content marketing for food brands is the organic engine that turns a DTC snack, drink, or CPG storefront into a search-driven revenue channel. Recipe hub of 40 to 100 recipes. Ingredient comparison guides at 12 to 24 pieces. Sourcing story pages at 6 to 12 pieces. Buyer intent content at 8 to 16 pieces. Creator syndication calendar with 12 to 30 creators per quarter. Refresh cadence at 12 to 24 months by pillar. Reporting with organic sessions and organic revenue attribution.
If your DTC food brand is running paid social at 20,000 dollars monthly with a broken blog and zero recipe schema, professional content marketing for food brands pays for itself inside the first 90 days on organic traffic captured. Redefine Web ships content marketing inside our monthly retainer packages. Book a call and we will walk through the last three DTC food brands we built recipe hubs for, pillar by pillar.
Content marketing for food brands starts with a recipe hub because recipe queries account for 40 to 60 percent of high-intent search volume in the food category. Every hero SKU needs 4 to 12 recipes anchored to it, each targeting a specific occasion and audience.
Skip the recipe hub and the brand loses the search real estate that pulls DTC storefront traffic month over month at zero incremental paid cost. Recipe traffic converts at 2 to 4 percent because the shopper landed with usage intent, not passive discovery, which is why food brands win on recipes.
Recipe schema and Google rich result eligibility
Every recipe page ships schema.org Recipe markup including cookTime, prepTime, recipeIngredient, recipeInstructions, nutrition, and aggregateRating. Correctly marked-up recipes qualify for Google’s recipe rich result carousel that pulls 3 to 6 times higher click-through rate than a plain blue link. The schema layer takes 15 minutes per recipe to author and 30 minutes to validate in Google Search Console. Cross-reference the recipe search stack on our food and beverage SEO page.
Recipe hub structure that scales
The recipe hub structure runs 40 to 100 recipes at maturity, organized by hero SKU (4 to 12 recipes per SKU) plus occasion tags (breakfast, weeknight dinner, meal prep, brunch, holiday). Every recipe links back to the hero SKU product page with the SKU embedded in an inline card. The hub earns internal linking value from ingredient comparison guides and the sourcing story pages, which feeds recipe ranking on Google. According to Google Search Central recipe structured data guidance, complete Recipe schema markup is required for eligibility in the recipe carousel and the ingredient search filter.
Pillar structure for food brand content marketing
The pillar structure on content marketing for food brands runs 4 content pillars concurrently: recipe hub (40 to 100 recipes), ingredient comparison guides (12 to 24 guides), sourcing story pages (6 to 12 pages), and buyer intent content (where to buy, subscription vs. one-time, gift bundle guides). Every pillar covers a distinct search intent and every pillar links back to the hero SKU product pages.
Ingredient comparison guide format
Ingredient comparison guides run 1,800 to 3,200 words comparing 2 to 4 ingredient types on 6 to 10 attributes with a comparison table, real-world use case examples, and links to the hero SKU that uses the specific ingredient. Example: organic vs. conventional oats compares nutritional profile, sourcing chain, cost, environmental impact, and taste on a 6-column table. The brand’s SKU appears in the winning column with a product card. These guides rank 3 to 8 months after publication and pull steady-state organic traffic.
Sourcing story pages that build trust
Sourcing story pages name the specific farms, cooperatives, or suppliers the brand sources from, with photos of the farms, farmer quotes, and specific harvest windows. A coffee brand’s Ethiopian farm page ranks for “single-origin Ethiopian coffee” and “Yirgacheffe coffee origin” plus 40 long-tail variations. The sourcing page pulls trust-building traffic that converts at 4 to 6 percent because the shopper landed pattern-matching on transparency and named provenance. Every sourcing page includes farmer or cooperative quotes, harvest dates, and a link back to 3 to 5 hero SKU pages that source from the named supplier.
Vejrø hospitality content case study
Vejrø Resort, a Danish private-island destination with an on-site restaurant focused on organic, locally sourced cuisine, joined us with strong social engagement and no organic-search real estate. Guests found the resort on Instagram but never in Google search for terms like “private island resort Denmark,” “farm-to-table hospitality Denmark,” or “Vejrø restaurant.” The same organic-search gap shows up on DTC food brands running paid social at 20,000 dollars monthly with a broken blog and zero recipe schema.
We built the conversion-focused website with on-site and off-site SEO tuned to the travel-niche keyword clusters, competitor analysis against comparable boutique resorts, and mobile-first design prioritizing guest discovery. Every page carried the structured data qualifying it for Google’s rich results in the hospitality category. Every internal link pushed authority toward the direct-booking conversion path.
Three months later, Vejrø hit 10,000 plus organic visitors, ranked for 200 plus first-page keywords, and pulled a 2.2 percent booking conversion rate from organic traffic. The same pattern applies to content marketing for food brands: recipe schema, ingredient comparison guides, and sourcing story pages pull organic traffic at 20 to 40 percent conversion into hero SKU pages inside 6 months when the content quality matches search intent and every page carries the right structured data markup. Vejrø also proved out the reporting discipline: every monthly report named the exact page, the exact keyword cluster, and the exact search feature (rich result, sitelinks, image pack) driving the incremental organic revenue instead of hiding behind aggregate traffic charts.
Recipe cadence and content calendar for food brands
Recipe cadence on a working food brand content calendar ships 2 to 4 new recipes per week during the first 6 months and drops to 1 per week at maturity. Each recipe takes 4 to 6 hours to produce (write, test in the kitchen, photograph, schema author, publish). At 3 recipes per week, the brand hits 78 recipes inside 6 months plus a backlog of ingredient comparison and sourcing content queued behind the recipe production line.
| Content pillar | Target volume year 1 | Production cost per piece | Refresh cadence |
|---|---|---|---|
| Recipe hub | 40 to 100 recipes | $180 to $320 | Every 12 months |
| Ingredient comparison guides | 12 to 24 guides | $450 to $780 | Every 18 months |
| Sourcing story pages | 6 to 12 pages | $680 to $1,200 | Every 24 months |
| Buyer intent content | 8 to 16 pieces | $220 to $420 | Every 12 months |
Photography as a content calendar constraint
Photography is the actual constraint on recipe cadence, not writing. Every recipe needs 6 to 12 photos: hero shot, ingredient flat lay, prep in progress, plated result, storage, and step shots for the schema markup. A working food brand batches photography 8 recipes at a time to keep the cost per recipe under 200 dollars. Skip the batching and the per-recipe cost climbs to 400 to 600 dollars, which caps recipe cadence at 1 per week and slows organic ranking timeline by 6 months.
Seasonal content calendar planning
Seasonal content calendar planning maps recipes and comparison guides to the seasonal windows they need to rank in. A Christmas cookie recipe needs to publish in September to rank by early December. A Valentine’s chocolate guide needs to publish in November to rank by early February. A back-to-school lunchbox recipe needs to publish in June to rank by late August. The 60-to-90-day ranking curve dictates the calendar.
Creator syndication inside food brand content
Creator syndication on food brand content marketing amplifies the recipe hub through Instagram Reels, TikTok, and YouTube Shorts creators paid to post their own version of the brand’s hero recipes. The creator content pulls net-new audiences into the recipe hub through the creator’s Link in Bio or Amazon Storefront tag. The syndication calendar names 12 to 30 creators per quarter with specific recipes assigned to each.
One brand we picked up had a spreadsheet titled “creator outreach 2023” with 47 rows and 3 responses. All 3 responses were auto-replies. The spreadsheet named zero recipes and offered flat rates below 100 dollars per post. Nobody posts a 30-second video for 87 dollars flat. Nobody.
Creator content commercial terms that work
Working creator content commercial terms run 350 to 1,500 dollars flat per post plus a 12 to 25 percent commission on tagged sales across a 30-day window. The commission mechanic pulls creators into follow-up posts because the incremental revenue continues past the initial fee. Mid-tier creators (30k to 150k followers) hit the sweet spot for food brand content because their engagement rate typically runs 4 to 8 percent versus 0.8 to 1.6 percent on mega-creators.
Content brief structure for creator partnerships
The content brief structure for creator partnerships runs a single page: the SKU, the specific recipe or usage occasion, 3 required brand mentions, 3 restricted claims (no health claims on non-medical SKUs), the pricing angle, the affiliate link, and 3 example videos that hit the tone. The brief avoids over-scripting because over-scripted creator content underperforms native creator voice by 40 to 60 percent on engagement rate.
Buyer intent content for food brand blogs
Buyer intent content on food brand blogs covers 8 to 16 pieces targeting explicit purchase-decision queries: “where to buy [brand],” “[brand] subscription vs. one-time,” “best [category] for [use case],” and “[brand] gift bundle.” Every buyer intent piece runs 1,400 to 2,400 words with a comparison table, product cards, and a clear conversion path to the specific SKU that matches the query intent. Buyer intent content converts at 3 to 6 percent versus 1 to 2 percent on recipe content because the shopper landed already planning to buy, not exploring a usage occasion.
Where-to-buy content structure
Where-to-buy content structure covers online (DTC storefront, Amazon, Target.com, Whole Foods online), retail (specific chain locators with the store finder embedded), and international (customs limitations, retailer partners abroad). Every piece names specific retailers, links to the store locator, and includes an FAQ block covering shipping availability, subscription options, and gift card compatibility. Where-to-buy content ranks for branded discovery queries the DTC storefront otherwise loses to competitor affiliate reviews.
Subscription versus one-time comparison content
Subscription versus one-time comparison content converts subscription commitments at 3 to 6 percent because it addresses the price-sensitivity concern head-on with a specific math table. The piece covers the discount structure (15 percent lifetime), the skip-a-month mechanic, the pause-anytime rule, the cancellation policy, and the specific yearly savings for the brand’s average consumption cadence. Cross-reference the retention structure on our food and beverage marketing retainer page.
Content refresh cadence on food brand pillars
Content refresh cadence on food brand content pillars runs a rolling audit every 12 to 24 months by pillar. Recipes get refreshed every 12 months with new photography, updated schema, and any nutrition or ingredient adjustments. Ingredient comparison guides refresh every 18 months to update market data. Sourcing story pages refresh every 24 months to reflect farm partnership changes and new harvest angles. Buyer intent content refreshes every 12 months to update retailer availability and pricing.
Recipe refresh priority order
Recipe refresh priority runs by organic traffic rank. The top 20 recipes by monthly organic sessions get refreshed first (new photography, schema audit, related recipe internal links, updated nutrition). The next 40 get refreshed at 15 months. The remaining recipes get refreshed opportunistically when the ranking slips past position 15 in Google. Skipping the refresh cadence lets recipe rankings drift out of the top 3 inside 18 months as newer competitor recipes take the position.
Schema audit checklist per refresh
The schema audit checklist per refresh runs 8 items: Recipe schema completeness, aggregateRating count and accuracy, nutrition data accuracy, prepTime and cookTime match the recipe body, image URLs valid at CDN, related recipe internal links working, product card SKU URL live, and Google Search Console rich result eligibility validated. This checklist takes 20 minutes per recipe and prevents the schema drift that costs recipe rankings 20 to 40 positions quietly.
Reporting cadence for food brand content marketing
Reporting cadence on food brand content marketing runs a monthly executive report plus a quarterly business review. The monthly report ships in the first business week and covers organic sessions by pillar, top 10 ranking recipes with position trend, ingredient guide ranking movements, sourcing page performance, and organic-attributed DTC revenue. Every number carries a comparison to the prior month and a plain-language interpretation the founder reads in 7 minutes.
Metrics that matter for content marketing
Metrics that matter for food brand content marketing: organic sessions by pillar, recipe rich result impressions in Search Console, organic conversion rate to hero SKU pages, organic-attributed DTC revenue, and top 20 ranking positions by monthly organic sessions. Vanity metrics that do not matter: total pageviews without conversion context, average time on page without conversion attribution, and social share counts. The monthly report skips the vanity block entirely.
Quarterly business review structure
The quarterly business review runs 90 minutes with the founder, head of content, and SEO lead. Agenda: organic traffic trend by pillar, top 10 winning content pieces, top 10 losing content pieces (candidates for refresh or removal), competitive gap analysis against 5 named competitor brands, and next quarter’s content calendar with recipes and ingredient guides queued. According to Ahrefs content marketing research, brands running quarterly content audits outperform brands running annual audits by 40 to 70 percent on organic revenue over a 24-month window.
Internal linking discipline across food brand content
Internal linking discipline across food brand content moves authority from recipe pages toward hero SKU product pages and comparison guides. Every recipe links to the hero SKU it uses inline (once in the ingredient list, once in a bottom call-out card). Every ingredient comparison guide links to 3 to 6 recipes using the winning ingredient plus the hero SKU product page. Every sourcing story links to the 2 to 4 SKUs sourced from that specific farm or cooperative.
Anchor text strategy across recipe hubs
Anchor text on internal links varies across recipe hubs to avoid over-optimization patterns Google penalizes. Exact-match anchor (“single-origin Ethiopian coffee”) runs on 20 to 30 percent of internal links. Partial-match variations (“our Ethiopian roast”) run on 30 to 40 percent. Branded anchors (the SKU name) run on 20 to 30 percent. Generic anchors (“shop the coffee”) fill the remaining 10 to 20 percent. This ratio holds ranking without triggering the over-optimization penalty that shows up on brands that anchor-text-stuff every internal link with the same exact-match keyword. Cross-reference the linking layer on our food and beverage web design page.
Link equity from ingredient guides to SKU pages
Link equity from ingredient guides passes to SKU pages when the guide’s comparison table names the hero SKU in the winning column with a product card, and when the guide’s body links to 3 to 6 recipes that use the winning ingredient. This 3-hop path (guide to recipe to SKU) pushes authority from a high-traffic informational query down to a high-intent transactional page. According to Search Engine Land SEO coverage, informational content that internally links to transactional pages produces 2 to 4 times higher organic revenue than isolated content silos.
Wrapping up content marketing for food brands
Content marketing for food brands is the organic engine that turns a DTC snack, drink, or CPG storefront into a search-driven revenue channel. Recipe hub of 40 to 100 recipes. Ingredient comparison guides at 12 to 24 pieces. Sourcing story pages at 6 to 12 pieces. Buyer intent content at 8 to 16 pieces. Creator syndication calendar with 12 to 30 creators per quarter. Refresh cadence at 12 to 24 months by pillar. Reporting with organic sessions and organic revenue attribution.
If your DTC food brand is running paid social at 20,000 dollars monthly with a broken blog and zero recipe schema, professional content marketing for food brands pays for itself inside the first 90 days on organic traffic captured. Redefine Web ships content marketing inside our monthly retainer packages. Book a call and we will walk through the last three DTC food brands we built recipe hubs for, pillar by pillar.
Internal linking discipline across food brand content moves authority from recipe pages toward hero SKU product pages and comparison guides. Every recipe links to the hero SKU it uses inline (once in the ingredient list, once in a bottom call-out card). Every ingredient comparison guide links to 3 to 6 recipes using the winning ingredient plus the hero SKU product page. Every sourcing story links to the 2 to 4 SKUs sourced from that specific farm or cooperative.
Anchor text strategy across recipe hubs
Anchor text on internal links varies across recipe hubs to avoid over-optimization patterns Google penalizes. Exact-match anchor (“single-origin Ethiopian coffee”) runs on 20 to 30 percent of internal links. Partial-match variations (“our Ethiopian roast”) run on 30 to 40 percent. Branded anchors (the SKU name) run on 20 to 30 percent. Generic anchors (“shop the coffee”) fill the remaining 10 to 20 percent. This ratio holds ranking without triggering the over-optimization penalty that shows up on brands that anchor-text-stuff every internal link with the same exact-match keyword. Cross-reference the linking layer on our food and beverage web design page.
Link equity from ingredient guides to SKU pages
Link equity from ingredient guides passes to SKU pages when the guide’s comparison table names the hero SKU in the winning column with a product card, and when the guide’s body links to 3 to 6 recipes that use the winning ingredient. This 3-hop path (guide to recipe to SKU) pushes authority from a high-traffic informational query down to a high-intent transactional page. According to Search Engine Land SEO coverage, informational content that internally links to transactional pages produces 2 to 4 times higher organic revenue than isolated content silos.
Wrapping up content marketing for food brands
Content marketing for food brands is the organic engine that turns a DTC snack, drink, or CPG storefront into a search-driven revenue channel. Recipe hub of 40 to 100 recipes. Ingredient comparison guides at 12 to 24 pieces. Sourcing story pages at 6 to 12 pieces. Buyer intent content at 8 to 16 pieces. Creator syndication calendar with 12 to 30 creators per quarter. Refresh cadence at 12 to 24 months by pillar. Reporting with organic sessions and organic revenue attribution.
If your DTC food brand is running paid social at 20,000 dollars monthly with a broken blog and zero recipe schema, professional content marketing for food brands pays for itself inside the first 90 days on organic traffic captured. Redefine Web ships content marketing inside our monthly retainer packages. Book a call and we will walk through the last three DTC food brands we built recipe hubs for, pillar by pillar.
Content marketing for food brands starts with a recipe hub because recipe queries account for 40 to 60 percent of high-intent search volume in the food category. Every hero SKU needs 4 to 12 recipes anchored to it, each targeting a specific occasion and audience.
Skip the recipe hub and the brand loses the search real estate that pulls DTC storefront traffic month over month at zero incremental paid cost. Recipe traffic converts at 2 to 4 percent because the shopper landed with usage intent, not passive discovery, which is why food brands win on recipes.
Recipe schema and Google rich result eligibility
Every recipe page ships schema.org Recipe markup including cookTime, prepTime, recipeIngredient, recipeInstructions, nutrition, and aggregateRating. Correctly marked-up recipes qualify for Google’s recipe rich result carousel that pulls 3 to 6 times higher click-through rate than a plain blue link. The schema layer takes 15 minutes per recipe to author and 30 minutes to validate in Google Search Console. Cross-reference the recipe search stack on our food and beverage SEO page.
Recipe hub structure that scales
The recipe hub structure runs 40 to 100 recipes at maturity, organized by hero SKU (4 to 12 recipes per SKU) plus occasion tags (breakfast, weeknight dinner, meal prep, brunch, holiday). Every recipe links back to the hero SKU product page with the SKU embedded in an inline card. The hub earns internal linking value from ingredient comparison guides and the sourcing story pages, which feeds recipe ranking on Google. According to Google Search Central recipe structured data guidance, complete Recipe schema markup is required for eligibility in the recipe carousel and the ingredient search filter.
Pillar structure for food brand content marketing
The pillar structure on content marketing for food brands runs 4 content pillars concurrently: recipe hub (40 to 100 recipes), ingredient comparison guides (12 to 24 guides), sourcing story pages (6 to 12 pages), and buyer intent content (where to buy, subscription vs. one-time, gift bundle guides). Every pillar covers a distinct search intent and every pillar links back to the hero SKU product pages.
Ingredient comparison guide format
Ingredient comparison guides run 1,800 to 3,200 words comparing 2 to 4 ingredient types on 6 to 10 attributes with a comparison table, real-world use case examples, and links to the hero SKU that uses the specific ingredient. Example: organic vs. conventional oats compares nutritional profile, sourcing chain, cost, environmental impact, and taste on a 6-column table. The brand’s SKU appears in the winning column with a product card. These guides rank 3 to 8 months after publication and pull steady-state organic traffic.
Sourcing story pages that build trust
Sourcing story pages name the specific farms, cooperatives, or suppliers the brand sources from, with photos of the farms, farmer quotes, and specific harvest windows. A coffee brand’s Ethiopian farm page ranks for “single-origin Ethiopian coffee” and “Yirgacheffe coffee origin” plus 40 long-tail variations. The sourcing page pulls trust-building traffic that converts at 4 to 6 percent because the shopper landed pattern-matching on transparency and named provenance. Every sourcing page includes farmer or cooperative quotes, harvest dates, and a link back to 3 to 5 hero SKU pages that source from the named supplier.
Vejrø hospitality content case study
Vejrø Resort, a Danish private-island destination with an on-site restaurant focused on organic, locally sourced cuisine, joined us with strong social engagement and no organic-search real estate. Guests found the resort on Instagram but never in Google search for terms like “private island resort Denmark,” “farm-to-table hospitality Denmark,” or “Vejrø restaurant.” The same organic-search gap shows up on DTC food brands running paid social at 20,000 dollars monthly with a broken blog and zero recipe schema.
We built the conversion-focused website with on-site and off-site SEO tuned to the travel-niche keyword clusters, competitor analysis against comparable boutique resorts, and mobile-first design prioritizing guest discovery. Every page carried the structured data qualifying it for Google’s rich results in the hospitality category. Every internal link pushed authority toward the direct-booking conversion path.
Three months later, Vejrø hit 10,000 plus organic visitors, ranked for 200 plus first-page keywords, and pulled a 2.2 percent booking conversion rate from organic traffic. The same pattern applies to content marketing for food brands: recipe schema, ingredient comparison guides, and sourcing story pages pull organic traffic at 20 to 40 percent conversion into hero SKU pages inside 6 months when the content quality matches search intent and every page carries the right structured data markup. Vejrø also proved out the reporting discipline: every monthly report named the exact page, the exact keyword cluster, and the exact search feature (rich result, sitelinks, image pack) driving the incremental organic revenue instead of hiding behind aggregate traffic charts.
Recipe cadence and content calendar for food brands
Recipe cadence on a working food brand content calendar ships 2 to 4 new recipes per week during the first 6 months and drops to 1 per week at maturity. Each recipe takes 4 to 6 hours to produce (write, test in the kitchen, photograph, schema author, publish). At 3 recipes per week, the brand hits 78 recipes inside 6 months plus a backlog of ingredient comparison and sourcing content queued behind the recipe production line.
| Content pillar | Target volume year 1 | Production cost per piece | Refresh cadence |
|---|---|---|---|
| Recipe hub | 40 to 100 recipes | $180 to $320 | Every 12 months |
| Ingredient comparison guides | 12 to 24 guides | $450 to $780 | Every 18 months |
| Sourcing story pages | 6 to 12 pages | $680 to $1,200 | Every 24 months |
| Buyer intent content | 8 to 16 pieces | $220 to $420 | Every 12 months |
Photography as a content calendar constraint
Photography is the actual constraint on recipe cadence, not writing. Every recipe needs 6 to 12 photos: hero shot, ingredient flat lay, prep in progress, plated result, storage, and step shots for the schema markup. A working food brand batches photography 8 recipes at a time to keep the cost per recipe under 200 dollars. Skip the batching and the per-recipe cost climbs to 400 to 600 dollars, which caps recipe cadence at 1 per week and slows organic ranking timeline by 6 months.
Seasonal content calendar planning
Seasonal content calendar planning maps recipes and comparison guides to the seasonal windows they need to rank in. A Christmas cookie recipe needs to publish in September to rank by early December. A Valentine’s chocolate guide needs to publish in November to rank by early February. A back-to-school lunchbox recipe needs to publish in June to rank by late August. The 60-to-90-day ranking curve dictates the calendar.
Creator syndication inside food brand content
Creator syndication on food brand content marketing amplifies the recipe hub through Instagram Reels, TikTok, and YouTube Shorts creators paid to post their own version of the brand’s hero recipes. The creator content pulls net-new audiences into the recipe hub through the creator’s Link in Bio or Amazon Storefront tag. The syndication calendar names 12 to 30 creators per quarter with specific recipes assigned to each.
One brand we picked up had a spreadsheet titled “creator outreach 2023” with 47 rows and 3 responses. All 3 responses were auto-replies. The spreadsheet named zero recipes and offered flat rates below 100 dollars per post. Nobody posts a 30-second video for 87 dollars flat. Nobody.
Creator content commercial terms that work
Working creator content commercial terms run 350 to 1,500 dollars flat per post plus a 12 to 25 percent commission on tagged sales across a 30-day window. The commission mechanic pulls creators into follow-up posts because the incremental revenue continues past the initial fee. Mid-tier creators (30k to 150k followers) hit the sweet spot for food brand content because their engagement rate typically runs 4 to 8 percent versus 0.8 to 1.6 percent on mega-creators.
Content brief structure for creator partnerships
The content brief structure for creator partnerships runs a single page: the SKU, the specific recipe or usage occasion, 3 required brand mentions, 3 restricted claims (no health claims on non-medical SKUs), the pricing angle, the affiliate link, and 3 example videos that hit the tone. The brief avoids over-scripting because over-scripted creator content underperforms native creator voice by 40 to 60 percent on engagement rate.
Buyer intent content for food brand blogs
Buyer intent content on food brand blogs covers 8 to 16 pieces targeting explicit purchase-decision queries: “where to buy [brand],” “[brand] subscription vs. one-time,” “best [category] for [use case],” and “[brand] gift bundle.” Every buyer intent piece runs 1,400 to 2,400 words with a comparison table, product cards, and a clear conversion path to the specific SKU that matches the query intent. Buyer intent content converts at 3 to 6 percent versus 1 to 2 percent on recipe content because the shopper landed already planning to buy, not exploring a usage occasion.
Where-to-buy content structure
Where-to-buy content structure covers online (DTC storefront, Amazon, Target.com, Whole Foods online), retail (specific chain locators with the store finder embedded), and international (customs limitations, retailer partners abroad). Every piece names specific retailers, links to the store locator, and includes an FAQ block covering shipping availability, subscription options, and gift card compatibility. Where-to-buy content ranks for branded discovery queries the DTC storefront otherwise loses to competitor affiliate reviews.
Subscription versus one-time comparison content
Subscription versus one-time comparison content converts subscription commitments at 3 to 6 percent because it addresses the price-sensitivity concern head-on with a specific math table. The piece covers the discount structure (15 percent lifetime), the skip-a-month mechanic, the pause-anytime rule, the cancellation policy, and the specific yearly savings for the brand’s average consumption cadence. Cross-reference the retention structure on our food and beverage marketing retainer page.
Content refresh cadence on food brand pillars
Content refresh cadence on food brand content pillars runs a rolling audit every 12 to 24 months by pillar. Recipes get refreshed every 12 months with new photography, updated schema, and any nutrition or ingredient adjustments. Ingredient comparison guides refresh every 18 months to update market data. Sourcing story pages refresh every 24 months to reflect farm partnership changes and new harvest angles. Buyer intent content refreshes every 12 months to update retailer availability and pricing.
Recipe refresh priority order
Recipe refresh priority runs by organic traffic rank. The top 20 recipes by monthly organic sessions get refreshed first (new photography, schema audit, related recipe internal links, updated nutrition). The next 40 get refreshed at 15 months. The remaining recipes get refreshed opportunistically when the ranking slips past position 15 in Google. Skipping the refresh cadence lets recipe rankings drift out of the top 3 inside 18 months as newer competitor recipes take the position.
Schema audit checklist per refresh
The schema audit checklist per refresh runs 8 items: Recipe schema completeness, aggregateRating count and accuracy, nutrition data accuracy, prepTime and cookTime match the recipe body, image URLs valid at CDN, related recipe internal links working, product card SKU URL live, and Google Search Console rich result eligibility validated. This checklist takes 20 minutes per recipe and prevents the schema drift that costs recipe rankings 20 to 40 positions quietly.
Reporting cadence for food brand content marketing
Reporting cadence on food brand content marketing runs a monthly executive report plus a quarterly business review. The monthly report ships in the first business week and covers organic sessions by pillar, top 10 ranking recipes with position trend, ingredient guide ranking movements, sourcing page performance, and organic-attributed DTC revenue. Every number carries a comparison to the prior month and a plain-language interpretation the founder reads in 7 minutes.
Metrics that matter for content marketing
Metrics that matter for food brand content marketing: organic sessions by pillar, recipe rich result impressions in Search Console, organic conversion rate to hero SKU pages, organic-attributed DTC revenue, and top 20 ranking positions by monthly organic sessions. Vanity metrics that do not matter: total pageviews without conversion context, average time on page without conversion attribution, and social share counts. The monthly report skips the vanity block entirely.
Quarterly business review structure
The quarterly business review runs 90 minutes with the founder, head of content, and SEO lead. Agenda: organic traffic trend by pillar, top 10 winning content pieces, top 10 losing content pieces (candidates for refresh or removal), competitive gap analysis against 5 named competitor brands, and next quarter’s content calendar with recipes and ingredient guides queued. According to Ahrefs content marketing research, brands running quarterly content audits outperform brands running annual audits by 40 to 70 percent on organic revenue over a 24-month window.
Internal linking discipline across food brand content
Internal linking discipline across food brand content moves authority from recipe pages toward hero SKU product pages and comparison guides. Every recipe links to the hero SKU it uses inline (once in the ingredient list, once in a bottom call-out card). Every ingredient comparison guide links to 3 to 6 recipes using the winning ingredient plus the hero SKU product page. Every sourcing story links to the 2 to 4 SKUs sourced from that specific farm or cooperative.
Anchor text strategy across recipe hubs
Anchor text on internal links varies across recipe hubs to avoid over-optimization patterns Google penalizes. Exact-match anchor (“single-origin Ethiopian coffee”) runs on 20 to 30 percent of internal links. Partial-match variations (“our Ethiopian roast”) run on 30 to 40 percent. Branded anchors (the SKU name) run on 20 to 30 percent. Generic anchors (“shop the coffee”) fill the remaining 10 to 20 percent. This ratio holds ranking without triggering the over-optimization penalty that shows up on brands that anchor-text-stuff every internal link with the same exact-match keyword. Cross-reference the linking layer on our food and beverage web design page.
Link equity from ingredient guides to SKU pages
Link equity from ingredient guides passes to SKU pages when the guide’s comparison table names the hero SKU in the winning column with a product card, and when the guide’s body links to 3 to 6 recipes that use the winning ingredient. This 3-hop path (guide to recipe to SKU) pushes authority from a high-traffic informational query down to a high-intent transactional page. According to Search Engine Land SEO coverage, informational content that internally links to transactional pages produces 2 to 4 times higher organic revenue than isolated content silos.
Wrapping up content marketing for food brands
Content marketing for food brands is the organic engine that turns a DTC snack, drink, or CPG storefront into a search-driven revenue channel. Recipe hub of 40 to 100 recipes. Ingredient comparison guides at 12 to 24 pieces. Sourcing story pages at 6 to 12 pieces. Buyer intent content at 8 to 16 pieces. Creator syndication calendar with 12 to 30 creators per quarter. Refresh cadence at 12 to 24 months by pillar. Reporting with organic sessions and organic revenue attribution.
If your DTC food brand is running paid social at 20,000 dollars monthly with a broken blog and zero recipe schema, professional content marketing for food brands pays for itself inside the first 90 days on organic traffic captured. Redefine Web ships content marketing inside our monthly retainer packages. Book a call and we will walk through the last three DTC food brands we built recipe hubs for, pillar by pillar.
Content marketing for food brands starts with a recipe hub because recipe queries account for 40 to 60 percent of high-intent search volume in the food category. Every hero SKU needs 4 to 12 recipes anchored to it, each targeting a specific occasion and audience.
Skip the recipe hub and the brand loses the search real estate that pulls DTC storefront traffic month over month at zero incremental paid cost. Recipe traffic converts at 2 to 4 percent because the shopper landed with usage intent, not passive discovery, which is why food brands win on recipes.
Recipe schema and Google rich result eligibility
Every recipe page ships schema.org Recipe markup including cookTime, prepTime, recipeIngredient, recipeInstructions, nutrition, and aggregateRating. Correctly marked-up recipes qualify for Google’s recipe rich result carousel that pulls 3 to 6 times higher click-through rate than a plain blue link. The schema layer takes 15 minutes per recipe to author and 30 minutes to validate in Google Search Console. Cross-reference the recipe search stack on our food and beverage SEO page.
Recipe hub structure that scales
The recipe hub structure runs 40 to 100 recipes at maturity, organized by hero SKU (4 to 12 recipes per SKU) plus occasion tags (breakfast, weeknight dinner, meal prep, brunch, holiday). Every recipe links back to the hero SKU product page with the SKU embedded in an inline card. The hub earns internal linking value from ingredient comparison guides and the sourcing story pages, which feeds recipe ranking on Google. According to Google Search Central recipe structured data guidance, complete Recipe schema markup is required for eligibility in the recipe carousel and the ingredient search filter.
Pillar structure for food brand content marketing
The pillar structure on content marketing for food brands runs 4 content pillars concurrently: recipe hub (40 to 100 recipes), ingredient comparison guides (12 to 24 guides), sourcing story pages (6 to 12 pages), and buyer intent content (where to buy, subscription vs. one-time, gift bundle guides). Every pillar covers a distinct search intent and every pillar links back to the hero SKU product pages.
Ingredient comparison guide format
Ingredient comparison guides run 1,800 to 3,200 words comparing 2 to 4 ingredient types on 6 to 10 attributes with a comparison table, real-world use case examples, and links to the hero SKU that uses the specific ingredient. Example: organic vs. conventional oats compares nutritional profile, sourcing chain, cost, environmental impact, and taste on a 6-column table. The brand’s SKU appears in the winning column with a product card. These guides rank 3 to 8 months after publication and pull steady-state organic traffic.
Sourcing story pages that build trust
Sourcing story pages name the specific farms, cooperatives, or suppliers the brand sources from, with photos of the farms, farmer quotes, and specific harvest windows. A coffee brand’s Ethiopian farm page ranks for “single-origin Ethiopian coffee” and “Yirgacheffe coffee origin” plus 40 long-tail variations. The sourcing page pulls trust-building traffic that converts at 4 to 6 percent because the shopper landed pattern-matching on transparency and named provenance. Every sourcing page includes farmer or cooperative quotes, harvest dates, and a link back to 3 to 5 hero SKU pages that source from the named supplier.
Vejrø hospitality content case study
Vejrø Resort, a Danish private-island destination with an on-site restaurant focused on organic, locally sourced cuisine, joined us with strong social engagement and no organic-search real estate. Guests found the resort on Instagram but never in Google search for terms like “private island resort Denmark,” “farm-to-table hospitality Denmark,” or “Vejrø restaurant.” The same organic-search gap shows up on DTC food brands running paid social at 20,000 dollars monthly with a broken blog and zero recipe schema.
We built the conversion-focused website with on-site and off-site SEO tuned to the travel-niche keyword clusters, competitor analysis against comparable boutique resorts, and mobile-first design prioritizing guest discovery. Every page carried the structured data qualifying it for Google’s rich results in the hospitality category. Every internal link pushed authority toward the direct-booking conversion path.
Three months later, Vejrø hit 10,000 plus organic visitors, ranked for 200 plus first-page keywords, and pulled a 2.2 percent booking conversion rate from organic traffic. The same pattern applies to content marketing for food brands: recipe schema, ingredient comparison guides, and sourcing story pages pull organic traffic at 20 to 40 percent conversion into hero SKU pages inside 6 months when the content quality matches search intent and every page carries the right structured data markup. Vejrø also proved out the reporting discipline: every monthly report named the exact page, the exact keyword cluster, and the exact search feature (rich result, sitelinks, image pack) driving the incremental organic revenue instead of hiding behind aggregate traffic charts.
Recipe cadence and content calendar for food brands
Recipe cadence on a working food brand content calendar ships 2 to 4 new recipes per week during the first 6 months and drops to 1 per week at maturity. Each recipe takes 4 to 6 hours to produce (write, test in the kitchen, photograph, schema author, publish). At 3 recipes per week, the brand hits 78 recipes inside 6 months plus a backlog of ingredient comparison and sourcing content queued behind the recipe production line.
| Content pillar | Target volume year 1 | Production cost per piece | Refresh cadence |
|---|---|---|---|
| Recipe hub | 40 to 100 recipes | $180 to $320 | Every 12 months |
| Ingredient comparison guides | 12 to 24 guides | $450 to $780 | Every 18 months |
| Sourcing story pages | 6 to 12 pages | $680 to $1,200 | Every 24 months |
| Buyer intent content | 8 to 16 pieces | $220 to $420 | Every 12 months |
Photography as a content calendar constraint
Photography is the actual constraint on recipe cadence, not writing. Every recipe needs 6 to 12 photos: hero shot, ingredient flat lay, prep in progress, plated result, storage, and step shots for the schema markup. A working food brand batches photography 8 recipes at a time to keep the cost per recipe under 200 dollars. Skip the batching and the per-recipe cost climbs to 400 to 600 dollars, which caps recipe cadence at 1 per week and slows organic ranking timeline by 6 months.
Seasonal content calendar planning
Seasonal content calendar planning maps recipes and comparison guides to the seasonal windows they need to rank in. A Christmas cookie recipe needs to publish in September to rank by early December. A Valentine’s chocolate guide needs to publish in November to rank by early February. A back-to-school lunchbox recipe needs to publish in June to rank by late August. The 60-to-90-day ranking curve dictates the calendar.
Creator syndication inside food brand content
Creator syndication on food brand content marketing amplifies the recipe hub through Instagram Reels, TikTok, and YouTube Shorts creators paid to post their own version of the brand’s hero recipes. The creator content pulls net-new audiences into the recipe hub through the creator’s Link in Bio or Amazon Storefront tag. The syndication calendar names 12 to 30 creators per quarter with specific recipes assigned to each.
One brand we picked up had a spreadsheet titled “creator outreach 2023” with 47 rows and 3 responses. All 3 responses were auto-replies. The spreadsheet named zero recipes and offered flat rates below 100 dollars per post. Nobody posts a 30-second video for 87 dollars flat. Nobody.
Creator content commercial terms that work
Working creator content commercial terms run 350 to 1,500 dollars flat per post plus a 12 to 25 percent commission on tagged sales across a 30-day window. The commission mechanic pulls creators into follow-up posts because the incremental revenue continues past the initial fee. Mid-tier creators (30k to 150k followers) hit the sweet spot for food brand content because their engagement rate typically runs 4 to 8 percent versus 0.8 to 1.6 percent on mega-creators.
Content brief structure for creator partnerships
The content brief structure for creator partnerships runs a single page: the SKU, the specific recipe or usage occasion, 3 required brand mentions, 3 restricted claims (no health claims on non-medical SKUs), the pricing angle, the affiliate link, and 3 example videos that hit the tone. The brief avoids over-scripting because over-scripted creator content underperforms native creator voice by 40 to 60 percent on engagement rate.
Buyer intent content for food brand blogs
Buyer intent content on food brand blogs covers 8 to 16 pieces targeting explicit purchase-decision queries: “where to buy [brand],” “[brand] subscription vs. one-time,” “best [category] for [use case],” and “[brand] gift bundle.” Every buyer intent piece runs 1,400 to 2,400 words with a comparison table, product cards, and a clear conversion path to the specific SKU that matches the query intent. Buyer intent content converts at 3 to 6 percent versus 1 to 2 percent on recipe content because the shopper landed already planning to buy, not exploring a usage occasion.
Where-to-buy content structure
Where-to-buy content structure covers online (DTC storefront, Amazon, Target.com, Whole Foods online), retail (specific chain locators with the store finder embedded), and international (customs limitations, retailer partners abroad). Every piece names specific retailers, links to the store locator, and includes an FAQ block covering shipping availability, subscription options, and gift card compatibility. Where-to-buy content ranks for branded discovery queries the DTC storefront otherwise loses to competitor affiliate reviews.
Subscription versus one-time comparison content
Subscription versus one-time comparison content converts subscription commitments at 3 to 6 percent because it addresses the price-sensitivity concern head-on with a specific math table. The piece covers the discount structure (15 percent lifetime), the skip-a-month mechanic, the pause-anytime rule, the cancellation policy, and the specific yearly savings for the brand’s average consumption cadence. Cross-reference the retention structure on our food and beverage marketing retainer page.
Content refresh cadence on food brand pillars
Content refresh cadence on food brand content pillars runs a rolling audit every 12 to 24 months by pillar. Recipes get refreshed every 12 months with new photography, updated schema, and any nutrition or ingredient adjustments. Ingredient comparison guides refresh every 18 months to update market data. Sourcing story pages refresh every 24 months to reflect farm partnership changes and new harvest angles. Buyer intent content refreshes every 12 months to update retailer availability and pricing.
Recipe refresh priority order
Recipe refresh priority runs by organic traffic rank. The top 20 recipes by monthly organic sessions get refreshed first (new photography, schema audit, related recipe internal links, updated nutrition). The next 40 get refreshed at 15 months. The remaining recipes get refreshed opportunistically when the ranking slips past position 15 in Google. Skipping the refresh cadence lets recipe rankings drift out of the top 3 inside 18 months as newer competitor recipes take the position.
Schema audit checklist per refresh
The schema audit checklist per refresh runs 8 items: Recipe schema completeness, aggregateRating count and accuracy, nutrition data accuracy, prepTime and cookTime match the recipe body, image URLs valid at CDN, related recipe internal links working, product card SKU URL live, and Google Search Console rich result eligibility validated. This checklist takes 20 minutes per recipe and prevents the schema drift that costs recipe rankings 20 to 40 positions quietly.
Reporting cadence for food brand content marketing
Reporting cadence on food brand content marketing runs a monthly executive report plus a quarterly business review. The monthly report ships in the first business week and covers organic sessions by pillar, top 10 ranking recipes with position trend, ingredient guide ranking movements, sourcing page performance, and organic-attributed DTC revenue. Every number carries a comparison to the prior month and a plain-language interpretation the founder reads in 7 minutes.
Metrics that matter for content marketing
Metrics that matter for food brand content marketing: organic sessions by pillar, recipe rich result impressions in Search Console, organic conversion rate to hero SKU pages, organic-attributed DTC revenue, and top 20 ranking positions by monthly organic sessions. Vanity metrics that do not matter: total pageviews without conversion context, average time on page without conversion attribution, and social share counts. The monthly report skips the vanity block entirely.
Quarterly business review structure
The quarterly business review runs 90 minutes with the founder, head of content, and SEO lead. Agenda: organic traffic trend by pillar, top 10 winning content pieces, top 10 losing content pieces (candidates for refresh or removal), competitive gap analysis against 5 named competitor brands, and next quarter’s content calendar with recipes and ingredient guides queued. According to Ahrefs content marketing research, brands running quarterly content audits outperform brands running annual audits by 40 to 70 percent on organic revenue over a 24-month window.
Internal linking discipline across food brand content
Internal linking discipline across food brand content moves authority from recipe pages toward hero SKU product pages and comparison guides. Every recipe links to the hero SKU it uses inline (once in the ingredient list, once in a bottom call-out card). Every ingredient comparison guide links to 3 to 6 recipes using the winning ingredient plus the hero SKU product page. Every sourcing story links to the 2 to 4 SKUs sourced from that specific farm or cooperative.
Anchor text strategy across recipe hubs
Anchor text on internal links varies across recipe hubs to avoid over-optimization patterns Google penalizes. Exact-match anchor (“single-origin Ethiopian coffee”) runs on 20 to 30 percent of internal links. Partial-match variations (“our Ethiopian roast”) run on 30 to 40 percent. Branded anchors (the SKU name) run on 20 to 30 percent. Generic anchors (“shop the coffee”) fill the remaining 10 to 20 percent. This ratio holds ranking without triggering the over-optimization penalty that shows up on brands that anchor-text-stuff every internal link with the same exact-match keyword. Cross-reference the linking layer on our food and beverage web design page.
Link equity from ingredient guides to SKU pages
Link equity from ingredient guides passes to SKU pages when the guide’s comparison table names the hero SKU in the winning column with a product card, and when the guide’s body links to 3 to 6 recipes that use the winning ingredient. This 3-hop path (guide to recipe to SKU) pushes authority from a high-traffic informational query down to a high-intent transactional page. According to Search Engine Land SEO coverage, informational content that internally links to transactional pages produces 2 to 4 times higher organic revenue than isolated content silos.
Wrapping up content marketing for food brands
Content marketing for food brands is the organic engine that turns a DTC snack, drink, or CPG storefront into a search-driven revenue channel. Recipe hub of 40 to 100 recipes. Ingredient comparison guides at 12 to 24 pieces. Sourcing story pages at 6 to 12 pieces. Buyer intent content at 8 to 16 pieces. Creator syndication calendar with 12 to 30 creators per quarter. Refresh cadence at 12 to 24 months by pillar. Reporting with organic sessions and organic revenue attribution.
If your DTC food brand is running paid social at 20,000 dollars monthly with a broken blog and zero recipe schema, professional content marketing for food brands pays for itself inside the first 90 days on organic traffic captured. Redefine Web ships content marketing inside our monthly retainer packages. Book a call and we will walk through the last three DTC food brands we built recipe hubs for, pillar by pillar.
Content marketing for food brands starts with a recipe hub because recipe queries account for 40 to 60 percent of high-intent search volume in the food category. Every hero SKU needs 4 to 12 recipes anchored to it, each targeting a specific occasion and audience.
Skip the recipe hub and the brand loses the search real estate that pulls DTC storefront traffic month over month at zero incremental paid cost. Recipe traffic converts at 2 to 4 percent because the shopper landed with usage intent, not passive discovery, which is why food brands win on recipes.
Recipe schema and Google rich result eligibility
Every recipe page ships schema.org Recipe markup including cookTime, prepTime, recipeIngredient, recipeInstructions, nutrition, and aggregateRating. Correctly marked-up recipes qualify for Google’s recipe rich result carousel that pulls 3 to 6 times higher click-through rate than a plain blue link. The schema layer takes 15 minutes per recipe to author and 30 minutes to validate in Google Search Console. Cross-reference the recipe search stack on our food and beverage SEO page.
Recipe hub structure that scales
The recipe hub structure runs 40 to 100 recipes at maturity, organized by hero SKU (4 to 12 recipes per SKU) plus occasion tags (breakfast, weeknight dinner, meal prep, brunch, holiday). Every recipe links back to the hero SKU product page with the SKU embedded in an inline card. The hub earns internal linking value from ingredient comparison guides and the sourcing story pages, which feeds recipe ranking on Google. According to Google Search Central recipe structured data guidance, complete Recipe schema markup is required for eligibility in the recipe carousel and the ingredient search filter.
Pillar structure for food brand content marketing
The pillar structure on content marketing for food brands runs 4 content pillars concurrently: recipe hub (40 to 100 recipes), ingredient comparison guides (12 to 24 guides), sourcing story pages (6 to 12 pages), and buyer intent content (where to buy, subscription vs. one-time, gift bundle guides). Every pillar covers a distinct search intent and every pillar links back to the hero SKU product pages.
Ingredient comparison guide format
Ingredient comparison guides run 1,800 to 3,200 words comparing 2 to 4 ingredient types on 6 to 10 attributes with a comparison table, real-world use case examples, and links to the hero SKU that uses the specific ingredient. Example: organic vs. conventional oats compares nutritional profile, sourcing chain, cost, environmental impact, and taste on a 6-column table. The brand’s SKU appears in the winning column with a product card. These guides rank 3 to 8 months after publication and pull steady-state organic traffic.
Sourcing story pages that build trust
Sourcing story pages name the specific farms, cooperatives, or suppliers the brand sources from, with photos of the farms, farmer quotes, and specific harvest windows. A coffee brand’s Ethiopian farm page ranks for “single-origin Ethiopian coffee” and “Yirgacheffe coffee origin” plus 40 long-tail variations. The sourcing page pulls trust-building traffic that converts at 4 to 6 percent because the shopper landed pattern-matching on transparency and named provenance. Every sourcing page includes farmer or cooperative quotes, harvest dates, and a link back to 3 to 5 hero SKU pages that source from the named supplier.
Vejrø hospitality content case study
Vejrø Resort, a Danish private-island destination with an on-site restaurant focused on organic, locally sourced cuisine, joined us with strong social engagement and no organic-search real estate. Guests found the resort on Instagram but never in Google search for terms like “private island resort Denmark,” “farm-to-table hospitality Denmark,” or “Vejrø restaurant.” The same organic-search gap shows up on DTC food brands running paid social at 20,000 dollars monthly with a broken blog and zero recipe schema.
We built the conversion-focused website with on-site and off-site SEO tuned to the travel-niche keyword clusters, competitor analysis against comparable boutique resorts, and mobile-first design prioritizing guest discovery. Every page carried the structured data qualifying it for Google’s rich results in the hospitality category. Every internal link pushed authority toward the direct-booking conversion path.
Three months later, Vejrø hit 10,000 plus organic visitors, ranked for 200 plus first-page keywords, and pulled a 2.2 percent booking conversion rate from organic traffic. The same pattern applies to content marketing for food brands: recipe schema, ingredient comparison guides, and sourcing story pages pull organic traffic at 20 to 40 percent conversion into hero SKU pages inside 6 months when the content quality matches search intent and every page carries the right structured data markup. Vejrø also proved out the reporting discipline: every monthly report named the exact page, the exact keyword cluster, and the exact search feature (rich result, sitelinks, image pack) driving the incremental organic revenue instead of hiding behind aggregate traffic charts.
Recipe cadence and content calendar for food brands
Recipe cadence on a working food brand content calendar ships 2 to 4 new recipes per week during the first 6 months and drops to 1 per week at maturity. Each recipe takes 4 to 6 hours to produce (write, test in the kitchen, photograph, schema author, publish). At 3 recipes per week, the brand hits 78 recipes inside 6 months plus a backlog of ingredient comparison and sourcing content queued behind the recipe production line.
| Content pillar | Target volume year 1 | Production cost per piece | Refresh cadence |
|---|---|---|---|
| Recipe hub | 40 to 100 recipes | $180 to $320 | Every 12 months |
| Ingredient comparison guides | 12 to 24 guides | $450 to $780 | Every 18 months |
| Sourcing story pages | 6 to 12 pages | $680 to $1,200 | Every 24 months |
| Buyer intent content | 8 to 16 pieces | $220 to $420 | Every 12 months |
Photography as a content calendar constraint
Photography is the actual constraint on recipe cadence, not writing. Every recipe needs 6 to 12 photos: hero shot, ingredient flat lay, prep in progress, plated result, storage, and step shots for the schema markup. A working food brand batches photography 8 recipes at a time to keep the cost per recipe under 200 dollars. Skip the batching and the per-recipe cost climbs to 400 to 600 dollars, which caps recipe cadence at 1 per week and slows organic ranking timeline by 6 months.
Seasonal content calendar planning
Seasonal content calendar planning maps recipes and comparison guides to the seasonal windows they need to rank in. A Christmas cookie recipe needs to publish in September to rank by early December. A Valentine’s chocolate guide needs to publish in November to rank by early February. A back-to-school lunchbox recipe needs to publish in June to rank by late August. The 60-to-90-day ranking curve dictates the calendar.
Creator syndication inside food brand content
Creator syndication on food brand content marketing amplifies the recipe hub through Instagram Reels, TikTok, and YouTube Shorts creators paid to post their own version of the brand’s hero recipes. The creator content pulls net-new audiences into the recipe hub through the creator’s Link in Bio or Amazon Storefront tag. The syndication calendar names 12 to 30 creators per quarter with specific recipes assigned to each.
One brand we picked up had a spreadsheet titled “creator outreach 2023” with 47 rows and 3 responses. All 3 responses were auto-replies. The spreadsheet named zero recipes and offered flat rates below 100 dollars per post. Nobody posts a 30-second video for 87 dollars flat. Nobody.
Creator content commercial terms that work
Working creator content commercial terms run 350 to 1,500 dollars flat per post plus a 12 to 25 percent commission on tagged sales across a 30-day window. The commission mechanic pulls creators into follow-up posts because the incremental revenue continues past the initial fee. Mid-tier creators (30k to 150k followers) hit the sweet spot for food brand content because their engagement rate typically runs 4 to 8 percent versus 0.8 to 1.6 percent on mega-creators.
Content brief structure for creator partnerships
The content brief structure for creator partnerships runs a single page: the SKU, the specific recipe or usage occasion, 3 required brand mentions, 3 restricted claims (no health claims on non-medical SKUs), the pricing angle, the affiliate link, and 3 example videos that hit the tone. The brief avoids over-scripting because over-scripted creator content underperforms native creator voice by 40 to 60 percent on engagement rate.
Buyer intent content for food brand blogs
Buyer intent content on food brand blogs covers 8 to 16 pieces targeting explicit purchase-decision queries: “where to buy [brand],” “[brand] subscription vs. one-time,” “best [category] for [use case],” and “[brand] gift bundle.” Every buyer intent piece runs 1,400 to 2,400 words with a comparison table, product cards, and a clear conversion path to the specific SKU that matches the query intent. Buyer intent content converts at 3 to 6 percent versus 1 to 2 percent on recipe content because the shopper landed already planning to buy, not exploring a usage occasion.
Where-to-buy content structure
Where-to-buy content structure covers online (DTC storefront, Amazon, Target.com, Whole Foods online), retail (specific chain locators with the store finder embedded), and international (customs limitations, retailer partners abroad). Every piece names specific retailers, links to the store locator, and includes an FAQ block covering shipping availability, subscription options, and gift card compatibility. Where-to-buy content ranks for branded discovery queries the DTC storefront otherwise loses to competitor affiliate reviews.
Subscription versus one-time comparison content
Subscription versus one-time comparison content converts subscription commitments at 3 to 6 percent because it addresses the price-sensitivity concern head-on with a specific math table. The piece covers the discount structure (15 percent lifetime), the skip-a-month mechanic, the pause-anytime rule, the cancellation policy, and the specific yearly savings for the brand’s average consumption cadence. Cross-reference the retention structure on our food and beverage marketing retainer page.
Content refresh cadence on food brand pillars
Content refresh cadence on food brand content pillars runs a rolling audit every 12 to 24 months by pillar. Recipes get refreshed every 12 months with new photography, updated schema, and any nutrition or ingredient adjustments. Ingredient comparison guides refresh every 18 months to update market data. Sourcing story pages refresh every 24 months to reflect farm partnership changes and new harvest angles. Buyer intent content refreshes every 12 months to update retailer availability and pricing.
Recipe refresh priority order
Recipe refresh priority runs by organic traffic rank. The top 20 recipes by monthly organic sessions get refreshed first (new photography, schema audit, related recipe internal links, updated nutrition). The next 40 get refreshed at 15 months. The remaining recipes get refreshed opportunistically when the ranking slips past position 15 in Google. Skipping the refresh cadence lets recipe rankings drift out of the top 3 inside 18 months as newer competitor recipes take the position.
Schema audit checklist per refresh
The schema audit checklist per refresh runs 8 items: Recipe schema completeness, aggregateRating count and accuracy, nutrition data accuracy, prepTime and cookTime match the recipe body, image URLs valid at CDN, related recipe internal links working, product card SKU URL live, and Google Search Console rich result eligibility validated. This checklist takes 20 minutes per recipe and prevents the schema drift that costs recipe rankings 20 to 40 positions quietly.
Reporting cadence for food brand content marketing
Reporting cadence on food brand content marketing runs a monthly executive report plus a quarterly business review. The monthly report ships in the first business week and covers organic sessions by pillar, top 10 ranking recipes with position trend, ingredient guide ranking movements, sourcing page performance, and organic-attributed DTC revenue. Every number carries a comparison to the prior month and a plain-language interpretation the founder reads in 7 minutes.
Metrics that matter for content marketing
Metrics that matter for food brand content marketing: organic sessions by pillar, recipe rich result impressions in Search Console, organic conversion rate to hero SKU pages, organic-attributed DTC revenue, and top 20 ranking positions by monthly organic sessions. Vanity metrics that do not matter: total pageviews without conversion context, average time on page without conversion attribution, and social share counts. The monthly report skips the vanity block entirely.
Quarterly business review structure
The quarterly business review runs 90 minutes with the founder, head of content, and SEO lead. Agenda: organic traffic trend by pillar, top 10 winning content pieces, top 10 losing content pieces (candidates for refresh or removal), competitive gap analysis against 5 named competitor brands, and next quarter’s content calendar with recipes and ingredient guides queued. According to Ahrefs content marketing research, brands running quarterly content audits outperform brands running annual audits by 40 to 70 percent on organic revenue over a 24-month window.
Internal linking discipline across food brand content
Internal linking discipline across food brand content moves authority from recipe pages toward hero SKU product pages and comparison guides. Every recipe links to the hero SKU it uses inline (once in the ingredient list, once in a bottom call-out card). Every ingredient comparison guide links to 3 to 6 recipes using the winning ingredient plus the hero SKU product page. Every sourcing story links to the 2 to 4 SKUs sourced from that specific farm or cooperative.
Anchor text strategy across recipe hubs
Anchor text on internal links varies across recipe hubs to avoid over-optimization patterns Google penalizes. Exact-match anchor (“single-origin Ethiopian coffee”) runs on 20 to 30 percent of internal links. Partial-match variations (“our Ethiopian roast”) run on 30 to 40 percent. Branded anchors (the SKU name) run on 20 to 30 percent. Generic anchors (“shop the coffee”) fill the remaining 10 to 20 percent. This ratio holds ranking without triggering the over-optimization penalty that shows up on brands that anchor-text-stuff every internal link with the same exact-match keyword. Cross-reference the linking layer on our food and beverage web design page.
Link equity from ingredient guides to SKU pages
Link equity from ingredient guides passes to SKU pages when the guide’s comparison table names the hero SKU in the winning column with a product card, and when the guide’s body links to 3 to 6 recipes that use the winning ingredient. This 3-hop path (guide to recipe to SKU) pushes authority from a high-traffic informational query down to a high-intent transactional page. According to Search Engine Land SEO coverage, informational content that internally links to transactional pages produces 2 to 4 times higher organic revenue than isolated content silos.
Wrapping up content marketing for food brands
Content marketing for food brands is the organic engine that turns a DTC snack, drink, or CPG storefront into a search-driven revenue channel. Recipe hub of 40 to 100 recipes. Ingredient comparison guides at 12 to 24 pieces. Sourcing story pages at 6 to 12 pieces. Buyer intent content at 8 to 16 pieces. Creator syndication calendar with 12 to 30 creators per quarter. Refresh cadence at 12 to 24 months by pillar. Reporting with organic sessions and organic revenue attribution.
If your DTC food brand is running paid social at 20,000 dollars monthly with a broken blog and zero recipe schema, professional content marketing for food brands pays for itself inside the first 90 days on organic traffic captured. Redefine Web ships content marketing inside our monthly retainer packages. Book a call and we will walk through the last three DTC food brands we built recipe hubs for, pillar by pillar.
Anchor text on internal links varies across recipe hubs to avoid over-optimization patterns Google penalizes. Exact-match anchor (“single-origin Ethiopian coffee”) runs on 20 to 30 percent of internal links. Partial-match variations (“our Ethiopian roast”) run on 30 to 40 percent. Branded anchors (the SKU name) run on 20 to 30 percent. Generic anchors (“shop the coffee”) fill the remaining 10 to 20 percent. This ratio holds ranking without triggering the over-optimization penalty that shows up on brands that anchor-text-stuff every internal link with the same exact-match keyword. Cross-reference the linking layer on our food and beverage web design page.
Link equity from ingredient guides to SKU pages
Link equity from ingredient guides passes to SKU pages when the guide’s comparison table names the hero SKU in the winning column with a product card, and when the guide’s body links to 3 to 6 recipes that use the winning ingredient. This 3-hop path (guide to recipe to SKU) pushes authority from a high-traffic informational query down to a high-intent transactional page. According to Search Engine Land SEO coverage, informational content that internally links to transactional pages produces 2 to 4 times higher organic revenue than isolated content silos.
Wrapping up content marketing for food brands
Content marketing for food brands is the organic engine that turns a DTC snack, drink, or CPG storefront into a search-driven revenue channel. Recipe hub of 40 to 100 recipes. Ingredient comparison guides at 12 to 24 pieces. Sourcing story pages at 6 to 12 pieces. Buyer intent content at 8 to 16 pieces. Creator syndication calendar with 12 to 30 creators per quarter. Refresh cadence at 12 to 24 months by pillar. Reporting with organic sessions and organic revenue attribution.
If your DTC food brand is running paid social at 20,000 dollars monthly with a broken blog and zero recipe schema, professional content marketing for food brands pays for itself inside the first 90 days on organic traffic captured. Redefine Web ships content marketing inside our monthly retainer packages. Book a call and we will walk through the last three DTC food brands we built recipe hubs for, pillar by pillar.
Content marketing for food brands starts with a recipe hub because recipe queries account for 40 to 60 percent of high-intent search volume in the food category. Every hero SKU needs 4 to 12 recipes anchored to it, each targeting a specific occasion and audience.
Skip the recipe hub and the brand loses the search real estate that pulls DTC storefront traffic month over month at zero incremental paid cost. Recipe traffic converts at 2 to 4 percent because the shopper landed with usage intent, not passive discovery, which is why food brands win on recipes.
Recipe schema and Google rich result eligibility
Every recipe page ships schema.org Recipe markup including cookTime, prepTime, recipeIngredient, recipeInstructions, nutrition, and aggregateRating. Correctly marked-up recipes qualify for Google’s recipe rich result carousel that pulls 3 to 6 times higher click-through rate than a plain blue link. The schema layer takes 15 minutes per recipe to author and 30 minutes to validate in Google Search Console. Cross-reference the recipe search stack on our food and beverage SEO page.
Recipe hub structure that scales
The recipe hub structure runs 40 to 100 recipes at maturity, organized by hero SKU (4 to 12 recipes per SKU) plus occasion tags (breakfast, weeknight dinner, meal prep, brunch, holiday). Every recipe links back to the hero SKU product page with the SKU embedded in an inline card. The hub earns internal linking value from ingredient comparison guides and the sourcing story pages, which feeds recipe ranking on Google. According to Google Search Central recipe structured data guidance, complete Recipe schema markup is required for eligibility in the recipe carousel and the ingredient search filter.
Pillar structure for food brand content marketing
The pillar structure on content marketing for food brands runs 4 content pillars concurrently: recipe hub (40 to 100 recipes), ingredient comparison guides (12 to 24 guides), sourcing story pages (6 to 12 pages), and buyer intent content (where to buy, subscription vs. one-time, gift bundle guides). Every pillar covers a distinct search intent and every pillar links back to the hero SKU product pages.
Ingredient comparison guide format
Ingredient comparison guides run 1,800 to 3,200 words comparing 2 to 4 ingredient types on 6 to 10 attributes with a comparison table, real-world use case examples, and links to the hero SKU that uses the specific ingredient. Example: organic vs. conventional oats compares nutritional profile, sourcing chain, cost, environmental impact, and taste on a 6-column table. The brand’s SKU appears in the winning column with a product card. These guides rank 3 to 8 months after publication and pull steady-state organic traffic.
Sourcing story pages that build trust
Sourcing story pages name the specific farms, cooperatives, or suppliers the brand sources from, with photos of the farms, farmer quotes, and specific harvest windows. A coffee brand’s Ethiopian farm page ranks for “single-origin Ethiopian coffee” and “Yirgacheffe coffee origin” plus 40 long-tail variations. The sourcing page pulls trust-building traffic that converts at 4 to 6 percent because the shopper landed pattern-matching on transparency and named provenance. Every sourcing page includes farmer or cooperative quotes, harvest dates, and a link back to 3 to 5 hero SKU pages that source from the named supplier.
Vejrø hospitality content case study
Vejrø Resort, a Danish private-island destination with an on-site restaurant focused on organic, locally sourced cuisine, joined us with strong social engagement and no organic-search real estate. Guests found the resort on Instagram but never in Google search for terms like “private island resort Denmark,” “farm-to-table hospitality Denmark,” or “Vejrø restaurant.” The same organic-search gap shows up on DTC food brands running paid social at 20,000 dollars monthly with a broken blog and zero recipe schema.
We built the conversion-focused website with on-site and off-site SEO tuned to the travel-niche keyword clusters, competitor analysis against comparable boutique resorts, and mobile-first design prioritizing guest discovery. Every page carried the structured data qualifying it for Google’s rich results in the hospitality category. Every internal link pushed authority toward the direct-booking conversion path.
Three months later, Vejrø hit 10,000 plus organic visitors, ranked for 200 plus first-page keywords, and pulled a 2.2 percent booking conversion rate from organic traffic. The same pattern applies to content marketing for food brands: recipe schema, ingredient comparison guides, and sourcing story pages pull organic traffic at 20 to 40 percent conversion into hero SKU pages inside 6 months when the content quality matches search intent and every page carries the right structured data markup. Vejrø also proved out the reporting discipline: every monthly report named the exact page, the exact keyword cluster, and the exact search feature (rich result, sitelinks, image pack) driving the incremental organic revenue instead of hiding behind aggregate traffic charts.
Recipe cadence and content calendar for food brands
Recipe cadence on a working food brand content calendar ships 2 to 4 new recipes per week during the first 6 months and drops to 1 per week at maturity. Each recipe takes 4 to 6 hours to produce (write, test in the kitchen, photograph, schema author, publish). At 3 recipes per week, the brand hits 78 recipes inside 6 months plus a backlog of ingredient comparison and sourcing content queued behind the recipe production line.
| Content pillar | Target volume year 1 | Production cost per piece | Refresh cadence |
|---|---|---|---|
| Recipe hub | 40 to 100 recipes | $180 to $320 | Every 12 months |
| Ingredient comparison guides | 12 to 24 guides | $450 to $780 | Every 18 months |
| Sourcing story pages | 6 to 12 pages | $680 to $1,200 | Every 24 months |
| Buyer intent content | 8 to 16 pieces | $220 to $420 | Every 12 months |
Photography as a content calendar constraint
Photography is the actual constraint on recipe cadence, not writing. Every recipe needs 6 to 12 photos: hero shot, ingredient flat lay, prep in progress, plated result, storage, and step shots for the schema markup. A working food brand batches photography 8 recipes at a time to keep the cost per recipe under 200 dollars. Skip the batching and the per-recipe cost climbs to 400 to 600 dollars, which caps recipe cadence at 1 per week and slows organic ranking timeline by 6 months.
Seasonal content calendar planning
Seasonal content calendar planning maps recipes and comparison guides to the seasonal windows they need to rank in. A Christmas cookie recipe needs to publish in September to rank by early December. A Valentine’s chocolate guide needs to publish in November to rank by early February. A back-to-school lunchbox recipe needs to publish in June to rank by late August. The 60-to-90-day ranking curve dictates the calendar.
Creator syndication inside food brand content
Creator syndication on food brand content marketing amplifies the recipe hub through Instagram Reels, TikTok, and YouTube Shorts creators paid to post their own version of the brand’s hero recipes. The creator content pulls net-new audiences into the recipe hub through the creator’s Link in Bio or Amazon Storefront tag. The syndication calendar names 12 to 30 creators per quarter with specific recipes assigned to each.
One brand we picked up had a spreadsheet titled “creator outreach 2023” with 47 rows and 3 responses. All 3 responses were auto-replies. The spreadsheet named zero recipes and offered flat rates below 100 dollars per post. Nobody posts a 30-second video for 87 dollars flat. Nobody.
Creator content commercial terms that work
Working creator content commercial terms run 350 to 1,500 dollars flat per post plus a 12 to 25 percent commission on tagged sales across a 30-day window. The commission mechanic pulls creators into follow-up posts because the incremental revenue continues past the initial fee. Mid-tier creators (30k to 150k followers) hit the sweet spot for food brand content because their engagement rate typically runs 4 to 8 percent versus 0.8 to 1.6 percent on mega-creators.
Content brief structure for creator partnerships
The content brief structure for creator partnerships runs a single page: the SKU, the specific recipe or usage occasion, 3 required brand mentions, 3 restricted claims (no health claims on non-medical SKUs), the pricing angle, the affiliate link, and 3 example videos that hit the tone. The brief avoids over-scripting because over-scripted creator content underperforms native creator voice by 40 to 60 percent on engagement rate.
Buyer intent content for food brand blogs
Buyer intent content on food brand blogs covers 8 to 16 pieces targeting explicit purchase-decision queries: “where to buy [brand],” “[brand] subscription vs. one-time,” “best [category] for [use case],” and “[brand] gift bundle.” Every buyer intent piece runs 1,400 to 2,400 words with a comparison table, product cards, and a clear conversion path to the specific SKU that matches the query intent. Buyer intent content converts at 3 to 6 percent versus 1 to 2 percent on recipe content because the shopper landed already planning to buy, not exploring a usage occasion.
Where-to-buy content structure
Where-to-buy content structure covers online (DTC storefront, Amazon, Target.com, Whole Foods online), retail (specific chain locators with the store finder embedded), and international (customs limitations, retailer partners abroad). Every piece names specific retailers, links to the store locator, and includes an FAQ block covering shipping availability, subscription options, and gift card compatibility. Where-to-buy content ranks for branded discovery queries the DTC storefront otherwise loses to competitor affiliate reviews.
Subscription versus one-time comparison content
Subscription versus one-time comparison content converts subscription commitments at 3 to 6 percent because it addresses the price-sensitivity concern head-on with a specific math table. The piece covers the discount structure (15 percent lifetime), the skip-a-month mechanic, the pause-anytime rule, the cancellation policy, and the specific yearly savings for the brand’s average consumption cadence. Cross-reference the retention structure on our food and beverage marketing retainer page.
Content refresh cadence on food brand pillars
Content refresh cadence on food brand content pillars runs a rolling audit every 12 to 24 months by pillar. Recipes get refreshed every 12 months with new photography, updated schema, and any nutrition or ingredient adjustments. Ingredient comparison guides refresh every 18 months to update market data. Sourcing story pages refresh every 24 months to reflect farm partnership changes and new harvest angles. Buyer intent content refreshes every 12 months to update retailer availability and pricing.
Recipe refresh priority order
Recipe refresh priority runs by organic traffic rank. The top 20 recipes by monthly organic sessions get refreshed first (new photography, schema audit, related recipe internal links, updated nutrition). The next 40 get refreshed at 15 months. The remaining recipes get refreshed opportunistically when the ranking slips past position 15 in Google. Skipping the refresh cadence lets recipe rankings drift out of the top 3 inside 18 months as newer competitor recipes take the position.
Schema audit checklist per refresh
The schema audit checklist per refresh runs 8 items: Recipe schema completeness, aggregateRating count and accuracy, nutrition data accuracy, prepTime and cookTime match the recipe body, image URLs valid at CDN, related recipe internal links working, product card SKU URL live, and Google Search Console rich result eligibility validated. This checklist takes 20 minutes per recipe and prevents the schema drift that costs recipe rankings 20 to 40 positions quietly.
Reporting cadence for food brand content marketing
Reporting cadence on food brand content marketing runs a monthly executive report plus a quarterly business review. The monthly report ships in the first business week and covers organic sessions by pillar, top 10 ranking recipes with position trend, ingredient guide ranking movements, sourcing page performance, and organic-attributed DTC revenue. Every number carries a comparison to the prior month and a plain-language interpretation the founder reads in 7 minutes.
Metrics that matter for content marketing
Metrics that matter for food brand content marketing: organic sessions by pillar, recipe rich result impressions in Search Console, organic conversion rate to hero SKU pages, organic-attributed DTC revenue, and top 20 ranking positions by monthly organic sessions. Vanity metrics that do not matter: total pageviews without conversion context, average time on page without conversion attribution, and social share counts. The monthly report skips the vanity block entirely.
Quarterly business review structure
The quarterly business review runs 90 minutes with the founder, head of content, and SEO lead. Agenda: organic traffic trend by pillar, top 10 winning content pieces, top 10 losing content pieces (candidates for refresh or removal), competitive gap analysis against 5 named competitor brands, and next quarter’s content calendar with recipes and ingredient guides queued. According to Ahrefs content marketing research, brands running quarterly content audits outperform brands running annual audits by 40 to 70 percent on organic revenue over a 24-month window.
Internal linking discipline across food brand content
Internal linking discipline across food brand content moves authority from recipe pages toward hero SKU product pages and comparison guides. Every recipe links to the hero SKU it uses inline (once in the ingredient list, once in a bottom call-out card). Every ingredient comparison guide links to 3 to 6 recipes using the winning ingredient plus the hero SKU product page. Every sourcing story links to the 2 to 4 SKUs sourced from that specific farm or cooperative.
Anchor text strategy across recipe hubs
Anchor text on internal links varies across recipe hubs to avoid over-optimization patterns Google penalizes. Exact-match anchor (“single-origin Ethiopian coffee”) runs on 20 to 30 percent of internal links. Partial-match variations (“our Ethiopian roast”) run on 30 to 40 percent. Branded anchors (the SKU name) run on 20 to 30 percent. Generic anchors (“shop the coffee”) fill the remaining 10 to 20 percent. This ratio holds ranking without triggering the over-optimization penalty that shows up on brands that anchor-text-stuff every internal link with the same exact-match keyword. Cross-reference the linking layer on our food and beverage web design page.
Link equity from ingredient guides to SKU pages
Link equity from ingredient guides passes to SKU pages when the guide’s comparison table names the hero SKU in the winning column with a product card, and when the guide’s body links to 3 to 6 recipes that use the winning ingredient. This 3-hop path (guide to recipe to SKU) pushes authority from a high-traffic informational query down to a high-intent transactional page. According to Search Engine Land SEO coverage, informational content that internally links to transactional pages produces 2 to 4 times higher organic revenue than isolated content silos.
Wrapping up content marketing for food brands
Content marketing for food brands is the organic engine that turns a DTC snack, drink, or CPG storefront into a search-driven revenue channel. Recipe hub of 40 to 100 recipes. Ingredient comparison guides at 12 to 24 pieces. Sourcing story pages at 6 to 12 pieces. Buyer intent content at 8 to 16 pieces. Creator syndication calendar with 12 to 30 creators per quarter. Refresh cadence at 12 to 24 months by pillar. Reporting with organic sessions and organic revenue attribution.
If your DTC food brand is running paid social at 20,000 dollars monthly with a broken blog and zero recipe schema, professional content marketing for food brands pays for itself inside the first 90 days on organic traffic captured. Redefine Web ships content marketing inside our monthly retainer packages. Book a call and we will walk through the last three DTC food brands we built recipe hubs for, pillar by pillar.
Content marketing for food brands starts with a recipe hub because recipe queries account for 40 to 60 percent of high-intent search volume in the food category. Every hero SKU needs 4 to 12 recipes anchored to it, each targeting a specific occasion and audience.
Skip the recipe hub and the brand loses the search real estate that pulls DTC storefront traffic month over month at zero incremental paid cost. Recipe traffic converts at 2 to 4 percent because the shopper landed with usage intent, not passive discovery, which is why food brands win on recipes.
Recipe schema and Google rich result eligibility
Every recipe page ships schema.org Recipe markup including cookTime, prepTime, recipeIngredient, recipeInstructions, nutrition, and aggregateRating. Correctly marked-up recipes qualify for Google’s recipe rich result carousel that pulls 3 to 6 times higher click-through rate than a plain blue link. The schema layer takes 15 minutes per recipe to author and 30 minutes to validate in Google Search Console. Cross-reference the recipe search stack on our food and beverage SEO page.
Recipe hub structure that scales
The recipe hub structure runs 40 to 100 recipes at maturity, organized by hero SKU (4 to 12 recipes per SKU) plus occasion tags (breakfast, weeknight dinner, meal prep, brunch, holiday). Every recipe links back to the hero SKU product page with the SKU embedded in an inline card. The hub earns internal linking value from ingredient comparison guides and the sourcing story pages, which feeds recipe ranking on Google. According to Google Search Central recipe structured data guidance, complete Recipe schema markup is required for eligibility in the recipe carousel and the ingredient search filter.
Pillar structure for food brand content marketing
The pillar structure on content marketing for food brands runs 4 content pillars concurrently: recipe hub (40 to 100 recipes), ingredient comparison guides (12 to 24 guides), sourcing story pages (6 to 12 pages), and buyer intent content (where to buy, subscription vs. one-time, gift bundle guides). Every pillar covers a distinct search intent and every pillar links back to the hero SKU product pages.
Ingredient comparison guide format
Ingredient comparison guides run 1,800 to 3,200 words comparing 2 to 4 ingredient types on 6 to 10 attributes with a comparison table, real-world use case examples, and links to the hero SKU that uses the specific ingredient. Example: organic vs. conventional oats compares nutritional profile, sourcing chain, cost, environmental impact, and taste on a 6-column table. The brand’s SKU appears in the winning column with a product card. These guides rank 3 to 8 months after publication and pull steady-state organic traffic.
Sourcing story pages that build trust
Sourcing story pages name the specific farms, cooperatives, or suppliers the brand sources from, with photos of the farms, farmer quotes, and specific harvest windows. A coffee brand’s Ethiopian farm page ranks for “single-origin Ethiopian coffee” and “Yirgacheffe coffee origin” plus 40 long-tail variations. The sourcing page pulls trust-building traffic that converts at 4 to 6 percent because the shopper landed pattern-matching on transparency and named provenance. Every sourcing page includes farmer or cooperative quotes, harvest dates, and a link back to 3 to 5 hero SKU pages that source from the named supplier.
Vejrø hospitality content case study
Vejrø Resort, a Danish private-island destination with an on-site restaurant focused on organic, locally sourced cuisine, joined us with strong social engagement and no organic-search real estate. Guests found the resort on Instagram but never in Google search for terms like “private island resort Denmark,” “farm-to-table hospitality Denmark,” or “Vejrø restaurant.” The same organic-search gap shows up on DTC food brands running paid social at 20,000 dollars monthly with a broken blog and zero recipe schema.
We built the conversion-focused website with on-site and off-site SEO tuned to the travel-niche keyword clusters, competitor analysis against comparable boutique resorts, and mobile-first design prioritizing guest discovery. Every page carried the structured data qualifying it for Google’s rich results in the hospitality category. Every internal link pushed authority toward the direct-booking conversion path.
Three months later, Vejrø hit 10,000 plus organic visitors, ranked for 200 plus first-page keywords, and pulled a 2.2 percent booking conversion rate from organic traffic. The same pattern applies to content marketing for food brands: recipe schema, ingredient comparison guides, and sourcing story pages pull organic traffic at 20 to 40 percent conversion into hero SKU pages inside 6 months when the content quality matches search intent and every page carries the right structured data markup. Vejrø also proved out the reporting discipline: every monthly report named the exact page, the exact keyword cluster, and the exact search feature (rich result, sitelinks, image pack) driving the incremental organic revenue instead of hiding behind aggregate traffic charts.
Recipe cadence and content calendar for food brands
Recipe cadence on a working food brand content calendar ships 2 to 4 new recipes per week during the first 6 months and drops to 1 per week at maturity. Each recipe takes 4 to 6 hours to produce (write, test in the kitchen, photograph, schema author, publish). At 3 recipes per week, the brand hits 78 recipes inside 6 months plus a backlog of ingredient comparison and sourcing content queued behind the recipe production line.
| Content pillar | Target volume year 1 | Production cost per piece | Refresh cadence |
|---|---|---|---|
| Recipe hub | 40 to 100 recipes | $180 to $320 | Every 12 months |
| Ingredient comparison guides | 12 to 24 guides | $450 to $780 | Every 18 months |
| Sourcing story pages | 6 to 12 pages | $680 to $1,200 | Every 24 months |
| Buyer intent content | 8 to 16 pieces | $220 to $420 | Every 12 months |
Photography as a content calendar constraint
Photography is the actual constraint on recipe cadence, not writing. Every recipe needs 6 to 12 photos: hero shot, ingredient flat lay, prep in progress, plated result, storage, and step shots for the schema markup. A working food brand batches photography 8 recipes at a time to keep the cost per recipe under 200 dollars. Skip the batching and the per-recipe cost climbs to 400 to 600 dollars, which caps recipe cadence at 1 per week and slows organic ranking timeline by 6 months.
Seasonal content calendar planning
Seasonal content calendar planning maps recipes and comparison guides to the seasonal windows they need to rank in. A Christmas cookie recipe needs to publish in September to rank by early December. A Valentine’s chocolate guide needs to publish in November to rank by early February. A back-to-school lunchbox recipe needs to publish in June to rank by late August. The 60-to-90-day ranking curve dictates the calendar.
Creator syndication inside food brand content
Creator syndication on food brand content marketing amplifies the recipe hub through Instagram Reels, TikTok, and YouTube Shorts creators paid to post their own version of the brand’s hero recipes. The creator content pulls net-new audiences into the recipe hub through the creator’s Link in Bio or Amazon Storefront tag. The syndication calendar names 12 to 30 creators per quarter with specific recipes assigned to each.
One brand we picked up had a spreadsheet titled “creator outreach 2023” with 47 rows and 3 responses. All 3 responses were auto-replies. The spreadsheet named zero recipes and offered flat rates below 100 dollars per post. Nobody posts a 30-second video for 87 dollars flat. Nobody.
Creator content commercial terms that work
Working creator content commercial terms run 350 to 1,500 dollars flat per post plus a 12 to 25 percent commission on tagged sales across a 30-day window. The commission mechanic pulls creators into follow-up posts because the incremental revenue continues past the initial fee. Mid-tier creators (30k to 150k followers) hit the sweet spot for food brand content because their engagement rate typically runs 4 to 8 percent versus 0.8 to 1.6 percent on mega-creators.
Content brief structure for creator partnerships
The content brief structure for creator partnerships runs a single page: the SKU, the specific recipe or usage occasion, 3 required brand mentions, 3 restricted claims (no health claims on non-medical SKUs), the pricing angle, the affiliate link, and 3 example videos that hit the tone. The brief avoids over-scripting because over-scripted creator content underperforms native creator voice by 40 to 60 percent on engagement rate.
Buyer intent content for food brand blogs
Buyer intent content on food brand blogs covers 8 to 16 pieces targeting explicit purchase-decision queries: “where to buy [brand],” “[brand] subscription vs. one-time,” “best [category] for [use case],” and “[brand] gift bundle.” Every buyer intent piece runs 1,400 to 2,400 words with a comparison table, product cards, and a clear conversion path to the specific SKU that matches the query intent. Buyer intent content converts at 3 to 6 percent versus 1 to 2 percent on recipe content because the shopper landed already planning to buy, not exploring a usage occasion.
Where-to-buy content structure
Where-to-buy content structure covers online (DTC storefront, Amazon, Target.com, Whole Foods online), retail (specific chain locators with the store finder embedded), and international (customs limitations, retailer partners abroad). Every piece names specific retailers, links to the store locator, and includes an FAQ block covering shipping availability, subscription options, and gift card compatibility. Where-to-buy content ranks for branded discovery queries the DTC storefront otherwise loses to competitor affiliate reviews.
Subscription versus one-time comparison content
Subscription versus one-time comparison content converts subscription commitments at 3 to 6 percent because it addresses the price-sensitivity concern head-on with a specific math table. The piece covers the discount structure (15 percent lifetime), the skip-a-month mechanic, the pause-anytime rule, the cancellation policy, and the specific yearly savings for the brand’s average consumption cadence. Cross-reference the retention structure on our food and beverage marketing retainer page.
Content refresh cadence on food brand pillars
Content refresh cadence on food brand content pillars runs a rolling audit every 12 to 24 months by pillar. Recipes get refreshed every 12 months with new photography, updated schema, and any nutrition or ingredient adjustments. Ingredient comparison guides refresh every 18 months to update market data. Sourcing story pages refresh every 24 months to reflect farm partnership changes and new harvest angles. Buyer intent content refreshes every 12 months to update retailer availability and pricing.
Recipe refresh priority order
Recipe refresh priority runs by organic traffic rank. The top 20 recipes by monthly organic sessions get refreshed first (new photography, schema audit, related recipe internal links, updated nutrition). The next 40 get refreshed at 15 months. The remaining recipes get refreshed opportunistically when the ranking slips past position 15 in Google. Skipping the refresh cadence lets recipe rankings drift out of the top 3 inside 18 months as newer competitor recipes take the position.
Schema audit checklist per refresh
The schema audit checklist per refresh runs 8 items: Recipe schema completeness, aggregateRating count and accuracy, nutrition data accuracy, prepTime and cookTime match the recipe body, image URLs valid at CDN, related recipe internal links working, product card SKU URL live, and Google Search Console rich result eligibility validated. This checklist takes 20 minutes per recipe and prevents the schema drift that costs recipe rankings 20 to 40 positions quietly.
Reporting cadence for food brand content marketing
Reporting cadence on food brand content marketing runs a monthly executive report plus a quarterly business review. The monthly report ships in the first business week and covers organic sessions by pillar, top 10 ranking recipes with position trend, ingredient guide ranking movements, sourcing page performance, and organic-attributed DTC revenue. Every number carries a comparison to the prior month and a plain-language interpretation the founder reads in 7 minutes.
Metrics that matter for content marketing
Metrics that matter for food brand content marketing: organic sessions by pillar, recipe rich result impressions in Search Console, organic conversion rate to hero SKU pages, organic-attributed DTC revenue, and top 20 ranking positions by monthly organic sessions. Vanity metrics that do not matter: total pageviews without conversion context, average time on page without conversion attribution, and social share counts. The monthly report skips the vanity block entirely.
Quarterly business review structure
The quarterly business review runs 90 minutes with the founder, head of content, and SEO lead. Agenda: organic traffic trend by pillar, top 10 winning content pieces, top 10 losing content pieces (candidates for refresh or removal), competitive gap analysis against 5 named competitor brands, and next quarter’s content calendar with recipes and ingredient guides queued. According to Ahrefs content marketing research, brands running quarterly content audits outperform brands running annual audits by 40 to 70 percent on organic revenue over a 24-month window.
Internal linking discipline across food brand content
Internal linking discipline across food brand content moves authority from recipe pages toward hero SKU product pages and comparison guides. Every recipe links to the hero SKU it uses inline (once in the ingredient list, once in a bottom call-out card). Every ingredient comparison guide links to 3 to 6 recipes using the winning ingredient plus the hero SKU product page. Every sourcing story links to the 2 to 4 SKUs sourced from that specific farm or cooperative.
Anchor text strategy across recipe hubs
Anchor text on internal links varies across recipe hubs to avoid over-optimization patterns Google penalizes. Exact-match anchor (“single-origin Ethiopian coffee”) runs on 20 to 30 percent of internal links. Partial-match variations (“our Ethiopian roast”) run on 30 to 40 percent. Branded anchors (the SKU name) run on 20 to 30 percent. Generic anchors (“shop the coffee”) fill the remaining 10 to 20 percent. This ratio holds ranking without triggering the over-optimization penalty that shows up on brands that anchor-text-stuff every internal link with the same exact-match keyword. Cross-reference the linking layer on our food and beverage web design page.
Link equity from ingredient guides to SKU pages
Link equity from ingredient guides passes to SKU pages when the guide’s comparison table names the hero SKU in the winning column with a product card, and when the guide’s body links to 3 to 6 recipes that use the winning ingredient. This 3-hop path (guide to recipe to SKU) pushes authority from a high-traffic informational query down to a high-intent transactional page. According to Search Engine Land SEO coverage, informational content that internally links to transactional pages produces 2 to 4 times higher organic revenue than isolated content silos.
Wrapping up content marketing for food brands
Content marketing for food brands is the organic engine that turns a DTC snack, drink, or CPG storefront into a search-driven revenue channel. Recipe hub of 40 to 100 recipes. Ingredient comparison guides at 12 to 24 pieces. Sourcing story pages at 6 to 12 pieces. Buyer intent content at 8 to 16 pieces. Creator syndication calendar with 12 to 30 creators per quarter. Refresh cadence at 12 to 24 months by pillar. Reporting with organic sessions and organic revenue attribution.
If your DTC food brand is running paid social at 20,000 dollars monthly with a broken blog and zero recipe schema, professional content marketing for food brands pays for itself inside the first 90 days on organic traffic captured. Redefine Web ships content marketing inside our monthly retainer packages. Book a call and we will walk through the last three DTC food brands we built recipe hubs for, pillar by pillar.
Internal linking discipline across food brand content moves authority from recipe pages toward hero SKU product pages and comparison guides. Every recipe links to the hero SKU it uses inline (once in the ingredient list, once in a bottom call-out card). Every ingredient comparison guide links to 3 to 6 recipes using the winning ingredient plus the hero SKU product page. Every sourcing story links to the 2 to 4 SKUs sourced from that specific farm or cooperative.
Anchor text strategy across recipe hubs
Anchor text on internal links varies across recipe hubs to avoid over-optimization patterns Google penalizes. Exact-match anchor (“single-origin Ethiopian coffee”) runs on 20 to 30 percent of internal links. Partial-match variations (“our Ethiopian roast”) run on 30 to 40 percent. Branded anchors (the SKU name) run on 20 to 30 percent. Generic anchors (“shop the coffee”) fill the remaining 10 to 20 percent. This ratio holds ranking without triggering the over-optimization penalty that shows up on brands that anchor-text-stuff every internal link with the same exact-match keyword. Cross-reference the linking layer on our food and beverage web design page.
Link equity from ingredient guides to SKU pages
Link equity from ingredient guides passes to SKU pages when the guide’s comparison table names the hero SKU in the winning column with a product card, and when the guide’s body links to 3 to 6 recipes that use the winning ingredient. This 3-hop path (guide to recipe to SKU) pushes authority from a high-traffic informational query down to a high-intent transactional page. According to Search Engine Land SEO coverage, informational content that internally links to transactional pages produces 2 to 4 times higher organic revenue than isolated content silos.
Wrapping up content marketing for food brands
Content marketing for food brands is the organic engine that turns a DTC snack, drink, or CPG storefront into a search-driven revenue channel. Recipe hub of 40 to 100 recipes. Ingredient comparison guides at 12 to 24 pieces. Sourcing story pages at 6 to 12 pieces. Buyer intent content at 8 to 16 pieces. Creator syndication calendar with 12 to 30 creators per quarter. Refresh cadence at 12 to 24 months by pillar. Reporting with organic sessions and organic revenue attribution.
If your DTC food brand is running paid social at 20,000 dollars monthly with a broken blog and zero recipe schema, professional content marketing for food brands pays for itself inside the first 90 days on organic traffic captured. Redefine Web ships content marketing inside our monthly retainer packages. Book a call and we will walk through the last three DTC food brands we built recipe hubs for, pillar by pillar.
Content marketing for food brands starts with a recipe hub because recipe queries account for 40 to 60 percent of high-intent search volume in the food category. Every hero SKU needs 4 to 12 recipes anchored to it, each targeting a specific occasion and audience.
Skip the recipe hub and the brand loses the search real estate that pulls DTC storefront traffic month over month at zero incremental paid cost. Recipe traffic converts at 2 to 4 percent because the shopper landed with usage intent, not passive discovery, which is why food brands win on recipes.
Recipe schema and Google rich result eligibility
Every recipe page ships schema.org Recipe markup including cookTime, prepTime, recipeIngredient, recipeInstructions, nutrition, and aggregateRating. Correctly marked-up recipes qualify for Google’s recipe rich result carousel that pulls 3 to 6 times higher click-through rate than a plain blue link. The schema layer takes 15 minutes per recipe to author and 30 minutes to validate in Google Search Console. Cross-reference the recipe search stack on our food and beverage SEO page.
Recipe hub structure that scales
The recipe hub structure runs 40 to 100 recipes at maturity, organized by hero SKU (4 to 12 recipes per SKU) plus occasion tags (breakfast, weeknight dinner, meal prep, brunch, holiday). Every recipe links back to the hero SKU product page with the SKU embedded in an inline card. The hub earns internal linking value from ingredient comparison guides and the sourcing story pages, which feeds recipe ranking on Google. According to Google Search Central recipe structured data guidance, complete Recipe schema markup is required for eligibility in the recipe carousel and the ingredient search filter.
Pillar structure for food brand content marketing
The pillar structure on content marketing for food brands runs 4 content pillars concurrently: recipe hub (40 to 100 recipes), ingredient comparison guides (12 to 24 guides), sourcing story pages (6 to 12 pages), and buyer intent content (where to buy, subscription vs. one-time, gift bundle guides). Every pillar covers a distinct search intent and every pillar links back to the hero SKU product pages.
Ingredient comparison guide format
Ingredient comparison guides run 1,800 to 3,200 words comparing 2 to 4 ingredient types on 6 to 10 attributes with a comparison table, real-world use case examples, and links to the hero SKU that uses the specific ingredient. Example: organic vs. conventional oats compares nutritional profile, sourcing chain, cost, environmental impact, and taste on a 6-column table. The brand’s SKU appears in the winning column with a product card. These guides rank 3 to 8 months after publication and pull steady-state organic traffic.
Sourcing story pages that build trust
Sourcing story pages name the specific farms, cooperatives, or suppliers the brand sources from, with photos of the farms, farmer quotes, and specific harvest windows. A coffee brand’s Ethiopian farm page ranks for “single-origin Ethiopian coffee” and “Yirgacheffe coffee origin” plus 40 long-tail variations. The sourcing page pulls trust-building traffic that converts at 4 to 6 percent because the shopper landed pattern-matching on transparency and named provenance. Every sourcing page includes farmer or cooperative quotes, harvest dates, and a link back to 3 to 5 hero SKU pages that source from the named supplier.
Vejrø hospitality content case study
Vejrø Resort, a Danish private-island destination with an on-site restaurant focused on organic, locally sourced cuisine, joined us with strong social engagement and no organic-search real estate. Guests found the resort on Instagram but never in Google search for terms like “private island resort Denmark,” “farm-to-table hospitality Denmark,” or “Vejrø restaurant.” The same organic-search gap shows up on DTC food brands running paid social at 20,000 dollars monthly with a broken blog and zero recipe schema.
We built the conversion-focused website with on-site and off-site SEO tuned to the travel-niche keyword clusters, competitor analysis against comparable boutique resorts, and mobile-first design prioritizing guest discovery. Every page carried the structured data qualifying it for Google’s rich results in the hospitality category. Every internal link pushed authority toward the direct-booking conversion path.
Three months later, Vejrø hit 10,000 plus organic visitors, ranked for 200 plus first-page keywords, and pulled a 2.2 percent booking conversion rate from organic traffic. The same pattern applies to content marketing for food brands: recipe schema, ingredient comparison guides, and sourcing story pages pull organic traffic at 20 to 40 percent conversion into hero SKU pages inside 6 months when the content quality matches search intent and every page carries the right structured data markup. Vejrø also proved out the reporting discipline: every monthly report named the exact page, the exact keyword cluster, and the exact search feature (rich result, sitelinks, image pack) driving the incremental organic revenue instead of hiding behind aggregate traffic charts.
Recipe cadence and content calendar for food brands
Recipe cadence on a working food brand content calendar ships 2 to 4 new recipes per week during the first 6 months and drops to 1 per week at maturity. Each recipe takes 4 to 6 hours to produce (write, test in the kitchen, photograph, schema author, publish). At 3 recipes per week, the brand hits 78 recipes inside 6 months plus a backlog of ingredient comparison and sourcing content queued behind the recipe production line.
| Content pillar | Target volume year 1 | Production cost per piece | Refresh cadence |
|---|---|---|---|
| Recipe hub | 40 to 100 recipes | $180 to $320 | Every 12 months |
| Ingredient comparison guides | 12 to 24 guides | $450 to $780 | Every 18 months |
| Sourcing story pages | 6 to 12 pages | $680 to $1,200 | Every 24 months |
| Buyer intent content | 8 to 16 pieces | $220 to $420 | Every 12 months |
Photography as a content calendar constraint
Photography is the actual constraint on recipe cadence, not writing. Every recipe needs 6 to 12 photos: hero shot, ingredient flat lay, prep in progress, plated result, storage, and step shots for the schema markup. A working food brand batches photography 8 recipes at a time to keep the cost per recipe under 200 dollars. Skip the batching and the per-recipe cost climbs to 400 to 600 dollars, which caps recipe cadence at 1 per week and slows organic ranking timeline by 6 months.
Seasonal content calendar planning
Seasonal content calendar planning maps recipes and comparison guides to the seasonal windows they need to rank in. A Christmas cookie recipe needs to publish in September to rank by early December. A Valentine’s chocolate guide needs to publish in November to rank by early February. A back-to-school lunchbox recipe needs to publish in June to rank by late August. The 60-to-90-day ranking curve dictates the calendar.
Creator syndication inside food brand content
Creator syndication on food brand content marketing amplifies the recipe hub through Instagram Reels, TikTok, and YouTube Shorts creators paid to post their own version of the brand’s hero recipes. The creator content pulls net-new audiences into the recipe hub through the creator’s Link in Bio or Amazon Storefront tag. The syndication calendar names 12 to 30 creators per quarter with specific recipes assigned to each.
One brand we picked up had a spreadsheet titled “creator outreach 2023” with 47 rows and 3 responses. All 3 responses were auto-replies. The spreadsheet named zero recipes and offered flat rates below 100 dollars per post. Nobody posts a 30-second video for 87 dollars flat. Nobody.
Creator content commercial terms that work
Working creator content commercial terms run 350 to 1,500 dollars flat per post plus a 12 to 25 percent commission on tagged sales across a 30-day window. The commission mechanic pulls creators into follow-up posts because the incremental revenue continues past the initial fee. Mid-tier creators (30k to 150k followers) hit the sweet spot for food brand content because their engagement rate typically runs 4 to 8 percent versus 0.8 to 1.6 percent on mega-creators.
Content brief structure for creator partnerships
The content brief structure for creator partnerships runs a single page: the SKU, the specific recipe or usage occasion, 3 required brand mentions, 3 restricted claims (no health claims on non-medical SKUs), the pricing angle, the affiliate link, and 3 example videos that hit the tone. The brief avoids over-scripting because over-scripted creator content underperforms native creator voice by 40 to 60 percent on engagement rate.
Buyer intent content for food brand blogs
Buyer intent content on food brand blogs covers 8 to 16 pieces targeting explicit purchase-decision queries: “where to buy [brand],” “[brand] subscription vs. one-time,” “best [category] for [use case],” and “[brand] gift bundle.” Every buyer intent piece runs 1,400 to 2,400 words with a comparison table, product cards, and a clear conversion path to the specific SKU that matches the query intent. Buyer intent content converts at 3 to 6 percent versus 1 to 2 percent on recipe content because the shopper landed already planning to buy, not exploring a usage occasion.
Where-to-buy content structure
Where-to-buy content structure covers online (DTC storefront, Amazon, Target.com, Whole Foods online), retail (specific chain locators with the store finder embedded), and international (customs limitations, retailer partners abroad). Every piece names specific retailers, links to the store locator, and includes an FAQ block covering shipping availability, subscription options, and gift card compatibility. Where-to-buy content ranks for branded discovery queries the DTC storefront otherwise loses to competitor affiliate reviews.
Subscription versus one-time comparison content
Subscription versus one-time comparison content converts subscription commitments at 3 to 6 percent because it addresses the price-sensitivity concern head-on with a specific math table. The piece covers the discount structure (15 percent lifetime), the skip-a-month mechanic, the pause-anytime rule, the cancellation policy, and the specific yearly savings for the brand’s average consumption cadence. Cross-reference the retention structure on our food and beverage marketing retainer page.
Content refresh cadence on food brand pillars
Content refresh cadence on food brand content pillars runs a rolling audit every 12 to 24 months by pillar. Recipes get refreshed every 12 months with new photography, updated schema, and any nutrition or ingredient adjustments. Ingredient comparison guides refresh every 18 months to update market data. Sourcing story pages refresh every 24 months to reflect farm partnership changes and new harvest angles. Buyer intent content refreshes every 12 months to update retailer availability and pricing.
Recipe refresh priority order
Recipe refresh priority runs by organic traffic rank. The top 20 recipes by monthly organic sessions get refreshed first (new photography, schema audit, related recipe internal links, updated nutrition). The next 40 get refreshed at 15 months. The remaining recipes get refreshed opportunistically when the ranking slips past position 15 in Google. Skipping the refresh cadence lets recipe rankings drift out of the top 3 inside 18 months as newer competitor recipes take the position.
Schema audit checklist per refresh
The schema audit checklist per refresh runs 8 items: Recipe schema completeness, aggregateRating count and accuracy, nutrition data accuracy, prepTime and cookTime match the recipe body, image URLs valid at CDN, related recipe internal links working, product card SKU URL live, and Google Search Console rich result eligibility validated. This checklist takes 20 minutes per recipe and prevents the schema drift that costs recipe rankings 20 to 40 positions quietly.
Reporting cadence for food brand content marketing
Reporting cadence on food brand content marketing runs a monthly executive report plus a quarterly business review. The monthly report ships in the first business week and covers organic sessions by pillar, top 10 ranking recipes with position trend, ingredient guide ranking movements, sourcing page performance, and organic-attributed DTC revenue. Every number carries a comparison to the prior month and a plain-language interpretation the founder reads in 7 minutes.
Metrics that matter for content marketing
Metrics that matter for food brand content marketing: organic sessions by pillar, recipe rich result impressions in Search Console, organic conversion rate to hero SKU pages, organic-attributed DTC revenue, and top 20 ranking positions by monthly organic sessions. Vanity metrics that do not matter: total pageviews without conversion context, average time on page without conversion attribution, and social share counts. The monthly report skips the vanity block entirely.
Quarterly business review structure
The quarterly business review runs 90 minutes with the founder, head of content, and SEO lead. Agenda: organic traffic trend by pillar, top 10 winning content pieces, top 10 losing content pieces (candidates for refresh or removal), competitive gap analysis against 5 named competitor brands, and next quarter’s content calendar with recipes and ingredient guides queued. According to Ahrefs content marketing research, brands running quarterly content audits outperform brands running annual audits by 40 to 70 percent on organic revenue over a 24-month window.
Internal linking discipline across food brand content
Internal linking discipline across food brand content moves authority from recipe pages toward hero SKU product pages and comparison guides. Every recipe links to the hero SKU it uses inline (once in the ingredient list, once in a bottom call-out card). Every ingredient comparison guide links to 3 to 6 recipes using the winning ingredient plus the hero SKU product page. Every sourcing story links to the 2 to 4 SKUs sourced from that specific farm or cooperative.
Anchor text strategy across recipe hubs
Anchor text on internal links varies across recipe hubs to avoid over-optimization patterns Google penalizes. Exact-match anchor (“single-origin Ethiopian coffee”) runs on 20 to 30 percent of internal links. Partial-match variations (“our Ethiopian roast”) run on 30 to 40 percent. Branded anchors (the SKU name) run on 20 to 30 percent. Generic anchors (“shop the coffee”) fill the remaining 10 to 20 percent. This ratio holds ranking without triggering the over-optimization penalty that shows up on brands that anchor-text-stuff every internal link with the same exact-match keyword. Cross-reference the linking layer on our food and beverage web design page.
Link equity from ingredient guides to SKU pages
Link equity from ingredient guides passes to SKU pages when the guide’s comparison table names the hero SKU in the winning column with a product card, and when the guide’s body links to 3 to 6 recipes that use the winning ingredient. This 3-hop path (guide to recipe to SKU) pushes authority from a high-traffic informational query down to a high-intent transactional page. According to Search Engine Land SEO coverage, informational content that internally links to transactional pages produces 2 to 4 times higher organic revenue than isolated content silos.
Wrapping up content marketing for food brands
Content marketing for food brands is the organic engine that turns a DTC snack, drink, or CPG storefront into a search-driven revenue channel. Recipe hub of 40 to 100 recipes. Ingredient comparison guides at 12 to 24 pieces. Sourcing story pages at 6 to 12 pieces. Buyer intent content at 8 to 16 pieces. Creator syndication calendar with 12 to 30 creators per quarter. Refresh cadence at 12 to 24 months by pillar. Reporting with organic sessions and organic revenue attribution.
If your DTC food brand is running paid social at 20,000 dollars monthly with a broken blog and zero recipe schema, professional content marketing for food brands pays for itself inside the first 90 days on organic traffic captured. Redefine Web ships content marketing inside our monthly retainer packages. Book a call and we will walk through the last three DTC food brands we built recipe hubs for, pillar by pillar.
Content marketing for food brands starts with a recipe hub because recipe queries account for 40 to 60 percent of high-intent search volume in the food category. Every hero SKU needs 4 to 12 recipes anchored to it, each targeting a specific occasion and audience.
Skip the recipe hub and the brand loses the search real estate that pulls DTC storefront traffic month over month at zero incremental paid cost. Recipe traffic converts at 2 to 4 percent because the shopper landed with usage intent, not passive discovery, which is why food brands win on recipes.
Recipe schema and Google rich result eligibility
Every recipe page ships schema.org Recipe markup including cookTime, prepTime, recipeIngredient, recipeInstructions, nutrition, and aggregateRating. Correctly marked-up recipes qualify for Google’s recipe rich result carousel that pulls 3 to 6 times higher click-through rate than a plain blue link. The schema layer takes 15 minutes per recipe to author and 30 minutes to validate in Google Search Console. Cross-reference the recipe search stack on our food and beverage SEO page.
Recipe hub structure that scales
The recipe hub structure runs 40 to 100 recipes at maturity, organized by hero SKU (4 to 12 recipes per SKU) plus occasion tags (breakfast, weeknight dinner, meal prep, brunch, holiday). Every recipe links back to the hero SKU product page with the SKU embedded in an inline card. The hub earns internal linking value from ingredient comparison guides and the sourcing story pages, which feeds recipe ranking on Google. According to Google Search Central recipe structured data guidance, complete Recipe schema markup is required for eligibility in the recipe carousel and the ingredient search filter.
Pillar structure for food brand content marketing
The pillar structure on content marketing for food brands runs 4 content pillars concurrently: recipe hub (40 to 100 recipes), ingredient comparison guides (12 to 24 guides), sourcing story pages (6 to 12 pages), and buyer intent content (where to buy, subscription vs. one-time, gift bundle guides). Every pillar covers a distinct search intent and every pillar links back to the hero SKU product pages.
Ingredient comparison guide format
Ingredient comparison guides run 1,800 to 3,200 words comparing 2 to 4 ingredient types on 6 to 10 attributes with a comparison table, real-world use case examples, and links to the hero SKU that uses the specific ingredient. Example: organic vs. conventional oats compares nutritional profile, sourcing chain, cost, environmental impact, and taste on a 6-column table. The brand’s SKU appears in the winning column with a product card. These guides rank 3 to 8 months after publication and pull steady-state organic traffic.
Sourcing story pages that build trust
Sourcing story pages name the specific farms, cooperatives, or suppliers the brand sources from, with photos of the farms, farmer quotes, and specific harvest windows. A coffee brand’s Ethiopian farm page ranks for “single-origin Ethiopian coffee” and “Yirgacheffe coffee origin” plus 40 long-tail variations. The sourcing page pulls trust-building traffic that converts at 4 to 6 percent because the shopper landed pattern-matching on transparency and named provenance. Every sourcing page includes farmer or cooperative quotes, harvest dates, and a link back to 3 to 5 hero SKU pages that source from the named supplier.
Vejrø hospitality content case study
Vejrø Resort, a Danish private-island destination with an on-site restaurant focused on organic, locally sourced cuisine, joined us with strong social engagement and no organic-search real estate. Guests found the resort on Instagram but never in Google search for terms like “private island resort Denmark,” “farm-to-table hospitality Denmark,” or “Vejrø restaurant.” The same organic-search gap shows up on DTC food brands running paid social at 20,000 dollars monthly with a broken blog and zero recipe schema.
We built the conversion-focused website with on-site and off-site SEO tuned to the travel-niche keyword clusters, competitor analysis against comparable boutique resorts, and mobile-first design prioritizing guest discovery. Every page carried the structured data qualifying it for Google’s rich results in the hospitality category. Every internal link pushed authority toward the direct-booking conversion path.
Three months later, Vejrø hit 10,000 plus organic visitors, ranked for 200 plus first-page keywords, and pulled a 2.2 percent booking conversion rate from organic traffic. The same pattern applies to content marketing for food brands: recipe schema, ingredient comparison guides, and sourcing story pages pull organic traffic at 20 to 40 percent conversion into hero SKU pages inside 6 months when the content quality matches search intent and every page carries the right structured data markup. Vejrø also proved out the reporting discipline: every monthly report named the exact page, the exact keyword cluster, and the exact search feature (rich result, sitelinks, image pack) driving the incremental organic revenue instead of hiding behind aggregate traffic charts.
Recipe cadence and content calendar for food brands
Recipe cadence on a working food brand content calendar ships 2 to 4 new recipes per week during the first 6 months and drops to 1 per week at maturity. Each recipe takes 4 to 6 hours to produce (write, test in the kitchen, photograph, schema author, publish). At 3 recipes per week, the brand hits 78 recipes inside 6 months plus a backlog of ingredient comparison and sourcing content queued behind the recipe production line.
| Content pillar | Target volume year 1 | Production cost per piece | Refresh cadence |
|---|---|---|---|
| Recipe hub | 40 to 100 recipes | $180 to $320 | Every 12 months |
| Ingredient comparison guides | 12 to 24 guides | $450 to $780 | Every 18 months |
| Sourcing story pages | 6 to 12 pages | $680 to $1,200 | Every 24 months |
| Buyer intent content | 8 to 16 pieces | $220 to $420 | Every 12 months |
Photography as a content calendar constraint
Photography is the actual constraint on recipe cadence, not writing. Every recipe needs 6 to 12 photos: hero shot, ingredient flat lay, prep in progress, plated result, storage, and step shots for the schema markup. A working food brand batches photography 8 recipes at a time to keep the cost per recipe under 200 dollars. Skip the batching and the per-recipe cost climbs to 400 to 600 dollars, which caps recipe cadence at 1 per week and slows organic ranking timeline by 6 months.
Seasonal content calendar planning
Seasonal content calendar planning maps recipes and comparison guides to the seasonal windows they need to rank in. A Christmas cookie recipe needs to publish in September to rank by early December. A Valentine’s chocolate guide needs to publish in November to rank by early February. A back-to-school lunchbox recipe needs to publish in June to rank by late August. The 60-to-90-day ranking curve dictates the calendar.
Creator syndication inside food brand content
Creator syndication on food brand content marketing amplifies the recipe hub through Instagram Reels, TikTok, and YouTube Shorts creators paid to post their own version of the brand’s hero recipes. The creator content pulls net-new audiences into the recipe hub through the creator’s Link in Bio or Amazon Storefront tag. The syndication calendar names 12 to 30 creators per quarter with specific recipes assigned to each.
One brand we picked up had a spreadsheet titled “creator outreach 2023” with 47 rows and 3 responses. All 3 responses were auto-replies. The spreadsheet named zero recipes and offered flat rates below 100 dollars per post. Nobody posts a 30-second video for 87 dollars flat. Nobody.
Creator content commercial terms that work
Working creator content commercial terms run 350 to 1,500 dollars flat per post plus a 12 to 25 percent commission on tagged sales across a 30-day window. The commission mechanic pulls creators into follow-up posts because the incremental revenue continues past the initial fee. Mid-tier creators (30k to 150k followers) hit the sweet spot for food brand content because their engagement rate typically runs 4 to 8 percent versus 0.8 to 1.6 percent on mega-creators.
Content brief structure for creator partnerships
The content brief structure for creator partnerships runs a single page: the SKU, the specific recipe or usage occasion, 3 required brand mentions, 3 restricted claims (no health claims on non-medical SKUs), the pricing angle, the affiliate link, and 3 example videos that hit the tone. The brief avoids over-scripting because over-scripted creator content underperforms native creator voice by 40 to 60 percent on engagement rate.
Buyer intent content for food brand blogs
Buyer intent content on food brand blogs covers 8 to 16 pieces targeting explicit purchase-decision queries: “where to buy [brand],” “[brand] subscription vs. one-time,” “best [category] for [use case],” and “[brand] gift bundle.” Every buyer intent piece runs 1,400 to 2,400 words with a comparison table, product cards, and a clear conversion path to the specific SKU that matches the query intent. Buyer intent content converts at 3 to 6 percent versus 1 to 2 percent on recipe content because the shopper landed already planning to buy, not exploring a usage occasion.
Where-to-buy content structure
Where-to-buy content structure covers online (DTC storefront, Amazon, Target.com, Whole Foods online), retail (specific chain locators with the store finder embedded), and international (customs limitations, retailer partners abroad). Every piece names specific retailers, links to the store locator, and includes an FAQ block covering shipping availability, subscription options, and gift card compatibility. Where-to-buy content ranks for branded discovery queries the DTC storefront otherwise loses to competitor affiliate reviews.
Subscription versus one-time comparison content
Subscription versus one-time comparison content converts subscription commitments at 3 to 6 percent because it addresses the price-sensitivity concern head-on with a specific math table. The piece covers the discount structure (15 percent lifetime), the skip-a-month mechanic, the pause-anytime rule, the cancellation policy, and the specific yearly savings for the brand’s average consumption cadence. Cross-reference the retention structure on our food and beverage marketing retainer page.
Content refresh cadence on food brand pillars
Content refresh cadence on food brand content pillars runs a rolling audit every 12 to 24 months by pillar. Recipes get refreshed every 12 months with new photography, updated schema, and any nutrition or ingredient adjustments. Ingredient comparison guides refresh every 18 months to update market data. Sourcing story pages refresh every 24 months to reflect farm partnership changes and new harvest angles. Buyer intent content refreshes every 12 months to update retailer availability and pricing.
Recipe refresh priority order
Recipe refresh priority runs by organic traffic rank. The top 20 recipes by monthly organic sessions get refreshed first (new photography, schema audit, related recipe internal links, updated nutrition). The next 40 get refreshed at 15 months. The remaining recipes get refreshed opportunistically when the ranking slips past position 15 in Google. Skipping the refresh cadence lets recipe rankings drift out of the top 3 inside 18 months as newer competitor recipes take the position.
Schema audit checklist per refresh
The schema audit checklist per refresh runs 8 items: Recipe schema completeness, aggregateRating count and accuracy, nutrition data accuracy, prepTime and cookTime match the recipe body, image URLs valid at CDN, related recipe internal links working, product card SKU URL live, and Google Search Console rich result eligibility validated. This checklist takes 20 minutes per recipe and prevents the schema drift that costs recipe rankings 20 to 40 positions quietly.
Reporting cadence for food brand content marketing
Reporting cadence on food brand content marketing runs a monthly executive report plus a quarterly business review. The monthly report ships in the first business week and covers organic sessions by pillar, top 10 ranking recipes with position trend, ingredient guide ranking movements, sourcing page performance, and organic-attributed DTC revenue. Every number carries a comparison to the prior month and a plain-language interpretation the founder reads in 7 minutes.
Metrics that matter for content marketing
Metrics that matter for food brand content marketing: organic sessions by pillar, recipe rich result impressions in Search Console, organic conversion rate to hero SKU pages, organic-attributed DTC revenue, and top 20 ranking positions by monthly organic sessions. Vanity metrics that do not matter: total pageviews without conversion context, average time on page without conversion attribution, and social share counts. The monthly report skips the vanity block entirely.
Quarterly business review structure
The quarterly business review runs 90 minutes with the founder, head of content, and SEO lead. Agenda: organic traffic trend by pillar, top 10 winning content pieces, top 10 losing content pieces (candidates for refresh or removal), competitive gap analysis against 5 named competitor brands, and next quarter’s content calendar with recipes and ingredient guides queued. According to Ahrefs content marketing research, brands running quarterly content audits outperform brands running annual audits by 40 to 70 percent on organic revenue over a 24-month window.
Internal linking discipline across food brand content
Internal linking discipline across food brand content moves authority from recipe pages toward hero SKU product pages and comparison guides. Every recipe links to the hero SKU it uses inline (once in the ingredient list, once in a bottom call-out card). Every ingredient comparison guide links to 3 to 6 recipes using the winning ingredient plus the hero SKU product page. Every sourcing story links to the 2 to 4 SKUs sourced from that specific farm or cooperative.
Anchor text strategy across recipe hubs
Anchor text on internal links varies across recipe hubs to avoid over-optimization patterns Google penalizes. Exact-match anchor (“single-origin Ethiopian coffee”) runs on 20 to 30 percent of internal links. Partial-match variations (“our Ethiopian roast”) run on 30 to 40 percent. Branded anchors (the SKU name) run on 20 to 30 percent. Generic anchors (“shop the coffee”) fill the remaining 10 to 20 percent. This ratio holds ranking without triggering the over-optimization penalty that shows up on brands that anchor-text-stuff every internal link with the same exact-match keyword. Cross-reference the linking layer on our food and beverage web design page.
Link equity from ingredient guides to SKU pages
Link equity from ingredient guides passes to SKU pages when the guide’s comparison table names the hero SKU in the winning column with a product card, and when the guide’s body links to 3 to 6 recipes that use the winning ingredient. This 3-hop path (guide to recipe to SKU) pushes authority from a high-traffic informational query down to a high-intent transactional page. According to Search Engine Land SEO coverage, informational content that internally links to transactional pages produces 2 to 4 times higher organic revenue than isolated content silos.
Wrapping up content marketing for food brands
Content marketing for food brands is the organic engine that turns a DTC snack, drink, or CPG storefront into a search-driven revenue channel. Recipe hub of 40 to 100 recipes. Ingredient comparison guides at 12 to 24 pieces. Sourcing story pages at 6 to 12 pieces. Buyer intent content at 8 to 16 pieces. Creator syndication calendar with 12 to 30 creators per quarter. Refresh cadence at 12 to 24 months by pillar. Reporting with organic sessions and organic revenue attribution.
If your DTC food brand is running paid social at 20,000 dollars monthly with a broken blog and zero recipe schema, professional content marketing for food brands pays for itself inside the first 90 days on organic traffic captured. Redefine Web ships content marketing inside our monthly retainer packages. Book a call and we will walk through the last three DTC food brands we built recipe hubs for, pillar by pillar.
Anchor text on internal links varies across recipe hubs to avoid over-optimization patterns Google penalizes. Exact-match anchor (“single-origin Ethiopian coffee”) runs on 20 to 30 percent of internal links. Partial-match variations (“our Ethiopian roast”) run on 30 to 40 percent. Branded anchors (the SKU name) run on 20 to 30 percent. Generic anchors (“shop the coffee”) fill the remaining 10 to 20 percent. This ratio holds ranking without triggering the over-optimization penalty that shows up on brands that anchor-text-stuff every internal link with the same exact-match keyword. Cross-reference the linking layer on our food and beverage web design page.
Link equity from ingredient guides to SKU pages
Link equity from ingredient guides passes to SKU pages when the guide’s comparison table names the hero SKU in the winning column with a product card, and when the guide’s body links to 3 to 6 recipes that use the winning ingredient. This 3-hop path (guide to recipe to SKU) pushes authority from a high-traffic informational query down to a high-intent transactional page. According to Search Engine Land SEO coverage, informational content that internally links to transactional pages produces 2 to 4 times higher organic revenue than isolated content silos.
Wrapping up content marketing for food brands
Content marketing for food brands is the organic engine that turns a DTC snack, drink, or CPG storefront into a search-driven revenue channel. Recipe hub of 40 to 100 recipes. Ingredient comparison guides at 12 to 24 pieces. Sourcing story pages at 6 to 12 pieces. Buyer intent content at 8 to 16 pieces. Creator syndication calendar with 12 to 30 creators per quarter. Refresh cadence at 12 to 24 months by pillar. Reporting with organic sessions and organic revenue attribution.
If your DTC food brand is running paid social at 20,000 dollars monthly with a broken blog and zero recipe schema, professional content marketing for food brands pays for itself inside the first 90 days on organic traffic captured. Redefine Web ships content marketing inside our monthly retainer packages. Book a call and we will walk through the last three DTC food brands we built recipe hubs for, pillar by pillar.
Internal linking discipline across food brand content moves authority from recipe pages toward hero SKU product pages and comparison guides. Every recipe links to the hero SKU it uses inline (once in the ingredient list, once in a bottom call-out card). Every ingredient comparison guide links to 3 to 6 recipes using the winning ingredient plus the hero SKU product page. Every sourcing story links to the 2 to 4 SKUs sourced from that specific farm or cooperative.
Anchor text strategy across recipe hubs
Anchor text on internal links varies across recipe hubs to avoid over-optimization patterns Google penalizes. Exact-match anchor (“single-origin Ethiopian coffee”) runs on 20 to 30 percent of internal links. Partial-match variations (“our Ethiopian roast”) run on 30 to 40 percent. Branded anchors (the SKU name) run on 20 to 30 percent. Generic anchors (“shop the coffee”) fill the remaining 10 to 20 percent. This ratio holds ranking without triggering the over-optimization penalty that shows up on brands that anchor-text-stuff every internal link with the same exact-match keyword. Cross-reference the linking layer on our food and beverage web design page.
Link equity from ingredient guides to SKU pages
Link equity from ingredient guides passes to SKU pages when the guide’s comparison table names the hero SKU in the winning column with a product card, and when the guide’s body links to 3 to 6 recipes that use the winning ingredient. This 3-hop path (guide to recipe to SKU) pushes authority from a high-traffic informational query down to a high-intent transactional page. According to Search Engine Land SEO coverage, informational content that internally links to transactional pages produces 2 to 4 times higher organic revenue than isolated content silos.
Wrapping up content marketing for food brands
Content marketing for food brands is the organic engine that turns a DTC snack, drink, or CPG storefront into a search-driven revenue channel. Recipe hub of 40 to 100 recipes. Ingredient comparison guides at 12 to 24 pieces. Sourcing story pages at 6 to 12 pieces. Buyer intent content at 8 to 16 pieces. Creator syndication calendar with 12 to 30 creators per quarter. Refresh cadence at 12 to 24 months by pillar. Reporting with organic sessions and organic revenue attribution.
If your DTC food brand is running paid social at 20,000 dollars monthly with a broken blog and zero recipe schema, professional content marketing for food brands pays for itself inside the first 90 days on organic traffic captured. Redefine Web ships content marketing inside our monthly retainer packages. Book a call and we will walk through the last three DTC food brands we built recipe hubs for, pillar by pillar.
Content marketing for food brands starts with a recipe hub because recipe queries account for 40 to 60 percent of high-intent search volume in the food category. Every hero SKU needs 4 to 12 recipes anchored to it, each targeting a specific occasion and audience.
Skip the recipe hub and the brand loses the search real estate that pulls DTC storefront traffic month over month at zero incremental paid cost. Recipe traffic converts at 2 to 4 percent because the shopper landed with usage intent, not passive discovery, which is why food brands win on recipes.
Recipe schema and Google rich result eligibility
Every recipe page ships schema.org Recipe markup including cookTime, prepTime, recipeIngredient, recipeInstructions, nutrition, and aggregateRating. Correctly marked-up recipes qualify for Google’s recipe rich result carousel that pulls 3 to 6 times higher click-through rate than a plain blue link. The schema layer takes 15 minutes per recipe to author and 30 minutes to validate in Google Search Console. Cross-reference the recipe search stack on our food and beverage SEO page.
Recipe hub structure that scales
The recipe hub structure runs 40 to 100 recipes at maturity, organized by hero SKU (4 to 12 recipes per SKU) plus occasion tags (breakfast, weeknight dinner, meal prep, brunch, holiday). Every recipe links back to the hero SKU product page with the SKU embedded in an inline card. The hub earns internal linking value from ingredient comparison guides and the sourcing story pages, which feeds recipe ranking on Google. According to Google Search Central recipe structured data guidance, complete Recipe schema markup is required for eligibility in the recipe carousel and the ingredient search filter.
Pillar structure for food brand content marketing
The pillar structure on content marketing for food brands runs 4 content pillars concurrently: recipe hub (40 to 100 recipes), ingredient comparison guides (12 to 24 guides), sourcing story pages (6 to 12 pages), and buyer intent content (where to buy, subscription vs. one-time, gift bundle guides). Every pillar covers a distinct search intent and every pillar links back to the hero SKU product pages.
Ingredient comparison guide format
Ingredient comparison guides run 1,800 to 3,200 words comparing 2 to 4 ingredient types on 6 to 10 attributes with a comparison table, real-world use case examples, and links to the hero SKU that uses the specific ingredient. Example: organic vs. conventional oats compares nutritional profile, sourcing chain, cost, environmental impact, and taste on a 6-column table. The brand’s SKU appears in the winning column with a product card. These guides rank 3 to 8 months after publication and pull steady-state organic traffic.
Sourcing story pages that build trust
Sourcing story pages name the specific farms, cooperatives, or suppliers the brand sources from, with photos of the farms, farmer quotes, and specific harvest windows. A coffee brand’s Ethiopian farm page ranks for “single-origin Ethiopian coffee” and “Yirgacheffe coffee origin” plus 40 long-tail variations. The sourcing page pulls trust-building traffic that converts at 4 to 6 percent because the shopper landed pattern-matching on transparency and named provenance. Every sourcing page includes farmer or cooperative quotes, harvest dates, and a link back to 3 to 5 hero SKU pages that source from the named supplier.
Vejrø hospitality content case study
Vejrø Resort, a Danish private-island destination with an on-site restaurant focused on organic, locally sourced cuisine, joined us with strong social engagement and no organic-search real estate. Guests found the resort on Instagram but never in Google search for terms like “private island resort Denmark,” “farm-to-table hospitality Denmark,” or “Vejrø restaurant.” The same organic-search gap shows up on DTC food brands running paid social at 20,000 dollars monthly with a broken blog and zero recipe schema.
We built the conversion-focused website with on-site and off-site SEO tuned to the travel-niche keyword clusters, competitor analysis against comparable boutique resorts, and mobile-first design prioritizing guest discovery. Every page carried the structured data qualifying it for Google’s rich results in the hospitality category. Every internal link pushed authority toward the direct-booking conversion path.
Three months later, Vejrø hit 10,000 plus organic visitors, ranked for 200 plus first-page keywords, and pulled a 2.2 percent booking conversion rate from organic traffic. The same pattern applies to content marketing for food brands: recipe schema, ingredient comparison guides, and sourcing story pages pull organic traffic at 20 to 40 percent conversion into hero SKU pages inside 6 months when the content quality matches search intent and every page carries the right structured data markup. Vejrø also proved out the reporting discipline: every monthly report named the exact page, the exact keyword cluster, and the exact search feature (rich result, sitelinks, image pack) driving the incremental organic revenue instead of hiding behind aggregate traffic charts.
Recipe cadence and content calendar for food brands
Recipe cadence on a working food brand content calendar ships 2 to 4 new recipes per week during the first 6 months and drops to 1 per week at maturity. Each recipe takes 4 to 6 hours to produce (write, test in the kitchen, photograph, schema author, publish). At 3 recipes per week, the brand hits 78 recipes inside 6 months plus a backlog of ingredient comparison and sourcing content queued behind the recipe production line.
| Content pillar | Target volume year 1 | Production cost per piece | Refresh cadence |
|---|---|---|---|
| Recipe hub | 40 to 100 recipes | $180 to $320 | Every 12 months |
| Ingredient comparison guides | 12 to 24 guides | $450 to $780 | Every 18 months |
| Sourcing story pages | 6 to 12 pages | $680 to $1,200 | Every 24 months |
| Buyer intent content | 8 to 16 pieces | $220 to $420 | Every 12 months |
Photography as a content calendar constraint
Photography is the actual constraint on recipe cadence, not writing. Every recipe needs 6 to 12 photos: hero shot, ingredient flat lay, prep in progress, plated result, storage, and step shots for the schema markup. A working food brand batches photography 8 recipes at a time to keep the cost per recipe under 200 dollars. Skip the batching and the per-recipe cost climbs to 400 to 600 dollars, which caps recipe cadence at 1 per week and slows organic ranking timeline by 6 months.
Seasonal content calendar planning
Seasonal content calendar planning maps recipes and comparison guides to the seasonal windows they need to rank in. A Christmas cookie recipe needs to publish in September to rank by early December. A Valentine’s chocolate guide needs to publish in November to rank by early February. A back-to-school lunchbox recipe needs to publish in June to rank by late August. The 60-to-90-day ranking curve dictates the calendar.
Creator syndication inside food brand content
Creator syndication on food brand content marketing amplifies the recipe hub through Instagram Reels, TikTok, and YouTube Shorts creators paid to post their own version of the brand’s hero recipes. The creator content pulls net-new audiences into the recipe hub through the creator’s Link in Bio or Amazon Storefront tag. The syndication calendar names 12 to 30 creators per quarter with specific recipes assigned to each.
One brand we picked up had a spreadsheet titled “creator outreach 2023” with 47 rows and 3 responses. All 3 responses were auto-replies. The spreadsheet named zero recipes and offered flat rates below 100 dollars per post. Nobody posts a 30-second video for 87 dollars flat. Nobody.
Creator content commercial terms that work
Working creator content commercial terms run 350 to 1,500 dollars flat per post plus a 12 to 25 percent commission on tagged sales across a 30-day window. The commission mechanic pulls creators into follow-up posts because the incremental revenue continues past the initial fee. Mid-tier creators (30k to 150k followers) hit the sweet spot for food brand content because their engagement rate typically runs 4 to 8 percent versus 0.8 to 1.6 percent on mega-creators.
Content brief structure for creator partnerships
The content brief structure for creator partnerships runs a single page: the SKU, the specific recipe or usage occasion, 3 required brand mentions, 3 restricted claims (no health claims on non-medical SKUs), the pricing angle, the affiliate link, and 3 example videos that hit the tone. The brief avoids over-scripting because over-scripted creator content underperforms native creator voice by 40 to 60 percent on engagement rate.
Buyer intent content for food brand blogs
Buyer intent content on food brand blogs covers 8 to 16 pieces targeting explicit purchase-decision queries: “where to buy [brand],” “[brand] subscription vs. one-time,” “best [category] for [use case],” and “[brand] gift bundle.” Every buyer intent piece runs 1,400 to 2,400 words with a comparison table, product cards, and a clear conversion path to the specific SKU that matches the query intent. Buyer intent content converts at 3 to 6 percent versus 1 to 2 percent on recipe content because the shopper landed already planning to buy, not exploring a usage occasion.
Where-to-buy content structure
Where-to-buy content structure covers online (DTC storefront, Amazon, Target.com, Whole Foods online), retail (specific chain locators with the store finder embedded), and international (customs limitations, retailer partners abroad). Every piece names specific retailers, links to the store locator, and includes an FAQ block covering shipping availability, subscription options, and gift card compatibility. Where-to-buy content ranks for branded discovery queries the DTC storefront otherwise loses to competitor affiliate reviews.
Subscription versus one-time comparison content
Subscription versus one-time comparison content converts subscription commitments at 3 to 6 percent because it addresses the price-sensitivity concern head-on with a specific math table. The piece covers the discount structure (15 percent lifetime), the skip-a-month mechanic, the pause-anytime rule, the cancellation policy, and the specific yearly savings for the brand’s average consumption cadence. Cross-reference the retention structure on our food and beverage marketing retainer page.
Content refresh cadence on food brand pillars
Content refresh cadence on food brand content pillars runs a rolling audit every 12 to 24 months by pillar. Recipes get refreshed every 12 months with new photography, updated schema, and any nutrition or ingredient adjustments. Ingredient comparison guides refresh every 18 months to update market data. Sourcing story pages refresh every 24 months to reflect farm partnership changes and new harvest angles. Buyer intent content refreshes every 12 months to update retailer availability and pricing.
Recipe refresh priority order
Recipe refresh priority runs by organic traffic rank. The top 20 recipes by monthly organic sessions get refreshed first (new photography, schema audit, related recipe internal links, updated nutrition). The next 40 get refreshed at 15 months. The remaining recipes get refreshed opportunistically when the ranking slips past position 15 in Google. Skipping the refresh cadence lets recipe rankings drift out of the top 3 inside 18 months as newer competitor recipes take the position.
Schema audit checklist per refresh
The schema audit checklist per refresh runs 8 items: Recipe schema completeness, aggregateRating count and accuracy, nutrition data accuracy, prepTime and cookTime match the recipe body, image URLs valid at CDN, related recipe internal links working, product card SKU URL live, and Google Search Console rich result eligibility validated. This checklist takes 20 minutes per recipe and prevents the schema drift that costs recipe rankings 20 to 40 positions quietly.
Reporting cadence for food brand content marketing
Reporting cadence on food brand content marketing runs a monthly executive report plus a quarterly business review. The monthly report ships in the first business week and covers organic sessions by pillar, top 10 ranking recipes with position trend, ingredient guide ranking movements, sourcing page performance, and organic-attributed DTC revenue. Every number carries a comparison to the prior month and a plain-language interpretation the founder reads in 7 minutes.
Metrics that matter for content marketing
Metrics that matter for food brand content marketing: organic sessions by pillar, recipe rich result impressions in Search Console, organic conversion rate to hero SKU pages, organic-attributed DTC revenue, and top 20 ranking positions by monthly organic sessions. Vanity metrics that do not matter: total pageviews without conversion context, average time on page without conversion attribution, and social share counts. The monthly report skips the vanity block entirely.
Quarterly business review structure
The quarterly business review runs 90 minutes with the founder, head of content, and SEO lead. Agenda: organic traffic trend by pillar, top 10 winning content pieces, top 10 losing content pieces (candidates for refresh or removal), competitive gap analysis against 5 named competitor brands, and next quarter’s content calendar with recipes and ingredient guides queued. According to Ahrefs content marketing research, brands running quarterly content audits outperform brands running annual audits by 40 to 70 percent on organic revenue over a 24-month window.
Internal linking discipline across food brand content
Internal linking discipline across food brand content moves authority from recipe pages toward hero SKU product pages and comparison guides. Every recipe links to the hero SKU it uses inline (once in the ingredient list, once in a bottom call-out card). Every ingredient comparison guide links to 3 to 6 recipes using the winning ingredient plus the hero SKU product page. Every sourcing story links to the 2 to 4 SKUs sourced from that specific farm or cooperative.
Anchor text strategy across recipe hubs
Anchor text on internal links varies across recipe hubs to avoid over-optimization patterns Google penalizes. Exact-match anchor (“single-origin Ethiopian coffee”) runs on 20 to 30 percent of internal links. Partial-match variations (“our Ethiopian roast”) run on 30 to 40 percent. Branded anchors (the SKU name) run on 20 to 30 percent. Generic anchors (“shop the coffee”) fill the remaining 10 to 20 percent. This ratio holds ranking without triggering the over-optimization penalty that shows up on brands that anchor-text-stuff every internal link with the same exact-match keyword. Cross-reference the linking layer on our food and beverage web design page.
Link equity from ingredient guides to SKU pages
Link equity from ingredient guides passes to SKU pages when the guide’s comparison table names the hero SKU in the winning column with a product card, and when the guide’s body links to 3 to 6 recipes that use the winning ingredient. This 3-hop path (guide to recipe to SKU) pushes authority from a high-traffic informational query down to a high-intent transactional page. According to Search Engine Land SEO coverage, informational content that internally links to transactional pages produces 2 to 4 times higher organic revenue than isolated content silos.
Wrapping up content marketing for food brands
Content marketing for food brands is the organic engine that turns a DTC snack, drink, or CPG storefront into a search-driven revenue channel. Recipe hub of 40 to 100 recipes. Ingredient comparison guides at 12 to 24 pieces. Sourcing story pages at 6 to 12 pieces. Buyer intent content at 8 to 16 pieces. Creator syndication calendar with 12 to 30 creators per quarter. Refresh cadence at 12 to 24 months by pillar. Reporting with organic sessions and organic revenue attribution.
If your DTC food brand is running paid social at 20,000 dollars monthly with a broken blog and zero recipe schema, professional content marketing for food brands pays for itself inside the first 90 days on organic traffic captured. Redefine Web ships content marketing inside our monthly retainer packages. Book a call and we will walk through the last three DTC food brands we built recipe hubs for, pillar by pillar.
Content marketing for food brands starts with a recipe hub because recipe queries account for 40 to 60 percent of high-intent search volume in the food category. Every hero SKU needs 4 to 12 recipes anchored to it, each targeting a specific occasion and audience.
Skip the recipe hub and the brand loses the search real estate that pulls DTC storefront traffic month over month at zero incremental paid cost. Recipe traffic converts at 2 to 4 percent because the shopper landed with usage intent, not passive discovery, which is why food brands win on recipes.
Recipe schema and Google rich result eligibility
Every recipe page ships schema.org Recipe markup including cookTime, prepTime, recipeIngredient, recipeInstructions, nutrition, and aggregateRating. Correctly marked-up recipes qualify for Google’s recipe rich result carousel that pulls 3 to 6 times higher click-through rate than a plain blue link. The schema layer takes 15 minutes per recipe to author and 30 minutes to validate in Google Search Console. Cross-reference the recipe search stack on our food and beverage SEO page.
Recipe hub structure that scales
The recipe hub structure runs 40 to 100 recipes at maturity, organized by hero SKU (4 to 12 recipes per SKU) plus occasion tags (breakfast, weeknight dinner, meal prep, brunch, holiday). Every recipe links back to the hero SKU product page with the SKU embedded in an inline card. The hub earns internal linking value from ingredient comparison guides and the sourcing story pages, which feeds recipe ranking on Google. According to Google Search Central recipe structured data guidance, complete Recipe schema markup is required for eligibility in the recipe carousel and the ingredient search filter.
Pillar structure for food brand content marketing
The pillar structure on content marketing for food brands runs 4 content pillars concurrently: recipe hub (40 to 100 recipes), ingredient comparison guides (12 to 24 guides), sourcing story pages (6 to 12 pages), and buyer intent content (where to buy, subscription vs. one-time, gift bundle guides). Every pillar covers a distinct search intent and every pillar links back to the hero SKU product pages.
Ingredient comparison guide format
Ingredient comparison guides run 1,800 to 3,200 words comparing 2 to 4 ingredient types on 6 to 10 attributes with a comparison table, real-world use case examples, and links to the hero SKU that uses the specific ingredient. Example: organic vs. conventional oats compares nutritional profile, sourcing chain, cost, environmental impact, and taste on a 6-column table. The brand’s SKU appears in the winning column with a product card. These guides rank 3 to 8 months after publication and pull steady-state organic traffic.
Sourcing story pages that build trust
Sourcing story pages name the specific farms, cooperatives, or suppliers the brand sources from, with photos of the farms, farmer quotes, and specific harvest windows. A coffee brand’s Ethiopian farm page ranks for “single-origin Ethiopian coffee” and “Yirgacheffe coffee origin” plus 40 long-tail variations. The sourcing page pulls trust-building traffic that converts at 4 to 6 percent because the shopper landed pattern-matching on transparency and named provenance. Every sourcing page includes farmer or cooperative quotes, harvest dates, and a link back to 3 to 5 hero SKU pages that source from the named supplier.
Vejrø hospitality content case study
Vejrø Resort, a Danish private-island destination with an on-site restaurant focused on organic, locally sourced cuisine, joined us with strong social engagement and no organic-search real estate. Guests found the resort on Instagram but never in Google search for terms like “private island resort Denmark,” “farm-to-table hospitality Denmark,” or “Vejrø restaurant.” The same organic-search gap shows up on DTC food brands running paid social at 20,000 dollars monthly with a broken blog and zero recipe schema.
We built the conversion-focused website with on-site and off-site SEO tuned to the travel-niche keyword clusters, competitor analysis against comparable boutique resorts, and mobile-first design prioritizing guest discovery. Every page carried the structured data qualifying it for Google’s rich results in the hospitality category. Every internal link pushed authority toward the direct-booking conversion path.
Three months later, Vejrø hit 10,000 plus organic visitors, ranked for 200 plus first-page keywords, and pulled a 2.2 percent booking conversion rate from organic traffic. The same pattern applies to content marketing for food brands: recipe schema, ingredient comparison guides, and sourcing story pages pull organic traffic at 20 to 40 percent conversion into hero SKU pages inside 6 months when the content quality matches search intent and every page carries the right structured data markup. Vejrø also proved out the reporting discipline: every monthly report named the exact page, the exact keyword cluster, and the exact search feature (rich result, sitelinks, image pack) driving the incremental organic revenue instead of hiding behind aggregate traffic charts.
Recipe cadence and content calendar for food brands
Recipe cadence on a working food brand content calendar ships 2 to 4 new recipes per week during the first 6 months and drops to 1 per week at maturity. Each recipe takes 4 to 6 hours to produce (write, test in the kitchen, photograph, schema author, publish). At 3 recipes per week, the brand hits 78 recipes inside 6 months plus a backlog of ingredient comparison and sourcing content queued behind the recipe production line.
| Content pillar | Target volume year 1 | Production cost per piece | Refresh cadence |
|---|---|---|---|
| Recipe hub | 40 to 100 recipes | $180 to $320 | Every 12 months |
| Ingredient comparison guides | 12 to 24 guides | $450 to $780 | Every 18 months |
| Sourcing story pages | 6 to 12 pages | $680 to $1,200 | Every 24 months |
| Buyer intent content | 8 to 16 pieces | $220 to $420 | Every 12 months |
Photography as a content calendar constraint
Photography is the actual constraint on recipe cadence, not writing. Every recipe needs 6 to 12 photos: hero shot, ingredient flat lay, prep in progress, plated result, storage, and step shots for the schema markup. A working food brand batches photography 8 recipes at a time to keep the cost per recipe under 200 dollars. Skip the batching and the per-recipe cost climbs to 400 to 600 dollars, which caps recipe cadence at 1 per week and slows organic ranking timeline by 6 months.
Seasonal content calendar planning
Seasonal content calendar planning maps recipes and comparison guides to the seasonal windows they need to rank in. A Christmas cookie recipe needs to publish in September to rank by early December. A Valentine’s chocolate guide needs to publish in November to rank by early February. A back-to-school lunchbox recipe needs to publish in June to rank by late August. The 60-to-90-day ranking curve dictates the calendar.
Creator syndication inside food brand content
Creator syndication on food brand content marketing amplifies the recipe hub through Instagram Reels, TikTok, and YouTube Shorts creators paid to post their own version of the brand’s hero recipes. The creator content pulls net-new audiences into the recipe hub through the creator’s Link in Bio or Amazon Storefront tag. The syndication calendar names 12 to 30 creators per quarter with specific recipes assigned to each.
One brand we picked up had a spreadsheet titled “creator outreach 2023” with 47 rows and 3 responses. All 3 responses were auto-replies. The spreadsheet named zero recipes and offered flat rates below 100 dollars per post. Nobody posts a 30-second video for 87 dollars flat. Nobody.
Creator content commercial terms that work
Working creator content commercial terms run 350 to 1,500 dollars flat per post plus a 12 to 25 percent commission on tagged sales across a 30-day window. The commission mechanic pulls creators into follow-up posts because the incremental revenue continues past the initial fee. Mid-tier creators (30k to 150k followers) hit the sweet spot for food brand content because their engagement rate typically runs 4 to 8 percent versus 0.8 to 1.6 percent on mega-creators.
Content brief structure for creator partnerships
The content brief structure for creator partnerships runs a single page: the SKU, the specific recipe or usage occasion, 3 required brand mentions, 3 restricted claims (no health claims on non-medical SKUs), the pricing angle, the affiliate link, and 3 example videos that hit the tone. The brief avoids over-scripting because over-scripted creator content underperforms native creator voice by 40 to 60 percent on engagement rate.
Buyer intent content for food brand blogs
Buyer intent content on food brand blogs covers 8 to 16 pieces targeting explicit purchase-decision queries: “where to buy [brand],” “[brand] subscription vs. one-time,” “best [category] for [use case],” and “[brand] gift bundle.” Every buyer intent piece runs 1,400 to 2,400 words with a comparison table, product cards, and a clear conversion path to the specific SKU that matches the query intent. Buyer intent content converts at 3 to 6 percent versus 1 to 2 percent on recipe content because the shopper landed already planning to buy, not exploring a usage occasion.
Where-to-buy content structure
Where-to-buy content structure covers online (DTC storefront, Amazon, Target.com, Whole Foods online), retail (specific chain locators with the store finder embedded), and international (customs limitations, retailer partners abroad). Every piece names specific retailers, links to the store locator, and includes an FAQ block covering shipping availability, subscription options, and gift card compatibility. Where-to-buy content ranks for branded discovery queries the DTC storefront otherwise loses to competitor affiliate reviews.
Subscription versus one-time comparison content
Subscription versus one-time comparison content converts subscription commitments at 3 to 6 percent because it addresses the price-sensitivity concern head-on with a specific math table. The piece covers the discount structure (15 percent lifetime), the skip-a-month mechanic, the pause-anytime rule, the cancellation policy, and the specific yearly savings for the brand’s average consumption cadence. Cross-reference the retention structure on our food and beverage marketing retainer page.
Content refresh cadence on food brand pillars
Content refresh cadence on food brand content pillars runs a rolling audit every 12 to 24 months by pillar. Recipes get refreshed every 12 months with new photography, updated schema, and any nutrition or ingredient adjustments. Ingredient comparison guides refresh every 18 months to update market data. Sourcing story pages refresh every 24 months to reflect farm partnership changes and new harvest angles. Buyer intent content refreshes every 12 months to update retailer availability and pricing.
Recipe refresh priority order
Recipe refresh priority runs by organic traffic rank. The top 20 recipes by monthly organic sessions get refreshed first (new photography, schema audit, related recipe internal links, updated nutrition). The next 40 get refreshed at 15 months. The remaining recipes get refreshed opportunistically when the ranking slips past position 15 in Google. Skipping the refresh cadence lets recipe rankings drift out of the top 3 inside 18 months as newer competitor recipes take the position.
Schema audit checklist per refresh
The schema audit checklist per refresh runs 8 items: Recipe schema completeness, aggregateRating count and accuracy, nutrition data accuracy, prepTime and cookTime match the recipe body, image URLs valid at CDN, related recipe internal links working, product card SKU URL live, and Google Search Console rich result eligibility validated. This checklist takes 20 minutes per recipe and prevents the schema drift that costs recipe rankings 20 to 40 positions quietly.
Reporting cadence for food brand content marketing
Reporting cadence on food brand content marketing runs a monthly executive report plus a quarterly business review. The monthly report ships in the first business week and covers organic sessions by pillar, top 10 ranking recipes with position trend, ingredient guide ranking movements, sourcing page performance, and organic-attributed DTC revenue. Every number carries a comparison to the prior month and a plain-language interpretation the founder reads in 7 minutes.
Metrics that matter for content marketing
Metrics that matter for food brand content marketing: organic sessions by pillar, recipe rich result impressions in Search Console, organic conversion rate to hero SKU pages, organic-attributed DTC revenue, and top 20 ranking positions by monthly organic sessions. Vanity metrics that do not matter: total pageviews without conversion context, average time on page without conversion attribution, and social share counts. The monthly report skips the vanity block entirely.
Quarterly business review structure
The quarterly business review runs 90 minutes with the founder, head of content, and SEO lead. Agenda: organic traffic trend by pillar, top 10 winning content pieces, top 10 losing content pieces (candidates for refresh or removal), competitive gap analysis against 5 named competitor brands, and next quarter’s content calendar with recipes and ingredient guides queued. According to Ahrefs content marketing research, brands running quarterly content audits outperform brands running annual audits by 40 to 70 percent on organic revenue over a 24-month window.
Internal linking discipline across food brand content
Internal linking discipline across food brand content moves authority from recipe pages toward hero SKU product pages and comparison guides. Every recipe links to the hero SKU it uses inline (once in the ingredient list, once in a bottom call-out card). Every ingredient comparison guide links to 3 to 6 recipes using the winning ingredient plus the hero SKU product page. Every sourcing story links to the 2 to 4 SKUs sourced from that specific farm or cooperative.
Anchor text strategy across recipe hubs
Anchor text on internal links varies across recipe hubs to avoid over-optimization patterns Google penalizes. Exact-match anchor (“single-origin Ethiopian coffee”) runs on 20 to 30 percent of internal links. Partial-match variations (“our Ethiopian roast”) run on 30 to 40 percent. Branded anchors (the SKU name) run on 20 to 30 percent. Generic anchors (“shop the coffee”) fill the remaining 10 to 20 percent. This ratio holds ranking without triggering the over-optimization penalty that shows up on brands that anchor-text-stuff every internal link with the same exact-match keyword. Cross-reference the linking layer on our food and beverage web design page.
Link equity from ingredient guides to SKU pages
Link equity from ingredient guides passes to SKU pages when the guide’s comparison table names the hero SKU in the winning column with a product card, and when the guide’s body links to 3 to 6 recipes that use the winning ingredient. This 3-hop path (guide to recipe to SKU) pushes authority from a high-traffic informational query down to a high-intent transactional page. According to Search Engine Land SEO coverage, informational content that internally links to transactional pages produces 2 to 4 times higher organic revenue than isolated content silos.
Wrapping up content marketing for food brands
Content marketing for food brands is the organic engine that turns a DTC snack, drink, or CPG storefront into a search-driven revenue channel. Recipe hub of 40 to 100 recipes. Ingredient comparison guides at 12 to 24 pieces. Sourcing story pages at 6 to 12 pieces. Buyer intent content at 8 to 16 pieces. Creator syndication calendar with 12 to 30 creators per quarter. Refresh cadence at 12 to 24 months by pillar. Reporting with organic sessions and organic revenue attribution.
If your DTC food brand is running paid social at 20,000 dollars monthly with a broken blog and zero recipe schema, professional content marketing for food brands pays for itself inside the first 90 days on organic traffic captured. Redefine Web ships content marketing inside our monthly retainer packages. Book a call and we will walk through the last three DTC food brands we built recipe hubs for, pillar by pillar.
Frequently asked questions
What is content marketing for food brands?
Content marketing for food brands is the organic engine that turns a DTC snack, drink, or CPG storefront into a search-driven revenue channel that pulls month-over-month sales without paying Meta a second acquisition cost. The scope covers a recipe hub of 40 to 100 recipes tied to hero SKUs, ingredient comparison guides, sourcing story pages naming the farms and suppliers, a creator content syndication calendar, and a schema markup layer that qualifies every recipe for Google's recipe rich result carousel.
How many recipes does a food brand content hub need?
A working food brand recipe hub runs 40 to 100 recipes at maturity, organized by hero SKU (4 to 12 recipes per SKU) plus occasion tags like breakfast, weeknight dinner, meal prep, brunch, and holiday. Recipe cadence during the first 6 months ships 2 to 4 new recipes per week and drops to 1 per week at maturity. At 3 recipes per week, the brand hits 78 recipes inside 6 months plus a backlog of ingredient comparison and sourcing content queued behind the recipe production line.
How much does content marketing for food brands cost per month?
Content marketing for food brands runs 4,000 to 15,000 dollars monthly by production volume and pillar count. Small food brands running 8 recipes plus 2 comparison guides per month spend 4,000 to 6,000 dollars. Growth brands producing 12 recipes plus 4 guides plus 2 sourcing pages spend 8,000 to 12,000 dollars. Multi-SKU brands running 20 pieces monthly across all 4 pillars spend 12,000 to 15,000 dollars including photography, copywriting, schema markup, and content management system publishing.
How does recipe schema help a food brand rank on Google?
Recipe schema markup includes cookTime, prepTime, recipeIngredient, recipeInstructions, nutrition, and aggregateRating. Correctly marked-up recipes qualify for Google's recipe rich result carousel that pulls 3 to 6 times higher click-through rate than a plain blue link. The schema layer takes 15 minutes per recipe to author and 30 minutes to validate in Google Search Console. Missing or incomplete schema markup drops the recipe out of the carousel and cuts organic traffic by 60 to 80 percent even when the recipe body ranks page one.
What does creator syndication look like for food brand content?
Creator syndication on food brand content marketing amplifies the recipe hub through Instagram Reels, TikTok, and YouTube Shorts creators paid to post their own version of the brand's hero recipes. Working commercial terms run 350 to 1,500 dollars flat per post plus a 12 to 25 percent commission on tagged sales across a 30-day window. Mid-tier creators (30k to 150k followers) hit the sweet spot because their engagement rate typically runs 4 to 8 percent versus 0.8 to 1.6 percent on mega-creators over 1 million followers.
How often should a food brand refresh its content?
Content refresh cadence on food brand content pillars runs a rolling audit every 12 to 24 months by pillar. Recipes get refreshed every 12 months with new photography, updated schema, and any nutrition or ingredient adjustments. Ingredient comparison guides refresh every 18 months to update market data. Sourcing story pages refresh every 24 months to reflect farm partnership changes and new harvest angles. Buyer intent content refreshes every 12 months to update retailer availability and pricing. Skipping the refresh drops recipe rankings inside 18 months.
Book your free 30-minute strategy call.
No spam, no sales rep. We use your email to schedule your call with a senior strategist. That is it.
More from the blog
View all articles → Digital Marketing
 Dental Marketing Tips That Compound Into New Patients
Read article Digital Marketing
 Ecommerce Marketing Strategies That Drive Real DTC Revenue
Read article Digital Marketing