
Fashion Ecommerce Marketing That Grows DTC Apparel Revenue
- Fashion ecommerce marketing runs on five nodes.
- Return rate is the single biggest apparel margin killer.
- Fit content on the product page cuts returns 4 to 9 points.
- Size selector belongs first in mobile checkout not last.
- Retention decides margin more than any paid channel.
- Four data streams reconcile the honest revenue number.
- Benchmarks inside fashion ecommerce marketing
- How do you measure fashion ecommerce marketing honestly
- Fashion ecommerce marketing in production
- The weekly review that keeps the plan honest
- Where fashion ecommerce marketing fits the wider stack
- Retention inside fashion ecommerce marketing
- Benchmarks inside fashion ecommerce marketing
- How do you measure fashion ecommerce marketing honestly
- Fashion ecommerce marketing in production
- The weekly review that keeps the plan honest
- Where fashion ecommerce marketing fits the wider stack
- Paid social inside fashion ecommerce marketing
- Retention inside fashion ecommerce marketing
- Benchmarks inside fashion ecommerce marketing
- How do you measure fashion ecommerce marketing honestly
- Fashion ecommerce marketing in production
- The weekly review that keeps the plan honest
- Where fashion ecommerce marketing fits the wider stack
- Checkout inside fashion ecommerce marketing
- Paid social inside fashion ecommerce marketing
- Retention inside fashion ecommerce marketing
- Benchmarks inside fashion ecommerce marketing
- How do you measure fashion ecommerce marketing honestly
- Fashion ecommerce marketing in production
- The weekly review that keeps the plan honest
- Where fashion ecommerce marketing fits the wider stack
- Product page imagery inside fashion ecommerce marketing
- Checkout inside fashion ecommerce marketing
- Paid social inside fashion ecommerce marketing
- Retention inside fashion ecommerce marketing
- Benchmarks inside fashion ecommerce marketing
- How do you measure fashion ecommerce marketing honestly
- Fashion ecommerce marketing in production
- The weekly review that keeps the plan honest
- Where fashion ecommerce marketing fits the wider stack
- How do you measure fashion ecommerce marketing honestly
- Fashion ecommerce marketing in production
- The weekly review that keeps the plan honest
- Where fashion ecommerce marketing fits the wider stack
- Product page imagery inside fashion ecommerce marketing
- Checkout inside fashion ecommerce marketing
- Paid social inside fashion ecommerce marketing
- Retention inside fashion ecommerce marketing
- Benchmarks inside fashion ecommerce marketing
- How do you measure fashion ecommerce marketing honestly
- Fashion ecommerce marketing in production
- The weekly review that keeps the plan honest
- Where fashion ecommerce marketing fits the wider stack
- Benchmarks inside fashion ecommerce marketing
- How do you measure fashion ecommerce marketing honestly
- Fashion ecommerce marketing in production
- The weekly review that keeps the plan honest
- Where fashion ecommerce marketing fits the wider stack
- Product page imagery inside fashion ecommerce marketing
- Checkout inside fashion ecommerce marketing
- Paid social inside fashion ecommerce marketing
- Retention inside fashion ecommerce marketing
- Benchmarks inside fashion ecommerce marketing
- How do you measure fashion ecommerce marketing honestly
- Fashion ecommerce marketing in production
- The weekly review that keeps the plan honest
- Where fashion ecommerce marketing fits the wider stack
- Retention inside fashion ecommerce marketing
- Benchmarks inside fashion ecommerce marketing
- How do you measure fashion ecommerce marketing honestly
- Fashion ecommerce marketing in production
- The weekly review that keeps the plan honest
- Where fashion ecommerce marketing fits the wider stack
- Product page imagery inside fashion ecommerce marketing
- Checkout inside fashion ecommerce marketing
- Paid social inside fashion ecommerce marketing
- Retention inside fashion ecommerce marketing
- Benchmarks inside fashion ecommerce marketing
- How do you measure fashion ecommerce marketing honestly
- Fashion ecommerce marketing in production
- The weekly review that keeps the plan honest
- Where fashion ecommerce marketing fits the wider stack
- Paid social inside fashion ecommerce marketing
- Retention inside fashion ecommerce marketing
- Benchmarks inside fashion ecommerce marketing
- How do you measure fashion ecommerce marketing honestly
- Fashion ecommerce marketing in production
- The weekly review that keeps the plan honest
- Where fashion ecommerce marketing fits the wider stack
- Product page imagery inside fashion ecommerce marketing
- Checkout inside fashion ecommerce marketing
- Paid social inside fashion ecommerce marketing
- Retention inside fashion ecommerce marketing
- Benchmarks inside fashion ecommerce marketing
- How do you measure fashion ecommerce marketing honestly
- Fashion ecommerce marketing in production
- The weekly review that keeps the plan honest
- Where fashion ecommerce marketing fits the wider stack
- Checkout inside fashion ecommerce marketing
- Paid social inside fashion ecommerce marketing
- Retention inside fashion ecommerce marketing
- Benchmarks inside fashion ecommerce marketing
- How do you measure fashion ecommerce marketing honestly
- Fashion ecommerce marketing in production
- The weekly review that keeps the plan honest
- Where fashion ecommerce marketing fits the wider stack
- Product page imagery inside fashion ecommerce marketing
- Checkout inside fashion ecommerce marketing
- Paid social inside fashion ecommerce marketing
- Retention inside fashion ecommerce marketing
- Benchmarks inside fashion ecommerce marketing
- How do you measure fashion ecommerce marketing honestly
- Fashion ecommerce marketing in production
- The weekly review that keeps the plan honest
- Where fashion ecommerce marketing fits the wider stack
- How do you measure fashion ecommerce marketing honestly
- Fashion ecommerce marketing in production
- The weekly review that keeps the plan honest
- Where fashion ecommerce marketing fits the wider stack
- Checkout inside fashion ecommerce marketing
- Paid social inside fashion ecommerce marketing
- Retention inside fashion ecommerce marketing
- Benchmarks inside fashion ecommerce marketing
- How do you measure fashion ecommerce marketing honestly
- Fashion ecommerce marketing in production
- The weekly review that keeps the plan honest
- Where fashion ecommerce marketing fits the wider stack
- Product page imagery inside fashion ecommerce marketing
- Checkout inside fashion ecommerce marketing
- Paid social inside fashion ecommerce marketing
- Retention inside fashion ecommerce marketing
- Benchmarks inside fashion ecommerce marketing
- How do you measure fashion ecommerce marketing honestly
- Fashion ecommerce marketing in production
- The weekly review that keeps the plan honest
- Where fashion ecommerce marketing fits the wider stack
- Benchmarks inside fashion ecommerce marketing
- How do you measure fashion ecommerce marketing honestly
- Fashion ecommerce marketing in production
- The weekly review that keeps the plan honest
- Where fashion ecommerce marketing fits the wider stack
- Checkout inside fashion ecommerce marketing
- Paid social inside fashion ecommerce marketing
- Retention inside fashion ecommerce marketing
- Benchmarks inside fashion ecommerce marketing
- How do you measure fashion ecommerce marketing honestly
- Fashion ecommerce marketing in production
- The weekly review that keeps the plan honest
- Where fashion ecommerce marketing fits the wider stack
- Product page imagery inside fashion ecommerce marketing
- Checkout inside fashion ecommerce marketing
- Paid social inside fashion ecommerce marketing
- Retention inside fashion ecommerce marketing
- Benchmarks inside fashion ecommerce marketing
- How do you measure fashion ecommerce marketing honestly
- Fashion ecommerce marketing in production
- The weekly review that keeps the plan honest
- Where fashion ecommerce marketing fits the wider stack
- Retention inside fashion ecommerce marketing
- Benchmarks inside fashion ecommerce marketing
- How do you measure fashion ecommerce marketing honestly
- Fashion ecommerce marketing in production
- The weekly review that keeps the plan honest
- Where fashion ecommerce marketing fits the wider stack
- Checkout inside fashion ecommerce marketing
- Paid social inside fashion ecommerce marketing
- Retention inside fashion ecommerce marketing
- Benchmarks inside fashion ecommerce marketing
- How do you measure fashion ecommerce marketing honestly
- Fashion ecommerce marketing in production
- The weekly review that keeps the plan honest
- Where fashion ecommerce marketing fits the wider stack
- Product page imagery inside fashion ecommerce marketing
- Checkout inside fashion ecommerce marketing
- Paid social inside fashion ecommerce marketing
- Retention inside fashion ecommerce marketing
- Benchmarks inside fashion ecommerce marketing
- How do you measure fashion ecommerce marketing honestly
- Fashion ecommerce marketing in production
- The weekly review that keeps the plan honest
- Where fashion ecommerce marketing fits the wider stack
- Paid social inside fashion ecommerce marketing
- Retention inside fashion ecommerce marketing
- Benchmarks inside fashion ecommerce marketing
- How do you measure fashion ecommerce marketing honestly
- Fashion ecommerce marketing in production
- The weekly review that keeps the plan honest
- Where fashion ecommerce marketing fits the wider stack
- Checkout inside fashion ecommerce marketing
- Paid social inside fashion ecommerce marketing
- Retention inside fashion ecommerce marketing
- Benchmarks inside fashion ecommerce marketing
- How do you measure fashion ecommerce marketing honestly
- Fashion ecommerce marketing in production
- The weekly review that keeps the plan honest
- Where fashion ecommerce marketing fits the wider stack
- Product page imagery inside fashion ecommerce marketing
- Checkout inside fashion ecommerce marketing
- Paid social inside fashion ecommerce marketing
- Retention inside fashion ecommerce marketing
- Benchmarks inside fashion ecommerce marketing
- How do you measure fashion ecommerce marketing honestly
- Fashion ecommerce marketing in production
- The weekly review that keeps the plan honest
- Where fashion ecommerce marketing fits the wider stack
- How do you measure fashion ecommerce marketing honestly
- Fashion ecommerce marketing in production
- The weekly review that keeps the plan honest
- Where fashion ecommerce marketing fits the wider stack
- Paid social inside fashion ecommerce marketing
- Retention inside fashion ecommerce marketing
- Benchmarks inside fashion ecommerce marketing
- How do you measure fashion ecommerce marketing honestly
- Fashion ecommerce marketing in production
- The weekly review that keeps the plan honest
- Where fashion ecommerce marketing fits the wider stack
- Checkout inside fashion ecommerce marketing
- Paid social inside fashion ecommerce marketing
- Retention inside fashion ecommerce marketing
- Benchmarks inside fashion ecommerce marketing
- How do you measure fashion ecommerce marketing honestly
- Fashion ecommerce marketing in production
- The weekly review that keeps the plan honest
- Where fashion ecommerce marketing fits the wider stack
- Product page imagery inside fashion ecommerce marketing
- Checkout inside fashion ecommerce marketing
- Paid social inside fashion ecommerce marketing
- Retention inside fashion ecommerce marketing
- Benchmarks inside fashion ecommerce marketing
- How do you measure fashion ecommerce marketing honestly
- Fashion ecommerce marketing in production
- The weekly review that keeps the plan honest
- Where fashion ecommerce marketing fits the wider stack
- Benchmarks inside fashion ecommerce marketing
- How do you measure fashion ecommerce marketing honestly
- Fashion ecommerce marketing in production
- The weekly review that keeps the plan honest
- Where fashion ecommerce marketing fits the wider stack
- Paid social inside fashion ecommerce marketing
- Retention inside fashion ecommerce marketing
- Benchmarks inside fashion ecommerce marketing
- How do you measure fashion ecommerce marketing honestly
- Fashion ecommerce marketing in production
- The weekly review that keeps the plan honest
- Where fashion ecommerce marketing fits the wider stack
- Checkout inside fashion ecommerce marketing
- Paid social inside fashion ecommerce marketing
- Retention inside fashion ecommerce marketing
- Benchmarks inside fashion ecommerce marketing
- How do you measure fashion ecommerce marketing honestly
- Fashion ecommerce marketing in production
- The weekly review that keeps the plan honest
- Where fashion ecommerce marketing fits the wider stack
- Product page imagery inside fashion ecommerce marketing
- Checkout inside fashion ecommerce marketing
- Paid social inside fashion ecommerce marketing
- Retention inside fashion ecommerce marketing
- Benchmarks inside fashion ecommerce marketing
- How do you measure fashion ecommerce marketing honestly
- Fashion ecommerce marketing in production
- The weekly review that keeps the plan honest
- Where fashion ecommerce marketing fits the wider stack
- Retention inside fashion ecommerce marketing
- Benchmarks inside fashion ecommerce marketing
- How do you measure fashion ecommerce marketing honestly
- Fashion ecommerce marketing in production
- The weekly review that keeps the plan honest
- Where fashion ecommerce marketing fits the wider stack
- Paid social inside fashion ecommerce marketing
- Retention inside fashion ecommerce marketing
- Benchmarks inside fashion ecommerce marketing
- How do you measure fashion ecommerce marketing honestly
- Fashion ecommerce marketing in production
- The weekly review that keeps the plan honest
- Where fashion ecommerce marketing fits the wider stack
- Checkout inside fashion ecommerce marketing
- Paid social inside fashion ecommerce marketing
- Retention inside fashion ecommerce marketing
- Benchmarks inside fashion ecommerce marketing
- How do you measure fashion ecommerce marketing honestly
- Fashion ecommerce marketing in production
- The weekly review that keeps the plan honest
- Where fashion ecommerce marketing fits the wider stack
- Product page imagery inside fashion ecommerce marketing
- Checkout inside fashion ecommerce marketing
- Paid social inside fashion ecommerce marketing
- Retention inside fashion ecommerce marketing
- Benchmarks inside fashion ecommerce marketing
- How do you measure fashion ecommerce marketing honestly
- Fashion ecommerce marketing in production
- The weekly review that keeps the plan honest
- Where fashion ecommerce marketing fits the wider stack
- How do you measure fashion ecommerce marketing honestly
- Fashion ecommerce marketing in production
- The weekly review that keeps the plan honest
- Where fashion ecommerce marketing fits the wider stack
- Retention inside fashion ecommerce marketing
- Benchmarks inside fashion ecommerce marketing
- How do you measure fashion ecommerce marketing honestly
- Fashion ecommerce marketing in production
- The weekly review that keeps the plan honest
- Where fashion ecommerce marketing fits the wider stack
- Paid social inside fashion ecommerce marketing
- Retention inside fashion ecommerce marketing
- Benchmarks inside fashion ecommerce marketing
- How do you measure fashion ecommerce marketing honestly
- Fashion ecommerce marketing in production
- The weekly review that keeps the plan honest
- Where fashion ecommerce marketing fits the wider stack
- Checkout inside fashion ecommerce marketing
- Paid social inside fashion ecommerce marketing
- Retention inside fashion ecommerce marketing
- Benchmarks inside fashion ecommerce marketing
- How do you measure fashion ecommerce marketing honestly
- Fashion ecommerce marketing in production
- The weekly review that keeps the plan honest
- Where fashion ecommerce marketing fits the wider stack
- Product page imagery inside fashion ecommerce marketing
- Checkout inside fashion ecommerce marketing
- Paid social inside fashion ecommerce marketing
- Retention inside fashion ecommerce marketing
- Benchmarks inside fashion ecommerce marketing
- How do you measure fashion ecommerce marketing honestly
- Fashion ecommerce marketing in production
- The weekly review that keeps the plan honest
- Where fashion ecommerce marketing fits the wider stack
- Benchmarks inside fashion ecommerce marketing
- How do you measure fashion ecommerce marketing honestly
- Fashion ecommerce marketing in production
- The weekly review that keeps the plan honest
- Where fashion ecommerce marketing fits the wider stack
- Retention inside fashion ecommerce marketing
- Benchmarks inside fashion ecommerce marketing
- How do you measure fashion ecommerce marketing honestly
- Fashion ecommerce marketing in production
- The weekly review that keeps the plan honest
- Where fashion ecommerce marketing fits the wider stack
- Paid social inside fashion ecommerce marketing
- Retention inside fashion ecommerce marketing
- Benchmarks inside fashion ecommerce marketing
- How do you measure fashion ecommerce marketing honestly
- Fashion ecommerce marketing in production
- The weekly review that keeps the plan honest
- Where fashion ecommerce marketing fits the wider stack
- Checkout inside fashion ecommerce marketing
- Paid social inside fashion ecommerce marketing
- Retention inside fashion ecommerce marketing
- Benchmarks inside fashion ecommerce marketing
- How do you measure fashion ecommerce marketing honestly
- Fashion ecommerce marketing in production
- The weekly review that keeps the plan honest
- Where fashion ecommerce marketing fits the wider stack
- Product page imagery inside fashion ecommerce marketing
- Checkout inside fashion ecommerce marketing
- Paid social inside fashion ecommerce marketing
- Retention inside fashion ecommerce marketing
- Benchmarks inside fashion ecommerce marketing
- How do you measure fashion ecommerce marketing honestly
- Fashion ecommerce marketing in production
- The weekly review that keeps the plan honest
- Where fashion ecommerce marketing fits the wider stack
- How do you measure fashion ecommerce marketing honestly
- Fashion ecommerce marketing in production
- The weekly review that keeps the plan honest
- Where fashion ecommerce marketing fits the wider stack
- Benchmarks inside fashion ecommerce marketing
- How do you measure fashion ecommerce marketing honestly
- Fashion ecommerce marketing in production
- The weekly review that keeps the plan honest
- Where fashion ecommerce marketing fits the wider stack
- Retention inside fashion ecommerce marketing
- Benchmarks inside fashion ecommerce marketing
- How do you measure fashion ecommerce marketing honestly
- Fashion ecommerce marketing in production
- The weekly review that keeps the plan honest
- Where fashion ecommerce marketing fits the wider stack
- Paid social inside fashion ecommerce marketing
- Retention inside fashion ecommerce marketing
- Benchmarks inside fashion ecommerce marketing
- How do you measure fashion ecommerce marketing honestly
- Fashion ecommerce marketing in production
- The weekly review that keeps the plan honest
- Where fashion ecommerce marketing fits the wider stack
- Checkout inside fashion ecommerce marketing
- Paid social inside fashion ecommerce marketing
- Retention inside fashion ecommerce marketing
- Benchmarks inside fashion ecommerce marketing
- How do you measure fashion ecommerce marketing honestly
- Fashion ecommerce marketing in production
- The weekly review that keeps the plan honest
- Where fashion ecommerce marketing fits the wider stack
- Product page imagery inside fashion ecommerce marketing
- Checkout inside fashion ecommerce marketing
- Paid social inside fashion ecommerce marketing
- Retention inside fashion ecommerce marketing
- Benchmarks inside fashion ecommerce marketing
- How do you measure fashion ecommerce marketing honestly
- Fashion ecommerce marketing in production
- The weekly review that keeps the plan honest
- Where fashion ecommerce marketing fits the wider stack
- Size and fit inside fashion ecommerce marketing
- Fashion ecommerce marketing in production
- The weekly review that keeps the plan honest
- Where fashion ecommerce marketing fits the wider stack
- How do you measure fashion ecommerce marketing honestly
- Fashion ecommerce marketing in production
- The weekly review that keeps the plan honest
- Where fashion ecommerce marketing fits the wider stack
- Benchmarks inside fashion ecommerce marketing
- How do you measure fashion ecommerce marketing honestly
- Fashion ecommerce marketing in production
- The weekly review that keeps the plan honest
- Where fashion ecommerce marketing fits the wider stack
- Retention inside fashion ecommerce marketing
- Benchmarks inside fashion ecommerce marketing
- How do you measure fashion ecommerce marketing honestly
- Fashion ecommerce marketing in production
- The weekly review that keeps the plan honest
- Where fashion ecommerce marketing fits the wider stack
- Paid social inside fashion ecommerce marketing
- Retention inside fashion ecommerce marketing
- Benchmarks inside fashion ecommerce marketing
- How do you measure fashion ecommerce marketing honestly
- Fashion ecommerce marketing in production
- The weekly review that keeps the plan honest
- Where fashion ecommerce marketing fits the wider stack
- Checkout inside fashion ecommerce marketing
- Paid social inside fashion ecommerce marketing
- Retention inside fashion ecommerce marketing
- Benchmarks inside fashion ecommerce marketing
- How do you measure fashion ecommerce marketing honestly
- Fashion ecommerce marketing in production
- The weekly review that keeps the plan honest
- Where fashion ecommerce marketing fits the wider stack
- Product page imagery inside fashion ecommerce marketing
- Checkout inside fashion ecommerce marketing
- Paid social inside fashion ecommerce marketing
- Retention inside fashion ecommerce marketing
- Benchmarks inside fashion ecommerce marketing
- How do you measure fashion ecommerce marketing honestly
- Fashion ecommerce marketing in production
- The weekly review that keeps the plan honest
- Where fashion ecommerce marketing fits the wider stack
Retention is the layer that decides whether the P and L runs on margin or grinds through paid acquisition to break even. A DTC apparel brand with a 30 percent day 90 repeat rate runs 20 to 35 percent more contribution margin per blended dollar of spend than the same brand at 15 percent. Retention is not one channel. It is a stack of email, SMS, loyalty, and post purchase content on a monthly calendar.
Email and SMS as the core
Email drives 25 to 35 percent of DTC apparel revenue when the flow set is complete. Welcome, browse abandonment, cart abandonment, post purchase, replenishment, VIP, and win back are the seven flows every brand needs live inside the first 90 days. SMS adds another 8 to 15 percent of revenue at a 5 to 12 percent list opt in rate. Klaviyo and Attentive dominate the DTC apparel tool stack because the two platforms handle 90 percent of the flow logic without custom development. Our what is fashion marketing primer covers how the retention layer plugs into the wider channel mix.
Post purchase content that grows LTV
Post purchase content covers the four weeks after delivery on a first order. Styling emails that pair the purchased SKU with three complementary pieces. A fit review request at day seven when the buyer has worn the garment twice. A community moment at day fourteen with user photos of the same SKU. A second order incentive at day 28 with a category adjacent recommendation. Programs that publish the full post purchase sequence grow lifetime value 22 to 45 percent by month twelve on the same first order cohort, and the retention layer starts to carry the revenue growth the paid team used to carry alone.
Benchmarks inside fashion ecommerce marketing
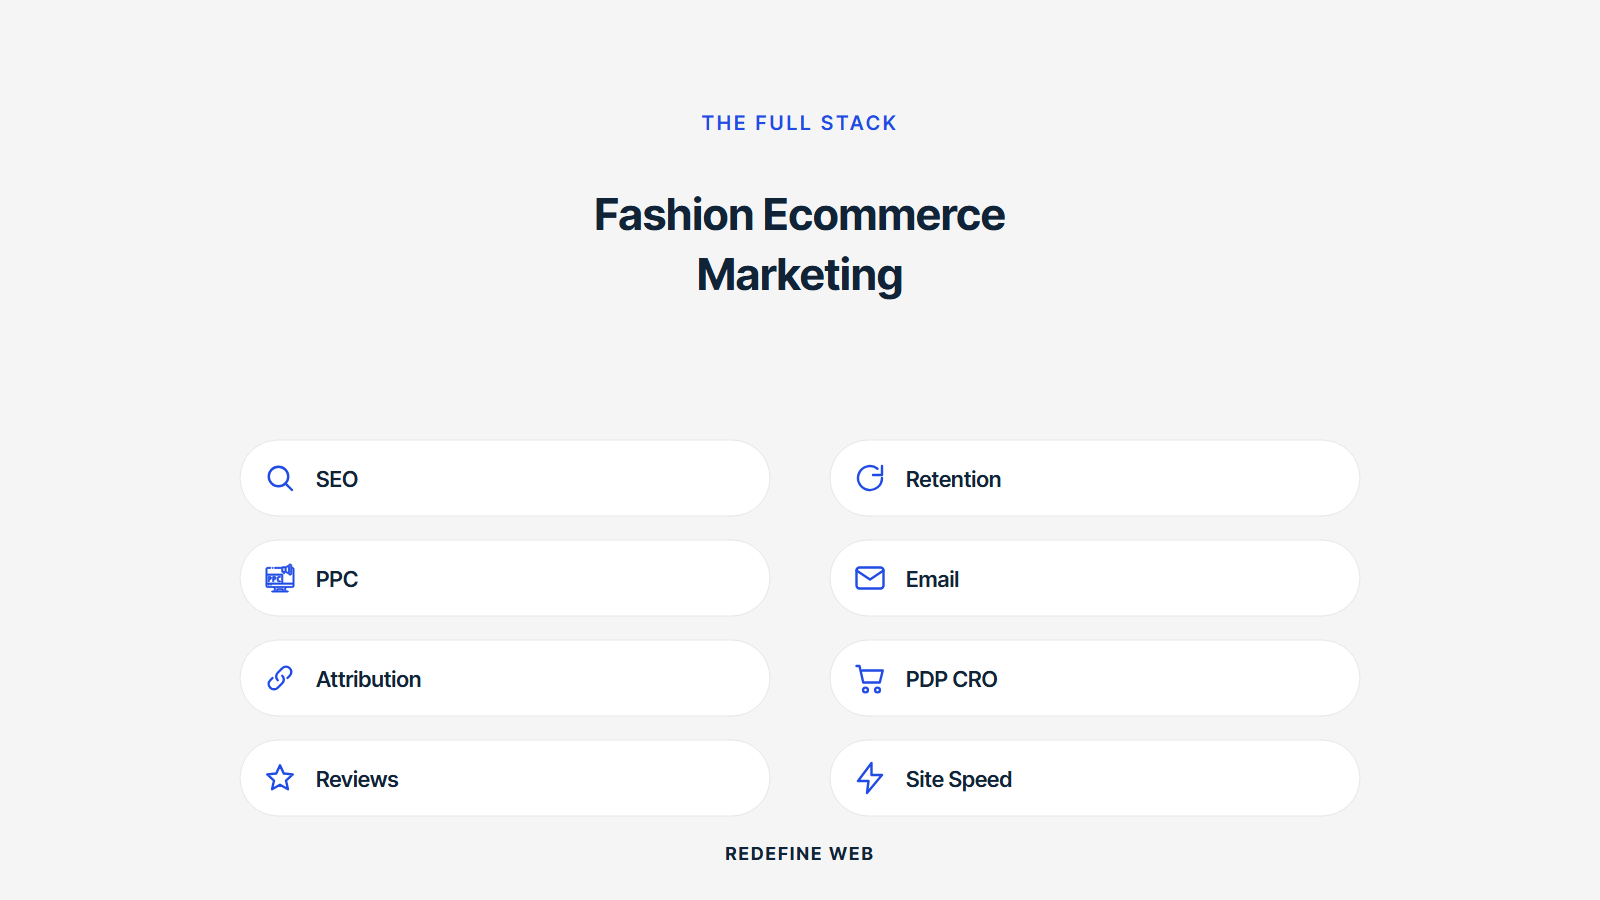
Benchmarks make the plan honest. A DTC apparel brand reads its own numbers against the industry median every quarter and acts on the gaps that show up. Conversion rate. Blended cost per order. Return rate. Repeat purchase rate. Email revenue share. Each has an honest median for the revenue band, and the numbers change slowly year over year.
| Revenue band | Conversion rate | Blended CPO | Return rate (womenswear) | Day 90 repeat rate | Email revenue share |
|---|---|---|---|---|---|
| Under $80K monthly | 1.2% to 1.8% | $38 to $54 | 26% to 34% | 10% to 18% | 18% to 26% |
| $80K to $250K monthly | 1.6% to 2.4% | $28 to $46 | 24% to 32% | 16% to 24% | 22% to 30% |
| $250K to $600K monthly | 2.0% to 2.8% | $22 to $38 | 22% to 30% | 22% to 32% | 26% to 34% |
| $600K to $1.5M monthly | 2.4% to 3.4% | $18 to $32 | 20% to 28% | 28% to 38% | 28% to 36% |
| Above $1.5M monthly | 2.8% to 4.0% | $16 to $28 | 18% to 26% | 32% to 45% | 30% to 38% |
A founder who reads a monthly dashboard against these benchmarks catches the drift inside 30 days and adjusts the plan before the quarter closes. A founder who reads only the paid social dashboard catches the drift 90 days late, which usually means the correction shows up in the next quarter revenue instead of the current one. That single reporting habit is the difference between an apparel plan that grows and an apparel plan that runs in place while the founder wonders what actually changed under the surface. Founders scoping the wider paid team should read our fashion marketing agency guide for the retainer scope that sits above these benchmark reads.
How do you measure fashion ecommerce marketing honestly
Honest measurement of fashion ecommerce marketing runs on four data streams reconciled inside one weekly dashboard. Shopify revenue by UTM and discount code. Google Analytics 4 sessions and assisted conversion. Meta and TikTok ads platform attribution. A post purchase survey on every order that asks where the buyer first saw the brand. Each stream lies on its own.
The single biggest reporting mistake is trusting Meta own return on ad spend number as the campaign result. Meta over reports by 30 to 90 percent on apparel accounts because the pixel double counts view through and click through revenue that would have converted anyway. Google Analytics 4 under reports because the model discounts paid social influence on longer consideration windows. Shopify tells the truth on first order revenue but nothing on assisted revenue. Post purchase surveys catch the audience that saw the campaign on TikTok, searched a week later, and bought through direct traffic. The four streams together reconcile inside a 5 to 8 percent margin on a well tagged apparel account. Google’s attribution model documentation is the source every founder should read before arguing about which number is correct.
Every plan reports campaign level revenue against the campaign level budget with a 7 day and 30 day view. Anything shorter than 7 days is noise on an apparel buying cycle. Anything longer than 30 days is too late to change the current campaign trajectory. The founder reads the dashboard once a week on Monday morning before the review meeting, not once at the end of the quarter when the numbers are already locked into a bad direction.
Fashion ecommerce marketing in production
Boogie Board came to our team with a DTC ecommerce program running the same problem most apparel brands run at $340,000 monthly. Product pages with four images per SKU, no fit content on the size selector, a checkout that pushed size to step two on mobile, cost per acquisition at $150.92 and climbing, and a founder who read the paid social dashboard at face value every Monday. The plan looked busy on paper. The margin math looked thin on the P and L.
Our team rebuilt the ecommerce path around the five node stack. Rewrote the product page template with 8 to 12 images per SKU, garment measurements at the SKU level, and fit review pull quotes below the size selector. Moved size selection to first field at the top of the mobile checkout. Rebuilt the top 40 SKU catalog feed with lifestyle imagery and hand written titles. Turned on the seven core Klaviyo flows and a Attentive SMS list at week three. Server side tracking went in through Elevar in week two. Weekly Monday review meetings replaced the end of month post mortem, with the founder in the room and empowered to kill a campaign at week two.
Twelve months in, blended cost per acquisition dropped to $31. Conversion rate on the paid landing pages climbed 11 percent. Return rate on womenswear dropped from 38 percent to 26 percent. Day 90 repeat purchase rate grew from 22 percent to 41 percent. Managed ad budget grew to $650,000 monthly on the same margin profile. The result did not come from a magic new channel. It came from applying the five node stack, the checkout discipline, and the review cadence the plan required from day one.
41 percent returns means your PDP has one hero photo and no fit content. Add on-model sizing and a 3-way body shot before you touch shipping labels.
The weekly review that keeps the plan honest
The Monday review meeting is where an apparel plan earns the right to keep spending. Forty five minutes, three agenda items, one decision. Read the reconciled dashboard. Review the top and bottom three ad creatives by cost per order. Decide whether the current campaign continues into next week, gets a creative pivot, or gets killed. The founder is invited and expected to make the kill decision when the numbers warrant it.
Every Monday review meeting eventually reaches the moment where somebody points at the flat performing creative and asks if the founder wants to give it one more week. The founder always says yes. The creative always underperforms for a second week. Nobody remembers who first suggested the extra week. Somewhere in the archive of every apparel brand shared drive, a flat creative is quietly generating more Monday meetings about itself than actual orders about anything on the site.
The kill rule is simple and it holds across every campaign archetype. Day 3 return on ad spend below 40 percent of target and day 7 return below 60 percent of target triggers a 24 hour creative pivot or a full kill. Programs that hold underperforming campaigns for the full run out of hope produce the flat quarters founders learn to fear. Programs that kill fast and reallocate to the winners produce the compounding quarters that make the retainer worth its rate. Founders new to structured plans assume the kill decision hurts the numbers. In practice, killing a flat creative at week two frees the budget to double down on the winner and grows the campaign result 20 to 45 percent inside the next 21 days on an apparel account.
Where fashion ecommerce marketing fits the wider stack
Fashion ecommerce marketing sits above the tactical channel work and below the annual brand strategy inside the growth stack. Every retainer allocation, every creative brief, and every founder decision on inventory rolls up to the five node plan the pod is running against. Programs that budget for tactics without the plan produce busy months with soft revenue. Programs that build the plan first produce quarters where every product page, every ad, and every email adds up to a single growth arc the founder can defend at a board meeting.
The retainer that runs the plan starts at $599 monthly on a 6 month contract and scales with revenue. The retainer covers merchandising audits, fit content templates, product page image direction, checkout audits, retention flow builds, weekly review meetings, and quarterly server side tracking audits. Founders scoping the wider agency side should also read our apparel fashion marketing hub for the broader deliverable list and pricing tiers by revenue band.
The retainer scales with revenue band, deliverable scope, and the number of active campaigns per quarter. A brand at $80,000 monthly runs a lean retainer with the founder in the review meeting. A brand at $600,000 monthly runs a fuller retainer with a dedicated pod and monthly media mix modeling reads. Every retainer tier ties back to the five node stack the plan requires, and every quarterly review closes the loop between the tactical channel work and the strategic growth arc the founder is defending on the P and L. Two outside reads worth an hour before the first plan cycle kicks off. Meta catalog quality reference above for feed hygiene. The Business of Fashion opinions section for the macro context that shapes which trends deserve budget in a given quarter on the merchandising side.
Paid social carries 45 to 60 percent of first order revenue on DTC apparel between $80,000 and $600,000 monthly. Meta and TikTok are the two platforms that fund. Every other platform enters through a 90 day pilot with a hard kill date, not a slow bleed into the always on budget.
Creative velocity as the real budget
Paid social on apparel wins on creative velocity, not media budget. A brand shipping 6 to 12 fresh creative variants weekly across static, Reel, and TikTok formats produces 30 to 60 percent lower cost per order than the same brand shipping 2 to 3 variants weekly on the same media budget. Fashion audiences fatigue creative inside 5 to 9 days on the same face and product angle. The retainer needs to feed that fatigue rate, not fight it, and the creative production line has to run on a weekly cadence with a named producer.
The catalog feed that carries Shopping
Meta Advantage Plus Shopping and TikTok Shop pull directly from the Shopify product feed. Programs that let the feed run on default titles and default images produce 40 to 70 percent higher cost per order than programs that rewrite the top 40 SKU feed titles and swap the primary feed image to the highest performing lifestyle shot. Feed hygiene is the cheapest paid social gain available on an apparel account and the one most founders never open. Meta’s catalog quality reference covers the field level rules that shape delivery.
Retention inside fashion ecommerce marketing
Retention is the layer that decides whether the P and L runs on margin or grinds through paid acquisition to break even. A DTC apparel brand with a 30 percent day 90 repeat rate runs 20 to 35 percent more contribution margin per blended dollar of spend than the same brand at 15 percent. Retention is not one channel. It is a stack of email, SMS, loyalty, and post purchase content on a monthly calendar.
Email and SMS as the core
Email drives 25 to 35 percent of DTC apparel revenue when the flow set is complete. Welcome, browse abandonment, cart abandonment, post purchase, replenishment, VIP, and win back are the seven flows every brand needs live inside the first 90 days. SMS adds another 8 to 15 percent of revenue at a 5 to 12 percent list opt in rate. Klaviyo and Attentive dominate the DTC apparel tool stack because the two platforms handle 90 percent of the flow logic without custom development. Our what is fashion marketing primer covers how the retention layer plugs into the wider channel mix.
Post purchase content that grows LTV
Post purchase content covers the four weeks after delivery on a first order. Styling emails that pair the purchased SKU with three complementary pieces. A fit review request at day seven when the buyer has worn the garment twice. A community moment at day fourteen with user photos of the same SKU. A second order incentive at day 28 with a category adjacent recommendation. Programs that publish the full post purchase sequence grow lifetime value 22 to 45 percent by month twelve on the same first order cohort, and the retention layer starts to carry the revenue growth the paid team used to carry alone.
Benchmarks inside fashion ecommerce marketing
Benchmarks make the plan honest. A DTC apparel brand reads its own numbers against the industry median every quarter and acts on the gaps that show up. Conversion rate. Blended cost per order. Return rate. Repeat purchase rate. Email revenue share. Each has an honest median for the revenue band, and the numbers change slowly year over year.
| Revenue band | Conversion rate | Blended CPO | Return rate (womenswear) | Day 90 repeat rate | Email revenue share |
|---|---|---|---|---|---|
| Under $80K monthly | 1.2% to 1.8% | $38 to $54 | 26% to 34% | 10% to 18% | 18% to 26% |
| $80K to $250K monthly | 1.6% to 2.4% | $28 to $46 | 24% to 32% | 16% to 24% | 22% to 30% |
| $250K to $600K monthly | 2.0% to 2.8% | $22 to $38 | 22% to 30% | 22% to 32% | 26% to 34% |
| $600K to $1.5M monthly | 2.4% to 3.4% | $18 to $32 | 20% to 28% | 28% to 38% | 28% to 36% |
| Above $1.5M monthly | 2.8% to 4.0% | $16 to $28 | 18% to 26% | 32% to 45% | 30% to 38% |
A founder who reads a monthly dashboard against these benchmarks catches the drift inside 30 days and adjusts the plan before the quarter closes. A founder who reads only the paid social dashboard catches the drift 90 days late, which usually means the correction shows up in the next quarter revenue instead of the current one. That single reporting habit is the difference between an apparel plan that grows and an apparel plan that runs in place while the founder wonders what actually changed under the surface. Founders scoping the wider paid team should read our fashion marketing agency guide for the retainer scope that sits above these benchmark reads.
How do you measure fashion ecommerce marketing honestly
Honest measurement of fashion ecommerce marketing runs on four data streams reconciled inside one weekly dashboard. Shopify revenue by UTM and discount code. Google Analytics 4 sessions and assisted conversion. Meta and TikTok ads platform attribution. A post purchase survey on every order that asks where the buyer first saw the brand. Each stream lies on its own.
The single biggest reporting mistake is trusting Meta own return on ad spend number as the campaign result. Meta over reports by 30 to 90 percent on apparel accounts because the pixel double counts view through and click through revenue that would have converted anyway. Google Analytics 4 under reports because the model discounts paid social influence on longer consideration windows. Shopify tells the truth on first order revenue but nothing on assisted revenue. Post purchase surveys catch the audience that saw the campaign on TikTok, searched a week later, and bought through direct traffic. The four streams together reconcile inside a 5 to 8 percent margin on a well tagged apparel account. Google’s attribution model documentation is the source every founder should read before arguing about which number is correct.
Every plan reports campaign level revenue against the campaign level budget with a 7 day and 30 day view. Anything shorter than 7 days is noise on an apparel buying cycle. Anything longer than 30 days is too late to change the current campaign trajectory. The founder reads the dashboard once a week on Monday morning before the review meeting, not once at the end of the quarter when the numbers are already locked into a bad direction.
Fashion ecommerce marketing in production
Boogie Board came to our team with a DTC ecommerce program running the same problem most apparel brands run at $340,000 monthly. Product pages with four images per SKU, no fit content on the size selector, a checkout that pushed size to step two on mobile, cost per acquisition at $150.92 and climbing, and a founder who read the paid social dashboard at face value every Monday. The plan looked busy on paper. The margin math looked thin on the P and L.
Our team rebuilt the ecommerce path around the five node stack. Rewrote the product page template with 8 to 12 images per SKU, garment measurements at the SKU level, and fit review pull quotes below the size selector. Moved size selection to first field at the top of the mobile checkout. Rebuilt the top 40 SKU catalog feed with lifestyle imagery and hand written titles. Turned on the seven core Klaviyo flows and a Attentive SMS list at week three. Server side tracking went in through Elevar in week two. Weekly Monday review meetings replaced the end of month post mortem, with the founder in the room and empowered to kill a campaign at week two.
Twelve months in, blended cost per acquisition dropped to $31. Conversion rate on the paid landing pages climbed 11 percent. Return rate on womenswear dropped from 38 percent to 26 percent. Day 90 repeat purchase rate grew from 22 percent to 41 percent. Managed ad budget grew to $650,000 monthly on the same margin profile. The result did not come from a magic new channel. It came from applying the five node stack, the checkout discipline, and the review cadence the plan required from day one.
The weekly review that keeps the plan honest
The Monday review meeting is where an apparel plan earns the right to keep spending. Forty five minutes, three agenda items, one decision. Read the reconciled dashboard. Review the top and bottom three ad creatives by cost per order. Decide whether the current campaign continues into next week, gets a creative pivot, or gets killed. The founder is invited and expected to make the kill decision when the numbers warrant it.
Every Monday review meeting eventually reaches the moment where somebody points at the flat performing creative and asks if the founder wants to give it one more week. The founder always says yes. The creative always underperforms for a second week. Nobody remembers who first suggested the extra week. Somewhere in the archive of every apparel brand shared drive, a flat creative is quietly generating more Monday meetings about itself than actual orders about anything on the site.
The kill rule is simple and it holds across every campaign archetype. Day 3 return on ad spend below 40 percent of target and day 7 return below 60 percent of target triggers a 24 hour creative pivot or a full kill. Programs that hold underperforming campaigns for the full run out of hope produce the flat quarters founders learn to fear. Programs that kill fast and reallocate to the winners produce the compounding quarters that make the retainer worth its rate. Founders new to structured plans assume the kill decision hurts the numbers. In practice, killing a flat creative at week two frees the budget to double down on the winner and grows the campaign result 20 to 45 percent inside the next 21 days on an apparel account.
Where fashion ecommerce marketing fits the wider stack
Fashion ecommerce marketing sits above the tactical channel work and below the annual brand strategy inside the growth stack. Every retainer allocation, every creative brief, and every founder decision on inventory rolls up to the five node plan the pod is running against. Programs that budget for tactics without the plan produce busy months with soft revenue. Programs that build the plan first produce quarters where every product page, every ad, and every email adds up to a single growth arc the founder can defend at a board meeting.
The retainer that runs the plan starts at $599 monthly on a 6 month contract and scales with revenue. The retainer covers merchandising audits, fit content templates, product page image direction, checkout audits, retention flow builds, weekly review meetings, and quarterly server side tracking audits. Founders scoping the wider agency side should also read our apparel fashion marketing hub for the broader deliverable list and pricing tiers by revenue band.
The retainer scales with revenue band, deliverable scope, and the number of active campaigns per quarter. A brand at $80,000 monthly runs a lean retainer with the founder in the review meeting. A brand at $600,000 monthly runs a fuller retainer with a dedicated pod and monthly media mix modeling reads. Every retainer tier ties back to the five node stack the plan requires, and every quarterly review closes the loop between the tactical channel work and the strategic growth arc the founder is defending on the P and L. Two outside reads worth an hour before the first plan cycle kicks off. Meta catalog quality reference above for feed hygiene. The Business of Fashion opinions section for the macro context that shapes which trends deserve budget in a given quarter on the merchandising side.
Checkout on apparel carries a size selector as the first field, not the last. Programs that push size selection to a second step lose 4 to 9 percent conversion rate on the same traffic because the mobile buyer scrolls twice for a decision the desktop pattern buries. The mobile buyer decides in under six seconds whether the flow feels safe. Every friction point in that window costs margin.
The checkout structure that respects sizing
The size selector sits directly under the price, above the add to cart button. Sold out sizes stay visible with a strikethrough, not hidden, so the buyer reads the size chart against the availability without a filter reset. A restock notification input replaces the add to cart button on the sold out size. On mobile, the size selector expands into a tap sheet that shows the size chart and fit review pull quotes on the same swipe. That single pattern grows completed checkout rate 6 to 12 percent on apparel accounts we have measured inside 21 days of the deploy.
Shipping and returns copy at the payment step
Shipping thresholds, return windows, and exchange policy live inline at the payment step, not on a footer page. Apparel buyers who read the return policy at cart complete checkout 18 to 30 percent more often than buyers who never see it, and the return rate on those orders drops 2 to 5 percentage points because the buyer bought with the exchange window in mind. Founders who bury return policy on a footer link are trading the transparency dividend for a false conversion gain that costs margin on the back end.
Paid social inside fashion ecommerce marketing
Paid social carries 45 to 60 percent of first order revenue on DTC apparel between $80,000 and $600,000 monthly. Meta and TikTok are the two platforms that fund. Every other platform enters through a 90 day pilot with a hard kill date, not a slow bleed into the always on budget.
Creative velocity as the real budget
Paid social on apparel wins on creative velocity, not media budget. A brand shipping 6 to 12 fresh creative variants weekly across static, Reel, and TikTok formats produces 30 to 60 percent lower cost per order than the same brand shipping 2 to 3 variants weekly on the same media budget. Fashion audiences fatigue creative inside 5 to 9 days on the same face and product angle. The retainer needs to feed that fatigue rate, not fight it, and the creative production line has to run on a weekly cadence with a named producer.
The catalog feed that carries Shopping
Meta Advantage Plus Shopping and TikTok Shop pull directly from the Shopify product feed. Programs that let the feed run on default titles and default images produce 40 to 70 percent higher cost per order than programs that rewrite the top 40 SKU feed titles and swap the primary feed image to the highest performing lifestyle shot. Feed hygiene is the cheapest paid social gain available on an apparel account and the one most founders never open. Meta’s catalog quality reference covers the field level rules that shape delivery.
Retention inside fashion ecommerce marketing
Retention is the layer that decides whether the P and L runs on margin or grinds through paid acquisition to break even. A DTC apparel brand with a 30 percent day 90 repeat rate runs 20 to 35 percent more contribution margin per blended dollar of spend than the same brand at 15 percent. Retention is not one channel. It is a stack of email, SMS, loyalty, and post purchase content on a monthly calendar.
Email and SMS as the core
Email drives 25 to 35 percent of DTC apparel revenue when the flow set is complete. Welcome, browse abandonment, cart abandonment, post purchase, replenishment, VIP, and win back are the seven flows every brand needs live inside the first 90 days. SMS adds another 8 to 15 percent of revenue at a 5 to 12 percent list opt in rate. Klaviyo and Attentive dominate the DTC apparel tool stack because the two platforms handle 90 percent of the flow logic without custom development. Our what is fashion marketing primer covers how the retention layer plugs into the wider channel mix.
Post purchase content that grows LTV
Post purchase content covers the four weeks after delivery on a first order. Styling emails that pair the purchased SKU with three complementary pieces. A fit review request at day seven when the buyer has worn the garment twice. A community moment at day fourteen with user photos of the same SKU. A second order incentive at day 28 with a category adjacent recommendation. Programs that publish the full post purchase sequence grow lifetime value 22 to 45 percent by month twelve on the same first order cohort, and the retention layer starts to carry the revenue growth the paid team used to carry alone.
Benchmarks inside fashion ecommerce marketing
Benchmarks make the plan honest. A DTC apparel brand reads its own numbers against the industry median every quarter and acts on the gaps that show up. Conversion rate. Blended cost per order. Return rate. Repeat purchase rate. Email revenue share. Each has an honest median for the revenue band, and the numbers change slowly year over year.
| Revenue band | Conversion rate | Blended CPO | Return rate (womenswear) | Day 90 repeat rate | Email revenue share |
|---|---|---|---|---|---|
| Under $80K monthly | 1.2% to 1.8% | $38 to $54 | 26% to 34% | 10% to 18% | 18% to 26% |
| $80K to $250K monthly | 1.6% to 2.4% | $28 to $46 | 24% to 32% | 16% to 24% | 22% to 30% |
| $250K to $600K monthly | 2.0% to 2.8% | $22 to $38 | 22% to 30% | 22% to 32% | 26% to 34% |
| $600K to $1.5M monthly | 2.4% to 3.4% | $18 to $32 | 20% to 28% | 28% to 38% | 28% to 36% |
| Above $1.5M monthly | 2.8% to 4.0% | $16 to $28 | 18% to 26% | 32% to 45% | 30% to 38% |
A founder who reads a monthly dashboard against these benchmarks catches the drift inside 30 days and adjusts the plan before the quarter closes. A founder who reads only the paid social dashboard catches the drift 90 days late, which usually means the correction shows up in the next quarter revenue instead of the current one. That single reporting habit is the difference between an apparel plan that grows and an apparel plan that runs in place while the founder wonders what actually changed under the surface. Founders scoping the wider paid team should read our fashion marketing agency guide for the retainer scope that sits above these benchmark reads.
How do you measure fashion ecommerce marketing honestly
Honest measurement of fashion ecommerce marketing runs on four data streams reconciled inside one weekly dashboard. Shopify revenue by UTM and discount code. Google Analytics 4 sessions and assisted conversion. Meta and TikTok ads platform attribution. A post purchase survey on every order that asks where the buyer first saw the brand. Each stream lies on its own.
The single biggest reporting mistake is trusting Meta own return on ad spend number as the campaign result. Meta over reports by 30 to 90 percent on apparel accounts because the pixel double counts view through and click through revenue that would have converted anyway. Google Analytics 4 under reports because the model discounts paid social influence on longer consideration windows. Shopify tells the truth on first order revenue but nothing on assisted revenue. Post purchase surveys catch the audience that saw the campaign on TikTok, searched a week later, and bought through direct traffic. The four streams together reconcile inside a 5 to 8 percent margin on a well tagged apparel account. Google’s attribution model documentation is the source every founder should read before arguing about which number is correct.
Every plan reports campaign level revenue against the campaign level budget with a 7 day and 30 day view. Anything shorter than 7 days is noise on an apparel buying cycle. Anything longer than 30 days is too late to change the current campaign trajectory. The founder reads the dashboard once a week on Monday morning before the review meeting, not once at the end of the quarter when the numbers are already locked into a bad direction.
Fashion ecommerce marketing in production
Boogie Board came to our team with a DTC ecommerce program running the same problem most apparel brands run at $340,000 monthly. Product pages with four images per SKU, no fit content on the size selector, a checkout that pushed size to step two on mobile, cost per acquisition at $150.92 and climbing, and a founder who read the paid social dashboard at face value every Monday. The plan looked busy on paper. The margin math looked thin on the P and L.
Our team rebuilt the ecommerce path around the five node stack. Rewrote the product page template with 8 to 12 images per SKU, garment measurements at the SKU level, and fit review pull quotes below the size selector. Moved size selection to first field at the top of the mobile checkout. Rebuilt the top 40 SKU catalog feed with lifestyle imagery and hand written titles. Turned on the seven core Klaviyo flows and a Attentive SMS list at week three. Server side tracking went in through Elevar in week two. Weekly Monday review meetings replaced the end of month post mortem, with the founder in the room and empowered to kill a campaign at week two.
Twelve months in, blended cost per acquisition dropped to $31. Conversion rate on the paid landing pages climbed 11 percent. Return rate on womenswear dropped from 38 percent to 26 percent. Day 90 repeat purchase rate grew from 22 percent to 41 percent. Managed ad budget grew to $650,000 monthly on the same margin profile. The result did not come from a magic new channel. It came from applying the five node stack, the checkout discipline, and the review cadence the plan required from day one.
The weekly review that keeps the plan honest
The Monday review meeting is where an apparel plan earns the right to keep spending. Forty five minutes, three agenda items, one decision. Read the reconciled dashboard. Review the top and bottom three ad creatives by cost per order. Decide whether the current campaign continues into next week, gets a creative pivot, or gets killed. The founder is invited and expected to make the kill decision when the numbers warrant it.
Every Monday review meeting eventually reaches the moment where somebody points at the flat performing creative and asks if the founder wants to give it one more week. The founder always says yes. The creative always underperforms for a second week. Nobody remembers who first suggested the extra week. Somewhere in the archive of every apparel brand shared drive, a flat creative is quietly generating more Monday meetings about itself than actual orders about anything on the site.
The kill rule is simple and it holds across every campaign archetype. Day 3 return on ad spend below 40 percent of target and day 7 return below 60 percent of target triggers a 24 hour creative pivot or a full kill. Programs that hold underperforming campaigns for the full run out of hope produce the flat quarters founders learn to fear. Programs that kill fast and reallocate to the winners produce the compounding quarters that make the retainer worth its rate. Founders new to structured plans assume the kill decision hurts the numbers. In practice, killing a flat creative at week two frees the budget to double down on the winner and grows the campaign result 20 to 45 percent inside the next 21 days on an apparel account.
Where fashion ecommerce marketing fits the wider stack
Fashion ecommerce marketing sits above the tactical channel work and below the annual brand strategy inside the growth stack. Every retainer allocation, every creative brief, and every founder decision on inventory rolls up to the five node plan the pod is running against. Programs that budget for tactics without the plan produce busy months with soft revenue. Programs that build the plan first produce quarters where every product page, every ad, and every email adds up to a single growth arc the founder can defend at a board meeting.
The retainer that runs the plan starts at $599 monthly on a 6 month contract and scales with revenue. The retainer covers merchandising audits, fit content templates, product page image direction, checkout audits, retention flow builds, weekly review meetings, and quarterly server side tracking audits. Founders scoping the wider agency side should also read our apparel fashion marketing hub for the broader deliverable list and pricing tiers by revenue band.
The retainer scales with revenue band, deliverable scope, and the number of active campaigns per quarter. A brand at $80,000 monthly runs a lean retainer with the founder in the review meeting. A brand at $600,000 monthly runs a fuller retainer with a dedicated pod and monthly media mix modeling reads. Every retainer tier ties back to the five node stack the plan requires, and every quarterly review closes the loop between the tactical channel work and the strategic growth arc the founder is defending on the P and L. Two outside reads worth an hour before the first plan cycle kicks off. Meta catalog quality reference above for feed hygiene. The Business of Fashion opinions section for the macro context that shapes which trends deserve budget in a given quarter on the merchandising side.
Product page imagery is where a paid social click either converts or bounces inside eight seconds. The industry median product page ships four images per SKU. The winners ship eight to twelve, and every image answers a specific buyer question the paid ad already primed.
The imagery stack per SKU
A working stack per SKU carries model shot on size medium, model shot on size extra large or size fourteen so the buyer sees the fit at range, flat lay on a neutral ground for the utility view, detail shot on the fabric texture, detail shot on the hardware and stitching, back view on the model, side view on the model, movement clip of 4 to 8 seconds, and a scale shot next to a familiar object for accessories. Programs that publish all twelve image slots grow conversion rate 8 to 22 percent against the four image baseline, and Meta gets richer feed asset variants to test in the ad set.
Video that earns its production cost
Product page video works when it stays under 10 seconds, loops on autoplay, mutes by default, and shows movement the still shot cannot. Longer videos hurt page load and buyer patience without a conversion gain. A DTC apparel brand doing $340,000 monthly should budget $60,000 to $140,000 annually on product page video across the top 40 SKUs by contribution margin. Below that budget, the video shoot day math does not work and the founder ships either thin coverage on all SKUs or full coverage on the wrong ones. Shopify’s product photography guide is a useful outside read for founders scoping a first shoot.
Checkout inside fashion ecommerce marketing
Checkout on apparel carries a size selector as the first field, not the last. Programs that push size selection to a second step lose 4 to 9 percent conversion rate on the same traffic because the mobile buyer scrolls twice for a decision the desktop pattern buries. The mobile buyer decides in under six seconds whether the flow feels safe. Every friction point in that window costs margin.
The checkout structure that respects sizing
The size selector sits directly under the price, above the add to cart button. Sold out sizes stay visible with a strikethrough, not hidden, so the buyer reads the size chart against the availability without a filter reset. A restock notification input replaces the add to cart button on the sold out size. On mobile, the size selector expands into a tap sheet that shows the size chart and fit review pull quotes on the same swipe. That single pattern grows completed checkout rate 6 to 12 percent on apparel accounts we have measured inside 21 days of the deploy.
Shipping and returns copy at the payment step
Shipping thresholds, return windows, and exchange policy live inline at the payment step, not on a footer page. Apparel buyers who read the return policy at cart complete checkout 18 to 30 percent more often than buyers who never see it, and the return rate on those orders drops 2 to 5 percentage points because the buyer bought with the exchange window in mind. Founders who bury return policy on a footer link are trading the transparency dividend for a false conversion gain that costs margin on the back end.
Paid social inside fashion ecommerce marketing
Paid social carries 45 to 60 percent of first order revenue on DTC apparel between $80,000 and $600,000 monthly. Meta and TikTok are the two platforms that fund. Every other platform enters through a 90 day pilot with a hard kill date, not a slow bleed into the always on budget.
Creative velocity as the real budget
Paid social on apparel wins on creative velocity, not media budget. A brand shipping 6 to 12 fresh creative variants weekly across static, Reel, and TikTok formats produces 30 to 60 percent lower cost per order than the same brand shipping 2 to 3 variants weekly on the same media budget. Fashion audiences fatigue creative inside 5 to 9 days on the same face and product angle. The retainer needs to feed that fatigue rate, not fight it, and the creative production line has to run on a weekly cadence with a named producer.
The catalog feed that carries Shopping
Meta Advantage Plus Shopping and TikTok Shop pull directly from the Shopify product feed. Programs that let the feed run on default titles and default images produce 40 to 70 percent higher cost per order than programs that rewrite the top 40 SKU feed titles and swap the primary feed image to the highest performing lifestyle shot. Feed hygiene is the cheapest paid social gain available on an apparel account and the one most founders never open. Meta’s catalog quality reference covers the field level rules that shape delivery.
Retention inside fashion ecommerce marketing
Retention is the layer that decides whether the P and L runs on margin or grinds through paid acquisition to break even. A DTC apparel brand with a 30 percent day 90 repeat rate runs 20 to 35 percent more contribution margin per blended dollar of spend than the same brand at 15 percent. Retention is not one channel. It is a stack of email, SMS, loyalty, and post purchase content on a monthly calendar.
Email and SMS as the core
Email drives 25 to 35 percent of DTC apparel revenue when the flow set is complete. Welcome, browse abandonment, cart abandonment, post purchase, replenishment, VIP, and win back are the seven flows every brand needs live inside the first 90 days. SMS adds another 8 to 15 percent of revenue at a 5 to 12 percent list opt in rate. Klaviyo and Attentive dominate the DTC apparel tool stack because the two platforms handle 90 percent of the flow logic without custom development. Our what is fashion marketing primer covers how the retention layer plugs into the wider channel mix.
Post purchase content that grows LTV
Post purchase content covers the four weeks after delivery on a first order. Styling emails that pair the purchased SKU with three complementary pieces. A fit review request at day seven when the buyer has worn the garment twice. A community moment at day fourteen with user photos of the same SKU. A second order incentive at day 28 with a category adjacent recommendation. Programs that publish the full post purchase sequence grow lifetime value 22 to 45 percent by month twelve on the same first order cohort, and the retention layer starts to carry the revenue growth the paid team used to carry alone.
Benchmarks inside fashion ecommerce marketing
Benchmarks make the plan honest. A DTC apparel brand reads its own numbers against the industry median every quarter and acts on the gaps that show up. Conversion rate. Blended cost per order. Return rate. Repeat purchase rate. Email revenue share. Each has an honest median for the revenue band, and the numbers change slowly year over year.
| Revenue band | Conversion rate | Blended CPO | Return rate (womenswear) | Day 90 repeat rate | Email revenue share |
|---|---|---|---|---|---|
| Under $80K monthly | 1.2% to 1.8% | $38 to $54 | 26% to 34% | 10% to 18% | 18% to 26% |
| $80K to $250K monthly | 1.6% to 2.4% | $28 to $46 | 24% to 32% | 16% to 24% | 22% to 30% |
| $250K to $600K monthly | 2.0% to 2.8% | $22 to $38 | 22% to 30% | 22% to 32% | 26% to 34% |
| $600K to $1.5M monthly | 2.4% to 3.4% | $18 to $32 | 20% to 28% | 28% to 38% | 28% to 36% |
| Above $1.5M monthly | 2.8% to 4.0% | $16 to $28 | 18% to 26% | 32% to 45% | 30% to 38% |
A founder who reads a monthly dashboard against these benchmarks catches the drift inside 30 days and adjusts the plan before the quarter closes. A founder who reads only the paid social dashboard catches the drift 90 days late, which usually means the correction shows up in the next quarter revenue instead of the current one. That single reporting habit is the difference between an apparel plan that grows and an apparel plan that runs in place while the founder wonders what actually changed under the surface. Founders scoping the wider paid team should read our fashion marketing agency guide for the retainer scope that sits above these benchmark reads.
How do you measure fashion ecommerce marketing honestly
Honest measurement of fashion ecommerce marketing runs on four data streams reconciled inside one weekly dashboard. Shopify revenue by UTM and discount code. Google Analytics 4 sessions and assisted conversion. Meta and TikTok ads platform attribution. A post purchase survey on every order that asks where the buyer first saw the brand. Each stream lies on its own.
The single biggest reporting mistake is trusting Meta own return on ad spend number as the campaign result. Meta over reports by 30 to 90 percent on apparel accounts because the pixel double counts view through and click through revenue that would have converted anyway. Google Analytics 4 under reports because the model discounts paid social influence on longer consideration windows. Shopify tells the truth on first order revenue but nothing on assisted revenue. Post purchase surveys catch the audience that saw the campaign on TikTok, searched a week later, and bought through direct traffic. The four streams together reconcile inside a 5 to 8 percent margin on a well tagged apparel account. Google’s attribution model documentation is the source every founder should read before arguing about which number is correct.
Every plan reports campaign level revenue against the campaign level budget with a 7 day and 30 day view. Anything shorter than 7 days is noise on an apparel buying cycle. Anything longer than 30 days is too late to change the current campaign trajectory. The founder reads the dashboard once a week on Monday morning before the review meeting, not once at the end of the quarter when the numbers are already locked into a bad direction.
Fashion ecommerce marketing in production
Boogie Board came to our team with a DTC ecommerce program running the same problem most apparel brands run at $340,000 monthly. Product pages with four images per SKU, no fit content on the size selector, a checkout that pushed size to step two on mobile, cost per acquisition at $150.92 and climbing, and a founder who read the paid social dashboard at face value every Monday. The plan looked busy on paper. The margin math looked thin on the P and L.
Our team rebuilt the ecommerce path around the five node stack. Rewrote the product page template with 8 to 12 images per SKU, garment measurements at the SKU level, and fit review pull quotes below the size selector. Moved size selection to first field at the top of the mobile checkout. Rebuilt the top 40 SKU catalog feed with lifestyle imagery and hand written titles. Turned on the seven core Klaviyo flows and a Attentive SMS list at week three. Server side tracking went in through Elevar in week two. Weekly Monday review meetings replaced the end of month post mortem, with the founder in the room and empowered to kill a campaign at week two.
Twelve months in, blended cost per acquisition dropped to $31. Conversion rate on the paid landing pages climbed 11 percent. Return rate on womenswear dropped from 38 percent to 26 percent. Day 90 repeat purchase rate grew from 22 percent to 41 percent. Managed ad budget grew to $650,000 monthly on the same margin profile. The result did not come from a magic new channel. It came from applying the five node stack, the checkout discipline, and the review cadence the plan required from day one.
The weekly review that keeps the plan honest
The Monday review meeting is where an apparel plan earns the right to keep spending. Forty five minutes, three agenda items, one decision. Read the reconciled dashboard. Review the top and bottom three ad creatives by cost per order. Decide whether the current campaign continues into next week, gets a creative pivot, or gets killed. The founder is invited and expected to make the kill decision when the numbers warrant it.
Every Monday review meeting eventually reaches the moment where somebody points at the flat performing creative and asks if the founder wants to give it one more week. The founder always says yes. The creative always underperforms for a second week. Nobody remembers who first suggested the extra week. Somewhere in the archive of every apparel brand shared drive, a flat creative is quietly generating more Monday meetings about itself than actual orders about anything on the site.
The kill rule is simple and it holds across every campaign archetype. Day 3 return on ad spend below 40 percent of target and day 7 return below 60 percent of target triggers a 24 hour creative pivot or a full kill. Programs that hold underperforming campaigns for the full run out of hope produce the flat quarters founders learn to fear. Programs that kill fast and reallocate to the winners produce the compounding quarters that make the retainer worth its rate. Founders new to structured plans assume the kill decision hurts the numbers. In practice, killing a flat creative at week two frees the budget to double down on the winner and grows the campaign result 20 to 45 percent inside the next 21 days on an apparel account.
Where fashion ecommerce marketing fits the wider stack
Fashion ecommerce marketing sits above the tactical channel work and below the annual brand strategy inside the growth stack. Every retainer allocation, every creative brief, and every founder decision on inventory rolls up to the five node plan the pod is running against. Programs that budget for tactics without the plan produce busy months with soft revenue. Programs that build the plan first produce quarters where every product page, every ad, and every email adds up to a single growth arc the founder can defend at a board meeting.
The retainer that runs the plan starts at $599 monthly on a 6 month contract and scales with revenue. The retainer covers merchandising audits, fit content templates, product page image direction, checkout audits, retention flow builds, weekly review meetings, and quarterly server side tracking audits. Founders scoping the wider agency side should also read our apparel fashion marketing hub for the broader deliverable list and pricing tiers by revenue band.
The retainer scales with revenue band, deliverable scope, and the number of active campaigns per quarter. A brand at $80,000 monthly runs a lean retainer with the founder in the review meeting. A brand at $600,000 monthly runs a fuller retainer with a dedicated pod and monthly media mix modeling reads. Every retainer tier ties back to the five node stack the plan requires, and every quarterly review closes the loop between the tactical channel work and the strategic growth arc the founder is defending on the P and L. Two outside reads worth an hour before the first plan cycle kicks off. Meta catalog quality reference above for feed hygiene. The Business of Fashion opinions section for the macro context that shapes which trends deserve budget in a given quarter on the merchandising side.
Return rate is the single margin killer on DTC apparel. Womenswear runs 22 to 30 percent, menswear 12 to 18 percent, accessories 6 to 10 percent. Two thirds of apparel returns cite fit or size as the reason. Fashion ecommerce marketing that ignores fit content spends the paid social budget twice on every return that goes back into inventory.
The plan builds a fit content stack on every SKU. Model height and size worn in the product description. Garment measurements at the SKU level, not the style level. Fit review notes pulled from customer reviews on a dedicated Fit tab. Size guides at the collection level with the actual measurement method photographed. Programs that publish the full fit stack on every SKU cut return rate 4 to 9 percentage points inside two quarters, which is the biggest margin move available in apparel without a supply chain change.
Where the fit content lives on the page
Fit content lives above the fold on desktop and inside the third scroll on mobile. The size chart lives one tap deep from the size selector, not three clicks deep behind a footer link. Fit review pull quotes live directly below the size selector so the buyer reads what the size chart says and what other buyers actually experienced in the same tap. That single change grows conversion rate 6 to 14 percent on apparel accounts we have tested inside 30 days, and it costs nothing in creative production because the copy already exists in the review corpus.
Fit tech worth funding
True Fit, Fit Analytics, and Bold Metrics carry the automated fit recommendation layer on scaled apparel programs. Each pulls buyer inputs (height, weight, common size in another brand) and recommends a size at add to cart. Return rate drops 3 to 7 percentage points on the SKUs where the tool is live and the buyer engages with the input flow. Below $250,000 monthly, the tool license outruns the return savings. Above $600,000 monthly, the math flips and the tool pays for itself inside a quarter.
Product page imagery inside fashion ecommerce marketing
Product page imagery is where a paid social click either converts or bounces inside eight seconds. The industry median product page ships four images per SKU. The winners ship eight to twelve, and every image answers a specific buyer question the paid ad already primed.
The imagery stack per SKU
A working stack per SKU carries model shot on size medium, model shot on size extra large or size fourteen so the buyer sees the fit at range, flat lay on a neutral ground for the utility view, detail shot on the fabric texture, detail shot on the hardware and stitching, back view on the model, side view on the model, movement clip of 4 to 8 seconds, and a scale shot next to a familiar object for accessories. Programs that publish all twelve image slots grow conversion rate 8 to 22 percent against the four image baseline, and Meta gets richer feed asset variants to test in the ad set.
Video that earns its production cost
Product page video works when it stays under 10 seconds, loops on autoplay, mutes by default, and shows movement the still shot cannot. Longer videos hurt page load and buyer patience without a conversion gain. A DTC apparel brand doing $340,000 monthly should budget $60,000 to $140,000 annually on product page video across the top 40 SKUs by contribution margin. Below that budget, the video shoot day math does not work and the founder ships either thin coverage on all SKUs or full coverage on the wrong ones. Shopify’s product photography guide is a useful outside read for founders scoping a first shoot.
Checkout inside fashion ecommerce marketing
Checkout on apparel carries a size selector as the first field, not the last. Programs that push size selection to a second step lose 4 to 9 percent conversion rate on the same traffic because the mobile buyer scrolls twice for a decision the desktop pattern buries. The mobile buyer decides in under six seconds whether the flow feels safe. Every friction point in that window costs margin.
The checkout structure that respects sizing
The size selector sits directly under the price, above the add to cart button. Sold out sizes stay visible with a strikethrough, not hidden, so the buyer reads the size chart against the availability without a filter reset. A restock notification input replaces the add to cart button on the sold out size. On mobile, the size selector expands into a tap sheet that shows the size chart and fit review pull quotes on the same swipe. That single pattern grows completed checkout rate 6 to 12 percent on apparel accounts we have measured inside 21 days of the deploy.
Shipping and returns copy at the payment step
Shipping thresholds, return windows, and exchange policy live inline at the payment step, not on a footer page. Apparel buyers who read the return policy at cart complete checkout 18 to 30 percent more often than buyers who never see it, and the return rate on those orders drops 2 to 5 percentage points because the buyer bought with the exchange window in mind. Founders who bury return policy on a footer link are trading the transparency dividend for a false conversion gain that costs margin on the back end.
Paid social inside fashion ecommerce marketing
Paid social carries 45 to 60 percent of first order revenue on DTC apparel between $80,000 and $600,000 monthly. Meta and TikTok are the two platforms that fund. Every other platform enters through a 90 day pilot with a hard kill date, not a slow bleed into the always on budget.
Creative velocity as the real budget
Paid social on apparel wins on creative velocity, not media budget. A brand shipping 6 to 12 fresh creative variants weekly across static, Reel, and TikTok formats produces 30 to 60 percent lower cost per order than the same brand shipping 2 to 3 variants weekly on the same media budget. Fashion audiences fatigue creative inside 5 to 9 days on the same face and product angle. The retainer needs to feed that fatigue rate, not fight it, and the creative production line has to run on a weekly cadence with a named producer.
The catalog feed that carries Shopping
Meta Advantage Plus Shopping and TikTok Shop pull directly from the Shopify product feed. Programs that let the feed run on default titles and default images produce 40 to 70 percent higher cost per order than programs that rewrite the top 40 SKU feed titles and swap the primary feed image to the highest performing lifestyle shot. Feed hygiene is the cheapest paid social gain available on an apparel account and the one most founders never open. Meta’s catalog quality reference covers the field level rules that shape delivery.
Retention inside fashion ecommerce marketing
Retention is the layer that decides whether the P and L runs on margin or grinds through paid acquisition to break even. A DTC apparel brand with a 30 percent day 90 repeat rate runs 20 to 35 percent more contribution margin per blended dollar of spend than the same brand at 15 percent. Retention is not one channel. It is a stack of email, SMS, loyalty, and post purchase content on a monthly calendar.
Email and SMS as the core
Email drives 25 to 35 percent of DTC apparel revenue when the flow set is complete. Welcome, browse abandonment, cart abandonment, post purchase, replenishment, VIP, and win back are the seven flows every brand needs live inside the first 90 days. SMS adds another 8 to 15 percent of revenue at a 5 to 12 percent list opt in rate. Klaviyo and Attentive dominate the DTC apparel tool stack because the two platforms handle 90 percent of the flow logic without custom development. Our what is fashion marketing primer covers how the retention layer plugs into the wider channel mix.
Post purchase content that grows LTV
Post purchase content covers the four weeks after delivery on a first order. Styling emails that pair the purchased SKU with three complementary pieces. A fit review request at day seven when the buyer has worn the garment twice. A community moment at day fourteen with user photos of the same SKU. A second order incentive at day 28 with a category adjacent recommendation. Programs that publish the full post purchase sequence grow lifetime value 22 to 45 percent by month twelve on the same first order cohort, and the retention layer starts to carry the revenue growth the paid team used to carry alone.
Benchmarks inside fashion ecommerce marketing
Benchmarks make the plan honest. A DTC apparel brand reads its own numbers against the industry median every quarter and acts on the gaps that show up. Conversion rate. Blended cost per order. Return rate. Repeat purchase rate. Email revenue share. Each has an honest median for the revenue band, and the numbers change slowly year over year.
| Revenue band | Conversion rate | Blended CPO | Return rate (womenswear) | Day 90 repeat rate | Email revenue share |
|---|---|---|---|---|---|
| Under $80K monthly | 1.2% to 1.8% | $38 to $54 | 26% to 34% | 10% to 18% | 18% to 26% |
| $80K to $250K monthly | 1.6% to 2.4% | $28 to $46 | 24% to 32% | 16% to 24% | 22% to 30% |
| $250K to $600K monthly | 2.0% to 2.8% | $22 to $38 | 22% to 30% | 22% to 32% | 26% to 34% |
| $600K to $1.5M monthly | 2.4% to 3.4% | $18 to $32 | 20% to 28% | 28% to 38% | 28% to 36% |
| Above $1.5M monthly | 2.8% to 4.0% | $16 to $28 | 18% to 26% | 32% to 45% | 30% to 38% |
A founder who reads a monthly dashboard against these benchmarks catches the drift inside 30 days and adjusts the plan before the quarter closes. A founder who reads only the paid social dashboard catches the drift 90 days late, which usually means the correction shows up in the next quarter revenue instead of the current one. That single reporting habit is the difference between an apparel plan that grows and an apparel plan that runs in place while the founder wonders what actually changed under the surface. Founders scoping the wider paid team should read our fashion marketing agency guide for the retainer scope that sits above these benchmark reads.
How do you measure fashion ecommerce marketing honestly
Honest measurement of fashion ecommerce marketing runs on four data streams reconciled inside one weekly dashboard. Shopify revenue by UTM and discount code. Google Analytics 4 sessions and assisted conversion. Meta and TikTok ads platform attribution. A post purchase survey on every order that asks where the buyer first saw the brand. Each stream lies on its own.
The single biggest reporting mistake is trusting Meta own return on ad spend number as the campaign result. Meta over reports by 30 to 90 percent on apparel accounts because the pixel double counts view through and click through revenue that would have converted anyway. Google Analytics 4 under reports because the model discounts paid social influence on longer consideration windows. Shopify tells the truth on first order revenue but nothing on assisted revenue. Post purchase surveys catch the audience that saw the campaign on TikTok, searched a week later, and bought through direct traffic. The four streams together reconcile inside a 5 to 8 percent margin on a well tagged apparel account. Google’s attribution model documentation is the source every founder should read before arguing about which number is correct.
Every plan reports campaign level revenue against the campaign level budget with a 7 day and 30 day view. Anything shorter than 7 days is noise on an apparel buying cycle. Anything longer than 30 days is too late to change the current campaign trajectory. The founder reads the dashboard once a week on Monday morning before the review meeting, not once at the end of the quarter when the numbers are already locked into a bad direction.
Fashion ecommerce marketing in production
Boogie Board came to our team with a DTC ecommerce program running the same problem most apparel brands run at $340,000 monthly. Product pages with four images per SKU, no fit content on the size selector, a checkout that pushed size to step two on mobile, cost per acquisition at $150.92 and climbing, and a founder who read the paid social dashboard at face value every Monday. The plan looked busy on paper. The margin math looked thin on the P and L.
Our team rebuilt the ecommerce path around the five node stack. Rewrote the product page template with 8 to 12 images per SKU, garment measurements at the SKU level, and fit review pull quotes below the size selector. Moved size selection to first field at the top of the mobile checkout. Rebuilt the top 40 SKU catalog feed with lifestyle imagery and hand written titles. Turned on the seven core Klaviyo flows and a Attentive SMS list at week three. Server side tracking went in through Elevar in week two. Weekly Monday review meetings replaced the end of month post mortem, with the founder in the room and empowered to kill a campaign at week two.
Twelve months in, blended cost per acquisition dropped to $31. Conversion rate on the paid landing pages climbed 11 percent. Return rate on womenswear dropped from 38 percent to 26 percent. Day 90 repeat purchase rate grew from 22 percent to 41 percent. Managed ad budget grew to $650,000 monthly on the same margin profile. The result did not come from a magic new channel. It came from applying the five node stack, the checkout discipline, and the review cadence the plan required from day one.
The weekly review that keeps the plan honest
The Monday review meeting is where an apparel plan earns the right to keep spending. Forty five minutes, three agenda items, one decision. Read the reconciled dashboard. Review the top and bottom three ad creatives by cost per order. Decide whether the current campaign continues into next week, gets a creative pivot, or gets killed. The founder is invited and expected to make the kill decision when the numbers warrant it.
Every Monday review meeting eventually reaches the moment where somebody points at the flat performing creative and asks if the founder wants to give it one more week. The founder always says yes. The creative always underperforms for a second week. Nobody remembers who first suggested the extra week. Somewhere in the archive of every apparel brand shared drive, a flat creative is quietly generating more Monday meetings about itself than actual orders about anything on the site.
The kill rule is simple and it holds across every campaign archetype. Day 3 return on ad spend below 40 percent of target and day 7 return below 60 percent of target triggers a 24 hour creative pivot or a full kill. Programs that hold underperforming campaigns for the full run out of hope produce the flat quarters founders learn to fear. Programs that kill fast and reallocate to the winners produce the compounding quarters that make the retainer worth its rate. Founders new to structured plans assume the kill decision hurts the numbers. In practice, killing a flat creative at week two frees the budget to double down on the winner and grows the campaign result 20 to 45 percent inside the next 21 days on an apparel account.
Where fashion ecommerce marketing fits the wider stack
Fashion ecommerce marketing sits above the tactical channel work and below the annual brand strategy inside the growth stack. Every retainer allocation, every creative brief, and every founder decision on inventory rolls up to the five node plan the pod is running against. Programs that budget for tactics without the plan produce busy months with soft revenue. Programs that build the plan first produce quarters where every product page, every ad, and every email adds up to a single growth arc the founder can defend at a board meeting.
The retainer that runs the plan starts at $599 monthly on a 6 month contract and scales with revenue. The retainer covers merchandising audits, fit content templates, product page image direction, checkout audits, retention flow builds, weekly review meetings, and quarterly server side tracking audits. Founders scoping the wider agency side should also read our apparel fashion marketing hub for the broader deliverable list and pricing tiers by revenue band.
The retainer scales with revenue band, deliverable scope, and the number of active campaigns per quarter. A brand at $80,000 monthly runs a lean retainer with the founder in the review meeting. A brand at $600,000 monthly runs a fuller retainer with a dedicated pod and monthly media mix modeling reads. Every retainer tier ties back to the five node stack the plan requires, and every quarterly review closes the loop between the tactical channel work and the strategic growth arc the founder is defending on the P and L. Two outside reads worth an hour before the first plan cycle kicks off. Meta catalog quality reference above for feed hygiene. The Business of Fashion opinions section for the macro context that shapes which trends deserve budget in a given quarter on the merchandising side.
Benchmarks make the plan honest. A DTC apparel brand reads its own numbers against the industry median every quarter and acts on the gaps that show up. Conversion rate. Blended cost per order. Return rate. Repeat purchase rate. Email revenue share. Each has an honest median for the revenue band, and the numbers change slowly year over year.
| Revenue band | Conversion rate | Blended CPO | Return rate (womenswear) | Day 90 repeat rate | Email revenue share |
|---|---|---|---|---|---|
| Under $80K monthly | 1.2% to 1.8% | $38 to $54 | 26% to 34% | 10% to 18% | 18% to 26% |
| $80K to $250K monthly | 1.6% to 2.4% | $28 to $46 | 24% to 32% | 16% to 24% | 22% to 30% |
| $250K to $600K monthly | 2.0% to 2.8% | $22 to $38 | 22% to 30% | 22% to 32% | 26% to 34% |
| $600K to $1.5M monthly | 2.4% to 3.4% | $18 to $32 | 20% to 28% | 28% to 38% | 28% to 36% |
| Above $1.5M monthly | 2.8% to 4.0% | $16 to $28 | 18% to 26% | 32% to 45% | 30% to 38% |
A founder who reads a monthly dashboard against these benchmarks catches the drift inside 30 days and adjusts the plan before the quarter closes. A founder who reads only the paid social dashboard catches the drift 90 days late, which usually means the correction shows up in the next quarter revenue instead of the current one. That single reporting habit is the difference between an apparel plan that grows and an apparel plan that runs in place while the founder wonders what actually changed under the surface. Founders scoping the wider paid team should read our fashion marketing agency guide for the retainer scope that sits above these benchmark reads.
How do you measure fashion ecommerce marketing honestly
Honest measurement of fashion ecommerce marketing runs on four data streams reconciled inside one weekly dashboard. Shopify revenue by UTM and discount code. Google Analytics 4 sessions and assisted conversion. Meta and TikTok ads platform attribution. A post purchase survey on every order that asks where the buyer first saw the brand. Each stream lies on its own.
The single biggest reporting mistake is trusting Meta own return on ad spend number as the campaign result. Meta over reports by 30 to 90 percent on apparel accounts because the pixel double counts view through and click through revenue that would have converted anyway. Google Analytics 4 under reports because the model discounts paid social influence on longer consideration windows. Shopify tells the truth on first order revenue but nothing on assisted revenue. Post purchase surveys catch the audience that saw the campaign on TikTok, searched a week later, and bought through direct traffic. The four streams together reconcile inside a 5 to 8 percent margin on a well tagged apparel account. Google’s attribution model documentation is the source every founder should read before arguing about which number is correct.
Every plan reports campaign level revenue against the campaign level budget with a 7 day and 30 day view. Anything shorter than 7 days is noise on an apparel buying cycle. Anything longer than 30 days is too late to change the current campaign trajectory. The founder reads the dashboard once a week on Monday morning before the review meeting, not once at the end of the quarter when the numbers are already locked into a bad direction.
Fashion ecommerce marketing in production
Boogie Board came to our team with a DTC ecommerce program running the same problem most apparel brands run at $340,000 monthly. Product pages with four images per SKU, no fit content on the size selector, a checkout that pushed size to step two on mobile, cost per acquisition at $150.92 and climbing, and a founder who read the paid social dashboard at face value every Monday. The plan looked busy on paper. The margin math looked thin on the P and L.
Our team rebuilt the ecommerce path around the five node stack. Rewrote the product page template with 8 to 12 images per SKU, garment measurements at the SKU level, and fit review pull quotes below the size selector. Moved size selection to first field at the top of the mobile checkout. Rebuilt the top 40 SKU catalog feed with lifestyle imagery and hand written titles. Turned on the seven core Klaviyo flows and a Attentive SMS list at week three. Server side tracking went in through Elevar in week two. Weekly Monday review meetings replaced the end of month post mortem, with the founder in the room and empowered to kill a campaign at week two.
Twelve months in, blended cost per acquisition dropped to $31. Conversion rate on the paid landing pages climbed 11 percent. Return rate on womenswear dropped from 38 percent to 26 percent. Day 90 repeat purchase rate grew from 22 percent to 41 percent. Managed ad budget grew to $650,000 monthly on the same margin profile. The result did not come from a magic new channel. It came from applying the five node stack, the checkout discipline, and the review cadence the plan required from day one.
The weekly review that keeps the plan honest
The Monday review meeting is where an apparel plan earns the right to keep spending. Forty five minutes, three agenda items, one decision. Read the reconciled dashboard. Review the top and bottom three ad creatives by cost per order. Decide whether the current campaign continues into next week, gets a creative pivot, or gets killed. The founder is invited and expected to make the kill decision when the numbers warrant it.
Every Monday review meeting eventually reaches the moment where somebody points at the flat performing creative and asks if the founder wants to give it one more week. The founder always says yes. The creative always underperforms for a second week. Nobody remembers who first suggested the extra week. Somewhere in the archive of every apparel brand shared drive, a flat creative is quietly generating more Monday meetings about itself than actual orders about anything on the site.
The kill rule is simple and it holds across every campaign archetype. Day 3 return on ad spend below 40 percent of target and day 7 return below 60 percent of target triggers a 24 hour creative pivot or a full kill. Programs that hold underperforming campaigns for the full run out of hope produce the flat quarters founders learn to fear. Programs that kill fast and reallocate to the winners produce the compounding quarters that make the retainer worth its rate. Founders new to structured plans assume the kill decision hurts the numbers. In practice, killing a flat creative at week two frees the budget to double down on the winner and grows the campaign result 20 to 45 percent inside the next 21 days on an apparel account.
Where fashion ecommerce marketing fits the wider stack
Fashion ecommerce marketing sits above the tactical channel work and below the annual brand strategy inside the growth stack. Every retainer allocation, every creative brief, and every founder decision on inventory rolls up to the five node plan the pod is running against. Programs that budget for tactics without the plan produce busy months with soft revenue. Programs that build the plan first produce quarters where every product page, every ad, and every email adds up to a single growth arc the founder can defend at a board meeting.
The retainer that runs the plan starts at $599 monthly on a 6 month contract and scales with revenue. The retainer covers merchandising audits, fit content templates, product page image direction, checkout audits, retention flow builds, weekly review meetings, and quarterly server side tracking audits. Founders scoping the wider agency side should also read our apparel fashion marketing hub for the broader deliverable list and pricing tiers by revenue band.
The retainer scales with revenue band, deliverable scope, and the number of active campaigns per quarter. A brand at $80,000 monthly runs a lean retainer with the founder in the review meeting. A brand at $600,000 monthly runs a fuller retainer with a dedicated pod and monthly media mix modeling reads. Every retainer tier ties back to the five node stack the plan requires, and every quarterly review closes the loop between the tactical channel work and the strategic growth arc the founder is defending on the P and L. Two outside reads worth an hour before the first plan cycle kicks off. Meta catalog quality reference above for feed hygiene. The Business of Fashion opinions section for the macro context that shapes which trends deserve budget in a given quarter on the merchandising side.
Return rate is the single margin killer on DTC apparel. Womenswear runs 22 to 30 percent, menswear 12 to 18 percent, accessories 6 to 10 percent. Two thirds of apparel returns cite fit or size as the reason. Fashion ecommerce marketing that ignores fit content spends the paid social budget twice on every return that goes back into inventory.
The plan builds a fit content stack on every SKU. Model height and size worn in the product description. Garment measurements at the SKU level, not the style level. Fit review notes pulled from customer reviews on a dedicated Fit tab. Size guides at the collection level with the actual measurement method photographed. Programs that publish the full fit stack on every SKU cut return rate 4 to 9 percentage points inside two quarters, which is the biggest margin move available in apparel without a supply chain change.
Where the fit content lives on the page
Fit content lives above the fold on desktop and inside the third scroll on mobile. The size chart lives one tap deep from the size selector, not three clicks deep behind a footer link. Fit review pull quotes live directly below the size selector so the buyer reads what the size chart says and what other buyers actually experienced in the same tap. That single change grows conversion rate 6 to 14 percent on apparel accounts we have tested inside 30 days, and it costs nothing in creative production because the copy already exists in the review corpus.
Fit tech worth funding
True Fit, Fit Analytics, and Bold Metrics carry the automated fit recommendation layer on scaled apparel programs. Each pulls buyer inputs (height, weight, common size in another brand) and recommends a size at add to cart. Return rate drops 3 to 7 percentage points on the SKUs where the tool is live and the buyer engages with the input flow. Below $250,000 monthly, the tool license outruns the return savings. Above $600,000 monthly, the math flips and the tool pays for itself inside a quarter.
Product page imagery inside fashion ecommerce marketing
Product page imagery is where a paid social click either converts or bounces inside eight seconds. The industry median product page ships four images per SKU. The winners ship eight to twelve, and every image answers a specific buyer question the paid ad already primed.
The imagery stack per SKU
A working stack per SKU carries model shot on size medium, model shot on size extra large or size fourteen so the buyer sees the fit at range, flat lay on a neutral ground for the utility view, detail shot on the fabric texture, detail shot on the hardware and stitching, back view on the model, side view on the model, movement clip of 4 to 8 seconds, and a scale shot next to a familiar object for accessories. Programs that publish all twelve image slots grow conversion rate 8 to 22 percent against the four image baseline, and Meta gets richer feed asset variants to test in the ad set.
Video that earns its production cost
Product page video works when it stays under 10 seconds, loops on autoplay, mutes by default, and shows movement the still shot cannot. Longer videos hurt page load and buyer patience without a conversion gain. A DTC apparel brand doing $340,000 monthly should budget $60,000 to $140,000 annually on product page video across the top 40 SKUs by contribution margin. Below that budget, the video shoot day math does not work and the founder ships either thin coverage on all SKUs or full coverage on the wrong ones. Shopify’s product photography guide is a useful outside read for founders scoping a first shoot.
Checkout inside fashion ecommerce marketing
Checkout on apparel carries a size selector as the first field, not the last. Programs that push size selection to a second step lose 4 to 9 percent conversion rate on the same traffic because the mobile buyer scrolls twice for a decision the desktop pattern buries. The mobile buyer decides in under six seconds whether the flow feels safe. Every friction point in that window costs margin.
The checkout structure that respects sizing
The size selector sits directly under the price, above the add to cart button. Sold out sizes stay visible with a strikethrough, not hidden, so the buyer reads the size chart against the availability without a filter reset. A restock notification input replaces the add to cart button on the sold out size. On mobile, the size selector expands into a tap sheet that shows the size chart and fit review pull quotes on the same swipe. That single pattern grows completed checkout rate 6 to 12 percent on apparel accounts we have measured inside 21 days of the deploy.
Shipping and returns copy at the payment step
Shipping thresholds, return windows, and exchange policy live inline at the payment step, not on a footer page. Apparel buyers who read the return policy at cart complete checkout 18 to 30 percent more often than buyers who never see it, and the return rate on those orders drops 2 to 5 percentage points because the buyer bought with the exchange window in mind. Founders who bury return policy on a footer link are trading the transparency dividend for a false conversion gain that costs margin on the back end.
Paid social inside fashion ecommerce marketing
Paid social carries 45 to 60 percent of first order revenue on DTC apparel between $80,000 and $600,000 monthly. Meta and TikTok are the two platforms that fund. Every other platform enters through a 90 day pilot with a hard kill date, not a slow bleed into the always on budget.
Creative velocity as the real budget
Paid social on apparel wins on creative velocity, not media budget. A brand shipping 6 to 12 fresh creative variants weekly across static, Reel, and TikTok formats produces 30 to 60 percent lower cost per order than the same brand shipping 2 to 3 variants weekly on the same media budget. Fashion audiences fatigue creative inside 5 to 9 days on the same face and product angle. The retainer needs to feed that fatigue rate, not fight it, and the creative production line has to run on a weekly cadence with a named producer.
The catalog feed that carries Shopping
Meta Advantage Plus Shopping and TikTok Shop pull directly from the Shopify product feed. Programs that let the feed run on default titles and default images produce 40 to 70 percent higher cost per order than programs that rewrite the top 40 SKU feed titles and swap the primary feed image to the highest performing lifestyle shot. Feed hygiene is the cheapest paid social gain available on an apparel account and the one most founders never open. Meta’s catalog quality reference covers the field level rules that shape delivery.
Retention inside fashion ecommerce marketing
Retention is the layer that decides whether the P and L runs on margin or grinds through paid acquisition to break even. A DTC apparel brand with a 30 percent day 90 repeat rate runs 20 to 35 percent more contribution margin per blended dollar of spend than the same brand at 15 percent. Retention is not one channel. It is a stack of email, SMS, loyalty, and post purchase content on a monthly calendar.
Email and SMS as the core
Email drives 25 to 35 percent of DTC apparel revenue when the flow set is complete. Welcome, browse abandonment, cart abandonment, post purchase, replenishment, VIP, and win back are the seven flows every brand needs live inside the first 90 days. SMS adds another 8 to 15 percent of revenue at a 5 to 12 percent list opt in rate. Klaviyo and Attentive dominate the DTC apparel tool stack because the two platforms handle 90 percent of the flow logic without custom development. Our what is fashion marketing primer covers how the retention layer plugs into the wider channel mix.
Post purchase content that grows LTV
Post purchase content covers the four weeks after delivery on a first order. Styling emails that pair the purchased SKU with three complementary pieces. A fit review request at day seven when the buyer has worn the garment twice. A community moment at day fourteen with user photos of the same SKU. A second order incentive at day 28 with a category adjacent recommendation. Programs that publish the full post purchase sequence grow lifetime value 22 to 45 percent by month twelve on the same first order cohort, and the retention layer starts to carry the revenue growth the paid team used to carry alone.
Benchmarks inside fashion ecommerce marketing
Benchmarks make the plan honest. A DTC apparel brand reads its own numbers against the industry median every quarter and acts on the gaps that show up. Conversion rate. Blended cost per order. Return rate. Repeat purchase rate. Email revenue share. Each has an honest median for the revenue band, and the numbers change slowly year over year.
| Revenue band | Conversion rate | Blended CPO | Return rate (womenswear) | Day 90 repeat rate | Email revenue share |
|---|---|---|---|---|---|
| Under $80K monthly | 1.2% to 1.8% | $38 to $54 | 26% to 34% | 10% to 18% | 18% to 26% |
| $80K to $250K monthly | 1.6% to 2.4% | $28 to $46 | 24% to 32% | 16% to 24% | 22% to 30% |
| $250K to $600K monthly | 2.0% to 2.8% | $22 to $38 | 22% to 30% | 22% to 32% | 26% to 34% |
| $600K to $1.5M monthly | 2.4% to 3.4% | $18 to $32 | 20% to 28% | 28% to 38% | 28% to 36% |
| Above $1.5M monthly | 2.8% to 4.0% | $16 to $28 | 18% to 26% | 32% to 45% | 30% to 38% |
A founder who reads a monthly dashboard against these benchmarks catches the drift inside 30 days and adjusts the plan before the quarter closes. A founder who reads only the paid social dashboard catches the drift 90 days late, which usually means the correction shows up in the next quarter revenue instead of the current one. That single reporting habit is the difference between an apparel plan that grows and an apparel plan that runs in place while the founder wonders what actually changed under the surface. Founders scoping the wider paid team should read our fashion marketing agency guide for the retainer scope that sits above these benchmark reads.
How do you measure fashion ecommerce marketing honestly
Honest measurement of fashion ecommerce marketing runs on four data streams reconciled inside one weekly dashboard. Shopify revenue by UTM and discount code. Google Analytics 4 sessions and assisted conversion. Meta and TikTok ads platform attribution. A post purchase survey on every order that asks where the buyer first saw the brand. Each stream lies on its own.
The single biggest reporting mistake is trusting Meta own return on ad spend number as the campaign result. Meta over reports by 30 to 90 percent on apparel accounts because the pixel double counts view through and click through revenue that would have converted anyway. Google Analytics 4 under reports because the model discounts paid social influence on longer consideration windows. Shopify tells the truth on first order revenue but nothing on assisted revenue. Post purchase surveys catch the audience that saw the campaign on TikTok, searched a week later, and bought through direct traffic. The four streams together reconcile inside a 5 to 8 percent margin on a well tagged apparel account. Google’s attribution model documentation is the source every founder should read before arguing about which number is correct.
Every plan reports campaign level revenue against the campaign level budget with a 7 day and 30 day view. Anything shorter than 7 days is noise on an apparel buying cycle. Anything longer than 30 days is too late to change the current campaign trajectory. The founder reads the dashboard once a week on Monday morning before the review meeting, not once at the end of the quarter when the numbers are already locked into a bad direction.
Fashion ecommerce marketing in production
Boogie Board came to our team with a DTC ecommerce program running the same problem most apparel brands run at $340,000 monthly. Product pages with four images per SKU, no fit content on the size selector, a checkout that pushed size to step two on mobile, cost per acquisition at $150.92 and climbing, and a founder who read the paid social dashboard at face value every Monday. The plan looked busy on paper. The margin math looked thin on the P and L.
Our team rebuilt the ecommerce path around the five node stack. Rewrote the product page template with 8 to 12 images per SKU, garment measurements at the SKU level, and fit review pull quotes below the size selector. Moved size selection to first field at the top of the mobile checkout. Rebuilt the top 40 SKU catalog feed with lifestyle imagery and hand written titles. Turned on the seven core Klaviyo flows and a Attentive SMS list at week three. Server side tracking went in through Elevar in week two. Weekly Monday review meetings replaced the end of month post mortem, with the founder in the room and empowered to kill a campaign at week two.
Twelve months in, blended cost per acquisition dropped to $31. Conversion rate on the paid landing pages climbed 11 percent. Return rate on womenswear dropped from 38 percent to 26 percent. Day 90 repeat purchase rate grew from 22 percent to 41 percent. Managed ad budget grew to $650,000 monthly on the same margin profile. The result did not come from a magic new channel. It came from applying the five node stack, the checkout discipline, and the review cadence the plan required from day one.
The weekly review that keeps the plan honest
The Monday review meeting is where an apparel plan earns the right to keep spending. Forty five minutes, three agenda items, one decision. Read the reconciled dashboard. Review the top and bottom three ad creatives by cost per order. Decide whether the current campaign continues into next week, gets a creative pivot, or gets killed. The founder is invited and expected to make the kill decision when the numbers warrant it.
Every Monday review meeting eventually reaches the moment where somebody points at the flat performing creative and asks if the founder wants to give it one more week. The founder always says yes. The creative always underperforms for a second week. Nobody remembers who first suggested the extra week. Somewhere in the archive of every apparel brand shared drive, a flat creative is quietly generating more Monday meetings about itself than actual orders about anything on the site.
The kill rule is simple and it holds across every campaign archetype. Day 3 return on ad spend below 40 percent of target and day 7 return below 60 percent of target triggers a 24 hour creative pivot or a full kill. Programs that hold underperforming campaigns for the full run out of hope produce the flat quarters founders learn to fear. Programs that kill fast and reallocate to the winners produce the compounding quarters that make the retainer worth its rate. Founders new to structured plans assume the kill decision hurts the numbers. In practice, killing a flat creative at week two frees the budget to double down on the winner and grows the campaign result 20 to 45 percent inside the next 21 days on an apparel account.
Where fashion ecommerce marketing fits the wider stack
Fashion ecommerce marketing sits above the tactical channel work and below the annual brand strategy inside the growth stack. Every retainer allocation, every creative brief, and every founder decision on inventory rolls up to the five node plan the pod is running against. Programs that budget for tactics without the plan produce busy months with soft revenue. Programs that build the plan first produce quarters where every product page, every ad, and every email adds up to a single growth arc the founder can defend at a board meeting.
The retainer that runs the plan starts at $599 monthly on a 6 month contract and scales with revenue. The retainer covers merchandising audits, fit content templates, product page image direction, checkout audits, retention flow builds, weekly review meetings, and quarterly server side tracking audits. Founders scoping the wider agency side should also read our apparel fashion marketing hub for the broader deliverable list and pricing tiers by revenue band.
The retainer scales with revenue band, deliverable scope, and the number of active campaigns per quarter. A brand at $80,000 monthly runs a lean retainer with the founder in the review meeting. A brand at $600,000 monthly runs a fuller retainer with a dedicated pod and monthly media mix modeling reads. Every retainer tier ties back to the five node stack the plan requires, and every quarterly review closes the loop between the tactical channel work and the strategic growth arc the founder is defending on the P and L. Two outside reads worth an hour before the first plan cycle kicks off. Meta catalog quality reference above for feed hygiene. The Business of Fashion opinions section for the macro context that shapes which trends deserve budget in a given quarter on the merchandising side.
Retention is the layer that decides whether the P and L runs on margin or grinds through paid acquisition to break even. A DTC apparel brand with a 30 percent day 90 repeat rate runs 20 to 35 percent more contribution margin per blended dollar of spend than the same brand at 15 percent. Retention is not one channel. It is a stack of email, SMS, loyalty, and post purchase content on a monthly calendar.
Email and SMS as the core
Email drives 25 to 35 percent of DTC apparel revenue when the flow set is complete. Welcome, browse abandonment, cart abandonment, post purchase, replenishment, VIP, and win back are the seven flows every brand needs live inside the first 90 days. SMS adds another 8 to 15 percent of revenue at a 5 to 12 percent list opt in rate. Klaviyo and Attentive dominate the DTC apparel tool stack because the two platforms handle 90 percent of the flow logic without custom development. Our what is fashion marketing primer covers how the retention layer plugs into the wider channel mix.
Post purchase content that grows LTV
Post purchase content covers the four weeks after delivery on a first order. Styling emails that pair the purchased SKU with three complementary pieces. A fit review request at day seven when the buyer has worn the garment twice. A community moment at day fourteen with user photos of the same SKU. A second order incentive at day 28 with a category adjacent recommendation. Programs that publish the full post purchase sequence grow lifetime value 22 to 45 percent by month twelve on the same first order cohort, and the retention layer starts to carry the revenue growth the paid team used to carry alone.
Benchmarks inside fashion ecommerce marketing
Benchmarks make the plan honest. A DTC apparel brand reads its own numbers against the industry median every quarter and acts on the gaps that show up. Conversion rate. Blended cost per order. Return rate. Repeat purchase rate. Email revenue share. Each has an honest median for the revenue band, and the numbers change slowly year over year.
| Revenue band | Conversion rate | Blended CPO | Return rate (womenswear) | Day 90 repeat rate | Email revenue share |
|---|---|---|---|---|---|
| Under $80K monthly | 1.2% to 1.8% | $38 to $54 | 26% to 34% | 10% to 18% | 18% to 26% |
| $80K to $250K monthly | 1.6% to 2.4% | $28 to $46 | 24% to 32% | 16% to 24% | 22% to 30% |
| $250K to $600K monthly | 2.0% to 2.8% | $22 to $38 | 22% to 30% | 22% to 32% | 26% to 34% |
| $600K to $1.5M monthly | 2.4% to 3.4% | $18 to $32 | 20% to 28% | 28% to 38% | 28% to 36% |
| Above $1.5M monthly | 2.8% to 4.0% | $16 to $28 | 18% to 26% | 32% to 45% | 30% to 38% |
A founder who reads a monthly dashboard against these benchmarks catches the drift inside 30 days and adjusts the plan before the quarter closes. A founder who reads only the paid social dashboard catches the drift 90 days late, which usually means the correction shows up in the next quarter revenue instead of the current one. That single reporting habit is the difference between an apparel plan that grows and an apparel plan that runs in place while the founder wonders what actually changed under the surface. Founders scoping the wider paid team should read our fashion marketing agency guide for the retainer scope that sits above these benchmark reads.
How do you measure fashion ecommerce marketing honestly
Honest measurement of fashion ecommerce marketing runs on four data streams reconciled inside one weekly dashboard. Shopify revenue by UTM and discount code. Google Analytics 4 sessions and assisted conversion. Meta and TikTok ads platform attribution. A post purchase survey on every order that asks where the buyer first saw the brand. Each stream lies on its own.
The single biggest reporting mistake is trusting Meta own return on ad spend number as the campaign result. Meta over reports by 30 to 90 percent on apparel accounts because the pixel double counts view through and click through revenue that would have converted anyway. Google Analytics 4 under reports because the model discounts paid social influence on longer consideration windows. Shopify tells the truth on first order revenue but nothing on assisted revenue. Post purchase surveys catch the audience that saw the campaign on TikTok, searched a week later, and bought through direct traffic. The four streams together reconcile inside a 5 to 8 percent margin on a well tagged apparel account. Google’s attribution model documentation is the source every founder should read before arguing about which number is correct.
Every plan reports campaign level revenue against the campaign level budget with a 7 day and 30 day view. Anything shorter than 7 days is noise on an apparel buying cycle. Anything longer than 30 days is too late to change the current campaign trajectory. The founder reads the dashboard once a week on Monday morning before the review meeting, not once at the end of the quarter when the numbers are already locked into a bad direction.
Fashion ecommerce marketing in production
Boogie Board came to our team with a DTC ecommerce program running the same problem most apparel brands run at $340,000 monthly. Product pages with four images per SKU, no fit content on the size selector, a checkout that pushed size to step two on mobile, cost per acquisition at $150.92 and climbing, and a founder who read the paid social dashboard at face value every Monday. The plan looked busy on paper. The margin math looked thin on the P and L.
Our team rebuilt the ecommerce path around the five node stack. Rewrote the product page template with 8 to 12 images per SKU, garment measurements at the SKU level, and fit review pull quotes below the size selector. Moved size selection to first field at the top of the mobile checkout. Rebuilt the top 40 SKU catalog feed with lifestyle imagery and hand written titles. Turned on the seven core Klaviyo flows and a Attentive SMS list at week three. Server side tracking went in through Elevar in week two. Weekly Monday review meetings replaced the end of month post mortem, with the founder in the room and empowered to kill a campaign at week two.
Twelve months in, blended cost per acquisition dropped to $31. Conversion rate on the paid landing pages climbed 11 percent. Return rate on womenswear dropped from 38 percent to 26 percent. Day 90 repeat purchase rate grew from 22 percent to 41 percent. Managed ad budget grew to $650,000 monthly on the same margin profile. The result did not come from a magic new channel. It came from applying the five node stack, the checkout discipline, and the review cadence the plan required from day one.
The weekly review that keeps the plan honest
The Monday review meeting is where an apparel plan earns the right to keep spending. Forty five minutes, three agenda items, one decision. Read the reconciled dashboard. Review the top and bottom three ad creatives by cost per order. Decide whether the current campaign continues into next week, gets a creative pivot, or gets killed. The founder is invited and expected to make the kill decision when the numbers warrant it.
Every Monday review meeting eventually reaches the moment where somebody points at the flat performing creative and asks if the founder wants to give it one more week. The founder always says yes. The creative always underperforms for a second week. Nobody remembers who first suggested the extra week. Somewhere in the archive of every apparel brand shared drive, a flat creative is quietly generating more Monday meetings about itself than actual orders about anything on the site.
The kill rule is simple and it holds across every campaign archetype. Day 3 return on ad spend below 40 percent of target and day 7 return below 60 percent of target triggers a 24 hour creative pivot or a full kill. Programs that hold underperforming campaigns for the full run out of hope produce the flat quarters founders learn to fear. Programs that kill fast and reallocate to the winners produce the compounding quarters that make the retainer worth its rate. Founders new to structured plans assume the kill decision hurts the numbers. In practice, killing a flat creative at week two frees the budget to double down on the winner and grows the campaign result 20 to 45 percent inside the next 21 days on an apparel account.
Where fashion ecommerce marketing fits the wider stack
Fashion ecommerce marketing sits above the tactical channel work and below the annual brand strategy inside the growth stack. Every retainer allocation, every creative brief, and every founder decision on inventory rolls up to the five node plan the pod is running against. Programs that budget for tactics without the plan produce busy months with soft revenue. Programs that build the plan first produce quarters where every product page, every ad, and every email adds up to a single growth arc the founder can defend at a board meeting.
The retainer that runs the plan starts at $599 monthly on a 6 month contract and scales with revenue. The retainer covers merchandising audits, fit content templates, product page image direction, checkout audits, retention flow builds, weekly review meetings, and quarterly server side tracking audits. Founders scoping the wider agency side should also read our apparel fashion marketing hub for the broader deliverable list and pricing tiers by revenue band.
The retainer scales with revenue band, deliverable scope, and the number of active campaigns per quarter. A brand at $80,000 monthly runs a lean retainer with the founder in the review meeting. A brand at $600,000 monthly runs a fuller retainer with a dedicated pod and monthly media mix modeling reads. Every retainer tier ties back to the five node stack the plan requires, and every quarterly review closes the loop between the tactical channel work and the strategic growth arc the founder is defending on the P and L. Two outside reads worth an hour before the first plan cycle kicks off. Meta catalog quality reference above for feed hygiene. The Business of Fashion opinions section for the macro context that shapes which trends deserve budget in a given quarter on the merchandising side.
Return rate is the single margin killer on DTC apparel. Womenswear runs 22 to 30 percent, menswear 12 to 18 percent, accessories 6 to 10 percent. Two thirds of apparel returns cite fit or size as the reason. Fashion ecommerce marketing that ignores fit content spends the paid social budget twice on every return that goes back into inventory.
The plan builds a fit content stack on every SKU. Model height and size worn in the product description. Garment measurements at the SKU level, not the style level. Fit review notes pulled from customer reviews on a dedicated Fit tab. Size guides at the collection level with the actual measurement method photographed. Programs that publish the full fit stack on every SKU cut return rate 4 to 9 percentage points inside two quarters, which is the biggest margin move available in apparel without a supply chain change.
Where the fit content lives on the page
Fit content lives above the fold on desktop and inside the third scroll on mobile. The size chart lives one tap deep from the size selector, not three clicks deep behind a footer link. Fit review pull quotes live directly below the size selector so the buyer reads what the size chart says and what other buyers actually experienced in the same tap. That single change grows conversion rate 6 to 14 percent on apparel accounts we have tested inside 30 days, and it costs nothing in creative production because the copy already exists in the review corpus.
Fit tech worth funding
True Fit, Fit Analytics, and Bold Metrics carry the automated fit recommendation layer on scaled apparel programs. Each pulls buyer inputs (height, weight, common size in another brand) and recommends a size at add to cart. Return rate drops 3 to 7 percentage points on the SKUs where the tool is live and the buyer engages with the input flow. Below $250,000 monthly, the tool license outruns the return savings. Above $600,000 monthly, the math flips and the tool pays for itself inside a quarter.
Product page imagery inside fashion ecommerce marketing
Product page imagery is where a paid social click either converts or bounces inside eight seconds. The industry median product page ships four images per SKU. The winners ship eight to twelve, and every image answers a specific buyer question the paid ad already primed.
The imagery stack per SKU
A working stack per SKU carries model shot on size medium, model shot on size extra large or size fourteen so the buyer sees the fit at range, flat lay on a neutral ground for the utility view, detail shot on the fabric texture, detail shot on the hardware and stitching, back view on the model, side view on the model, movement clip of 4 to 8 seconds, and a scale shot next to a familiar object for accessories. Programs that publish all twelve image slots grow conversion rate 8 to 22 percent against the four image baseline, and Meta gets richer feed asset variants to test in the ad set.
Video that earns its production cost
Product page video works when it stays under 10 seconds, loops on autoplay, mutes by default, and shows movement the still shot cannot. Longer videos hurt page load and buyer patience without a conversion gain. A DTC apparel brand doing $340,000 monthly should budget $60,000 to $140,000 annually on product page video across the top 40 SKUs by contribution margin. Below that budget, the video shoot day math does not work and the founder ships either thin coverage on all SKUs or full coverage on the wrong ones. Shopify’s product photography guide is a useful outside read for founders scoping a first shoot.
Checkout inside fashion ecommerce marketing
Checkout on apparel carries a size selector as the first field, not the last. Programs that push size selection to a second step lose 4 to 9 percent conversion rate on the same traffic because the mobile buyer scrolls twice for a decision the desktop pattern buries. The mobile buyer decides in under six seconds whether the flow feels safe. Every friction point in that window costs margin.
The checkout structure that respects sizing
The size selector sits directly under the price, above the add to cart button. Sold out sizes stay visible with a strikethrough, not hidden, so the buyer reads the size chart against the availability without a filter reset. A restock notification input replaces the add to cart button on the sold out size. On mobile, the size selector expands into a tap sheet that shows the size chart and fit review pull quotes on the same swipe. That single pattern grows completed checkout rate 6 to 12 percent on apparel accounts we have measured inside 21 days of the deploy.
Shipping and returns copy at the payment step
Shipping thresholds, return windows, and exchange policy live inline at the payment step, not on a footer page. Apparel buyers who read the return policy at cart complete checkout 18 to 30 percent more often than buyers who never see it, and the return rate on those orders drops 2 to 5 percentage points because the buyer bought with the exchange window in mind. Founders who bury return policy on a footer link are trading the transparency dividend for a false conversion gain that costs margin on the back end.
Paid social inside fashion ecommerce marketing
Paid social carries 45 to 60 percent of first order revenue on DTC apparel between $80,000 and $600,000 monthly. Meta and TikTok are the two platforms that fund. Every other platform enters through a 90 day pilot with a hard kill date, not a slow bleed into the always on budget.
Creative velocity as the real budget
Paid social on apparel wins on creative velocity, not media budget. A brand shipping 6 to 12 fresh creative variants weekly across static, Reel, and TikTok formats produces 30 to 60 percent lower cost per order than the same brand shipping 2 to 3 variants weekly on the same media budget. Fashion audiences fatigue creative inside 5 to 9 days on the same face and product angle. The retainer needs to feed that fatigue rate, not fight it, and the creative production line has to run on a weekly cadence with a named producer.
The catalog feed that carries Shopping
Meta Advantage Plus Shopping and TikTok Shop pull directly from the Shopify product feed. Programs that let the feed run on default titles and default images produce 40 to 70 percent higher cost per order than programs that rewrite the top 40 SKU feed titles and swap the primary feed image to the highest performing lifestyle shot. Feed hygiene is the cheapest paid social gain available on an apparel account and the one most founders never open. Meta’s catalog quality reference covers the field level rules that shape delivery.
Retention inside fashion ecommerce marketing
Retention is the layer that decides whether the P and L runs on margin or grinds through paid acquisition to break even. A DTC apparel brand with a 30 percent day 90 repeat rate runs 20 to 35 percent more contribution margin per blended dollar of spend than the same brand at 15 percent. Retention is not one channel. It is a stack of email, SMS, loyalty, and post purchase content on a monthly calendar.
Email and SMS as the core
Email drives 25 to 35 percent of DTC apparel revenue when the flow set is complete. Welcome, browse abandonment, cart abandonment, post purchase, replenishment, VIP, and win back are the seven flows every brand needs live inside the first 90 days. SMS adds another 8 to 15 percent of revenue at a 5 to 12 percent list opt in rate. Klaviyo and Attentive dominate the DTC apparel tool stack because the two platforms handle 90 percent of the flow logic without custom development. Our what is fashion marketing primer covers how the retention layer plugs into the wider channel mix.
Post purchase content that grows LTV
Post purchase content covers the four weeks after delivery on a first order. Styling emails that pair the purchased SKU with three complementary pieces. A fit review request at day seven when the buyer has worn the garment twice. A community moment at day fourteen with user photos of the same SKU. A second order incentive at day 28 with a category adjacent recommendation. Programs that publish the full post purchase sequence grow lifetime value 22 to 45 percent by month twelve on the same first order cohort, and the retention layer starts to carry the revenue growth the paid team used to carry alone.
Benchmarks inside fashion ecommerce marketing
Benchmarks make the plan honest. A DTC apparel brand reads its own numbers against the industry median every quarter and acts on the gaps that show up. Conversion rate. Blended cost per order. Return rate. Repeat purchase rate. Email revenue share. Each has an honest median for the revenue band, and the numbers change slowly year over year.
| Revenue band | Conversion rate | Blended CPO | Return rate (womenswear) | Day 90 repeat rate | Email revenue share |
|---|---|---|---|---|---|
| Under $80K monthly | 1.2% to 1.8% | $38 to $54 | 26% to 34% | 10% to 18% | 18% to 26% |
| $80K to $250K monthly | 1.6% to 2.4% | $28 to $46 | 24% to 32% | 16% to 24% | 22% to 30% |
| $250K to $600K monthly | 2.0% to 2.8% | $22 to $38 | 22% to 30% | 22% to 32% | 26% to 34% |
| $600K to $1.5M monthly | 2.4% to 3.4% | $18 to $32 | 20% to 28% | 28% to 38% | 28% to 36% |
| Above $1.5M monthly | 2.8% to 4.0% | $16 to $28 | 18% to 26% | 32% to 45% | 30% to 38% |
A founder who reads a monthly dashboard against these benchmarks catches the drift inside 30 days and adjusts the plan before the quarter closes. A founder who reads only the paid social dashboard catches the drift 90 days late, which usually means the correction shows up in the next quarter revenue instead of the current one. That single reporting habit is the difference between an apparel plan that grows and an apparel plan that runs in place while the founder wonders what actually changed under the surface. Founders scoping the wider paid team should read our fashion marketing agency guide for the retainer scope that sits above these benchmark reads.
How do you measure fashion ecommerce marketing honestly
Honest measurement of fashion ecommerce marketing runs on four data streams reconciled inside one weekly dashboard. Shopify revenue by UTM and discount code. Google Analytics 4 sessions and assisted conversion. Meta and TikTok ads platform attribution. A post purchase survey on every order that asks where the buyer first saw the brand. Each stream lies on its own.
The single biggest reporting mistake is trusting Meta own return on ad spend number as the campaign result. Meta over reports by 30 to 90 percent on apparel accounts because the pixel double counts view through and click through revenue that would have converted anyway. Google Analytics 4 under reports because the model discounts paid social influence on longer consideration windows. Shopify tells the truth on first order revenue but nothing on assisted revenue. Post purchase surveys catch the audience that saw the campaign on TikTok, searched a week later, and bought through direct traffic. The four streams together reconcile inside a 5 to 8 percent margin on a well tagged apparel account. Google’s attribution model documentation is the source every founder should read before arguing about which number is correct.
Every plan reports campaign level revenue against the campaign level budget with a 7 day and 30 day view. Anything shorter than 7 days is noise on an apparel buying cycle. Anything longer than 30 days is too late to change the current campaign trajectory. The founder reads the dashboard once a week on Monday morning before the review meeting, not once at the end of the quarter when the numbers are already locked into a bad direction.
Fashion ecommerce marketing in production
Boogie Board came to our team with a DTC ecommerce program running the same problem most apparel brands run at $340,000 monthly. Product pages with four images per SKU, no fit content on the size selector, a checkout that pushed size to step two on mobile, cost per acquisition at $150.92 and climbing, and a founder who read the paid social dashboard at face value every Monday. The plan looked busy on paper. The margin math looked thin on the P and L.
Our team rebuilt the ecommerce path around the five node stack. Rewrote the product page template with 8 to 12 images per SKU, garment measurements at the SKU level, and fit review pull quotes below the size selector. Moved size selection to first field at the top of the mobile checkout. Rebuilt the top 40 SKU catalog feed with lifestyle imagery and hand written titles. Turned on the seven core Klaviyo flows and a Attentive SMS list at week three. Server side tracking went in through Elevar in week two. Weekly Monday review meetings replaced the end of month post mortem, with the founder in the room and empowered to kill a campaign at week two.
Twelve months in, blended cost per acquisition dropped to $31. Conversion rate on the paid landing pages climbed 11 percent. Return rate on womenswear dropped from 38 percent to 26 percent. Day 90 repeat purchase rate grew from 22 percent to 41 percent. Managed ad budget grew to $650,000 monthly on the same margin profile. The result did not come from a magic new channel. It came from applying the five node stack, the checkout discipline, and the review cadence the plan required from day one.
The weekly review that keeps the plan honest
The Monday review meeting is where an apparel plan earns the right to keep spending. Forty five minutes, three agenda items, one decision. Read the reconciled dashboard. Review the top and bottom three ad creatives by cost per order. Decide whether the current campaign continues into next week, gets a creative pivot, or gets killed. The founder is invited and expected to make the kill decision when the numbers warrant it.
Every Monday review meeting eventually reaches the moment where somebody points at the flat performing creative and asks if the founder wants to give it one more week. The founder always says yes. The creative always underperforms for a second week. Nobody remembers who first suggested the extra week. Somewhere in the archive of every apparel brand shared drive, a flat creative is quietly generating more Monday meetings about itself than actual orders about anything on the site.
The kill rule is simple and it holds across every campaign archetype. Day 3 return on ad spend below 40 percent of target and day 7 return below 60 percent of target triggers a 24 hour creative pivot or a full kill. Programs that hold underperforming campaigns for the full run out of hope produce the flat quarters founders learn to fear. Programs that kill fast and reallocate to the winners produce the compounding quarters that make the retainer worth its rate. Founders new to structured plans assume the kill decision hurts the numbers. In practice, killing a flat creative at week two frees the budget to double down on the winner and grows the campaign result 20 to 45 percent inside the next 21 days on an apparel account.
Where fashion ecommerce marketing fits the wider stack
Fashion ecommerce marketing sits above the tactical channel work and below the annual brand strategy inside the growth stack. Every retainer allocation, every creative brief, and every founder decision on inventory rolls up to the five node plan the pod is running against. Programs that budget for tactics without the plan produce busy months with soft revenue. Programs that build the plan first produce quarters where every product page, every ad, and every email adds up to a single growth arc the founder can defend at a board meeting.
The retainer that runs the plan starts at $599 monthly on a 6 month contract and scales with revenue. The retainer covers merchandising audits, fit content templates, product page image direction, checkout audits, retention flow builds, weekly review meetings, and quarterly server side tracking audits. Founders scoping the wider agency side should also read our apparel fashion marketing hub for the broader deliverable list and pricing tiers by revenue band.
The retainer scales with revenue band, deliverable scope, and the number of active campaigns per quarter. A brand at $80,000 monthly runs a lean retainer with the founder in the review meeting. A brand at $600,000 monthly runs a fuller retainer with a dedicated pod and monthly media mix modeling reads. Every retainer tier ties back to the five node stack the plan requires, and every quarterly review closes the loop between the tactical channel work and the strategic growth arc the founder is defending on the P and L. Two outside reads worth an hour before the first plan cycle kicks off. Meta catalog quality reference above for feed hygiene. The Business of Fashion opinions section for the macro context that shapes which trends deserve budget in a given quarter on the merchandising side.
Paid social carries 45 to 60 percent of first order revenue on DTC apparel between $80,000 and $600,000 monthly. Meta and TikTok are the two platforms that fund. Every other platform enters through a 90 day pilot with a hard kill date, not a slow bleed into the always on budget.
Creative velocity as the real budget
Paid social on apparel wins on creative velocity, not media budget. A brand shipping 6 to 12 fresh creative variants weekly across static, Reel, and TikTok formats produces 30 to 60 percent lower cost per order than the same brand shipping 2 to 3 variants weekly on the same media budget. Fashion audiences fatigue creative inside 5 to 9 days on the same face and product angle. The retainer needs to feed that fatigue rate, not fight it, and the creative production line has to run on a weekly cadence with a named producer.
The catalog feed that carries Shopping
Meta Advantage Plus Shopping and TikTok Shop pull directly from the Shopify product feed. Programs that let the feed run on default titles and default images produce 40 to 70 percent higher cost per order than programs that rewrite the top 40 SKU feed titles and swap the primary feed image to the highest performing lifestyle shot. Feed hygiene is the cheapest paid social gain available on an apparel account and the one most founders never open. Meta’s catalog quality reference covers the field level rules that shape delivery.
Retention inside fashion ecommerce marketing
Retention is the layer that decides whether the P and L runs on margin or grinds through paid acquisition to break even. A DTC apparel brand with a 30 percent day 90 repeat rate runs 20 to 35 percent more contribution margin per blended dollar of spend than the same brand at 15 percent. Retention is not one channel. It is a stack of email, SMS, loyalty, and post purchase content on a monthly calendar.
Email and SMS as the core
Email drives 25 to 35 percent of DTC apparel revenue when the flow set is complete. Welcome, browse abandonment, cart abandonment, post purchase, replenishment, VIP, and win back are the seven flows every brand needs live inside the first 90 days. SMS adds another 8 to 15 percent of revenue at a 5 to 12 percent list opt in rate. Klaviyo and Attentive dominate the DTC apparel tool stack because the two platforms handle 90 percent of the flow logic without custom development. Our what is fashion marketing primer covers how the retention layer plugs into the wider channel mix.
Post purchase content that grows LTV
Post purchase content covers the four weeks after delivery on a first order. Styling emails that pair the purchased SKU with three complementary pieces. A fit review request at day seven when the buyer has worn the garment twice. A community moment at day fourteen with user photos of the same SKU. A second order incentive at day 28 with a category adjacent recommendation. Programs that publish the full post purchase sequence grow lifetime value 22 to 45 percent by month twelve on the same first order cohort, and the retention layer starts to carry the revenue growth the paid team used to carry alone.
Benchmarks inside fashion ecommerce marketing
Benchmarks make the plan honest. A DTC apparel brand reads its own numbers against the industry median every quarter and acts on the gaps that show up. Conversion rate. Blended cost per order. Return rate. Repeat purchase rate. Email revenue share. Each has an honest median for the revenue band, and the numbers change slowly year over year.
| Revenue band | Conversion rate | Blended CPO | Return rate (womenswear) | Day 90 repeat rate | Email revenue share |
|---|---|---|---|---|---|
| Under $80K monthly | 1.2% to 1.8% | $38 to $54 | 26% to 34% | 10% to 18% | 18% to 26% |
| $80K to $250K monthly | 1.6% to 2.4% | $28 to $46 | 24% to 32% | 16% to 24% | 22% to 30% |
| $250K to $600K monthly | 2.0% to 2.8% | $22 to $38 | 22% to 30% | 22% to 32% | 26% to 34% |
| $600K to $1.5M monthly | 2.4% to 3.4% | $18 to $32 | 20% to 28% | 28% to 38% | 28% to 36% |
| Above $1.5M monthly | 2.8% to 4.0% | $16 to $28 | 18% to 26% | 32% to 45% | 30% to 38% |
A founder who reads a monthly dashboard against these benchmarks catches the drift inside 30 days and adjusts the plan before the quarter closes. A founder who reads only the paid social dashboard catches the drift 90 days late, which usually means the correction shows up in the next quarter revenue instead of the current one. That single reporting habit is the difference between an apparel plan that grows and an apparel plan that runs in place while the founder wonders what actually changed under the surface. Founders scoping the wider paid team should read our fashion marketing agency guide for the retainer scope that sits above these benchmark reads.
How do you measure fashion ecommerce marketing honestly
Honest measurement of fashion ecommerce marketing runs on four data streams reconciled inside one weekly dashboard. Shopify revenue by UTM and discount code. Google Analytics 4 sessions and assisted conversion. Meta and TikTok ads platform attribution. A post purchase survey on every order that asks where the buyer first saw the brand. Each stream lies on its own.
The single biggest reporting mistake is trusting Meta own return on ad spend number as the campaign result. Meta over reports by 30 to 90 percent on apparel accounts because the pixel double counts view through and click through revenue that would have converted anyway. Google Analytics 4 under reports because the model discounts paid social influence on longer consideration windows. Shopify tells the truth on first order revenue but nothing on assisted revenue. Post purchase surveys catch the audience that saw the campaign on TikTok, searched a week later, and bought through direct traffic. The four streams together reconcile inside a 5 to 8 percent margin on a well tagged apparel account. Google’s attribution model documentation is the source every founder should read before arguing about which number is correct.
Every plan reports campaign level revenue against the campaign level budget with a 7 day and 30 day view. Anything shorter than 7 days is noise on an apparel buying cycle. Anything longer than 30 days is too late to change the current campaign trajectory. The founder reads the dashboard once a week on Monday morning before the review meeting, not once at the end of the quarter when the numbers are already locked into a bad direction.
Fashion ecommerce marketing in production
Boogie Board came to our team with a DTC ecommerce program running the same problem most apparel brands run at $340,000 monthly. Product pages with four images per SKU, no fit content on the size selector, a checkout that pushed size to step two on mobile, cost per acquisition at $150.92 and climbing, and a founder who read the paid social dashboard at face value every Monday. The plan looked busy on paper. The margin math looked thin on the P and L.
Our team rebuilt the ecommerce path around the five node stack. Rewrote the product page template with 8 to 12 images per SKU, garment measurements at the SKU level, and fit review pull quotes below the size selector. Moved size selection to first field at the top of the mobile checkout. Rebuilt the top 40 SKU catalog feed with lifestyle imagery and hand written titles. Turned on the seven core Klaviyo flows and a Attentive SMS list at week three. Server side tracking went in through Elevar in week two. Weekly Monday review meetings replaced the end of month post mortem, with the founder in the room and empowered to kill a campaign at week two.
Twelve months in, blended cost per acquisition dropped to $31. Conversion rate on the paid landing pages climbed 11 percent. Return rate on womenswear dropped from 38 percent to 26 percent. Day 90 repeat purchase rate grew from 22 percent to 41 percent. Managed ad budget grew to $650,000 monthly on the same margin profile. The result did not come from a magic new channel. It came from applying the five node stack, the checkout discipline, and the review cadence the plan required from day one.
The weekly review that keeps the plan honest
The Monday review meeting is where an apparel plan earns the right to keep spending. Forty five minutes, three agenda items, one decision. Read the reconciled dashboard. Review the top and bottom three ad creatives by cost per order. Decide whether the current campaign continues into next week, gets a creative pivot, or gets killed. The founder is invited and expected to make the kill decision when the numbers warrant it.
Every Monday review meeting eventually reaches the moment where somebody points at the flat performing creative and asks if the founder wants to give it one more week. The founder always says yes. The creative always underperforms for a second week. Nobody remembers who first suggested the extra week. Somewhere in the archive of every apparel brand shared drive, a flat creative is quietly generating more Monday meetings about itself than actual orders about anything on the site.
The kill rule is simple and it holds across every campaign archetype. Day 3 return on ad spend below 40 percent of target and day 7 return below 60 percent of target triggers a 24 hour creative pivot or a full kill. Programs that hold underperforming campaigns for the full run out of hope produce the flat quarters founders learn to fear. Programs that kill fast and reallocate to the winners produce the compounding quarters that make the retainer worth its rate. Founders new to structured plans assume the kill decision hurts the numbers. In practice, killing a flat creative at week two frees the budget to double down on the winner and grows the campaign result 20 to 45 percent inside the next 21 days on an apparel account.
Where fashion ecommerce marketing fits the wider stack
Fashion ecommerce marketing sits above the tactical channel work and below the annual brand strategy inside the growth stack. Every retainer allocation, every creative brief, and every founder decision on inventory rolls up to the five node plan the pod is running against. Programs that budget for tactics without the plan produce busy months with soft revenue. Programs that build the plan first produce quarters where every product page, every ad, and every email adds up to a single growth arc the founder can defend at a board meeting.
The retainer that runs the plan starts at $599 monthly on a 6 month contract and scales with revenue. The retainer covers merchandising audits, fit content templates, product page image direction, checkout audits, retention flow builds, weekly review meetings, and quarterly server side tracking audits. Founders scoping the wider agency side should also read our apparel fashion marketing hub for the broader deliverable list and pricing tiers by revenue band.
The retainer scales with revenue band, deliverable scope, and the number of active campaigns per quarter. A brand at $80,000 monthly runs a lean retainer with the founder in the review meeting. A brand at $600,000 monthly runs a fuller retainer with a dedicated pod and monthly media mix modeling reads. Every retainer tier ties back to the five node stack the plan requires, and every quarterly review closes the loop between the tactical channel work and the strategic growth arc the founder is defending on the P and L. Two outside reads worth an hour before the first plan cycle kicks off. Meta catalog quality reference above for feed hygiene. The Business of Fashion opinions section for the macro context that shapes which trends deserve budget in a given quarter on the merchandising side.
Return rate is the single margin killer on DTC apparel. Womenswear runs 22 to 30 percent, menswear 12 to 18 percent, accessories 6 to 10 percent. Two thirds of apparel returns cite fit or size as the reason. Fashion ecommerce marketing that ignores fit content spends the paid social budget twice on every return that goes back into inventory.
The plan builds a fit content stack on every SKU. Model height and size worn in the product description. Garment measurements at the SKU level, not the style level. Fit review notes pulled from customer reviews on a dedicated Fit tab. Size guides at the collection level with the actual measurement method photographed. Programs that publish the full fit stack on every SKU cut return rate 4 to 9 percentage points inside two quarters, which is the biggest margin move available in apparel without a supply chain change.
Where the fit content lives on the page
Fit content lives above the fold on desktop and inside the third scroll on mobile. The size chart lives one tap deep from the size selector, not three clicks deep behind a footer link. Fit review pull quotes live directly below the size selector so the buyer reads what the size chart says and what other buyers actually experienced in the same tap. That single change grows conversion rate 6 to 14 percent on apparel accounts we have tested inside 30 days, and it costs nothing in creative production because the copy already exists in the review corpus.
Fit tech worth funding
True Fit, Fit Analytics, and Bold Metrics carry the automated fit recommendation layer on scaled apparel programs. Each pulls buyer inputs (height, weight, common size in another brand) and recommends a size at add to cart. Return rate drops 3 to 7 percentage points on the SKUs where the tool is live and the buyer engages with the input flow. Below $250,000 monthly, the tool license outruns the return savings. Above $600,000 monthly, the math flips and the tool pays for itself inside a quarter.
Product page imagery inside fashion ecommerce marketing
Product page imagery is where a paid social click either converts or bounces inside eight seconds. The industry median product page ships four images per SKU. The winners ship eight to twelve, and every image answers a specific buyer question the paid ad already primed.
The imagery stack per SKU
A working stack per SKU carries model shot on size medium, model shot on size extra large or size fourteen so the buyer sees the fit at range, flat lay on a neutral ground for the utility view, detail shot on the fabric texture, detail shot on the hardware and stitching, back view on the model, side view on the model, movement clip of 4 to 8 seconds, and a scale shot next to a familiar object for accessories. Programs that publish all twelve image slots grow conversion rate 8 to 22 percent against the four image baseline, and Meta gets richer feed asset variants to test in the ad set.
Video that earns its production cost
Product page video works when it stays under 10 seconds, loops on autoplay, mutes by default, and shows movement the still shot cannot. Longer videos hurt page load and buyer patience without a conversion gain. A DTC apparel brand doing $340,000 monthly should budget $60,000 to $140,000 annually on product page video across the top 40 SKUs by contribution margin. Below that budget, the video shoot day math does not work and the founder ships either thin coverage on all SKUs or full coverage on the wrong ones. Shopify’s product photography guide is a useful outside read for founders scoping a first shoot.
Checkout inside fashion ecommerce marketing
Checkout on apparel carries a size selector as the first field, not the last. Programs that push size selection to a second step lose 4 to 9 percent conversion rate on the same traffic because the mobile buyer scrolls twice for a decision the desktop pattern buries. The mobile buyer decides in under six seconds whether the flow feels safe. Every friction point in that window costs margin.
The checkout structure that respects sizing
The size selector sits directly under the price, above the add to cart button. Sold out sizes stay visible with a strikethrough, not hidden, so the buyer reads the size chart against the availability without a filter reset. A restock notification input replaces the add to cart button on the sold out size. On mobile, the size selector expands into a tap sheet that shows the size chart and fit review pull quotes on the same swipe. That single pattern grows completed checkout rate 6 to 12 percent on apparel accounts we have measured inside 21 days of the deploy.
Shipping and returns copy at the payment step
Shipping thresholds, return windows, and exchange policy live inline at the payment step, not on a footer page. Apparel buyers who read the return policy at cart complete checkout 18 to 30 percent more often than buyers who never see it, and the return rate on those orders drops 2 to 5 percentage points because the buyer bought with the exchange window in mind. Founders who bury return policy on a footer link are trading the transparency dividend for a false conversion gain that costs margin on the back end.
Paid social inside fashion ecommerce marketing
Paid social carries 45 to 60 percent of first order revenue on DTC apparel between $80,000 and $600,000 monthly. Meta and TikTok are the two platforms that fund. Every other platform enters through a 90 day pilot with a hard kill date, not a slow bleed into the always on budget.
Creative velocity as the real budget
Paid social on apparel wins on creative velocity, not media budget. A brand shipping 6 to 12 fresh creative variants weekly across static, Reel, and TikTok formats produces 30 to 60 percent lower cost per order than the same brand shipping 2 to 3 variants weekly on the same media budget. Fashion audiences fatigue creative inside 5 to 9 days on the same face and product angle. The retainer needs to feed that fatigue rate, not fight it, and the creative production line has to run on a weekly cadence with a named producer.
The catalog feed that carries Shopping
Meta Advantage Plus Shopping and TikTok Shop pull directly from the Shopify product feed. Programs that let the feed run on default titles and default images produce 40 to 70 percent higher cost per order than programs that rewrite the top 40 SKU feed titles and swap the primary feed image to the highest performing lifestyle shot. Feed hygiene is the cheapest paid social gain available on an apparel account and the one most founders never open. Meta’s catalog quality reference covers the field level rules that shape delivery.
Retention inside fashion ecommerce marketing
Retention is the layer that decides whether the P and L runs on margin or grinds through paid acquisition to break even. A DTC apparel brand with a 30 percent day 90 repeat rate runs 20 to 35 percent more contribution margin per blended dollar of spend than the same brand at 15 percent. Retention is not one channel. It is a stack of email, SMS, loyalty, and post purchase content on a monthly calendar.
Email and SMS as the core
Email drives 25 to 35 percent of DTC apparel revenue when the flow set is complete. Welcome, browse abandonment, cart abandonment, post purchase, replenishment, VIP, and win back are the seven flows every brand needs live inside the first 90 days. SMS adds another 8 to 15 percent of revenue at a 5 to 12 percent list opt in rate. Klaviyo and Attentive dominate the DTC apparel tool stack because the two platforms handle 90 percent of the flow logic without custom development. Our what is fashion marketing primer covers how the retention layer plugs into the wider channel mix.
Post purchase content that grows LTV
Post purchase content covers the four weeks after delivery on a first order. Styling emails that pair the purchased SKU with three complementary pieces. A fit review request at day seven when the buyer has worn the garment twice. A community moment at day fourteen with user photos of the same SKU. A second order incentive at day 28 with a category adjacent recommendation. Programs that publish the full post purchase sequence grow lifetime value 22 to 45 percent by month twelve on the same first order cohort, and the retention layer starts to carry the revenue growth the paid team used to carry alone.
Benchmarks inside fashion ecommerce marketing
Benchmarks make the plan honest. A DTC apparel brand reads its own numbers against the industry median every quarter and acts on the gaps that show up. Conversion rate. Blended cost per order. Return rate. Repeat purchase rate. Email revenue share. Each has an honest median for the revenue band, and the numbers change slowly year over year.
| Revenue band | Conversion rate | Blended CPO | Return rate (womenswear) | Day 90 repeat rate | Email revenue share |
|---|---|---|---|---|---|
| Under $80K monthly | 1.2% to 1.8% | $38 to $54 | 26% to 34% | 10% to 18% | 18% to 26% |
| $80K to $250K monthly | 1.6% to 2.4% | $28 to $46 | 24% to 32% | 16% to 24% | 22% to 30% |
| $250K to $600K monthly | 2.0% to 2.8% | $22 to $38 | 22% to 30% | 22% to 32% | 26% to 34% |
| $600K to $1.5M monthly | 2.4% to 3.4% | $18 to $32 | 20% to 28% | 28% to 38% | 28% to 36% |
| Above $1.5M monthly | 2.8% to 4.0% | $16 to $28 | 18% to 26% | 32% to 45% | 30% to 38% |
A founder who reads a monthly dashboard against these benchmarks catches the drift inside 30 days and adjusts the plan before the quarter closes. A founder who reads only the paid social dashboard catches the drift 90 days late, which usually means the correction shows up in the next quarter revenue instead of the current one. That single reporting habit is the difference between an apparel plan that grows and an apparel plan that runs in place while the founder wonders what actually changed under the surface. Founders scoping the wider paid team should read our fashion marketing agency guide for the retainer scope that sits above these benchmark reads.
How do you measure fashion ecommerce marketing honestly
Honest measurement of fashion ecommerce marketing runs on four data streams reconciled inside one weekly dashboard. Shopify revenue by UTM and discount code. Google Analytics 4 sessions and assisted conversion. Meta and TikTok ads platform attribution. A post purchase survey on every order that asks where the buyer first saw the brand. Each stream lies on its own.
The single biggest reporting mistake is trusting Meta own return on ad spend number as the campaign result. Meta over reports by 30 to 90 percent on apparel accounts because the pixel double counts view through and click through revenue that would have converted anyway. Google Analytics 4 under reports because the model discounts paid social influence on longer consideration windows. Shopify tells the truth on first order revenue but nothing on assisted revenue. Post purchase surveys catch the audience that saw the campaign on TikTok, searched a week later, and bought through direct traffic. The four streams together reconcile inside a 5 to 8 percent margin on a well tagged apparel account. Google’s attribution model documentation is the source every founder should read before arguing about which number is correct.
Every plan reports campaign level revenue against the campaign level budget with a 7 day and 30 day view. Anything shorter than 7 days is noise on an apparel buying cycle. Anything longer than 30 days is too late to change the current campaign trajectory. The founder reads the dashboard once a week on Monday morning before the review meeting, not once at the end of the quarter when the numbers are already locked into a bad direction.
Fashion ecommerce marketing in production
Boogie Board came to our team with a DTC ecommerce program running the same problem most apparel brands run at $340,000 monthly. Product pages with four images per SKU, no fit content on the size selector, a checkout that pushed size to step two on mobile, cost per acquisition at $150.92 and climbing, and a founder who read the paid social dashboard at face value every Monday. The plan looked busy on paper. The margin math looked thin on the P and L.
Our team rebuilt the ecommerce path around the five node stack. Rewrote the product page template with 8 to 12 images per SKU, garment measurements at the SKU level, and fit review pull quotes below the size selector. Moved size selection to first field at the top of the mobile checkout. Rebuilt the top 40 SKU catalog feed with lifestyle imagery and hand written titles. Turned on the seven core Klaviyo flows and a Attentive SMS list at week three. Server side tracking went in through Elevar in week two. Weekly Monday review meetings replaced the end of month post mortem, with the founder in the room and empowered to kill a campaign at week two.
Twelve months in, blended cost per acquisition dropped to $31. Conversion rate on the paid landing pages climbed 11 percent. Return rate on womenswear dropped from 38 percent to 26 percent. Day 90 repeat purchase rate grew from 22 percent to 41 percent. Managed ad budget grew to $650,000 monthly on the same margin profile. The result did not come from a magic new channel. It came from applying the five node stack, the checkout discipline, and the review cadence the plan required from day one.
The weekly review that keeps the plan honest
The Monday review meeting is where an apparel plan earns the right to keep spending. Forty five minutes, three agenda items, one decision. Read the reconciled dashboard. Review the top and bottom three ad creatives by cost per order. Decide whether the current campaign continues into next week, gets a creative pivot, or gets killed. The founder is invited and expected to make the kill decision when the numbers warrant it.
Every Monday review meeting eventually reaches the moment where somebody points at the flat performing creative and asks if the founder wants to give it one more week. The founder always says yes. The creative always underperforms for a second week. Nobody remembers who first suggested the extra week. Somewhere in the archive of every apparel brand shared drive, a flat creative is quietly generating more Monday meetings about itself than actual orders about anything on the site.
The kill rule is simple and it holds across every campaign archetype. Day 3 return on ad spend below 40 percent of target and day 7 return below 60 percent of target triggers a 24 hour creative pivot or a full kill. Programs that hold underperforming campaigns for the full run out of hope produce the flat quarters founders learn to fear. Programs that kill fast and reallocate to the winners produce the compounding quarters that make the retainer worth its rate. Founders new to structured plans assume the kill decision hurts the numbers. In practice, killing a flat creative at week two frees the budget to double down on the winner and grows the campaign result 20 to 45 percent inside the next 21 days on an apparel account.
Where fashion ecommerce marketing fits the wider stack
Fashion ecommerce marketing sits above the tactical channel work and below the annual brand strategy inside the growth stack. Every retainer allocation, every creative brief, and every founder decision on inventory rolls up to the five node plan the pod is running against. Programs that budget for tactics without the plan produce busy months with soft revenue. Programs that build the plan first produce quarters where every product page, every ad, and every email adds up to a single growth arc the founder can defend at a board meeting.
The retainer that runs the plan starts at $599 monthly on a 6 month contract and scales with revenue. The retainer covers merchandising audits, fit content templates, product page image direction, checkout audits, retention flow builds, weekly review meetings, and quarterly server side tracking audits. Founders scoping the wider agency side should also read our apparel fashion marketing hub for the broader deliverable list and pricing tiers by revenue band.
The retainer scales with revenue band, deliverable scope, and the number of active campaigns per quarter. A brand at $80,000 monthly runs a lean retainer with the founder in the review meeting. A brand at $600,000 monthly runs a fuller retainer with a dedicated pod and monthly media mix modeling reads. Every retainer tier ties back to the five node stack the plan requires, and every quarterly review closes the loop between the tactical channel work and the strategic growth arc the founder is defending on the P and L. Two outside reads worth an hour before the first plan cycle kicks off. Meta catalog quality reference above for feed hygiene. The Business of Fashion opinions section for the macro context that shapes which trends deserve budget in a given quarter on the merchandising side.
Checkout on apparel carries a size selector as the first field, not the last. Programs that push size selection to a second step lose 4 to 9 percent conversion rate on the same traffic because the mobile buyer scrolls twice for a decision the desktop pattern buries. The mobile buyer decides in under six seconds whether the flow feels safe. Every friction point in that window costs margin.
The checkout structure that respects sizing
The size selector sits directly under the price, above the add to cart button. Sold out sizes stay visible with a strikethrough, not hidden, so the buyer reads the size chart against the availability without a filter reset. A restock notification input replaces the add to cart button on the sold out size. On mobile, the size selector expands into a tap sheet that shows the size chart and fit review pull quotes on the same swipe. That single pattern grows completed checkout rate 6 to 12 percent on apparel accounts we have measured inside 21 days of the deploy.
Shipping and returns copy at the payment step
Shipping thresholds, return windows, and exchange policy live inline at the payment step, not on a footer page. Apparel buyers who read the return policy at cart complete checkout 18 to 30 percent more often than buyers who never see it, and the return rate on those orders drops 2 to 5 percentage points because the buyer bought with the exchange window in mind. Founders who bury return policy on a footer link are trading the transparency dividend for a false conversion gain that costs margin on the back end.
Paid social inside fashion ecommerce marketing
Paid social carries 45 to 60 percent of first order revenue on DTC apparel between $80,000 and $600,000 monthly. Meta and TikTok are the two platforms that fund. Every other platform enters through a 90 day pilot with a hard kill date, not a slow bleed into the always on budget.
Creative velocity as the real budget
Paid social on apparel wins on creative velocity, not media budget. A brand shipping 6 to 12 fresh creative variants weekly across static, Reel, and TikTok formats produces 30 to 60 percent lower cost per order than the same brand shipping 2 to 3 variants weekly on the same media budget. Fashion audiences fatigue creative inside 5 to 9 days on the same face and product angle. The retainer needs to feed that fatigue rate, not fight it, and the creative production line has to run on a weekly cadence with a named producer.
The catalog feed that carries Shopping
Meta Advantage Plus Shopping and TikTok Shop pull directly from the Shopify product feed. Programs that let the feed run on default titles and default images produce 40 to 70 percent higher cost per order than programs that rewrite the top 40 SKU feed titles and swap the primary feed image to the highest performing lifestyle shot. Feed hygiene is the cheapest paid social gain available on an apparel account and the one most founders never open. Meta’s catalog quality reference covers the field level rules that shape delivery.
Retention inside fashion ecommerce marketing
Retention is the layer that decides whether the P and L runs on margin or grinds through paid acquisition to break even. A DTC apparel brand with a 30 percent day 90 repeat rate runs 20 to 35 percent more contribution margin per blended dollar of spend than the same brand at 15 percent. Retention is not one channel. It is a stack of email, SMS, loyalty, and post purchase content on a monthly calendar.
Email and SMS as the core
Email drives 25 to 35 percent of DTC apparel revenue when the flow set is complete. Welcome, browse abandonment, cart abandonment, post purchase, replenishment, VIP, and win back are the seven flows every brand needs live inside the first 90 days. SMS adds another 8 to 15 percent of revenue at a 5 to 12 percent list opt in rate. Klaviyo and Attentive dominate the DTC apparel tool stack because the two platforms handle 90 percent of the flow logic without custom development. Our what is fashion marketing primer covers how the retention layer plugs into the wider channel mix.
Post purchase content that grows LTV
Post purchase content covers the four weeks after delivery on a first order. Styling emails that pair the purchased SKU with three complementary pieces. A fit review request at day seven when the buyer has worn the garment twice. A community moment at day fourteen with user photos of the same SKU. A second order incentive at day 28 with a category adjacent recommendation. Programs that publish the full post purchase sequence grow lifetime value 22 to 45 percent by month twelve on the same first order cohort, and the retention layer starts to carry the revenue growth the paid team used to carry alone.
Benchmarks inside fashion ecommerce marketing
Benchmarks make the plan honest. A DTC apparel brand reads its own numbers against the industry median every quarter and acts on the gaps that show up. Conversion rate. Blended cost per order. Return rate. Repeat purchase rate. Email revenue share. Each has an honest median for the revenue band, and the numbers change slowly year over year.
| Revenue band | Conversion rate | Blended CPO | Return rate (womenswear) | Day 90 repeat rate | Email revenue share |
|---|---|---|---|---|---|
| Under $80K monthly | 1.2% to 1.8% | $38 to $54 | 26% to 34% | 10% to 18% | 18% to 26% |
| $80K to $250K monthly | 1.6% to 2.4% | $28 to $46 | 24% to 32% | 16% to 24% | 22% to 30% |
| $250K to $600K monthly | 2.0% to 2.8% | $22 to $38 | 22% to 30% | 22% to 32% | 26% to 34% |
| $600K to $1.5M monthly | 2.4% to 3.4% | $18 to $32 | 20% to 28% | 28% to 38% | 28% to 36% |
| Above $1.5M monthly | 2.8% to 4.0% | $16 to $28 | 18% to 26% | 32% to 45% | 30% to 38% |
A founder who reads a monthly dashboard against these benchmarks catches the drift inside 30 days and adjusts the plan before the quarter closes. A founder who reads only the paid social dashboard catches the drift 90 days late, which usually means the correction shows up in the next quarter revenue instead of the current one. That single reporting habit is the difference between an apparel plan that grows and an apparel plan that runs in place while the founder wonders what actually changed under the surface. Founders scoping the wider paid team should read our fashion marketing agency guide for the retainer scope that sits above these benchmark reads.
How do you measure fashion ecommerce marketing honestly
Honest measurement of fashion ecommerce marketing runs on four data streams reconciled inside one weekly dashboard. Shopify revenue by UTM and discount code. Google Analytics 4 sessions and assisted conversion. Meta and TikTok ads platform attribution. A post purchase survey on every order that asks where the buyer first saw the brand. Each stream lies on its own.
The single biggest reporting mistake is trusting Meta own return on ad spend number as the campaign result. Meta over reports by 30 to 90 percent on apparel accounts because the pixel double counts view through and click through revenue that would have converted anyway. Google Analytics 4 under reports because the model discounts paid social influence on longer consideration windows. Shopify tells the truth on first order revenue but nothing on assisted revenue. Post purchase surveys catch the audience that saw the campaign on TikTok, searched a week later, and bought through direct traffic. The four streams together reconcile inside a 5 to 8 percent margin on a well tagged apparel account. Google’s attribution model documentation is the source every founder should read before arguing about which number is correct.
Every plan reports campaign level revenue against the campaign level budget with a 7 day and 30 day view. Anything shorter than 7 days is noise on an apparel buying cycle. Anything longer than 30 days is too late to change the current campaign trajectory. The founder reads the dashboard once a week on Monday morning before the review meeting, not once at the end of the quarter when the numbers are already locked into a bad direction.
Fashion ecommerce marketing in production
Boogie Board came to our team with a DTC ecommerce program running the same problem most apparel brands run at $340,000 monthly. Product pages with four images per SKU, no fit content on the size selector, a checkout that pushed size to step two on mobile, cost per acquisition at $150.92 and climbing, and a founder who read the paid social dashboard at face value every Monday. The plan looked busy on paper. The margin math looked thin on the P and L.
Our team rebuilt the ecommerce path around the five node stack. Rewrote the product page template with 8 to 12 images per SKU, garment measurements at the SKU level, and fit review pull quotes below the size selector. Moved size selection to first field at the top of the mobile checkout. Rebuilt the top 40 SKU catalog feed with lifestyle imagery and hand written titles. Turned on the seven core Klaviyo flows and a Attentive SMS list at week three. Server side tracking went in through Elevar in week two. Weekly Monday review meetings replaced the end of month post mortem, with the founder in the room and empowered to kill a campaign at week two.
Twelve months in, blended cost per acquisition dropped to $31. Conversion rate on the paid landing pages climbed 11 percent. Return rate on womenswear dropped from 38 percent to 26 percent. Day 90 repeat purchase rate grew from 22 percent to 41 percent. Managed ad budget grew to $650,000 monthly on the same margin profile. The result did not come from a magic new channel. It came from applying the five node stack, the checkout discipline, and the review cadence the plan required from day one.
The weekly review that keeps the plan honest
The Monday review meeting is where an apparel plan earns the right to keep spending. Forty five minutes, three agenda items, one decision. Read the reconciled dashboard. Review the top and bottom three ad creatives by cost per order. Decide whether the current campaign continues into next week, gets a creative pivot, or gets killed. The founder is invited and expected to make the kill decision when the numbers warrant it.
Every Monday review meeting eventually reaches the moment where somebody points at the flat performing creative and asks if the founder wants to give it one more week. The founder always says yes. The creative always underperforms for a second week. Nobody remembers who first suggested the extra week. Somewhere in the archive of every apparel brand shared drive, a flat creative is quietly generating more Monday meetings about itself than actual orders about anything on the site.
The kill rule is simple and it holds across every campaign archetype. Day 3 return on ad spend below 40 percent of target and day 7 return below 60 percent of target triggers a 24 hour creative pivot or a full kill. Programs that hold underperforming campaigns for the full run out of hope produce the flat quarters founders learn to fear. Programs that kill fast and reallocate to the winners produce the compounding quarters that make the retainer worth its rate. Founders new to structured plans assume the kill decision hurts the numbers. In practice, killing a flat creative at week two frees the budget to double down on the winner and grows the campaign result 20 to 45 percent inside the next 21 days on an apparel account.
Where fashion ecommerce marketing fits the wider stack
Fashion ecommerce marketing sits above the tactical channel work and below the annual brand strategy inside the growth stack. Every retainer allocation, every creative brief, and every founder decision on inventory rolls up to the five node plan the pod is running against. Programs that budget for tactics without the plan produce busy months with soft revenue. Programs that build the plan first produce quarters where every product page, every ad, and every email adds up to a single growth arc the founder can defend at a board meeting.
The retainer that runs the plan starts at $599 monthly on a 6 month contract and scales with revenue. The retainer covers merchandising audits, fit content templates, product page image direction, checkout audits, retention flow builds, weekly review meetings, and quarterly server side tracking audits. Founders scoping the wider agency side should also read our apparel fashion marketing hub for the broader deliverable list and pricing tiers by revenue band.
The retainer scales with revenue band, deliverable scope, and the number of active campaigns per quarter. A brand at $80,000 monthly runs a lean retainer with the founder in the review meeting. A brand at $600,000 monthly runs a fuller retainer with a dedicated pod and monthly media mix modeling reads. Every retainer tier ties back to the five node stack the plan requires, and every quarterly review closes the loop between the tactical channel work and the strategic growth arc the founder is defending on the P and L. Two outside reads worth an hour before the first plan cycle kicks off. Meta catalog quality reference above for feed hygiene. The Business of Fashion opinions section for the macro context that shapes which trends deserve budget in a given quarter on the merchandising side.
Return rate is the single margin killer on DTC apparel. Womenswear runs 22 to 30 percent, menswear 12 to 18 percent, accessories 6 to 10 percent. Two thirds of apparel returns cite fit or size as the reason. Fashion ecommerce marketing that ignores fit content spends the paid social budget twice on every return that goes back into inventory.
The plan builds a fit content stack on every SKU. Model height and size worn in the product description. Garment measurements at the SKU level, not the style level. Fit review notes pulled from customer reviews on a dedicated Fit tab. Size guides at the collection level with the actual measurement method photographed. Programs that publish the full fit stack on every SKU cut return rate 4 to 9 percentage points inside two quarters, which is the biggest margin move available in apparel without a supply chain change.
Where the fit content lives on the page
Fit content lives above the fold on desktop and inside the third scroll on mobile. The size chart lives one tap deep from the size selector, not three clicks deep behind a footer link. Fit review pull quotes live directly below the size selector so the buyer reads what the size chart says and what other buyers actually experienced in the same tap. That single change grows conversion rate 6 to 14 percent on apparel accounts we have tested inside 30 days, and it costs nothing in creative production because the copy already exists in the review corpus.
Fit tech worth funding
True Fit, Fit Analytics, and Bold Metrics carry the automated fit recommendation layer on scaled apparel programs. Each pulls buyer inputs (height, weight, common size in another brand) and recommends a size at add to cart. Return rate drops 3 to 7 percentage points on the SKUs where the tool is live and the buyer engages with the input flow. Below $250,000 monthly, the tool license outruns the return savings. Above $600,000 monthly, the math flips and the tool pays for itself inside a quarter.
Product page imagery inside fashion ecommerce marketing
Product page imagery is where a paid social click either converts or bounces inside eight seconds. The industry median product page ships four images per SKU. The winners ship eight to twelve, and every image answers a specific buyer question the paid ad already primed.
The imagery stack per SKU
A working stack per SKU carries model shot on size medium, model shot on size extra large or size fourteen so the buyer sees the fit at range, flat lay on a neutral ground for the utility view, detail shot on the fabric texture, detail shot on the hardware and stitching, back view on the model, side view on the model, movement clip of 4 to 8 seconds, and a scale shot next to a familiar object for accessories. Programs that publish all twelve image slots grow conversion rate 8 to 22 percent against the four image baseline, and Meta gets richer feed asset variants to test in the ad set.
Video that earns its production cost
Product page video works when it stays under 10 seconds, loops on autoplay, mutes by default, and shows movement the still shot cannot. Longer videos hurt page load and buyer patience without a conversion gain. A DTC apparel brand doing $340,000 monthly should budget $60,000 to $140,000 annually on product page video across the top 40 SKUs by contribution margin. Below that budget, the video shoot day math does not work and the founder ships either thin coverage on all SKUs or full coverage on the wrong ones. Shopify’s product photography guide is a useful outside read for founders scoping a first shoot.
Checkout inside fashion ecommerce marketing
Checkout on apparel carries a size selector as the first field, not the last. Programs that push size selection to a second step lose 4 to 9 percent conversion rate on the same traffic because the mobile buyer scrolls twice for a decision the desktop pattern buries. The mobile buyer decides in under six seconds whether the flow feels safe. Every friction point in that window costs margin.
The checkout structure that respects sizing
The size selector sits directly under the price, above the add to cart button. Sold out sizes stay visible with a strikethrough, not hidden, so the buyer reads the size chart against the availability without a filter reset. A restock notification input replaces the add to cart button on the sold out size. On mobile, the size selector expands into a tap sheet that shows the size chart and fit review pull quotes on the same swipe. That single pattern grows completed checkout rate 6 to 12 percent on apparel accounts we have measured inside 21 days of the deploy.
Shipping and returns copy at the payment step
Shipping thresholds, return windows, and exchange policy live inline at the payment step, not on a footer page. Apparel buyers who read the return policy at cart complete checkout 18 to 30 percent more often than buyers who never see it, and the return rate on those orders drops 2 to 5 percentage points because the buyer bought with the exchange window in mind. Founders who bury return policy on a footer link are trading the transparency dividend for a false conversion gain that costs margin on the back end.
Paid social inside fashion ecommerce marketing
Paid social carries 45 to 60 percent of first order revenue on DTC apparel between $80,000 and $600,000 monthly. Meta and TikTok are the two platforms that fund. Every other platform enters through a 90 day pilot with a hard kill date, not a slow bleed into the always on budget.
Creative velocity as the real budget
Paid social on apparel wins on creative velocity, not media budget. A brand shipping 6 to 12 fresh creative variants weekly across static, Reel, and TikTok formats produces 30 to 60 percent lower cost per order than the same brand shipping 2 to 3 variants weekly on the same media budget. Fashion audiences fatigue creative inside 5 to 9 days on the same face and product angle. The retainer needs to feed that fatigue rate, not fight it, and the creative production line has to run on a weekly cadence with a named producer.
The catalog feed that carries Shopping
Meta Advantage Plus Shopping and TikTok Shop pull directly from the Shopify product feed. Programs that let the feed run on default titles and default images produce 40 to 70 percent higher cost per order than programs that rewrite the top 40 SKU feed titles and swap the primary feed image to the highest performing lifestyle shot. Feed hygiene is the cheapest paid social gain available on an apparel account and the one most founders never open. Meta’s catalog quality reference covers the field level rules that shape delivery.
Retention inside fashion ecommerce marketing
Retention is the layer that decides whether the P and L runs on margin or grinds through paid acquisition to break even. A DTC apparel brand with a 30 percent day 90 repeat rate runs 20 to 35 percent more contribution margin per blended dollar of spend than the same brand at 15 percent. Retention is not one channel. It is a stack of email, SMS, loyalty, and post purchase content on a monthly calendar.
Email and SMS as the core
Email drives 25 to 35 percent of DTC apparel revenue when the flow set is complete. Welcome, browse abandonment, cart abandonment, post purchase, replenishment, VIP, and win back are the seven flows every brand needs live inside the first 90 days. SMS adds another 8 to 15 percent of revenue at a 5 to 12 percent list opt in rate. Klaviyo and Attentive dominate the DTC apparel tool stack because the two platforms handle 90 percent of the flow logic without custom development. Our what is fashion marketing primer covers how the retention layer plugs into the wider channel mix.
Post purchase content that grows LTV
Post purchase content covers the four weeks after delivery on a first order. Styling emails that pair the purchased SKU with three complementary pieces. A fit review request at day seven when the buyer has worn the garment twice. A community moment at day fourteen with user photos of the same SKU. A second order incentive at day 28 with a category adjacent recommendation. Programs that publish the full post purchase sequence grow lifetime value 22 to 45 percent by month twelve on the same first order cohort, and the retention layer starts to carry the revenue growth the paid team used to carry alone.
Benchmarks inside fashion ecommerce marketing
Benchmarks make the plan honest. A DTC apparel brand reads its own numbers against the industry median every quarter and acts on the gaps that show up. Conversion rate. Blended cost per order. Return rate. Repeat purchase rate. Email revenue share. Each has an honest median for the revenue band, and the numbers change slowly year over year.
| Revenue band | Conversion rate | Blended CPO | Return rate (womenswear) | Day 90 repeat rate | Email revenue share |
|---|---|---|---|---|---|
| Under $80K monthly | 1.2% to 1.8% | $38 to $54 | 26% to 34% | 10% to 18% | 18% to 26% |
| $80K to $250K monthly | 1.6% to 2.4% | $28 to $46 | 24% to 32% | 16% to 24% | 22% to 30% |
| $250K to $600K monthly | 2.0% to 2.8% | $22 to $38 | 22% to 30% | 22% to 32% | 26% to 34% |
| $600K to $1.5M monthly | 2.4% to 3.4% | $18 to $32 | 20% to 28% | 28% to 38% | 28% to 36% |
| Above $1.5M monthly | 2.8% to 4.0% | $16 to $28 | 18% to 26% | 32% to 45% | 30% to 38% |
A founder who reads a monthly dashboard against these benchmarks catches the drift inside 30 days and adjusts the plan before the quarter closes. A founder who reads only the paid social dashboard catches the drift 90 days late, which usually means the correction shows up in the next quarter revenue instead of the current one. That single reporting habit is the difference between an apparel plan that grows and an apparel plan that runs in place while the founder wonders what actually changed under the surface. Founders scoping the wider paid team should read our fashion marketing agency guide for the retainer scope that sits above these benchmark reads.
How do you measure fashion ecommerce marketing honestly
Honest measurement of fashion ecommerce marketing runs on four data streams reconciled inside one weekly dashboard. Shopify revenue by UTM and discount code. Google Analytics 4 sessions and assisted conversion. Meta and TikTok ads platform attribution. A post purchase survey on every order that asks where the buyer first saw the brand. Each stream lies on its own.
The single biggest reporting mistake is trusting Meta own return on ad spend number as the campaign result. Meta over reports by 30 to 90 percent on apparel accounts because the pixel double counts view through and click through revenue that would have converted anyway. Google Analytics 4 under reports because the model discounts paid social influence on longer consideration windows. Shopify tells the truth on first order revenue but nothing on assisted revenue. Post purchase surveys catch the audience that saw the campaign on TikTok, searched a week later, and bought through direct traffic. The four streams together reconcile inside a 5 to 8 percent margin on a well tagged apparel account. Google’s attribution model documentation is the source every founder should read before arguing about which number is correct.
Every plan reports campaign level revenue against the campaign level budget with a 7 day and 30 day view. Anything shorter than 7 days is noise on an apparel buying cycle. Anything longer than 30 days is too late to change the current campaign trajectory. The founder reads the dashboard once a week on Monday morning before the review meeting, not once at the end of the quarter when the numbers are already locked into a bad direction.
Fashion ecommerce marketing in production
Boogie Board came to our team with a DTC ecommerce program running the same problem most apparel brands run at $340,000 monthly. Product pages with four images per SKU, no fit content on the size selector, a checkout that pushed size to step two on mobile, cost per acquisition at $150.92 and climbing, and a founder who read the paid social dashboard at face value every Monday. The plan looked busy on paper. The margin math looked thin on the P and L.
Our team rebuilt the ecommerce path around the five node stack. Rewrote the product page template with 8 to 12 images per SKU, garment measurements at the SKU level, and fit review pull quotes below the size selector. Moved size selection to first field at the top of the mobile checkout. Rebuilt the top 40 SKU catalog feed with lifestyle imagery and hand written titles. Turned on the seven core Klaviyo flows and a Attentive SMS list at week three. Server side tracking went in through Elevar in week two. Weekly Monday review meetings replaced the end of month post mortem, with the founder in the room and empowered to kill a campaign at week two.
Twelve months in, blended cost per acquisition dropped to $31. Conversion rate on the paid landing pages climbed 11 percent. Return rate on womenswear dropped from 38 percent to 26 percent. Day 90 repeat purchase rate grew from 22 percent to 41 percent. Managed ad budget grew to $650,000 monthly on the same margin profile. The result did not come from a magic new channel. It came from applying the five node stack, the checkout discipline, and the review cadence the plan required from day one.
The weekly review that keeps the plan honest
The Monday review meeting is where an apparel plan earns the right to keep spending. Forty five minutes, three agenda items, one decision. Read the reconciled dashboard. Review the top and bottom three ad creatives by cost per order. Decide whether the current campaign continues into next week, gets a creative pivot, or gets killed. The founder is invited and expected to make the kill decision when the numbers warrant it.
Every Monday review meeting eventually reaches the moment where somebody points at the flat performing creative and asks if the founder wants to give it one more week. The founder always says yes. The creative always underperforms for a second week. Nobody remembers who first suggested the extra week. Somewhere in the archive of every apparel brand shared drive, a flat creative is quietly generating more Monday meetings about itself than actual orders about anything on the site.
The kill rule is simple and it holds across every campaign archetype. Day 3 return on ad spend below 40 percent of target and day 7 return below 60 percent of target triggers a 24 hour creative pivot or a full kill. Programs that hold underperforming campaigns for the full run out of hope produce the flat quarters founders learn to fear. Programs that kill fast and reallocate to the winners produce the compounding quarters that make the retainer worth its rate. Founders new to structured plans assume the kill decision hurts the numbers. In practice, killing a flat creative at week two frees the budget to double down on the winner and grows the campaign result 20 to 45 percent inside the next 21 days on an apparel account.
Where fashion ecommerce marketing fits the wider stack
Fashion ecommerce marketing sits above the tactical channel work and below the annual brand strategy inside the growth stack. Every retainer allocation, every creative brief, and every founder decision on inventory rolls up to the five node plan the pod is running against. Programs that budget for tactics without the plan produce busy months with soft revenue. Programs that build the plan first produce quarters where every product page, every ad, and every email adds up to a single growth arc the founder can defend at a board meeting.
The retainer that runs the plan starts at $599 monthly on a 6 month contract and scales with revenue. The retainer covers merchandising audits, fit content templates, product page image direction, checkout audits, retention flow builds, weekly review meetings, and quarterly server side tracking audits. Founders scoping the wider agency side should also read our apparel fashion marketing hub for the broader deliverable list and pricing tiers by revenue band.
The retainer scales with revenue band, deliverable scope, and the number of active campaigns per quarter. A brand at $80,000 monthly runs a lean retainer with the founder in the review meeting. A brand at $600,000 monthly runs a fuller retainer with a dedicated pod and monthly media mix modeling reads. Every retainer tier ties back to the five node stack the plan requires, and every quarterly review closes the loop between the tactical channel work and the strategic growth arc the founder is defending on the P and L. Two outside reads worth an hour before the first plan cycle kicks off. Meta catalog quality reference above for feed hygiene. The Business of Fashion opinions section for the macro context that shapes which trends deserve budget in a given quarter on the merchandising side.
Product page imagery is where a paid social click either converts or bounces inside eight seconds. The industry median product page ships four images per SKU. The winners ship eight to twelve, and every image answers a specific buyer question the paid ad already primed.
The imagery stack per SKU
A working stack per SKU carries model shot on size medium, model shot on size extra large or size fourteen so the buyer sees the fit at range, flat lay on a neutral ground for the utility view, detail shot on the fabric texture, detail shot on the hardware and stitching, back view on the model, side view on the model, movement clip of 4 to 8 seconds, and a scale shot next to a familiar object for accessories. Programs that publish all twelve image slots grow conversion rate 8 to 22 percent against the four image baseline, and Meta gets richer feed asset variants to test in the ad set.
Video that earns its production cost
Product page video works when it stays under 10 seconds, loops on autoplay, mutes by default, and shows movement the still shot cannot. Longer videos hurt page load and buyer patience without a conversion gain. A DTC apparel brand doing $340,000 monthly should budget $60,000 to $140,000 annually on product page video across the top 40 SKUs by contribution margin. Below that budget, the video shoot day math does not work and the founder ships either thin coverage on all SKUs or full coverage on the wrong ones. Shopify’s product photography guide is a useful outside read for founders scoping a first shoot.
Checkout inside fashion ecommerce marketing
Checkout on apparel carries a size selector as the first field, not the last. Programs that push size selection to a second step lose 4 to 9 percent conversion rate on the same traffic because the mobile buyer scrolls twice for a decision the desktop pattern buries. The mobile buyer decides in under six seconds whether the flow feels safe. Every friction point in that window costs margin.
The checkout structure that respects sizing
The size selector sits directly under the price, above the add to cart button. Sold out sizes stay visible with a strikethrough, not hidden, so the buyer reads the size chart against the availability without a filter reset. A restock notification input replaces the add to cart button on the sold out size. On mobile, the size selector expands into a tap sheet that shows the size chart and fit review pull quotes on the same swipe. That single pattern grows completed checkout rate 6 to 12 percent on apparel accounts we have measured inside 21 days of the deploy.
Shipping and returns copy at the payment step
Shipping thresholds, return windows, and exchange policy live inline at the payment step, not on a footer page. Apparel buyers who read the return policy at cart complete checkout 18 to 30 percent more often than buyers who never see it, and the return rate on those orders drops 2 to 5 percentage points because the buyer bought with the exchange window in mind. Founders who bury return policy on a footer link are trading the transparency dividend for a false conversion gain that costs margin on the back end.
Paid social inside fashion ecommerce marketing
Paid social carries 45 to 60 percent of first order revenue on DTC apparel between $80,000 and $600,000 monthly. Meta and TikTok are the two platforms that fund. Every other platform enters through a 90 day pilot with a hard kill date, not a slow bleed into the always on budget.
Creative velocity as the real budget
Paid social on apparel wins on creative velocity, not media budget. A brand shipping 6 to 12 fresh creative variants weekly across static, Reel, and TikTok formats produces 30 to 60 percent lower cost per order than the same brand shipping 2 to 3 variants weekly on the same media budget. Fashion audiences fatigue creative inside 5 to 9 days on the same face and product angle. The retainer needs to feed that fatigue rate, not fight it, and the creative production line has to run on a weekly cadence with a named producer.
The catalog feed that carries Shopping
Meta Advantage Plus Shopping and TikTok Shop pull directly from the Shopify product feed. Programs that let the feed run on default titles and default images produce 40 to 70 percent higher cost per order than programs that rewrite the top 40 SKU feed titles and swap the primary feed image to the highest performing lifestyle shot. Feed hygiene is the cheapest paid social gain available on an apparel account and the one most founders never open. Meta’s catalog quality reference covers the field level rules that shape delivery.
Retention inside fashion ecommerce marketing
Retention is the layer that decides whether the P and L runs on margin or grinds through paid acquisition to break even. A DTC apparel brand with a 30 percent day 90 repeat rate runs 20 to 35 percent more contribution margin per blended dollar of spend than the same brand at 15 percent. Retention is not one channel. It is a stack of email, SMS, loyalty, and post purchase content on a monthly calendar.
Email and SMS as the core
Email drives 25 to 35 percent of DTC apparel revenue when the flow set is complete. Welcome, browse abandonment, cart abandonment, post purchase, replenishment, VIP, and win back are the seven flows every brand needs live inside the first 90 days. SMS adds another 8 to 15 percent of revenue at a 5 to 12 percent list opt in rate. Klaviyo and Attentive dominate the DTC apparel tool stack because the two platforms handle 90 percent of the flow logic without custom development. Our what is fashion marketing primer covers how the retention layer plugs into the wider channel mix.
Post purchase content that grows LTV
Post purchase content covers the four weeks after delivery on a first order. Styling emails that pair the purchased SKU with three complementary pieces. A fit review request at day seven when the buyer has worn the garment twice. A community moment at day fourteen with user photos of the same SKU. A second order incentive at day 28 with a category adjacent recommendation. Programs that publish the full post purchase sequence grow lifetime value 22 to 45 percent by month twelve on the same first order cohort, and the retention layer starts to carry the revenue growth the paid team used to carry alone.
Benchmarks inside fashion ecommerce marketing
Benchmarks make the plan honest. A DTC apparel brand reads its own numbers against the industry median every quarter and acts on the gaps that show up. Conversion rate. Blended cost per order. Return rate. Repeat purchase rate. Email revenue share. Each has an honest median for the revenue band, and the numbers change slowly year over year.
| Revenue band | Conversion rate | Blended CPO | Return rate (womenswear) | Day 90 repeat rate | Email revenue share |
|---|---|---|---|---|---|
| Under $80K monthly | 1.2% to 1.8% | $38 to $54 | 26% to 34% | 10% to 18% | 18% to 26% |
| $80K to $250K monthly | 1.6% to 2.4% | $28 to $46 | 24% to 32% | 16% to 24% | 22% to 30% |
| $250K to $600K monthly | 2.0% to 2.8% | $22 to $38 | 22% to 30% | 22% to 32% | 26% to 34% |
| $600K to $1.5M monthly | 2.4% to 3.4% | $18 to $32 | 20% to 28% | 28% to 38% | 28% to 36% |
| Above $1.5M monthly | 2.8% to 4.0% | $16 to $28 | 18% to 26% | 32% to 45% | 30% to 38% |
A founder who reads a monthly dashboard against these benchmarks catches the drift inside 30 days and adjusts the plan before the quarter closes. A founder who reads only the paid social dashboard catches the drift 90 days late, which usually means the correction shows up in the next quarter revenue instead of the current one. That single reporting habit is the difference between an apparel plan that grows and an apparel plan that runs in place while the founder wonders what actually changed under the surface. Founders scoping the wider paid team should read our fashion marketing agency guide for the retainer scope that sits above these benchmark reads.
How do you measure fashion ecommerce marketing honestly
Honest measurement of fashion ecommerce marketing runs on four data streams reconciled inside one weekly dashboard. Shopify revenue by UTM and discount code. Google Analytics 4 sessions and assisted conversion. Meta and TikTok ads platform attribution. A post purchase survey on every order that asks where the buyer first saw the brand. Each stream lies on its own.
The single biggest reporting mistake is trusting Meta own return on ad spend number as the campaign result. Meta over reports by 30 to 90 percent on apparel accounts because the pixel double counts view through and click through revenue that would have converted anyway. Google Analytics 4 under reports because the model discounts paid social influence on longer consideration windows. Shopify tells the truth on first order revenue but nothing on assisted revenue. Post purchase surveys catch the audience that saw the campaign on TikTok, searched a week later, and bought through direct traffic. The four streams together reconcile inside a 5 to 8 percent margin on a well tagged apparel account. Google’s attribution model documentation is the source every founder should read before arguing about which number is correct.
Every plan reports campaign level revenue against the campaign level budget with a 7 day and 30 day view. Anything shorter than 7 days is noise on an apparel buying cycle. Anything longer than 30 days is too late to change the current campaign trajectory. The founder reads the dashboard once a week on Monday morning before the review meeting, not once at the end of the quarter when the numbers are already locked into a bad direction.
Fashion ecommerce marketing in production
Boogie Board came to our team with a DTC ecommerce program running the same problem most apparel brands run at $340,000 monthly. Product pages with four images per SKU, no fit content on the size selector, a checkout that pushed size to step two on mobile, cost per acquisition at $150.92 and climbing, and a founder who read the paid social dashboard at face value every Monday. The plan looked busy on paper. The margin math looked thin on the P and L.
Our team rebuilt the ecommerce path around the five node stack. Rewrote the product page template with 8 to 12 images per SKU, garment measurements at the SKU level, and fit review pull quotes below the size selector. Moved size selection to first field at the top of the mobile checkout. Rebuilt the top 40 SKU catalog feed with lifestyle imagery and hand written titles. Turned on the seven core Klaviyo flows and a Attentive SMS list at week three. Server side tracking went in through Elevar in week two. Weekly Monday review meetings replaced the end of month post mortem, with the founder in the room and empowered to kill a campaign at week two.
Twelve months in, blended cost per acquisition dropped to $31. Conversion rate on the paid landing pages climbed 11 percent. Return rate on womenswear dropped from 38 percent to 26 percent. Day 90 repeat purchase rate grew from 22 percent to 41 percent. Managed ad budget grew to $650,000 monthly on the same margin profile. The result did not come from a magic new channel. It came from applying the five node stack, the checkout discipline, and the review cadence the plan required from day one.
The weekly review that keeps the plan honest
The Monday review meeting is where an apparel plan earns the right to keep spending. Forty five minutes, three agenda items, one decision. Read the reconciled dashboard. Review the top and bottom three ad creatives by cost per order. Decide whether the current campaign continues into next week, gets a creative pivot, or gets killed. The founder is invited and expected to make the kill decision when the numbers warrant it.
Every Monday review meeting eventually reaches the moment where somebody points at the flat performing creative and asks if the founder wants to give it one more week. The founder always says yes. The creative always underperforms for a second week. Nobody remembers who first suggested the extra week. Somewhere in the archive of every apparel brand shared drive, a flat creative is quietly generating more Monday meetings about itself than actual orders about anything on the site.
The kill rule is simple and it holds across every campaign archetype. Day 3 return on ad spend below 40 percent of target and day 7 return below 60 percent of target triggers a 24 hour creative pivot or a full kill. Programs that hold underperforming campaigns for the full run out of hope produce the flat quarters founders learn to fear. Programs that kill fast and reallocate to the winners produce the compounding quarters that make the retainer worth its rate. Founders new to structured plans assume the kill decision hurts the numbers. In practice, killing a flat creative at week two frees the budget to double down on the winner and grows the campaign result 20 to 45 percent inside the next 21 days on an apparel account.
Where fashion ecommerce marketing fits the wider stack
Fashion ecommerce marketing sits above the tactical channel work and below the annual brand strategy inside the growth stack. Every retainer allocation, every creative brief, and every founder decision on inventory rolls up to the five node plan the pod is running against. Programs that budget for tactics without the plan produce busy months with soft revenue. Programs that build the plan first produce quarters where every product page, every ad, and every email adds up to a single growth arc the founder can defend at a board meeting.
The retainer that runs the plan starts at $599 monthly on a 6 month contract and scales with revenue. The retainer covers merchandising audits, fit content templates, product page image direction, checkout audits, retention flow builds, weekly review meetings, and quarterly server side tracking audits. Founders scoping the wider agency side should also read our apparel fashion marketing hub for the broader deliverable list and pricing tiers by revenue band.
The retainer scales with revenue band, deliverable scope, and the number of active campaigns per quarter. A brand at $80,000 monthly runs a lean retainer with the founder in the review meeting. A brand at $600,000 monthly runs a fuller retainer with a dedicated pod and monthly media mix modeling reads. Every retainer tier ties back to the five node stack the plan requires, and every quarterly review closes the loop between the tactical channel work and the strategic growth arc the founder is defending on the P and L. Two outside reads worth an hour before the first plan cycle kicks off. Meta catalog quality reference above for feed hygiene. The Business of Fashion opinions section for the macro context that shapes which trends deserve budget in a given quarter on the merchandising side.
Return rate is the single margin killer on DTC apparel. Womenswear runs 22 to 30 percent, menswear 12 to 18 percent, accessories 6 to 10 percent. Two thirds of apparel returns cite fit or size as the reason. Fashion ecommerce marketing that ignores fit content spends the paid social budget twice on every return that goes back into inventory.
The plan builds a fit content stack on every SKU. Model height and size worn in the product description. Garment measurements at the SKU level, not the style level. Fit review notes pulled from customer reviews on a dedicated Fit tab. Size guides at the collection level with the actual measurement method photographed. Programs that publish the full fit stack on every SKU cut return rate 4 to 9 percentage points inside two quarters, which is the biggest margin move available in apparel without a supply chain change.
Where the fit content lives on the page
Fit content lives above the fold on desktop and inside the third scroll on mobile. The size chart lives one tap deep from the size selector, not three clicks deep behind a footer link. Fit review pull quotes live directly below the size selector so the buyer reads what the size chart says and what other buyers actually experienced in the same tap. That single change grows conversion rate 6 to 14 percent on apparel accounts we have tested inside 30 days, and it costs nothing in creative production because the copy already exists in the review corpus.
Fit tech worth funding
True Fit, Fit Analytics, and Bold Metrics carry the automated fit recommendation layer on scaled apparel programs. Each pulls buyer inputs (height, weight, common size in another brand) and recommends a size at add to cart. Return rate drops 3 to 7 percentage points on the SKUs where the tool is live and the buyer engages with the input flow. Below $250,000 monthly, the tool license outruns the return savings. Above $600,000 monthly, the math flips and the tool pays for itself inside a quarter.
Product page imagery inside fashion ecommerce marketing
Product page imagery is where a paid social click either converts or bounces inside eight seconds. The industry median product page ships four images per SKU. The winners ship eight to twelve, and every image answers a specific buyer question the paid ad already primed.
The imagery stack per SKU
A working stack per SKU carries model shot on size medium, model shot on size extra large or size fourteen so the buyer sees the fit at range, flat lay on a neutral ground for the utility view, detail shot on the fabric texture, detail shot on the hardware and stitching, back view on the model, side view on the model, movement clip of 4 to 8 seconds, and a scale shot next to a familiar object for accessories. Programs that publish all twelve image slots grow conversion rate 8 to 22 percent against the four image baseline, and Meta gets richer feed asset variants to test in the ad set.
Video that earns its production cost
Product page video works when it stays under 10 seconds, loops on autoplay, mutes by default, and shows movement the still shot cannot. Longer videos hurt page load and buyer patience without a conversion gain. A DTC apparel brand doing $340,000 monthly should budget $60,000 to $140,000 annually on product page video across the top 40 SKUs by contribution margin. Below that budget, the video shoot day math does not work and the founder ships either thin coverage on all SKUs or full coverage on the wrong ones. Shopify’s product photography guide is a useful outside read for founders scoping a first shoot.
Checkout inside fashion ecommerce marketing
Checkout on apparel carries a size selector as the first field, not the last. Programs that push size selection to a second step lose 4 to 9 percent conversion rate on the same traffic because the mobile buyer scrolls twice for a decision the desktop pattern buries. The mobile buyer decides in under six seconds whether the flow feels safe. Every friction point in that window costs margin.
The checkout structure that respects sizing
The size selector sits directly under the price, above the add to cart button. Sold out sizes stay visible with a strikethrough, not hidden, so the buyer reads the size chart against the availability without a filter reset. A restock notification input replaces the add to cart button on the sold out size. On mobile, the size selector expands into a tap sheet that shows the size chart and fit review pull quotes on the same swipe. That single pattern grows completed checkout rate 6 to 12 percent on apparel accounts we have measured inside 21 days of the deploy.
Shipping and returns copy at the payment step
Shipping thresholds, return windows, and exchange policy live inline at the payment step, not on a footer page. Apparel buyers who read the return policy at cart complete checkout 18 to 30 percent more often than buyers who never see it, and the return rate on those orders drops 2 to 5 percentage points because the buyer bought with the exchange window in mind. Founders who bury return policy on a footer link are trading the transparency dividend for a false conversion gain that costs margin on the back end.
Paid social inside fashion ecommerce marketing
Paid social carries 45 to 60 percent of first order revenue on DTC apparel between $80,000 and $600,000 monthly. Meta and TikTok are the two platforms that fund. Every other platform enters through a 90 day pilot with a hard kill date, not a slow bleed into the always on budget.
Creative velocity as the real budget
Paid social on apparel wins on creative velocity, not media budget. A brand shipping 6 to 12 fresh creative variants weekly across static, Reel, and TikTok formats produces 30 to 60 percent lower cost per order than the same brand shipping 2 to 3 variants weekly on the same media budget. Fashion audiences fatigue creative inside 5 to 9 days on the same face and product angle. The retainer needs to feed that fatigue rate, not fight it, and the creative production line has to run on a weekly cadence with a named producer.
The catalog feed that carries Shopping
Meta Advantage Plus Shopping and TikTok Shop pull directly from the Shopify product feed. Programs that let the feed run on default titles and default images produce 40 to 70 percent higher cost per order than programs that rewrite the top 40 SKU feed titles and swap the primary feed image to the highest performing lifestyle shot. Feed hygiene is the cheapest paid social gain available on an apparel account and the one most founders never open. Meta’s catalog quality reference covers the field level rules that shape delivery.
Retention inside fashion ecommerce marketing
Retention is the layer that decides whether the P and L runs on margin or grinds through paid acquisition to break even. A DTC apparel brand with a 30 percent day 90 repeat rate runs 20 to 35 percent more contribution margin per blended dollar of spend than the same brand at 15 percent. Retention is not one channel. It is a stack of email, SMS, loyalty, and post purchase content on a monthly calendar.
Email and SMS as the core
Email drives 25 to 35 percent of DTC apparel revenue when the flow set is complete. Welcome, browse abandonment, cart abandonment, post purchase, replenishment, VIP, and win back are the seven flows every brand needs live inside the first 90 days. SMS adds another 8 to 15 percent of revenue at a 5 to 12 percent list opt in rate. Klaviyo and Attentive dominate the DTC apparel tool stack because the two platforms handle 90 percent of the flow logic without custom development. Our what is fashion marketing primer covers how the retention layer plugs into the wider channel mix.
Post purchase content that grows LTV
Post purchase content covers the four weeks after delivery on a first order. Styling emails that pair the purchased SKU with three complementary pieces. A fit review request at day seven when the buyer has worn the garment twice. A community moment at day fourteen with user photos of the same SKU. A second order incentive at day 28 with a category adjacent recommendation. Programs that publish the full post purchase sequence grow lifetime value 22 to 45 percent by month twelve on the same first order cohort, and the retention layer starts to carry the revenue growth the paid team used to carry alone.
Benchmarks inside fashion ecommerce marketing
Benchmarks make the plan honest. A DTC apparel brand reads its own numbers against the industry median every quarter and acts on the gaps that show up. Conversion rate. Blended cost per order. Return rate. Repeat purchase rate. Email revenue share. Each has an honest median for the revenue band, and the numbers change slowly year over year.
| Revenue band | Conversion rate | Blended CPO | Return rate (womenswear) | Day 90 repeat rate | Email revenue share |
|---|---|---|---|---|---|
| Under $80K monthly | 1.2% to 1.8% | $38 to $54 | 26% to 34% | 10% to 18% | 18% to 26% |
| $80K to $250K monthly | 1.6% to 2.4% | $28 to $46 | 24% to 32% | 16% to 24% | 22% to 30% |
| $250K to $600K monthly | 2.0% to 2.8% | $22 to $38 | 22% to 30% | 22% to 32% | 26% to 34% |
| $600K to $1.5M monthly | 2.4% to 3.4% | $18 to $32 | 20% to 28% | 28% to 38% | 28% to 36% |
| Above $1.5M monthly | 2.8% to 4.0% | $16 to $28 | 18% to 26% | 32% to 45% | 30% to 38% |
A founder who reads a monthly dashboard against these benchmarks catches the drift inside 30 days and adjusts the plan before the quarter closes. A founder who reads only the paid social dashboard catches the drift 90 days late, which usually means the correction shows up in the next quarter revenue instead of the current one. That single reporting habit is the difference between an apparel plan that grows and an apparel plan that runs in place while the founder wonders what actually changed under the surface. Founders scoping the wider paid team should read our fashion marketing agency guide for the retainer scope that sits above these benchmark reads.
How do you measure fashion ecommerce marketing honestly
Honest measurement of fashion ecommerce marketing runs on four data streams reconciled inside one weekly dashboard. Shopify revenue by UTM and discount code. Google Analytics 4 sessions and assisted conversion. Meta and TikTok ads platform attribution. A post purchase survey on every order that asks where the buyer first saw the brand. Each stream lies on its own.
The single biggest reporting mistake is trusting Meta own return on ad spend number as the campaign result. Meta over reports by 30 to 90 percent on apparel accounts because the pixel double counts view through and click through revenue that would have converted anyway. Google Analytics 4 under reports because the model discounts paid social influence on longer consideration windows. Shopify tells the truth on first order revenue but nothing on assisted revenue. Post purchase surveys catch the audience that saw the campaign on TikTok, searched a week later, and bought through direct traffic. The four streams together reconcile inside a 5 to 8 percent margin on a well tagged apparel account. Google’s attribution model documentation is the source every founder should read before arguing about which number is correct.
Every plan reports campaign level revenue against the campaign level budget with a 7 day and 30 day view. Anything shorter than 7 days is noise on an apparel buying cycle. Anything longer than 30 days is too late to change the current campaign trajectory. The founder reads the dashboard once a week on Monday morning before the review meeting, not once at the end of the quarter when the numbers are already locked into a bad direction.
Fashion ecommerce marketing in production
Boogie Board came to our team with a DTC ecommerce program running the same problem most apparel brands run at $340,000 monthly. Product pages with four images per SKU, no fit content on the size selector, a checkout that pushed size to step two on mobile, cost per acquisition at $150.92 and climbing, and a founder who read the paid social dashboard at face value every Monday. The plan looked busy on paper. The margin math looked thin on the P and L.
Our team rebuilt the ecommerce path around the five node stack. Rewrote the product page template with 8 to 12 images per SKU, garment measurements at the SKU level, and fit review pull quotes below the size selector. Moved size selection to first field at the top of the mobile checkout. Rebuilt the top 40 SKU catalog feed with lifestyle imagery and hand written titles. Turned on the seven core Klaviyo flows and a Attentive SMS list at week three. Server side tracking went in through Elevar in week two. Weekly Monday review meetings replaced the end of month post mortem, with the founder in the room and empowered to kill a campaign at week two.
Twelve months in, blended cost per acquisition dropped to $31. Conversion rate on the paid landing pages climbed 11 percent. Return rate on womenswear dropped from 38 percent to 26 percent. Day 90 repeat purchase rate grew from 22 percent to 41 percent. Managed ad budget grew to $650,000 monthly on the same margin profile. The result did not come from a magic new channel. It came from applying the five node stack, the checkout discipline, and the review cadence the plan required from day one.
The weekly review that keeps the plan honest
The Monday review meeting is where an apparel plan earns the right to keep spending. Forty five minutes, three agenda items, one decision. Read the reconciled dashboard. Review the top and bottom three ad creatives by cost per order. Decide whether the current campaign continues into next week, gets a creative pivot, or gets killed. The founder is invited and expected to make the kill decision when the numbers warrant it.
Every Monday review meeting eventually reaches the moment where somebody points at the flat performing creative and asks if the founder wants to give it one more week. The founder always says yes. The creative always underperforms for a second week. Nobody remembers who first suggested the extra week. Somewhere in the archive of every apparel brand shared drive, a flat creative is quietly generating more Monday meetings about itself than actual orders about anything on the site.
The kill rule is simple and it holds across every campaign archetype. Day 3 return on ad spend below 40 percent of target and day 7 return below 60 percent of target triggers a 24 hour creative pivot or a full kill. Programs that hold underperforming campaigns for the full run out of hope produce the flat quarters founders learn to fear. Programs that kill fast and reallocate to the winners produce the compounding quarters that make the retainer worth its rate. Founders new to structured plans assume the kill decision hurts the numbers. In practice, killing a flat creative at week two frees the budget to double down on the winner and grows the campaign result 20 to 45 percent inside the next 21 days on an apparel account.
Where fashion ecommerce marketing fits the wider stack
Fashion ecommerce marketing sits above the tactical channel work and below the annual brand strategy inside the growth stack. Every retainer allocation, every creative brief, and every founder decision on inventory rolls up to the five node plan the pod is running against. Programs that budget for tactics without the plan produce busy months with soft revenue. Programs that build the plan first produce quarters where every product page, every ad, and every email adds up to a single growth arc the founder can defend at a board meeting.
The retainer that runs the plan starts at $599 monthly on a 6 month contract and scales with revenue. The retainer covers merchandising audits, fit content templates, product page image direction, checkout audits, retention flow builds, weekly review meetings, and quarterly server side tracking audits. Founders scoping the wider agency side should also read our apparel fashion marketing hub for the broader deliverable list and pricing tiers by revenue band.
The retainer scales with revenue band, deliverable scope, and the number of active campaigns per quarter. A brand at $80,000 monthly runs a lean retainer with the founder in the review meeting. A brand at $600,000 monthly runs a fuller retainer with a dedicated pod and monthly media mix modeling reads. Every retainer tier ties back to the five node stack the plan requires, and every quarterly review closes the loop between the tactical channel work and the strategic growth arc the founder is defending on the P and L. Two outside reads worth an hour before the first plan cycle kicks off. Meta catalog quality reference above for feed hygiene. The Business of Fashion opinions section for the macro context that shapes which trends deserve budget in a given quarter on the merchandising side.
Benchmarks make the plan honest. A DTC apparel brand reads its own numbers against the industry median every quarter and acts on the gaps that show up. Conversion rate. Blended cost per order. Return rate. Repeat purchase rate. Email revenue share. Each has an honest median for the revenue band, and the numbers change slowly year over year.
| Revenue band | Conversion rate | Blended CPO | Return rate (womenswear) | Day 90 repeat rate | Email revenue share |
|---|---|---|---|---|---|
| Under $80K monthly | 1.2% to 1.8% | $38 to $54 | 26% to 34% | 10% to 18% | 18% to 26% |
| $80K to $250K monthly | 1.6% to 2.4% | $28 to $46 | 24% to 32% | 16% to 24% | 22% to 30% |
| $250K to $600K monthly | 2.0% to 2.8% | $22 to $38 | 22% to 30% | 22% to 32% | 26% to 34% |
| $600K to $1.5M monthly | 2.4% to 3.4% | $18 to $32 | 20% to 28% | 28% to 38% | 28% to 36% |
| Above $1.5M monthly | 2.8% to 4.0% | $16 to $28 | 18% to 26% | 32% to 45% | 30% to 38% |
A founder who reads a monthly dashboard against these benchmarks catches the drift inside 30 days and adjusts the plan before the quarter closes. A founder who reads only the paid social dashboard catches the drift 90 days late, which usually means the correction shows up in the next quarter revenue instead of the current one. That single reporting habit is the difference between an apparel plan that grows and an apparel plan that runs in place while the founder wonders what actually changed under the surface. Founders scoping the wider paid team should read our fashion marketing agency guide for the retainer scope that sits above these benchmark reads.
How do you measure fashion ecommerce marketing honestly
Honest measurement of fashion ecommerce marketing runs on four data streams reconciled inside one weekly dashboard. Shopify revenue by UTM and discount code. Google Analytics 4 sessions and assisted conversion. Meta and TikTok ads platform attribution. A post purchase survey on every order that asks where the buyer first saw the brand. Each stream lies on its own.
The single biggest reporting mistake is trusting Meta own return on ad spend number as the campaign result. Meta over reports by 30 to 90 percent on apparel accounts because the pixel double counts view through and click through revenue that would have converted anyway. Google Analytics 4 under reports because the model discounts paid social influence on longer consideration windows. Shopify tells the truth on first order revenue but nothing on assisted revenue. Post purchase surveys catch the audience that saw the campaign on TikTok, searched a week later, and bought through direct traffic. The four streams together reconcile inside a 5 to 8 percent margin on a well tagged apparel account. Google’s attribution model documentation is the source every founder should read before arguing about which number is correct.
Every plan reports campaign level revenue against the campaign level budget with a 7 day and 30 day view. Anything shorter than 7 days is noise on an apparel buying cycle. Anything longer than 30 days is too late to change the current campaign trajectory. The founder reads the dashboard once a week on Monday morning before the review meeting, not once at the end of the quarter when the numbers are already locked into a bad direction.
Fashion ecommerce marketing in production
Boogie Board came to our team with a DTC ecommerce program running the same problem most apparel brands run at $340,000 monthly. Product pages with four images per SKU, no fit content on the size selector, a checkout that pushed size to step two on mobile, cost per acquisition at $150.92 and climbing, and a founder who read the paid social dashboard at face value every Monday. The plan looked busy on paper. The margin math looked thin on the P and L.
Our team rebuilt the ecommerce path around the five node stack. Rewrote the product page template with 8 to 12 images per SKU, garment measurements at the SKU level, and fit review pull quotes below the size selector. Moved size selection to first field at the top of the mobile checkout. Rebuilt the top 40 SKU catalog feed with lifestyle imagery and hand written titles. Turned on the seven core Klaviyo flows and a Attentive SMS list at week three. Server side tracking went in through Elevar in week two. Weekly Monday review meetings replaced the end of month post mortem, with the founder in the room and empowered to kill a campaign at week two.
Twelve months in, blended cost per acquisition dropped to $31. Conversion rate on the paid landing pages climbed 11 percent. Return rate on womenswear dropped from 38 percent to 26 percent. Day 90 repeat purchase rate grew from 22 percent to 41 percent. Managed ad budget grew to $650,000 monthly on the same margin profile. The result did not come from a magic new channel. It came from applying the five node stack, the checkout discipline, and the review cadence the plan required from day one.
The weekly review that keeps the plan honest
The Monday review meeting is where an apparel plan earns the right to keep spending. Forty five minutes, three agenda items, one decision. Read the reconciled dashboard. Review the top and bottom three ad creatives by cost per order. Decide whether the current campaign continues into next week, gets a creative pivot, or gets killed. The founder is invited and expected to make the kill decision when the numbers warrant it.
Every Monday review meeting eventually reaches the moment where somebody points at the flat performing creative and asks if the founder wants to give it one more week. The founder always says yes. The creative always underperforms for a second week. Nobody remembers who first suggested the extra week. Somewhere in the archive of every apparel brand shared drive, a flat creative is quietly generating more Monday meetings about itself than actual orders about anything on the site.
The kill rule is simple and it holds across every campaign archetype. Day 3 return on ad spend below 40 percent of target and day 7 return below 60 percent of target triggers a 24 hour creative pivot or a full kill. Programs that hold underperforming campaigns for the full run out of hope produce the flat quarters founders learn to fear. Programs that kill fast and reallocate to the winners produce the compounding quarters that make the retainer worth its rate. Founders new to structured plans assume the kill decision hurts the numbers. In practice, killing a flat creative at week two frees the budget to double down on the winner and grows the campaign result 20 to 45 percent inside the next 21 days on an apparel account.
Where fashion ecommerce marketing fits the wider stack
Fashion ecommerce marketing sits above the tactical channel work and below the annual brand strategy inside the growth stack. Every retainer allocation, every creative brief, and every founder decision on inventory rolls up to the five node plan the pod is running against. Programs that budget for tactics without the plan produce busy months with soft revenue. Programs that build the plan first produce quarters where every product page, every ad, and every email adds up to a single growth arc the founder can defend at a board meeting.
The retainer that runs the plan starts at $599 monthly on a 6 month contract and scales with revenue. The retainer covers merchandising audits, fit content templates, product page image direction, checkout audits, retention flow builds, weekly review meetings, and quarterly server side tracking audits. Founders scoping the wider agency side should also read our apparel fashion marketing hub for the broader deliverable list and pricing tiers by revenue band.
The retainer scales with revenue band, deliverable scope, and the number of active campaigns per quarter. A brand at $80,000 monthly runs a lean retainer with the founder in the review meeting. A brand at $600,000 monthly runs a fuller retainer with a dedicated pod and monthly media mix modeling reads. Every retainer tier ties back to the five node stack the plan requires, and every quarterly review closes the loop between the tactical channel work and the strategic growth arc the founder is defending on the P and L. Two outside reads worth an hour before the first plan cycle kicks off. Meta catalog quality reference above for feed hygiene. The Business of Fashion opinions section for the macro context that shapes which trends deserve budget in a given quarter on the merchandising side.
Product page imagery is where a paid social click either converts or bounces inside eight seconds. The industry median product page ships four images per SKU. The winners ship eight to twelve, and every image answers a specific buyer question the paid ad already primed.
The imagery stack per SKU
A working stack per SKU carries model shot on size medium, model shot on size extra large or size fourteen so the buyer sees the fit at range, flat lay on a neutral ground for the utility view, detail shot on the fabric texture, detail shot on the hardware and stitching, back view on the model, side view on the model, movement clip of 4 to 8 seconds, and a scale shot next to a familiar object for accessories. Programs that publish all twelve image slots grow conversion rate 8 to 22 percent against the four image baseline, and Meta gets richer feed asset variants to test in the ad set.
Video that earns its production cost
Product page video works when it stays under 10 seconds, loops on autoplay, mutes by default, and shows movement the still shot cannot. Longer videos hurt page load and buyer patience without a conversion gain. A DTC apparel brand doing $340,000 monthly should budget $60,000 to $140,000 annually on product page video across the top 40 SKUs by contribution margin. Below that budget, the video shoot day math does not work and the founder ships either thin coverage on all SKUs or full coverage on the wrong ones. Shopify’s product photography guide is a useful outside read for founders scoping a first shoot.
Checkout inside fashion ecommerce marketing
Checkout on apparel carries a size selector as the first field, not the last. Programs that push size selection to a second step lose 4 to 9 percent conversion rate on the same traffic because the mobile buyer scrolls twice for a decision the desktop pattern buries. The mobile buyer decides in under six seconds whether the flow feels safe. Every friction point in that window costs margin.
The checkout structure that respects sizing
The size selector sits directly under the price, above the add to cart button. Sold out sizes stay visible with a strikethrough, not hidden, so the buyer reads the size chart against the availability without a filter reset. A restock notification input replaces the add to cart button on the sold out size. On mobile, the size selector expands into a tap sheet that shows the size chart and fit review pull quotes on the same swipe. That single pattern grows completed checkout rate 6 to 12 percent on apparel accounts we have measured inside 21 days of the deploy.
Shipping and returns copy at the payment step
Shipping thresholds, return windows, and exchange policy live inline at the payment step, not on a footer page. Apparel buyers who read the return policy at cart complete checkout 18 to 30 percent more often than buyers who never see it, and the return rate on those orders drops 2 to 5 percentage points because the buyer bought with the exchange window in mind. Founders who bury return policy on a footer link are trading the transparency dividend for a false conversion gain that costs margin on the back end.
Paid social inside fashion ecommerce marketing
Paid social carries 45 to 60 percent of first order revenue on DTC apparel between $80,000 and $600,000 monthly. Meta and TikTok are the two platforms that fund. Every other platform enters through a 90 day pilot with a hard kill date, not a slow bleed into the always on budget.
Creative velocity as the real budget
Paid social on apparel wins on creative velocity, not media budget. A brand shipping 6 to 12 fresh creative variants weekly across static, Reel, and TikTok formats produces 30 to 60 percent lower cost per order than the same brand shipping 2 to 3 variants weekly on the same media budget. Fashion audiences fatigue creative inside 5 to 9 days on the same face and product angle. The retainer needs to feed that fatigue rate, not fight it, and the creative production line has to run on a weekly cadence with a named producer.
The catalog feed that carries Shopping
Meta Advantage Plus Shopping and TikTok Shop pull directly from the Shopify product feed. Programs that let the feed run on default titles and default images produce 40 to 70 percent higher cost per order than programs that rewrite the top 40 SKU feed titles and swap the primary feed image to the highest performing lifestyle shot. Feed hygiene is the cheapest paid social gain available on an apparel account and the one most founders never open. Meta’s catalog quality reference covers the field level rules that shape delivery.
Retention inside fashion ecommerce marketing
Retention is the layer that decides whether the P and L runs on margin or grinds through paid acquisition to break even. A DTC apparel brand with a 30 percent day 90 repeat rate runs 20 to 35 percent more contribution margin per blended dollar of spend than the same brand at 15 percent. Retention is not one channel. It is a stack of email, SMS, loyalty, and post purchase content on a monthly calendar.
Email and SMS as the core
Email drives 25 to 35 percent of DTC apparel revenue when the flow set is complete. Welcome, browse abandonment, cart abandonment, post purchase, replenishment, VIP, and win back are the seven flows every brand needs live inside the first 90 days. SMS adds another 8 to 15 percent of revenue at a 5 to 12 percent list opt in rate. Klaviyo and Attentive dominate the DTC apparel tool stack because the two platforms handle 90 percent of the flow logic without custom development. Our what is fashion marketing primer covers how the retention layer plugs into the wider channel mix.
Post purchase content that grows LTV
Post purchase content covers the four weeks after delivery on a first order. Styling emails that pair the purchased SKU with three complementary pieces. A fit review request at day seven when the buyer has worn the garment twice. A community moment at day fourteen with user photos of the same SKU. A second order incentive at day 28 with a category adjacent recommendation. Programs that publish the full post purchase sequence grow lifetime value 22 to 45 percent by month twelve on the same first order cohort, and the retention layer starts to carry the revenue growth the paid team used to carry alone.
Benchmarks inside fashion ecommerce marketing
Benchmarks make the plan honest. A DTC apparel brand reads its own numbers against the industry median every quarter and acts on the gaps that show up. Conversion rate. Blended cost per order. Return rate. Repeat purchase rate. Email revenue share. Each has an honest median for the revenue band, and the numbers change slowly year over year.
| Revenue band | Conversion rate | Blended CPO | Return rate (womenswear) | Day 90 repeat rate | Email revenue share |
|---|---|---|---|---|---|
| Under $80K monthly | 1.2% to 1.8% | $38 to $54 | 26% to 34% | 10% to 18% | 18% to 26% |
| $80K to $250K monthly | 1.6% to 2.4% | $28 to $46 | 24% to 32% | 16% to 24% | 22% to 30% |
| $250K to $600K monthly | 2.0% to 2.8% | $22 to $38 | 22% to 30% | 22% to 32% | 26% to 34% |
| $600K to $1.5M monthly | 2.4% to 3.4% | $18 to $32 | 20% to 28% | 28% to 38% | 28% to 36% |
| Above $1.5M monthly | 2.8% to 4.0% | $16 to $28 | 18% to 26% | 32% to 45% | 30% to 38% |
A founder who reads a monthly dashboard against these benchmarks catches the drift inside 30 days and adjusts the plan before the quarter closes. A founder who reads only the paid social dashboard catches the drift 90 days late, which usually means the correction shows up in the next quarter revenue instead of the current one. That single reporting habit is the difference between an apparel plan that grows and an apparel plan that runs in place while the founder wonders what actually changed under the surface. Founders scoping the wider paid team should read our fashion marketing agency guide for the retainer scope that sits above these benchmark reads.
How do you measure fashion ecommerce marketing honestly
Honest measurement of fashion ecommerce marketing runs on four data streams reconciled inside one weekly dashboard. Shopify revenue by UTM and discount code. Google Analytics 4 sessions and assisted conversion. Meta and TikTok ads platform attribution. A post purchase survey on every order that asks where the buyer first saw the brand. Each stream lies on its own.
The single biggest reporting mistake is trusting Meta own return on ad spend number as the campaign result. Meta over reports by 30 to 90 percent on apparel accounts because the pixel double counts view through and click through revenue that would have converted anyway. Google Analytics 4 under reports because the model discounts paid social influence on longer consideration windows. Shopify tells the truth on first order revenue but nothing on assisted revenue. Post purchase surveys catch the audience that saw the campaign on TikTok, searched a week later, and bought through direct traffic. The four streams together reconcile inside a 5 to 8 percent margin on a well tagged apparel account. Google’s attribution model documentation is the source every founder should read before arguing about which number is correct.
Every plan reports campaign level revenue against the campaign level budget with a 7 day and 30 day view. Anything shorter than 7 days is noise on an apparel buying cycle. Anything longer than 30 days is too late to change the current campaign trajectory. The founder reads the dashboard once a week on Monday morning before the review meeting, not once at the end of the quarter when the numbers are already locked into a bad direction.
Fashion ecommerce marketing in production
Boogie Board came to our team with a DTC ecommerce program running the same problem most apparel brands run at $340,000 monthly. Product pages with four images per SKU, no fit content on the size selector, a checkout that pushed size to step two on mobile, cost per acquisition at $150.92 and climbing, and a founder who read the paid social dashboard at face value every Monday. The plan looked busy on paper. The margin math looked thin on the P and L.
Our team rebuilt the ecommerce path around the five node stack. Rewrote the product page template with 8 to 12 images per SKU, garment measurements at the SKU level, and fit review pull quotes below the size selector. Moved size selection to first field at the top of the mobile checkout. Rebuilt the top 40 SKU catalog feed with lifestyle imagery and hand written titles. Turned on the seven core Klaviyo flows and a Attentive SMS list at week three. Server side tracking went in through Elevar in week two. Weekly Monday review meetings replaced the end of month post mortem, with the founder in the room and empowered to kill a campaign at week two.
Twelve months in, blended cost per acquisition dropped to $31. Conversion rate on the paid landing pages climbed 11 percent. Return rate on womenswear dropped from 38 percent to 26 percent. Day 90 repeat purchase rate grew from 22 percent to 41 percent. Managed ad budget grew to $650,000 monthly on the same margin profile. The result did not come from a magic new channel. It came from applying the five node stack, the checkout discipline, and the review cadence the plan required from day one.
The weekly review that keeps the plan honest
The Monday review meeting is where an apparel plan earns the right to keep spending. Forty five minutes, three agenda items, one decision. Read the reconciled dashboard. Review the top and bottom three ad creatives by cost per order. Decide whether the current campaign continues into next week, gets a creative pivot, or gets killed. The founder is invited and expected to make the kill decision when the numbers warrant it.
Every Monday review meeting eventually reaches the moment where somebody points at the flat performing creative and asks if the founder wants to give it one more week. The founder always says yes. The creative always underperforms for a second week. Nobody remembers who first suggested the extra week. Somewhere in the archive of every apparel brand shared drive, a flat creative is quietly generating more Monday meetings about itself than actual orders about anything on the site.
The kill rule is simple and it holds across every campaign archetype. Day 3 return on ad spend below 40 percent of target and day 7 return below 60 percent of target triggers a 24 hour creative pivot or a full kill. Programs that hold underperforming campaigns for the full run out of hope produce the flat quarters founders learn to fear. Programs that kill fast and reallocate to the winners produce the compounding quarters that make the retainer worth its rate. Founders new to structured plans assume the kill decision hurts the numbers. In practice, killing a flat creative at week two frees the budget to double down on the winner and grows the campaign result 20 to 45 percent inside the next 21 days on an apparel account.
Where fashion ecommerce marketing fits the wider stack
Fashion ecommerce marketing sits above the tactical channel work and below the annual brand strategy inside the growth stack. Every retainer allocation, every creative brief, and every founder decision on inventory rolls up to the five node plan the pod is running against. Programs that budget for tactics without the plan produce busy months with soft revenue. Programs that build the plan first produce quarters where every product page, every ad, and every email adds up to a single growth arc the founder can defend at a board meeting.
The retainer that runs the plan starts at $599 monthly on a 6 month contract and scales with revenue. The retainer covers merchandising audits, fit content templates, product page image direction, checkout audits, retention flow builds, weekly review meetings, and quarterly server side tracking audits. Founders scoping the wider agency side should also read our apparel fashion marketing hub for the broader deliverable list and pricing tiers by revenue band.
The retainer scales with revenue band, deliverable scope, and the number of active campaigns per quarter. A brand at $80,000 monthly runs a lean retainer with the founder in the review meeting. A brand at $600,000 monthly runs a fuller retainer with a dedicated pod and monthly media mix modeling reads. Every retainer tier ties back to the five node stack the plan requires, and every quarterly review closes the loop between the tactical channel work and the strategic growth arc the founder is defending on the P and L. Two outside reads worth an hour before the first plan cycle kicks off. Meta catalog quality reference above for feed hygiene. The Business of Fashion opinions section for the macro context that shapes which trends deserve budget in a given quarter on the merchandising side.
Return rate is the single margin killer on DTC apparel. Womenswear runs 22 to 30 percent, menswear 12 to 18 percent, accessories 6 to 10 percent. Two thirds of apparel returns cite fit or size as the reason. Fashion ecommerce marketing that ignores fit content spends the paid social budget twice on every return that goes back into inventory.
The plan builds a fit content stack on every SKU. Model height and size worn in the product description. Garment measurements at the SKU level, not the style level. Fit review notes pulled from customer reviews on a dedicated Fit tab. Size guides at the collection level with the actual measurement method photographed. Programs that publish the full fit stack on every SKU cut return rate 4 to 9 percentage points inside two quarters, which is the biggest margin move available in apparel without a supply chain change.
Where the fit content lives on the page
Fit content lives above the fold on desktop and inside the third scroll on mobile. The size chart lives one tap deep from the size selector, not three clicks deep behind a footer link. Fit review pull quotes live directly below the size selector so the buyer reads what the size chart says and what other buyers actually experienced in the same tap. That single change grows conversion rate 6 to 14 percent on apparel accounts we have tested inside 30 days, and it costs nothing in creative production because the copy already exists in the review corpus.
Fit tech worth funding
True Fit, Fit Analytics, and Bold Metrics carry the automated fit recommendation layer on scaled apparel programs. Each pulls buyer inputs (height, weight, common size in another brand) and recommends a size at add to cart. Return rate drops 3 to 7 percentage points on the SKUs where the tool is live and the buyer engages with the input flow. Below $250,000 monthly, the tool license outruns the return savings. Above $600,000 monthly, the math flips and the tool pays for itself inside a quarter.
Product page imagery inside fashion ecommerce marketing
Product page imagery is where a paid social click either converts or bounces inside eight seconds. The industry median product page ships four images per SKU. The winners ship eight to twelve, and every image answers a specific buyer question the paid ad already primed.
The imagery stack per SKU
A working stack per SKU carries model shot on size medium, model shot on size extra large or size fourteen so the buyer sees the fit at range, flat lay on a neutral ground for the utility view, detail shot on the fabric texture, detail shot on the hardware and stitching, back view on the model, side view on the model, movement clip of 4 to 8 seconds, and a scale shot next to a familiar object for accessories. Programs that publish all twelve image slots grow conversion rate 8 to 22 percent against the four image baseline, and Meta gets richer feed asset variants to test in the ad set.
Video that earns its production cost
Product page video works when it stays under 10 seconds, loops on autoplay, mutes by default, and shows movement the still shot cannot. Longer videos hurt page load and buyer patience without a conversion gain. A DTC apparel brand doing $340,000 monthly should budget $60,000 to $140,000 annually on product page video across the top 40 SKUs by contribution margin. Below that budget, the video shoot day math does not work and the founder ships either thin coverage on all SKUs or full coverage on the wrong ones. Shopify’s product photography guide is a useful outside read for founders scoping a first shoot.
Checkout inside fashion ecommerce marketing
Checkout on apparel carries a size selector as the first field, not the last. Programs that push size selection to a second step lose 4 to 9 percent conversion rate on the same traffic because the mobile buyer scrolls twice for a decision the desktop pattern buries. The mobile buyer decides in under six seconds whether the flow feels safe. Every friction point in that window costs margin.
The checkout structure that respects sizing
The size selector sits directly under the price, above the add to cart button. Sold out sizes stay visible with a strikethrough, not hidden, so the buyer reads the size chart against the availability without a filter reset. A restock notification input replaces the add to cart button on the sold out size. On mobile, the size selector expands into a tap sheet that shows the size chart and fit review pull quotes on the same swipe. That single pattern grows completed checkout rate 6 to 12 percent on apparel accounts we have measured inside 21 days of the deploy.
Shipping and returns copy at the payment step
Shipping thresholds, return windows, and exchange policy live inline at the payment step, not on a footer page. Apparel buyers who read the return policy at cart complete checkout 18 to 30 percent more often than buyers who never see it, and the return rate on those orders drops 2 to 5 percentage points because the buyer bought with the exchange window in mind. Founders who bury return policy on a footer link are trading the transparency dividend for a false conversion gain that costs margin on the back end.
Paid social inside fashion ecommerce marketing
Paid social carries 45 to 60 percent of first order revenue on DTC apparel between $80,000 and $600,000 monthly. Meta and TikTok are the two platforms that fund. Every other platform enters through a 90 day pilot with a hard kill date, not a slow bleed into the always on budget.
Creative velocity as the real budget
Paid social on apparel wins on creative velocity, not media budget. A brand shipping 6 to 12 fresh creative variants weekly across static, Reel, and TikTok formats produces 30 to 60 percent lower cost per order than the same brand shipping 2 to 3 variants weekly on the same media budget. Fashion audiences fatigue creative inside 5 to 9 days on the same face and product angle. The retainer needs to feed that fatigue rate, not fight it, and the creative production line has to run on a weekly cadence with a named producer.
The catalog feed that carries Shopping
Meta Advantage Plus Shopping and TikTok Shop pull directly from the Shopify product feed. Programs that let the feed run on default titles and default images produce 40 to 70 percent higher cost per order than programs that rewrite the top 40 SKU feed titles and swap the primary feed image to the highest performing lifestyle shot. Feed hygiene is the cheapest paid social gain available on an apparel account and the one most founders never open. Meta’s catalog quality reference covers the field level rules that shape delivery.
Retention inside fashion ecommerce marketing
Retention is the layer that decides whether the P and L runs on margin or grinds through paid acquisition to break even. A DTC apparel brand with a 30 percent day 90 repeat rate runs 20 to 35 percent more contribution margin per blended dollar of spend than the same brand at 15 percent. Retention is not one channel. It is a stack of email, SMS, loyalty, and post purchase content on a monthly calendar.
Email and SMS as the core
Email drives 25 to 35 percent of DTC apparel revenue when the flow set is complete. Welcome, browse abandonment, cart abandonment, post purchase, replenishment, VIP, and win back are the seven flows every brand needs live inside the first 90 days. SMS adds another 8 to 15 percent of revenue at a 5 to 12 percent list opt in rate. Klaviyo and Attentive dominate the DTC apparel tool stack because the two platforms handle 90 percent of the flow logic without custom development. Our what is fashion marketing primer covers how the retention layer plugs into the wider channel mix.
Post purchase content that grows LTV
Post purchase content covers the four weeks after delivery on a first order. Styling emails that pair the purchased SKU with three complementary pieces. A fit review request at day seven when the buyer has worn the garment twice. A community moment at day fourteen with user photos of the same SKU. A second order incentive at day 28 with a category adjacent recommendation. Programs that publish the full post purchase sequence grow lifetime value 22 to 45 percent by month twelve on the same first order cohort, and the retention layer starts to carry the revenue growth the paid team used to carry alone.
Benchmarks inside fashion ecommerce marketing
Benchmarks make the plan honest. A DTC apparel brand reads its own numbers against the industry median every quarter and acts on the gaps that show up. Conversion rate. Blended cost per order. Return rate. Repeat purchase rate. Email revenue share. Each has an honest median for the revenue band, and the numbers change slowly year over year.
| Revenue band | Conversion rate | Blended CPO | Return rate (womenswear) | Day 90 repeat rate | Email revenue share |
|---|---|---|---|---|---|
| Under $80K monthly | 1.2% to 1.8% | $38 to $54 | 26% to 34% | 10% to 18% | 18% to 26% |
| $80K to $250K monthly | 1.6% to 2.4% | $28 to $46 | 24% to 32% | 16% to 24% | 22% to 30% |
| $250K to $600K monthly | 2.0% to 2.8% | $22 to $38 | 22% to 30% | 22% to 32% | 26% to 34% |
| $600K to $1.5M monthly | 2.4% to 3.4% | $18 to $32 | 20% to 28% | 28% to 38% | 28% to 36% |
| Above $1.5M monthly | 2.8% to 4.0% | $16 to $28 | 18% to 26% | 32% to 45% | 30% to 38% |
A founder who reads a monthly dashboard against these benchmarks catches the drift inside 30 days and adjusts the plan before the quarter closes. A founder who reads only the paid social dashboard catches the drift 90 days late, which usually means the correction shows up in the next quarter revenue instead of the current one. That single reporting habit is the difference between an apparel plan that grows and an apparel plan that runs in place while the founder wonders what actually changed under the surface. Founders scoping the wider paid team should read our fashion marketing agency guide for the retainer scope that sits above these benchmark reads.
How do you measure fashion ecommerce marketing honestly
Honest measurement of fashion ecommerce marketing runs on four data streams reconciled inside one weekly dashboard. Shopify revenue by UTM and discount code. Google Analytics 4 sessions and assisted conversion. Meta and TikTok ads platform attribution. A post purchase survey on every order that asks where the buyer first saw the brand. Each stream lies on its own.
The single biggest reporting mistake is trusting Meta own return on ad spend number as the campaign result. Meta over reports by 30 to 90 percent on apparel accounts because the pixel double counts view through and click through revenue that would have converted anyway. Google Analytics 4 under reports because the model discounts paid social influence on longer consideration windows. Shopify tells the truth on first order revenue but nothing on assisted revenue. Post purchase surveys catch the audience that saw the campaign on TikTok, searched a week later, and bought through direct traffic. The four streams together reconcile inside a 5 to 8 percent margin on a well tagged apparel account. Google’s attribution model documentation is the source every founder should read before arguing about which number is correct.
Every plan reports campaign level revenue against the campaign level budget with a 7 day and 30 day view. Anything shorter than 7 days is noise on an apparel buying cycle. Anything longer than 30 days is too late to change the current campaign trajectory. The founder reads the dashboard once a week on Monday morning before the review meeting, not once at the end of the quarter when the numbers are already locked into a bad direction.
Fashion ecommerce marketing in production
Boogie Board came to our team with a DTC ecommerce program running the same problem most apparel brands run at $340,000 monthly. Product pages with four images per SKU, no fit content on the size selector, a checkout that pushed size to step two on mobile, cost per acquisition at $150.92 and climbing, and a founder who read the paid social dashboard at face value every Monday. The plan looked busy on paper. The margin math looked thin on the P and L.
Our team rebuilt the ecommerce path around the five node stack. Rewrote the product page template with 8 to 12 images per SKU, garment measurements at the SKU level, and fit review pull quotes below the size selector. Moved size selection to first field at the top of the mobile checkout. Rebuilt the top 40 SKU catalog feed with lifestyle imagery and hand written titles. Turned on the seven core Klaviyo flows and a Attentive SMS list at week three. Server side tracking went in through Elevar in week two. Weekly Monday review meetings replaced the end of month post mortem, with the founder in the room and empowered to kill a campaign at week two.
Twelve months in, blended cost per acquisition dropped to $31. Conversion rate on the paid landing pages climbed 11 percent. Return rate on womenswear dropped from 38 percent to 26 percent. Day 90 repeat purchase rate grew from 22 percent to 41 percent. Managed ad budget grew to $650,000 monthly on the same margin profile. The result did not come from a magic new channel. It came from applying the five node stack, the checkout discipline, and the review cadence the plan required from day one.
The weekly review that keeps the plan honest
The Monday review meeting is where an apparel plan earns the right to keep spending. Forty five minutes, three agenda items, one decision. Read the reconciled dashboard. Review the top and bottom three ad creatives by cost per order. Decide whether the current campaign continues into next week, gets a creative pivot, or gets killed. The founder is invited and expected to make the kill decision when the numbers warrant it.
Every Monday review meeting eventually reaches the moment where somebody points at the flat performing creative and asks if the founder wants to give it one more week. The founder always says yes. The creative always underperforms for a second week. Nobody remembers who first suggested the extra week. Somewhere in the archive of every apparel brand shared drive, a flat creative is quietly generating more Monday meetings about itself than actual orders about anything on the site.
The kill rule is simple and it holds across every campaign archetype. Day 3 return on ad spend below 40 percent of target and day 7 return below 60 percent of target triggers a 24 hour creative pivot or a full kill. Programs that hold underperforming campaigns for the full run out of hope produce the flat quarters founders learn to fear. Programs that kill fast and reallocate to the winners produce the compounding quarters that make the retainer worth its rate. Founders new to structured plans assume the kill decision hurts the numbers. In practice, killing a flat creative at week two frees the budget to double down on the winner and grows the campaign result 20 to 45 percent inside the next 21 days on an apparel account.
Where fashion ecommerce marketing fits the wider stack
Fashion ecommerce marketing sits above the tactical channel work and below the annual brand strategy inside the growth stack. Every retainer allocation, every creative brief, and every founder decision on inventory rolls up to the five node plan the pod is running against. Programs that budget for tactics without the plan produce busy months with soft revenue. Programs that build the plan first produce quarters where every product page, every ad, and every email adds up to a single growth arc the founder can defend at a board meeting.
The retainer that runs the plan starts at $599 monthly on a 6 month contract and scales with revenue. The retainer covers merchandising audits, fit content templates, product page image direction, checkout audits, retention flow builds, weekly review meetings, and quarterly server side tracking audits. Founders scoping the wider agency side should also read our apparel fashion marketing hub for the broader deliverable list and pricing tiers by revenue band.
The retainer scales with revenue band, deliverable scope, and the number of active campaigns per quarter. A brand at $80,000 monthly runs a lean retainer with the founder in the review meeting. A brand at $600,000 monthly runs a fuller retainer with a dedicated pod and monthly media mix modeling reads. Every retainer tier ties back to the five node stack the plan requires, and every quarterly review closes the loop between the tactical channel work and the strategic growth arc the founder is defending on the P and L. Two outside reads worth an hour before the first plan cycle kicks off. Meta catalog quality reference above for feed hygiene. The Business of Fashion opinions section for the macro context that shapes which trends deserve budget in a given quarter on the merchandising side.
Retention is the layer that decides whether the P and L runs on margin or grinds through paid acquisition to break even. A DTC apparel brand with a 30 percent day 90 repeat rate runs 20 to 35 percent more contribution margin per blended dollar of spend than the same brand at 15 percent. Retention is not one channel. It is a stack of email, SMS, loyalty, and post purchase content on a monthly calendar.
Email and SMS as the core
Email drives 25 to 35 percent of DTC apparel revenue when the flow set is complete. Welcome, browse abandonment, cart abandonment, post purchase, replenishment, VIP, and win back are the seven flows every brand needs live inside the first 90 days. SMS adds another 8 to 15 percent of revenue at a 5 to 12 percent list opt in rate. Klaviyo and Attentive dominate the DTC apparel tool stack because the two platforms handle 90 percent of the flow logic without custom development. Our what is fashion marketing primer covers how the retention layer plugs into the wider channel mix.
Post purchase content that grows LTV
Post purchase content covers the four weeks after delivery on a first order. Styling emails that pair the purchased SKU with three complementary pieces. A fit review request at day seven when the buyer has worn the garment twice. A community moment at day fourteen with user photos of the same SKU. A second order incentive at day 28 with a category adjacent recommendation. Programs that publish the full post purchase sequence grow lifetime value 22 to 45 percent by month twelve on the same first order cohort, and the retention layer starts to carry the revenue growth the paid team used to carry alone.
Benchmarks inside fashion ecommerce marketing
Benchmarks make the plan honest. A DTC apparel brand reads its own numbers against the industry median every quarter and acts on the gaps that show up. Conversion rate. Blended cost per order. Return rate. Repeat purchase rate. Email revenue share. Each has an honest median for the revenue band, and the numbers change slowly year over year.
| Revenue band | Conversion rate | Blended CPO | Return rate (womenswear) | Day 90 repeat rate | Email revenue share |
|---|---|---|---|---|---|
| Under $80K monthly | 1.2% to 1.8% | $38 to $54 | 26% to 34% | 10% to 18% | 18% to 26% |
| $80K to $250K monthly | 1.6% to 2.4% | $28 to $46 | 24% to 32% | 16% to 24% | 22% to 30% |
| $250K to $600K monthly | 2.0% to 2.8% | $22 to $38 | 22% to 30% | 22% to 32% | 26% to 34% |
| $600K to $1.5M monthly | 2.4% to 3.4% | $18 to $32 | 20% to 28% | 28% to 38% | 28% to 36% |
| Above $1.5M monthly | 2.8% to 4.0% | $16 to $28 | 18% to 26% | 32% to 45% | 30% to 38% |
A founder who reads a monthly dashboard against these benchmarks catches the drift inside 30 days and adjusts the plan before the quarter closes. A founder who reads only the paid social dashboard catches the drift 90 days late, which usually means the correction shows up in the next quarter revenue instead of the current one. That single reporting habit is the difference between an apparel plan that grows and an apparel plan that runs in place while the founder wonders what actually changed under the surface. Founders scoping the wider paid team should read our fashion marketing agency guide for the retainer scope that sits above these benchmark reads.
How do you measure fashion ecommerce marketing honestly
Honest measurement of fashion ecommerce marketing runs on four data streams reconciled inside one weekly dashboard. Shopify revenue by UTM and discount code. Google Analytics 4 sessions and assisted conversion. Meta and TikTok ads platform attribution. A post purchase survey on every order that asks where the buyer first saw the brand. Each stream lies on its own.
The single biggest reporting mistake is trusting Meta own return on ad spend number as the campaign result. Meta over reports by 30 to 90 percent on apparel accounts because the pixel double counts view through and click through revenue that would have converted anyway. Google Analytics 4 under reports because the model discounts paid social influence on longer consideration windows. Shopify tells the truth on first order revenue but nothing on assisted revenue. Post purchase surveys catch the audience that saw the campaign on TikTok, searched a week later, and bought through direct traffic. The four streams together reconcile inside a 5 to 8 percent margin on a well tagged apparel account. Google’s attribution model documentation is the source every founder should read before arguing about which number is correct.
Every plan reports campaign level revenue against the campaign level budget with a 7 day and 30 day view. Anything shorter than 7 days is noise on an apparel buying cycle. Anything longer than 30 days is too late to change the current campaign trajectory. The founder reads the dashboard once a week on Monday morning before the review meeting, not once at the end of the quarter when the numbers are already locked into a bad direction.
Fashion ecommerce marketing in production
Boogie Board came to our team with a DTC ecommerce program running the same problem most apparel brands run at $340,000 monthly. Product pages with four images per SKU, no fit content on the size selector, a checkout that pushed size to step two on mobile, cost per acquisition at $150.92 and climbing, and a founder who read the paid social dashboard at face value every Monday. The plan looked busy on paper. The margin math looked thin on the P and L.
Our team rebuilt the ecommerce path around the five node stack. Rewrote the product page template with 8 to 12 images per SKU, garment measurements at the SKU level, and fit review pull quotes below the size selector. Moved size selection to first field at the top of the mobile checkout. Rebuilt the top 40 SKU catalog feed with lifestyle imagery and hand written titles. Turned on the seven core Klaviyo flows and a Attentive SMS list at week three. Server side tracking went in through Elevar in week two. Weekly Monday review meetings replaced the end of month post mortem, with the founder in the room and empowered to kill a campaign at week two.
Twelve months in, blended cost per acquisition dropped to $31. Conversion rate on the paid landing pages climbed 11 percent. Return rate on womenswear dropped from 38 percent to 26 percent. Day 90 repeat purchase rate grew from 22 percent to 41 percent. Managed ad budget grew to $650,000 monthly on the same margin profile. The result did not come from a magic new channel. It came from applying the five node stack, the checkout discipline, and the review cadence the plan required from day one.
The weekly review that keeps the plan honest
The Monday review meeting is where an apparel plan earns the right to keep spending. Forty five minutes, three agenda items, one decision. Read the reconciled dashboard. Review the top and bottom three ad creatives by cost per order. Decide whether the current campaign continues into next week, gets a creative pivot, or gets killed. The founder is invited and expected to make the kill decision when the numbers warrant it.
Every Monday review meeting eventually reaches the moment where somebody points at the flat performing creative and asks if the founder wants to give it one more week. The founder always says yes. The creative always underperforms for a second week. Nobody remembers who first suggested the extra week. Somewhere in the archive of every apparel brand shared drive, a flat creative is quietly generating more Monday meetings about itself than actual orders about anything on the site.
The kill rule is simple and it holds across every campaign archetype. Day 3 return on ad spend below 40 percent of target and day 7 return below 60 percent of target triggers a 24 hour creative pivot or a full kill. Programs that hold underperforming campaigns for the full run out of hope produce the flat quarters founders learn to fear. Programs that kill fast and reallocate to the winners produce the compounding quarters that make the retainer worth its rate. Founders new to structured plans assume the kill decision hurts the numbers. In practice, killing a flat creative at week two frees the budget to double down on the winner and grows the campaign result 20 to 45 percent inside the next 21 days on an apparel account.
Where fashion ecommerce marketing fits the wider stack
Fashion ecommerce marketing sits above the tactical channel work and below the annual brand strategy inside the growth stack. Every retainer allocation, every creative brief, and every founder decision on inventory rolls up to the five node plan the pod is running against. Programs that budget for tactics without the plan produce busy months with soft revenue. Programs that build the plan first produce quarters where every product page, every ad, and every email adds up to a single growth arc the founder can defend at a board meeting.
The retainer that runs the plan starts at $599 monthly on a 6 month contract and scales with revenue. The retainer covers merchandising audits, fit content templates, product page image direction, checkout audits, retention flow builds, weekly review meetings, and quarterly server side tracking audits. Founders scoping the wider agency side should also read our apparel fashion marketing hub for the broader deliverable list and pricing tiers by revenue band.
The retainer scales with revenue band, deliverable scope, and the number of active campaigns per quarter. A brand at $80,000 monthly runs a lean retainer with the founder in the review meeting. A brand at $600,000 monthly runs a fuller retainer with a dedicated pod and monthly media mix modeling reads. Every retainer tier ties back to the five node stack the plan requires, and every quarterly review closes the loop between the tactical channel work and the strategic growth arc the founder is defending on the P and L. Two outside reads worth an hour before the first plan cycle kicks off. Meta catalog quality reference above for feed hygiene. The Business of Fashion opinions section for the macro context that shapes which trends deserve budget in a given quarter on the merchandising side.
Product page imagery is where a paid social click either converts or bounces inside eight seconds. The industry median product page ships four images per SKU. The winners ship eight to twelve, and every image answers a specific buyer question the paid ad already primed.
The imagery stack per SKU
A working stack per SKU carries model shot on size medium, model shot on size extra large or size fourteen so the buyer sees the fit at range, flat lay on a neutral ground for the utility view, detail shot on the fabric texture, detail shot on the hardware and stitching, back view on the model, side view on the model, movement clip of 4 to 8 seconds, and a scale shot next to a familiar object for accessories. Programs that publish all twelve image slots grow conversion rate 8 to 22 percent against the four image baseline, and Meta gets richer feed asset variants to test in the ad set.
Video that earns its production cost
Product page video works when it stays under 10 seconds, loops on autoplay, mutes by default, and shows movement the still shot cannot. Longer videos hurt page load and buyer patience without a conversion gain. A DTC apparel brand doing $340,000 monthly should budget $60,000 to $140,000 annually on product page video across the top 40 SKUs by contribution margin. Below that budget, the video shoot day math does not work and the founder ships either thin coverage on all SKUs or full coverage on the wrong ones. Shopify’s product photography guide is a useful outside read for founders scoping a first shoot.
Checkout inside fashion ecommerce marketing
Checkout on apparel carries a size selector as the first field, not the last. Programs that push size selection to a second step lose 4 to 9 percent conversion rate on the same traffic because the mobile buyer scrolls twice for a decision the desktop pattern buries. The mobile buyer decides in under six seconds whether the flow feels safe. Every friction point in that window costs margin.
The checkout structure that respects sizing
The size selector sits directly under the price, above the add to cart button. Sold out sizes stay visible with a strikethrough, not hidden, so the buyer reads the size chart against the availability without a filter reset. A restock notification input replaces the add to cart button on the sold out size. On mobile, the size selector expands into a tap sheet that shows the size chart and fit review pull quotes on the same swipe. That single pattern grows completed checkout rate 6 to 12 percent on apparel accounts we have measured inside 21 days of the deploy.
Shipping and returns copy at the payment step
Shipping thresholds, return windows, and exchange policy live inline at the payment step, not on a footer page. Apparel buyers who read the return policy at cart complete checkout 18 to 30 percent more often than buyers who never see it, and the return rate on those orders drops 2 to 5 percentage points because the buyer bought with the exchange window in mind. Founders who bury return policy on a footer link are trading the transparency dividend for a false conversion gain that costs margin on the back end.
Paid social inside fashion ecommerce marketing
Paid social carries 45 to 60 percent of first order revenue on DTC apparel between $80,000 and $600,000 monthly. Meta and TikTok are the two platforms that fund. Every other platform enters through a 90 day pilot with a hard kill date, not a slow bleed into the always on budget.
Creative velocity as the real budget
Paid social on apparel wins on creative velocity, not media budget. A brand shipping 6 to 12 fresh creative variants weekly across static, Reel, and TikTok formats produces 30 to 60 percent lower cost per order than the same brand shipping 2 to 3 variants weekly on the same media budget. Fashion audiences fatigue creative inside 5 to 9 days on the same face and product angle. The retainer needs to feed that fatigue rate, not fight it, and the creative production line has to run on a weekly cadence with a named producer.
The catalog feed that carries Shopping
Meta Advantage Plus Shopping and TikTok Shop pull directly from the Shopify product feed. Programs that let the feed run on default titles and default images produce 40 to 70 percent higher cost per order than programs that rewrite the top 40 SKU feed titles and swap the primary feed image to the highest performing lifestyle shot. Feed hygiene is the cheapest paid social gain available on an apparel account and the one most founders never open. Meta’s catalog quality reference covers the field level rules that shape delivery.
Retention inside fashion ecommerce marketing
Retention is the layer that decides whether the P and L runs on margin or grinds through paid acquisition to break even. A DTC apparel brand with a 30 percent day 90 repeat rate runs 20 to 35 percent more contribution margin per blended dollar of spend than the same brand at 15 percent. Retention is not one channel. It is a stack of email, SMS, loyalty, and post purchase content on a monthly calendar.
Email and SMS as the core
Email drives 25 to 35 percent of DTC apparel revenue when the flow set is complete. Welcome, browse abandonment, cart abandonment, post purchase, replenishment, VIP, and win back are the seven flows every brand needs live inside the first 90 days. SMS adds another 8 to 15 percent of revenue at a 5 to 12 percent list opt in rate. Klaviyo and Attentive dominate the DTC apparel tool stack because the two platforms handle 90 percent of the flow logic without custom development. Our what is fashion marketing primer covers how the retention layer plugs into the wider channel mix.
Post purchase content that grows LTV
Post purchase content covers the four weeks after delivery on a first order. Styling emails that pair the purchased SKU with three complementary pieces. A fit review request at day seven when the buyer has worn the garment twice. A community moment at day fourteen with user photos of the same SKU. A second order incentive at day 28 with a category adjacent recommendation. Programs that publish the full post purchase sequence grow lifetime value 22 to 45 percent by month twelve on the same first order cohort, and the retention layer starts to carry the revenue growth the paid team used to carry alone.
Benchmarks inside fashion ecommerce marketing
Benchmarks make the plan honest. A DTC apparel brand reads its own numbers against the industry median every quarter and acts on the gaps that show up. Conversion rate. Blended cost per order. Return rate. Repeat purchase rate. Email revenue share. Each has an honest median for the revenue band, and the numbers change slowly year over year.
| Revenue band | Conversion rate | Blended CPO | Return rate (womenswear) | Day 90 repeat rate | Email revenue share |
|---|---|---|---|---|---|
| Under $80K monthly | 1.2% to 1.8% | $38 to $54 | 26% to 34% | 10% to 18% | 18% to 26% |
| $80K to $250K monthly | 1.6% to 2.4% | $28 to $46 | 24% to 32% | 16% to 24% | 22% to 30% |
| $250K to $600K monthly | 2.0% to 2.8% | $22 to $38 | 22% to 30% | 22% to 32% | 26% to 34% |
| $600K to $1.5M monthly | 2.4% to 3.4% | $18 to $32 | 20% to 28% | 28% to 38% | 28% to 36% |
| Above $1.5M monthly | 2.8% to 4.0% | $16 to $28 | 18% to 26% | 32% to 45% | 30% to 38% |
A founder who reads a monthly dashboard against these benchmarks catches the drift inside 30 days and adjusts the plan before the quarter closes. A founder who reads only the paid social dashboard catches the drift 90 days late, which usually means the correction shows up in the next quarter revenue instead of the current one. That single reporting habit is the difference between an apparel plan that grows and an apparel plan that runs in place while the founder wonders what actually changed under the surface. Founders scoping the wider paid team should read our fashion marketing agency guide for the retainer scope that sits above these benchmark reads.
How do you measure fashion ecommerce marketing honestly
Honest measurement of fashion ecommerce marketing runs on four data streams reconciled inside one weekly dashboard. Shopify revenue by UTM and discount code. Google Analytics 4 sessions and assisted conversion. Meta and TikTok ads platform attribution. A post purchase survey on every order that asks where the buyer first saw the brand. Each stream lies on its own.
The single biggest reporting mistake is trusting Meta own return on ad spend number as the campaign result. Meta over reports by 30 to 90 percent on apparel accounts because the pixel double counts view through and click through revenue that would have converted anyway. Google Analytics 4 under reports because the model discounts paid social influence on longer consideration windows. Shopify tells the truth on first order revenue but nothing on assisted revenue. Post purchase surveys catch the audience that saw the campaign on TikTok, searched a week later, and bought through direct traffic. The four streams together reconcile inside a 5 to 8 percent margin on a well tagged apparel account. Google’s attribution model documentation is the source every founder should read before arguing about which number is correct.
Every plan reports campaign level revenue against the campaign level budget with a 7 day and 30 day view. Anything shorter than 7 days is noise on an apparel buying cycle. Anything longer than 30 days is too late to change the current campaign trajectory. The founder reads the dashboard once a week on Monday morning before the review meeting, not once at the end of the quarter when the numbers are already locked into a bad direction.
Fashion ecommerce marketing in production
Boogie Board came to our team with a DTC ecommerce program running the same problem most apparel brands run at $340,000 monthly. Product pages with four images per SKU, no fit content on the size selector, a checkout that pushed size to step two on mobile, cost per acquisition at $150.92 and climbing, and a founder who read the paid social dashboard at face value every Monday. The plan looked busy on paper. The margin math looked thin on the P and L.
Our team rebuilt the ecommerce path around the five node stack. Rewrote the product page template with 8 to 12 images per SKU, garment measurements at the SKU level, and fit review pull quotes below the size selector. Moved size selection to first field at the top of the mobile checkout. Rebuilt the top 40 SKU catalog feed with lifestyle imagery and hand written titles. Turned on the seven core Klaviyo flows and a Attentive SMS list at week three. Server side tracking went in through Elevar in week two. Weekly Monday review meetings replaced the end of month post mortem, with the founder in the room and empowered to kill a campaign at week two.
Twelve months in, blended cost per acquisition dropped to $31. Conversion rate on the paid landing pages climbed 11 percent. Return rate on womenswear dropped from 38 percent to 26 percent. Day 90 repeat purchase rate grew from 22 percent to 41 percent. Managed ad budget grew to $650,000 monthly on the same margin profile. The result did not come from a magic new channel. It came from applying the five node stack, the checkout discipline, and the review cadence the plan required from day one.
The weekly review that keeps the plan honest
The Monday review meeting is where an apparel plan earns the right to keep spending. Forty five minutes, three agenda items, one decision. Read the reconciled dashboard. Review the top and bottom three ad creatives by cost per order. Decide whether the current campaign continues into next week, gets a creative pivot, or gets killed. The founder is invited and expected to make the kill decision when the numbers warrant it.
Every Monday review meeting eventually reaches the moment where somebody points at the flat performing creative and asks if the founder wants to give it one more week. The founder always says yes. The creative always underperforms for a second week. Nobody remembers who first suggested the extra week. Somewhere in the archive of every apparel brand shared drive, a flat creative is quietly generating more Monday meetings about itself than actual orders about anything on the site.
The kill rule is simple and it holds across every campaign archetype. Day 3 return on ad spend below 40 percent of target and day 7 return below 60 percent of target triggers a 24 hour creative pivot or a full kill. Programs that hold underperforming campaigns for the full run out of hope produce the flat quarters founders learn to fear. Programs that kill fast and reallocate to the winners produce the compounding quarters that make the retainer worth its rate. Founders new to structured plans assume the kill decision hurts the numbers. In practice, killing a flat creative at week two frees the budget to double down on the winner and grows the campaign result 20 to 45 percent inside the next 21 days on an apparel account.
Where fashion ecommerce marketing fits the wider stack
Fashion ecommerce marketing sits above the tactical channel work and below the annual brand strategy inside the growth stack. Every retainer allocation, every creative brief, and every founder decision on inventory rolls up to the five node plan the pod is running against. Programs that budget for tactics without the plan produce busy months with soft revenue. Programs that build the plan first produce quarters where every product page, every ad, and every email adds up to a single growth arc the founder can defend at a board meeting.
The retainer that runs the plan starts at $599 monthly on a 6 month contract and scales with revenue. The retainer covers merchandising audits, fit content templates, product page image direction, checkout audits, retention flow builds, weekly review meetings, and quarterly server side tracking audits. Founders scoping the wider agency side should also read our apparel fashion marketing hub for the broader deliverable list and pricing tiers by revenue band.
The retainer scales with revenue band, deliverable scope, and the number of active campaigns per quarter. A brand at $80,000 monthly runs a lean retainer with the founder in the review meeting. A brand at $600,000 monthly runs a fuller retainer with a dedicated pod and monthly media mix modeling reads. Every retainer tier ties back to the five node stack the plan requires, and every quarterly review closes the loop between the tactical channel work and the strategic growth arc the founder is defending on the P and L. Two outside reads worth an hour before the first plan cycle kicks off. Meta catalog quality reference above for feed hygiene. The Business of Fashion opinions section for the macro context that shapes which trends deserve budget in a given quarter on the merchandising side.
Return rate is the single margin killer on DTC apparel. Womenswear runs 22 to 30 percent, menswear 12 to 18 percent, accessories 6 to 10 percent. Two thirds of apparel returns cite fit or size as the reason. Fashion ecommerce marketing that ignores fit content spends the paid social budget twice on every return that goes back into inventory.
The plan builds a fit content stack on every SKU. Model height and size worn in the product description. Garment measurements at the SKU level, not the style level. Fit review notes pulled from customer reviews on a dedicated Fit tab. Size guides at the collection level with the actual measurement method photographed. Programs that publish the full fit stack on every SKU cut return rate 4 to 9 percentage points inside two quarters, which is the biggest margin move available in apparel without a supply chain change.
Where the fit content lives on the page
Fit content lives above the fold on desktop and inside the third scroll on mobile. The size chart lives one tap deep from the size selector, not three clicks deep behind a footer link. Fit review pull quotes live directly below the size selector so the buyer reads what the size chart says and what other buyers actually experienced in the same tap. That single change grows conversion rate 6 to 14 percent on apparel accounts we have tested inside 30 days, and it costs nothing in creative production because the copy already exists in the review corpus.
Fit tech worth funding
True Fit, Fit Analytics, and Bold Metrics carry the automated fit recommendation layer on scaled apparel programs. Each pulls buyer inputs (height, weight, common size in another brand) and recommends a size at add to cart. Return rate drops 3 to 7 percentage points on the SKUs where the tool is live and the buyer engages with the input flow. Below $250,000 monthly, the tool license outruns the return savings. Above $600,000 monthly, the math flips and the tool pays for itself inside a quarter.
Product page imagery inside fashion ecommerce marketing
Product page imagery is where a paid social click either converts or bounces inside eight seconds. The industry median product page ships four images per SKU. The winners ship eight to twelve, and every image answers a specific buyer question the paid ad already primed.
The imagery stack per SKU
A working stack per SKU carries model shot on size medium, model shot on size extra large or size fourteen so the buyer sees the fit at range, flat lay on a neutral ground for the utility view, detail shot on the fabric texture, detail shot on the hardware and stitching, back view on the model, side view on the model, movement clip of 4 to 8 seconds, and a scale shot next to a familiar object for accessories. Programs that publish all twelve image slots grow conversion rate 8 to 22 percent against the four image baseline, and Meta gets richer feed asset variants to test in the ad set.
Video that earns its production cost
Product page video works when it stays under 10 seconds, loops on autoplay, mutes by default, and shows movement the still shot cannot. Longer videos hurt page load and buyer patience without a conversion gain. A DTC apparel brand doing $340,000 monthly should budget $60,000 to $140,000 annually on product page video across the top 40 SKUs by contribution margin. Below that budget, the video shoot day math does not work and the founder ships either thin coverage on all SKUs or full coverage on the wrong ones. Shopify’s product photography guide is a useful outside read for founders scoping a first shoot.
Checkout inside fashion ecommerce marketing
Checkout on apparel carries a size selector as the first field, not the last. Programs that push size selection to a second step lose 4 to 9 percent conversion rate on the same traffic because the mobile buyer scrolls twice for a decision the desktop pattern buries. The mobile buyer decides in under six seconds whether the flow feels safe. Every friction point in that window costs margin.
The checkout structure that respects sizing
The size selector sits directly under the price, above the add to cart button. Sold out sizes stay visible with a strikethrough, not hidden, so the buyer reads the size chart against the availability without a filter reset. A restock notification input replaces the add to cart button on the sold out size. On mobile, the size selector expands into a tap sheet that shows the size chart and fit review pull quotes on the same swipe. That single pattern grows completed checkout rate 6 to 12 percent on apparel accounts we have measured inside 21 days of the deploy.
Shipping and returns copy at the payment step
Shipping thresholds, return windows, and exchange policy live inline at the payment step, not on a footer page. Apparel buyers who read the return policy at cart complete checkout 18 to 30 percent more often than buyers who never see it, and the return rate on those orders drops 2 to 5 percentage points because the buyer bought with the exchange window in mind. Founders who bury return policy on a footer link are trading the transparency dividend for a false conversion gain that costs margin on the back end.
Paid social inside fashion ecommerce marketing
Paid social carries 45 to 60 percent of first order revenue on DTC apparel between $80,000 and $600,000 monthly. Meta and TikTok are the two platforms that fund. Every other platform enters through a 90 day pilot with a hard kill date, not a slow bleed into the always on budget.
Creative velocity as the real budget
Paid social on apparel wins on creative velocity, not media budget. A brand shipping 6 to 12 fresh creative variants weekly across static, Reel, and TikTok formats produces 30 to 60 percent lower cost per order than the same brand shipping 2 to 3 variants weekly on the same media budget. Fashion audiences fatigue creative inside 5 to 9 days on the same face and product angle. The retainer needs to feed that fatigue rate, not fight it, and the creative production line has to run on a weekly cadence with a named producer.
The catalog feed that carries Shopping
Meta Advantage Plus Shopping and TikTok Shop pull directly from the Shopify product feed. Programs that let the feed run on default titles and default images produce 40 to 70 percent higher cost per order than programs that rewrite the top 40 SKU feed titles and swap the primary feed image to the highest performing lifestyle shot. Feed hygiene is the cheapest paid social gain available on an apparel account and the one most founders never open. Meta’s catalog quality reference covers the field level rules that shape delivery.
Retention inside fashion ecommerce marketing
Retention is the layer that decides whether the P and L runs on margin or grinds through paid acquisition to break even. A DTC apparel brand with a 30 percent day 90 repeat rate runs 20 to 35 percent more contribution margin per blended dollar of spend than the same brand at 15 percent. Retention is not one channel. It is a stack of email, SMS, loyalty, and post purchase content on a monthly calendar.
Email and SMS as the core
Email drives 25 to 35 percent of DTC apparel revenue when the flow set is complete. Welcome, browse abandonment, cart abandonment, post purchase, replenishment, VIP, and win back are the seven flows every brand needs live inside the first 90 days. SMS adds another 8 to 15 percent of revenue at a 5 to 12 percent list opt in rate. Klaviyo and Attentive dominate the DTC apparel tool stack because the two platforms handle 90 percent of the flow logic without custom development. Our what is fashion marketing primer covers how the retention layer plugs into the wider channel mix.
Post purchase content that grows LTV
Post purchase content covers the four weeks after delivery on a first order. Styling emails that pair the purchased SKU with three complementary pieces. A fit review request at day seven when the buyer has worn the garment twice. A community moment at day fourteen with user photos of the same SKU. A second order incentive at day 28 with a category adjacent recommendation. Programs that publish the full post purchase sequence grow lifetime value 22 to 45 percent by month twelve on the same first order cohort, and the retention layer starts to carry the revenue growth the paid team used to carry alone.
Benchmarks inside fashion ecommerce marketing
Benchmarks make the plan honest. A DTC apparel brand reads its own numbers against the industry median every quarter and acts on the gaps that show up. Conversion rate. Blended cost per order. Return rate. Repeat purchase rate. Email revenue share. Each has an honest median for the revenue band, and the numbers change slowly year over year.
| Revenue band | Conversion rate | Blended CPO | Return rate (womenswear) | Day 90 repeat rate | Email revenue share |
|---|---|---|---|---|---|
| Under $80K monthly | 1.2% to 1.8% | $38 to $54 | 26% to 34% | 10% to 18% | 18% to 26% |
| $80K to $250K monthly | 1.6% to 2.4% | $28 to $46 | 24% to 32% | 16% to 24% | 22% to 30% |
| $250K to $600K monthly | 2.0% to 2.8% | $22 to $38 | 22% to 30% | 22% to 32% | 26% to 34% |
| $600K to $1.5M monthly | 2.4% to 3.4% | $18 to $32 | 20% to 28% | 28% to 38% | 28% to 36% |
| Above $1.5M monthly | 2.8% to 4.0% | $16 to $28 | 18% to 26% | 32% to 45% | 30% to 38% |
A founder who reads a monthly dashboard against these benchmarks catches the drift inside 30 days and adjusts the plan before the quarter closes. A founder who reads only the paid social dashboard catches the drift 90 days late, which usually means the correction shows up in the next quarter revenue instead of the current one. That single reporting habit is the difference between an apparel plan that grows and an apparel plan that runs in place while the founder wonders what actually changed under the surface. Founders scoping the wider paid team should read our fashion marketing agency guide for the retainer scope that sits above these benchmark reads.
How do you measure fashion ecommerce marketing honestly
Honest measurement of fashion ecommerce marketing runs on four data streams reconciled inside one weekly dashboard. Shopify revenue by UTM and discount code. Google Analytics 4 sessions and assisted conversion. Meta and TikTok ads platform attribution. A post purchase survey on every order that asks where the buyer first saw the brand. Each stream lies on its own.
The single biggest reporting mistake is trusting Meta own return on ad spend number as the campaign result. Meta over reports by 30 to 90 percent on apparel accounts because the pixel double counts view through and click through revenue that would have converted anyway. Google Analytics 4 under reports because the model discounts paid social influence on longer consideration windows. Shopify tells the truth on first order revenue but nothing on assisted revenue. Post purchase surveys catch the audience that saw the campaign on TikTok, searched a week later, and bought through direct traffic. The four streams together reconcile inside a 5 to 8 percent margin on a well tagged apparel account. Google’s attribution model documentation is the source every founder should read before arguing about which number is correct.
Every plan reports campaign level revenue against the campaign level budget with a 7 day and 30 day view. Anything shorter than 7 days is noise on an apparel buying cycle. Anything longer than 30 days is too late to change the current campaign trajectory. The founder reads the dashboard once a week on Monday morning before the review meeting, not once at the end of the quarter when the numbers are already locked into a bad direction.
Fashion ecommerce marketing in production
Boogie Board came to our team with a DTC ecommerce program running the same problem most apparel brands run at $340,000 monthly. Product pages with four images per SKU, no fit content on the size selector, a checkout that pushed size to step two on mobile, cost per acquisition at $150.92 and climbing, and a founder who read the paid social dashboard at face value every Monday. The plan looked busy on paper. The margin math looked thin on the P and L.
Our team rebuilt the ecommerce path around the five node stack. Rewrote the product page template with 8 to 12 images per SKU, garment measurements at the SKU level, and fit review pull quotes below the size selector. Moved size selection to first field at the top of the mobile checkout. Rebuilt the top 40 SKU catalog feed with lifestyle imagery and hand written titles. Turned on the seven core Klaviyo flows and a Attentive SMS list at week three. Server side tracking went in through Elevar in week two. Weekly Monday review meetings replaced the end of month post mortem, with the founder in the room and empowered to kill a campaign at week two.
Twelve months in, blended cost per acquisition dropped to $31. Conversion rate on the paid landing pages climbed 11 percent. Return rate on womenswear dropped from 38 percent to 26 percent. Day 90 repeat purchase rate grew from 22 percent to 41 percent. Managed ad budget grew to $650,000 monthly on the same margin profile. The result did not come from a magic new channel. It came from applying the five node stack, the checkout discipline, and the review cadence the plan required from day one.
The weekly review that keeps the plan honest
The Monday review meeting is where an apparel plan earns the right to keep spending. Forty five minutes, three agenda items, one decision. Read the reconciled dashboard. Review the top and bottom three ad creatives by cost per order. Decide whether the current campaign continues into next week, gets a creative pivot, or gets killed. The founder is invited and expected to make the kill decision when the numbers warrant it.
Every Monday review meeting eventually reaches the moment where somebody points at the flat performing creative and asks if the founder wants to give it one more week. The founder always says yes. The creative always underperforms for a second week. Nobody remembers who first suggested the extra week. Somewhere in the archive of every apparel brand shared drive, a flat creative is quietly generating more Monday meetings about itself than actual orders about anything on the site.
The kill rule is simple and it holds across every campaign archetype. Day 3 return on ad spend below 40 percent of target and day 7 return below 60 percent of target triggers a 24 hour creative pivot or a full kill. Programs that hold underperforming campaigns for the full run out of hope produce the flat quarters founders learn to fear. Programs that kill fast and reallocate to the winners produce the compounding quarters that make the retainer worth its rate. Founders new to structured plans assume the kill decision hurts the numbers. In practice, killing a flat creative at week two frees the budget to double down on the winner and grows the campaign result 20 to 45 percent inside the next 21 days on an apparel account.
Where fashion ecommerce marketing fits the wider stack
Fashion ecommerce marketing sits above the tactical channel work and below the annual brand strategy inside the growth stack. Every retainer allocation, every creative brief, and every founder decision on inventory rolls up to the five node plan the pod is running against. Programs that budget for tactics without the plan produce busy months with soft revenue. Programs that build the plan first produce quarters where every product page, every ad, and every email adds up to a single growth arc the founder can defend at a board meeting.
The retainer that runs the plan starts at $599 monthly on a 6 month contract and scales with revenue. The retainer covers merchandising audits, fit content templates, product page image direction, checkout audits, retention flow builds, weekly review meetings, and quarterly server side tracking audits. Founders scoping the wider agency side should also read our apparel fashion marketing hub for the broader deliverable list and pricing tiers by revenue band.
The retainer scales with revenue band, deliverable scope, and the number of active campaigns per quarter. A brand at $80,000 monthly runs a lean retainer with the founder in the review meeting. A brand at $600,000 monthly runs a fuller retainer with a dedicated pod and monthly media mix modeling reads. Every retainer tier ties back to the five node stack the plan requires, and every quarterly review closes the loop between the tactical channel work and the strategic growth arc the founder is defending on the P and L. Two outside reads worth an hour before the first plan cycle kicks off. Meta catalog quality reference above for feed hygiene. The Business of Fashion opinions section for the macro context that shapes which trends deserve budget in a given quarter on the merchandising side.
Paid social carries 45 to 60 percent of first order revenue on DTC apparel between $80,000 and $600,000 monthly. Meta and TikTok are the two platforms that fund. Every other platform enters through a 90 day pilot with a hard kill date, not a slow bleed into the always on budget.
Creative velocity as the real budget
Paid social on apparel wins on creative velocity, not media budget. A brand shipping 6 to 12 fresh creative variants weekly across static, Reel, and TikTok formats produces 30 to 60 percent lower cost per order than the same brand shipping 2 to 3 variants weekly on the same media budget. Fashion audiences fatigue creative inside 5 to 9 days on the same face and product angle. The retainer needs to feed that fatigue rate, not fight it, and the creative production line has to run on a weekly cadence with a named producer.
The catalog feed that carries Shopping
Meta Advantage Plus Shopping and TikTok Shop pull directly from the Shopify product feed. Programs that let the feed run on default titles and default images produce 40 to 70 percent higher cost per order than programs that rewrite the top 40 SKU feed titles and swap the primary feed image to the highest performing lifestyle shot. Feed hygiene is the cheapest paid social gain available on an apparel account and the one most founders never open. Meta’s catalog quality reference covers the field level rules that shape delivery.
Retention inside fashion ecommerce marketing
Retention is the layer that decides whether the P and L runs on margin or grinds through paid acquisition to break even. A DTC apparel brand with a 30 percent day 90 repeat rate runs 20 to 35 percent more contribution margin per blended dollar of spend than the same brand at 15 percent. Retention is not one channel. It is a stack of email, SMS, loyalty, and post purchase content on a monthly calendar.
Email and SMS as the core
Email drives 25 to 35 percent of DTC apparel revenue when the flow set is complete. Welcome, browse abandonment, cart abandonment, post purchase, replenishment, VIP, and win back are the seven flows every brand needs live inside the first 90 days. SMS adds another 8 to 15 percent of revenue at a 5 to 12 percent list opt in rate. Klaviyo and Attentive dominate the DTC apparel tool stack because the two platforms handle 90 percent of the flow logic without custom development. Our what is fashion marketing primer covers how the retention layer plugs into the wider channel mix.
Post purchase content that grows LTV
Post purchase content covers the four weeks after delivery on a first order. Styling emails that pair the purchased SKU with three complementary pieces. A fit review request at day seven when the buyer has worn the garment twice. A community moment at day fourteen with user photos of the same SKU. A second order incentive at day 28 with a category adjacent recommendation. Programs that publish the full post purchase sequence grow lifetime value 22 to 45 percent by month twelve on the same first order cohort, and the retention layer starts to carry the revenue growth the paid team used to carry alone.
Benchmarks inside fashion ecommerce marketing
Benchmarks make the plan honest. A DTC apparel brand reads its own numbers against the industry median every quarter and acts on the gaps that show up. Conversion rate. Blended cost per order. Return rate. Repeat purchase rate. Email revenue share. Each has an honest median for the revenue band, and the numbers change slowly year over year.
| Revenue band | Conversion rate | Blended CPO | Return rate (womenswear) | Day 90 repeat rate | Email revenue share |
|---|---|---|---|---|---|
| Under $80K monthly | 1.2% to 1.8% | $38 to $54 | 26% to 34% | 10% to 18% | 18% to 26% |
| $80K to $250K monthly | 1.6% to 2.4% | $28 to $46 | 24% to 32% | 16% to 24% | 22% to 30% |
| $250K to $600K monthly | 2.0% to 2.8% | $22 to $38 | 22% to 30% | 22% to 32% | 26% to 34% |
| $600K to $1.5M monthly | 2.4% to 3.4% | $18 to $32 | 20% to 28% | 28% to 38% | 28% to 36% |
| Above $1.5M monthly | 2.8% to 4.0% | $16 to $28 | 18% to 26% | 32% to 45% | 30% to 38% |
A founder who reads a monthly dashboard against these benchmarks catches the drift inside 30 days and adjusts the plan before the quarter closes. A founder who reads only the paid social dashboard catches the drift 90 days late, which usually means the correction shows up in the next quarter revenue instead of the current one. That single reporting habit is the difference between an apparel plan that grows and an apparel plan that runs in place while the founder wonders what actually changed under the surface. Founders scoping the wider paid team should read our fashion marketing agency guide for the retainer scope that sits above these benchmark reads.
How do you measure fashion ecommerce marketing honestly
Honest measurement of fashion ecommerce marketing runs on four data streams reconciled inside one weekly dashboard. Shopify revenue by UTM and discount code. Google Analytics 4 sessions and assisted conversion. Meta and TikTok ads platform attribution. A post purchase survey on every order that asks where the buyer first saw the brand. Each stream lies on its own.
The single biggest reporting mistake is trusting Meta own return on ad spend number as the campaign result. Meta over reports by 30 to 90 percent on apparel accounts because the pixel double counts view through and click through revenue that would have converted anyway. Google Analytics 4 under reports because the model discounts paid social influence on longer consideration windows. Shopify tells the truth on first order revenue but nothing on assisted revenue. Post purchase surveys catch the audience that saw the campaign on TikTok, searched a week later, and bought through direct traffic. The four streams together reconcile inside a 5 to 8 percent margin on a well tagged apparel account. Google’s attribution model documentation is the source every founder should read before arguing about which number is correct.
Every plan reports campaign level revenue against the campaign level budget with a 7 day and 30 day view. Anything shorter than 7 days is noise on an apparel buying cycle. Anything longer than 30 days is too late to change the current campaign trajectory. The founder reads the dashboard once a week on Monday morning before the review meeting, not once at the end of the quarter when the numbers are already locked into a bad direction.
Fashion ecommerce marketing in production
Boogie Board came to our team with a DTC ecommerce program running the same problem most apparel brands run at $340,000 monthly. Product pages with four images per SKU, no fit content on the size selector, a checkout that pushed size to step two on mobile, cost per acquisition at $150.92 and climbing, and a founder who read the paid social dashboard at face value every Monday. The plan looked busy on paper. The margin math looked thin on the P and L.
Our team rebuilt the ecommerce path around the five node stack. Rewrote the product page template with 8 to 12 images per SKU, garment measurements at the SKU level, and fit review pull quotes below the size selector. Moved size selection to first field at the top of the mobile checkout. Rebuilt the top 40 SKU catalog feed with lifestyle imagery and hand written titles. Turned on the seven core Klaviyo flows and a Attentive SMS list at week three. Server side tracking went in through Elevar in week two. Weekly Monday review meetings replaced the end of month post mortem, with the founder in the room and empowered to kill a campaign at week two.
Twelve months in, blended cost per acquisition dropped to $31. Conversion rate on the paid landing pages climbed 11 percent. Return rate on womenswear dropped from 38 percent to 26 percent. Day 90 repeat purchase rate grew from 22 percent to 41 percent. Managed ad budget grew to $650,000 monthly on the same margin profile. The result did not come from a magic new channel. It came from applying the five node stack, the checkout discipline, and the review cadence the plan required from day one.
The weekly review that keeps the plan honest
The Monday review meeting is where an apparel plan earns the right to keep spending. Forty five minutes, three agenda items, one decision. Read the reconciled dashboard. Review the top and bottom three ad creatives by cost per order. Decide whether the current campaign continues into next week, gets a creative pivot, or gets killed. The founder is invited and expected to make the kill decision when the numbers warrant it.
Every Monday review meeting eventually reaches the moment where somebody points at the flat performing creative and asks if the founder wants to give it one more week. The founder always says yes. The creative always underperforms for a second week. Nobody remembers who first suggested the extra week. Somewhere in the archive of every apparel brand shared drive, a flat creative is quietly generating more Monday meetings about itself than actual orders about anything on the site.
The kill rule is simple and it holds across every campaign archetype. Day 3 return on ad spend below 40 percent of target and day 7 return below 60 percent of target triggers a 24 hour creative pivot or a full kill. Programs that hold underperforming campaigns for the full run out of hope produce the flat quarters founders learn to fear. Programs that kill fast and reallocate to the winners produce the compounding quarters that make the retainer worth its rate. Founders new to structured plans assume the kill decision hurts the numbers. In practice, killing a flat creative at week two frees the budget to double down on the winner and grows the campaign result 20 to 45 percent inside the next 21 days on an apparel account.
Where fashion ecommerce marketing fits the wider stack
Fashion ecommerce marketing sits above the tactical channel work and below the annual brand strategy inside the growth stack. Every retainer allocation, every creative brief, and every founder decision on inventory rolls up to the five node plan the pod is running against. Programs that budget for tactics without the plan produce busy months with soft revenue. Programs that build the plan first produce quarters where every product page, every ad, and every email adds up to a single growth arc the founder can defend at a board meeting.
The retainer that runs the plan starts at $599 monthly on a 6 month contract and scales with revenue. The retainer covers merchandising audits, fit content templates, product page image direction, checkout audits, retention flow builds, weekly review meetings, and quarterly server side tracking audits. Founders scoping the wider agency side should also read our apparel fashion marketing hub for the broader deliverable list and pricing tiers by revenue band.
The retainer scales with revenue band, deliverable scope, and the number of active campaigns per quarter. A brand at $80,000 monthly runs a lean retainer with the founder in the review meeting. A brand at $600,000 monthly runs a fuller retainer with a dedicated pod and monthly media mix modeling reads. Every retainer tier ties back to the five node stack the plan requires, and every quarterly review closes the loop between the tactical channel work and the strategic growth arc the founder is defending on the P and L. Two outside reads worth an hour before the first plan cycle kicks off. Meta catalog quality reference above for feed hygiene. The Business of Fashion opinions section for the macro context that shapes which trends deserve budget in a given quarter on the merchandising side.
Product page imagery is where a paid social click either converts or bounces inside eight seconds. The industry median product page ships four images per SKU. The winners ship eight to twelve, and every image answers a specific buyer question the paid ad already primed.
The imagery stack per SKU
A working stack per SKU carries model shot on size medium, model shot on size extra large or size fourteen so the buyer sees the fit at range, flat lay on a neutral ground for the utility view, detail shot on the fabric texture, detail shot on the hardware and stitching, back view on the model, side view on the model, movement clip of 4 to 8 seconds, and a scale shot next to a familiar object for accessories. Programs that publish all twelve image slots grow conversion rate 8 to 22 percent against the four image baseline, and Meta gets richer feed asset variants to test in the ad set.
Video that earns its production cost
Product page video works when it stays under 10 seconds, loops on autoplay, mutes by default, and shows movement the still shot cannot. Longer videos hurt page load and buyer patience without a conversion gain. A DTC apparel brand doing $340,000 monthly should budget $60,000 to $140,000 annually on product page video across the top 40 SKUs by contribution margin. Below that budget, the video shoot day math does not work and the founder ships either thin coverage on all SKUs or full coverage on the wrong ones. Shopify’s product photography guide is a useful outside read for founders scoping a first shoot.
Checkout inside fashion ecommerce marketing
Checkout on apparel carries a size selector as the first field, not the last. Programs that push size selection to a second step lose 4 to 9 percent conversion rate on the same traffic because the mobile buyer scrolls twice for a decision the desktop pattern buries. The mobile buyer decides in under six seconds whether the flow feels safe. Every friction point in that window costs margin.
The checkout structure that respects sizing
The size selector sits directly under the price, above the add to cart button. Sold out sizes stay visible with a strikethrough, not hidden, so the buyer reads the size chart against the availability without a filter reset. A restock notification input replaces the add to cart button on the sold out size. On mobile, the size selector expands into a tap sheet that shows the size chart and fit review pull quotes on the same swipe. That single pattern grows completed checkout rate 6 to 12 percent on apparel accounts we have measured inside 21 days of the deploy.
Shipping and returns copy at the payment step
Shipping thresholds, return windows, and exchange policy live inline at the payment step, not on a footer page. Apparel buyers who read the return policy at cart complete checkout 18 to 30 percent more often than buyers who never see it, and the return rate on those orders drops 2 to 5 percentage points because the buyer bought with the exchange window in mind. Founders who bury return policy on a footer link are trading the transparency dividend for a false conversion gain that costs margin on the back end.
Paid social inside fashion ecommerce marketing
Paid social carries 45 to 60 percent of first order revenue on DTC apparel between $80,000 and $600,000 monthly. Meta and TikTok are the two platforms that fund. Every other platform enters through a 90 day pilot with a hard kill date, not a slow bleed into the always on budget.
Creative velocity as the real budget
Paid social on apparel wins on creative velocity, not media budget. A brand shipping 6 to 12 fresh creative variants weekly across static, Reel, and TikTok formats produces 30 to 60 percent lower cost per order than the same brand shipping 2 to 3 variants weekly on the same media budget. Fashion audiences fatigue creative inside 5 to 9 days on the same face and product angle. The retainer needs to feed that fatigue rate, not fight it, and the creative production line has to run on a weekly cadence with a named producer.
The catalog feed that carries Shopping
Meta Advantage Plus Shopping and TikTok Shop pull directly from the Shopify product feed. Programs that let the feed run on default titles and default images produce 40 to 70 percent higher cost per order than programs that rewrite the top 40 SKU feed titles and swap the primary feed image to the highest performing lifestyle shot. Feed hygiene is the cheapest paid social gain available on an apparel account and the one most founders never open. Meta’s catalog quality reference covers the field level rules that shape delivery.
Retention inside fashion ecommerce marketing
Retention is the layer that decides whether the P and L runs on margin or grinds through paid acquisition to break even. A DTC apparel brand with a 30 percent day 90 repeat rate runs 20 to 35 percent more contribution margin per blended dollar of spend than the same brand at 15 percent. Retention is not one channel. It is a stack of email, SMS, loyalty, and post purchase content on a monthly calendar.
Email and SMS as the core
Email drives 25 to 35 percent of DTC apparel revenue when the flow set is complete. Welcome, browse abandonment, cart abandonment, post purchase, replenishment, VIP, and win back are the seven flows every brand needs live inside the first 90 days. SMS adds another 8 to 15 percent of revenue at a 5 to 12 percent list opt in rate. Klaviyo and Attentive dominate the DTC apparel tool stack because the two platforms handle 90 percent of the flow logic without custom development. Our what is fashion marketing primer covers how the retention layer plugs into the wider channel mix.
Post purchase content that grows LTV
Post purchase content covers the four weeks after delivery on a first order. Styling emails that pair the purchased SKU with three complementary pieces. A fit review request at day seven when the buyer has worn the garment twice. A community moment at day fourteen with user photos of the same SKU. A second order incentive at day 28 with a category adjacent recommendation. Programs that publish the full post purchase sequence grow lifetime value 22 to 45 percent by month twelve on the same first order cohort, and the retention layer starts to carry the revenue growth the paid team used to carry alone.
Benchmarks inside fashion ecommerce marketing
Benchmarks make the plan honest. A DTC apparel brand reads its own numbers against the industry median every quarter and acts on the gaps that show up. Conversion rate. Blended cost per order. Return rate. Repeat purchase rate. Email revenue share. Each has an honest median for the revenue band, and the numbers change slowly year over year.
| Revenue band | Conversion rate | Blended CPO | Return rate (womenswear) | Day 90 repeat rate | Email revenue share |
|---|---|---|---|---|---|
| Under $80K monthly | 1.2% to 1.8% | $38 to $54 | 26% to 34% | 10% to 18% | 18% to 26% |
| $80K to $250K monthly | 1.6% to 2.4% | $28 to $46 | 24% to 32% | 16% to 24% | 22% to 30% |
| $250K to $600K monthly | 2.0% to 2.8% | $22 to $38 | 22% to 30% | 22% to 32% | 26% to 34% |
| $600K to $1.5M monthly | 2.4% to 3.4% | $18 to $32 | 20% to 28% | 28% to 38% | 28% to 36% |
| Above $1.5M monthly | 2.8% to 4.0% | $16 to $28 | 18% to 26% | 32% to 45% | 30% to 38% |
A founder who reads a monthly dashboard against these benchmarks catches the drift inside 30 days and adjusts the plan before the quarter closes. A founder who reads only the paid social dashboard catches the drift 90 days late, which usually means the correction shows up in the next quarter revenue instead of the current one. That single reporting habit is the difference between an apparel plan that grows and an apparel plan that runs in place while the founder wonders what actually changed under the surface. Founders scoping the wider paid team should read our fashion marketing agency guide for the retainer scope that sits above these benchmark reads.
How do you measure fashion ecommerce marketing honestly
Honest measurement of fashion ecommerce marketing runs on four data streams reconciled inside one weekly dashboard. Shopify revenue by UTM and discount code. Google Analytics 4 sessions and assisted conversion. Meta and TikTok ads platform attribution. A post purchase survey on every order that asks where the buyer first saw the brand. Each stream lies on its own.
The single biggest reporting mistake is trusting Meta own return on ad spend number as the campaign result. Meta over reports by 30 to 90 percent on apparel accounts because the pixel double counts view through and click through revenue that would have converted anyway. Google Analytics 4 under reports because the model discounts paid social influence on longer consideration windows. Shopify tells the truth on first order revenue but nothing on assisted revenue. Post purchase surveys catch the audience that saw the campaign on TikTok, searched a week later, and bought through direct traffic. The four streams together reconcile inside a 5 to 8 percent margin on a well tagged apparel account. Google’s attribution model documentation is the source every founder should read before arguing about which number is correct.
Every plan reports campaign level revenue against the campaign level budget with a 7 day and 30 day view. Anything shorter than 7 days is noise on an apparel buying cycle. Anything longer than 30 days is too late to change the current campaign trajectory. The founder reads the dashboard once a week on Monday morning before the review meeting, not once at the end of the quarter when the numbers are already locked into a bad direction.
Fashion ecommerce marketing in production
Boogie Board came to our team with a DTC ecommerce program running the same problem most apparel brands run at $340,000 monthly. Product pages with four images per SKU, no fit content on the size selector, a checkout that pushed size to step two on mobile, cost per acquisition at $150.92 and climbing, and a founder who read the paid social dashboard at face value every Monday. The plan looked busy on paper. The margin math looked thin on the P and L.
Our team rebuilt the ecommerce path around the five node stack. Rewrote the product page template with 8 to 12 images per SKU, garment measurements at the SKU level, and fit review pull quotes below the size selector. Moved size selection to first field at the top of the mobile checkout. Rebuilt the top 40 SKU catalog feed with lifestyle imagery and hand written titles. Turned on the seven core Klaviyo flows and a Attentive SMS list at week three. Server side tracking went in through Elevar in week two. Weekly Monday review meetings replaced the end of month post mortem, with the founder in the room and empowered to kill a campaign at week two.
Twelve months in, blended cost per acquisition dropped to $31. Conversion rate on the paid landing pages climbed 11 percent. Return rate on womenswear dropped from 38 percent to 26 percent. Day 90 repeat purchase rate grew from 22 percent to 41 percent. Managed ad budget grew to $650,000 monthly on the same margin profile. The result did not come from a magic new channel. It came from applying the five node stack, the checkout discipline, and the review cadence the plan required from day one.
The weekly review that keeps the plan honest
The Monday review meeting is where an apparel plan earns the right to keep spending. Forty five minutes, three agenda items, one decision. Read the reconciled dashboard. Review the top and bottom three ad creatives by cost per order. Decide whether the current campaign continues into next week, gets a creative pivot, or gets killed. The founder is invited and expected to make the kill decision when the numbers warrant it.
Every Monday review meeting eventually reaches the moment where somebody points at the flat performing creative and asks if the founder wants to give it one more week. The founder always says yes. The creative always underperforms for a second week. Nobody remembers who first suggested the extra week. Somewhere in the archive of every apparel brand shared drive, a flat creative is quietly generating more Monday meetings about itself than actual orders about anything on the site.
The kill rule is simple and it holds across every campaign archetype. Day 3 return on ad spend below 40 percent of target and day 7 return below 60 percent of target triggers a 24 hour creative pivot or a full kill. Programs that hold underperforming campaigns for the full run out of hope produce the flat quarters founders learn to fear. Programs that kill fast and reallocate to the winners produce the compounding quarters that make the retainer worth its rate. Founders new to structured plans assume the kill decision hurts the numbers. In practice, killing a flat creative at week two frees the budget to double down on the winner and grows the campaign result 20 to 45 percent inside the next 21 days on an apparel account.
Where fashion ecommerce marketing fits the wider stack
Fashion ecommerce marketing sits above the tactical channel work and below the annual brand strategy inside the growth stack. Every retainer allocation, every creative brief, and every founder decision on inventory rolls up to the five node plan the pod is running against. Programs that budget for tactics without the plan produce busy months with soft revenue. Programs that build the plan first produce quarters where every product page, every ad, and every email adds up to a single growth arc the founder can defend at a board meeting.
The retainer that runs the plan starts at $599 monthly on a 6 month contract and scales with revenue. The retainer covers merchandising audits, fit content templates, product page image direction, checkout audits, retention flow builds, weekly review meetings, and quarterly server side tracking audits. Founders scoping the wider agency side should also read our apparel fashion marketing hub for the broader deliverable list and pricing tiers by revenue band.
The retainer scales with revenue band, deliverable scope, and the number of active campaigns per quarter. A brand at $80,000 monthly runs a lean retainer with the founder in the review meeting. A brand at $600,000 monthly runs a fuller retainer with a dedicated pod and monthly media mix modeling reads. Every retainer tier ties back to the five node stack the plan requires, and every quarterly review closes the loop between the tactical channel work and the strategic growth arc the founder is defending on the P and L. Two outside reads worth an hour before the first plan cycle kicks off. Meta catalog quality reference above for feed hygiene. The Business of Fashion opinions section for the macro context that shapes which trends deserve budget in a given quarter on the merchandising side.
Return rate is the single margin killer on DTC apparel. Womenswear runs 22 to 30 percent, menswear 12 to 18 percent, accessories 6 to 10 percent. Two thirds of apparel returns cite fit or size as the reason. Fashion ecommerce marketing that ignores fit content spends the paid social budget twice on every return that goes back into inventory.
The plan builds a fit content stack on every SKU. Model height and size worn in the product description. Garment measurements at the SKU level, not the style level. Fit review notes pulled from customer reviews on a dedicated Fit tab. Size guides at the collection level with the actual measurement method photographed. Programs that publish the full fit stack on every SKU cut return rate 4 to 9 percentage points inside two quarters, which is the biggest margin move available in apparel without a supply chain change.
Where the fit content lives on the page
Fit content lives above the fold on desktop and inside the third scroll on mobile. The size chart lives one tap deep from the size selector, not three clicks deep behind a footer link. Fit review pull quotes live directly below the size selector so the buyer reads what the size chart says and what other buyers actually experienced in the same tap. That single change grows conversion rate 6 to 14 percent on apparel accounts we have tested inside 30 days, and it costs nothing in creative production because the copy already exists in the review corpus.
Fit tech worth funding
True Fit, Fit Analytics, and Bold Metrics carry the automated fit recommendation layer on scaled apparel programs. Each pulls buyer inputs (height, weight, common size in another brand) and recommends a size at add to cart. Return rate drops 3 to 7 percentage points on the SKUs where the tool is live and the buyer engages with the input flow. Below $250,000 monthly, the tool license outruns the return savings. Above $600,000 monthly, the math flips and the tool pays for itself inside a quarter.
Product page imagery inside fashion ecommerce marketing
Product page imagery is where a paid social click either converts or bounces inside eight seconds. The industry median product page ships four images per SKU. The winners ship eight to twelve, and every image answers a specific buyer question the paid ad already primed.
The imagery stack per SKU
A working stack per SKU carries model shot on size medium, model shot on size extra large or size fourteen so the buyer sees the fit at range, flat lay on a neutral ground for the utility view, detail shot on the fabric texture, detail shot on the hardware and stitching, back view on the model, side view on the model, movement clip of 4 to 8 seconds, and a scale shot next to a familiar object for accessories. Programs that publish all twelve image slots grow conversion rate 8 to 22 percent against the four image baseline, and Meta gets richer feed asset variants to test in the ad set.
Video that earns its production cost
Product page video works when it stays under 10 seconds, loops on autoplay, mutes by default, and shows movement the still shot cannot. Longer videos hurt page load and buyer patience without a conversion gain. A DTC apparel brand doing $340,000 monthly should budget $60,000 to $140,000 annually on product page video across the top 40 SKUs by contribution margin. Below that budget, the video shoot day math does not work and the founder ships either thin coverage on all SKUs or full coverage on the wrong ones. Shopify’s product photography guide is a useful outside read for founders scoping a first shoot.
Checkout inside fashion ecommerce marketing
Checkout on apparel carries a size selector as the first field, not the last. Programs that push size selection to a second step lose 4 to 9 percent conversion rate on the same traffic because the mobile buyer scrolls twice for a decision the desktop pattern buries. The mobile buyer decides in under six seconds whether the flow feels safe. Every friction point in that window costs margin.
The checkout structure that respects sizing
The size selector sits directly under the price, above the add to cart button. Sold out sizes stay visible with a strikethrough, not hidden, so the buyer reads the size chart against the availability without a filter reset. A restock notification input replaces the add to cart button on the sold out size. On mobile, the size selector expands into a tap sheet that shows the size chart and fit review pull quotes on the same swipe. That single pattern grows completed checkout rate 6 to 12 percent on apparel accounts we have measured inside 21 days of the deploy.
Shipping and returns copy at the payment step
Shipping thresholds, return windows, and exchange policy live inline at the payment step, not on a footer page. Apparel buyers who read the return policy at cart complete checkout 18 to 30 percent more often than buyers who never see it, and the return rate on those orders drops 2 to 5 percentage points because the buyer bought with the exchange window in mind. Founders who bury return policy on a footer link are trading the transparency dividend for a false conversion gain that costs margin on the back end.
Paid social inside fashion ecommerce marketing
Paid social carries 45 to 60 percent of first order revenue on DTC apparel between $80,000 and $600,000 monthly. Meta and TikTok are the two platforms that fund. Every other platform enters through a 90 day pilot with a hard kill date, not a slow bleed into the always on budget.
Creative velocity as the real budget
Paid social on apparel wins on creative velocity, not media budget. A brand shipping 6 to 12 fresh creative variants weekly across static, Reel, and TikTok formats produces 30 to 60 percent lower cost per order than the same brand shipping 2 to 3 variants weekly on the same media budget. Fashion audiences fatigue creative inside 5 to 9 days on the same face and product angle. The retainer needs to feed that fatigue rate, not fight it, and the creative production line has to run on a weekly cadence with a named producer.
The catalog feed that carries Shopping
Meta Advantage Plus Shopping and TikTok Shop pull directly from the Shopify product feed. Programs that let the feed run on default titles and default images produce 40 to 70 percent higher cost per order than programs that rewrite the top 40 SKU feed titles and swap the primary feed image to the highest performing lifestyle shot. Feed hygiene is the cheapest paid social gain available on an apparel account and the one most founders never open. Meta’s catalog quality reference covers the field level rules that shape delivery.
Retention inside fashion ecommerce marketing
Retention is the layer that decides whether the P and L runs on margin or grinds through paid acquisition to break even. A DTC apparel brand with a 30 percent day 90 repeat rate runs 20 to 35 percent more contribution margin per blended dollar of spend than the same brand at 15 percent. Retention is not one channel. It is a stack of email, SMS, loyalty, and post purchase content on a monthly calendar.
Email and SMS as the core
Email drives 25 to 35 percent of DTC apparel revenue when the flow set is complete. Welcome, browse abandonment, cart abandonment, post purchase, replenishment, VIP, and win back are the seven flows every brand needs live inside the first 90 days. SMS adds another 8 to 15 percent of revenue at a 5 to 12 percent list opt in rate. Klaviyo and Attentive dominate the DTC apparel tool stack because the two platforms handle 90 percent of the flow logic without custom development. Our what is fashion marketing primer covers how the retention layer plugs into the wider channel mix.
Post purchase content that grows LTV
Post purchase content covers the four weeks after delivery on a first order. Styling emails that pair the purchased SKU with three complementary pieces. A fit review request at day seven when the buyer has worn the garment twice. A community moment at day fourteen with user photos of the same SKU. A second order incentive at day 28 with a category adjacent recommendation. Programs that publish the full post purchase sequence grow lifetime value 22 to 45 percent by month twelve on the same first order cohort, and the retention layer starts to carry the revenue growth the paid team used to carry alone.
Benchmarks inside fashion ecommerce marketing
Benchmarks make the plan honest. A DTC apparel brand reads its own numbers against the industry median every quarter and acts on the gaps that show up. Conversion rate. Blended cost per order. Return rate. Repeat purchase rate. Email revenue share. Each has an honest median for the revenue band, and the numbers change slowly year over year.
| Revenue band | Conversion rate | Blended CPO | Return rate (womenswear) | Day 90 repeat rate | Email revenue share |
|---|---|---|---|---|---|
| Under $80K monthly | 1.2% to 1.8% | $38 to $54 | 26% to 34% | 10% to 18% | 18% to 26% |
| $80K to $250K monthly | 1.6% to 2.4% | $28 to $46 | 24% to 32% | 16% to 24% | 22% to 30% |
| $250K to $600K monthly | 2.0% to 2.8% | $22 to $38 | 22% to 30% | 22% to 32% | 26% to 34% |
| $600K to $1.5M monthly | 2.4% to 3.4% | $18 to $32 | 20% to 28% | 28% to 38% | 28% to 36% |
| Above $1.5M monthly | 2.8% to 4.0% | $16 to $28 | 18% to 26% | 32% to 45% | 30% to 38% |
A founder who reads a monthly dashboard against these benchmarks catches the drift inside 30 days and adjusts the plan before the quarter closes. A founder who reads only the paid social dashboard catches the drift 90 days late, which usually means the correction shows up in the next quarter revenue instead of the current one. That single reporting habit is the difference between an apparel plan that grows and an apparel plan that runs in place while the founder wonders what actually changed under the surface. Founders scoping the wider paid team should read our fashion marketing agency guide for the retainer scope that sits above these benchmark reads.
How do you measure fashion ecommerce marketing honestly
Honest measurement of fashion ecommerce marketing runs on four data streams reconciled inside one weekly dashboard. Shopify revenue by UTM and discount code. Google Analytics 4 sessions and assisted conversion. Meta and TikTok ads platform attribution. A post purchase survey on every order that asks where the buyer first saw the brand. Each stream lies on its own.
The single biggest reporting mistake is trusting Meta own return on ad spend number as the campaign result. Meta over reports by 30 to 90 percent on apparel accounts because the pixel double counts view through and click through revenue that would have converted anyway. Google Analytics 4 under reports because the model discounts paid social influence on longer consideration windows. Shopify tells the truth on first order revenue but nothing on assisted revenue. Post purchase surveys catch the audience that saw the campaign on TikTok, searched a week later, and bought through direct traffic. The four streams together reconcile inside a 5 to 8 percent margin on a well tagged apparel account. Google’s attribution model documentation is the source every founder should read before arguing about which number is correct.
Every plan reports campaign level revenue against the campaign level budget with a 7 day and 30 day view. Anything shorter than 7 days is noise on an apparel buying cycle. Anything longer than 30 days is too late to change the current campaign trajectory. The founder reads the dashboard once a week on Monday morning before the review meeting, not once at the end of the quarter when the numbers are already locked into a bad direction.
Fashion ecommerce marketing in production
Boogie Board came to our team with a DTC ecommerce program running the same problem most apparel brands run at $340,000 monthly. Product pages with four images per SKU, no fit content on the size selector, a checkout that pushed size to step two on mobile, cost per acquisition at $150.92 and climbing, and a founder who read the paid social dashboard at face value every Monday. The plan looked busy on paper. The margin math looked thin on the P and L.
Our team rebuilt the ecommerce path around the five node stack. Rewrote the product page template with 8 to 12 images per SKU, garment measurements at the SKU level, and fit review pull quotes below the size selector. Moved size selection to first field at the top of the mobile checkout. Rebuilt the top 40 SKU catalog feed with lifestyle imagery and hand written titles. Turned on the seven core Klaviyo flows and a Attentive SMS list at week three. Server side tracking went in through Elevar in week two. Weekly Monday review meetings replaced the end of month post mortem, with the founder in the room and empowered to kill a campaign at week two.
Twelve months in, blended cost per acquisition dropped to $31. Conversion rate on the paid landing pages climbed 11 percent. Return rate on womenswear dropped from 38 percent to 26 percent. Day 90 repeat purchase rate grew from 22 percent to 41 percent. Managed ad budget grew to $650,000 monthly on the same margin profile. The result did not come from a magic new channel. It came from applying the five node stack, the checkout discipline, and the review cadence the plan required from day one.
The weekly review that keeps the plan honest
The Monday review meeting is where an apparel plan earns the right to keep spending. Forty five minutes, three agenda items, one decision. Read the reconciled dashboard. Review the top and bottom three ad creatives by cost per order. Decide whether the current campaign continues into next week, gets a creative pivot, or gets killed. The founder is invited and expected to make the kill decision when the numbers warrant it.
Every Monday review meeting eventually reaches the moment where somebody points at the flat performing creative and asks if the founder wants to give it one more week. The founder always says yes. The creative always underperforms for a second week. Nobody remembers who first suggested the extra week. Somewhere in the archive of every apparel brand shared drive, a flat creative is quietly generating more Monday meetings about itself than actual orders about anything on the site.
The kill rule is simple and it holds across every campaign archetype. Day 3 return on ad spend below 40 percent of target and day 7 return below 60 percent of target triggers a 24 hour creative pivot or a full kill. Programs that hold underperforming campaigns for the full run out of hope produce the flat quarters founders learn to fear. Programs that kill fast and reallocate to the winners produce the compounding quarters that make the retainer worth its rate. Founders new to structured plans assume the kill decision hurts the numbers. In practice, killing a flat creative at week two frees the budget to double down on the winner and grows the campaign result 20 to 45 percent inside the next 21 days on an apparel account.
Where fashion ecommerce marketing fits the wider stack
Fashion ecommerce marketing sits above the tactical channel work and below the annual brand strategy inside the growth stack. Every retainer allocation, every creative brief, and every founder decision on inventory rolls up to the five node plan the pod is running against. Programs that budget for tactics without the plan produce busy months with soft revenue. Programs that build the plan first produce quarters where every product page, every ad, and every email adds up to a single growth arc the founder can defend at a board meeting.
The retainer that runs the plan starts at $599 monthly on a 6 month contract and scales with revenue. The retainer covers merchandising audits, fit content templates, product page image direction, checkout audits, retention flow builds, weekly review meetings, and quarterly server side tracking audits. Founders scoping the wider agency side should also read our apparel fashion marketing hub for the broader deliverable list and pricing tiers by revenue band.
The retainer scales with revenue band, deliverable scope, and the number of active campaigns per quarter. A brand at $80,000 monthly runs a lean retainer with the founder in the review meeting. A brand at $600,000 monthly runs a fuller retainer with a dedicated pod and monthly media mix modeling reads. Every retainer tier ties back to the five node stack the plan requires, and every quarterly review closes the loop between the tactical channel work and the strategic growth arc the founder is defending on the P and L. Two outside reads worth an hour before the first plan cycle kicks off. Meta catalog quality reference above for feed hygiene. The Business of Fashion opinions section for the macro context that shapes which trends deserve budget in a given quarter on the merchandising side.
Checkout on apparel carries a size selector as the first field, not the last. Programs that push size selection to a second step lose 4 to 9 percent conversion rate on the same traffic because the mobile buyer scrolls twice for a decision the desktop pattern buries. The mobile buyer decides in under six seconds whether the flow feels safe. Every friction point in that window costs margin.
The checkout structure that respects sizing
The size selector sits directly under the price, above the add to cart button. Sold out sizes stay visible with a strikethrough, not hidden, so the buyer reads the size chart against the availability without a filter reset. A restock notification input replaces the add to cart button on the sold out size. On mobile, the size selector expands into a tap sheet that shows the size chart and fit review pull quotes on the same swipe. That single pattern grows completed checkout rate 6 to 12 percent on apparel accounts we have measured inside 21 days of the deploy.
Shipping and returns copy at the payment step
Shipping thresholds, return windows, and exchange policy live inline at the payment step, not on a footer page. Apparel buyers who read the return policy at cart complete checkout 18 to 30 percent more often than buyers who never see it, and the return rate on those orders drops 2 to 5 percentage points because the buyer bought with the exchange window in mind. Founders who bury return policy on a footer link are trading the transparency dividend for a false conversion gain that costs margin on the back end.
Paid social inside fashion ecommerce marketing
Paid social carries 45 to 60 percent of first order revenue on DTC apparel between $80,000 and $600,000 monthly. Meta and TikTok are the two platforms that fund. Every other platform enters through a 90 day pilot with a hard kill date, not a slow bleed into the always on budget.
Creative velocity as the real budget
Paid social on apparel wins on creative velocity, not media budget. A brand shipping 6 to 12 fresh creative variants weekly across static, Reel, and TikTok formats produces 30 to 60 percent lower cost per order than the same brand shipping 2 to 3 variants weekly on the same media budget. Fashion audiences fatigue creative inside 5 to 9 days on the same face and product angle. The retainer needs to feed that fatigue rate, not fight it, and the creative production line has to run on a weekly cadence with a named producer.
The catalog feed that carries Shopping
Meta Advantage Plus Shopping and TikTok Shop pull directly from the Shopify product feed. Programs that let the feed run on default titles and default images produce 40 to 70 percent higher cost per order than programs that rewrite the top 40 SKU feed titles and swap the primary feed image to the highest performing lifestyle shot. Feed hygiene is the cheapest paid social gain available on an apparel account and the one most founders never open. Meta’s catalog quality reference covers the field level rules that shape delivery.
Retention inside fashion ecommerce marketing
Retention is the layer that decides whether the P and L runs on margin or grinds through paid acquisition to break even. A DTC apparel brand with a 30 percent day 90 repeat rate runs 20 to 35 percent more contribution margin per blended dollar of spend than the same brand at 15 percent. Retention is not one channel. It is a stack of email, SMS, loyalty, and post purchase content on a monthly calendar.
Email and SMS as the core
Email drives 25 to 35 percent of DTC apparel revenue when the flow set is complete. Welcome, browse abandonment, cart abandonment, post purchase, replenishment, VIP, and win back are the seven flows every brand needs live inside the first 90 days. SMS adds another 8 to 15 percent of revenue at a 5 to 12 percent list opt in rate. Klaviyo and Attentive dominate the DTC apparel tool stack because the two platforms handle 90 percent of the flow logic without custom development. Our what is fashion marketing primer covers how the retention layer plugs into the wider channel mix.
Post purchase content that grows LTV
Post purchase content covers the four weeks after delivery on a first order. Styling emails that pair the purchased SKU with three complementary pieces. A fit review request at day seven when the buyer has worn the garment twice. A community moment at day fourteen with user photos of the same SKU. A second order incentive at day 28 with a category adjacent recommendation. Programs that publish the full post purchase sequence grow lifetime value 22 to 45 percent by month twelve on the same first order cohort, and the retention layer starts to carry the revenue growth the paid team used to carry alone.
Benchmarks inside fashion ecommerce marketing
Benchmarks make the plan honest. A DTC apparel brand reads its own numbers against the industry median every quarter and acts on the gaps that show up. Conversion rate. Blended cost per order. Return rate. Repeat purchase rate. Email revenue share. Each has an honest median for the revenue band, and the numbers change slowly year over year.
| Revenue band | Conversion rate | Blended CPO | Return rate (womenswear) | Day 90 repeat rate | Email revenue share |
|---|---|---|---|---|---|
| Under $80K monthly | 1.2% to 1.8% | $38 to $54 | 26% to 34% | 10% to 18% | 18% to 26% |
| $80K to $250K monthly | 1.6% to 2.4% | $28 to $46 | 24% to 32% | 16% to 24% | 22% to 30% |
| $250K to $600K monthly | 2.0% to 2.8% | $22 to $38 | 22% to 30% | 22% to 32% | 26% to 34% |
| $600K to $1.5M monthly | 2.4% to 3.4% | $18 to $32 | 20% to 28% | 28% to 38% | 28% to 36% |
| Above $1.5M monthly | 2.8% to 4.0% | $16 to $28 | 18% to 26% | 32% to 45% | 30% to 38% |
A founder who reads a monthly dashboard against these benchmarks catches the drift inside 30 days and adjusts the plan before the quarter closes. A founder who reads only the paid social dashboard catches the drift 90 days late, which usually means the correction shows up in the next quarter revenue instead of the current one. That single reporting habit is the difference between an apparel plan that grows and an apparel plan that runs in place while the founder wonders what actually changed under the surface. Founders scoping the wider paid team should read our fashion marketing agency guide for the retainer scope that sits above these benchmark reads.
How do you measure fashion ecommerce marketing honestly
Honest measurement of fashion ecommerce marketing runs on four data streams reconciled inside one weekly dashboard. Shopify revenue by UTM and discount code. Google Analytics 4 sessions and assisted conversion. Meta and TikTok ads platform attribution. A post purchase survey on every order that asks where the buyer first saw the brand. Each stream lies on its own.
The single biggest reporting mistake is trusting Meta own return on ad spend number as the campaign result. Meta over reports by 30 to 90 percent on apparel accounts because the pixel double counts view through and click through revenue that would have converted anyway. Google Analytics 4 under reports because the model discounts paid social influence on longer consideration windows. Shopify tells the truth on first order revenue but nothing on assisted revenue. Post purchase surveys catch the audience that saw the campaign on TikTok, searched a week later, and bought through direct traffic. The four streams together reconcile inside a 5 to 8 percent margin on a well tagged apparel account. Google’s attribution model documentation is the source every founder should read before arguing about which number is correct.
Every plan reports campaign level revenue against the campaign level budget with a 7 day and 30 day view. Anything shorter than 7 days is noise on an apparel buying cycle. Anything longer than 30 days is too late to change the current campaign trajectory. The founder reads the dashboard once a week on Monday morning before the review meeting, not once at the end of the quarter when the numbers are already locked into a bad direction.
Fashion ecommerce marketing in production
Boogie Board came to our team with a DTC ecommerce program running the same problem most apparel brands run at $340,000 monthly. Product pages with four images per SKU, no fit content on the size selector, a checkout that pushed size to step two on mobile, cost per acquisition at $150.92 and climbing, and a founder who read the paid social dashboard at face value every Monday. The plan looked busy on paper. The margin math looked thin on the P and L.
Our team rebuilt the ecommerce path around the five node stack. Rewrote the product page template with 8 to 12 images per SKU, garment measurements at the SKU level, and fit review pull quotes below the size selector. Moved size selection to first field at the top of the mobile checkout. Rebuilt the top 40 SKU catalog feed with lifestyle imagery and hand written titles. Turned on the seven core Klaviyo flows and a Attentive SMS list at week three. Server side tracking went in through Elevar in week two. Weekly Monday review meetings replaced the end of month post mortem, with the founder in the room and empowered to kill a campaign at week two.
Twelve months in, blended cost per acquisition dropped to $31. Conversion rate on the paid landing pages climbed 11 percent. Return rate on womenswear dropped from 38 percent to 26 percent. Day 90 repeat purchase rate grew from 22 percent to 41 percent. Managed ad budget grew to $650,000 monthly on the same margin profile. The result did not come from a magic new channel. It came from applying the five node stack, the checkout discipline, and the review cadence the plan required from day one.
The weekly review that keeps the plan honest
The Monday review meeting is where an apparel plan earns the right to keep spending. Forty five minutes, three agenda items, one decision. Read the reconciled dashboard. Review the top and bottom three ad creatives by cost per order. Decide whether the current campaign continues into next week, gets a creative pivot, or gets killed. The founder is invited and expected to make the kill decision when the numbers warrant it.
Every Monday review meeting eventually reaches the moment where somebody points at the flat performing creative and asks if the founder wants to give it one more week. The founder always says yes. The creative always underperforms for a second week. Nobody remembers who first suggested the extra week. Somewhere in the archive of every apparel brand shared drive, a flat creative is quietly generating more Monday meetings about itself than actual orders about anything on the site.
The kill rule is simple and it holds across every campaign archetype. Day 3 return on ad spend below 40 percent of target and day 7 return below 60 percent of target triggers a 24 hour creative pivot or a full kill. Programs that hold underperforming campaigns for the full run out of hope produce the flat quarters founders learn to fear. Programs that kill fast and reallocate to the winners produce the compounding quarters that make the retainer worth its rate. Founders new to structured plans assume the kill decision hurts the numbers. In practice, killing a flat creative at week two frees the budget to double down on the winner and grows the campaign result 20 to 45 percent inside the next 21 days on an apparel account.
Where fashion ecommerce marketing fits the wider stack
Fashion ecommerce marketing sits above the tactical channel work and below the annual brand strategy inside the growth stack. Every retainer allocation, every creative brief, and every founder decision on inventory rolls up to the five node plan the pod is running against. Programs that budget for tactics without the plan produce busy months with soft revenue. Programs that build the plan first produce quarters where every product page, every ad, and every email adds up to a single growth arc the founder can defend at a board meeting.
The retainer that runs the plan starts at $599 monthly on a 6 month contract and scales with revenue. The retainer covers merchandising audits, fit content templates, product page image direction, checkout audits, retention flow builds, weekly review meetings, and quarterly server side tracking audits. Founders scoping the wider agency side should also read our apparel fashion marketing hub for the broader deliverable list and pricing tiers by revenue band.
The retainer scales with revenue band, deliverable scope, and the number of active campaigns per quarter. A brand at $80,000 monthly runs a lean retainer with the founder in the review meeting. A brand at $600,000 monthly runs a fuller retainer with a dedicated pod and monthly media mix modeling reads. Every retainer tier ties back to the five node stack the plan requires, and every quarterly review closes the loop between the tactical channel work and the strategic growth arc the founder is defending on the P and L. Two outside reads worth an hour before the first plan cycle kicks off. Meta catalog quality reference above for feed hygiene. The Business of Fashion opinions section for the macro context that shapes which trends deserve budget in a given quarter on the merchandising side.
Product page imagery is where a paid social click either converts or bounces inside eight seconds. The industry median product page ships four images per SKU. The winners ship eight to twelve, and every image answers a specific buyer question the paid ad already primed.
The imagery stack per SKU
A working stack per SKU carries model shot on size medium, model shot on size extra large or size fourteen so the buyer sees the fit at range, flat lay on a neutral ground for the utility view, detail shot on the fabric texture, detail shot on the hardware and stitching, back view on the model, side view on the model, movement clip of 4 to 8 seconds, and a scale shot next to a familiar object for accessories. Programs that publish all twelve image slots grow conversion rate 8 to 22 percent against the four image baseline, and Meta gets richer feed asset variants to test in the ad set.
Video that earns its production cost
Product page video works when it stays under 10 seconds, loops on autoplay, mutes by default, and shows movement the still shot cannot. Longer videos hurt page load and buyer patience without a conversion gain. A DTC apparel brand doing $340,000 monthly should budget $60,000 to $140,000 annually on product page video across the top 40 SKUs by contribution margin. Below that budget, the video shoot day math does not work and the founder ships either thin coverage on all SKUs or full coverage on the wrong ones. Shopify’s product photography guide is a useful outside read for founders scoping a first shoot.
Checkout inside fashion ecommerce marketing
Checkout on apparel carries a size selector as the first field, not the last. Programs that push size selection to a second step lose 4 to 9 percent conversion rate on the same traffic because the mobile buyer scrolls twice for a decision the desktop pattern buries. The mobile buyer decides in under six seconds whether the flow feels safe. Every friction point in that window costs margin.
The checkout structure that respects sizing
The size selector sits directly under the price, above the add to cart button. Sold out sizes stay visible with a strikethrough, not hidden, so the buyer reads the size chart against the availability without a filter reset. A restock notification input replaces the add to cart button on the sold out size. On mobile, the size selector expands into a tap sheet that shows the size chart and fit review pull quotes on the same swipe. That single pattern grows completed checkout rate 6 to 12 percent on apparel accounts we have measured inside 21 days of the deploy.
Shipping and returns copy at the payment step
Shipping thresholds, return windows, and exchange policy live inline at the payment step, not on a footer page. Apparel buyers who read the return policy at cart complete checkout 18 to 30 percent more often than buyers who never see it, and the return rate on those orders drops 2 to 5 percentage points because the buyer bought with the exchange window in mind. Founders who bury return policy on a footer link are trading the transparency dividend for a false conversion gain that costs margin on the back end.
Paid social inside fashion ecommerce marketing
Paid social carries 45 to 60 percent of first order revenue on DTC apparel between $80,000 and $600,000 monthly. Meta and TikTok are the two platforms that fund. Every other platform enters through a 90 day pilot with a hard kill date, not a slow bleed into the always on budget.
Creative velocity as the real budget
Paid social on apparel wins on creative velocity, not media budget. A brand shipping 6 to 12 fresh creative variants weekly across static, Reel, and TikTok formats produces 30 to 60 percent lower cost per order than the same brand shipping 2 to 3 variants weekly on the same media budget. Fashion audiences fatigue creative inside 5 to 9 days on the same face and product angle. The retainer needs to feed that fatigue rate, not fight it, and the creative production line has to run on a weekly cadence with a named producer.
The catalog feed that carries Shopping
Meta Advantage Plus Shopping and TikTok Shop pull directly from the Shopify product feed. Programs that let the feed run on default titles and default images produce 40 to 70 percent higher cost per order than programs that rewrite the top 40 SKU feed titles and swap the primary feed image to the highest performing lifestyle shot. Feed hygiene is the cheapest paid social gain available on an apparel account and the one most founders never open. Meta’s catalog quality reference covers the field level rules that shape delivery.
Retention inside fashion ecommerce marketing
Retention is the layer that decides whether the P and L runs on margin or grinds through paid acquisition to break even. A DTC apparel brand with a 30 percent day 90 repeat rate runs 20 to 35 percent more contribution margin per blended dollar of spend than the same brand at 15 percent. Retention is not one channel. It is a stack of email, SMS, loyalty, and post purchase content on a monthly calendar.
Email and SMS as the core
Email drives 25 to 35 percent of DTC apparel revenue when the flow set is complete. Welcome, browse abandonment, cart abandonment, post purchase, replenishment, VIP, and win back are the seven flows every brand needs live inside the first 90 days. SMS adds another 8 to 15 percent of revenue at a 5 to 12 percent list opt in rate. Klaviyo and Attentive dominate the DTC apparel tool stack because the two platforms handle 90 percent of the flow logic without custom development. Our what is fashion marketing primer covers how the retention layer plugs into the wider channel mix.
Post purchase content that grows LTV
Post purchase content covers the four weeks after delivery on a first order. Styling emails that pair the purchased SKU with three complementary pieces. A fit review request at day seven when the buyer has worn the garment twice. A community moment at day fourteen with user photos of the same SKU. A second order incentive at day 28 with a category adjacent recommendation. Programs that publish the full post purchase sequence grow lifetime value 22 to 45 percent by month twelve on the same first order cohort, and the retention layer starts to carry the revenue growth the paid team used to carry alone.
Benchmarks inside fashion ecommerce marketing
Benchmarks make the plan honest. A DTC apparel brand reads its own numbers against the industry median every quarter and acts on the gaps that show up. Conversion rate. Blended cost per order. Return rate. Repeat purchase rate. Email revenue share. Each has an honest median for the revenue band, and the numbers change slowly year over year.
| Revenue band | Conversion rate | Blended CPO | Return rate (womenswear) | Day 90 repeat rate | Email revenue share |
|---|---|---|---|---|---|
| Under $80K monthly | 1.2% to 1.8% | $38 to $54 | 26% to 34% | 10% to 18% | 18% to 26% |
| $80K to $250K monthly | 1.6% to 2.4% | $28 to $46 | 24% to 32% | 16% to 24% | 22% to 30% |
| $250K to $600K monthly | 2.0% to 2.8% | $22 to $38 | 22% to 30% | 22% to 32% | 26% to 34% |
| $600K to $1.5M monthly | 2.4% to 3.4% | $18 to $32 | 20% to 28% | 28% to 38% | 28% to 36% |
| Above $1.5M monthly | 2.8% to 4.0% | $16 to $28 | 18% to 26% | 32% to 45% | 30% to 38% |
A founder who reads a monthly dashboard against these benchmarks catches the drift inside 30 days and adjusts the plan before the quarter closes. A founder who reads only the paid social dashboard catches the drift 90 days late, which usually means the correction shows up in the next quarter revenue instead of the current one. That single reporting habit is the difference between an apparel plan that grows and an apparel plan that runs in place while the founder wonders what actually changed under the surface. Founders scoping the wider paid team should read our fashion marketing agency guide for the retainer scope that sits above these benchmark reads.
How do you measure fashion ecommerce marketing honestly
Honest measurement of fashion ecommerce marketing runs on four data streams reconciled inside one weekly dashboard. Shopify revenue by UTM and discount code. Google Analytics 4 sessions and assisted conversion. Meta and TikTok ads platform attribution. A post purchase survey on every order that asks where the buyer first saw the brand. Each stream lies on its own.
The single biggest reporting mistake is trusting Meta own return on ad spend number as the campaign result. Meta over reports by 30 to 90 percent on apparel accounts because the pixel double counts view through and click through revenue that would have converted anyway. Google Analytics 4 under reports because the model discounts paid social influence on longer consideration windows. Shopify tells the truth on first order revenue but nothing on assisted revenue. Post purchase surveys catch the audience that saw the campaign on TikTok, searched a week later, and bought through direct traffic. The four streams together reconcile inside a 5 to 8 percent margin on a well tagged apparel account. Google’s attribution model documentation is the source every founder should read before arguing about which number is correct.
Every plan reports campaign level revenue against the campaign level budget with a 7 day and 30 day view. Anything shorter than 7 days is noise on an apparel buying cycle. Anything longer than 30 days is too late to change the current campaign trajectory. The founder reads the dashboard once a week on Monday morning before the review meeting, not once at the end of the quarter when the numbers are already locked into a bad direction.
Fashion ecommerce marketing in production
Boogie Board came to our team with a DTC ecommerce program running the same problem most apparel brands run at $340,000 monthly. Product pages with four images per SKU, no fit content on the size selector, a checkout that pushed size to step two on mobile, cost per acquisition at $150.92 and climbing, and a founder who read the paid social dashboard at face value every Monday. The plan looked busy on paper. The margin math looked thin on the P and L.
Our team rebuilt the ecommerce path around the five node stack. Rewrote the product page template with 8 to 12 images per SKU, garment measurements at the SKU level, and fit review pull quotes below the size selector. Moved size selection to first field at the top of the mobile checkout. Rebuilt the top 40 SKU catalog feed with lifestyle imagery and hand written titles. Turned on the seven core Klaviyo flows and a Attentive SMS list at week three. Server side tracking went in through Elevar in week two. Weekly Monday review meetings replaced the end of month post mortem, with the founder in the room and empowered to kill a campaign at week two.
Twelve months in, blended cost per acquisition dropped to $31. Conversion rate on the paid landing pages climbed 11 percent. Return rate on womenswear dropped from 38 percent to 26 percent. Day 90 repeat purchase rate grew from 22 percent to 41 percent. Managed ad budget grew to $650,000 monthly on the same margin profile. The result did not come from a magic new channel. It came from applying the five node stack, the checkout discipline, and the review cadence the plan required from day one.
The weekly review that keeps the plan honest
The Monday review meeting is where an apparel plan earns the right to keep spending. Forty five minutes, three agenda items, one decision. Read the reconciled dashboard. Review the top and bottom three ad creatives by cost per order. Decide whether the current campaign continues into next week, gets a creative pivot, or gets killed. The founder is invited and expected to make the kill decision when the numbers warrant it.
Every Monday review meeting eventually reaches the moment where somebody points at the flat performing creative and asks if the founder wants to give it one more week. The founder always says yes. The creative always underperforms for a second week. Nobody remembers who first suggested the extra week. Somewhere in the archive of every apparel brand shared drive, a flat creative is quietly generating more Monday meetings about itself than actual orders about anything on the site.
The kill rule is simple and it holds across every campaign archetype. Day 3 return on ad spend below 40 percent of target and day 7 return below 60 percent of target triggers a 24 hour creative pivot or a full kill. Programs that hold underperforming campaigns for the full run out of hope produce the flat quarters founders learn to fear. Programs that kill fast and reallocate to the winners produce the compounding quarters that make the retainer worth its rate. Founders new to structured plans assume the kill decision hurts the numbers. In practice, killing a flat creative at week two frees the budget to double down on the winner and grows the campaign result 20 to 45 percent inside the next 21 days on an apparel account.
Where fashion ecommerce marketing fits the wider stack
Fashion ecommerce marketing sits above the tactical channel work and below the annual brand strategy inside the growth stack. Every retainer allocation, every creative brief, and every founder decision on inventory rolls up to the five node plan the pod is running against. Programs that budget for tactics without the plan produce busy months with soft revenue. Programs that build the plan first produce quarters where every product page, every ad, and every email adds up to a single growth arc the founder can defend at a board meeting.
The retainer that runs the plan starts at $599 monthly on a 6 month contract and scales with revenue. The retainer covers merchandising audits, fit content templates, product page image direction, checkout audits, retention flow builds, weekly review meetings, and quarterly server side tracking audits. Founders scoping the wider agency side should also read our apparel fashion marketing hub for the broader deliverable list and pricing tiers by revenue band.
The retainer scales with revenue band, deliverable scope, and the number of active campaigns per quarter. A brand at $80,000 monthly runs a lean retainer with the founder in the review meeting. A brand at $600,000 monthly runs a fuller retainer with a dedicated pod and monthly media mix modeling reads. Every retainer tier ties back to the five node stack the plan requires, and every quarterly review closes the loop between the tactical channel work and the strategic growth arc the founder is defending on the P and L. Two outside reads worth an hour before the first plan cycle kicks off. Meta catalog quality reference above for feed hygiene. The Business of Fashion opinions section for the macro context that shapes which trends deserve budget in a given quarter on the merchandising side.
Return rate is the single margin killer on DTC apparel. Womenswear runs 22 to 30 percent, menswear 12 to 18 percent, accessories 6 to 10 percent. Two thirds of apparel returns cite fit or size as the reason. Fashion ecommerce marketing that ignores fit content spends the paid social budget twice on every return that goes back into inventory.
The plan builds a fit content stack on every SKU. Model height and size worn in the product description. Garment measurements at the SKU level, not the style level. Fit review notes pulled from customer reviews on a dedicated Fit tab. Size guides at the collection level with the actual measurement method photographed. Programs that publish the full fit stack on every SKU cut return rate 4 to 9 percentage points inside two quarters, which is the biggest margin move available in apparel without a supply chain change.
Where the fit content lives on the page
Fit content lives above the fold on desktop and inside the third scroll on mobile. The size chart lives one tap deep from the size selector, not three clicks deep behind a footer link. Fit review pull quotes live directly below the size selector so the buyer reads what the size chart says and what other buyers actually experienced in the same tap. That single change grows conversion rate 6 to 14 percent on apparel accounts we have tested inside 30 days, and it costs nothing in creative production because the copy already exists in the review corpus.
Fit tech worth funding
True Fit, Fit Analytics, and Bold Metrics carry the automated fit recommendation layer on scaled apparel programs. Each pulls buyer inputs (height, weight, common size in another brand) and recommends a size at add to cart. Return rate drops 3 to 7 percentage points on the SKUs where the tool is live and the buyer engages with the input flow. Below $250,000 monthly, the tool license outruns the return savings. Above $600,000 monthly, the math flips and the tool pays for itself inside a quarter.
Product page imagery inside fashion ecommerce marketing
Product page imagery is where a paid social click either converts or bounces inside eight seconds. The industry median product page ships four images per SKU. The winners ship eight to twelve, and every image answers a specific buyer question the paid ad already primed.
The imagery stack per SKU
A working stack per SKU carries model shot on size medium, model shot on size extra large or size fourteen so the buyer sees the fit at range, flat lay on a neutral ground for the utility view, detail shot on the fabric texture, detail shot on the hardware and stitching, back view on the model, side view on the model, movement clip of 4 to 8 seconds, and a scale shot next to a familiar object for accessories. Programs that publish all twelve image slots grow conversion rate 8 to 22 percent against the four image baseline, and Meta gets richer feed asset variants to test in the ad set.
Video that earns its production cost
Product page video works when it stays under 10 seconds, loops on autoplay, mutes by default, and shows movement the still shot cannot. Longer videos hurt page load and buyer patience without a conversion gain. A DTC apparel brand doing $340,000 monthly should budget $60,000 to $140,000 annually on product page video across the top 40 SKUs by contribution margin. Below that budget, the video shoot day math does not work and the founder ships either thin coverage on all SKUs or full coverage on the wrong ones. Shopify’s product photography guide is a useful outside read for founders scoping a first shoot.
Checkout inside fashion ecommerce marketing
Checkout on apparel carries a size selector as the first field, not the last. Programs that push size selection to a second step lose 4 to 9 percent conversion rate on the same traffic because the mobile buyer scrolls twice for a decision the desktop pattern buries. The mobile buyer decides in under six seconds whether the flow feels safe. Every friction point in that window costs margin.
The checkout structure that respects sizing
The size selector sits directly under the price, above the add to cart button. Sold out sizes stay visible with a strikethrough, not hidden, so the buyer reads the size chart against the availability without a filter reset. A restock notification input replaces the add to cart button on the sold out size. On mobile, the size selector expands into a tap sheet that shows the size chart and fit review pull quotes on the same swipe. That single pattern grows completed checkout rate 6 to 12 percent on apparel accounts we have measured inside 21 days of the deploy.
Shipping and returns copy at the payment step
Shipping thresholds, return windows, and exchange policy live inline at the payment step, not on a footer page. Apparel buyers who read the return policy at cart complete checkout 18 to 30 percent more often than buyers who never see it, and the return rate on those orders drops 2 to 5 percentage points because the buyer bought with the exchange window in mind. Founders who bury return policy on a footer link are trading the transparency dividend for a false conversion gain that costs margin on the back end.
Paid social inside fashion ecommerce marketing
Paid social carries 45 to 60 percent of first order revenue on DTC apparel between $80,000 and $600,000 monthly. Meta and TikTok are the two platforms that fund. Every other platform enters through a 90 day pilot with a hard kill date, not a slow bleed into the always on budget.
Creative velocity as the real budget
Paid social on apparel wins on creative velocity, not media budget. A brand shipping 6 to 12 fresh creative variants weekly across static, Reel, and TikTok formats produces 30 to 60 percent lower cost per order than the same brand shipping 2 to 3 variants weekly on the same media budget. Fashion audiences fatigue creative inside 5 to 9 days on the same face and product angle. The retainer needs to feed that fatigue rate, not fight it, and the creative production line has to run on a weekly cadence with a named producer.
The catalog feed that carries Shopping
Meta Advantage Plus Shopping and TikTok Shop pull directly from the Shopify product feed. Programs that let the feed run on default titles and default images produce 40 to 70 percent higher cost per order than programs that rewrite the top 40 SKU feed titles and swap the primary feed image to the highest performing lifestyle shot. Feed hygiene is the cheapest paid social gain available on an apparel account and the one most founders never open. Meta’s catalog quality reference covers the field level rules that shape delivery.
Retention inside fashion ecommerce marketing
Retention is the layer that decides whether the P and L runs on margin or grinds through paid acquisition to break even. A DTC apparel brand with a 30 percent day 90 repeat rate runs 20 to 35 percent more contribution margin per blended dollar of spend than the same brand at 15 percent. Retention is not one channel. It is a stack of email, SMS, loyalty, and post purchase content on a monthly calendar.
Email and SMS as the core
Email drives 25 to 35 percent of DTC apparel revenue when the flow set is complete. Welcome, browse abandonment, cart abandonment, post purchase, replenishment, VIP, and win back are the seven flows every brand needs live inside the first 90 days. SMS adds another 8 to 15 percent of revenue at a 5 to 12 percent list opt in rate. Klaviyo and Attentive dominate the DTC apparel tool stack because the two platforms handle 90 percent of the flow logic without custom development. Our what is fashion marketing primer covers how the retention layer plugs into the wider channel mix.
Post purchase content that grows LTV
Post purchase content covers the four weeks after delivery on a first order. Styling emails that pair the purchased SKU with three complementary pieces. A fit review request at day seven when the buyer has worn the garment twice. A community moment at day fourteen with user photos of the same SKU. A second order incentive at day 28 with a category adjacent recommendation. Programs that publish the full post purchase sequence grow lifetime value 22 to 45 percent by month twelve on the same first order cohort, and the retention layer starts to carry the revenue growth the paid team used to carry alone.
Benchmarks inside fashion ecommerce marketing
Benchmarks make the plan honest. A DTC apparel brand reads its own numbers against the industry median every quarter and acts on the gaps that show up. Conversion rate. Blended cost per order. Return rate. Repeat purchase rate. Email revenue share. Each has an honest median for the revenue band, and the numbers change slowly year over year.
| Revenue band | Conversion rate | Blended CPO | Return rate (womenswear) | Day 90 repeat rate | Email revenue share |
|---|---|---|---|---|---|
| Under $80K monthly | 1.2% to 1.8% | $38 to $54 | 26% to 34% | 10% to 18% | 18% to 26% |
| $80K to $250K monthly | 1.6% to 2.4% | $28 to $46 | 24% to 32% | 16% to 24% | 22% to 30% |
| $250K to $600K monthly | 2.0% to 2.8% | $22 to $38 | 22% to 30% | 22% to 32% | 26% to 34% |
| $600K to $1.5M monthly | 2.4% to 3.4% | $18 to $32 | 20% to 28% | 28% to 38% | 28% to 36% |
| Above $1.5M monthly | 2.8% to 4.0% | $16 to $28 | 18% to 26% | 32% to 45% | 30% to 38% |
A founder who reads a monthly dashboard against these benchmarks catches the drift inside 30 days and adjusts the plan before the quarter closes. A founder who reads only the paid social dashboard catches the drift 90 days late, which usually means the correction shows up in the next quarter revenue instead of the current one. That single reporting habit is the difference between an apparel plan that grows and an apparel plan that runs in place while the founder wonders what actually changed under the surface. Founders scoping the wider paid team should read our fashion marketing agency guide for the retainer scope that sits above these benchmark reads.
How do you measure fashion ecommerce marketing honestly
Honest measurement of fashion ecommerce marketing runs on four data streams reconciled inside one weekly dashboard. Shopify revenue by UTM and discount code. Google Analytics 4 sessions and assisted conversion. Meta and TikTok ads platform attribution. A post purchase survey on every order that asks where the buyer first saw the brand. Each stream lies on its own.
The single biggest reporting mistake is trusting Meta own return on ad spend number as the campaign result. Meta over reports by 30 to 90 percent on apparel accounts because the pixel double counts view through and click through revenue that would have converted anyway. Google Analytics 4 under reports because the model discounts paid social influence on longer consideration windows. Shopify tells the truth on first order revenue but nothing on assisted revenue. Post purchase surveys catch the audience that saw the campaign on TikTok, searched a week later, and bought through direct traffic. The four streams together reconcile inside a 5 to 8 percent margin on a well tagged apparel account. Google’s attribution model documentation is the source every founder should read before arguing about which number is correct.
Every plan reports campaign level revenue against the campaign level budget with a 7 day and 30 day view. Anything shorter than 7 days is noise on an apparel buying cycle. Anything longer than 30 days is too late to change the current campaign trajectory. The founder reads the dashboard once a week on Monday morning before the review meeting, not once at the end of the quarter when the numbers are already locked into a bad direction.
Fashion ecommerce marketing in production
Boogie Board came to our team with a DTC ecommerce program running the same problem most apparel brands run at $340,000 monthly. Product pages with four images per SKU, no fit content on the size selector, a checkout that pushed size to step two on mobile, cost per acquisition at $150.92 and climbing, and a founder who read the paid social dashboard at face value every Monday. The plan looked busy on paper. The margin math looked thin on the P and L.
Our team rebuilt the ecommerce path around the five node stack. Rewrote the product page template with 8 to 12 images per SKU, garment measurements at the SKU level, and fit review pull quotes below the size selector. Moved size selection to first field at the top of the mobile checkout. Rebuilt the top 40 SKU catalog feed with lifestyle imagery and hand written titles. Turned on the seven core Klaviyo flows and a Attentive SMS list at week three. Server side tracking went in through Elevar in week two. Weekly Monday review meetings replaced the end of month post mortem, with the founder in the room and empowered to kill a campaign at week two.
Twelve months in, blended cost per acquisition dropped to $31. Conversion rate on the paid landing pages climbed 11 percent. Return rate on womenswear dropped from 38 percent to 26 percent. Day 90 repeat purchase rate grew from 22 percent to 41 percent. Managed ad budget grew to $650,000 monthly on the same margin profile. The result did not come from a magic new channel. It came from applying the five node stack, the checkout discipline, and the review cadence the plan required from day one.
The weekly review that keeps the plan honest
The Monday review meeting is where an apparel plan earns the right to keep spending. Forty five minutes, three agenda items, one decision. Read the reconciled dashboard. Review the top and bottom three ad creatives by cost per order. Decide whether the current campaign continues into next week, gets a creative pivot, or gets killed. The founder is invited and expected to make the kill decision when the numbers warrant it.
Every Monday review meeting eventually reaches the moment where somebody points at the flat performing creative and asks if the founder wants to give it one more week. The founder always says yes. The creative always underperforms for a second week. Nobody remembers who first suggested the extra week. Somewhere in the archive of every apparel brand shared drive, a flat creative is quietly generating more Monday meetings about itself than actual orders about anything on the site.
The kill rule is simple and it holds across every campaign archetype. Day 3 return on ad spend below 40 percent of target and day 7 return below 60 percent of target triggers a 24 hour creative pivot or a full kill. Programs that hold underperforming campaigns for the full run out of hope produce the flat quarters founders learn to fear. Programs that kill fast and reallocate to the winners produce the compounding quarters that make the retainer worth its rate. Founders new to structured plans assume the kill decision hurts the numbers. In practice, killing a flat creative at week two frees the budget to double down on the winner and grows the campaign result 20 to 45 percent inside the next 21 days on an apparel account.
Where fashion ecommerce marketing fits the wider stack
Fashion ecommerce marketing sits above the tactical channel work and below the annual brand strategy inside the growth stack. Every retainer allocation, every creative brief, and every founder decision on inventory rolls up to the five node plan the pod is running against. Programs that budget for tactics without the plan produce busy months with soft revenue. Programs that build the plan first produce quarters where every product page, every ad, and every email adds up to a single growth arc the founder can defend at a board meeting.
The retainer that runs the plan starts at $599 monthly on a 6 month contract and scales with revenue. The retainer covers merchandising audits, fit content templates, product page image direction, checkout audits, retention flow builds, weekly review meetings, and quarterly server side tracking audits. Founders scoping the wider agency side should also read our apparel fashion marketing hub for the broader deliverable list and pricing tiers by revenue band.
The retainer scales with revenue band, deliverable scope, and the number of active campaigns per quarter. A brand at $80,000 monthly runs a lean retainer with the founder in the review meeting. A brand at $600,000 monthly runs a fuller retainer with a dedicated pod and monthly media mix modeling reads. Every retainer tier ties back to the five node stack the plan requires, and every quarterly review closes the loop between the tactical channel work and the strategic growth arc the founder is defending on the P and L. Two outside reads worth an hour before the first plan cycle kicks off. Meta catalog quality reference above for feed hygiene. The Business of Fashion opinions section for the macro context that shapes which trends deserve budget in a given quarter on the merchandising side.
Benchmarks make the plan honest. A DTC apparel brand reads its own numbers against the industry median every quarter and acts on the gaps that show up. Conversion rate. Blended cost per order. Return rate. Repeat purchase rate. Email revenue share. Each has an honest median for the revenue band, and the numbers change slowly year over year.
| Revenue band | Conversion rate | Blended CPO | Return rate (womenswear) | Day 90 repeat rate | Email revenue share |
|---|---|---|---|---|---|
| Under $80K monthly | 1.2% to 1.8% | $38 to $54 | 26% to 34% | 10% to 18% | 18% to 26% |
| $80K to $250K monthly | 1.6% to 2.4% | $28 to $46 | 24% to 32% | 16% to 24% | 22% to 30% |
| $250K to $600K monthly | 2.0% to 2.8% | $22 to $38 | 22% to 30% | 22% to 32% | 26% to 34% |
| $600K to $1.5M monthly | 2.4% to 3.4% | $18 to $32 | 20% to 28% | 28% to 38% | 28% to 36% |
| Above $1.5M monthly | 2.8% to 4.0% | $16 to $28 | 18% to 26% | 32% to 45% | 30% to 38% |
A founder who reads a monthly dashboard against these benchmarks catches the drift inside 30 days and adjusts the plan before the quarter closes. A founder who reads only the paid social dashboard catches the drift 90 days late, which usually means the correction shows up in the next quarter revenue instead of the current one. That single reporting habit is the difference between an apparel plan that grows and an apparel plan that runs in place while the founder wonders what actually changed under the surface. Founders scoping the wider paid team should read our fashion marketing agency guide for the retainer scope that sits above these benchmark reads.
How do you measure fashion ecommerce marketing honestly
Honest measurement of fashion ecommerce marketing runs on four data streams reconciled inside one weekly dashboard. Shopify revenue by UTM and discount code. Google Analytics 4 sessions and assisted conversion. Meta and TikTok ads platform attribution. A post purchase survey on every order that asks where the buyer first saw the brand. Each stream lies on its own.
The single biggest reporting mistake is trusting Meta own return on ad spend number as the campaign result. Meta over reports by 30 to 90 percent on apparel accounts because the pixel double counts view through and click through revenue that would have converted anyway. Google Analytics 4 under reports because the model discounts paid social influence on longer consideration windows. Shopify tells the truth on first order revenue but nothing on assisted revenue. Post purchase surveys catch the audience that saw the campaign on TikTok, searched a week later, and bought through direct traffic. The four streams together reconcile inside a 5 to 8 percent margin on a well tagged apparel account. Google’s attribution model documentation is the source every founder should read before arguing about which number is correct.
Every plan reports campaign level revenue against the campaign level budget with a 7 day and 30 day view. Anything shorter than 7 days is noise on an apparel buying cycle. Anything longer than 30 days is too late to change the current campaign trajectory. The founder reads the dashboard once a week on Monday morning before the review meeting, not once at the end of the quarter when the numbers are already locked into a bad direction.
Fashion ecommerce marketing in production
Boogie Board came to our team with a DTC ecommerce program running the same problem most apparel brands run at $340,000 monthly. Product pages with four images per SKU, no fit content on the size selector, a checkout that pushed size to step two on mobile, cost per acquisition at $150.92 and climbing, and a founder who read the paid social dashboard at face value every Monday. The plan looked busy on paper. The margin math looked thin on the P and L.
Our team rebuilt the ecommerce path around the five node stack. Rewrote the product page template with 8 to 12 images per SKU, garment measurements at the SKU level, and fit review pull quotes below the size selector. Moved size selection to first field at the top of the mobile checkout. Rebuilt the top 40 SKU catalog feed with lifestyle imagery and hand written titles. Turned on the seven core Klaviyo flows and a Attentive SMS list at week three. Server side tracking went in through Elevar in week two. Weekly Monday review meetings replaced the end of month post mortem, with the founder in the room and empowered to kill a campaign at week two.
Twelve months in, blended cost per acquisition dropped to $31. Conversion rate on the paid landing pages climbed 11 percent. Return rate on womenswear dropped from 38 percent to 26 percent. Day 90 repeat purchase rate grew from 22 percent to 41 percent. Managed ad budget grew to $650,000 monthly on the same margin profile. The result did not come from a magic new channel. It came from applying the five node stack, the checkout discipline, and the review cadence the plan required from day one.
The weekly review that keeps the plan honest
The Monday review meeting is where an apparel plan earns the right to keep spending. Forty five minutes, three agenda items, one decision. Read the reconciled dashboard. Review the top and bottom three ad creatives by cost per order. Decide whether the current campaign continues into next week, gets a creative pivot, or gets killed. The founder is invited and expected to make the kill decision when the numbers warrant it.
Every Monday review meeting eventually reaches the moment where somebody points at the flat performing creative and asks if the founder wants to give it one more week. The founder always says yes. The creative always underperforms for a second week. Nobody remembers who first suggested the extra week. Somewhere in the archive of every apparel brand shared drive, a flat creative is quietly generating more Monday meetings about itself than actual orders about anything on the site.
The kill rule is simple and it holds across every campaign archetype. Day 3 return on ad spend below 40 percent of target and day 7 return below 60 percent of target triggers a 24 hour creative pivot or a full kill. Programs that hold underperforming campaigns for the full run out of hope produce the flat quarters founders learn to fear. Programs that kill fast and reallocate to the winners produce the compounding quarters that make the retainer worth its rate. Founders new to structured plans assume the kill decision hurts the numbers. In practice, killing a flat creative at week two frees the budget to double down on the winner and grows the campaign result 20 to 45 percent inside the next 21 days on an apparel account.
Where fashion ecommerce marketing fits the wider stack
Fashion ecommerce marketing sits above the tactical channel work and below the annual brand strategy inside the growth stack. Every retainer allocation, every creative brief, and every founder decision on inventory rolls up to the five node plan the pod is running against. Programs that budget for tactics without the plan produce busy months with soft revenue. Programs that build the plan first produce quarters where every product page, every ad, and every email adds up to a single growth arc the founder can defend at a board meeting.
The retainer that runs the plan starts at $599 monthly on a 6 month contract and scales with revenue. The retainer covers merchandising audits, fit content templates, product page image direction, checkout audits, retention flow builds, weekly review meetings, and quarterly server side tracking audits. Founders scoping the wider agency side should also read our apparel fashion marketing hub for the broader deliverable list and pricing tiers by revenue band.
The retainer scales with revenue band, deliverable scope, and the number of active campaigns per quarter. A brand at $80,000 monthly runs a lean retainer with the founder in the review meeting. A brand at $600,000 monthly runs a fuller retainer with a dedicated pod and monthly media mix modeling reads. Every retainer tier ties back to the five node stack the plan requires, and every quarterly review closes the loop between the tactical channel work and the strategic growth arc the founder is defending on the P and L. Two outside reads worth an hour before the first plan cycle kicks off. Meta catalog quality reference above for feed hygiene. The Business of Fashion opinions section for the macro context that shapes which trends deserve budget in a given quarter on the merchandising side.
Checkout on apparel carries a size selector as the first field, not the last. Programs that push size selection to a second step lose 4 to 9 percent conversion rate on the same traffic because the mobile buyer scrolls twice for a decision the desktop pattern buries. The mobile buyer decides in under six seconds whether the flow feels safe. Every friction point in that window costs margin.
The checkout structure that respects sizing
The size selector sits directly under the price, above the add to cart button. Sold out sizes stay visible with a strikethrough, not hidden, so the buyer reads the size chart against the availability without a filter reset. A restock notification input replaces the add to cart button on the sold out size. On mobile, the size selector expands into a tap sheet that shows the size chart and fit review pull quotes on the same swipe. That single pattern grows completed checkout rate 6 to 12 percent on apparel accounts we have measured inside 21 days of the deploy.
Shipping and returns copy at the payment step
Shipping thresholds, return windows, and exchange policy live inline at the payment step, not on a footer page. Apparel buyers who read the return policy at cart complete checkout 18 to 30 percent more often than buyers who never see it, and the return rate on those orders drops 2 to 5 percentage points because the buyer bought with the exchange window in mind. Founders who bury return policy on a footer link are trading the transparency dividend for a false conversion gain that costs margin on the back end.
Paid social inside fashion ecommerce marketing
Paid social carries 45 to 60 percent of first order revenue on DTC apparel between $80,000 and $600,000 monthly. Meta and TikTok are the two platforms that fund. Every other platform enters through a 90 day pilot with a hard kill date, not a slow bleed into the always on budget.
Creative velocity as the real budget
Paid social on apparel wins on creative velocity, not media budget. A brand shipping 6 to 12 fresh creative variants weekly across static, Reel, and TikTok formats produces 30 to 60 percent lower cost per order than the same brand shipping 2 to 3 variants weekly on the same media budget. Fashion audiences fatigue creative inside 5 to 9 days on the same face and product angle. The retainer needs to feed that fatigue rate, not fight it, and the creative production line has to run on a weekly cadence with a named producer.
The catalog feed that carries Shopping
Meta Advantage Plus Shopping and TikTok Shop pull directly from the Shopify product feed. Programs that let the feed run on default titles and default images produce 40 to 70 percent higher cost per order than programs that rewrite the top 40 SKU feed titles and swap the primary feed image to the highest performing lifestyle shot. Feed hygiene is the cheapest paid social gain available on an apparel account and the one most founders never open. Meta’s catalog quality reference covers the field level rules that shape delivery.
Retention inside fashion ecommerce marketing
Retention is the layer that decides whether the P and L runs on margin or grinds through paid acquisition to break even. A DTC apparel brand with a 30 percent day 90 repeat rate runs 20 to 35 percent more contribution margin per blended dollar of spend than the same brand at 15 percent. Retention is not one channel. It is a stack of email, SMS, loyalty, and post purchase content on a monthly calendar.
Email and SMS as the core
Email drives 25 to 35 percent of DTC apparel revenue when the flow set is complete. Welcome, browse abandonment, cart abandonment, post purchase, replenishment, VIP, and win back are the seven flows every brand needs live inside the first 90 days. SMS adds another 8 to 15 percent of revenue at a 5 to 12 percent list opt in rate. Klaviyo and Attentive dominate the DTC apparel tool stack because the two platforms handle 90 percent of the flow logic without custom development. Our what is fashion marketing primer covers how the retention layer plugs into the wider channel mix.
Post purchase content that grows LTV
Post purchase content covers the four weeks after delivery on a first order. Styling emails that pair the purchased SKU with three complementary pieces. A fit review request at day seven when the buyer has worn the garment twice. A community moment at day fourteen with user photos of the same SKU. A second order incentive at day 28 with a category adjacent recommendation. Programs that publish the full post purchase sequence grow lifetime value 22 to 45 percent by month twelve on the same first order cohort, and the retention layer starts to carry the revenue growth the paid team used to carry alone.
Benchmarks inside fashion ecommerce marketing
Benchmarks make the plan honest. A DTC apparel brand reads its own numbers against the industry median every quarter and acts on the gaps that show up. Conversion rate. Blended cost per order. Return rate. Repeat purchase rate. Email revenue share. Each has an honest median for the revenue band, and the numbers change slowly year over year.
| Revenue band | Conversion rate | Blended CPO | Return rate (womenswear) | Day 90 repeat rate | Email revenue share |
|---|---|---|---|---|---|
| Under $80K monthly | 1.2% to 1.8% | $38 to $54 | 26% to 34% | 10% to 18% | 18% to 26% |
| $80K to $250K monthly | 1.6% to 2.4% | $28 to $46 | 24% to 32% | 16% to 24% | 22% to 30% |
| $250K to $600K monthly | 2.0% to 2.8% | $22 to $38 | 22% to 30% | 22% to 32% | 26% to 34% |
| $600K to $1.5M monthly | 2.4% to 3.4% | $18 to $32 | 20% to 28% | 28% to 38% | 28% to 36% |
| Above $1.5M monthly | 2.8% to 4.0% | $16 to $28 | 18% to 26% | 32% to 45% | 30% to 38% |
A founder who reads a monthly dashboard against these benchmarks catches the drift inside 30 days and adjusts the plan before the quarter closes. A founder who reads only the paid social dashboard catches the drift 90 days late, which usually means the correction shows up in the next quarter revenue instead of the current one. That single reporting habit is the difference between an apparel plan that grows and an apparel plan that runs in place while the founder wonders what actually changed under the surface. Founders scoping the wider paid team should read our fashion marketing agency guide for the retainer scope that sits above these benchmark reads.
How do you measure fashion ecommerce marketing honestly
Honest measurement of fashion ecommerce marketing runs on four data streams reconciled inside one weekly dashboard. Shopify revenue by UTM and discount code. Google Analytics 4 sessions and assisted conversion. Meta and TikTok ads platform attribution. A post purchase survey on every order that asks where the buyer first saw the brand. Each stream lies on its own.
The single biggest reporting mistake is trusting Meta own return on ad spend number as the campaign result. Meta over reports by 30 to 90 percent on apparel accounts because the pixel double counts view through and click through revenue that would have converted anyway. Google Analytics 4 under reports because the model discounts paid social influence on longer consideration windows. Shopify tells the truth on first order revenue but nothing on assisted revenue. Post purchase surveys catch the audience that saw the campaign on TikTok, searched a week later, and bought through direct traffic. The four streams together reconcile inside a 5 to 8 percent margin on a well tagged apparel account. Google’s attribution model documentation is the source every founder should read before arguing about which number is correct.
Every plan reports campaign level revenue against the campaign level budget with a 7 day and 30 day view. Anything shorter than 7 days is noise on an apparel buying cycle. Anything longer than 30 days is too late to change the current campaign trajectory. The founder reads the dashboard once a week on Monday morning before the review meeting, not once at the end of the quarter when the numbers are already locked into a bad direction.
Fashion ecommerce marketing in production
Boogie Board came to our team with a DTC ecommerce program running the same problem most apparel brands run at $340,000 monthly. Product pages with four images per SKU, no fit content on the size selector, a checkout that pushed size to step two on mobile, cost per acquisition at $150.92 and climbing, and a founder who read the paid social dashboard at face value every Monday. The plan looked busy on paper. The margin math looked thin on the P and L.
Our team rebuilt the ecommerce path around the five node stack. Rewrote the product page template with 8 to 12 images per SKU, garment measurements at the SKU level, and fit review pull quotes below the size selector. Moved size selection to first field at the top of the mobile checkout. Rebuilt the top 40 SKU catalog feed with lifestyle imagery and hand written titles. Turned on the seven core Klaviyo flows and a Attentive SMS list at week three. Server side tracking went in through Elevar in week two. Weekly Monday review meetings replaced the end of month post mortem, with the founder in the room and empowered to kill a campaign at week two.
Twelve months in, blended cost per acquisition dropped to $31. Conversion rate on the paid landing pages climbed 11 percent. Return rate on womenswear dropped from 38 percent to 26 percent. Day 90 repeat purchase rate grew from 22 percent to 41 percent. Managed ad budget grew to $650,000 monthly on the same margin profile. The result did not come from a magic new channel. It came from applying the five node stack, the checkout discipline, and the review cadence the plan required from day one.
The weekly review that keeps the plan honest
The Monday review meeting is where an apparel plan earns the right to keep spending. Forty five minutes, three agenda items, one decision. Read the reconciled dashboard. Review the top and bottom three ad creatives by cost per order. Decide whether the current campaign continues into next week, gets a creative pivot, or gets killed. The founder is invited and expected to make the kill decision when the numbers warrant it.
Every Monday review meeting eventually reaches the moment where somebody points at the flat performing creative and asks if the founder wants to give it one more week. The founder always says yes. The creative always underperforms for a second week. Nobody remembers who first suggested the extra week. Somewhere in the archive of every apparel brand shared drive, a flat creative is quietly generating more Monday meetings about itself than actual orders about anything on the site.
The kill rule is simple and it holds across every campaign archetype. Day 3 return on ad spend below 40 percent of target and day 7 return below 60 percent of target triggers a 24 hour creative pivot or a full kill. Programs that hold underperforming campaigns for the full run out of hope produce the flat quarters founders learn to fear. Programs that kill fast and reallocate to the winners produce the compounding quarters that make the retainer worth its rate. Founders new to structured plans assume the kill decision hurts the numbers. In practice, killing a flat creative at week two frees the budget to double down on the winner and grows the campaign result 20 to 45 percent inside the next 21 days on an apparel account.
Where fashion ecommerce marketing fits the wider stack
Fashion ecommerce marketing sits above the tactical channel work and below the annual brand strategy inside the growth stack. Every retainer allocation, every creative brief, and every founder decision on inventory rolls up to the five node plan the pod is running against. Programs that budget for tactics without the plan produce busy months with soft revenue. Programs that build the plan first produce quarters where every product page, every ad, and every email adds up to a single growth arc the founder can defend at a board meeting.
The retainer that runs the plan starts at $599 monthly on a 6 month contract and scales with revenue. The retainer covers merchandising audits, fit content templates, product page image direction, checkout audits, retention flow builds, weekly review meetings, and quarterly server side tracking audits. Founders scoping the wider agency side should also read our apparel fashion marketing hub for the broader deliverable list and pricing tiers by revenue band.
The retainer scales with revenue band, deliverable scope, and the number of active campaigns per quarter. A brand at $80,000 monthly runs a lean retainer with the founder in the review meeting. A brand at $600,000 monthly runs a fuller retainer with a dedicated pod and monthly media mix modeling reads. Every retainer tier ties back to the five node stack the plan requires, and every quarterly review closes the loop between the tactical channel work and the strategic growth arc the founder is defending on the P and L. Two outside reads worth an hour before the first plan cycle kicks off. Meta catalog quality reference above for feed hygiene. The Business of Fashion opinions section for the macro context that shapes which trends deserve budget in a given quarter on the merchandising side.
Product page imagery is where a paid social click either converts or bounces inside eight seconds. The industry median product page ships four images per SKU. The winners ship eight to twelve, and every image answers a specific buyer question the paid ad already primed.
The imagery stack per SKU
A working stack per SKU carries model shot on size medium, model shot on size extra large or size fourteen so the buyer sees the fit at range, flat lay on a neutral ground for the utility view, detail shot on the fabric texture, detail shot on the hardware and stitching, back view on the model, side view on the model, movement clip of 4 to 8 seconds, and a scale shot next to a familiar object for accessories. Programs that publish all twelve image slots grow conversion rate 8 to 22 percent against the four image baseline, and Meta gets richer feed asset variants to test in the ad set.
Video that earns its production cost
Product page video works when it stays under 10 seconds, loops on autoplay, mutes by default, and shows movement the still shot cannot. Longer videos hurt page load and buyer patience without a conversion gain. A DTC apparel brand doing $340,000 monthly should budget $60,000 to $140,000 annually on product page video across the top 40 SKUs by contribution margin. Below that budget, the video shoot day math does not work and the founder ships either thin coverage on all SKUs or full coverage on the wrong ones. Shopify’s product photography guide is a useful outside read for founders scoping a first shoot.
Checkout inside fashion ecommerce marketing
Checkout on apparel carries a size selector as the first field, not the last. Programs that push size selection to a second step lose 4 to 9 percent conversion rate on the same traffic because the mobile buyer scrolls twice for a decision the desktop pattern buries. The mobile buyer decides in under six seconds whether the flow feels safe. Every friction point in that window costs margin.
The checkout structure that respects sizing
The size selector sits directly under the price, above the add to cart button. Sold out sizes stay visible with a strikethrough, not hidden, so the buyer reads the size chart against the availability without a filter reset. A restock notification input replaces the add to cart button on the sold out size. On mobile, the size selector expands into a tap sheet that shows the size chart and fit review pull quotes on the same swipe. That single pattern grows completed checkout rate 6 to 12 percent on apparel accounts we have measured inside 21 days of the deploy.
Shipping and returns copy at the payment step
Shipping thresholds, return windows, and exchange policy live inline at the payment step, not on a footer page. Apparel buyers who read the return policy at cart complete checkout 18 to 30 percent more often than buyers who never see it, and the return rate on those orders drops 2 to 5 percentage points because the buyer bought with the exchange window in mind. Founders who bury return policy on a footer link are trading the transparency dividend for a false conversion gain that costs margin on the back end.
Paid social inside fashion ecommerce marketing
Paid social carries 45 to 60 percent of first order revenue on DTC apparel between $80,000 and $600,000 monthly. Meta and TikTok are the two platforms that fund. Every other platform enters through a 90 day pilot with a hard kill date, not a slow bleed into the always on budget.
Creative velocity as the real budget
Paid social on apparel wins on creative velocity, not media budget. A brand shipping 6 to 12 fresh creative variants weekly across static, Reel, and TikTok formats produces 30 to 60 percent lower cost per order than the same brand shipping 2 to 3 variants weekly on the same media budget. Fashion audiences fatigue creative inside 5 to 9 days on the same face and product angle. The retainer needs to feed that fatigue rate, not fight it, and the creative production line has to run on a weekly cadence with a named producer.
The catalog feed that carries Shopping
Meta Advantage Plus Shopping and TikTok Shop pull directly from the Shopify product feed. Programs that let the feed run on default titles and default images produce 40 to 70 percent higher cost per order than programs that rewrite the top 40 SKU feed titles and swap the primary feed image to the highest performing lifestyle shot. Feed hygiene is the cheapest paid social gain available on an apparel account and the one most founders never open. Meta’s catalog quality reference covers the field level rules that shape delivery.
Retention inside fashion ecommerce marketing
Retention is the layer that decides whether the P and L runs on margin or grinds through paid acquisition to break even. A DTC apparel brand with a 30 percent day 90 repeat rate runs 20 to 35 percent more contribution margin per blended dollar of spend than the same brand at 15 percent. Retention is not one channel. It is a stack of email, SMS, loyalty, and post purchase content on a monthly calendar.
Email and SMS as the core
Email drives 25 to 35 percent of DTC apparel revenue when the flow set is complete. Welcome, browse abandonment, cart abandonment, post purchase, replenishment, VIP, and win back are the seven flows every brand needs live inside the first 90 days. SMS adds another 8 to 15 percent of revenue at a 5 to 12 percent list opt in rate. Klaviyo and Attentive dominate the DTC apparel tool stack because the two platforms handle 90 percent of the flow logic without custom development. Our what is fashion marketing primer covers how the retention layer plugs into the wider channel mix.
Post purchase content that grows LTV
Post purchase content covers the four weeks after delivery on a first order. Styling emails that pair the purchased SKU with three complementary pieces. A fit review request at day seven when the buyer has worn the garment twice. A community moment at day fourteen with user photos of the same SKU. A second order incentive at day 28 with a category adjacent recommendation. Programs that publish the full post purchase sequence grow lifetime value 22 to 45 percent by month twelve on the same first order cohort, and the retention layer starts to carry the revenue growth the paid team used to carry alone.
Benchmarks inside fashion ecommerce marketing
Benchmarks make the plan honest. A DTC apparel brand reads its own numbers against the industry median every quarter and acts on the gaps that show up. Conversion rate. Blended cost per order. Return rate. Repeat purchase rate. Email revenue share. Each has an honest median for the revenue band, and the numbers change slowly year over year.
| Revenue band | Conversion rate | Blended CPO | Return rate (womenswear) | Day 90 repeat rate | Email revenue share |
|---|---|---|---|---|---|
| Under $80K monthly | 1.2% to 1.8% | $38 to $54 | 26% to 34% | 10% to 18% | 18% to 26% |
| $80K to $250K monthly | 1.6% to 2.4% | $28 to $46 | 24% to 32% | 16% to 24% | 22% to 30% |
| $250K to $600K monthly | 2.0% to 2.8% | $22 to $38 | 22% to 30% | 22% to 32% | 26% to 34% |
| $600K to $1.5M monthly | 2.4% to 3.4% | $18 to $32 | 20% to 28% | 28% to 38% | 28% to 36% |
| Above $1.5M monthly | 2.8% to 4.0% | $16 to $28 | 18% to 26% | 32% to 45% | 30% to 38% |
A founder who reads a monthly dashboard against these benchmarks catches the drift inside 30 days and adjusts the plan before the quarter closes. A founder who reads only the paid social dashboard catches the drift 90 days late, which usually means the correction shows up in the next quarter revenue instead of the current one. That single reporting habit is the difference between an apparel plan that grows and an apparel plan that runs in place while the founder wonders what actually changed under the surface. Founders scoping the wider paid team should read our fashion marketing agency guide for the retainer scope that sits above these benchmark reads.
How do you measure fashion ecommerce marketing honestly
Honest measurement of fashion ecommerce marketing runs on four data streams reconciled inside one weekly dashboard. Shopify revenue by UTM and discount code. Google Analytics 4 sessions and assisted conversion. Meta and TikTok ads platform attribution. A post purchase survey on every order that asks where the buyer first saw the brand. Each stream lies on its own.
The single biggest reporting mistake is trusting Meta own return on ad spend number as the campaign result. Meta over reports by 30 to 90 percent on apparel accounts because the pixel double counts view through and click through revenue that would have converted anyway. Google Analytics 4 under reports because the model discounts paid social influence on longer consideration windows. Shopify tells the truth on first order revenue but nothing on assisted revenue. Post purchase surveys catch the audience that saw the campaign on TikTok, searched a week later, and bought through direct traffic. The four streams together reconcile inside a 5 to 8 percent margin on a well tagged apparel account. Google’s attribution model documentation is the source every founder should read before arguing about which number is correct.
Every plan reports campaign level revenue against the campaign level budget with a 7 day and 30 day view. Anything shorter than 7 days is noise on an apparel buying cycle. Anything longer than 30 days is too late to change the current campaign trajectory. The founder reads the dashboard once a week on Monday morning before the review meeting, not once at the end of the quarter when the numbers are already locked into a bad direction.
Fashion ecommerce marketing in production
Boogie Board came to our team with a DTC ecommerce program running the same problem most apparel brands run at $340,000 monthly. Product pages with four images per SKU, no fit content on the size selector, a checkout that pushed size to step two on mobile, cost per acquisition at $150.92 and climbing, and a founder who read the paid social dashboard at face value every Monday. The plan looked busy on paper. The margin math looked thin on the P and L.
Our team rebuilt the ecommerce path around the five node stack. Rewrote the product page template with 8 to 12 images per SKU, garment measurements at the SKU level, and fit review pull quotes below the size selector. Moved size selection to first field at the top of the mobile checkout. Rebuilt the top 40 SKU catalog feed with lifestyle imagery and hand written titles. Turned on the seven core Klaviyo flows and a Attentive SMS list at week three. Server side tracking went in through Elevar in week two. Weekly Monday review meetings replaced the end of month post mortem, with the founder in the room and empowered to kill a campaign at week two.
Twelve months in, blended cost per acquisition dropped to $31. Conversion rate on the paid landing pages climbed 11 percent. Return rate on womenswear dropped from 38 percent to 26 percent. Day 90 repeat purchase rate grew from 22 percent to 41 percent. Managed ad budget grew to $650,000 monthly on the same margin profile. The result did not come from a magic new channel. It came from applying the five node stack, the checkout discipline, and the review cadence the plan required from day one.
The weekly review that keeps the plan honest
The Monday review meeting is where an apparel plan earns the right to keep spending. Forty five minutes, three agenda items, one decision. Read the reconciled dashboard. Review the top and bottom three ad creatives by cost per order. Decide whether the current campaign continues into next week, gets a creative pivot, or gets killed. The founder is invited and expected to make the kill decision when the numbers warrant it.
Every Monday review meeting eventually reaches the moment where somebody points at the flat performing creative and asks if the founder wants to give it one more week. The founder always says yes. The creative always underperforms for a second week. Nobody remembers who first suggested the extra week. Somewhere in the archive of every apparel brand shared drive, a flat creative is quietly generating more Monday meetings about itself than actual orders about anything on the site.
The kill rule is simple and it holds across every campaign archetype. Day 3 return on ad spend below 40 percent of target and day 7 return below 60 percent of target triggers a 24 hour creative pivot or a full kill. Programs that hold underperforming campaigns for the full run out of hope produce the flat quarters founders learn to fear. Programs that kill fast and reallocate to the winners produce the compounding quarters that make the retainer worth its rate. Founders new to structured plans assume the kill decision hurts the numbers. In practice, killing a flat creative at week two frees the budget to double down on the winner and grows the campaign result 20 to 45 percent inside the next 21 days on an apparel account.
Where fashion ecommerce marketing fits the wider stack
Fashion ecommerce marketing sits above the tactical channel work and below the annual brand strategy inside the growth stack. Every retainer allocation, every creative brief, and every founder decision on inventory rolls up to the five node plan the pod is running against. Programs that budget for tactics without the plan produce busy months with soft revenue. Programs that build the plan first produce quarters where every product page, every ad, and every email adds up to a single growth arc the founder can defend at a board meeting.
The retainer that runs the plan starts at $599 monthly on a 6 month contract and scales with revenue. The retainer covers merchandising audits, fit content templates, product page image direction, checkout audits, retention flow builds, weekly review meetings, and quarterly server side tracking audits. Founders scoping the wider agency side should also read our apparel fashion marketing hub for the broader deliverable list and pricing tiers by revenue band.
The retainer scales with revenue band, deliverable scope, and the number of active campaigns per quarter. A brand at $80,000 monthly runs a lean retainer with the founder in the review meeting. A brand at $600,000 monthly runs a fuller retainer with a dedicated pod and monthly media mix modeling reads. Every retainer tier ties back to the five node stack the plan requires, and every quarterly review closes the loop between the tactical channel work and the strategic growth arc the founder is defending on the P and L. Two outside reads worth an hour before the first plan cycle kicks off. Meta catalog quality reference above for feed hygiene. The Business of Fashion opinions section for the macro context that shapes which trends deserve budget in a given quarter on the merchandising side.
Return rate is the single margin killer on DTC apparel. Womenswear runs 22 to 30 percent, menswear 12 to 18 percent, accessories 6 to 10 percent. Two thirds of apparel returns cite fit or size as the reason. Fashion ecommerce marketing that ignores fit content spends the paid social budget twice on every return that goes back into inventory.
The plan builds a fit content stack on every SKU. Model height and size worn in the product description. Garment measurements at the SKU level, not the style level. Fit review notes pulled from customer reviews on a dedicated Fit tab. Size guides at the collection level with the actual measurement method photographed. Programs that publish the full fit stack on every SKU cut return rate 4 to 9 percentage points inside two quarters, which is the biggest margin move available in apparel without a supply chain change.
Where the fit content lives on the page
Fit content lives above the fold on desktop and inside the third scroll on mobile. The size chart lives one tap deep from the size selector, not three clicks deep behind a footer link. Fit review pull quotes live directly below the size selector so the buyer reads what the size chart says and what other buyers actually experienced in the same tap. That single change grows conversion rate 6 to 14 percent on apparel accounts we have tested inside 30 days, and it costs nothing in creative production because the copy already exists in the review corpus.
Fit tech worth funding
True Fit, Fit Analytics, and Bold Metrics carry the automated fit recommendation layer on scaled apparel programs. Each pulls buyer inputs (height, weight, common size in another brand) and recommends a size at add to cart. Return rate drops 3 to 7 percentage points on the SKUs where the tool is live and the buyer engages with the input flow. Below $250,000 monthly, the tool license outruns the return savings. Above $600,000 monthly, the math flips and the tool pays for itself inside a quarter.
Product page imagery inside fashion ecommerce marketing
Product page imagery is where a paid social click either converts or bounces inside eight seconds. The industry median product page ships four images per SKU. The winners ship eight to twelve, and every image answers a specific buyer question the paid ad already primed.
The imagery stack per SKU
A working stack per SKU carries model shot on size medium, model shot on size extra large or size fourteen so the buyer sees the fit at range, flat lay on a neutral ground for the utility view, detail shot on the fabric texture, detail shot on the hardware and stitching, back view on the model, side view on the model, movement clip of 4 to 8 seconds, and a scale shot next to a familiar object for accessories. Programs that publish all twelve image slots grow conversion rate 8 to 22 percent against the four image baseline, and Meta gets richer feed asset variants to test in the ad set.
Video that earns its production cost
Product page video works when it stays under 10 seconds, loops on autoplay, mutes by default, and shows movement the still shot cannot. Longer videos hurt page load and buyer patience without a conversion gain. A DTC apparel brand doing $340,000 monthly should budget $60,000 to $140,000 annually on product page video across the top 40 SKUs by contribution margin. Below that budget, the video shoot day math does not work and the founder ships either thin coverage on all SKUs or full coverage on the wrong ones. Shopify’s product photography guide is a useful outside read for founders scoping a first shoot.
Checkout inside fashion ecommerce marketing
Checkout on apparel carries a size selector as the first field, not the last. Programs that push size selection to a second step lose 4 to 9 percent conversion rate on the same traffic because the mobile buyer scrolls twice for a decision the desktop pattern buries. The mobile buyer decides in under six seconds whether the flow feels safe. Every friction point in that window costs margin.
The checkout structure that respects sizing
The size selector sits directly under the price, above the add to cart button. Sold out sizes stay visible with a strikethrough, not hidden, so the buyer reads the size chart against the availability without a filter reset. A restock notification input replaces the add to cart button on the sold out size. On mobile, the size selector expands into a tap sheet that shows the size chart and fit review pull quotes on the same swipe. That single pattern grows completed checkout rate 6 to 12 percent on apparel accounts we have measured inside 21 days of the deploy.
Shipping and returns copy at the payment step
Shipping thresholds, return windows, and exchange policy live inline at the payment step, not on a footer page. Apparel buyers who read the return policy at cart complete checkout 18 to 30 percent more often than buyers who never see it, and the return rate on those orders drops 2 to 5 percentage points because the buyer bought with the exchange window in mind. Founders who bury return policy on a footer link are trading the transparency dividend for a false conversion gain that costs margin on the back end.
Paid social inside fashion ecommerce marketing
Paid social carries 45 to 60 percent of first order revenue on DTC apparel between $80,000 and $600,000 monthly. Meta and TikTok are the two platforms that fund. Every other platform enters through a 90 day pilot with a hard kill date, not a slow bleed into the always on budget.
Creative velocity as the real budget
Paid social on apparel wins on creative velocity, not media budget. A brand shipping 6 to 12 fresh creative variants weekly across static, Reel, and TikTok formats produces 30 to 60 percent lower cost per order than the same brand shipping 2 to 3 variants weekly on the same media budget. Fashion audiences fatigue creative inside 5 to 9 days on the same face and product angle. The retainer needs to feed that fatigue rate, not fight it, and the creative production line has to run on a weekly cadence with a named producer.
The catalog feed that carries Shopping
Meta Advantage Plus Shopping and TikTok Shop pull directly from the Shopify product feed. Programs that let the feed run on default titles and default images produce 40 to 70 percent higher cost per order than programs that rewrite the top 40 SKU feed titles and swap the primary feed image to the highest performing lifestyle shot. Feed hygiene is the cheapest paid social gain available on an apparel account and the one most founders never open. Meta’s catalog quality reference covers the field level rules that shape delivery.
Retention inside fashion ecommerce marketing
Retention is the layer that decides whether the P and L runs on margin or grinds through paid acquisition to break even. A DTC apparel brand with a 30 percent day 90 repeat rate runs 20 to 35 percent more contribution margin per blended dollar of spend than the same brand at 15 percent. Retention is not one channel. It is a stack of email, SMS, loyalty, and post purchase content on a monthly calendar.
Email and SMS as the core
Email drives 25 to 35 percent of DTC apparel revenue when the flow set is complete. Welcome, browse abandonment, cart abandonment, post purchase, replenishment, VIP, and win back are the seven flows every brand needs live inside the first 90 days. SMS adds another 8 to 15 percent of revenue at a 5 to 12 percent list opt in rate. Klaviyo and Attentive dominate the DTC apparel tool stack because the two platforms handle 90 percent of the flow logic without custom development. Our what is fashion marketing primer covers how the retention layer plugs into the wider channel mix.
Post purchase content that grows LTV
Post purchase content covers the four weeks after delivery on a first order. Styling emails that pair the purchased SKU with three complementary pieces. A fit review request at day seven when the buyer has worn the garment twice. A community moment at day fourteen with user photos of the same SKU. A second order incentive at day 28 with a category adjacent recommendation. Programs that publish the full post purchase sequence grow lifetime value 22 to 45 percent by month twelve on the same first order cohort, and the retention layer starts to carry the revenue growth the paid team used to carry alone.
Benchmarks inside fashion ecommerce marketing
Benchmarks make the plan honest. A DTC apparel brand reads its own numbers against the industry median every quarter and acts on the gaps that show up. Conversion rate. Blended cost per order. Return rate. Repeat purchase rate. Email revenue share. Each has an honest median for the revenue band, and the numbers change slowly year over year.
| Revenue band | Conversion rate | Blended CPO | Return rate (womenswear) | Day 90 repeat rate | Email revenue share |
|---|---|---|---|---|---|
| Under $80K monthly | 1.2% to 1.8% | $38 to $54 | 26% to 34% | 10% to 18% | 18% to 26% |
| $80K to $250K monthly | 1.6% to 2.4% | $28 to $46 | 24% to 32% | 16% to 24% | 22% to 30% |
| $250K to $600K monthly | 2.0% to 2.8% | $22 to $38 | 22% to 30% | 22% to 32% | 26% to 34% |
| $600K to $1.5M monthly | 2.4% to 3.4% | $18 to $32 | 20% to 28% | 28% to 38% | 28% to 36% |
| Above $1.5M monthly | 2.8% to 4.0% | $16 to $28 | 18% to 26% | 32% to 45% | 30% to 38% |
A founder who reads a monthly dashboard against these benchmarks catches the drift inside 30 days and adjusts the plan before the quarter closes. A founder who reads only the paid social dashboard catches the drift 90 days late, which usually means the correction shows up in the next quarter revenue instead of the current one. That single reporting habit is the difference between an apparel plan that grows and an apparel plan that runs in place while the founder wonders what actually changed under the surface. Founders scoping the wider paid team should read our fashion marketing agency guide for the retainer scope that sits above these benchmark reads.
How do you measure fashion ecommerce marketing honestly
Honest measurement of fashion ecommerce marketing runs on four data streams reconciled inside one weekly dashboard. Shopify revenue by UTM and discount code. Google Analytics 4 sessions and assisted conversion. Meta and TikTok ads platform attribution. A post purchase survey on every order that asks where the buyer first saw the brand. Each stream lies on its own.
The single biggest reporting mistake is trusting Meta own return on ad spend number as the campaign result. Meta over reports by 30 to 90 percent on apparel accounts because the pixel double counts view through and click through revenue that would have converted anyway. Google Analytics 4 under reports because the model discounts paid social influence on longer consideration windows. Shopify tells the truth on first order revenue but nothing on assisted revenue. Post purchase surveys catch the audience that saw the campaign on TikTok, searched a week later, and bought through direct traffic. The four streams together reconcile inside a 5 to 8 percent margin on a well tagged apparel account. Google’s attribution model documentation is the source every founder should read before arguing about which number is correct.
Every plan reports campaign level revenue against the campaign level budget with a 7 day and 30 day view. Anything shorter than 7 days is noise on an apparel buying cycle. Anything longer than 30 days is too late to change the current campaign trajectory. The founder reads the dashboard once a week on Monday morning before the review meeting, not once at the end of the quarter when the numbers are already locked into a bad direction.
Fashion ecommerce marketing in production
Boogie Board came to our team with a DTC ecommerce program running the same problem most apparel brands run at $340,000 monthly. Product pages with four images per SKU, no fit content on the size selector, a checkout that pushed size to step two on mobile, cost per acquisition at $150.92 and climbing, and a founder who read the paid social dashboard at face value every Monday. The plan looked busy on paper. The margin math looked thin on the P and L.
Our team rebuilt the ecommerce path around the five node stack. Rewrote the product page template with 8 to 12 images per SKU, garment measurements at the SKU level, and fit review pull quotes below the size selector. Moved size selection to first field at the top of the mobile checkout. Rebuilt the top 40 SKU catalog feed with lifestyle imagery and hand written titles. Turned on the seven core Klaviyo flows and a Attentive SMS list at week three. Server side tracking went in through Elevar in week two. Weekly Monday review meetings replaced the end of month post mortem, with the founder in the room and empowered to kill a campaign at week two.
Twelve months in, blended cost per acquisition dropped to $31. Conversion rate on the paid landing pages climbed 11 percent. Return rate on womenswear dropped from 38 percent to 26 percent. Day 90 repeat purchase rate grew from 22 percent to 41 percent. Managed ad budget grew to $650,000 monthly on the same margin profile. The result did not come from a magic new channel. It came from applying the five node stack, the checkout discipline, and the review cadence the plan required from day one.
The weekly review that keeps the plan honest
The Monday review meeting is where an apparel plan earns the right to keep spending. Forty five minutes, three agenda items, one decision. Read the reconciled dashboard. Review the top and bottom three ad creatives by cost per order. Decide whether the current campaign continues into next week, gets a creative pivot, or gets killed. The founder is invited and expected to make the kill decision when the numbers warrant it.
Every Monday review meeting eventually reaches the moment where somebody points at the flat performing creative and asks if the founder wants to give it one more week. The founder always says yes. The creative always underperforms for a second week. Nobody remembers who first suggested the extra week. Somewhere in the archive of every apparel brand shared drive, a flat creative is quietly generating more Monday meetings about itself than actual orders about anything on the site.
The kill rule is simple and it holds across every campaign archetype. Day 3 return on ad spend below 40 percent of target and day 7 return below 60 percent of target triggers a 24 hour creative pivot or a full kill. Programs that hold underperforming campaigns for the full run out of hope produce the flat quarters founders learn to fear. Programs that kill fast and reallocate to the winners produce the compounding quarters that make the retainer worth its rate. Founders new to structured plans assume the kill decision hurts the numbers. In practice, killing a flat creative at week two frees the budget to double down on the winner and grows the campaign result 20 to 45 percent inside the next 21 days on an apparel account.
Where fashion ecommerce marketing fits the wider stack
Fashion ecommerce marketing sits above the tactical channel work and below the annual brand strategy inside the growth stack. Every retainer allocation, every creative brief, and every founder decision on inventory rolls up to the five node plan the pod is running against. Programs that budget for tactics without the plan produce busy months with soft revenue. Programs that build the plan first produce quarters where every product page, every ad, and every email adds up to a single growth arc the founder can defend at a board meeting.
The retainer that runs the plan starts at $599 monthly on a 6 month contract and scales with revenue. The retainer covers merchandising audits, fit content templates, product page image direction, checkout audits, retention flow builds, weekly review meetings, and quarterly server side tracking audits. Founders scoping the wider agency side should also read our apparel fashion marketing hub for the broader deliverable list and pricing tiers by revenue band.
The retainer scales with revenue band, deliverable scope, and the number of active campaigns per quarter. A brand at $80,000 monthly runs a lean retainer with the founder in the review meeting. A brand at $600,000 monthly runs a fuller retainer with a dedicated pod and monthly media mix modeling reads. Every retainer tier ties back to the five node stack the plan requires, and every quarterly review closes the loop between the tactical channel work and the strategic growth arc the founder is defending on the P and L. Two outside reads worth an hour before the first plan cycle kicks off. Meta catalog quality reference above for feed hygiene. The Business of Fashion opinions section for the macro context that shapes which trends deserve budget in a given quarter on the merchandising side.
Retention is the layer that decides whether the P and L runs on margin or grinds through paid acquisition to break even. A DTC apparel brand with a 30 percent day 90 repeat rate runs 20 to 35 percent more contribution margin per blended dollar of spend than the same brand at 15 percent. Retention is not one channel. It is a stack of email, SMS, loyalty, and post purchase content on a monthly calendar.
Email and SMS as the core
Email drives 25 to 35 percent of DTC apparel revenue when the flow set is complete. Welcome, browse abandonment, cart abandonment, post purchase, replenishment, VIP, and win back are the seven flows every brand needs live inside the first 90 days. SMS adds another 8 to 15 percent of revenue at a 5 to 12 percent list opt in rate. Klaviyo and Attentive dominate the DTC apparel tool stack because the two platforms handle 90 percent of the flow logic without custom development. Our what is fashion marketing primer covers how the retention layer plugs into the wider channel mix.
Post purchase content that grows LTV
Post purchase content covers the four weeks after delivery on a first order. Styling emails that pair the purchased SKU with three complementary pieces. A fit review request at day seven when the buyer has worn the garment twice. A community moment at day fourteen with user photos of the same SKU. A second order incentive at day 28 with a category adjacent recommendation. Programs that publish the full post purchase sequence grow lifetime value 22 to 45 percent by month twelve on the same first order cohort, and the retention layer starts to carry the revenue growth the paid team used to carry alone.
Benchmarks inside fashion ecommerce marketing
Benchmarks make the plan honest. A DTC apparel brand reads its own numbers against the industry median every quarter and acts on the gaps that show up. Conversion rate. Blended cost per order. Return rate. Repeat purchase rate. Email revenue share. Each has an honest median for the revenue band, and the numbers change slowly year over year.
| Revenue band | Conversion rate | Blended CPO | Return rate (womenswear) | Day 90 repeat rate | Email revenue share |
|---|---|---|---|---|---|
| Under $80K monthly | 1.2% to 1.8% | $38 to $54 | 26% to 34% | 10% to 18% | 18% to 26% |
| $80K to $250K monthly | 1.6% to 2.4% | $28 to $46 | 24% to 32% | 16% to 24% | 22% to 30% |
| $250K to $600K monthly | 2.0% to 2.8% | $22 to $38 | 22% to 30% | 22% to 32% | 26% to 34% |
| $600K to $1.5M monthly | 2.4% to 3.4% | $18 to $32 | 20% to 28% | 28% to 38% | 28% to 36% |
| Above $1.5M monthly | 2.8% to 4.0% | $16 to $28 | 18% to 26% | 32% to 45% | 30% to 38% |
A founder who reads a monthly dashboard against these benchmarks catches the drift inside 30 days and adjusts the plan before the quarter closes. A founder who reads only the paid social dashboard catches the drift 90 days late, which usually means the correction shows up in the next quarter revenue instead of the current one. That single reporting habit is the difference between an apparel plan that grows and an apparel plan that runs in place while the founder wonders what actually changed under the surface. Founders scoping the wider paid team should read our fashion marketing agency guide for the retainer scope that sits above these benchmark reads.
How do you measure fashion ecommerce marketing honestly
Honest measurement of fashion ecommerce marketing runs on four data streams reconciled inside one weekly dashboard. Shopify revenue by UTM and discount code. Google Analytics 4 sessions and assisted conversion. Meta and TikTok ads platform attribution. A post purchase survey on every order that asks where the buyer first saw the brand. Each stream lies on its own.
The single biggest reporting mistake is trusting Meta own return on ad spend number as the campaign result. Meta over reports by 30 to 90 percent on apparel accounts because the pixel double counts view through and click through revenue that would have converted anyway. Google Analytics 4 under reports because the model discounts paid social influence on longer consideration windows. Shopify tells the truth on first order revenue but nothing on assisted revenue. Post purchase surveys catch the audience that saw the campaign on TikTok, searched a week later, and bought through direct traffic. The four streams together reconcile inside a 5 to 8 percent margin on a well tagged apparel account. Google’s attribution model documentation is the source every founder should read before arguing about which number is correct.
Every plan reports campaign level revenue against the campaign level budget with a 7 day and 30 day view. Anything shorter than 7 days is noise on an apparel buying cycle. Anything longer than 30 days is too late to change the current campaign trajectory. The founder reads the dashboard once a week on Monday morning before the review meeting, not once at the end of the quarter when the numbers are already locked into a bad direction.
Fashion ecommerce marketing in production
Boogie Board came to our team with a DTC ecommerce program running the same problem most apparel brands run at $340,000 monthly. Product pages with four images per SKU, no fit content on the size selector, a checkout that pushed size to step two on mobile, cost per acquisition at $150.92 and climbing, and a founder who read the paid social dashboard at face value every Monday. The plan looked busy on paper. The margin math looked thin on the P and L.
Our team rebuilt the ecommerce path around the five node stack. Rewrote the product page template with 8 to 12 images per SKU, garment measurements at the SKU level, and fit review pull quotes below the size selector. Moved size selection to first field at the top of the mobile checkout. Rebuilt the top 40 SKU catalog feed with lifestyle imagery and hand written titles. Turned on the seven core Klaviyo flows and a Attentive SMS list at week three. Server side tracking went in through Elevar in week two. Weekly Monday review meetings replaced the end of month post mortem, with the founder in the room and empowered to kill a campaign at week two.
Twelve months in, blended cost per acquisition dropped to $31. Conversion rate on the paid landing pages climbed 11 percent. Return rate on womenswear dropped from 38 percent to 26 percent. Day 90 repeat purchase rate grew from 22 percent to 41 percent. Managed ad budget grew to $650,000 monthly on the same margin profile. The result did not come from a magic new channel. It came from applying the five node stack, the checkout discipline, and the review cadence the plan required from day one.
The weekly review that keeps the plan honest
The Monday review meeting is where an apparel plan earns the right to keep spending. Forty five minutes, three agenda items, one decision. Read the reconciled dashboard. Review the top and bottom three ad creatives by cost per order. Decide whether the current campaign continues into next week, gets a creative pivot, or gets killed. The founder is invited and expected to make the kill decision when the numbers warrant it.
Every Monday review meeting eventually reaches the moment where somebody points at the flat performing creative and asks if the founder wants to give it one more week. The founder always says yes. The creative always underperforms for a second week. Nobody remembers who first suggested the extra week. Somewhere in the archive of every apparel brand shared drive, a flat creative is quietly generating more Monday meetings about itself than actual orders about anything on the site.
The kill rule is simple and it holds across every campaign archetype. Day 3 return on ad spend below 40 percent of target and day 7 return below 60 percent of target triggers a 24 hour creative pivot or a full kill. Programs that hold underperforming campaigns for the full run out of hope produce the flat quarters founders learn to fear. Programs that kill fast and reallocate to the winners produce the compounding quarters that make the retainer worth its rate. Founders new to structured plans assume the kill decision hurts the numbers. In practice, killing a flat creative at week two frees the budget to double down on the winner and grows the campaign result 20 to 45 percent inside the next 21 days on an apparel account.
Where fashion ecommerce marketing fits the wider stack
Fashion ecommerce marketing sits above the tactical channel work and below the annual brand strategy inside the growth stack. Every retainer allocation, every creative brief, and every founder decision on inventory rolls up to the five node plan the pod is running against. Programs that budget for tactics without the plan produce busy months with soft revenue. Programs that build the plan first produce quarters where every product page, every ad, and every email adds up to a single growth arc the founder can defend at a board meeting.
The retainer that runs the plan starts at $599 monthly on a 6 month contract and scales with revenue. The retainer covers merchandising audits, fit content templates, product page image direction, checkout audits, retention flow builds, weekly review meetings, and quarterly server side tracking audits. Founders scoping the wider agency side should also read our apparel fashion marketing hub for the broader deliverable list and pricing tiers by revenue band.
The retainer scales with revenue band, deliverable scope, and the number of active campaigns per quarter. A brand at $80,000 monthly runs a lean retainer with the founder in the review meeting. A brand at $600,000 monthly runs a fuller retainer with a dedicated pod and monthly media mix modeling reads. Every retainer tier ties back to the five node stack the plan requires, and every quarterly review closes the loop between the tactical channel work and the strategic growth arc the founder is defending on the P and L. Two outside reads worth an hour before the first plan cycle kicks off. Meta catalog quality reference above for feed hygiene. The Business of Fashion opinions section for the macro context that shapes which trends deserve budget in a given quarter on the merchandising side.
Checkout on apparel carries a size selector as the first field, not the last. Programs that push size selection to a second step lose 4 to 9 percent conversion rate on the same traffic because the mobile buyer scrolls twice for a decision the desktop pattern buries. The mobile buyer decides in under six seconds whether the flow feels safe. Every friction point in that window costs margin.
The checkout structure that respects sizing
The size selector sits directly under the price, above the add to cart button. Sold out sizes stay visible with a strikethrough, not hidden, so the buyer reads the size chart against the availability without a filter reset. A restock notification input replaces the add to cart button on the sold out size. On mobile, the size selector expands into a tap sheet that shows the size chart and fit review pull quotes on the same swipe. That single pattern grows completed checkout rate 6 to 12 percent on apparel accounts we have measured inside 21 days of the deploy.
Shipping and returns copy at the payment step
Shipping thresholds, return windows, and exchange policy live inline at the payment step, not on a footer page. Apparel buyers who read the return policy at cart complete checkout 18 to 30 percent more often than buyers who never see it, and the return rate on those orders drops 2 to 5 percentage points because the buyer bought with the exchange window in mind. Founders who bury return policy on a footer link are trading the transparency dividend for a false conversion gain that costs margin on the back end.
Paid social inside fashion ecommerce marketing
Paid social carries 45 to 60 percent of first order revenue on DTC apparel between $80,000 and $600,000 monthly. Meta and TikTok are the two platforms that fund. Every other platform enters through a 90 day pilot with a hard kill date, not a slow bleed into the always on budget.
Creative velocity as the real budget
Paid social on apparel wins on creative velocity, not media budget. A brand shipping 6 to 12 fresh creative variants weekly across static, Reel, and TikTok formats produces 30 to 60 percent lower cost per order than the same brand shipping 2 to 3 variants weekly on the same media budget. Fashion audiences fatigue creative inside 5 to 9 days on the same face and product angle. The retainer needs to feed that fatigue rate, not fight it, and the creative production line has to run on a weekly cadence with a named producer.
The catalog feed that carries Shopping
Meta Advantage Plus Shopping and TikTok Shop pull directly from the Shopify product feed. Programs that let the feed run on default titles and default images produce 40 to 70 percent higher cost per order than programs that rewrite the top 40 SKU feed titles and swap the primary feed image to the highest performing lifestyle shot. Feed hygiene is the cheapest paid social gain available on an apparel account and the one most founders never open. Meta’s catalog quality reference covers the field level rules that shape delivery.
Retention inside fashion ecommerce marketing
Retention is the layer that decides whether the P and L runs on margin or grinds through paid acquisition to break even. A DTC apparel brand with a 30 percent day 90 repeat rate runs 20 to 35 percent more contribution margin per blended dollar of spend than the same brand at 15 percent. Retention is not one channel. It is a stack of email, SMS, loyalty, and post purchase content on a monthly calendar.
Email and SMS as the core
Email drives 25 to 35 percent of DTC apparel revenue when the flow set is complete. Welcome, browse abandonment, cart abandonment, post purchase, replenishment, VIP, and win back are the seven flows every brand needs live inside the first 90 days. SMS adds another 8 to 15 percent of revenue at a 5 to 12 percent list opt in rate. Klaviyo and Attentive dominate the DTC apparel tool stack because the two platforms handle 90 percent of the flow logic without custom development. Our what is fashion marketing primer covers how the retention layer plugs into the wider channel mix.
Post purchase content that grows LTV
Post purchase content covers the four weeks after delivery on a first order. Styling emails that pair the purchased SKU with three complementary pieces. A fit review request at day seven when the buyer has worn the garment twice. A community moment at day fourteen with user photos of the same SKU. A second order incentive at day 28 with a category adjacent recommendation. Programs that publish the full post purchase sequence grow lifetime value 22 to 45 percent by month twelve on the same first order cohort, and the retention layer starts to carry the revenue growth the paid team used to carry alone.
Benchmarks inside fashion ecommerce marketing
Benchmarks make the plan honest. A DTC apparel brand reads its own numbers against the industry median every quarter and acts on the gaps that show up. Conversion rate. Blended cost per order. Return rate. Repeat purchase rate. Email revenue share. Each has an honest median for the revenue band, and the numbers change slowly year over year.
| Revenue band | Conversion rate | Blended CPO | Return rate (womenswear) | Day 90 repeat rate | Email revenue share |
|---|---|---|---|---|---|
| Under $80K monthly | 1.2% to 1.8% | $38 to $54 | 26% to 34% | 10% to 18% | 18% to 26% |
| $80K to $250K monthly | 1.6% to 2.4% | $28 to $46 | 24% to 32% | 16% to 24% | 22% to 30% |
| $250K to $600K monthly | 2.0% to 2.8% | $22 to $38 | 22% to 30% | 22% to 32% | 26% to 34% |
| $600K to $1.5M monthly | 2.4% to 3.4% | $18 to $32 | 20% to 28% | 28% to 38% | 28% to 36% |
| Above $1.5M monthly | 2.8% to 4.0% | $16 to $28 | 18% to 26% | 32% to 45% | 30% to 38% |
A founder who reads a monthly dashboard against these benchmarks catches the drift inside 30 days and adjusts the plan before the quarter closes. A founder who reads only the paid social dashboard catches the drift 90 days late, which usually means the correction shows up in the next quarter revenue instead of the current one. That single reporting habit is the difference between an apparel plan that grows and an apparel plan that runs in place while the founder wonders what actually changed under the surface. Founders scoping the wider paid team should read our fashion marketing agency guide for the retainer scope that sits above these benchmark reads.
How do you measure fashion ecommerce marketing honestly
Honest measurement of fashion ecommerce marketing runs on four data streams reconciled inside one weekly dashboard. Shopify revenue by UTM and discount code. Google Analytics 4 sessions and assisted conversion. Meta and TikTok ads platform attribution. A post purchase survey on every order that asks where the buyer first saw the brand. Each stream lies on its own.
The single biggest reporting mistake is trusting Meta own return on ad spend number as the campaign result. Meta over reports by 30 to 90 percent on apparel accounts because the pixel double counts view through and click through revenue that would have converted anyway. Google Analytics 4 under reports because the model discounts paid social influence on longer consideration windows. Shopify tells the truth on first order revenue but nothing on assisted revenue. Post purchase surveys catch the audience that saw the campaign on TikTok, searched a week later, and bought through direct traffic. The four streams together reconcile inside a 5 to 8 percent margin on a well tagged apparel account. Google’s attribution model documentation is the source every founder should read before arguing about which number is correct.
Every plan reports campaign level revenue against the campaign level budget with a 7 day and 30 day view. Anything shorter than 7 days is noise on an apparel buying cycle. Anything longer than 30 days is too late to change the current campaign trajectory. The founder reads the dashboard once a week on Monday morning before the review meeting, not once at the end of the quarter when the numbers are already locked into a bad direction.
Fashion ecommerce marketing in production
Boogie Board came to our team with a DTC ecommerce program running the same problem most apparel brands run at $340,000 monthly. Product pages with four images per SKU, no fit content on the size selector, a checkout that pushed size to step two on mobile, cost per acquisition at $150.92 and climbing, and a founder who read the paid social dashboard at face value every Monday. The plan looked busy on paper. The margin math looked thin on the P and L.
Our team rebuilt the ecommerce path around the five node stack. Rewrote the product page template with 8 to 12 images per SKU, garment measurements at the SKU level, and fit review pull quotes below the size selector. Moved size selection to first field at the top of the mobile checkout. Rebuilt the top 40 SKU catalog feed with lifestyle imagery and hand written titles. Turned on the seven core Klaviyo flows and a Attentive SMS list at week three. Server side tracking went in through Elevar in week two. Weekly Monday review meetings replaced the end of month post mortem, with the founder in the room and empowered to kill a campaign at week two.
Twelve months in, blended cost per acquisition dropped to $31. Conversion rate on the paid landing pages climbed 11 percent. Return rate on womenswear dropped from 38 percent to 26 percent. Day 90 repeat purchase rate grew from 22 percent to 41 percent. Managed ad budget grew to $650,000 monthly on the same margin profile. The result did not come from a magic new channel. It came from applying the five node stack, the checkout discipline, and the review cadence the plan required from day one.
The weekly review that keeps the plan honest
The Monday review meeting is where an apparel plan earns the right to keep spending. Forty five minutes, three agenda items, one decision. Read the reconciled dashboard. Review the top and bottom three ad creatives by cost per order. Decide whether the current campaign continues into next week, gets a creative pivot, or gets killed. The founder is invited and expected to make the kill decision when the numbers warrant it.
Every Monday review meeting eventually reaches the moment where somebody points at the flat performing creative and asks if the founder wants to give it one more week. The founder always says yes. The creative always underperforms for a second week. Nobody remembers who first suggested the extra week. Somewhere in the archive of every apparel brand shared drive, a flat creative is quietly generating more Monday meetings about itself than actual orders about anything on the site.
The kill rule is simple and it holds across every campaign archetype. Day 3 return on ad spend below 40 percent of target and day 7 return below 60 percent of target triggers a 24 hour creative pivot or a full kill. Programs that hold underperforming campaigns for the full run out of hope produce the flat quarters founders learn to fear. Programs that kill fast and reallocate to the winners produce the compounding quarters that make the retainer worth its rate. Founders new to structured plans assume the kill decision hurts the numbers. In practice, killing a flat creative at week two frees the budget to double down on the winner and grows the campaign result 20 to 45 percent inside the next 21 days on an apparel account.
Where fashion ecommerce marketing fits the wider stack
Fashion ecommerce marketing sits above the tactical channel work and below the annual brand strategy inside the growth stack. Every retainer allocation, every creative brief, and every founder decision on inventory rolls up to the five node plan the pod is running against. Programs that budget for tactics without the plan produce busy months with soft revenue. Programs that build the plan first produce quarters where every product page, every ad, and every email adds up to a single growth arc the founder can defend at a board meeting.
The retainer that runs the plan starts at $599 monthly on a 6 month contract and scales with revenue. The retainer covers merchandising audits, fit content templates, product page image direction, checkout audits, retention flow builds, weekly review meetings, and quarterly server side tracking audits. Founders scoping the wider agency side should also read our apparel fashion marketing hub for the broader deliverable list and pricing tiers by revenue band.
The retainer scales with revenue band, deliverable scope, and the number of active campaigns per quarter. A brand at $80,000 monthly runs a lean retainer with the founder in the review meeting. A brand at $600,000 monthly runs a fuller retainer with a dedicated pod and monthly media mix modeling reads. Every retainer tier ties back to the five node stack the plan requires, and every quarterly review closes the loop between the tactical channel work and the strategic growth arc the founder is defending on the P and L. Two outside reads worth an hour before the first plan cycle kicks off. Meta catalog quality reference above for feed hygiene. The Business of Fashion opinions section for the macro context that shapes which trends deserve budget in a given quarter on the merchandising side.
Product page imagery is where a paid social click either converts or bounces inside eight seconds. The industry median product page ships four images per SKU. The winners ship eight to twelve, and every image answers a specific buyer question the paid ad already primed.
The imagery stack per SKU
A working stack per SKU carries model shot on size medium, model shot on size extra large or size fourteen so the buyer sees the fit at range, flat lay on a neutral ground for the utility view, detail shot on the fabric texture, detail shot on the hardware and stitching, back view on the model, side view on the model, movement clip of 4 to 8 seconds, and a scale shot next to a familiar object for accessories. Programs that publish all twelve image slots grow conversion rate 8 to 22 percent against the four image baseline, and Meta gets richer feed asset variants to test in the ad set.
Video that earns its production cost
Product page video works when it stays under 10 seconds, loops on autoplay, mutes by default, and shows movement the still shot cannot. Longer videos hurt page load and buyer patience without a conversion gain. A DTC apparel brand doing $340,000 monthly should budget $60,000 to $140,000 annually on product page video across the top 40 SKUs by contribution margin. Below that budget, the video shoot day math does not work and the founder ships either thin coverage on all SKUs or full coverage on the wrong ones. Shopify’s product photography guide is a useful outside read for founders scoping a first shoot.
Checkout inside fashion ecommerce marketing
Checkout on apparel carries a size selector as the first field, not the last. Programs that push size selection to a second step lose 4 to 9 percent conversion rate on the same traffic because the mobile buyer scrolls twice for a decision the desktop pattern buries. The mobile buyer decides in under six seconds whether the flow feels safe. Every friction point in that window costs margin.
The checkout structure that respects sizing
The size selector sits directly under the price, above the add to cart button. Sold out sizes stay visible with a strikethrough, not hidden, so the buyer reads the size chart against the availability without a filter reset. A restock notification input replaces the add to cart button on the sold out size. On mobile, the size selector expands into a tap sheet that shows the size chart and fit review pull quotes on the same swipe. That single pattern grows completed checkout rate 6 to 12 percent on apparel accounts we have measured inside 21 days of the deploy.
Shipping and returns copy at the payment step
Shipping thresholds, return windows, and exchange policy live inline at the payment step, not on a footer page. Apparel buyers who read the return policy at cart complete checkout 18 to 30 percent more often than buyers who never see it, and the return rate on those orders drops 2 to 5 percentage points because the buyer bought with the exchange window in mind. Founders who bury return policy on a footer link are trading the transparency dividend for a false conversion gain that costs margin on the back end.
Paid social inside fashion ecommerce marketing
Paid social carries 45 to 60 percent of first order revenue on DTC apparel between $80,000 and $600,000 monthly. Meta and TikTok are the two platforms that fund. Every other platform enters through a 90 day pilot with a hard kill date, not a slow bleed into the always on budget.
Creative velocity as the real budget
Paid social on apparel wins on creative velocity, not media budget. A brand shipping 6 to 12 fresh creative variants weekly across static, Reel, and TikTok formats produces 30 to 60 percent lower cost per order than the same brand shipping 2 to 3 variants weekly on the same media budget. Fashion audiences fatigue creative inside 5 to 9 days on the same face and product angle. The retainer needs to feed that fatigue rate, not fight it, and the creative production line has to run on a weekly cadence with a named producer.
The catalog feed that carries Shopping
Meta Advantage Plus Shopping and TikTok Shop pull directly from the Shopify product feed. Programs that let the feed run on default titles and default images produce 40 to 70 percent higher cost per order than programs that rewrite the top 40 SKU feed titles and swap the primary feed image to the highest performing lifestyle shot. Feed hygiene is the cheapest paid social gain available on an apparel account and the one most founders never open. Meta’s catalog quality reference covers the field level rules that shape delivery.
Retention inside fashion ecommerce marketing
Retention is the layer that decides whether the P and L runs on margin or grinds through paid acquisition to break even. A DTC apparel brand with a 30 percent day 90 repeat rate runs 20 to 35 percent more contribution margin per blended dollar of spend than the same brand at 15 percent. Retention is not one channel. It is a stack of email, SMS, loyalty, and post purchase content on a monthly calendar.
Email and SMS as the core
Email drives 25 to 35 percent of DTC apparel revenue when the flow set is complete. Welcome, browse abandonment, cart abandonment, post purchase, replenishment, VIP, and win back are the seven flows every brand needs live inside the first 90 days. SMS adds another 8 to 15 percent of revenue at a 5 to 12 percent list opt in rate. Klaviyo and Attentive dominate the DTC apparel tool stack because the two platforms handle 90 percent of the flow logic without custom development. Our what is fashion marketing primer covers how the retention layer plugs into the wider channel mix.
Post purchase content that grows LTV
Post purchase content covers the four weeks after delivery on a first order. Styling emails that pair the purchased SKU with three complementary pieces. A fit review request at day seven when the buyer has worn the garment twice. A community moment at day fourteen with user photos of the same SKU. A second order incentive at day 28 with a category adjacent recommendation. Programs that publish the full post purchase sequence grow lifetime value 22 to 45 percent by month twelve on the same first order cohort, and the retention layer starts to carry the revenue growth the paid team used to carry alone.
Benchmarks inside fashion ecommerce marketing
Benchmarks make the plan honest. A DTC apparel brand reads its own numbers against the industry median every quarter and acts on the gaps that show up. Conversion rate. Blended cost per order. Return rate. Repeat purchase rate. Email revenue share. Each has an honest median for the revenue band, and the numbers change slowly year over year.
| Revenue band | Conversion rate | Blended CPO | Return rate (womenswear) | Day 90 repeat rate | Email revenue share |
|---|---|---|---|---|---|
| Under $80K monthly | 1.2% to 1.8% | $38 to $54 | 26% to 34% | 10% to 18% | 18% to 26% |
| $80K to $250K monthly | 1.6% to 2.4% | $28 to $46 | 24% to 32% | 16% to 24% | 22% to 30% |
| $250K to $600K monthly | 2.0% to 2.8% | $22 to $38 | 22% to 30% | 22% to 32% | 26% to 34% |
| $600K to $1.5M monthly | 2.4% to 3.4% | $18 to $32 | 20% to 28% | 28% to 38% | 28% to 36% |
| Above $1.5M monthly | 2.8% to 4.0% | $16 to $28 | 18% to 26% | 32% to 45% | 30% to 38% |
A founder who reads a monthly dashboard against these benchmarks catches the drift inside 30 days and adjusts the plan before the quarter closes. A founder who reads only the paid social dashboard catches the drift 90 days late, which usually means the correction shows up in the next quarter revenue instead of the current one. That single reporting habit is the difference between an apparel plan that grows and an apparel plan that runs in place while the founder wonders what actually changed under the surface. Founders scoping the wider paid team should read our fashion marketing agency guide for the retainer scope that sits above these benchmark reads.
How do you measure fashion ecommerce marketing honestly
Honest measurement of fashion ecommerce marketing runs on four data streams reconciled inside one weekly dashboard. Shopify revenue by UTM and discount code. Google Analytics 4 sessions and assisted conversion. Meta and TikTok ads platform attribution. A post purchase survey on every order that asks where the buyer first saw the brand. Each stream lies on its own.
The single biggest reporting mistake is trusting Meta own return on ad spend number as the campaign result. Meta over reports by 30 to 90 percent on apparel accounts because the pixel double counts view through and click through revenue that would have converted anyway. Google Analytics 4 under reports because the model discounts paid social influence on longer consideration windows. Shopify tells the truth on first order revenue but nothing on assisted revenue. Post purchase surveys catch the audience that saw the campaign on TikTok, searched a week later, and bought through direct traffic. The four streams together reconcile inside a 5 to 8 percent margin on a well tagged apparel account. Google’s attribution model documentation is the source every founder should read before arguing about which number is correct.
Every plan reports campaign level revenue against the campaign level budget with a 7 day and 30 day view. Anything shorter than 7 days is noise on an apparel buying cycle. Anything longer than 30 days is too late to change the current campaign trajectory. The founder reads the dashboard once a week on Monday morning before the review meeting, not once at the end of the quarter when the numbers are already locked into a bad direction.
Fashion ecommerce marketing in production
Boogie Board came to our team with a DTC ecommerce program running the same problem most apparel brands run at $340,000 monthly. Product pages with four images per SKU, no fit content on the size selector, a checkout that pushed size to step two on mobile, cost per acquisition at $150.92 and climbing, and a founder who read the paid social dashboard at face value every Monday. The plan looked busy on paper. The margin math looked thin on the P and L.
Our team rebuilt the ecommerce path around the five node stack. Rewrote the product page template with 8 to 12 images per SKU, garment measurements at the SKU level, and fit review pull quotes below the size selector. Moved size selection to first field at the top of the mobile checkout. Rebuilt the top 40 SKU catalog feed with lifestyle imagery and hand written titles. Turned on the seven core Klaviyo flows and a Attentive SMS list at week three. Server side tracking went in through Elevar in week two. Weekly Monday review meetings replaced the end of month post mortem, with the founder in the room and empowered to kill a campaign at week two.
Twelve months in, blended cost per acquisition dropped to $31. Conversion rate on the paid landing pages climbed 11 percent. Return rate on womenswear dropped from 38 percent to 26 percent. Day 90 repeat purchase rate grew from 22 percent to 41 percent. Managed ad budget grew to $650,000 monthly on the same margin profile. The result did not come from a magic new channel. It came from applying the five node stack, the checkout discipline, and the review cadence the plan required from day one.
The weekly review that keeps the plan honest
The Monday review meeting is where an apparel plan earns the right to keep spending. Forty five minutes, three agenda items, one decision. Read the reconciled dashboard. Review the top and bottom three ad creatives by cost per order. Decide whether the current campaign continues into next week, gets a creative pivot, or gets killed. The founder is invited and expected to make the kill decision when the numbers warrant it.
Every Monday review meeting eventually reaches the moment where somebody points at the flat performing creative and asks if the founder wants to give it one more week. The founder always says yes. The creative always underperforms for a second week. Nobody remembers who first suggested the extra week. Somewhere in the archive of every apparel brand shared drive, a flat creative is quietly generating more Monday meetings about itself than actual orders about anything on the site.
The kill rule is simple and it holds across every campaign archetype. Day 3 return on ad spend below 40 percent of target and day 7 return below 60 percent of target triggers a 24 hour creative pivot or a full kill. Programs that hold underperforming campaigns for the full run out of hope produce the flat quarters founders learn to fear. Programs that kill fast and reallocate to the winners produce the compounding quarters that make the retainer worth its rate. Founders new to structured plans assume the kill decision hurts the numbers. In practice, killing a flat creative at week two frees the budget to double down on the winner and grows the campaign result 20 to 45 percent inside the next 21 days on an apparel account.
Where fashion ecommerce marketing fits the wider stack
Fashion ecommerce marketing sits above the tactical channel work and below the annual brand strategy inside the growth stack. Every retainer allocation, every creative brief, and every founder decision on inventory rolls up to the five node plan the pod is running against. Programs that budget for tactics without the plan produce busy months with soft revenue. Programs that build the plan first produce quarters where every product page, every ad, and every email adds up to a single growth arc the founder can defend at a board meeting.
The retainer that runs the plan starts at $599 monthly on a 6 month contract and scales with revenue. The retainer covers merchandising audits, fit content templates, product page image direction, checkout audits, retention flow builds, weekly review meetings, and quarterly server side tracking audits. Founders scoping the wider agency side should also read our apparel fashion marketing hub for the broader deliverable list and pricing tiers by revenue band.
The retainer scales with revenue band, deliverable scope, and the number of active campaigns per quarter. A brand at $80,000 monthly runs a lean retainer with the founder in the review meeting. A brand at $600,000 monthly runs a fuller retainer with a dedicated pod and monthly media mix modeling reads. Every retainer tier ties back to the five node stack the plan requires, and every quarterly review closes the loop between the tactical channel work and the strategic growth arc the founder is defending on the P and L. Two outside reads worth an hour before the first plan cycle kicks off. Meta catalog quality reference above for feed hygiene. The Business of Fashion opinions section for the macro context that shapes which trends deserve budget in a given quarter on the merchandising side.
Return rate is the single margin killer on DTC apparel. Womenswear runs 22 to 30 percent, menswear 12 to 18 percent, accessories 6 to 10 percent. Two thirds of apparel returns cite fit or size as the reason. Fashion ecommerce marketing that ignores fit content spends the paid social budget twice on every return that goes back into inventory.
The plan builds a fit content stack on every SKU. Model height and size worn in the product description. Garment measurements at the SKU level, not the style level. Fit review notes pulled from customer reviews on a dedicated Fit tab. Size guides at the collection level with the actual measurement method photographed. Programs that publish the full fit stack on every SKU cut return rate 4 to 9 percentage points inside two quarters, which is the biggest margin move available in apparel without a supply chain change.
Where the fit content lives on the page
Fit content lives above the fold on desktop and inside the third scroll on mobile. The size chart lives one tap deep from the size selector, not three clicks deep behind a footer link. Fit review pull quotes live directly below the size selector so the buyer reads what the size chart says and what other buyers actually experienced in the same tap. That single change grows conversion rate 6 to 14 percent on apparel accounts we have tested inside 30 days, and it costs nothing in creative production because the copy already exists in the review corpus.
Fit tech worth funding
True Fit, Fit Analytics, and Bold Metrics carry the automated fit recommendation layer on scaled apparel programs. Each pulls buyer inputs (height, weight, common size in another brand) and recommends a size at add to cart. Return rate drops 3 to 7 percentage points on the SKUs where the tool is live and the buyer engages with the input flow. Below $250,000 monthly, the tool license outruns the return savings. Above $600,000 monthly, the math flips and the tool pays for itself inside a quarter.
Product page imagery inside fashion ecommerce marketing
Product page imagery is where a paid social click either converts or bounces inside eight seconds. The industry median product page ships four images per SKU. The winners ship eight to twelve, and every image answers a specific buyer question the paid ad already primed.
The imagery stack per SKU
A working stack per SKU carries model shot on size medium, model shot on size extra large or size fourteen so the buyer sees the fit at range, flat lay on a neutral ground for the utility view, detail shot on the fabric texture, detail shot on the hardware and stitching, back view on the model, side view on the model, movement clip of 4 to 8 seconds, and a scale shot next to a familiar object for accessories. Programs that publish all twelve image slots grow conversion rate 8 to 22 percent against the four image baseline, and Meta gets richer feed asset variants to test in the ad set.
Video that earns its production cost
Product page video works when it stays under 10 seconds, loops on autoplay, mutes by default, and shows movement the still shot cannot. Longer videos hurt page load and buyer patience without a conversion gain. A DTC apparel brand doing $340,000 monthly should budget $60,000 to $140,000 annually on product page video across the top 40 SKUs by contribution margin. Below that budget, the video shoot day math does not work and the founder ships either thin coverage on all SKUs or full coverage on the wrong ones. Shopify’s product photography guide is a useful outside read for founders scoping a first shoot.
Checkout inside fashion ecommerce marketing
Checkout on apparel carries a size selector as the first field, not the last. Programs that push size selection to a second step lose 4 to 9 percent conversion rate on the same traffic because the mobile buyer scrolls twice for a decision the desktop pattern buries. The mobile buyer decides in under six seconds whether the flow feels safe. Every friction point in that window costs margin.
The checkout structure that respects sizing
The size selector sits directly under the price, above the add to cart button. Sold out sizes stay visible with a strikethrough, not hidden, so the buyer reads the size chart against the availability without a filter reset. A restock notification input replaces the add to cart button on the sold out size. On mobile, the size selector expands into a tap sheet that shows the size chart and fit review pull quotes on the same swipe. That single pattern grows completed checkout rate 6 to 12 percent on apparel accounts we have measured inside 21 days of the deploy.
Shipping and returns copy at the payment step
Shipping thresholds, return windows, and exchange policy live inline at the payment step, not on a footer page. Apparel buyers who read the return policy at cart complete checkout 18 to 30 percent more often than buyers who never see it, and the return rate on those orders drops 2 to 5 percentage points because the buyer bought with the exchange window in mind. Founders who bury return policy on a footer link are trading the transparency dividend for a false conversion gain that costs margin on the back end.
Paid social inside fashion ecommerce marketing
Paid social carries 45 to 60 percent of first order revenue on DTC apparel between $80,000 and $600,000 monthly. Meta and TikTok are the two platforms that fund. Every other platform enters through a 90 day pilot with a hard kill date, not a slow bleed into the always on budget.
Creative velocity as the real budget
Paid social on apparel wins on creative velocity, not media budget. A brand shipping 6 to 12 fresh creative variants weekly across static, Reel, and TikTok formats produces 30 to 60 percent lower cost per order than the same brand shipping 2 to 3 variants weekly on the same media budget. Fashion audiences fatigue creative inside 5 to 9 days on the same face and product angle. The retainer needs to feed that fatigue rate, not fight it, and the creative production line has to run on a weekly cadence with a named producer.
The catalog feed that carries Shopping
Meta Advantage Plus Shopping and TikTok Shop pull directly from the Shopify product feed. Programs that let the feed run on default titles and default images produce 40 to 70 percent higher cost per order than programs that rewrite the top 40 SKU feed titles and swap the primary feed image to the highest performing lifestyle shot. Feed hygiene is the cheapest paid social gain available on an apparel account and the one most founders never open. Meta’s catalog quality reference covers the field level rules that shape delivery.
Retention inside fashion ecommerce marketing
Retention is the layer that decides whether the P and L runs on margin or grinds through paid acquisition to break even. A DTC apparel brand with a 30 percent day 90 repeat rate runs 20 to 35 percent more contribution margin per blended dollar of spend than the same brand at 15 percent. Retention is not one channel. It is a stack of email, SMS, loyalty, and post purchase content on a monthly calendar.
Email and SMS as the core
Email drives 25 to 35 percent of DTC apparel revenue when the flow set is complete. Welcome, browse abandonment, cart abandonment, post purchase, replenishment, VIP, and win back are the seven flows every brand needs live inside the first 90 days. SMS adds another 8 to 15 percent of revenue at a 5 to 12 percent list opt in rate. Klaviyo and Attentive dominate the DTC apparel tool stack because the two platforms handle 90 percent of the flow logic without custom development. Our what is fashion marketing primer covers how the retention layer plugs into the wider channel mix.
Post purchase content that grows LTV
Post purchase content covers the four weeks after delivery on a first order. Styling emails that pair the purchased SKU with three complementary pieces. A fit review request at day seven when the buyer has worn the garment twice. A community moment at day fourteen with user photos of the same SKU. A second order incentive at day 28 with a category adjacent recommendation. Programs that publish the full post purchase sequence grow lifetime value 22 to 45 percent by month twelve on the same first order cohort, and the retention layer starts to carry the revenue growth the paid team used to carry alone.
Benchmarks inside fashion ecommerce marketing
Benchmarks make the plan honest. A DTC apparel brand reads its own numbers against the industry median every quarter and acts on the gaps that show up. Conversion rate. Blended cost per order. Return rate. Repeat purchase rate. Email revenue share. Each has an honest median for the revenue band, and the numbers change slowly year over year.
| Revenue band | Conversion rate | Blended CPO | Return rate (womenswear) | Day 90 repeat rate | Email revenue share |
|---|---|---|---|---|---|
| Under $80K monthly | 1.2% to 1.8% | $38 to $54 | 26% to 34% | 10% to 18% | 18% to 26% |
| $80K to $250K monthly | 1.6% to 2.4% | $28 to $46 | 24% to 32% | 16% to 24% | 22% to 30% |
| $250K to $600K monthly | 2.0% to 2.8% | $22 to $38 | 22% to 30% | 22% to 32% | 26% to 34% |
| $600K to $1.5M monthly | 2.4% to 3.4% | $18 to $32 | 20% to 28% | 28% to 38% | 28% to 36% |
| Above $1.5M monthly | 2.8% to 4.0% | $16 to $28 | 18% to 26% | 32% to 45% | 30% to 38% |
A founder who reads a monthly dashboard against these benchmarks catches the drift inside 30 days and adjusts the plan before the quarter closes. A founder who reads only the paid social dashboard catches the drift 90 days late, which usually means the correction shows up in the next quarter revenue instead of the current one. That single reporting habit is the difference between an apparel plan that grows and an apparel plan that runs in place while the founder wonders what actually changed under the surface. Founders scoping the wider paid team should read our fashion marketing agency guide for the retainer scope that sits above these benchmark reads.
How do you measure fashion ecommerce marketing honestly
Honest measurement of fashion ecommerce marketing runs on four data streams reconciled inside one weekly dashboard. Shopify revenue by UTM and discount code. Google Analytics 4 sessions and assisted conversion. Meta and TikTok ads platform attribution. A post purchase survey on every order that asks where the buyer first saw the brand. Each stream lies on its own.
The single biggest reporting mistake is trusting Meta own return on ad spend number as the campaign result. Meta over reports by 30 to 90 percent on apparel accounts because the pixel double counts view through and click through revenue that would have converted anyway. Google Analytics 4 under reports because the model discounts paid social influence on longer consideration windows. Shopify tells the truth on first order revenue but nothing on assisted revenue. Post purchase surveys catch the audience that saw the campaign on TikTok, searched a week later, and bought through direct traffic. The four streams together reconcile inside a 5 to 8 percent margin on a well tagged apparel account. Google’s attribution model documentation is the source every founder should read before arguing about which number is correct.
Every plan reports campaign level revenue against the campaign level budget with a 7 day and 30 day view. Anything shorter than 7 days is noise on an apparel buying cycle. Anything longer than 30 days is too late to change the current campaign trajectory. The founder reads the dashboard once a week on Monday morning before the review meeting, not once at the end of the quarter when the numbers are already locked into a bad direction.
Fashion ecommerce marketing in production
Boogie Board came to our team with a DTC ecommerce program running the same problem most apparel brands run at $340,000 monthly. Product pages with four images per SKU, no fit content on the size selector, a checkout that pushed size to step two on mobile, cost per acquisition at $150.92 and climbing, and a founder who read the paid social dashboard at face value every Monday. The plan looked busy on paper. The margin math looked thin on the P and L.
Our team rebuilt the ecommerce path around the five node stack. Rewrote the product page template with 8 to 12 images per SKU, garment measurements at the SKU level, and fit review pull quotes below the size selector. Moved size selection to first field at the top of the mobile checkout. Rebuilt the top 40 SKU catalog feed with lifestyle imagery and hand written titles. Turned on the seven core Klaviyo flows and a Attentive SMS list at week three. Server side tracking went in through Elevar in week two. Weekly Monday review meetings replaced the end of month post mortem, with the founder in the room and empowered to kill a campaign at week two.
Twelve months in, blended cost per acquisition dropped to $31. Conversion rate on the paid landing pages climbed 11 percent. Return rate on womenswear dropped from 38 percent to 26 percent. Day 90 repeat purchase rate grew from 22 percent to 41 percent. Managed ad budget grew to $650,000 monthly on the same margin profile. The result did not come from a magic new channel. It came from applying the five node stack, the checkout discipline, and the review cadence the plan required from day one.
The weekly review that keeps the plan honest
The Monday review meeting is where an apparel plan earns the right to keep spending. Forty five minutes, three agenda items, one decision. Read the reconciled dashboard. Review the top and bottom three ad creatives by cost per order. Decide whether the current campaign continues into next week, gets a creative pivot, or gets killed. The founder is invited and expected to make the kill decision when the numbers warrant it.
Every Monday review meeting eventually reaches the moment where somebody points at the flat performing creative and asks if the founder wants to give it one more week. The founder always says yes. The creative always underperforms for a second week. Nobody remembers who first suggested the extra week. Somewhere in the archive of every apparel brand shared drive, a flat creative is quietly generating more Monday meetings about itself than actual orders about anything on the site.
The kill rule is simple and it holds across every campaign archetype. Day 3 return on ad spend below 40 percent of target and day 7 return below 60 percent of target triggers a 24 hour creative pivot or a full kill. Programs that hold underperforming campaigns for the full run out of hope produce the flat quarters founders learn to fear. Programs that kill fast and reallocate to the winners produce the compounding quarters that make the retainer worth its rate. Founders new to structured plans assume the kill decision hurts the numbers. In practice, killing a flat creative at week two frees the budget to double down on the winner and grows the campaign result 20 to 45 percent inside the next 21 days on an apparel account.
Where fashion ecommerce marketing fits the wider stack
Fashion ecommerce marketing sits above the tactical channel work and below the annual brand strategy inside the growth stack. Every retainer allocation, every creative brief, and every founder decision on inventory rolls up to the five node plan the pod is running against. Programs that budget for tactics without the plan produce busy months with soft revenue. Programs that build the plan first produce quarters where every product page, every ad, and every email adds up to a single growth arc the founder can defend at a board meeting.
The retainer that runs the plan starts at $599 monthly on a 6 month contract and scales with revenue. The retainer covers merchandising audits, fit content templates, product page image direction, checkout audits, retention flow builds, weekly review meetings, and quarterly server side tracking audits. Founders scoping the wider agency side should also read our apparel fashion marketing hub for the broader deliverable list and pricing tiers by revenue band.
The retainer scales with revenue band, deliverable scope, and the number of active campaigns per quarter. A brand at $80,000 monthly runs a lean retainer with the founder in the review meeting. A brand at $600,000 monthly runs a fuller retainer with a dedicated pod and monthly media mix modeling reads. Every retainer tier ties back to the five node stack the plan requires, and every quarterly review closes the loop between the tactical channel work and the strategic growth arc the founder is defending on the P and L. Two outside reads worth an hour before the first plan cycle kicks off. Meta catalog quality reference above for feed hygiene. The Business of Fashion opinions section for the macro context that shapes which trends deserve budget in a given quarter on the merchandising side.
Paid social carries 45 to 60 percent of first order revenue on DTC apparel between $80,000 and $600,000 monthly. Meta and TikTok are the two platforms that fund. Every other platform enters through a 90 day pilot with a hard kill date, not a slow bleed into the always on budget.
Creative velocity as the real budget
Paid social on apparel wins on creative velocity, not media budget. A brand shipping 6 to 12 fresh creative variants weekly across static, Reel, and TikTok formats produces 30 to 60 percent lower cost per order than the same brand shipping 2 to 3 variants weekly on the same media budget. Fashion audiences fatigue creative inside 5 to 9 days on the same face and product angle. The retainer needs to feed that fatigue rate, not fight it, and the creative production line has to run on a weekly cadence with a named producer.
The catalog feed that carries Shopping
Meta Advantage Plus Shopping and TikTok Shop pull directly from the Shopify product feed. Programs that let the feed run on default titles and default images produce 40 to 70 percent higher cost per order than programs that rewrite the top 40 SKU feed titles and swap the primary feed image to the highest performing lifestyle shot. Feed hygiene is the cheapest paid social gain available on an apparel account and the one most founders never open. Meta’s catalog quality reference covers the field level rules that shape delivery.
Retention inside fashion ecommerce marketing
Retention is the layer that decides whether the P and L runs on margin or grinds through paid acquisition to break even. A DTC apparel brand with a 30 percent day 90 repeat rate runs 20 to 35 percent more contribution margin per blended dollar of spend than the same brand at 15 percent. Retention is not one channel. It is a stack of email, SMS, loyalty, and post purchase content on a monthly calendar.
Email and SMS as the core
Email drives 25 to 35 percent of DTC apparel revenue when the flow set is complete. Welcome, browse abandonment, cart abandonment, post purchase, replenishment, VIP, and win back are the seven flows every brand needs live inside the first 90 days. SMS adds another 8 to 15 percent of revenue at a 5 to 12 percent list opt in rate. Klaviyo and Attentive dominate the DTC apparel tool stack because the two platforms handle 90 percent of the flow logic without custom development. Our what is fashion marketing primer covers how the retention layer plugs into the wider channel mix.
Post purchase content that grows LTV
Post purchase content covers the four weeks after delivery on a first order. Styling emails that pair the purchased SKU with three complementary pieces. A fit review request at day seven when the buyer has worn the garment twice. A community moment at day fourteen with user photos of the same SKU. A second order incentive at day 28 with a category adjacent recommendation. Programs that publish the full post purchase sequence grow lifetime value 22 to 45 percent by month twelve on the same first order cohort, and the retention layer starts to carry the revenue growth the paid team used to carry alone.
Benchmarks inside fashion ecommerce marketing
Benchmarks make the plan honest. A DTC apparel brand reads its own numbers against the industry median every quarter and acts on the gaps that show up. Conversion rate. Blended cost per order. Return rate. Repeat purchase rate. Email revenue share. Each has an honest median for the revenue band, and the numbers change slowly year over year.
| Revenue band | Conversion rate | Blended CPO | Return rate (womenswear) | Day 90 repeat rate | Email revenue share |
|---|---|---|---|---|---|
| Under $80K monthly | 1.2% to 1.8% | $38 to $54 | 26% to 34% | 10% to 18% | 18% to 26% |
| $80K to $250K monthly | 1.6% to 2.4% | $28 to $46 | 24% to 32% | 16% to 24% | 22% to 30% |
| $250K to $600K monthly | 2.0% to 2.8% | $22 to $38 | 22% to 30% | 22% to 32% | 26% to 34% |
| $600K to $1.5M monthly | 2.4% to 3.4% | $18 to $32 | 20% to 28% | 28% to 38% | 28% to 36% |
| Above $1.5M monthly | 2.8% to 4.0% | $16 to $28 | 18% to 26% | 32% to 45% | 30% to 38% |
A founder who reads a monthly dashboard against these benchmarks catches the drift inside 30 days and adjusts the plan before the quarter closes. A founder who reads only the paid social dashboard catches the drift 90 days late, which usually means the correction shows up in the next quarter revenue instead of the current one. That single reporting habit is the difference between an apparel plan that grows and an apparel plan that runs in place while the founder wonders what actually changed under the surface. Founders scoping the wider paid team should read our fashion marketing agency guide for the retainer scope that sits above these benchmark reads.
How do you measure fashion ecommerce marketing honestly
Honest measurement of fashion ecommerce marketing runs on four data streams reconciled inside one weekly dashboard. Shopify revenue by UTM and discount code. Google Analytics 4 sessions and assisted conversion. Meta and TikTok ads platform attribution. A post purchase survey on every order that asks where the buyer first saw the brand. Each stream lies on its own.
The single biggest reporting mistake is trusting Meta own return on ad spend number as the campaign result. Meta over reports by 30 to 90 percent on apparel accounts because the pixel double counts view through and click through revenue that would have converted anyway. Google Analytics 4 under reports because the model discounts paid social influence on longer consideration windows. Shopify tells the truth on first order revenue but nothing on assisted revenue. Post purchase surveys catch the audience that saw the campaign on TikTok, searched a week later, and bought through direct traffic. The four streams together reconcile inside a 5 to 8 percent margin on a well tagged apparel account. Google’s attribution model documentation is the source every founder should read before arguing about which number is correct.
Every plan reports campaign level revenue against the campaign level budget with a 7 day and 30 day view. Anything shorter than 7 days is noise on an apparel buying cycle. Anything longer than 30 days is too late to change the current campaign trajectory. The founder reads the dashboard once a week on Monday morning before the review meeting, not once at the end of the quarter when the numbers are already locked into a bad direction.
Fashion ecommerce marketing in production
Boogie Board came to our team with a DTC ecommerce program running the same problem most apparel brands run at $340,000 monthly. Product pages with four images per SKU, no fit content on the size selector, a checkout that pushed size to step two on mobile, cost per acquisition at $150.92 and climbing, and a founder who read the paid social dashboard at face value every Monday. The plan looked busy on paper. The margin math looked thin on the P and L.
Our team rebuilt the ecommerce path around the five node stack. Rewrote the product page template with 8 to 12 images per SKU, garment measurements at the SKU level, and fit review pull quotes below the size selector. Moved size selection to first field at the top of the mobile checkout. Rebuilt the top 40 SKU catalog feed with lifestyle imagery and hand written titles. Turned on the seven core Klaviyo flows and a Attentive SMS list at week three. Server side tracking went in through Elevar in week two. Weekly Monday review meetings replaced the end of month post mortem, with the founder in the room and empowered to kill a campaign at week two.
Twelve months in, blended cost per acquisition dropped to $31. Conversion rate on the paid landing pages climbed 11 percent. Return rate on womenswear dropped from 38 percent to 26 percent. Day 90 repeat purchase rate grew from 22 percent to 41 percent. Managed ad budget grew to $650,000 monthly on the same margin profile. The result did not come from a magic new channel. It came from applying the five node stack, the checkout discipline, and the review cadence the plan required from day one.
The weekly review that keeps the plan honest
The Monday review meeting is where an apparel plan earns the right to keep spending. Forty five minutes, three agenda items, one decision. Read the reconciled dashboard. Review the top and bottom three ad creatives by cost per order. Decide whether the current campaign continues into next week, gets a creative pivot, or gets killed. The founder is invited and expected to make the kill decision when the numbers warrant it.
Every Monday review meeting eventually reaches the moment where somebody points at the flat performing creative and asks if the founder wants to give it one more week. The founder always says yes. The creative always underperforms for a second week. Nobody remembers who first suggested the extra week. Somewhere in the archive of every apparel brand shared drive, a flat creative is quietly generating more Monday meetings about itself than actual orders about anything on the site.
The kill rule is simple and it holds across every campaign archetype. Day 3 return on ad spend below 40 percent of target and day 7 return below 60 percent of target triggers a 24 hour creative pivot or a full kill. Programs that hold underperforming campaigns for the full run out of hope produce the flat quarters founders learn to fear. Programs that kill fast and reallocate to the winners produce the compounding quarters that make the retainer worth its rate. Founders new to structured plans assume the kill decision hurts the numbers. In practice, killing a flat creative at week two frees the budget to double down on the winner and grows the campaign result 20 to 45 percent inside the next 21 days on an apparel account.
Where fashion ecommerce marketing fits the wider stack
Fashion ecommerce marketing sits above the tactical channel work and below the annual brand strategy inside the growth stack. Every retainer allocation, every creative brief, and every founder decision on inventory rolls up to the five node plan the pod is running against. Programs that budget for tactics without the plan produce busy months with soft revenue. Programs that build the plan first produce quarters where every product page, every ad, and every email adds up to a single growth arc the founder can defend at a board meeting.
The retainer that runs the plan starts at $599 monthly on a 6 month contract and scales with revenue. The retainer covers merchandising audits, fit content templates, product page image direction, checkout audits, retention flow builds, weekly review meetings, and quarterly server side tracking audits. Founders scoping the wider agency side should also read our apparel fashion marketing hub for the broader deliverable list and pricing tiers by revenue band.
The retainer scales with revenue band, deliverable scope, and the number of active campaigns per quarter. A brand at $80,000 monthly runs a lean retainer with the founder in the review meeting. A brand at $600,000 monthly runs a fuller retainer with a dedicated pod and monthly media mix modeling reads. Every retainer tier ties back to the five node stack the plan requires, and every quarterly review closes the loop between the tactical channel work and the strategic growth arc the founder is defending on the P and L. Two outside reads worth an hour before the first plan cycle kicks off. Meta catalog quality reference above for feed hygiene. The Business of Fashion opinions section for the macro context that shapes which trends deserve budget in a given quarter on the merchandising side.
Checkout on apparel carries a size selector as the first field, not the last. Programs that push size selection to a second step lose 4 to 9 percent conversion rate on the same traffic because the mobile buyer scrolls twice for a decision the desktop pattern buries. The mobile buyer decides in under six seconds whether the flow feels safe. Every friction point in that window costs margin.
The checkout structure that respects sizing
The size selector sits directly under the price, above the add to cart button. Sold out sizes stay visible with a strikethrough, not hidden, so the buyer reads the size chart against the availability without a filter reset. A restock notification input replaces the add to cart button on the sold out size. On mobile, the size selector expands into a tap sheet that shows the size chart and fit review pull quotes on the same swipe. That single pattern grows completed checkout rate 6 to 12 percent on apparel accounts we have measured inside 21 days of the deploy.
Shipping and returns copy at the payment step
Shipping thresholds, return windows, and exchange policy live inline at the payment step, not on a footer page. Apparel buyers who read the return policy at cart complete checkout 18 to 30 percent more often than buyers who never see it, and the return rate on those orders drops 2 to 5 percentage points because the buyer bought with the exchange window in mind. Founders who bury return policy on a footer link are trading the transparency dividend for a false conversion gain that costs margin on the back end.
Paid social inside fashion ecommerce marketing
Paid social carries 45 to 60 percent of first order revenue on DTC apparel between $80,000 and $600,000 monthly. Meta and TikTok are the two platforms that fund. Every other platform enters through a 90 day pilot with a hard kill date, not a slow bleed into the always on budget.
Creative velocity as the real budget
Paid social on apparel wins on creative velocity, not media budget. A brand shipping 6 to 12 fresh creative variants weekly across static, Reel, and TikTok formats produces 30 to 60 percent lower cost per order than the same brand shipping 2 to 3 variants weekly on the same media budget. Fashion audiences fatigue creative inside 5 to 9 days on the same face and product angle. The retainer needs to feed that fatigue rate, not fight it, and the creative production line has to run on a weekly cadence with a named producer.
The catalog feed that carries Shopping
Meta Advantage Plus Shopping and TikTok Shop pull directly from the Shopify product feed. Programs that let the feed run on default titles and default images produce 40 to 70 percent higher cost per order than programs that rewrite the top 40 SKU feed titles and swap the primary feed image to the highest performing lifestyle shot. Feed hygiene is the cheapest paid social gain available on an apparel account and the one most founders never open. Meta’s catalog quality reference covers the field level rules that shape delivery.
Retention inside fashion ecommerce marketing
Retention is the layer that decides whether the P and L runs on margin or grinds through paid acquisition to break even. A DTC apparel brand with a 30 percent day 90 repeat rate runs 20 to 35 percent more contribution margin per blended dollar of spend than the same brand at 15 percent. Retention is not one channel. It is a stack of email, SMS, loyalty, and post purchase content on a monthly calendar.
Email and SMS as the core
Email drives 25 to 35 percent of DTC apparel revenue when the flow set is complete. Welcome, browse abandonment, cart abandonment, post purchase, replenishment, VIP, and win back are the seven flows every brand needs live inside the first 90 days. SMS adds another 8 to 15 percent of revenue at a 5 to 12 percent list opt in rate. Klaviyo and Attentive dominate the DTC apparel tool stack because the two platforms handle 90 percent of the flow logic without custom development. Our what is fashion marketing primer covers how the retention layer plugs into the wider channel mix.
Post purchase content that grows LTV
Post purchase content covers the four weeks after delivery on a first order. Styling emails that pair the purchased SKU with three complementary pieces. A fit review request at day seven when the buyer has worn the garment twice. A community moment at day fourteen with user photos of the same SKU. A second order incentive at day 28 with a category adjacent recommendation. Programs that publish the full post purchase sequence grow lifetime value 22 to 45 percent by month twelve on the same first order cohort, and the retention layer starts to carry the revenue growth the paid team used to carry alone.
Benchmarks inside fashion ecommerce marketing
Benchmarks make the plan honest. A DTC apparel brand reads its own numbers against the industry median every quarter and acts on the gaps that show up. Conversion rate. Blended cost per order. Return rate. Repeat purchase rate. Email revenue share. Each has an honest median for the revenue band, and the numbers change slowly year over year.
| Revenue band | Conversion rate | Blended CPO | Return rate (womenswear) | Day 90 repeat rate | Email revenue share |
|---|---|---|---|---|---|
| Under $80K monthly | 1.2% to 1.8% | $38 to $54 | 26% to 34% | 10% to 18% | 18% to 26% |
| $80K to $250K monthly | 1.6% to 2.4% | $28 to $46 | 24% to 32% | 16% to 24% | 22% to 30% |
| $250K to $600K monthly | 2.0% to 2.8% | $22 to $38 | 22% to 30% | 22% to 32% | 26% to 34% |
| $600K to $1.5M monthly | 2.4% to 3.4% | $18 to $32 | 20% to 28% | 28% to 38% | 28% to 36% |
| Above $1.5M monthly | 2.8% to 4.0% | $16 to $28 | 18% to 26% | 32% to 45% | 30% to 38% |
A founder who reads a monthly dashboard against these benchmarks catches the drift inside 30 days and adjusts the plan before the quarter closes. A founder who reads only the paid social dashboard catches the drift 90 days late, which usually means the correction shows up in the next quarter revenue instead of the current one. That single reporting habit is the difference between an apparel plan that grows and an apparel plan that runs in place while the founder wonders what actually changed under the surface. Founders scoping the wider paid team should read our fashion marketing agency guide for the retainer scope that sits above these benchmark reads.
How do you measure fashion ecommerce marketing honestly
Honest measurement of fashion ecommerce marketing runs on four data streams reconciled inside one weekly dashboard. Shopify revenue by UTM and discount code. Google Analytics 4 sessions and assisted conversion. Meta and TikTok ads platform attribution. A post purchase survey on every order that asks where the buyer first saw the brand. Each stream lies on its own.
The single biggest reporting mistake is trusting Meta own return on ad spend number as the campaign result. Meta over reports by 30 to 90 percent on apparel accounts because the pixel double counts view through and click through revenue that would have converted anyway. Google Analytics 4 under reports because the model discounts paid social influence on longer consideration windows. Shopify tells the truth on first order revenue but nothing on assisted revenue. Post purchase surveys catch the audience that saw the campaign on TikTok, searched a week later, and bought through direct traffic. The four streams together reconcile inside a 5 to 8 percent margin on a well tagged apparel account. Google’s attribution model documentation is the source every founder should read before arguing about which number is correct.
Every plan reports campaign level revenue against the campaign level budget with a 7 day and 30 day view. Anything shorter than 7 days is noise on an apparel buying cycle. Anything longer than 30 days is too late to change the current campaign trajectory. The founder reads the dashboard once a week on Monday morning before the review meeting, not once at the end of the quarter when the numbers are already locked into a bad direction.
Fashion ecommerce marketing in production
Boogie Board came to our team with a DTC ecommerce program running the same problem most apparel brands run at $340,000 monthly. Product pages with four images per SKU, no fit content on the size selector, a checkout that pushed size to step two on mobile, cost per acquisition at $150.92 and climbing, and a founder who read the paid social dashboard at face value every Monday. The plan looked busy on paper. The margin math looked thin on the P and L.
Our team rebuilt the ecommerce path around the five node stack. Rewrote the product page template with 8 to 12 images per SKU, garment measurements at the SKU level, and fit review pull quotes below the size selector. Moved size selection to first field at the top of the mobile checkout. Rebuilt the top 40 SKU catalog feed with lifestyle imagery and hand written titles. Turned on the seven core Klaviyo flows and a Attentive SMS list at week three. Server side tracking went in through Elevar in week two. Weekly Monday review meetings replaced the end of month post mortem, with the founder in the room and empowered to kill a campaign at week two.
Twelve months in, blended cost per acquisition dropped to $31. Conversion rate on the paid landing pages climbed 11 percent. Return rate on womenswear dropped from 38 percent to 26 percent. Day 90 repeat purchase rate grew from 22 percent to 41 percent. Managed ad budget grew to $650,000 monthly on the same margin profile. The result did not come from a magic new channel. It came from applying the five node stack, the checkout discipline, and the review cadence the plan required from day one.
The weekly review that keeps the plan honest
The Monday review meeting is where an apparel plan earns the right to keep spending. Forty five minutes, three agenda items, one decision. Read the reconciled dashboard. Review the top and bottom three ad creatives by cost per order. Decide whether the current campaign continues into next week, gets a creative pivot, or gets killed. The founder is invited and expected to make the kill decision when the numbers warrant it.
Every Monday review meeting eventually reaches the moment where somebody points at the flat performing creative and asks if the founder wants to give it one more week. The founder always says yes. The creative always underperforms for a second week. Nobody remembers who first suggested the extra week. Somewhere in the archive of every apparel brand shared drive, a flat creative is quietly generating more Monday meetings about itself than actual orders about anything on the site.
The kill rule is simple and it holds across every campaign archetype. Day 3 return on ad spend below 40 percent of target and day 7 return below 60 percent of target triggers a 24 hour creative pivot or a full kill. Programs that hold underperforming campaigns for the full run out of hope produce the flat quarters founders learn to fear. Programs that kill fast and reallocate to the winners produce the compounding quarters that make the retainer worth its rate. Founders new to structured plans assume the kill decision hurts the numbers. In practice, killing a flat creative at week two frees the budget to double down on the winner and grows the campaign result 20 to 45 percent inside the next 21 days on an apparel account.
Where fashion ecommerce marketing fits the wider stack
Fashion ecommerce marketing sits above the tactical channel work and below the annual brand strategy inside the growth stack. Every retainer allocation, every creative brief, and every founder decision on inventory rolls up to the five node plan the pod is running against. Programs that budget for tactics without the plan produce busy months with soft revenue. Programs that build the plan first produce quarters where every product page, every ad, and every email adds up to a single growth arc the founder can defend at a board meeting.
The retainer that runs the plan starts at $599 monthly on a 6 month contract and scales with revenue. The retainer covers merchandising audits, fit content templates, product page image direction, checkout audits, retention flow builds, weekly review meetings, and quarterly server side tracking audits. Founders scoping the wider agency side should also read our apparel fashion marketing hub for the broader deliverable list and pricing tiers by revenue band.
The retainer scales with revenue band, deliverable scope, and the number of active campaigns per quarter. A brand at $80,000 monthly runs a lean retainer with the founder in the review meeting. A brand at $600,000 monthly runs a fuller retainer with a dedicated pod and monthly media mix modeling reads. Every retainer tier ties back to the five node stack the plan requires, and every quarterly review closes the loop between the tactical channel work and the strategic growth arc the founder is defending on the P and L. Two outside reads worth an hour before the first plan cycle kicks off. Meta catalog quality reference above for feed hygiene. The Business of Fashion opinions section for the macro context that shapes which trends deserve budget in a given quarter on the merchandising side.
Product page imagery is where a paid social click either converts or bounces inside eight seconds. The industry median product page ships four images per SKU. The winners ship eight to twelve, and every image answers a specific buyer question the paid ad already primed.
The imagery stack per SKU
A working stack per SKU carries model shot on size medium, model shot on size extra large or size fourteen so the buyer sees the fit at range, flat lay on a neutral ground for the utility view, detail shot on the fabric texture, detail shot on the hardware and stitching, back view on the model, side view on the model, movement clip of 4 to 8 seconds, and a scale shot next to a familiar object for accessories. Programs that publish all twelve image slots grow conversion rate 8 to 22 percent against the four image baseline, and Meta gets richer feed asset variants to test in the ad set.
Video that earns its production cost
Product page video works when it stays under 10 seconds, loops on autoplay, mutes by default, and shows movement the still shot cannot. Longer videos hurt page load and buyer patience without a conversion gain. A DTC apparel brand doing $340,000 monthly should budget $60,000 to $140,000 annually on product page video across the top 40 SKUs by contribution margin. Below that budget, the video shoot day math does not work and the founder ships either thin coverage on all SKUs or full coverage on the wrong ones. Shopify’s product photography guide is a useful outside read for founders scoping a first shoot.
Checkout inside fashion ecommerce marketing
Checkout on apparel carries a size selector as the first field, not the last. Programs that push size selection to a second step lose 4 to 9 percent conversion rate on the same traffic because the mobile buyer scrolls twice for a decision the desktop pattern buries. The mobile buyer decides in under six seconds whether the flow feels safe. Every friction point in that window costs margin.
The checkout structure that respects sizing
The size selector sits directly under the price, above the add to cart button. Sold out sizes stay visible with a strikethrough, not hidden, so the buyer reads the size chart against the availability without a filter reset. A restock notification input replaces the add to cart button on the sold out size. On mobile, the size selector expands into a tap sheet that shows the size chart and fit review pull quotes on the same swipe. That single pattern grows completed checkout rate 6 to 12 percent on apparel accounts we have measured inside 21 days of the deploy.
Shipping and returns copy at the payment step
Shipping thresholds, return windows, and exchange policy live inline at the payment step, not on a footer page. Apparel buyers who read the return policy at cart complete checkout 18 to 30 percent more often than buyers who never see it, and the return rate on those orders drops 2 to 5 percentage points because the buyer bought with the exchange window in mind. Founders who bury return policy on a footer link are trading the transparency dividend for a false conversion gain that costs margin on the back end.
Paid social inside fashion ecommerce marketing
Paid social carries 45 to 60 percent of first order revenue on DTC apparel between $80,000 and $600,000 monthly. Meta and TikTok are the two platforms that fund. Every other platform enters through a 90 day pilot with a hard kill date, not a slow bleed into the always on budget.
Creative velocity as the real budget
Paid social on apparel wins on creative velocity, not media budget. A brand shipping 6 to 12 fresh creative variants weekly across static, Reel, and TikTok formats produces 30 to 60 percent lower cost per order than the same brand shipping 2 to 3 variants weekly on the same media budget. Fashion audiences fatigue creative inside 5 to 9 days on the same face and product angle. The retainer needs to feed that fatigue rate, not fight it, and the creative production line has to run on a weekly cadence with a named producer.
The catalog feed that carries Shopping
Meta Advantage Plus Shopping and TikTok Shop pull directly from the Shopify product feed. Programs that let the feed run on default titles and default images produce 40 to 70 percent higher cost per order than programs that rewrite the top 40 SKU feed titles and swap the primary feed image to the highest performing lifestyle shot. Feed hygiene is the cheapest paid social gain available on an apparel account and the one most founders never open. Meta’s catalog quality reference covers the field level rules that shape delivery.
Retention inside fashion ecommerce marketing
Retention is the layer that decides whether the P and L runs on margin or grinds through paid acquisition to break even. A DTC apparel brand with a 30 percent day 90 repeat rate runs 20 to 35 percent more contribution margin per blended dollar of spend than the same brand at 15 percent. Retention is not one channel. It is a stack of email, SMS, loyalty, and post purchase content on a monthly calendar.
Email and SMS as the core
Email drives 25 to 35 percent of DTC apparel revenue when the flow set is complete. Welcome, browse abandonment, cart abandonment, post purchase, replenishment, VIP, and win back are the seven flows every brand needs live inside the first 90 days. SMS adds another 8 to 15 percent of revenue at a 5 to 12 percent list opt in rate. Klaviyo and Attentive dominate the DTC apparel tool stack because the two platforms handle 90 percent of the flow logic without custom development. Our what is fashion marketing primer covers how the retention layer plugs into the wider channel mix.
Post purchase content that grows LTV
Post purchase content covers the four weeks after delivery on a first order. Styling emails that pair the purchased SKU with three complementary pieces. A fit review request at day seven when the buyer has worn the garment twice. A community moment at day fourteen with user photos of the same SKU. A second order incentive at day 28 with a category adjacent recommendation. Programs that publish the full post purchase sequence grow lifetime value 22 to 45 percent by month twelve on the same first order cohort, and the retention layer starts to carry the revenue growth the paid team used to carry alone.
Benchmarks inside fashion ecommerce marketing
Benchmarks make the plan honest. A DTC apparel brand reads its own numbers against the industry median every quarter and acts on the gaps that show up. Conversion rate. Blended cost per order. Return rate. Repeat purchase rate. Email revenue share. Each has an honest median for the revenue band, and the numbers change slowly year over year.
| Revenue band | Conversion rate | Blended CPO | Return rate (womenswear) | Day 90 repeat rate | Email revenue share |
|---|---|---|---|---|---|
| Under $80K monthly | 1.2% to 1.8% | $38 to $54 | 26% to 34% | 10% to 18% | 18% to 26% |
| $80K to $250K monthly | 1.6% to 2.4% | $28 to $46 | 24% to 32% | 16% to 24% | 22% to 30% |
| $250K to $600K monthly | 2.0% to 2.8% | $22 to $38 | 22% to 30% | 22% to 32% | 26% to 34% |
| $600K to $1.5M monthly | 2.4% to 3.4% | $18 to $32 | 20% to 28% | 28% to 38% | 28% to 36% |
| Above $1.5M monthly | 2.8% to 4.0% | $16 to $28 | 18% to 26% | 32% to 45% | 30% to 38% |
A founder who reads a monthly dashboard against these benchmarks catches the drift inside 30 days and adjusts the plan before the quarter closes. A founder who reads only the paid social dashboard catches the drift 90 days late, which usually means the correction shows up in the next quarter revenue instead of the current one. That single reporting habit is the difference between an apparel plan that grows and an apparel plan that runs in place while the founder wonders what actually changed under the surface. Founders scoping the wider paid team should read our fashion marketing agency guide for the retainer scope that sits above these benchmark reads.
How do you measure fashion ecommerce marketing honestly
Honest measurement of fashion ecommerce marketing runs on four data streams reconciled inside one weekly dashboard. Shopify revenue by UTM and discount code. Google Analytics 4 sessions and assisted conversion. Meta and TikTok ads platform attribution. A post purchase survey on every order that asks where the buyer first saw the brand. Each stream lies on its own.
The single biggest reporting mistake is trusting Meta own return on ad spend number as the campaign result. Meta over reports by 30 to 90 percent on apparel accounts because the pixel double counts view through and click through revenue that would have converted anyway. Google Analytics 4 under reports because the model discounts paid social influence on longer consideration windows. Shopify tells the truth on first order revenue but nothing on assisted revenue. Post purchase surveys catch the audience that saw the campaign on TikTok, searched a week later, and bought through direct traffic. The four streams together reconcile inside a 5 to 8 percent margin on a well tagged apparel account. Google’s attribution model documentation is the source every founder should read before arguing about which number is correct.
Every plan reports campaign level revenue against the campaign level budget with a 7 day and 30 day view. Anything shorter than 7 days is noise on an apparel buying cycle. Anything longer than 30 days is too late to change the current campaign trajectory. The founder reads the dashboard once a week on Monday morning before the review meeting, not once at the end of the quarter when the numbers are already locked into a bad direction.
Fashion ecommerce marketing in production
Boogie Board came to our team with a DTC ecommerce program running the same problem most apparel brands run at $340,000 monthly. Product pages with four images per SKU, no fit content on the size selector, a checkout that pushed size to step two on mobile, cost per acquisition at $150.92 and climbing, and a founder who read the paid social dashboard at face value every Monday. The plan looked busy on paper. The margin math looked thin on the P and L.
Our team rebuilt the ecommerce path around the five node stack. Rewrote the product page template with 8 to 12 images per SKU, garment measurements at the SKU level, and fit review pull quotes below the size selector. Moved size selection to first field at the top of the mobile checkout. Rebuilt the top 40 SKU catalog feed with lifestyle imagery and hand written titles. Turned on the seven core Klaviyo flows and a Attentive SMS list at week three. Server side tracking went in through Elevar in week two. Weekly Monday review meetings replaced the end of month post mortem, with the founder in the room and empowered to kill a campaign at week two.
Twelve months in, blended cost per acquisition dropped to $31. Conversion rate on the paid landing pages climbed 11 percent. Return rate on womenswear dropped from 38 percent to 26 percent. Day 90 repeat purchase rate grew from 22 percent to 41 percent. Managed ad budget grew to $650,000 monthly on the same margin profile. The result did not come from a magic new channel. It came from applying the five node stack, the checkout discipline, and the review cadence the plan required from day one.
The weekly review that keeps the plan honest
The Monday review meeting is where an apparel plan earns the right to keep spending. Forty five minutes, three agenda items, one decision. Read the reconciled dashboard. Review the top and bottom three ad creatives by cost per order. Decide whether the current campaign continues into next week, gets a creative pivot, or gets killed. The founder is invited and expected to make the kill decision when the numbers warrant it.
Every Monday review meeting eventually reaches the moment where somebody points at the flat performing creative and asks if the founder wants to give it one more week. The founder always says yes. The creative always underperforms for a second week. Nobody remembers who first suggested the extra week. Somewhere in the archive of every apparel brand shared drive, a flat creative is quietly generating more Monday meetings about itself than actual orders about anything on the site.
The kill rule is simple and it holds across every campaign archetype. Day 3 return on ad spend below 40 percent of target and day 7 return below 60 percent of target triggers a 24 hour creative pivot or a full kill. Programs that hold underperforming campaigns for the full run out of hope produce the flat quarters founders learn to fear. Programs that kill fast and reallocate to the winners produce the compounding quarters that make the retainer worth its rate. Founders new to structured plans assume the kill decision hurts the numbers. In practice, killing a flat creative at week two frees the budget to double down on the winner and grows the campaign result 20 to 45 percent inside the next 21 days on an apparel account.
Where fashion ecommerce marketing fits the wider stack
Fashion ecommerce marketing sits above the tactical channel work and below the annual brand strategy inside the growth stack. Every retainer allocation, every creative brief, and every founder decision on inventory rolls up to the five node plan the pod is running against. Programs that budget for tactics without the plan produce busy months with soft revenue. Programs that build the plan first produce quarters where every product page, every ad, and every email adds up to a single growth arc the founder can defend at a board meeting.
The retainer that runs the plan starts at $599 monthly on a 6 month contract and scales with revenue. The retainer covers merchandising audits, fit content templates, product page image direction, checkout audits, retention flow builds, weekly review meetings, and quarterly server side tracking audits. Founders scoping the wider agency side should also read our apparel fashion marketing hub for the broader deliverable list and pricing tiers by revenue band.
The retainer scales with revenue band, deliverable scope, and the number of active campaigns per quarter. A brand at $80,000 monthly runs a lean retainer with the founder in the review meeting. A brand at $600,000 monthly runs a fuller retainer with a dedicated pod and monthly media mix modeling reads. Every retainer tier ties back to the five node stack the plan requires, and every quarterly review closes the loop between the tactical channel work and the strategic growth arc the founder is defending on the P and L. Two outside reads worth an hour before the first plan cycle kicks off. Meta catalog quality reference above for feed hygiene. The Business of Fashion opinions section for the macro context that shapes which trends deserve budget in a given quarter on the merchandising side.
Return rate is the single margin killer on DTC apparel. Womenswear runs 22 to 30 percent, menswear 12 to 18 percent, accessories 6 to 10 percent. Two thirds of apparel returns cite fit or size as the reason. Fashion ecommerce marketing that ignores fit content spends the paid social budget twice on every return that goes back into inventory.
The plan builds a fit content stack on every SKU. Model height and size worn in the product description. Garment measurements at the SKU level, not the style level. Fit review notes pulled from customer reviews on a dedicated Fit tab. Size guides at the collection level with the actual measurement method photographed. Programs that publish the full fit stack on every SKU cut return rate 4 to 9 percentage points inside two quarters, which is the biggest margin move available in apparel without a supply chain change.
Where the fit content lives on the page
Fit content lives above the fold on desktop and inside the third scroll on mobile. The size chart lives one tap deep from the size selector, not three clicks deep behind a footer link. Fit review pull quotes live directly below the size selector so the buyer reads what the size chart says and what other buyers actually experienced in the same tap. That single change grows conversion rate 6 to 14 percent on apparel accounts we have tested inside 30 days, and it costs nothing in creative production because the copy already exists in the review corpus.
Fit tech worth funding
True Fit, Fit Analytics, and Bold Metrics carry the automated fit recommendation layer on scaled apparel programs. Each pulls buyer inputs (height, weight, common size in another brand) and recommends a size at add to cart. Return rate drops 3 to 7 percentage points on the SKUs where the tool is live and the buyer engages with the input flow. Below $250,000 monthly, the tool license outruns the return savings. Above $600,000 monthly, the math flips and the tool pays for itself inside a quarter.
Product page imagery inside fashion ecommerce marketing
Product page imagery is where a paid social click either converts or bounces inside eight seconds. The industry median product page ships four images per SKU. The winners ship eight to twelve, and every image answers a specific buyer question the paid ad already primed.
The imagery stack per SKU
A working stack per SKU carries model shot on size medium, model shot on size extra large or size fourteen so the buyer sees the fit at range, flat lay on a neutral ground for the utility view, detail shot on the fabric texture, detail shot on the hardware and stitching, back view on the model, side view on the model, movement clip of 4 to 8 seconds, and a scale shot next to a familiar object for accessories. Programs that publish all twelve image slots grow conversion rate 8 to 22 percent against the four image baseline, and Meta gets richer feed asset variants to test in the ad set.
Video that earns its production cost
Product page video works when it stays under 10 seconds, loops on autoplay, mutes by default, and shows movement the still shot cannot. Longer videos hurt page load and buyer patience without a conversion gain. A DTC apparel brand doing $340,000 monthly should budget $60,000 to $140,000 annually on product page video across the top 40 SKUs by contribution margin. Below that budget, the video shoot day math does not work and the founder ships either thin coverage on all SKUs or full coverage on the wrong ones. Shopify’s product photography guide is a useful outside read for founders scoping a first shoot.
Checkout inside fashion ecommerce marketing
Checkout on apparel carries a size selector as the first field, not the last. Programs that push size selection to a second step lose 4 to 9 percent conversion rate on the same traffic because the mobile buyer scrolls twice for a decision the desktop pattern buries. The mobile buyer decides in under six seconds whether the flow feels safe. Every friction point in that window costs margin.
The checkout structure that respects sizing
The size selector sits directly under the price, above the add to cart button. Sold out sizes stay visible with a strikethrough, not hidden, so the buyer reads the size chart against the availability without a filter reset. A restock notification input replaces the add to cart button on the sold out size. On mobile, the size selector expands into a tap sheet that shows the size chart and fit review pull quotes on the same swipe. That single pattern grows completed checkout rate 6 to 12 percent on apparel accounts we have measured inside 21 days of the deploy.
Shipping and returns copy at the payment step
Shipping thresholds, return windows, and exchange policy live inline at the payment step, not on a footer page. Apparel buyers who read the return policy at cart complete checkout 18 to 30 percent more often than buyers who never see it, and the return rate on those orders drops 2 to 5 percentage points because the buyer bought with the exchange window in mind. Founders who bury return policy on a footer link are trading the transparency dividend for a false conversion gain that costs margin on the back end.
Paid social inside fashion ecommerce marketing
Paid social carries 45 to 60 percent of first order revenue on DTC apparel between $80,000 and $600,000 monthly. Meta and TikTok are the two platforms that fund. Every other platform enters through a 90 day pilot with a hard kill date, not a slow bleed into the always on budget.
Creative velocity as the real budget
Paid social on apparel wins on creative velocity, not media budget. A brand shipping 6 to 12 fresh creative variants weekly across static, Reel, and TikTok formats produces 30 to 60 percent lower cost per order than the same brand shipping 2 to 3 variants weekly on the same media budget. Fashion audiences fatigue creative inside 5 to 9 days on the same face and product angle. The retainer needs to feed that fatigue rate, not fight it, and the creative production line has to run on a weekly cadence with a named producer.
The catalog feed that carries Shopping
Meta Advantage Plus Shopping and TikTok Shop pull directly from the Shopify product feed. Programs that let the feed run on default titles and default images produce 40 to 70 percent higher cost per order than programs that rewrite the top 40 SKU feed titles and swap the primary feed image to the highest performing lifestyle shot. Feed hygiene is the cheapest paid social gain available on an apparel account and the one most founders never open. Meta’s catalog quality reference covers the field level rules that shape delivery.
Retention inside fashion ecommerce marketing
Retention is the layer that decides whether the P and L runs on margin or grinds through paid acquisition to break even. A DTC apparel brand with a 30 percent day 90 repeat rate runs 20 to 35 percent more contribution margin per blended dollar of spend than the same brand at 15 percent. Retention is not one channel. It is a stack of email, SMS, loyalty, and post purchase content on a monthly calendar.
Email and SMS as the core
Email drives 25 to 35 percent of DTC apparel revenue when the flow set is complete. Welcome, browse abandonment, cart abandonment, post purchase, replenishment, VIP, and win back are the seven flows every brand needs live inside the first 90 days. SMS adds another 8 to 15 percent of revenue at a 5 to 12 percent list opt in rate. Klaviyo and Attentive dominate the DTC apparel tool stack because the two platforms handle 90 percent of the flow logic without custom development. Our what is fashion marketing primer covers how the retention layer plugs into the wider channel mix.
Post purchase content that grows LTV
Post purchase content covers the four weeks after delivery on a first order. Styling emails that pair the purchased SKU with three complementary pieces. A fit review request at day seven when the buyer has worn the garment twice. A community moment at day fourteen with user photos of the same SKU. A second order incentive at day 28 with a category adjacent recommendation. Programs that publish the full post purchase sequence grow lifetime value 22 to 45 percent by month twelve on the same first order cohort, and the retention layer starts to carry the revenue growth the paid team used to carry alone.
Benchmarks inside fashion ecommerce marketing
Benchmarks make the plan honest. A DTC apparel brand reads its own numbers against the industry median every quarter and acts on the gaps that show up. Conversion rate. Blended cost per order. Return rate. Repeat purchase rate. Email revenue share. Each has an honest median for the revenue band, and the numbers change slowly year over year.
| Revenue band | Conversion rate | Blended CPO | Return rate (womenswear) | Day 90 repeat rate | Email revenue share |
|---|---|---|---|---|---|
| Under $80K monthly | 1.2% to 1.8% | $38 to $54 | 26% to 34% | 10% to 18% | 18% to 26% |
| $80K to $250K monthly | 1.6% to 2.4% | $28 to $46 | 24% to 32% | 16% to 24% | 22% to 30% |
| $250K to $600K monthly | 2.0% to 2.8% | $22 to $38 | 22% to 30% | 22% to 32% | 26% to 34% |
| $600K to $1.5M monthly | 2.4% to 3.4% | $18 to $32 | 20% to 28% | 28% to 38% | 28% to 36% |
| Above $1.5M monthly | 2.8% to 4.0% | $16 to $28 | 18% to 26% | 32% to 45% | 30% to 38% |
A founder who reads a monthly dashboard against these benchmarks catches the drift inside 30 days and adjusts the plan before the quarter closes. A founder who reads only the paid social dashboard catches the drift 90 days late, which usually means the correction shows up in the next quarter revenue instead of the current one. That single reporting habit is the difference between an apparel plan that grows and an apparel plan that runs in place while the founder wonders what actually changed under the surface. Founders scoping the wider paid team should read our fashion marketing agency guide for the retainer scope that sits above these benchmark reads.
How do you measure fashion ecommerce marketing honestly
Honest measurement of fashion ecommerce marketing runs on four data streams reconciled inside one weekly dashboard. Shopify revenue by UTM and discount code. Google Analytics 4 sessions and assisted conversion. Meta and TikTok ads platform attribution. A post purchase survey on every order that asks where the buyer first saw the brand. Each stream lies on its own.
The single biggest reporting mistake is trusting Meta own return on ad spend number as the campaign result. Meta over reports by 30 to 90 percent on apparel accounts because the pixel double counts view through and click through revenue that would have converted anyway. Google Analytics 4 under reports because the model discounts paid social influence on longer consideration windows. Shopify tells the truth on first order revenue but nothing on assisted revenue. Post purchase surveys catch the audience that saw the campaign on TikTok, searched a week later, and bought through direct traffic. The four streams together reconcile inside a 5 to 8 percent margin on a well tagged apparel account. Google’s attribution model documentation is the source every founder should read before arguing about which number is correct.
Every plan reports campaign level revenue against the campaign level budget with a 7 day and 30 day view. Anything shorter than 7 days is noise on an apparel buying cycle. Anything longer than 30 days is too late to change the current campaign trajectory. The founder reads the dashboard once a week on Monday morning before the review meeting, not once at the end of the quarter when the numbers are already locked into a bad direction.
Fashion ecommerce marketing in production
Boogie Board came to our team with a DTC ecommerce program running the same problem most apparel brands run at $340,000 monthly. Product pages with four images per SKU, no fit content on the size selector, a checkout that pushed size to step two on mobile, cost per acquisition at $150.92 and climbing, and a founder who read the paid social dashboard at face value every Monday. The plan looked busy on paper. The margin math looked thin on the P and L.
Our team rebuilt the ecommerce path around the five node stack. Rewrote the product page template with 8 to 12 images per SKU, garment measurements at the SKU level, and fit review pull quotes below the size selector. Moved size selection to first field at the top of the mobile checkout. Rebuilt the top 40 SKU catalog feed with lifestyle imagery and hand written titles. Turned on the seven core Klaviyo flows and a Attentive SMS list at week three. Server side tracking went in through Elevar in week two. Weekly Monday review meetings replaced the end of month post mortem, with the founder in the room and empowered to kill a campaign at week two.
Twelve months in, blended cost per acquisition dropped to $31. Conversion rate on the paid landing pages climbed 11 percent. Return rate on womenswear dropped from 38 percent to 26 percent. Day 90 repeat purchase rate grew from 22 percent to 41 percent. Managed ad budget grew to $650,000 monthly on the same margin profile. The result did not come from a magic new channel. It came from applying the five node stack, the checkout discipline, and the review cadence the plan required from day one.
The weekly review that keeps the plan honest
The Monday review meeting is where an apparel plan earns the right to keep spending. Forty five minutes, three agenda items, one decision. Read the reconciled dashboard. Review the top and bottom three ad creatives by cost per order. Decide whether the current campaign continues into next week, gets a creative pivot, or gets killed. The founder is invited and expected to make the kill decision when the numbers warrant it.
Every Monday review meeting eventually reaches the moment where somebody points at the flat performing creative and asks if the founder wants to give it one more week. The founder always says yes. The creative always underperforms for a second week. Nobody remembers who first suggested the extra week. Somewhere in the archive of every apparel brand shared drive, a flat creative is quietly generating more Monday meetings about itself than actual orders about anything on the site.
The kill rule is simple and it holds across every campaign archetype. Day 3 return on ad spend below 40 percent of target and day 7 return below 60 percent of target triggers a 24 hour creative pivot or a full kill. Programs that hold underperforming campaigns for the full run out of hope produce the flat quarters founders learn to fear. Programs that kill fast and reallocate to the winners produce the compounding quarters that make the retainer worth its rate. Founders new to structured plans assume the kill decision hurts the numbers. In practice, killing a flat creative at week two frees the budget to double down on the winner and grows the campaign result 20 to 45 percent inside the next 21 days on an apparel account.
Where fashion ecommerce marketing fits the wider stack
Fashion ecommerce marketing sits above the tactical channel work and below the annual brand strategy inside the growth stack. Every retainer allocation, every creative brief, and every founder decision on inventory rolls up to the five node plan the pod is running against. Programs that budget for tactics without the plan produce busy months with soft revenue. Programs that build the plan first produce quarters where every product page, every ad, and every email adds up to a single growth arc the founder can defend at a board meeting.
The retainer that runs the plan starts at $599 monthly on a 6 month contract and scales with revenue. The retainer covers merchandising audits, fit content templates, product page image direction, checkout audits, retention flow builds, weekly review meetings, and quarterly server side tracking audits. Founders scoping the wider agency side should also read our apparel fashion marketing hub for the broader deliverable list and pricing tiers by revenue band.
The retainer scales with revenue band, deliverable scope, and the number of active campaigns per quarter. A brand at $80,000 monthly runs a lean retainer with the founder in the review meeting. A brand at $600,000 monthly runs a fuller retainer with a dedicated pod and monthly media mix modeling reads. Every retainer tier ties back to the five node stack the plan requires, and every quarterly review closes the loop between the tactical channel work and the strategic growth arc the founder is defending on the P and L. Two outside reads worth an hour before the first plan cycle kicks off. Meta catalog quality reference above for feed hygiene. The Business of Fashion opinions section for the macro context that shapes which trends deserve budget in a given quarter on the merchandising side.
Benchmarks make the plan honest. A DTC apparel brand reads its own numbers against the industry median every quarter and acts on the gaps that show up. Conversion rate. Blended cost per order. Return rate. Repeat purchase rate. Email revenue share. Each has an honest median for the revenue band, and the numbers change slowly year over year.
| Revenue band | Conversion rate | Blended CPO | Return rate (womenswear) | Day 90 repeat rate | Email revenue share |
|---|---|---|---|---|---|
| Under $80K monthly | 1.2% to 1.8% | $38 to $54 | 26% to 34% | 10% to 18% | 18% to 26% |
| $80K to $250K monthly | 1.6% to 2.4% | $28 to $46 | 24% to 32% | 16% to 24% | 22% to 30% |
| $250K to $600K monthly | 2.0% to 2.8% | $22 to $38 | 22% to 30% | 22% to 32% | 26% to 34% |
| $600K to $1.5M monthly | 2.4% to 3.4% | $18 to $32 | 20% to 28% | 28% to 38% | 28% to 36% |
| Above $1.5M monthly | 2.8% to 4.0% | $16 to $28 | 18% to 26% | 32% to 45% | 30% to 38% |
A founder who reads a monthly dashboard against these benchmarks catches the drift inside 30 days and adjusts the plan before the quarter closes. A founder who reads only the paid social dashboard catches the drift 90 days late, which usually means the correction shows up in the next quarter revenue instead of the current one. That single reporting habit is the difference between an apparel plan that grows and an apparel plan that runs in place while the founder wonders what actually changed under the surface. Founders scoping the wider paid team should read our fashion marketing agency guide for the retainer scope that sits above these benchmark reads.
How do you measure fashion ecommerce marketing honestly
Honest measurement of fashion ecommerce marketing runs on four data streams reconciled inside one weekly dashboard. Shopify revenue by UTM and discount code. Google Analytics 4 sessions and assisted conversion. Meta and TikTok ads platform attribution. A post purchase survey on every order that asks where the buyer first saw the brand. Each stream lies on its own.
The single biggest reporting mistake is trusting Meta own return on ad spend number as the campaign result. Meta over reports by 30 to 90 percent on apparel accounts because the pixel double counts view through and click through revenue that would have converted anyway. Google Analytics 4 under reports because the model discounts paid social influence on longer consideration windows. Shopify tells the truth on first order revenue but nothing on assisted revenue. Post purchase surveys catch the audience that saw the campaign on TikTok, searched a week later, and bought through direct traffic. The four streams together reconcile inside a 5 to 8 percent margin on a well tagged apparel account. Google’s attribution model documentation is the source every founder should read before arguing about which number is correct.
Every plan reports campaign level revenue against the campaign level budget with a 7 day and 30 day view. Anything shorter than 7 days is noise on an apparel buying cycle. Anything longer than 30 days is too late to change the current campaign trajectory. The founder reads the dashboard once a week on Monday morning before the review meeting, not once at the end of the quarter when the numbers are already locked into a bad direction.
Fashion ecommerce marketing in production
Boogie Board came to our team with a DTC ecommerce program running the same problem most apparel brands run at $340,000 monthly. Product pages with four images per SKU, no fit content on the size selector, a checkout that pushed size to step two on mobile, cost per acquisition at $150.92 and climbing, and a founder who read the paid social dashboard at face value every Monday. The plan looked busy on paper. The margin math looked thin on the P and L.
Our team rebuilt the ecommerce path around the five node stack. Rewrote the product page template with 8 to 12 images per SKU, garment measurements at the SKU level, and fit review pull quotes below the size selector. Moved size selection to first field at the top of the mobile checkout. Rebuilt the top 40 SKU catalog feed with lifestyle imagery and hand written titles. Turned on the seven core Klaviyo flows and a Attentive SMS list at week three. Server side tracking went in through Elevar in week two. Weekly Monday review meetings replaced the end of month post mortem, with the founder in the room and empowered to kill a campaign at week two.
Twelve months in, blended cost per acquisition dropped to $31. Conversion rate on the paid landing pages climbed 11 percent. Return rate on womenswear dropped from 38 percent to 26 percent. Day 90 repeat purchase rate grew from 22 percent to 41 percent. Managed ad budget grew to $650,000 monthly on the same margin profile. The result did not come from a magic new channel. It came from applying the five node stack, the checkout discipline, and the review cadence the plan required from day one.
The weekly review that keeps the plan honest
The Monday review meeting is where an apparel plan earns the right to keep spending. Forty five minutes, three agenda items, one decision. Read the reconciled dashboard. Review the top and bottom three ad creatives by cost per order. Decide whether the current campaign continues into next week, gets a creative pivot, or gets killed. The founder is invited and expected to make the kill decision when the numbers warrant it.
Every Monday review meeting eventually reaches the moment where somebody points at the flat performing creative and asks if the founder wants to give it one more week. The founder always says yes. The creative always underperforms for a second week. Nobody remembers who first suggested the extra week. Somewhere in the archive of every apparel brand shared drive, a flat creative is quietly generating more Monday meetings about itself than actual orders about anything on the site.
The kill rule is simple and it holds across every campaign archetype. Day 3 return on ad spend below 40 percent of target and day 7 return below 60 percent of target triggers a 24 hour creative pivot or a full kill. Programs that hold underperforming campaigns for the full run out of hope produce the flat quarters founders learn to fear. Programs that kill fast and reallocate to the winners produce the compounding quarters that make the retainer worth its rate. Founders new to structured plans assume the kill decision hurts the numbers. In practice, killing a flat creative at week two frees the budget to double down on the winner and grows the campaign result 20 to 45 percent inside the next 21 days on an apparel account.
Where fashion ecommerce marketing fits the wider stack
Fashion ecommerce marketing sits above the tactical channel work and below the annual brand strategy inside the growth stack. Every retainer allocation, every creative brief, and every founder decision on inventory rolls up to the five node plan the pod is running against. Programs that budget for tactics without the plan produce busy months with soft revenue. Programs that build the plan first produce quarters where every product page, every ad, and every email adds up to a single growth arc the founder can defend at a board meeting.
The retainer that runs the plan starts at $599 monthly on a 6 month contract and scales with revenue. The retainer covers merchandising audits, fit content templates, product page image direction, checkout audits, retention flow builds, weekly review meetings, and quarterly server side tracking audits. Founders scoping the wider agency side should also read our apparel fashion marketing hub for the broader deliverable list and pricing tiers by revenue band.
The retainer scales with revenue band, deliverable scope, and the number of active campaigns per quarter. A brand at $80,000 monthly runs a lean retainer with the founder in the review meeting. A brand at $600,000 monthly runs a fuller retainer with a dedicated pod and monthly media mix modeling reads. Every retainer tier ties back to the five node stack the plan requires, and every quarterly review closes the loop between the tactical channel work and the strategic growth arc the founder is defending on the P and L. Two outside reads worth an hour before the first plan cycle kicks off. Meta catalog quality reference above for feed hygiene. The Business of Fashion opinions section for the macro context that shapes which trends deserve budget in a given quarter on the merchandising side.
Paid social carries 45 to 60 percent of first order revenue on DTC apparel between $80,000 and $600,000 monthly. Meta and TikTok are the two platforms that fund. Every other platform enters through a 90 day pilot with a hard kill date, not a slow bleed into the always on budget.
Creative velocity as the real budget
Paid social on apparel wins on creative velocity, not media budget. A brand shipping 6 to 12 fresh creative variants weekly across static, Reel, and TikTok formats produces 30 to 60 percent lower cost per order than the same brand shipping 2 to 3 variants weekly on the same media budget. Fashion audiences fatigue creative inside 5 to 9 days on the same face and product angle. The retainer needs to feed that fatigue rate, not fight it, and the creative production line has to run on a weekly cadence with a named producer.
The catalog feed that carries Shopping
Meta Advantage Plus Shopping and TikTok Shop pull directly from the Shopify product feed. Programs that let the feed run on default titles and default images produce 40 to 70 percent higher cost per order than programs that rewrite the top 40 SKU feed titles and swap the primary feed image to the highest performing lifestyle shot. Feed hygiene is the cheapest paid social gain available on an apparel account and the one most founders never open. Meta’s catalog quality reference covers the field level rules that shape delivery.
Retention inside fashion ecommerce marketing
Retention is the layer that decides whether the P and L runs on margin or grinds through paid acquisition to break even. A DTC apparel brand with a 30 percent day 90 repeat rate runs 20 to 35 percent more contribution margin per blended dollar of spend than the same brand at 15 percent. Retention is not one channel. It is a stack of email, SMS, loyalty, and post purchase content on a monthly calendar.
Email and SMS as the core
Email drives 25 to 35 percent of DTC apparel revenue when the flow set is complete. Welcome, browse abandonment, cart abandonment, post purchase, replenishment, VIP, and win back are the seven flows every brand needs live inside the first 90 days. SMS adds another 8 to 15 percent of revenue at a 5 to 12 percent list opt in rate. Klaviyo and Attentive dominate the DTC apparel tool stack because the two platforms handle 90 percent of the flow logic without custom development. Our what is fashion marketing primer covers how the retention layer plugs into the wider channel mix.
Post purchase content that grows LTV
Post purchase content covers the four weeks after delivery on a first order. Styling emails that pair the purchased SKU with three complementary pieces. A fit review request at day seven when the buyer has worn the garment twice. A community moment at day fourteen with user photos of the same SKU. A second order incentive at day 28 with a category adjacent recommendation. Programs that publish the full post purchase sequence grow lifetime value 22 to 45 percent by month twelve on the same first order cohort, and the retention layer starts to carry the revenue growth the paid team used to carry alone.
Benchmarks inside fashion ecommerce marketing
Benchmarks make the plan honest. A DTC apparel brand reads its own numbers against the industry median every quarter and acts on the gaps that show up. Conversion rate. Blended cost per order. Return rate. Repeat purchase rate. Email revenue share. Each has an honest median for the revenue band, and the numbers change slowly year over year.
| Revenue band | Conversion rate | Blended CPO | Return rate (womenswear) | Day 90 repeat rate | Email revenue share |
|---|---|---|---|---|---|
| Under $80K monthly | 1.2% to 1.8% | $38 to $54 | 26% to 34% | 10% to 18% | 18% to 26% |
| $80K to $250K monthly | 1.6% to 2.4% | $28 to $46 | 24% to 32% | 16% to 24% | 22% to 30% |
| $250K to $600K monthly | 2.0% to 2.8% | $22 to $38 | 22% to 30% | 22% to 32% | 26% to 34% |
| $600K to $1.5M monthly | 2.4% to 3.4% | $18 to $32 | 20% to 28% | 28% to 38% | 28% to 36% |
| Above $1.5M monthly | 2.8% to 4.0% | $16 to $28 | 18% to 26% | 32% to 45% | 30% to 38% |
A founder who reads a monthly dashboard against these benchmarks catches the drift inside 30 days and adjusts the plan before the quarter closes. A founder who reads only the paid social dashboard catches the drift 90 days late, which usually means the correction shows up in the next quarter revenue instead of the current one. That single reporting habit is the difference between an apparel plan that grows and an apparel plan that runs in place while the founder wonders what actually changed under the surface. Founders scoping the wider paid team should read our fashion marketing agency guide for the retainer scope that sits above these benchmark reads.
How do you measure fashion ecommerce marketing honestly
Honest measurement of fashion ecommerce marketing runs on four data streams reconciled inside one weekly dashboard. Shopify revenue by UTM and discount code. Google Analytics 4 sessions and assisted conversion. Meta and TikTok ads platform attribution. A post purchase survey on every order that asks where the buyer first saw the brand. Each stream lies on its own.
The single biggest reporting mistake is trusting Meta own return on ad spend number as the campaign result. Meta over reports by 30 to 90 percent on apparel accounts because the pixel double counts view through and click through revenue that would have converted anyway. Google Analytics 4 under reports because the model discounts paid social influence on longer consideration windows. Shopify tells the truth on first order revenue but nothing on assisted revenue. Post purchase surveys catch the audience that saw the campaign on TikTok, searched a week later, and bought through direct traffic. The four streams together reconcile inside a 5 to 8 percent margin on a well tagged apparel account. Google’s attribution model documentation is the source every founder should read before arguing about which number is correct.
Every plan reports campaign level revenue against the campaign level budget with a 7 day and 30 day view. Anything shorter than 7 days is noise on an apparel buying cycle. Anything longer than 30 days is too late to change the current campaign trajectory. The founder reads the dashboard once a week on Monday morning before the review meeting, not once at the end of the quarter when the numbers are already locked into a bad direction.
Fashion ecommerce marketing in production
Boogie Board came to our team with a DTC ecommerce program running the same problem most apparel brands run at $340,000 monthly. Product pages with four images per SKU, no fit content on the size selector, a checkout that pushed size to step two on mobile, cost per acquisition at $150.92 and climbing, and a founder who read the paid social dashboard at face value every Monday. The plan looked busy on paper. The margin math looked thin on the P and L.
Our team rebuilt the ecommerce path around the five node stack. Rewrote the product page template with 8 to 12 images per SKU, garment measurements at the SKU level, and fit review pull quotes below the size selector. Moved size selection to first field at the top of the mobile checkout. Rebuilt the top 40 SKU catalog feed with lifestyle imagery and hand written titles. Turned on the seven core Klaviyo flows and a Attentive SMS list at week three. Server side tracking went in through Elevar in week two. Weekly Monday review meetings replaced the end of month post mortem, with the founder in the room and empowered to kill a campaign at week two.
Twelve months in, blended cost per acquisition dropped to $31. Conversion rate on the paid landing pages climbed 11 percent. Return rate on womenswear dropped from 38 percent to 26 percent. Day 90 repeat purchase rate grew from 22 percent to 41 percent. Managed ad budget grew to $650,000 monthly on the same margin profile. The result did not come from a magic new channel. It came from applying the five node stack, the checkout discipline, and the review cadence the plan required from day one.
The weekly review that keeps the plan honest
The Monday review meeting is where an apparel plan earns the right to keep spending. Forty five minutes, three agenda items, one decision. Read the reconciled dashboard. Review the top and bottom three ad creatives by cost per order. Decide whether the current campaign continues into next week, gets a creative pivot, or gets killed. The founder is invited and expected to make the kill decision when the numbers warrant it.
Every Monday review meeting eventually reaches the moment where somebody points at the flat performing creative and asks if the founder wants to give it one more week. The founder always says yes. The creative always underperforms for a second week. Nobody remembers who first suggested the extra week. Somewhere in the archive of every apparel brand shared drive, a flat creative is quietly generating more Monday meetings about itself than actual orders about anything on the site.
The kill rule is simple and it holds across every campaign archetype. Day 3 return on ad spend below 40 percent of target and day 7 return below 60 percent of target triggers a 24 hour creative pivot or a full kill. Programs that hold underperforming campaigns for the full run out of hope produce the flat quarters founders learn to fear. Programs that kill fast and reallocate to the winners produce the compounding quarters that make the retainer worth its rate. Founders new to structured plans assume the kill decision hurts the numbers. In practice, killing a flat creative at week two frees the budget to double down on the winner and grows the campaign result 20 to 45 percent inside the next 21 days on an apparel account.
Where fashion ecommerce marketing fits the wider stack
Fashion ecommerce marketing sits above the tactical channel work and below the annual brand strategy inside the growth stack. Every retainer allocation, every creative brief, and every founder decision on inventory rolls up to the five node plan the pod is running against. Programs that budget for tactics without the plan produce busy months with soft revenue. Programs that build the plan first produce quarters where every product page, every ad, and every email adds up to a single growth arc the founder can defend at a board meeting.
The retainer that runs the plan starts at $599 monthly on a 6 month contract and scales with revenue. The retainer covers merchandising audits, fit content templates, product page image direction, checkout audits, retention flow builds, weekly review meetings, and quarterly server side tracking audits. Founders scoping the wider agency side should also read our apparel fashion marketing hub for the broader deliverable list and pricing tiers by revenue band.
The retainer scales with revenue band, deliverable scope, and the number of active campaigns per quarter. A brand at $80,000 monthly runs a lean retainer with the founder in the review meeting. A brand at $600,000 monthly runs a fuller retainer with a dedicated pod and monthly media mix modeling reads. Every retainer tier ties back to the five node stack the plan requires, and every quarterly review closes the loop between the tactical channel work and the strategic growth arc the founder is defending on the P and L. Two outside reads worth an hour before the first plan cycle kicks off. Meta catalog quality reference above for feed hygiene. The Business of Fashion opinions section for the macro context that shapes which trends deserve budget in a given quarter on the merchandising side.
Checkout on apparel carries a size selector as the first field, not the last. Programs that push size selection to a second step lose 4 to 9 percent conversion rate on the same traffic because the mobile buyer scrolls twice for a decision the desktop pattern buries. The mobile buyer decides in under six seconds whether the flow feels safe. Every friction point in that window costs margin.
The checkout structure that respects sizing
The size selector sits directly under the price, above the add to cart button. Sold out sizes stay visible with a strikethrough, not hidden, so the buyer reads the size chart against the availability without a filter reset. A restock notification input replaces the add to cart button on the sold out size. On mobile, the size selector expands into a tap sheet that shows the size chart and fit review pull quotes on the same swipe. That single pattern grows completed checkout rate 6 to 12 percent on apparel accounts we have measured inside 21 days of the deploy.
Shipping and returns copy at the payment step
Shipping thresholds, return windows, and exchange policy live inline at the payment step, not on a footer page. Apparel buyers who read the return policy at cart complete checkout 18 to 30 percent more often than buyers who never see it, and the return rate on those orders drops 2 to 5 percentage points because the buyer bought with the exchange window in mind. Founders who bury return policy on a footer link are trading the transparency dividend for a false conversion gain that costs margin on the back end.
Paid social inside fashion ecommerce marketing
Paid social carries 45 to 60 percent of first order revenue on DTC apparel between $80,000 and $600,000 monthly. Meta and TikTok are the two platforms that fund. Every other platform enters through a 90 day pilot with a hard kill date, not a slow bleed into the always on budget.
Creative velocity as the real budget
Paid social on apparel wins on creative velocity, not media budget. A brand shipping 6 to 12 fresh creative variants weekly across static, Reel, and TikTok formats produces 30 to 60 percent lower cost per order than the same brand shipping 2 to 3 variants weekly on the same media budget. Fashion audiences fatigue creative inside 5 to 9 days on the same face and product angle. The retainer needs to feed that fatigue rate, not fight it, and the creative production line has to run on a weekly cadence with a named producer.
The catalog feed that carries Shopping
Meta Advantage Plus Shopping and TikTok Shop pull directly from the Shopify product feed. Programs that let the feed run on default titles and default images produce 40 to 70 percent higher cost per order than programs that rewrite the top 40 SKU feed titles and swap the primary feed image to the highest performing lifestyle shot. Feed hygiene is the cheapest paid social gain available on an apparel account and the one most founders never open. Meta’s catalog quality reference covers the field level rules that shape delivery.
Retention inside fashion ecommerce marketing
Retention is the layer that decides whether the P and L runs on margin or grinds through paid acquisition to break even. A DTC apparel brand with a 30 percent day 90 repeat rate runs 20 to 35 percent more contribution margin per blended dollar of spend than the same brand at 15 percent. Retention is not one channel. It is a stack of email, SMS, loyalty, and post purchase content on a monthly calendar.
Email and SMS as the core
Email drives 25 to 35 percent of DTC apparel revenue when the flow set is complete. Welcome, browse abandonment, cart abandonment, post purchase, replenishment, VIP, and win back are the seven flows every brand needs live inside the first 90 days. SMS adds another 8 to 15 percent of revenue at a 5 to 12 percent list opt in rate. Klaviyo and Attentive dominate the DTC apparel tool stack because the two platforms handle 90 percent of the flow logic without custom development. Our what is fashion marketing primer covers how the retention layer plugs into the wider channel mix.
Post purchase content that grows LTV
Post purchase content covers the four weeks after delivery on a first order. Styling emails that pair the purchased SKU with three complementary pieces. A fit review request at day seven when the buyer has worn the garment twice. A community moment at day fourteen with user photos of the same SKU. A second order incentive at day 28 with a category adjacent recommendation. Programs that publish the full post purchase sequence grow lifetime value 22 to 45 percent by month twelve on the same first order cohort, and the retention layer starts to carry the revenue growth the paid team used to carry alone.
Benchmarks inside fashion ecommerce marketing
Benchmarks make the plan honest. A DTC apparel brand reads its own numbers against the industry median every quarter and acts on the gaps that show up. Conversion rate. Blended cost per order. Return rate. Repeat purchase rate. Email revenue share. Each has an honest median for the revenue band, and the numbers change slowly year over year.
| Revenue band | Conversion rate | Blended CPO | Return rate (womenswear) | Day 90 repeat rate | Email revenue share |
|---|---|---|---|---|---|
| Under $80K monthly | 1.2% to 1.8% | $38 to $54 | 26% to 34% | 10% to 18% | 18% to 26% |
| $80K to $250K monthly | 1.6% to 2.4% | $28 to $46 | 24% to 32% | 16% to 24% | 22% to 30% |
| $250K to $600K monthly | 2.0% to 2.8% | $22 to $38 | 22% to 30% | 22% to 32% | 26% to 34% |
| $600K to $1.5M monthly | 2.4% to 3.4% | $18 to $32 | 20% to 28% | 28% to 38% | 28% to 36% |
| Above $1.5M monthly | 2.8% to 4.0% | $16 to $28 | 18% to 26% | 32% to 45% | 30% to 38% |
A founder who reads a monthly dashboard against these benchmarks catches the drift inside 30 days and adjusts the plan before the quarter closes. A founder who reads only the paid social dashboard catches the drift 90 days late, which usually means the correction shows up in the next quarter revenue instead of the current one. That single reporting habit is the difference between an apparel plan that grows and an apparel plan that runs in place while the founder wonders what actually changed under the surface. Founders scoping the wider paid team should read our fashion marketing agency guide for the retainer scope that sits above these benchmark reads.
How do you measure fashion ecommerce marketing honestly
Honest measurement of fashion ecommerce marketing runs on four data streams reconciled inside one weekly dashboard. Shopify revenue by UTM and discount code. Google Analytics 4 sessions and assisted conversion. Meta and TikTok ads platform attribution. A post purchase survey on every order that asks where the buyer first saw the brand. Each stream lies on its own.
The single biggest reporting mistake is trusting Meta own return on ad spend number as the campaign result. Meta over reports by 30 to 90 percent on apparel accounts because the pixel double counts view through and click through revenue that would have converted anyway. Google Analytics 4 under reports because the model discounts paid social influence on longer consideration windows. Shopify tells the truth on first order revenue but nothing on assisted revenue. Post purchase surveys catch the audience that saw the campaign on TikTok, searched a week later, and bought through direct traffic. The four streams together reconcile inside a 5 to 8 percent margin on a well tagged apparel account. Google’s attribution model documentation is the source every founder should read before arguing about which number is correct.
Every plan reports campaign level revenue against the campaign level budget with a 7 day and 30 day view. Anything shorter than 7 days is noise on an apparel buying cycle. Anything longer than 30 days is too late to change the current campaign trajectory. The founder reads the dashboard once a week on Monday morning before the review meeting, not once at the end of the quarter when the numbers are already locked into a bad direction.
Fashion ecommerce marketing in production
Boogie Board came to our team with a DTC ecommerce program running the same problem most apparel brands run at $340,000 monthly. Product pages with four images per SKU, no fit content on the size selector, a checkout that pushed size to step two on mobile, cost per acquisition at $150.92 and climbing, and a founder who read the paid social dashboard at face value every Monday. The plan looked busy on paper. The margin math looked thin on the P and L.
Our team rebuilt the ecommerce path around the five node stack. Rewrote the product page template with 8 to 12 images per SKU, garment measurements at the SKU level, and fit review pull quotes below the size selector. Moved size selection to first field at the top of the mobile checkout. Rebuilt the top 40 SKU catalog feed with lifestyle imagery and hand written titles. Turned on the seven core Klaviyo flows and a Attentive SMS list at week three. Server side tracking went in through Elevar in week two. Weekly Monday review meetings replaced the end of month post mortem, with the founder in the room and empowered to kill a campaign at week two.
Twelve months in, blended cost per acquisition dropped to $31. Conversion rate on the paid landing pages climbed 11 percent. Return rate on womenswear dropped from 38 percent to 26 percent. Day 90 repeat purchase rate grew from 22 percent to 41 percent. Managed ad budget grew to $650,000 monthly on the same margin profile. The result did not come from a magic new channel. It came from applying the five node stack, the checkout discipline, and the review cadence the plan required from day one.
The weekly review that keeps the plan honest
The Monday review meeting is where an apparel plan earns the right to keep spending. Forty five minutes, three agenda items, one decision. Read the reconciled dashboard. Review the top and bottom three ad creatives by cost per order. Decide whether the current campaign continues into next week, gets a creative pivot, or gets killed. The founder is invited and expected to make the kill decision when the numbers warrant it.
Every Monday review meeting eventually reaches the moment where somebody points at the flat performing creative and asks if the founder wants to give it one more week. The founder always says yes. The creative always underperforms for a second week. Nobody remembers who first suggested the extra week. Somewhere in the archive of every apparel brand shared drive, a flat creative is quietly generating more Monday meetings about itself than actual orders about anything on the site.
The kill rule is simple and it holds across every campaign archetype. Day 3 return on ad spend below 40 percent of target and day 7 return below 60 percent of target triggers a 24 hour creative pivot or a full kill. Programs that hold underperforming campaigns for the full run out of hope produce the flat quarters founders learn to fear. Programs that kill fast and reallocate to the winners produce the compounding quarters that make the retainer worth its rate. Founders new to structured plans assume the kill decision hurts the numbers. In practice, killing a flat creative at week two frees the budget to double down on the winner and grows the campaign result 20 to 45 percent inside the next 21 days on an apparel account.
Where fashion ecommerce marketing fits the wider stack
Fashion ecommerce marketing sits above the tactical channel work and below the annual brand strategy inside the growth stack. Every retainer allocation, every creative brief, and every founder decision on inventory rolls up to the five node plan the pod is running against. Programs that budget for tactics without the plan produce busy months with soft revenue. Programs that build the plan first produce quarters where every product page, every ad, and every email adds up to a single growth arc the founder can defend at a board meeting.
The retainer that runs the plan starts at $599 monthly on a 6 month contract and scales with revenue. The retainer covers merchandising audits, fit content templates, product page image direction, checkout audits, retention flow builds, weekly review meetings, and quarterly server side tracking audits. Founders scoping the wider agency side should also read our apparel fashion marketing hub for the broader deliverable list and pricing tiers by revenue band.
The retainer scales with revenue band, deliverable scope, and the number of active campaigns per quarter. A brand at $80,000 monthly runs a lean retainer with the founder in the review meeting. A brand at $600,000 monthly runs a fuller retainer with a dedicated pod and monthly media mix modeling reads. Every retainer tier ties back to the five node stack the plan requires, and every quarterly review closes the loop between the tactical channel work and the strategic growth arc the founder is defending on the P and L. Two outside reads worth an hour before the first plan cycle kicks off. Meta catalog quality reference above for feed hygiene. The Business of Fashion opinions section for the macro context that shapes which trends deserve budget in a given quarter on the merchandising side.
Product page imagery is where a paid social click either converts or bounces inside eight seconds. The industry median product page ships four images per SKU. The winners ship eight to twelve, and every image answers a specific buyer question the paid ad already primed.
The imagery stack per SKU
A working stack per SKU carries model shot on size medium, model shot on size extra large or size fourteen so the buyer sees the fit at range, flat lay on a neutral ground for the utility view, detail shot on the fabric texture, detail shot on the hardware and stitching, back view on the model, side view on the model, movement clip of 4 to 8 seconds, and a scale shot next to a familiar object for accessories. Programs that publish all twelve image slots grow conversion rate 8 to 22 percent against the four image baseline, and Meta gets richer feed asset variants to test in the ad set.
Video that earns its production cost
Product page video works when it stays under 10 seconds, loops on autoplay, mutes by default, and shows movement the still shot cannot. Longer videos hurt page load and buyer patience without a conversion gain. A DTC apparel brand doing $340,000 monthly should budget $60,000 to $140,000 annually on product page video across the top 40 SKUs by contribution margin. Below that budget, the video shoot day math does not work and the founder ships either thin coverage on all SKUs or full coverage on the wrong ones. Shopify’s product photography guide is a useful outside read for founders scoping a first shoot.
Checkout inside fashion ecommerce marketing
Checkout on apparel carries a size selector as the first field, not the last. Programs that push size selection to a second step lose 4 to 9 percent conversion rate on the same traffic because the mobile buyer scrolls twice for a decision the desktop pattern buries. The mobile buyer decides in under six seconds whether the flow feels safe. Every friction point in that window costs margin.
The checkout structure that respects sizing
The size selector sits directly under the price, above the add to cart button. Sold out sizes stay visible with a strikethrough, not hidden, so the buyer reads the size chart against the availability without a filter reset. A restock notification input replaces the add to cart button on the sold out size. On mobile, the size selector expands into a tap sheet that shows the size chart and fit review pull quotes on the same swipe. That single pattern grows completed checkout rate 6 to 12 percent on apparel accounts we have measured inside 21 days of the deploy.
Shipping and returns copy at the payment step
Shipping thresholds, return windows, and exchange policy live inline at the payment step, not on a footer page. Apparel buyers who read the return policy at cart complete checkout 18 to 30 percent more often than buyers who never see it, and the return rate on those orders drops 2 to 5 percentage points because the buyer bought with the exchange window in mind. Founders who bury return policy on a footer link are trading the transparency dividend for a false conversion gain that costs margin on the back end.
Paid social inside fashion ecommerce marketing
Paid social carries 45 to 60 percent of first order revenue on DTC apparel between $80,000 and $600,000 monthly. Meta and TikTok are the two platforms that fund. Every other platform enters through a 90 day pilot with a hard kill date, not a slow bleed into the always on budget.
Creative velocity as the real budget
Paid social on apparel wins on creative velocity, not media budget. A brand shipping 6 to 12 fresh creative variants weekly across static, Reel, and TikTok formats produces 30 to 60 percent lower cost per order than the same brand shipping 2 to 3 variants weekly on the same media budget. Fashion audiences fatigue creative inside 5 to 9 days on the same face and product angle. The retainer needs to feed that fatigue rate, not fight it, and the creative production line has to run on a weekly cadence with a named producer.
The catalog feed that carries Shopping
Meta Advantage Plus Shopping and TikTok Shop pull directly from the Shopify product feed. Programs that let the feed run on default titles and default images produce 40 to 70 percent higher cost per order than programs that rewrite the top 40 SKU feed titles and swap the primary feed image to the highest performing lifestyle shot. Feed hygiene is the cheapest paid social gain available on an apparel account and the one most founders never open. Meta’s catalog quality reference covers the field level rules that shape delivery.
Retention inside fashion ecommerce marketing
Retention is the layer that decides whether the P and L runs on margin or grinds through paid acquisition to break even. A DTC apparel brand with a 30 percent day 90 repeat rate runs 20 to 35 percent more contribution margin per blended dollar of spend than the same brand at 15 percent. Retention is not one channel. It is a stack of email, SMS, loyalty, and post purchase content on a monthly calendar.
Email and SMS as the core
Email drives 25 to 35 percent of DTC apparel revenue when the flow set is complete. Welcome, browse abandonment, cart abandonment, post purchase, replenishment, VIP, and win back are the seven flows every brand needs live inside the first 90 days. SMS adds another 8 to 15 percent of revenue at a 5 to 12 percent list opt in rate. Klaviyo and Attentive dominate the DTC apparel tool stack because the two platforms handle 90 percent of the flow logic without custom development. Our what is fashion marketing primer covers how the retention layer plugs into the wider channel mix.
Post purchase content that grows LTV
Post purchase content covers the four weeks after delivery on a first order. Styling emails that pair the purchased SKU with three complementary pieces. A fit review request at day seven when the buyer has worn the garment twice. A community moment at day fourteen with user photos of the same SKU. A second order incentive at day 28 with a category adjacent recommendation. Programs that publish the full post purchase sequence grow lifetime value 22 to 45 percent by month twelve on the same first order cohort, and the retention layer starts to carry the revenue growth the paid team used to carry alone.
Benchmarks inside fashion ecommerce marketing
Benchmarks make the plan honest. A DTC apparel brand reads its own numbers against the industry median every quarter and acts on the gaps that show up. Conversion rate. Blended cost per order. Return rate. Repeat purchase rate. Email revenue share. Each has an honest median for the revenue band, and the numbers change slowly year over year.
| Revenue band | Conversion rate | Blended CPO | Return rate (womenswear) | Day 90 repeat rate | Email revenue share |
|---|---|---|---|---|---|
| Under $80K monthly | 1.2% to 1.8% | $38 to $54 | 26% to 34% | 10% to 18% | 18% to 26% |
| $80K to $250K monthly | 1.6% to 2.4% | $28 to $46 | 24% to 32% | 16% to 24% | 22% to 30% |
| $250K to $600K monthly | 2.0% to 2.8% | $22 to $38 | 22% to 30% | 22% to 32% | 26% to 34% |
| $600K to $1.5M monthly | 2.4% to 3.4% | $18 to $32 | 20% to 28% | 28% to 38% | 28% to 36% |
| Above $1.5M monthly | 2.8% to 4.0% | $16 to $28 | 18% to 26% | 32% to 45% | 30% to 38% |
A founder who reads a monthly dashboard against these benchmarks catches the drift inside 30 days and adjusts the plan before the quarter closes. A founder who reads only the paid social dashboard catches the drift 90 days late, which usually means the correction shows up in the next quarter revenue instead of the current one. That single reporting habit is the difference between an apparel plan that grows and an apparel plan that runs in place while the founder wonders what actually changed under the surface. Founders scoping the wider paid team should read our fashion marketing agency guide for the retainer scope that sits above these benchmark reads.
How do you measure fashion ecommerce marketing honestly
Honest measurement of fashion ecommerce marketing runs on four data streams reconciled inside one weekly dashboard. Shopify revenue by UTM and discount code. Google Analytics 4 sessions and assisted conversion. Meta and TikTok ads platform attribution. A post purchase survey on every order that asks where the buyer first saw the brand. Each stream lies on its own.
The single biggest reporting mistake is trusting Meta own return on ad spend number as the campaign result. Meta over reports by 30 to 90 percent on apparel accounts because the pixel double counts view through and click through revenue that would have converted anyway. Google Analytics 4 under reports because the model discounts paid social influence on longer consideration windows. Shopify tells the truth on first order revenue but nothing on assisted revenue. Post purchase surveys catch the audience that saw the campaign on TikTok, searched a week later, and bought through direct traffic. The four streams together reconcile inside a 5 to 8 percent margin on a well tagged apparel account. Google’s attribution model documentation is the source every founder should read before arguing about which number is correct.
Every plan reports campaign level revenue against the campaign level budget with a 7 day and 30 day view. Anything shorter than 7 days is noise on an apparel buying cycle. Anything longer than 30 days is too late to change the current campaign trajectory. The founder reads the dashboard once a week on Monday morning before the review meeting, not once at the end of the quarter when the numbers are already locked into a bad direction.
Fashion ecommerce marketing in production
Boogie Board came to our team with a DTC ecommerce program running the same problem most apparel brands run at $340,000 monthly. Product pages with four images per SKU, no fit content on the size selector, a checkout that pushed size to step two on mobile, cost per acquisition at $150.92 and climbing, and a founder who read the paid social dashboard at face value every Monday. The plan looked busy on paper. The margin math looked thin on the P and L.
Our team rebuilt the ecommerce path around the five node stack. Rewrote the product page template with 8 to 12 images per SKU, garment measurements at the SKU level, and fit review pull quotes below the size selector. Moved size selection to first field at the top of the mobile checkout. Rebuilt the top 40 SKU catalog feed with lifestyle imagery and hand written titles. Turned on the seven core Klaviyo flows and a Attentive SMS list at week three. Server side tracking went in through Elevar in week two. Weekly Monday review meetings replaced the end of month post mortem, with the founder in the room and empowered to kill a campaign at week two.
Twelve months in, blended cost per acquisition dropped to $31. Conversion rate on the paid landing pages climbed 11 percent. Return rate on womenswear dropped from 38 percent to 26 percent. Day 90 repeat purchase rate grew from 22 percent to 41 percent. Managed ad budget grew to $650,000 monthly on the same margin profile. The result did not come from a magic new channel. It came from applying the five node stack, the checkout discipline, and the review cadence the plan required from day one.
The weekly review that keeps the plan honest
The Monday review meeting is where an apparel plan earns the right to keep spending. Forty five minutes, three agenda items, one decision. Read the reconciled dashboard. Review the top and bottom three ad creatives by cost per order. Decide whether the current campaign continues into next week, gets a creative pivot, or gets killed. The founder is invited and expected to make the kill decision when the numbers warrant it.
Every Monday review meeting eventually reaches the moment where somebody points at the flat performing creative and asks if the founder wants to give it one more week. The founder always says yes. The creative always underperforms for a second week. Nobody remembers who first suggested the extra week. Somewhere in the archive of every apparel brand shared drive, a flat creative is quietly generating more Monday meetings about itself than actual orders about anything on the site.
The kill rule is simple and it holds across every campaign archetype. Day 3 return on ad spend below 40 percent of target and day 7 return below 60 percent of target triggers a 24 hour creative pivot or a full kill. Programs that hold underperforming campaigns for the full run out of hope produce the flat quarters founders learn to fear. Programs that kill fast and reallocate to the winners produce the compounding quarters that make the retainer worth its rate. Founders new to structured plans assume the kill decision hurts the numbers. In practice, killing a flat creative at week two frees the budget to double down on the winner and grows the campaign result 20 to 45 percent inside the next 21 days on an apparel account.
Where fashion ecommerce marketing fits the wider stack
Fashion ecommerce marketing sits above the tactical channel work and below the annual brand strategy inside the growth stack. Every retainer allocation, every creative brief, and every founder decision on inventory rolls up to the five node plan the pod is running against. Programs that budget for tactics without the plan produce busy months with soft revenue. Programs that build the plan first produce quarters where every product page, every ad, and every email adds up to a single growth arc the founder can defend at a board meeting.
The retainer that runs the plan starts at $599 monthly on a 6 month contract and scales with revenue. The retainer covers merchandising audits, fit content templates, product page image direction, checkout audits, retention flow builds, weekly review meetings, and quarterly server side tracking audits. Founders scoping the wider agency side should also read our apparel fashion marketing hub for the broader deliverable list and pricing tiers by revenue band.
The retainer scales with revenue band, deliverable scope, and the number of active campaigns per quarter. A brand at $80,000 monthly runs a lean retainer with the founder in the review meeting. A brand at $600,000 monthly runs a fuller retainer with a dedicated pod and monthly media mix modeling reads. Every retainer tier ties back to the five node stack the plan requires, and every quarterly review closes the loop between the tactical channel work and the strategic growth arc the founder is defending on the P and L. Two outside reads worth an hour before the first plan cycle kicks off. Meta catalog quality reference above for feed hygiene. The Business of Fashion opinions section for the macro context that shapes which trends deserve budget in a given quarter on the merchandising side.
Return rate is the single margin killer on DTC apparel. Womenswear runs 22 to 30 percent, menswear 12 to 18 percent, accessories 6 to 10 percent. Two thirds of apparel returns cite fit or size as the reason. Fashion ecommerce marketing that ignores fit content spends the paid social budget twice on every return that goes back into inventory.
The plan builds a fit content stack on every SKU. Model height and size worn in the product description. Garment measurements at the SKU level, not the style level. Fit review notes pulled from customer reviews on a dedicated Fit tab. Size guides at the collection level with the actual measurement method photographed. Programs that publish the full fit stack on every SKU cut return rate 4 to 9 percentage points inside two quarters, which is the biggest margin move available in apparel without a supply chain change.
Where the fit content lives on the page
Fit content lives above the fold on desktop and inside the third scroll on mobile. The size chart lives one tap deep from the size selector, not three clicks deep behind a footer link. Fit review pull quotes live directly below the size selector so the buyer reads what the size chart says and what other buyers actually experienced in the same tap. That single change grows conversion rate 6 to 14 percent on apparel accounts we have tested inside 30 days, and it costs nothing in creative production because the copy already exists in the review corpus.
Fit tech worth funding
True Fit, Fit Analytics, and Bold Metrics carry the automated fit recommendation layer on scaled apparel programs. Each pulls buyer inputs (height, weight, common size in another brand) and recommends a size at add to cart. Return rate drops 3 to 7 percentage points on the SKUs where the tool is live and the buyer engages with the input flow. Below $250,000 monthly, the tool license outruns the return savings. Above $600,000 monthly, the math flips and the tool pays for itself inside a quarter.
Product page imagery inside fashion ecommerce marketing
Product page imagery is where a paid social click either converts or bounces inside eight seconds. The industry median product page ships four images per SKU. The winners ship eight to twelve, and every image answers a specific buyer question the paid ad already primed.
The imagery stack per SKU
A working stack per SKU carries model shot on size medium, model shot on size extra large or size fourteen so the buyer sees the fit at range, flat lay on a neutral ground for the utility view, detail shot on the fabric texture, detail shot on the hardware and stitching, back view on the model, side view on the model, movement clip of 4 to 8 seconds, and a scale shot next to a familiar object for accessories. Programs that publish all twelve image slots grow conversion rate 8 to 22 percent against the four image baseline, and Meta gets richer feed asset variants to test in the ad set.
Video that earns its production cost
Product page video works when it stays under 10 seconds, loops on autoplay, mutes by default, and shows movement the still shot cannot. Longer videos hurt page load and buyer patience without a conversion gain. A DTC apparel brand doing $340,000 monthly should budget $60,000 to $140,000 annually on product page video across the top 40 SKUs by contribution margin. Below that budget, the video shoot day math does not work and the founder ships either thin coverage on all SKUs or full coverage on the wrong ones. Shopify’s product photography guide is a useful outside read for founders scoping a first shoot.
Checkout inside fashion ecommerce marketing
Checkout on apparel carries a size selector as the first field, not the last. Programs that push size selection to a second step lose 4 to 9 percent conversion rate on the same traffic because the mobile buyer scrolls twice for a decision the desktop pattern buries. The mobile buyer decides in under six seconds whether the flow feels safe. Every friction point in that window costs margin.
The checkout structure that respects sizing
The size selector sits directly under the price, above the add to cart button. Sold out sizes stay visible with a strikethrough, not hidden, so the buyer reads the size chart against the availability without a filter reset. A restock notification input replaces the add to cart button on the sold out size. On mobile, the size selector expands into a tap sheet that shows the size chart and fit review pull quotes on the same swipe. That single pattern grows completed checkout rate 6 to 12 percent on apparel accounts we have measured inside 21 days of the deploy.
Shipping and returns copy at the payment step
Shipping thresholds, return windows, and exchange policy live inline at the payment step, not on a footer page. Apparel buyers who read the return policy at cart complete checkout 18 to 30 percent more often than buyers who never see it, and the return rate on those orders drops 2 to 5 percentage points because the buyer bought with the exchange window in mind. Founders who bury return policy on a footer link are trading the transparency dividend for a false conversion gain that costs margin on the back end.
Paid social inside fashion ecommerce marketing
Paid social carries 45 to 60 percent of first order revenue on DTC apparel between $80,000 and $600,000 monthly. Meta and TikTok are the two platforms that fund. Every other platform enters through a 90 day pilot with a hard kill date, not a slow bleed into the always on budget.
Creative velocity as the real budget
Paid social on apparel wins on creative velocity, not media budget. A brand shipping 6 to 12 fresh creative variants weekly across static, Reel, and TikTok formats produces 30 to 60 percent lower cost per order than the same brand shipping 2 to 3 variants weekly on the same media budget. Fashion audiences fatigue creative inside 5 to 9 days on the same face and product angle. The retainer needs to feed that fatigue rate, not fight it, and the creative production line has to run on a weekly cadence with a named producer.
The catalog feed that carries Shopping
Meta Advantage Plus Shopping and TikTok Shop pull directly from the Shopify product feed. Programs that let the feed run on default titles and default images produce 40 to 70 percent higher cost per order than programs that rewrite the top 40 SKU feed titles and swap the primary feed image to the highest performing lifestyle shot. Feed hygiene is the cheapest paid social gain available on an apparel account and the one most founders never open. Meta’s catalog quality reference covers the field level rules that shape delivery.
Retention inside fashion ecommerce marketing
Retention is the layer that decides whether the P and L runs on margin or grinds through paid acquisition to break even. A DTC apparel brand with a 30 percent day 90 repeat rate runs 20 to 35 percent more contribution margin per blended dollar of spend than the same brand at 15 percent. Retention is not one channel. It is a stack of email, SMS, loyalty, and post purchase content on a monthly calendar.
Email and SMS as the core
Email drives 25 to 35 percent of DTC apparel revenue when the flow set is complete. Welcome, browse abandonment, cart abandonment, post purchase, replenishment, VIP, and win back are the seven flows every brand needs live inside the first 90 days. SMS adds another 8 to 15 percent of revenue at a 5 to 12 percent list opt in rate. Klaviyo and Attentive dominate the DTC apparel tool stack because the two platforms handle 90 percent of the flow logic without custom development. Our what is fashion marketing primer covers how the retention layer plugs into the wider channel mix.
Post purchase content that grows LTV
Post purchase content covers the four weeks after delivery on a first order. Styling emails that pair the purchased SKU with three complementary pieces. A fit review request at day seven when the buyer has worn the garment twice. A community moment at day fourteen with user photos of the same SKU. A second order incentive at day 28 with a category adjacent recommendation. Programs that publish the full post purchase sequence grow lifetime value 22 to 45 percent by month twelve on the same first order cohort, and the retention layer starts to carry the revenue growth the paid team used to carry alone.
Benchmarks inside fashion ecommerce marketing
Benchmarks make the plan honest. A DTC apparel brand reads its own numbers against the industry median every quarter and acts on the gaps that show up. Conversion rate. Blended cost per order. Return rate. Repeat purchase rate. Email revenue share. Each has an honest median for the revenue band, and the numbers change slowly year over year.
| Revenue band | Conversion rate | Blended CPO | Return rate (womenswear) | Day 90 repeat rate | Email revenue share |
|---|---|---|---|---|---|
| Under $80K monthly | 1.2% to 1.8% | $38 to $54 | 26% to 34% | 10% to 18% | 18% to 26% |
| $80K to $250K monthly | 1.6% to 2.4% | $28 to $46 | 24% to 32% | 16% to 24% | 22% to 30% |
| $250K to $600K monthly | 2.0% to 2.8% | $22 to $38 | 22% to 30% | 22% to 32% | 26% to 34% |
| $600K to $1.5M monthly | 2.4% to 3.4% | $18 to $32 | 20% to 28% | 28% to 38% | 28% to 36% |
| Above $1.5M monthly | 2.8% to 4.0% | $16 to $28 | 18% to 26% | 32% to 45% | 30% to 38% |
A founder who reads a monthly dashboard against these benchmarks catches the drift inside 30 days and adjusts the plan before the quarter closes. A founder who reads only the paid social dashboard catches the drift 90 days late, which usually means the correction shows up in the next quarter revenue instead of the current one. That single reporting habit is the difference between an apparel plan that grows and an apparel plan that runs in place while the founder wonders what actually changed under the surface. Founders scoping the wider paid team should read our fashion marketing agency guide for the retainer scope that sits above these benchmark reads.
How do you measure fashion ecommerce marketing honestly
Honest measurement of fashion ecommerce marketing runs on four data streams reconciled inside one weekly dashboard. Shopify revenue by UTM and discount code. Google Analytics 4 sessions and assisted conversion. Meta and TikTok ads platform attribution. A post purchase survey on every order that asks where the buyer first saw the brand. Each stream lies on its own.
The single biggest reporting mistake is trusting Meta own return on ad spend number as the campaign result. Meta over reports by 30 to 90 percent on apparel accounts because the pixel double counts view through and click through revenue that would have converted anyway. Google Analytics 4 under reports because the model discounts paid social influence on longer consideration windows. Shopify tells the truth on first order revenue but nothing on assisted revenue. Post purchase surveys catch the audience that saw the campaign on TikTok, searched a week later, and bought through direct traffic. The four streams together reconcile inside a 5 to 8 percent margin on a well tagged apparel account. Google’s attribution model documentation is the source every founder should read before arguing about which number is correct.
Every plan reports campaign level revenue against the campaign level budget with a 7 day and 30 day view. Anything shorter than 7 days is noise on an apparel buying cycle. Anything longer than 30 days is too late to change the current campaign trajectory. The founder reads the dashboard once a week on Monday morning before the review meeting, not once at the end of the quarter when the numbers are already locked into a bad direction.
Fashion ecommerce marketing in production
Boogie Board came to our team with a DTC ecommerce program running the same problem most apparel brands run at $340,000 monthly. Product pages with four images per SKU, no fit content on the size selector, a checkout that pushed size to step two on mobile, cost per acquisition at $150.92 and climbing, and a founder who read the paid social dashboard at face value every Monday. The plan looked busy on paper. The margin math looked thin on the P and L.
Our team rebuilt the ecommerce path around the five node stack. Rewrote the product page template with 8 to 12 images per SKU, garment measurements at the SKU level, and fit review pull quotes below the size selector. Moved size selection to first field at the top of the mobile checkout. Rebuilt the top 40 SKU catalog feed with lifestyle imagery and hand written titles. Turned on the seven core Klaviyo flows and a Attentive SMS list at week three. Server side tracking went in through Elevar in week two. Weekly Monday review meetings replaced the end of month post mortem, with the founder in the room and empowered to kill a campaign at week two.
Twelve months in, blended cost per acquisition dropped to $31. Conversion rate on the paid landing pages climbed 11 percent. Return rate on womenswear dropped from 38 percent to 26 percent. Day 90 repeat purchase rate grew from 22 percent to 41 percent. Managed ad budget grew to $650,000 monthly on the same margin profile. The result did not come from a magic new channel. It came from applying the five node stack, the checkout discipline, and the review cadence the plan required from day one.
The weekly review that keeps the plan honest
The Monday review meeting is where an apparel plan earns the right to keep spending. Forty five minutes, three agenda items, one decision. Read the reconciled dashboard. Review the top and bottom three ad creatives by cost per order. Decide whether the current campaign continues into next week, gets a creative pivot, or gets killed. The founder is invited and expected to make the kill decision when the numbers warrant it.
Every Monday review meeting eventually reaches the moment where somebody points at the flat performing creative and asks if the founder wants to give it one more week. The founder always says yes. The creative always underperforms for a second week. Nobody remembers who first suggested the extra week. Somewhere in the archive of every apparel brand shared drive, a flat creative is quietly generating more Monday meetings about itself than actual orders about anything on the site.
The kill rule is simple and it holds across every campaign archetype. Day 3 return on ad spend below 40 percent of target and day 7 return below 60 percent of target triggers a 24 hour creative pivot or a full kill. Programs that hold underperforming campaigns for the full run out of hope produce the flat quarters founders learn to fear. Programs that kill fast and reallocate to the winners produce the compounding quarters that make the retainer worth its rate. Founders new to structured plans assume the kill decision hurts the numbers. In practice, killing a flat creative at week two frees the budget to double down on the winner and grows the campaign result 20 to 45 percent inside the next 21 days on an apparel account.
Where fashion ecommerce marketing fits the wider stack
Fashion ecommerce marketing sits above the tactical channel work and below the annual brand strategy inside the growth stack. Every retainer allocation, every creative brief, and every founder decision on inventory rolls up to the five node plan the pod is running against. Programs that budget for tactics without the plan produce busy months with soft revenue. Programs that build the plan first produce quarters where every product page, every ad, and every email adds up to a single growth arc the founder can defend at a board meeting.
The retainer that runs the plan starts at $599 monthly on a 6 month contract and scales with revenue. The retainer covers merchandising audits, fit content templates, product page image direction, checkout audits, retention flow builds, weekly review meetings, and quarterly server side tracking audits. Founders scoping the wider agency side should also read our apparel fashion marketing hub for the broader deliverable list and pricing tiers by revenue band.
The retainer scales with revenue band, deliverable scope, and the number of active campaigns per quarter. A brand at $80,000 monthly runs a lean retainer with the founder in the review meeting. A brand at $600,000 monthly runs a fuller retainer with a dedicated pod and monthly media mix modeling reads. Every retainer tier ties back to the five node stack the plan requires, and every quarterly review closes the loop between the tactical channel work and the strategic growth arc the founder is defending on the P and L. Two outside reads worth an hour before the first plan cycle kicks off. Meta catalog quality reference above for feed hygiene. The Business of Fashion opinions section for the macro context that shapes which trends deserve budget in a given quarter on the merchandising side.
Retention is the layer that decides whether the P and L runs on margin or grinds through paid acquisition to break even. A DTC apparel brand with a 30 percent day 90 repeat rate runs 20 to 35 percent more contribution margin per blended dollar of spend than the same brand at 15 percent. Retention is not one channel. It is a stack of email, SMS, loyalty, and post purchase content on a monthly calendar.
Email and SMS as the core
Email drives 25 to 35 percent of DTC apparel revenue when the flow set is complete. Welcome, browse abandonment, cart abandonment, post purchase, replenishment, VIP, and win back are the seven flows every brand needs live inside the first 90 days. SMS adds another 8 to 15 percent of revenue at a 5 to 12 percent list opt in rate. Klaviyo and Attentive dominate the DTC apparel tool stack because the two platforms handle 90 percent of the flow logic without custom development. Our what is fashion marketing primer covers how the retention layer plugs into the wider channel mix.
Post purchase content that grows LTV
Post purchase content covers the four weeks after delivery on a first order. Styling emails that pair the purchased SKU with three complementary pieces. A fit review request at day seven when the buyer has worn the garment twice. A community moment at day fourteen with user photos of the same SKU. A second order incentive at day 28 with a category adjacent recommendation. Programs that publish the full post purchase sequence grow lifetime value 22 to 45 percent by month twelve on the same first order cohort, and the retention layer starts to carry the revenue growth the paid team used to carry alone.
Benchmarks inside fashion ecommerce marketing
Benchmarks make the plan honest. A DTC apparel brand reads its own numbers against the industry median every quarter and acts on the gaps that show up. Conversion rate. Blended cost per order. Return rate. Repeat purchase rate. Email revenue share. Each has an honest median for the revenue band, and the numbers change slowly year over year.
| Revenue band | Conversion rate | Blended CPO | Return rate (womenswear) | Day 90 repeat rate | Email revenue share |
|---|---|---|---|---|---|
| Under $80K monthly | 1.2% to 1.8% | $38 to $54 | 26% to 34% | 10% to 18% | 18% to 26% |
| $80K to $250K monthly | 1.6% to 2.4% | $28 to $46 | 24% to 32% | 16% to 24% | 22% to 30% |
| $250K to $600K monthly | 2.0% to 2.8% | $22 to $38 | 22% to 30% | 22% to 32% | 26% to 34% |
| $600K to $1.5M monthly | 2.4% to 3.4% | $18 to $32 | 20% to 28% | 28% to 38% | 28% to 36% |
| Above $1.5M monthly | 2.8% to 4.0% | $16 to $28 | 18% to 26% | 32% to 45% | 30% to 38% |
A founder who reads a monthly dashboard against these benchmarks catches the drift inside 30 days and adjusts the plan before the quarter closes. A founder who reads only the paid social dashboard catches the drift 90 days late, which usually means the correction shows up in the next quarter revenue instead of the current one. That single reporting habit is the difference between an apparel plan that grows and an apparel plan that runs in place while the founder wonders what actually changed under the surface. Founders scoping the wider paid team should read our fashion marketing agency guide for the retainer scope that sits above these benchmark reads.
How do you measure fashion ecommerce marketing honestly
Honest measurement of fashion ecommerce marketing runs on four data streams reconciled inside one weekly dashboard. Shopify revenue by UTM and discount code. Google Analytics 4 sessions and assisted conversion. Meta and TikTok ads platform attribution. A post purchase survey on every order that asks where the buyer first saw the brand. Each stream lies on its own.
The single biggest reporting mistake is trusting Meta own return on ad spend number as the campaign result. Meta over reports by 30 to 90 percent on apparel accounts because the pixel double counts view through and click through revenue that would have converted anyway. Google Analytics 4 under reports because the model discounts paid social influence on longer consideration windows. Shopify tells the truth on first order revenue but nothing on assisted revenue. Post purchase surveys catch the audience that saw the campaign on TikTok, searched a week later, and bought through direct traffic. The four streams together reconcile inside a 5 to 8 percent margin on a well tagged apparel account. Google’s attribution model documentation is the source every founder should read before arguing about which number is correct.
Every plan reports campaign level revenue against the campaign level budget with a 7 day and 30 day view. Anything shorter than 7 days is noise on an apparel buying cycle. Anything longer than 30 days is too late to change the current campaign trajectory. The founder reads the dashboard once a week on Monday morning before the review meeting, not once at the end of the quarter when the numbers are already locked into a bad direction.
Fashion ecommerce marketing in production
Boogie Board came to our team with a DTC ecommerce program running the same problem most apparel brands run at $340,000 monthly. Product pages with four images per SKU, no fit content on the size selector, a checkout that pushed size to step two on mobile, cost per acquisition at $150.92 and climbing, and a founder who read the paid social dashboard at face value every Monday. The plan looked busy on paper. The margin math looked thin on the P and L.
Our team rebuilt the ecommerce path around the five node stack. Rewrote the product page template with 8 to 12 images per SKU, garment measurements at the SKU level, and fit review pull quotes below the size selector. Moved size selection to first field at the top of the mobile checkout. Rebuilt the top 40 SKU catalog feed with lifestyle imagery and hand written titles. Turned on the seven core Klaviyo flows and a Attentive SMS list at week three. Server side tracking went in through Elevar in week two. Weekly Monday review meetings replaced the end of month post mortem, with the founder in the room and empowered to kill a campaign at week two.
Twelve months in, blended cost per acquisition dropped to $31. Conversion rate on the paid landing pages climbed 11 percent. Return rate on womenswear dropped from 38 percent to 26 percent. Day 90 repeat purchase rate grew from 22 percent to 41 percent. Managed ad budget grew to $650,000 monthly on the same margin profile. The result did not come from a magic new channel. It came from applying the five node stack, the checkout discipline, and the review cadence the plan required from day one.
The weekly review that keeps the plan honest
The Monday review meeting is where an apparel plan earns the right to keep spending. Forty five minutes, three agenda items, one decision. Read the reconciled dashboard. Review the top and bottom three ad creatives by cost per order. Decide whether the current campaign continues into next week, gets a creative pivot, or gets killed. The founder is invited and expected to make the kill decision when the numbers warrant it.
Every Monday review meeting eventually reaches the moment where somebody points at the flat performing creative and asks if the founder wants to give it one more week. The founder always says yes. The creative always underperforms for a second week. Nobody remembers who first suggested the extra week. Somewhere in the archive of every apparel brand shared drive, a flat creative is quietly generating more Monday meetings about itself than actual orders about anything on the site.
The kill rule is simple and it holds across every campaign archetype. Day 3 return on ad spend below 40 percent of target and day 7 return below 60 percent of target triggers a 24 hour creative pivot or a full kill. Programs that hold underperforming campaigns for the full run out of hope produce the flat quarters founders learn to fear. Programs that kill fast and reallocate to the winners produce the compounding quarters that make the retainer worth its rate. Founders new to structured plans assume the kill decision hurts the numbers. In practice, killing a flat creative at week two frees the budget to double down on the winner and grows the campaign result 20 to 45 percent inside the next 21 days on an apparel account.
Where fashion ecommerce marketing fits the wider stack
Fashion ecommerce marketing sits above the tactical channel work and below the annual brand strategy inside the growth stack. Every retainer allocation, every creative brief, and every founder decision on inventory rolls up to the five node plan the pod is running against. Programs that budget for tactics without the plan produce busy months with soft revenue. Programs that build the plan first produce quarters where every product page, every ad, and every email adds up to a single growth arc the founder can defend at a board meeting.
The retainer that runs the plan starts at $599 monthly on a 6 month contract and scales with revenue. The retainer covers merchandising audits, fit content templates, product page image direction, checkout audits, retention flow builds, weekly review meetings, and quarterly server side tracking audits. Founders scoping the wider agency side should also read our apparel fashion marketing hub for the broader deliverable list and pricing tiers by revenue band.
The retainer scales with revenue band, deliverable scope, and the number of active campaigns per quarter. A brand at $80,000 monthly runs a lean retainer with the founder in the review meeting. A brand at $600,000 monthly runs a fuller retainer with a dedicated pod and monthly media mix modeling reads. Every retainer tier ties back to the five node stack the plan requires, and every quarterly review closes the loop between the tactical channel work and the strategic growth arc the founder is defending on the P and L. Two outside reads worth an hour before the first plan cycle kicks off. Meta catalog quality reference above for feed hygiene. The Business of Fashion opinions section for the macro context that shapes which trends deserve budget in a given quarter on the merchandising side.
Paid social carries 45 to 60 percent of first order revenue on DTC apparel between $80,000 and $600,000 monthly. Meta and TikTok are the two platforms that fund. Every other platform enters through a 90 day pilot with a hard kill date, not a slow bleed into the always on budget.
Creative velocity as the real budget
Paid social on apparel wins on creative velocity, not media budget. A brand shipping 6 to 12 fresh creative variants weekly across static, Reel, and TikTok formats produces 30 to 60 percent lower cost per order than the same brand shipping 2 to 3 variants weekly on the same media budget. Fashion audiences fatigue creative inside 5 to 9 days on the same face and product angle. The retainer needs to feed that fatigue rate, not fight it, and the creative production line has to run on a weekly cadence with a named producer.
The catalog feed that carries Shopping
Meta Advantage Plus Shopping and TikTok Shop pull directly from the Shopify product feed. Programs that let the feed run on default titles and default images produce 40 to 70 percent higher cost per order than programs that rewrite the top 40 SKU feed titles and swap the primary feed image to the highest performing lifestyle shot. Feed hygiene is the cheapest paid social gain available on an apparel account and the one most founders never open. Meta’s catalog quality reference covers the field level rules that shape delivery.
Retention inside fashion ecommerce marketing
Retention is the layer that decides whether the P and L runs on margin or grinds through paid acquisition to break even. A DTC apparel brand with a 30 percent day 90 repeat rate runs 20 to 35 percent more contribution margin per blended dollar of spend than the same brand at 15 percent. Retention is not one channel. It is a stack of email, SMS, loyalty, and post purchase content on a monthly calendar.
Email and SMS as the core
Email drives 25 to 35 percent of DTC apparel revenue when the flow set is complete. Welcome, browse abandonment, cart abandonment, post purchase, replenishment, VIP, and win back are the seven flows every brand needs live inside the first 90 days. SMS adds another 8 to 15 percent of revenue at a 5 to 12 percent list opt in rate. Klaviyo and Attentive dominate the DTC apparel tool stack because the two platforms handle 90 percent of the flow logic without custom development. Our what is fashion marketing primer covers how the retention layer plugs into the wider channel mix.
Post purchase content that grows LTV
Post purchase content covers the four weeks after delivery on a first order. Styling emails that pair the purchased SKU with three complementary pieces. A fit review request at day seven when the buyer has worn the garment twice. A community moment at day fourteen with user photos of the same SKU. A second order incentive at day 28 with a category adjacent recommendation. Programs that publish the full post purchase sequence grow lifetime value 22 to 45 percent by month twelve on the same first order cohort, and the retention layer starts to carry the revenue growth the paid team used to carry alone.
Benchmarks inside fashion ecommerce marketing
Benchmarks make the plan honest. A DTC apparel brand reads its own numbers against the industry median every quarter and acts on the gaps that show up. Conversion rate. Blended cost per order. Return rate. Repeat purchase rate. Email revenue share. Each has an honest median for the revenue band, and the numbers change slowly year over year.
| Revenue band | Conversion rate | Blended CPO | Return rate (womenswear) | Day 90 repeat rate | Email revenue share |
|---|---|---|---|---|---|
| Under $80K monthly | 1.2% to 1.8% | $38 to $54 | 26% to 34% | 10% to 18% | 18% to 26% |
| $80K to $250K monthly | 1.6% to 2.4% | $28 to $46 | 24% to 32% | 16% to 24% | 22% to 30% |
| $250K to $600K monthly | 2.0% to 2.8% | $22 to $38 | 22% to 30% | 22% to 32% | 26% to 34% |
| $600K to $1.5M monthly | 2.4% to 3.4% | $18 to $32 | 20% to 28% | 28% to 38% | 28% to 36% |
| Above $1.5M monthly | 2.8% to 4.0% | $16 to $28 | 18% to 26% | 32% to 45% | 30% to 38% |
A founder who reads a monthly dashboard against these benchmarks catches the drift inside 30 days and adjusts the plan before the quarter closes. A founder who reads only the paid social dashboard catches the drift 90 days late, which usually means the correction shows up in the next quarter revenue instead of the current one. That single reporting habit is the difference between an apparel plan that grows and an apparel plan that runs in place while the founder wonders what actually changed under the surface. Founders scoping the wider paid team should read our fashion marketing agency guide for the retainer scope that sits above these benchmark reads.
How do you measure fashion ecommerce marketing honestly
Honest measurement of fashion ecommerce marketing runs on four data streams reconciled inside one weekly dashboard. Shopify revenue by UTM and discount code. Google Analytics 4 sessions and assisted conversion. Meta and TikTok ads platform attribution. A post purchase survey on every order that asks where the buyer first saw the brand. Each stream lies on its own.
The single biggest reporting mistake is trusting Meta own return on ad spend number as the campaign result. Meta over reports by 30 to 90 percent on apparel accounts because the pixel double counts view through and click through revenue that would have converted anyway. Google Analytics 4 under reports because the model discounts paid social influence on longer consideration windows. Shopify tells the truth on first order revenue but nothing on assisted revenue. Post purchase surveys catch the audience that saw the campaign on TikTok, searched a week later, and bought through direct traffic. The four streams together reconcile inside a 5 to 8 percent margin on a well tagged apparel account. Google’s attribution model documentation is the source every founder should read before arguing about which number is correct.
Every plan reports campaign level revenue against the campaign level budget with a 7 day and 30 day view. Anything shorter than 7 days is noise on an apparel buying cycle. Anything longer than 30 days is too late to change the current campaign trajectory. The founder reads the dashboard once a week on Monday morning before the review meeting, not once at the end of the quarter when the numbers are already locked into a bad direction.
Fashion ecommerce marketing in production
Boogie Board came to our team with a DTC ecommerce program running the same problem most apparel brands run at $340,000 monthly. Product pages with four images per SKU, no fit content on the size selector, a checkout that pushed size to step two on mobile, cost per acquisition at $150.92 and climbing, and a founder who read the paid social dashboard at face value every Monday. The plan looked busy on paper. The margin math looked thin on the P and L.
Our team rebuilt the ecommerce path around the five node stack. Rewrote the product page template with 8 to 12 images per SKU, garment measurements at the SKU level, and fit review pull quotes below the size selector. Moved size selection to first field at the top of the mobile checkout. Rebuilt the top 40 SKU catalog feed with lifestyle imagery and hand written titles. Turned on the seven core Klaviyo flows and a Attentive SMS list at week three. Server side tracking went in through Elevar in week two. Weekly Monday review meetings replaced the end of month post mortem, with the founder in the room and empowered to kill a campaign at week two.
Twelve months in, blended cost per acquisition dropped to $31. Conversion rate on the paid landing pages climbed 11 percent. Return rate on womenswear dropped from 38 percent to 26 percent. Day 90 repeat purchase rate grew from 22 percent to 41 percent. Managed ad budget grew to $650,000 monthly on the same margin profile. The result did not come from a magic new channel. It came from applying the five node stack, the checkout discipline, and the review cadence the plan required from day one.
The weekly review that keeps the plan honest
The Monday review meeting is where an apparel plan earns the right to keep spending. Forty five minutes, three agenda items, one decision. Read the reconciled dashboard. Review the top and bottom three ad creatives by cost per order. Decide whether the current campaign continues into next week, gets a creative pivot, or gets killed. The founder is invited and expected to make the kill decision when the numbers warrant it.
Every Monday review meeting eventually reaches the moment where somebody points at the flat performing creative and asks if the founder wants to give it one more week. The founder always says yes. The creative always underperforms for a second week. Nobody remembers who first suggested the extra week. Somewhere in the archive of every apparel brand shared drive, a flat creative is quietly generating more Monday meetings about itself than actual orders about anything on the site.
The kill rule is simple and it holds across every campaign archetype. Day 3 return on ad spend below 40 percent of target and day 7 return below 60 percent of target triggers a 24 hour creative pivot or a full kill. Programs that hold underperforming campaigns for the full run out of hope produce the flat quarters founders learn to fear. Programs that kill fast and reallocate to the winners produce the compounding quarters that make the retainer worth its rate. Founders new to structured plans assume the kill decision hurts the numbers. In practice, killing a flat creative at week two frees the budget to double down on the winner and grows the campaign result 20 to 45 percent inside the next 21 days on an apparel account.
Where fashion ecommerce marketing fits the wider stack
Fashion ecommerce marketing sits above the tactical channel work and below the annual brand strategy inside the growth stack. Every retainer allocation, every creative brief, and every founder decision on inventory rolls up to the five node plan the pod is running against. Programs that budget for tactics without the plan produce busy months with soft revenue. Programs that build the plan first produce quarters where every product page, every ad, and every email adds up to a single growth arc the founder can defend at a board meeting.
The retainer that runs the plan starts at $599 monthly on a 6 month contract and scales with revenue. The retainer covers merchandising audits, fit content templates, product page image direction, checkout audits, retention flow builds, weekly review meetings, and quarterly server side tracking audits. Founders scoping the wider agency side should also read our apparel fashion marketing hub for the broader deliverable list and pricing tiers by revenue band.
The retainer scales with revenue band, deliverable scope, and the number of active campaigns per quarter. A brand at $80,000 monthly runs a lean retainer with the founder in the review meeting. A brand at $600,000 monthly runs a fuller retainer with a dedicated pod and monthly media mix modeling reads. Every retainer tier ties back to the five node stack the plan requires, and every quarterly review closes the loop between the tactical channel work and the strategic growth arc the founder is defending on the P and L. Two outside reads worth an hour before the first plan cycle kicks off. Meta catalog quality reference above for feed hygiene. The Business of Fashion opinions section for the macro context that shapes which trends deserve budget in a given quarter on the merchandising side.
Checkout on apparel carries a size selector as the first field, not the last. Programs that push size selection to a second step lose 4 to 9 percent conversion rate on the same traffic because the mobile buyer scrolls twice for a decision the desktop pattern buries. The mobile buyer decides in under six seconds whether the flow feels safe. Every friction point in that window costs margin.
The checkout structure that respects sizing
The size selector sits directly under the price, above the add to cart button. Sold out sizes stay visible with a strikethrough, not hidden, so the buyer reads the size chart against the availability without a filter reset. A restock notification input replaces the add to cart button on the sold out size. On mobile, the size selector expands into a tap sheet that shows the size chart and fit review pull quotes on the same swipe. That single pattern grows completed checkout rate 6 to 12 percent on apparel accounts we have measured inside 21 days of the deploy.
Shipping and returns copy at the payment step
Shipping thresholds, return windows, and exchange policy live inline at the payment step, not on a footer page. Apparel buyers who read the return policy at cart complete checkout 18 to 30 percent more often than buyers who never see it, and the return rate on those orders drops 2 to 5 percentage points because the buyer bought with the exchange window in mind. Founders who bury return policy on a footer link are trading the transparency dividend for a false conversion gain that costs margin on the back end.
Paid social inside fashion ecommerce marketing
Paid social carries 45 to 60 percent of first order revenue on DTC apparel between $80,000 and $600,000 monthly. Meta and TikTok are the two platforms that fund. Every other platform enters through a 90 day pilot with a hard kill date, not a slow bleed into the always on budget.
Creative velocity as the real budget
Paid social on apparel wins on creative velocity, not media budget. A brand shipping 6 to 12 fresh creative variants weekly across static, Reel, and TikTok formats produces 30 to 60 percent lower cost per order than the same brand shipping 2 to 3 variants weekly on the same media budget. Fashion audiences fatigue creative inside 5 to 9 days on the same face and product angle. The retainer needs to feed that fatigue rate, not fight it, and the creative production line has to run on a weekly cadence with a named producer.
The catalog feed that carries Shopping
Meta Advantage Plus Shopping and TikTok Shop pull directly from the Shopify product feed. Programs that let the feed run on default titles and default images produce 40 to 70 percent higher cost per order than programs that rewrite the top 40 SKU feed titles and swap the primary feed image to the highest performing lifestyle shot. Feed hygiene is the cheapest paid social gain available on an apparel account and the one most founders never open. Meta’s catalog quality reference covers the field level rules that shape delivery.
Retention inside fashion ecommerce marketing
Retention is the layer that decides whether the P and L runs on margin or grinds through paid acquisition to break even. A DTC apparel brand with a 30 percent day 90 repeat rate runs 20 to 35 percent more contribution margin per blended dollar of spend than the same brand at 15 percent. Retention is not one channel. It is a stack of email, SMS, loyalty, and post purchase content on a monthly calendar.
Email and SMS as the core
Email drives 25 to 35 percent of DTC apparel revenue when the flow set is complete. Welcome, browse abandonment, cart abandonment, post purchase, replenishment, VIP, and win back are the seven flows every brand needs live inside the first 90 days. SMS adds another 8 to 15 percent of revenue at a 5 to 12 percent list opt in rate. Klaviyo and Attentive dominate the DTC apparel tool stack because the two platforms handle 90 percent of the flow logic without custom development. Our what is fashion marketing primer covers how the retention layer plugs into the wider channel mix.
Post purchase content that grows LTV
Post purchase content covers the four weeks after delivery on a first order. Styling emails that pair the purchased SKU with three complementary pieces. A fit review request at day seven when the buyer has worn the garment twice. A community moment at day fourteen with user photos of the same SKU. A second order incentive at day 28 with a category adjacent recommendation. Programs that publish the full post purchase sequence grow lifetime value 22 to 45 percent by month twelve on the same first order cohort, and the retention layer starts to carry the revenue growth the paid team used to carry alone.
Benchmarks inside fashion ecommerce marketing
Benchmarks make the plan honest. A DTC apparel brand reads its own numbers against the industry median every quarter and acts on the gaps that show up. Conversion rate. Blended cost per order. Return rate. Repeat purchase rate. Email revenue share. Each has an honest median for the revenue band, and the numbers change slowly year over year.
| Revenue band | Conversion rate | Blended CPO | Return rate (womenswear) | Day 90 repeat rate | Email revenue share |
|---|---|---|---|---|---|
| Under $80K monthly | 1.2% to 1.8% | $38 to $54 | 26% to 34% | 10% to 18% | 18% to 26% |
| $80K to $250K monthly | 1.6% to 2.4% | $28 to $46 | 24% to 32% | 16% to 24% | 22% to 30% |
| $250K to $600K monthly | 2.0% to 2.8% | $22 to $38 | 22% to 30% | 22% to 32% | 26% to 34% |
| $600K to $1.5M monthly | 2.4% to 3.4% | $18 to $32 | 20% to 28% | 28% to 38% | 28% to 36% |
| Above $1.5M monthly | 2.8% to 4.0% | $16 to $28 | 18% to 26% | 32% to 45% | 30% to 38% |
A founder who reads a monthly dashboard against these benchmarks catches the drift inside 30 days and adjusts the plan before the quarter closes. A founder who reads only the paid social dashboard catches the drift 90 days late, which usually means the correction shows up in the next quarter revenue instead of the current one. That single reporting habit is the difference between an apparel plan that grows and an apparel plan that runs in place while the founder wonders what actually changed under the surface. Founders scoping the wider paid team should read our fashion marketing agency guide for the retainer scope that sits above these benchmark reads.
How do you measure fashion ecommerce marketing honestly
Honest measurement of fashion ecommerce marketing runs on four data streams reconciled inside one weekly dashboard. Shopify revenue by UTM and discount code. Google Analytics 4 sessions and assisted conversion. Meta and TikTok ads platform attribution. A post purchase survey on every order that asks where the buyer first saw the brand. Each stream lies on its own.
The single biggest reporting mistake is trusting Meta own return on ad spend number as the campaign result. Meta over reports by 30 to 90 percent on apparel accounts because the pixel double counts view through and click through revenue that would have converted anyway. Google Analytics 4 under reports because the model discounts paid social influence on longer consideration windows. Shopify tells the truth on first order revenue but nothing on assisted revenue. Post purchase surveys catch the audience that saw the campaign on TikTok, searched a week later, and bought through direct traffic. The four streams together reconcile inside a 5 to 8 percent margin on a well tagged apparel account. Google’s attribution model documentation is the source every founder should read before arguing about which number is correct.
Every plan reports campaign level revenue against the campaign level budget with a 7 day and 30 day view. Anything shorter than 7 days is noise on an apparel buying cycle. Anything longer than 30 days is too late to change the current campaign trajectory. The founder reads the dashboard once a week on Monday morning before the review meeting, not once at the end of the quarter when the numbers are already locked into a bad direction.
Fashion ecommerce marketing in production
Boogie Board came to our team with a DTC ecommerce program running the same problem most apparel brands run at $340,000 monthly. Product pages with four images per SKU, no fit content on the size selector, a checkout that pushed size to step two on mobile, cost per acquisition at $150.92 and climbing, and a founder who read the paid social dashboard at face value every Monday. The plan looked busy on paper. The margin math looked thin on the P and L.
Our team rebuilt the ecommerce path around the five node stack. Rewrote the product page template with 8 to 12 images per SKU, garment measurements at the SKU level, and fit review pull quotes below the size selector. Moved size selection to first field at the top of the mobile checkout. Rebuilt the top 40 SKU catalog feed with lifestyle imagery and hand written titles. Turned on the seven core Klaviyo flows and a Attentive SMS list at week three. Server side tracking went in through Elevar in week two. Weekly Monday review meetings replaced the end of month post mortem, with the founder in the room and empowered to kill a campaign at week two.
Twelve months in, blended cost per acquisition dropped to $31. Conversion rate on the paid landing pages climbed 11 percent. Return rate on womenswear dropped from 38 percent to 26 percent. Day 90 repeat purchase rate grew from 22 percent to 41 percent. Managed ad budget grew to $650,000 monthly on the same margin profile. The result did not come from a magic new channel. It came from applying the five node stack, the checkout discipline, and the review cadence the plan required from day one.
The weekly review that keeps the plan honest
The Monday review meeting is where an apparel plan earns the right to keep spending. Forty five minutes, three agenda items, one decision. Read the reconciled dashboard. Review the top and bottom three ad creatives by cost per order. Decide whether the current campaign continues into next week, gets a creative pivot, or gets killed. The founder is invited and expected to make the kill decision when the numbers warrant it.
Every Monday review meeting eventually reaches the moment where somebody points at the flat performing creative and asks if the founder wants to give it one more week. The founder always says yes. The creative always underperforms for a second week. Nobody remembers who first suggested the extra week. Somewhere in the archive of every apparel brand shared drive, a flat creative is quietly generating more Monday meetings about itself than actual orders about anything on the site.
The kill rule is simple and it holds across every campaign archetype. Day 3 return on ad spend below 40 percent of target and day 7 return below 60 percent of target triggers a 24 hour creative pivot or a full kill. Programs that hold underperforming campaigns for the full run out of hope produce the flat quarters founders learn to fear. Programs that kill fast and reallocate to the winners produce the compounding quarters that make the retainer worth its rate. Founders new to structured plans assume the kill decision hurts the numbers. In practice, killing a flat creative at week two frees the budget to double down on the winner and grows the campaign result 20 to 45 percent inside the next 21 days on an apparel account.
Where fashion ecommerce marketing fits the wider stack
Fashion ecommerce marketing sits above the tactical channel work and below the annual brand strategy inside the growth stack. Every retainer allocation, every creative brief, and every founder decision on inventory rolls up to the five node plan the pod is running against. Programs that budget for tactics without the plan produce busy months with soft revenue. Programs that build the plan first produce quarters where every product page, every ad, and every email adds up to a single growth arc the founder can defend at a board meeting.
The retainer that runs the plan starts at $599 monthly on a 6 month contract and scales with revenue. The retainer covers merchandising audits, fit content templates, product page image direction, checkout audits, retention flow builds, weekly review meetings, and quarterly server side tracking audits. Founders scoping the wider agency side should also read our apparel fashion marketing hub for the broader deliverable list and pricing tiers by revenue band.
The retainer scales with revenue band, deliverable scope, and the number of active campaigns per quarter. A brand at $80,000 monthly runs a lean retainer with the founder in the review meeting. A brand at $600,000 monthly runs a fuller retainer with a dedicated pod and monthly media mix modeling reads. Every retainer tier ties back to the five node stack the plan requires, and every quarterly review closes the loop between the tactical channel work and the strategic growth arc the founder is defending on the P and L. Two outside reads worth an hour before the first plan cycle kicks off. Meta catalog quality reference above for feed hygiene. The Business of Fashion opinions section for the macro context that shapes which trends deserve budget in a given quarter on the merchandising side.
Product page imagery is where a paid social click either converts or bounces inside eight seconds. The industry median product page ships four images per SKU. The winners ship eight to twelve, and every image answers a specific buyer question the paid ad already primed.
The imagery stack per SKU
A working stack per SKU carries model shot on size medium, model shot on size extra large or size fourteen so the buyer sees the fit at range, flat lay on a neutral ground for the utility view, detail shot on the fabric texture, detail shot on the hardware and stitching, back view on the model, side view on the model, movement clip of 4 to 8 seconds, and a scale shot next to a familiar object for accessories. Programs that publish all twelve image slots grow conversion rate 8 to 22 percent against the four image baseline, and Meta gets richer feed asset variants to test in the ad set.
Video that earns its production cost
Product page video works when it stays under 10 seconds, loops on autoplay, mutes by default, and shows movement the still shot cannot. Longer videos hurt page load and buyer patience without a conversion gain. A DTC apparel brand doing $340,000 monthly should budget $60,000 to $140,000 annually on product page video across the top 40 SKUs by contribution margin. Below that budget, the video shoot day math does not work and the founder ships either thin coverage on all SKUs or full coverage on the wrong ones. Shopify’s product photography guide is a useful outside read for founders scoping a first shoot.
Checkout inside fashion ecommerce marketing
Checkout on apparel carries a size selector as the first field, not the last. Programs that push size selection to a second step lose 4 to 9 percent conversion rate on the same traffic because the mobile buyer scrolls twice for a decision the desktop pattern buries. The mobile buyer decides in under six seconds whether the flow feels safe. Every friction point in that window costs margin.
The checkout structure that respects sizing
The size selector sits directly under the price, above the add to cart button. Sold out sizes stay visible with a strikethrough, not hidden, so the buyer reads the size chart against the availability without a filter reset. A restock notification input replaces the add to cart button on the sold out size. On mobile, the size selector expands into a tap sheet that shows the size chart and fit review pull quotes on the same swipe. That single pattern grows completed checkout rate 6 to 12 percent on apparel accounts we have measured inside 21 days of the deploy.
Shipping and returns copy at the payment step
Shipping thresholds, return windows, and exchange policy live inline at the payment step, not on a footer page. Apparel buyers who read the return policy at cart complete checkout 18 to 30 percent more often than buyers who never see it, and the return rate on those orders drops 2 to 5 percentage points because the buyer bought with the exchange window in mind. Founders who bury return policy on a footer link are trading the transparency dividend for a false conversion gain that costs margin on the back end.
Paid social inside fashion ecommerce marketing
Paid social carries 45 to 60 percent of first order revenue on DTC apparel between $80,000 and $600,000 monthly. Meta and TikTok are the two platforms that fund. Every other platform enters through a 90 day pilot with a hard kill date, not a slow bleed into the always on budget.
Creative velocity as the real budget
Paid social on apparel wins on creative velocity, not media budget. A brand shipping 6 to 12 fresh creative variants weekly across static, Reel, and TikTok formats produces 30 to 60 percent lower cost per order than the same brand shipping 2 to 3 variants weekly on the same media budget. Fashion audiences fatigue creative inside 5 to 9 days on the same face and product angle. The retainer needs to feed that fatigue rate, not fight it, and the creative production line has to run on a weekly cadence with a named producer.
The catalog feed that carries Shopping
Meta Advantage Plus Shopping and TikTok Shop pull directly from the Shopify product feed. Programs that let the feed run on default titles and default images produce 40 to 70 percent higher cost per order than programs that rewrite the top 40 SKU feed titles and swap the primary feed image to the highest performing lifestyle shot. Feed hygiene is the cheapest paid social gain available on an apparel account and the one most founders never open. Meta’s catalog quality reference covers the field level rules that shape delivery.
Retention inside fashion ecommerce marketing
Retention is the layer that decides whether the P and L runs on margin or grinds through paid acquisition to break even. A DTC apparel brand with a 30 percent day 90 repeat rate runs 20 to 35 percent more contribution margin per blended dollar of spend than the same brand at 15 percent. Retention is not one channel. It is a stack of email, SMS, loyalty, and post purchase content on a monthly calendar.
Email and SMS as the core
Email drives 25 to 35 percent of DTC apparel revenue when the flow set is complete. Welcome, browse abandonment, cart abandonment, post purchase, replenishment, VIP, and win back are the seven flows every brand needs live inside the first 90 days. SMS adds another 8 to 15 percent of revenue at a 5 to 12 percent list opt in rate. Klaviyo and Attentive dominate the DTC apparel tool stack because the two platforms handle 90 percent of the flow logic without custom development. Our what is fashion marketing primer covers how the retention layer plugs into the wider channel mix.
Post purchase content that grows LTV
Post purchase content covers the four weeks after delivery on a first order. Styling emails that pair the purchased SKU with three complementary pieces. A fit review request at day seven when the buyer has worn the garment twice. A community moment at day fourteen with user photos of the same SKU. A second order incentive at day 28 with a category adjacent recommendation. Programs that publish the full post purchase sequence grow lifetime value 22 to 45 percent by month twelve on the same first order cohort, and the retention layer starts to carry the revenue growth the paid team used to carry alone.
Benchmarks inside fashion ecommerce marketing
Benchmarks make the plan honest. A DTC apparel brand reads its own numbers against the industry median every quarter and acts on the gaps that show up. Conversion rate. Blended cost per order. Return rate. Repeat purchase rate. Email revenue share. Each has an honest median for the revenue band, and the numbers change slowly year over year.
| Revenue band | Conversion rate | Blended CPO | Return rate (womenswear) | Day 90 repeat rate | Email revenue share |
|---|---|---|---|---|---|
| Under $80K monthly | 1.2% to 1.8% | $38 to $54 | 26% to 34% | 10% to 18% | 18% to 26% |
| $80K to $250K monthly | 1.6% to 2.4% | $28 to $46 | 24% to 32% | 16% to 24% | 22% to 30% |
| $250K to $600K monthly | 2.0% to 2.8% | $22 to $38 | 22% to 30% | 22% to 32% | 26% to 34% |
| $600K to $1.5M monthly | 2.4% to 3.4% | $18 to $32 | 20% to 28% | 28% to 38% | 28% to 36% |
| Above $1.5M monthly | 2.8% to 4.0% | $16 to $28 | 18% to 26% | 32% to 45% | 30% to 38% |
A founder who reads a monthly dashboard against these benchmarks catches the drift inside 30 days and adjusts the plan before the quarter closes. A founder who reads only the paid social dashboard catches the drift 90 days late, which usually means the correction shows up in the next quarter revenue instead of the current one. That single reporting habit is the difference between an apparel plan that grows and an apparel plan that runs in place while the founder wonders what actually changed under the surface. Founders scoping the wider paid team should read our fashion marketing agency guide for the retainer scope that sits above these benchmark reads.
How do you measure fashion ecommerce marketing honestly
Honest measurement of fashion ecommerce marketing runs on four data streams reconciled inside one weekly dashboard. Shopify revenue by UTM and discount code. Google Analytics 4 sessions and assisted conversion. Meta and TikTok ads platform attribution. A post purchase survey on every order that asks where the buyer first saw the brand. Each stream lies on its own.
The single biggest reporting mistake is trusting Meta own return on ad spend number as the campaign result. Meta over reports by 30 to 90 percent on apparel accounts because the pixel double counts view through and click through revenue that would have converted anyway. Google Analytics 4 under reports because the model discounts paid social influence on longer consideration windows. Shopify tells the truth on first order revenue but nothing on assisted revenue. Post purchase surveys catch the audience that saw the campaign on TikTok, searched a week later, and bought through direct traffic. The four streams together reconcile inside a 5 to 8 percent margin on a well tagged apparel account. Google’s attribution model documentation is the source every founder should read before arguing about which number is correct.
Every plan reports campaign level revenue against the campaign level budget with a 7 day and 30 day view. Anything shorter than 7 days is noise on an apparel buying cycle. Anything longer than 30 days is too late to change the current campaign trajectory. The founder reads the dashboard once a week on Monday morning before the review meeting, not once at the end of the quarter when the numbers are already locked into a bad direction.
Fashion ecommerce marketing in production
Boogie Board came to our team with a DTC ecommerce program running the same problem most apparel brands run at $340,000 monthly. Product pages with four images per SKU, no fit content on the size selector, a checkout that pushed size to step two on mobile, cost per acquisition at $150.92 and climbing, and a founder who read the paid social dashboard at face value every Monday. The plan looked busy on paper. The margin math looked thin on the P and L.
Our team rebuilt the ecommerce path around the five node stack. Rewrote the product page template with 8 to 12 images per SKU, garment measurements at the SKU level, and fit review pull quotes below the size selector. Moved size selection to first field at the top of the mobile checkout. Rebuilt the top 40 SKU catalog feed with lifestyle imagery and hand written titles. Turned on the seven core Klaviyo flows and a Attentive SMS list at week three. Server side tracking went in through Elevar in week two. Weekly Monday review meetings replaced the end of month post mortem, with the founder in the room and empowered to kill a campaign at week two.
Twelve months in, blended cost per acquisition dropped to $31. Conversion rate on the paid landing pages climbed 11 percent. Return rate on womenswear dropped from 38 percent to 26 percent. Day 90 repeat purchase rate grew from 22 percent to 41 percent. Managed ad budget grew to $650,000 monthly on the same margin profile. The result did not come from a magic new channel. It came from applying the five node stack, the checkout discipline, and the review cadence the plan required from day one.
The weekly review that keeps the plan honest
The Monday review meeting is where an apparel plan earns the right to keep spending. Forty five minutes, three agenda items, one decision. Read the reconciled dashboard. Review the top and bottom three ad creatives by cost per order. Decide whether the current campaign continues into next week, gets a creative pivot, or gets killed. The founder is invited and expected to make the kill decision when the numbers warrant it.
Every Monday review meeting eventually reaches the moment where somebody points at the flat performing creative and asks if the founder wants to give it one more week. The founder always says yes. The creative always underperforms for a second week. Nobody remembers who first suggested the extra week. Somewhere in the archive of every apparel brand shared drive, a flat creative is quietly generating more Monday meetings about itself than actual orders about anything on the site.
The kill rule is simple and it holds across every campaign archetype. Day 3 return on ad spend below 40 percent of target and day 7 return below 60 percent of target triggers a 24 hour creative pivot or a full kill. Programs that hold underperforming campaigns for the full run out of hope produce the flat quarters founders learn to fear. Programs that kill fast and reallocate to the winners produce the compounding quarters that make the retainer worth its rate. Founders new to structured plans assume the kill decision hurts the numbers. In practice, killing a flat creative at week two frees the budget to double down on the winner and grows the campaign result 20 to 45 percent inside the next 21 days on an apparel account.
Where fashion ecommerce marketing fits the wider stack
Fashion ecommerce marketing sits above the tactical channel work and below the annual brand strategy inside the growth stack. Every retainer allocation, every creative brief, and every founder decision on inventory rolls up to the five node plan the pod is running against. Programs that budget for tactics without the plan produce busy months with soft revenue. Programs that build the plan first produce quarters where every product page, every ad, and every email adds up to a single growth arc the founder can defend at a board meeting.
The retainer that runs the plan starts at $599 monthly on a 6 month contract and scales with revenue. The retainer covers merchandising audits, fit content templates, product page image direction, checkout audits, retention flow builds, weekly review meetings, and quarterly server side tracking audits. Founders scoping the wider agency side should also read our apparel fashion marketing hub for the broader deliverable list and pricing tiers by revenue band.
The retainer scales with revenue band, deliverable scope, and the number of active campaigns per quarter. A brand at $80,000 monthly runs a lean retainer with the founder in the review meeting. A brand at $600,000 monthly runs a fuller retainer with a dedicated pod and monthly media mix modeling reads. Every retainer tier ties back to the five node stack the plan requires, and every quarterly review closes the loop between the tactical channel work and the strategic growth arc the founder is defending on the P and L. Two outside reads worth an hour before the first plan cycle kicks off. Meta catalog quality reference above for feed hygiene. The Business of Fashion opinions section for the macro context that shapes which trends deserve budget in a given quarter on the merchandising side.
Return rate is the single margin killer on DTC apparel. Womenswear runs 22 to 30 percent, menswear 12 to 18 percent, accessories 6 to 10 percent. Two thirds of apparel returns cite fit or size as the reason. Fashion ecommerce marketing that ignores fit content spends the paid social budget twice on every return that goes back into inventory.
The plan builds a fit content stack on every SKU. Model height and size worn in the product description. Garment measurements at the SKU level, not the style level. Fit review notes pulled from customer reviews on a dedicated Fit tab. Size guides at the collection level with the actual measurement method photographed. Programs that publish the full fit stack on every SKU cut return rate 4 to 9 percentage points inside two quarters, which is the biggest margin move available in apparel without a supply chain change.
Where the fit content lives on the page
Fit content lives above the fold on desktop and inside the third scroll on mobile. The size chart lives one tap deep from the size selector, not three clicks deep behind a footer link. Fit review pull quotes live directly below the size selector so the buyer reads what the size chart says and what other buyers actually experienced in the same tap. That single change grows conversion rate 6 to 14 percent on apparel accounts we have tested inside 30 days, and it costs nothing in creative production because the copy already exists in the review corpus.
Fit tech worth funding
True Fit, Fit Analytics, and Bold Metrics carry the automated fit recommendation layer on scaled apparel programs. Each pulls buyer inputs (height, weight, common size in another brand) and recommends a size at add to cart. Return rate drops 3 to 7 percentage points on the SKUs where the tool is live and the buyer engages with the input flow. Below $250,000 monthly, the tool license outruns the return savings. Above $600,000 monthly, the math flips and the tool pays for itself inside a quarter.
Product page imagery inside fashion ecommerce marketing
Product page imagery is where a paid social click either converts or bounces inside eight seconds. The industry median product page ships four images per SKU. The winners ship eight to twelve, and every image answers a specific buyer question the paid ad already primed.
The imagery stack per SKU
A working stack per SKU carries model shot on size medium, model shot on size extra large or size fourteen so the buyer sees the fit at range, flat lay on a neutral ground for the utility view, detail shot on the fabric texture, detail shot on the hardware and stitching, back view on the model, side view on the model, movement clip of 4 to 8 seconds, and a scale shot next to a familiar object for accessories. Programs that publish all twelve image slots grow conversion rate 8 to 22 percent against the four image baseline, and Meta gets richer feed asset variants to test in the ad set.
Video that earns its production cost
Product page video works when it stays under 10 seconds, loops on autoplay, mutes by default, and shows movement the still shot cannot. Longer videos hurt page load and buyer patience without a conversion gain. A DTC apparel brand doing $340,000 monthly should budget $60,000 to $140,000 annually on product page video across the top 40 SKUs by contribution margin. Below that budget, the video shoot day math does not work and the founder ships either thin coverage on all SKUs or full coverage on the wrong ones. Shopify’s product photography guide is a useful outside read for founders scoping a first shoot.
Checkout inside fashion ecommerce marketing
Checkout on apparel carries a size selector as the first field, not the last. Programs that push size selection to a second step lose 4 to 9 percent conversion rate on the same traffic because the mobile buyer scrolls twice for a decision the desktop pattern buries. The mobile buyer decides in under six seconds whether the flow feels safe. Every friction point in that window costs margin.
The checkout structure that respects sizing
The size selector sits directly under the price, above the add to cart button. Sold out sizes stay visible with a strikethrough, not hidden, so the buyer reads the size chart against the availability without a filter reset. A restock notification input replaces the add to cart button on the sold out size. On mobile, the size selector expands into a tap sheet that shows the size chart and fit review pull quotes on the same swipe. That single pattern grows completed checkout rate 6 to 12 percent on apparel accounts we have measured inside 21 days of the deploy.
Shipping and returns copy at the payment step
Shipping thresholds, return windows, and exchange policy live inline at the payment step, not on a footer page. Apparel buyers who read the return policy at cart complete checkout 18 to 30 percent more often than buyers who never see it, and the return rate on those orders drops 2 to 5 percentage points because the buyer bought with the exchange window in mind. Founders who bury return policy on a footer link are trading the transparency dividend for a false conversion gain that costs margin on the back end.
Paid social inside fashion ecommerce marketing
Paid social carries 45 to 60 percent of first order revenue on DTC apparel between $80,000 and $600,000 monthly. Meta and TikTok are the two platforms that fund. Every other platform enters through a 90 day pilot with a hard kill date, not a slow bleed into the always on budget.
Creative velocity as the real budget
Paid social on apparel wins on creative velocity, not media budget. A brand shipping 6 to 12 fresh creative variants weekly across static, Reel, and TikTok formats produces 30 to 60 percent lower cost per order than the same brand shipping 2 to 3 variants weekly on the same media budget. Fashion audiences fatigue creative inside 5 to 9 days on the same face and product angle. The retainer needs to feed that fatigue rate, not fight it, and the creative production line has to run on a weekly cadence with a named producer.
The catalog feed that carries Shopping
Meta Advantage Plus Shopping and TikTok Shop pull directly from the Shopify product feed. Programs that let the feed run on default titles and default images produce 40 to 70 percent higher cost per order than programs that rewrite the top 40 SKU feed titles and swap the primary feed image to the highest performing lifestyle shot. Feed hygiene is the cheapest paid social gain available on an apparel account and the one most founders never open. Meta’s catalog quality reference covers the field level rules that shape delivery.
Retention inside fashion ecommerce marketing
Retention is the layer that decides whether the P and L runs on margin or grinds through paid acquisition to break even. A DTC apparel brand with a 30 percent day 90 repeat rate runs 20 to 35 percent more contribution margin per blended dollar of spend than the same brand at 15 percent. Retention is not one channel. It is a stack of email, SMS, loyalty, and post purchase content on a monthly calendar.
Email and SMS as the core
Email drives 25 to 35 percent of DTC apparel revenue when the flow set is complete. Welcome, browse abandonment, cart abandonment, post purchase, replenishment, VIP, and win back are the seven flows every brand needs live inside the first 90 days. SMS adds another 8 to 15 percent of revenue at a 5 to 12 percent list opt in rate. Klaviyo and Attentive dominate the DTC apparel tool stack because the two platforms handle 90 percent of the flow logic without custom development. Our what is fashion marketing primer covers how the retention layer plugs into the wider channel mix.
Post purchase content that grows LTV
Post purchase content covers the four weeks after delivery on a first order. Styling emails that pair the purchased SKU with three complementary pieces. A fit review request at day seven when the buyer has worn the garment twice. A community moment at day fourteen with user photos of the same SKU. A second order incentive at day 28 with a category adjacent recommendation. Programs that publish the full post purchase sequence grow lifetime value 22 to 45 percent by month twelve on the same first order cohort, and the retention layer starts to carry the revenue growth the paid team used to carry alone.
Benchmarks inside fashion ecommerce marketing
Benchmarks make the plan honest. A DTC apparel brand reads its own numbers against the industry median every quarter and acts on the gaps that show up. Conversion rate. Blended cost per order. Return rate. Repeat purchase rate. Email revenue share. Each has an honest median for the revenue band, and the numbers change slowly year over year.
| Revenue band | Conversion rate | Blended CPO | Return rate (womenswear) | Day 90 repeat rate | Email revenue share |
|---|---|---|---|---|---|
| Under $80K monthly | 1.2% to 1.8% | $38 to $54 | 26% to 34% | 10% to 18% | 18% to 26% |
| $80K to $250K monthly | 1.6% to 2.4% | $28 to $46 | 24% to 32% | 16% to 24% | 22% to 30% |
| $250K to $600K monthly | 2.0% to 2.8% | $22 to $38 | 22% to 30% | 22% to 32% | 26% to 34% |
| $600K to $1.5M monthly | 2.4% to 3.4% | $18 to $32 | 20% to 28% | 28% to 38% | 28% to 36% |
| Above $1.5M monthly | 2.8% to 4.0% | $16 to $28 | 18% to 26% | 32% to 45% | 30% to 38% |
A founder who reads a monthly dashboard against these benchmarks catches the drift inside 30 days and adjusts the plan before the quarter closes. A founder who reads only the paid social dashboard catches the drift 90 days late, which usually means the correction shows up in the next quarter revenue instead of the current one. That single reporting habit is the difference between an apparel plan that grows and an apparel plan that runs in place while the founder wonders what actually changed under the surface. Founders scoping the wider paid team should read our fashion marketing agency guide for the retainer scope that sits above these benchmark reads.
How do you measure fashion ecommerce marketing honestly
Honest measurement of fashion ecommerce marketing runs on four data streams reconciled inside one weekly dashboard. Shopify revenue by UTM and discount code. Google Analytics 4 sessions and assisted conversion. Meta and TikTok ads platform attribution. A post purchase survey on every order that asks where the buyer first saw the brand. Each stream lies on its own.
The single biggest reporting mistake is trusting Meta own return on ad spend number as the campaign result. Meta over reports by 30 to 90 percent on apparel accounts because the pixel double counts view through and click through revenue that would have converted anyway. Google Analytics 4 under reports because the model discounts paid social influence on longer consideration windows. Shopify tells the truth on first order revenue but nothing on assisted revenue. Post purchase surveys catch the audience that saw the campaign on TikTok, searched a week later, and bought through direct traffic. The four streams together reconcile inside a 5 to 8 percent margin on a well tagged apparel account. Google’s attribution model documentation is the source every founder should read before arguing about which number is correct.
Every plan reports campaign level revenue against the campaign level budget with a 7 day and 30 day view. Anything shorter than 7 days is noise on an apparel buying cycle. Anything longer than 30 days is too late to change the current campaign trajectory. The founder reads the dashboard once a week on Monday morning before the review meeting, not once at the end of the quarter when the numbers are already locked into a bad direction.
Fashion ecommerce marketing in production
Boogie Board came to our team with a DTC ecommerce program running the same problem most apparel brands run at $340,000 monthly. Product pages with four images per SKU, no fit content on the size selector, a checkout that pushed size to step two on mobile, cost per acquisition at $150.92 and climbing, and a founder who read the paid social dashboard at face value every Monday. The plan looked busy on paper. The margin math looked thin on the P and L.
Our team rebuilt the ecommerce path around the five node stack. Rewrote the product page template with 8 to 12 images per SKU, garment measurements at the SKU level, and fit review pull quotes below the size selector. Moved size selection to first field at the top of the mobile checkout. Rebuilt the top 40 SKU catalog feed with lifestyle imagery and hand written titles. Turned on the seven core Klaviyo flows and a Attentive SMS list at week three. Server side tracking went in through Elevar in week two. Weekly Monday review meetings replaced the end of month post mortem, with the founder in the room and empowered to kill a campaign at week two.
Twelve months in, blended cost per acquisition dropped to $31. Conversion rate on the paid landing pages climbed 11 percent. Return rate on womenswear dropped from 38 percent to 26 percent. Day 90 repeat purchase rate grew from 22 percent to 41 percent. Managed ad budget grew to $650,000 monthly on the same margin profile. The result did not come from a magic new channel. It came from applying the five node stack, the checkout discipline, and the review cadence the plan required from day one.
The weekly review that keeps the plan honest
The Monday review meeting is where an apparel plan earns the right to keep spending. Forty five minutes, three agenda items, one decision. Read the reconciled dashboard. Review the top and bottom three ad creatives by cost per order. Decide whether the current campaign continues into next week, gets a creative pivot, or gets killed. The founder is invited and expected to make the kill decision when the numbers warrant it.
Every Monday review meeting eventually reaches the moment where somebody points at the flat performing creative and asks if the founder wants to give it one more week. The founder always says yes. The creative always underperforms for a second week. Nobody remembers who first suggested the extra week. Somewhere in the archive of every apparel brand shared drive, a flat creative is quietly generating more Monday meetings about itself than actual orders about anything on the site.
The kill rule is simple and it holds across every campaign archetype. Day 3 return on ad spend below 40 percent of target and day 7 return below 60 percent of target triggers a 24 hour creative pivot or a full kill. Programs that hold underperforming campaigns for the full run out of hope produce the flat quarters founders learn to fear. Programs that kill fast and reallocate to the winners produce the compounding quarters that make the retainer worth its rate. Founders new to structured plans assume the kill decision hurts the numbers. In practice, killing a flat creative at week two frees the budget to double down on the winner and grows the campaign result 20 to 45 percent inside the next 21 days on an apparel account.
Where fashion ecommerce marketing fits the wider stack
Fashion ecommerce marketing sits above the tactical channel work and below the annual brand strategy inside the growth stack. Every retainer allocation, every creative brief, and every founder decision on inventory rolls up to the five node plan the pod is running against. Programs that budget for tactics without the plan produce busy months with soft revenue. Programs that build the plan first produce quarters where every product page, every ad, and every email adds up to a single growth arc the founder can defend at a board meeting.
The retainer that runs the plan starts at $599 monthly on a 6 month contract and scales with revenue. The retainer covers merchandising audits, fit content templates, product page image direction, checkout audits, retention flow builds, weekly review meetings, and quarterly server side tracking audits. Founders scoping the wider agency side should also read our apparel fashion marketing hub for the broader deliverable list and pricing tiers by revenue band.
The retainer scales with revenue band, deliverable scope, and the number of active campaigns per quarter. A brand at $80,000 monthly runs a lean retainer with the founder in the review meeting. A brand at $600,000 monthly runs a fuller retainer with a dedicated pod and monthly media mix modeling reads. Every retainer tier ties back to the five node stack the plan requires, and every quarterly review closes the loop between the tactical channel work and the strategic growth arc the founder is defending on the P and L. Two outside reads worth an hour before the first plan cycle kicks off. Meta catalog quality reference above for feed hygiene. The Business of Fashion opinions section for the macro context that shapes which trends deserve budget in a given quarter on the merchandising side.
Benchmarks make the plan honest. A DTC apparel brand reads its own numbers against the industry median every quarter and acts on the gaps that show up. Conversion rate. Blended cost per order. Return rate. Repeat purchase rate. Email revenue share. Each has an honest median for the revenue band, and the numbers change slowly year over year.
| Revenue band | Conversion rate | Blended CPO | Return rate (womenswear) | Day 90 repeat rate | Email revenue share |
|---|---|---|---|---|---|
| Under $80K monthly | 1.2% to 1.8% | $38 to $54 | 26% to 34% | 10% to 18% | 18% to 26% |
| $80K to $250K monthly | 1.6% to 2.4% | $28 to $46 | 24% to 32% | 16% to 24% | 22% to 30% |
| $250K to $600K monthly | 2.0% to 2.8% | $22 to $38 | 22% to 30% | 22% to 32% | 26% to 34% |
| $600K to $1.5M monthly | 2.4% to 3.4% | $18 to $32 | 20% to 28% | 28% to 38% | 28% to 36% |
| Above $1.5M monthly | 2.8% to 4.0% | $16 to $28 | 18% to 26% | 32% to 45% | 30% to 38% |
A founder who reads a monthly dashboard against these benchmarks catches the drift inside 30 days and adjusts the plan before the quarter closes. A founder who reads only the paid social dashboard catches the drift 90 days late, which usually means the correction shows up in the next quarter revenue instead of the current one. That single reporting habit is the difference between an apparel plan that grows and an apparel plan that runs in place while the founder wonders what actually changed under the surface. Founders scoping the wider paid team should read our fashion marketing agency guide for the retainer scope that sits above these benchmark reads.
How do you measure fashion ecommerce marketing honestly
Honest measurement of fashion ecommerce marketing runs on four data streams reconciled inside one weekly dashboard. Shopify revenue by UTM and discount code. Google Analytics 4 sessions and assisted conversion. Meta and TikTok ads platform attribution. A post purchase survey on every order that asks where the buyer first saw the brand. Each stream lies on its own.
The single biggest reporting mistake is trusting Meta own return on ad spend number as the campaign result. Meta over reports by 30 to 90 percent on apparel accounts because the pixel double counts view through and click through revenue that would have converted anyway. Google Analytics 4 under reports because the model discounts paid social influence on longer consideration windows. Shopify tells the truth on first order revenue but nothing on assisted revenue. Post purchase surveys catch the audience that saw the campaign on TikTok, searched a week later, and bought through direct traffic. The four streams together reconcile inside a 5 to 8 percent margin on a well tagged apparel account. Google’s attribution model documentation is the source every founder should read before arguing about which number is correct.
Every plan reports campaign level revenue against the campaign level budget with a 7 day and 30 day view. Anything shorter than 7 days is noise on an apparel buying cycle. Anything longer than 30 days is too late to change the current campaign trajectory. The founder reads the dashboard once a week on Monday morning before the review meeting, not once at the end of the quarter when the numbers are already locked into a bad direction.
Fashion ecommerce marketing in production
Boogie Board came to our team with a DTC ecommerce program running the same problem most apparel brands run at $340,000 monthly. Product pages with four images per SKU, no fit content on the size selector, a checkout that pushed size to step two on mobile, cost per acquisition at $150.92 and climbing, and a founder who read the paid social dashboard at face value every Monday. The plan looked busy on paper. The margin math looked thin on the P and L.
Our team rebuilt the ecommerce path around the five node stack. Rewrote the product page template with 8 to 12 images per SKU, garment measurements at the SKU level, and fit review pull quotes below the size selector. Moved size selection to first field at the top of the mobile checkout. Rebuilt the top 40 SKU catalog feed with lifestyle imagery and hand written titles. Turned on the seven core Klaviyo flows and a Attentive SMS list at week three. Server side tracking went in through Elevar in week two. Weekly Monday review meetings replaced the end of month post mortem, with the founder in the room and empowered to kill a campaign at week two.
Twelve months in, blended cost per acquisition dropped to $31. Conversion rate on the paid landing pages climbed 11 percent. Return rate on womenswear dropped from 38 percent to 26 percent. Day 90 repeat purchase rate grew from 22 percent to 41 percent. Managed ad budget grew to $650,000 monthly on the same margin profile. The result did not come from a magic new channel. It came from applying the five node stack, the checkout discipline, and the review cadence the plan required from day one.
The weekly review that keeps the plan honest
The Monday review meeting is where an apparel plan earns the right to keep spending. Forty five minutes, three agenda items, one decision. Read the reconciled dashboard. Review the top and bottom three ad creatives by cost per order. Decide whether the current campaign continues into next week, gets a creative pivot, or gets killed. The founder is invited and expected to make the kill decision when the numbers warrant it.
Every Monday review meeting eventually reaches the moment where somebody points at the flat performing creative and asks if the founder wants to give it one more week. The founder always says yes. The creative always underperforms for a second week. Nobody remembers who first suggested the extra week. Somewhere in the archive of every apparel brand shared drive, a flat creative is quietly generating more Monday meetings about itself than actual orders about anything on the site.
The kill rule is simple and it holds across every campaign archetype. Day 3 return on ad spend below 40 percent of target and day 7 return below 60 percent of target triggers a 24 hour creative pivot or a full kill. Programs that hold underperforming campaigns for the full run out of hope produce the flat quarters founders learn to fear. Programs that kill fast and reallocate to the winners produce the compounding quarters that make the retainer worth its rate. Founders new to structured plans assume the kill decision hurts the numbers. In practice, killing a flat creative at week two frees the budget to double down on the winner and grows the campaign result 20 to 45 percent inside the next 21 days on an apparel account.
Where fashion ecommerce marketing fits the wider stack
Fashion ecommerce marketing sits above the tactical channel work and below the annual brand strategy inside the growth stack. Every retainer allocation, every creative brief, and every founder decision on inventory rolls up to the five node plan the pod is running against. Programs that budget for tactics without the plan produce busy months with soft revenue. Programs that build the plan first produce quarters where every product page, every ad, and every email adds up to a single growth arc the founder can defend at a board meeting.
The retainer that runs the plan starts at $599 monthly on a 6 month contract and scales with revenue. The retainer covers merchandising audits, fit content templates, product page image direction, checkout audits, retention flow builds, weekly review meetings, and quarterly server side tracking audits. Founders scoping the wider agency side should also read our apparel fashion marketing hub for the broader deliverable list and pricing tiers by revenue band.
The retainer scales with revenue band, deliverable scope, and the number of active campaigns per quarter. A brand at $80,000 monthly runs a lean retainer with the founder in the review meeting. A brand at $600,000 monthly runs a fuller retainer with a dedicated pod and monthly media mix modeling reads. Every retainer tier ties back to the five node stack the plan requires, and every quarterly review closes the loop between the tactical channel work and the strategic growth arc the founder is defending on the P and L. Two outside reads worth an hour before the first plan cycle kicks off. Meta catalog quality reference above for feed hygiene. The Business of Fashion opinions section for the macro context that shapes which trends deserve budget in a given quarter on the merchandising side.
Retention is the layer that decides whether the P and L runs on margin or grinds through paid acquisition to break even. A DTC apparel brand with a 30 percent day 90 repeat rate runs 20 to 35 percent more contribution margin per blended dollar of spend than the same brand at 15 percent. Retention is not one channel. It is a stack of email, SMS, loyalty, and post purchase content on a monthly calendar.
Email and SMS as the core
Email drives 25 to 35 percent of DTC apparel revenue when the flow set is complete. Welcome, browse abandonment, cart abandonment, post purchase, replenishment, VIP, and win back are the seven flows every brand needs live inside the first 90 days. SMS adds another 8 to 15 percent of revenue at a 5 to 12 percent list opt in rate. Klaviyo and Attentive dominate the DTC apparel tool stack because the two platforms handle 90 percent of the flow logic without custom development. Our what is fashion marketing primer covers how the retention layer plugs into the wider channel mix.
Post purchase content that grows LTV
Post purchase content covers the four weeks after delivery on a first order. Styling emails that pair the purchased SKU with three complementary pieces. A fit review request at day seven when the buyer has worn the garment twice. A community moment at day fourteen with user photos of the same SKU. A second order incentive at day 28 with a category adjacent recommendation. Programs that publish the full post purchase sequence grow lifetime value 22 to 45 percent by month twelve on the same first order cohort, and the retention layer starts to carry the revenue growth the paid team used to carry alone.
Benchmarks inside fashion ecommerce marketing
Benchmarks make the plan honest. A DTC apparel brand reads its own numbers against the industry median every quarter and acts on the gaps that show up. Conversion rate. Blended cost per order. Return rate. Repeat purchase rate. Email revenue share. Each has an honest median for the revenue band, and the numbers change slowly year over year.
| Revenue band | Conversion rate | Blended CPO | Return rate (womenswear) | Day 90 repeat rate | Email revenue share |
|---|---|---|---|---|---|
| Under $80K monthly | 1.2% to 1.8% | $38 to $54 | 26% to 34% | 10% to 18% | 18% to 26% |
| $80K to $250K monthly | 1.6% to 2.4% | $28 to $46 | 24% to 32% | 16% to 24% | 22% to 30% |
| $250K to $600K monthly | 2.0% to 2.8% | $22 to $38 | 22% to 30% | 22% to 32% | 26% to 34% |
| $600K to $1.5M monthly | 2.4% to 3.4% | $18 to $32 | 20% to 28% | 28% to 38% | 28% to 36% |
| Above $1.5M monthly | 2.8% to 4.0% | $16 to $28 | 18% to 26% | 32% to 45% | 30% to 38% |
A founder who reads a monthly dashboard against these benchmarks catches the drift inside 30 days and adjusts the plan before the quarter closes. A founder who reads only the paid social dashboard catches the drift 90 days late, which usually means the correction shows up in the next quarter revenue instead of the current one. That single reporting habit is the difference between an apparel plan that grows and an apparel plan that runs in place while the founder wonders what actually changed under the surface. Founders scoping the wider paid team should read our fashion marketing agency guide for the retainer scope that sits above these benchmark reads.
How do you measure fashion ecommerce marketing honestly
Honest measurement of fashion ecommerce marketing runs on four data streams reconciled inside one weekly dashboard. Shopify revenue by UTM and discount code. Google Analytics 4 sessions and assisted conversion. Meta and TikTok ads platform attribution. A post purchase survey on every order that asks where the buyer first saw the brand. Each stream lies on its own.
The single biggest reporting mistake is trusting Meta own return on ad spend number as the campaign result. Meta over reports by 30 to 90 percent on apparel accounts because the pixel double counts view through and click through revenue that would have converted anyway. Google Analytics 4 under reports because the model discounts paid social influence on longer consideration windows. Shopify tells the truth on first order revenue but nothing on assisted revenue. Post purchase surveys catch the audience that saw the campaign on TikTok, searched a week later, and bought through direct traffic. The four streams together reconcile inside a 5 to 8 percent margin on a well tagged apparel account. Google’s attribution model documentation is the source every founder should read before arguing about which number is correct.
Every plan reports campaign level revenue against the campaign level budget with a 7 day and 30 day view. Anything shorter than 7 days is noise on an apparel buying cycle. Anything longer than 30 days is too late to change the current campaign trajectory. The founder reads the dashboard once a week on Monday morning before the review meeting, not once at the end of the quarter when the numbers are already locked into a bad direction.
Fashion ecommerce marketing in production
Boogie Board came to our team with a DTC ecommerce program running the same problem most apparel brands run at $340,000 monthly. Product pages with four images per SKU, no fit content on the size selector, a checkout that pushed size to step two on mobile, cost per acquisition at $150.92 and climbing, and a founder who read the paid social dashboard at face value every Monday. The plan looked busy on paper. The margin math looked thin on the P and L.
Our team rebuilt the ecommerce path around the five node stack. Rewrote the product page template with 8 to 12 images per SKU, garment measurements at the SKU level, and fit review pull quotes below the size selector. Moved size selection to first field at the top of the mobile checkout. Rebuilt the top 40 SKU catalog feed with lifestyle imagery and hand written titles. Turned on the seven core Klaviyo flows and a Attentive SMS list at week three. Server side tracking went in through Elevar in week two. Weekly Monday review meetings replaced the end of month post mortem, with the founder in the room and empowered to kill a campaign at week two.
Twelve months in, blended cost per acquisition dropped to $31. Conversion rate on the paid landing pages climbed 11 percent. Return rate on womenswear dropped from 38 percent to 26 percent. Day 90 repeat purchase rate grew from 22 percent to 41 percent. Managed ad budget grew to $650,000 monthly on the same margin profile. The result did not come from a magic new channel. It came from applying the five node stack, the checkout discipline, and the review cadence the plan required from day one.
The weekly review that keeps the plan honest
The Monday review meeting is where an apparel plan earns the right to keep spending. Forty five minutes, three agenda items, one decision. Read the reconciled dashboard. Review the top and bottom three ad creatives by cost per order. Decide whether the current campaign continues into next week, gets a creative pivot, or gets killed. The founder is invited and expected to make the kill decision when the numbers warrant it.
Every Monday review meeting eventually reaches the moment where somebody points at the flat performing creative and asks if the founder wants to give it one more week. The founder always says yes. The creative always underperforms for a second week. Nobody remembers who first suggested the extra week. Somewhere in the archive of every apparel brand shared drive, a flat creative is quietly generating more Monday meetings about itself than actual orders about anything on the site.
The kill rule is simple and it holds across every campaign archetype. Day 3 return on ad spend below 40 percent of target and day 7 return below 60 percent of target triggers a 24 hour creative pivot or a full kill. Programs that hold underperforming campaigns for the full run out of hope produce the flat quarters founders learn to fear. Programs that kill fast and reallocate to the winners produce the compounding quarters that make the retainer worth its rate. Founders new to structured plans assume the kill decision hurts the numbers. In practice, killing a flat creative at week two frees the budget to double down on the winner and grows the campaign result 20 to 45 percent inside the next 21 days on an apparel account.
Where fashion ecommerce marketing fits the wider stack
Fashion ecommerce marketing sits above the tactical channel work and below the annual brand strategy inside the growth stack. Every retainer allocation, every creative brief, and every founder decision on inventory rolls up to the five node plan the pod is running against. Programs that budget for tactics without the plan produce busy months with soft revenue. Programs that build the plan first produce quarters where every product page, every ad, and every email adds up to a single growth arc the founder can defend at a board meeting.
The retainer that runs the plan starts at $599 monthly on a 6 month contract and scales with revenue. The retainer covers merchandising audits, fit content templates, product page image direction, checkout audits, retention flow builds, weekly review meetings, and quarterly server side tracking audits. Founders scoping the wider agency side should also read our apparel fashion marketing hub for the broader deliverable list and pricing tiers by revenue band.
The retainer scales with revenue band, deliverable scope, and the number of active campaigns per quarter. A brand at $80,000 monthly runs a lean retainer with the founder in the review meeting. A brand at $600,000 monthly runs a fuller retainer with a dedicated pod and monthly media mix modeling reads. Every retainer tier ties back to the five node stack the plan requires, and every quarterly review closes the loop between the tactical channel work and the strategic growth arc the founder is defending on the P and L. Two outside reads worth an hour before the first plan cycle kicks off. Meta catalog quality reference above for feed hygiene. The Business of Fashion opinions section for the macro context that shapes which trends deserve budget in a given quarter on the merchandising side.
Paid social carries 45 to 60 percent of first order revenue on DTC apparel between $80,000 and $600,000 monthly. Meta and TikTok are the two platforms that fund. Every other platform enters through a 90 day pilot with a hard kill date, not a slow bleed into the always on budget.
Creative velocity as the real budget
Paid social on apparel wins on creative velocity, not media budget. A brand shipping 6 to 12 fresh creative variants weekly across static, Reel, and TikTok formats produces 30 to 60 percent lower cost per order than the same brand shipping 2 to 3 variants weekly on the same media budget. Fashion audiences fatigue creative inside 5 to 9 days on the same face and product angle. The retainer needs to feed that fatigue rate, not fight it, and the creative production line has to run on a weekly cadence with a named producer.
The catalog feed that carries Shopping
Meta Advantage Plus Shopping and TikTok Shop pull directly from the Shopify product feed. Programs that let the feed run on default titles and default images produce 40 to 70 percent higher cost per order than programs that rewrite the top 40 SKU feed titles and swap the primary feed image to the highest performing lifestyle shot. Feed hygiene is the cheapest paid social gain available on an apparel account and the one most founders never open. Meta’s catalog quality reference covers the field level rules that shape delivery.
Retention inside fashion ecommerce marketing
Retention is the layer that decides whether the P and L runs on margin or grinds through paid acquisition to break even. A DTC apparel brand with a 30 percent day 90 repeat rate runs 20 to 35 percent more contribution margin per blended dollar of spend than the same brand at 15 percent. Retention is not one channel. It is a stack of email, SMS, loyalty, and post purchase content on a monthly calendar.
Email and SMS as the core
Email drives 25 to 35 percent of DTC apparel revenue when the flow set is complete. Welcome, browse abandonment, cart abandonment, post purchase, replenishment, VIP, and win back are the seven flows every brand needs live inside the first 90 days. SMS adds another 8 to 15 percent of revenue at a 5 to 12 percent list opt in rate. Klaviyo and Attentive dominate the DTC apparel tool stack because the two platforms handle 90 percent of the flow logic without custom development. Our what is fashion marketing primer covers how the retention layer plugs into the wider channel mix.
Post purchase content that grows LTV
Post purchase content covers the four weeks after delivery on a first order. Styling emails that pair the purchased SKU with three complementary pieces. A fit review request at day seven when the buyer has worn the garment twice. A community moment at day fourteen with user photos of the same SKU. A second order incentive at day 28 with a category adjacent recommendation. Programs that publish the full post purchase sequence grow lifetime value 22 to 45 percent by month twelve on the same first order cohort, and the retention layer starts to carry the revenue growth the paid team used to carry alone.
Benchmarks inside fashion ecommerce marketing
Benchmarks make the plan honest. A DTC apparel brand reads its own numbers against the industry median every quarter and acts on the gaps that show up. Conversion rate. Blended cost per order. Return rate. Repeat purchase rate. Email revenue share. Each has an honest median for the revenue band, and the numbers change slowly year over year.
| Revenue band | Conversion rate | Blended CPO | Return rate (womenswear) | Day 90 repeat rate | Email revenue share |
|---|---|---|---|---|---|
| Under $80K monthly | 1.2% to 1.8% | $38 to $54 | 26% to 34% | 10% to 18% | 18% to 26% |
| $80K to $250K monthly | 1.6% to 2.4% | $28 to $46 | 24% to 32% | 16% to 24% | 22% to 30% |
| $250K to $600K monthly | 2.0% to 2.8% | $22 to $38 | 22% to 30% | 22% to 32% | 26% to 34% |
| $600K to $1.5M monthly | 2.4% to 3.4% | $18 to $32 | 20% to 28% | 28% to 38% | 28% to 36% |
| Above $1.5M monthly | 2.8% to 4.0% | $16 to $28 | 18% to 26% | 32% to 45% | 30% to 38% |
A founder who reads a monthly dashboard against these benchmarks catches the drift inside 30 days and adjusts the plan before the quarter closes. A founder who reads only the paid social dashboard catches the drift 90 days late, which usually means the correction shows up in the next quarter revenue instead of the current one. That single reporting habit is the difference between an apparel plan that grows and an apparel plan that runs in place while the founder wonders what actually changed under the surface. Founders scoping the wider paid team should read our fashion marketing agency guide for the retainer scope that sits above these benchmark reads.
How do you measure fashion ecommerce marketing honestly
Honest measurement of fashion ecommerce marketing runs on four data streams reconciled inside one weekly dashboard. Shopify revenue by UTM and discount code. Google Analytics 4 sessions and assisted conversion. Meta and TikTok ads platform attribution. A post purchase survey on every order that asks where the buyer first saw the brand. Each stream lies on its own.
The single biggest reporting mistake is trusting Meta own return on ad spend number as the campaign result. Meta over reports by 30 to 90 percent on apparel accounts because the pixel double counts view through and click through revenue that would have converted anyway. Google Analytics 4 under reports because the model discounts paid social influence on longer consideration windows. Shopify tells the truth on first order revenue but nothing on assisted revenue. Post purchase surveys catch the audience that saw the campaign on TikTok, searched a week later, and bought through direct traffic. The four streams together reconcile inside a 5 to 8 percent margin on a well tagged apparel account. Google’s attribution model documentation is the source every founder should read before arguing about which number is correct.
Every plan reports campaign level revenue against the campaign level budget with a 7 day and 30 day view. Anything shorter than 7 days is noise on an apparel buying cycle. Anything longer than 30 days is too late to change the current campaign trajectory. The founder reads the dashboard once a week on Monday morning before the review meeting, not once at the end of the quarter when the numbers are already locked into a bad direction.
Fashion ecommerce marketing in production
Boogie Board came to our team with a DTC ecommerce program running the same problem most apparel brands run at $340,000 monthly. Product pages with four images per SKU, no fit content on the size selector, a checkout that pushed size to step two on mobile, cost per acquisition at $150.92 and climbing, and a founder who read the paid social dashboard at face value every Monday. The plan looked busy on paper. The margin math looked thin on the P and L.
Our team rebuilt the ecommerce path around the five node stack. Rewrote the product page template with 8 to 12 images per SKU, garment measurements at the SKU level, and fit review pull quotes below the size selector. Moved size selection to first field at the top of the mobile checkout. Rebuilt the top 40 SKU catalog feed with lifestyle imagery and hand written titles. Turned on the seven core Klaviyo flows and a Attentive SMS list at week three. Server side tracking went in through Elevar in week two. Weekly Monday review meetings replaced the end of month post mortem, with the founder in the room and empowered to kill a campaign at week two.
Twelve months in, blended cost per acquisition dropped to $31. Conversion rate on the paid landing pages climbed 11 percent. Return rate on womenswear dropped from 38 percent to 26 percent. Day 90 repeat purchase rate grew from 22 percent to 41 percent. Managed ad budget grew to $650,000 monthly on the same margin profile. The result did not come from a magic new channel. It came from applying the five node stack, the checkout discipline, and the review cadence the plan required from day one.
The weekly review that keeps the plan honest
The Monday review meeting is where an apparel plan earns the right to keep spending. Forty five minutes, three agenda items, one decision. Read the reconciled dashboard. Review the top and bottom three ad creatives by cost per order. Decide whether the current campaign continues into next week, gets a creative pivot, or gets killed. The founder is invited and expected to make the kill decision when the numbers warrant it.
Every Monday review meeting eventually reaches the moment where somebody points at the flat performing creative and asks if the founder wants to give it one more week. The founder always says yes. The creative always underperforms for a second week. Nobody remembers who first suggested the extra week. Somewhere in the archive of every apparel brand shared drive, a flat creative is quietly generating more Monday meetings about itself than actual orders about anything on the site.
The kill rule is simple and it holds across every campaign archetype. Day 3 return on ad spend below 40 percent of target and day 7 return below 60 percent of target triggers a 24 hour creative pivot or a full kill. Programs that hold underperforming campaigns for the full run out of hope produce the flat quarters founders learn to fear. Programs that kill fast and reallocate to the winners produce the compounding quarters that make the retainer worth its rate. Founders new to structured plans assume the kill decision hurts the numbers. In practice, killing a flat creative at week two frees the budget to double down on the winner and grows the campaign result 20 to 45 percent inside the next 21 days on an apparel account.
Where fashion ecommerce marketing fits the wider stack
Fashion ecommerce marketing sits above the tactical channel work and below the annual brand strategy inside the growth stack. Every retainer allocation, every creative brief, and every founder decision on inventory rolls up to the five node plan the pod is running against. Programs that budget for tactics without the plan produce busy months with soft revenue. Programs that build the plan first produce quarters where every product page, every ad, and every email adds up to a single growth arc the founder can defend at a board meeting.
The retainer that runs the plan starts at $599 monthly on a 6 month contract and scales with revenue. The retainer covers merchandising audits, fit content templates, product page image direction, checkout audits, retention flow builds, weekly review meetings, and quarterly server side tracking audits. Founders scoping the wider agency side should also read our apparel fashion marketing hub for the broader deliverable list and pricing tiers by revenue band.
The retainer scales with revenue band, deliverable scope, and the number of active campaigns per quarter. A brand at $80,000 monthly runs a lean retainer with the founder in the review meeting. A brand at $600,000 monthly runs a fuller retainer with a dedicated pod and monthly media mix modeling reads. Every retainer tier ties back to the five node stack the plan requires, and every quarterly review closes the loop between the tactical channel work and the strategic growth arc the founder is defending on the P and L. Two outside reads worth an hour before the first plan cycle kicks off. Meta catalog quality reference above for feed hygiene. The Business of Fashion opinions section for the macro context that shapes which trends deserve budget in a given quarter on the merchandising side.
Checkout on apparel carries a size selector as the first field, not the last. Programs that push size selection to a second step lose 4 to 9 percent conversion rate on the same traffic because the mobile buyer scrolls twice for a decision the desktop pattern buries. The mobile buyer decides in under six seconds whether the flow feels safe. Every friction point in that window costs margin.
The checkout structure that respects sizing
The size selector sits directly under the price, above the add to cart button. Sold out sizes stay visible with a strikethrough, not hidden, so the buyer reads the size chart against the availability without a filter reset. A restock notification input replaces the add to cart button on the sold out size. On mobile, the size selector expands into a tap sheet that shows the size chart and fit review pull quotes on the same swipe. That single pattern grows completed checkout rate 6 to 12 percent on apparel accounts we have measured inside 21 days of the deploy.
Shipping and returns copy at the payment step
Shipping thresholds, return windows, and exchange policy live inline at the payment step, not on a footer page. Apparel buyers who read the return policy at cart complete checkout 18 to 30 percent more often than buyers who never see it, and the return rate on those orders drops 2 to 5 percentage points because the buyer bought with the exchange window in mind. Founders who bury return policy on a footer link are trading the transparency dividend for a false conversion gain that costs margin on the back end.
Paid social inside fashion ecommerce marketing
Paid social carries 45 to 60 percent of first order revenue on DTC apparel between $80,000 and $600,000 monthly. Meta and TikTok are the two platforms that fund. Every other platform enters through a 90 day pilot with a hard kill date, not a slow bleed into the always on budget.
Creative velocity as the real budget
Paid social on apparel wins on creative velocity, not media budget. A brand shipping 6 to 12 fresh creative variants weekly across static, Reel, and TikTok formats produces 30 to 60 percent lower cost per order than the same brand shipping 2 to 3 variants weekly on the same media budget. Fashion audiences fatigue creative inside 5 to 9 days on the same face and product angle. The retainer needs to feed that fatigue rate, not fight it, and the creative production line has to run on a weekly cadence with a named producer.
The catalog feed that carries Shopping
Meta Advantage Plus Shopping and TikTok Shop pull directly from the Shopify product feed. Programs that let the feed run on default titles and default images produce 40 to 70 percent higher cost per order than programs that rewrite the top 40 SKU feed titles and swap the primary feed image to the highest performing lifestyle shot. Feed hygiene is the cheapest paid social gain available on an apparel account and the one most founders never open. Meta’s catalog quality reference covers the field level rules that shape delivery.
Retention inside fashion ecommerce marketing
Retention is the layer that decides whether the P and L runs on margin or grinds through paid acquisition to break even. A DTC apparel brand with a 30 percent day 90 repeat rate runs 20 to 35 percent more contribution margin per blended dollar of spend than the same brand at 15 percent. Retention is not one channel. It is a stack of email, SMS, loyalty, and post purchase content on a monthly calendar.
Email and SMS as the core
Email drives 25 to 35 percent of DTC apparel revenue when the flow set is complete. Welcome, browse abandonment, cart abandonment, post purchase, replenishment, VIP, and win back are the seven flows every brand needs live inside the first 90 days. SMS adds another 8 to 15 percent of revenue at a 5 to 12 percent list opt in rate. Klaviyo and Attentive dominate the DTC apparel tool stack because the two platforms handle 90 percent of the flow logic without custom development. Our what is fashion marketing primer covers how the retention layer plugs into the wider channel mix.
Post purchase content that grows LTV
Post purchase content covers the four weeks after delivery on a first order. Styling emails that pair the purchased SKU with three complementary pieces. A fit review request at day seven when the buyer has worn the garment twice. A community moment at day fourteen with user photos of the same SKU. A second order incentive at day 28 with a category adjacent recommendation. Programs that publish the full post purchase sequence grow lifetime value 22 to 45 percent by month twelve on the same first order cohort, and the retention layer starts to carry the revenue growth the paid team used to carry alone.
Benchmarks inside fashion ecommerce marketing
Benchmarks make the plan honest. A DTC apparel brand reads its own numbers against the industry median every quarter and acts on the gaps that show up. Conversion rate. Blended cost per order. Return rate. Repeat purchase rate. Email revenue share. Each has an honest median for the revenue band, and the numbers change slowly year over year.
| Revenue band | Conversion rate | Blended CPO | Return rate (womenswear) | Day 90 repeat rate | Email revenue share |
|---|---|---|---|---|---|
| Under $80K monthly | 1.2% to 1.8% | $38 to $54 | 26% to 34% | 10% to 18% | 18% to 26% |
| $80K to $250K monthly | 1.6% to 2.4% | $28 to $46 | 24% to 32% | 16% to 24% | 22% to 30% |
| $250K to $600K monthly | 2.0% to 2.8% | $22 to $38 | 22% to 30% | 22% to 32% | 26% to 34% |
| $600K to $1.5M monthly | 2.4% to 3.4% | $18 to $32 | 20% to 28% | 28% to 38% | 28% to 36% |
| Above $1.5M monthly | 2.8% to 4.0% | $16 to $28 | 18% to 26% | 32% to 45% | 30% to 38% |
A founder who reads a monthly dashboard against these benchmarks catches the drift inside 30 days and adjusts the plan before the quarter closes. A founder who reads only the paid social dashboard catches the drift 90 days late, which usually means the correction shows up in the next quarter revenue instead of the current one. That single reporting habit is the difference between an apparel plan that grows and an apparel plan that runs in place while the founder wonders what actually changed under the surface. Founders scoping the wider paid team should read our fashion marketing agency guide for the retainer scope that sits above these benchmark reads.
How do you measure fashion ecommerce marketing honestly
Honest measurement of fashion ecommerce marketing runs on four data streams reconciled inside one weekly dashboard. Shopify revenue by UTM and discount code. Google Analytics 4 sessions and assisted conversion. Meta and TikTok ads platform attribution. A post purchase survey on every order that asks where the buyer first saw the brand. Each stream lies on its own.
The single biggest reporting mistake is trusting Meta own return on ad spend number as the campaign result. Meta over reports by 30 to 90 percent on apparel accounts because the pixel double counts view through and click through revenue that would have converted anyway. Google Analytics 4 under reports because the model discounts paid social influence on longer consideration windows. Shopify tells the truth on first order revenue but nothing on assisted revenue. Post purchase surveys catch the audience that saw the campaign on TikTok, searched a week later, and bought through direct traffic. The four streams together reconcile inside a 5 to 8 percent margin on a well tagged apparel account. Google’s attribution model documentation is the source every founder should read before arguing about which number is correct.
Every plan reports campaign level revenue against the campaign level budget with a 7 day and 30 day view. Anything shorter than 7 days is noise on an apparel buying cycle. Anything longer than 30 days is too late to change the current campaign trajectory. The founder reads the dashboard once a week on Monday morning before the review meeting, not once at the end of the quarter when the numbers are already locked into a bad direction.
Fashion ecommerce marketing in production
Boogie Board came to our team with a DTC ecommerce program running the same problem most apparel brands run at $340,000 monthly. Product pages with four images per SKU, no fit content on the size selector, a checkout that pushed size to step two on mobile, cost per acquisition at $150.92 and climbing, and a founder who read the paid social dashboard at face value every Monday. The plan looked busy on paper. The margin math looked thin on the P and L.
Our team rebuilt the ecommerce path around the five node stack. Rewrote the product page template with 8 to 12 images per SKU, garment measurements at the SKU level, and fit review pull quotes below the size selector. Moved size selection to first field at the top of the mobile checkout. Rebuilt the top 40 SKU catalog feed with lifestyle imagery and hand written titles. Turned on the seven core Klaviyo flows and a Attentive SMS list at week three. Server side tracking went in through Elevar in week two. Weekly Monday review meetings replaced the end of month post mortem, with the founder in the room and empowered to kill a campaign at week two.
Twelve months in, blended cost per acquisition dropped to $31. Conversion rate on the paid landing pages climbed 11 percent. Return rate on womenswear dropped from 38 percent to 26 percent. Day 90 repeat purchase rate grew from 22 percent to 41 percent. Managed ad budget grew to $650,000 monthly on the same margin profile. The result did not come from a magic new channel. It came from applying the five node stack, the checkout discipline, and the review cadence the plan required from day one.
The weekly review that keeps the plan honest
The Monday review meeting is where an apparel plan earns the right to keep spending. Forty five minutes, three agenda items, one decision. Read the reconciled dashboard. Review the top and bottom three ad creatives by cost per order. Decide whether the current campaign continues into next week, gets a creative pivot, or gets killed. The founder is invited and expected to make the kill decision when the numbers warrant it.
Every Monday review meeting eventually reaches the moment where somebody points at the flat performing creative and asks if the founder wants to give it one more week. The founder always says yes. The creative always underperforms for a second week. Nobody remembers who first suggested the extra week. Somewhere in the archive of every apparel brand shared drive, a flat creative is quietly generating more Monday meetings about itself than actual orders about anything on the site.
The kill rule is simple and it holds across every campaign archetype. Day 3 return on ad spend below 40 percent of target and day 7 return below 60 percent of target triggers a 24 hour creative pivot or a full kill. Programs that hold underperforming campaigns for the full run out of hope produce the flat quarters founders learn to fear. Programs that kill fast and reallocate to the winners produce the compounding quarters that make the retainer worth its rate. Founders new to structured plans assume the kill decision hurts the numbers. In practice, killing a flat creative at week two frees the budget to double down on the winner and grows the campaign result 20 to 45 percent inside the next 21 days on an apparel account.
Where fashion ecommerce marketing fits the wider stack
Fashion ecommerce marketing sits above the tactical channel work and below the annual brand strategy inside the growth stack. Every retainer allocation, every creative brief, and every founder decision on inventory rolls up to the five node plan the pod is running against. Programs that budget for tactics without the plan produce busy months with soft revenue. Programs that build the plan first produce quarters where every product page, every ad, and every email adds up to a single growth arc the founder can defend at a board meeting.
The retainer that runs the plan starts at $599 monthly on a 6 month contract and scales with revenue. The retainer covers merchandising audits, fit content templates, product page image direction, checkout audits, retention flow builds, weekly review meetings, and quarterly server side tracking audits. Founders scoping the wider agency side should also read our apparel fashion marketing hub for the broader deliverable list and pricing tiers by revenue band.
The retainer scales with revenue band, deliverable scope, and the number of active campaigns per quarter. A brand at $80,000 monthly runs a lean retainer with the founder in the review meeting. A brand at $600,000 monthly runs a fuller retainer with a dedicated pod and monthly media mix modeling reads. Every retainer tier ties back to the five node stack the plan requires, and every quarterly review closes the loop between the tactical channel work and the strategic growth arc the founder is defending on the P and L. Two outside reads worth an hour before the first plan cycle kicks off. Meta catalog quality reference above for feed hygiene. The Business of Fashion opinions section for the macro context that shapes which trends deserve budget in a given quarter on the merchandising side.
Product page imagery is where a paid social click either converts or bounces inside eight seconds. The industry median product page ships four images per SKU. The winners ship eight to twelve, and every image answers a specific buyer question the paid ad already primed.
The imagery stack per SKU
A working stack per SKU carries model shot on size medium, model shot on size extra large or size fourteen so the buyer sees the fit at range, flat lay on a neutral ground for the utility view, detail shot on the fabric texture, detail shot on the hardware and stitching, back view on the model, side view on the model, movement clip of 4 to 8 seconds, and a scale shot next to a familiar object for accessories. Programs that publish all twelve image slots grow conversion rate 8 to 22 percent against the four image baseline, and Meta gets richer feed asset variants to test in the ad set.
Video that earns its production cost
Product page video works when it stays under 10 seconds, loops on autoplay, mutes by default, and shows movement the still shot cannot. Longer videos hurt page load and buyer patience without a conversion gain. A DTC apparel brand doing $340,000 monthly should budget $60,000 to $140,000 annually on product page video across the top 40 SKUs by contribution margin. Below that budget, the video shoot day math does not work and the founder ships either thin coverage on all SKUs or full coverage on the wrong ones. Shopify’s product photography guide is a useful outside read for founders scoping a first shoot.
Checkout inside fashion ecommerce marketing
Checkout on apparel carries a size selector as the first field, not the last. Programs that push size selection to a second step lose 4 to 9 percent conversion rate on the same traffic because the mobile buyer scrolls twice for a decision the desktop pattern buries. The mobile buyer decides in under six seconds whether the flow feels safe. Every friction point in that window costs margin.
The checkout structure that respects sizing
The size selector sits directly under the price, above the add to cart button. Sold out sizes stay visible with a strikethrough, not hidden, so the buyer reads the size chart against the availability without a filter reset. A restock notification input replaces the add to cart button on the sold out size. On mobile, the size selector expands into a tap sheet that shows the size chart and fit review pull quotes on the same swipe. That single pattern grows completed checkout rate 6 to 12 percent on apparel accounts we have measured inside 21 days of the deploy.
Shipping and returns copy at the payment step
Shipping thresholds, return windows, and exchange policy live inline at the payment step, not on a footer page. Apparel buyers who read the return policy at cart complete checkout 18 to 30 percent more often than buyers who never see it, and the return rate on those orders drops 2 to 5 percentage points because the buyer bought with the exchange window in mind. Founders who bury return policy on a footer link are trading the transparency dividend for a false conversion gain that costs margin on the back end.
Paid social inside fashion ecommerce marketing
Paid social carries 45 to 60 percent of first order revenue on DTC apparel between $80,000 and $600,000 monthly. Meta and TikTok are the two platforms that fund. Every other platform enters through a 90 day pilot with a hard kill date, not a slow bleed into the always on budget.
Creative velocity as the real budget
Paid social on apparel wins on creative velocity, not media budget. A brand shipping 6 to 12 fresh creative variants weekly across static, Reel, and TikTok formats produces 30 to 60 percent lower cost per order than the same brand shipping 2 to 3 variants weekly on the same media budget. Fashion audiences fatigue creative inside 5 to 9 days on the same face and product angle. The retainer needs to feed that fatigue rate, not fight it, and the creative production line has to run on a weekly cadence with a named producer.
The catalog feed that carries Shopping
Meta Advantage Plus Shopping and TikTok Shop pull directly from the Shopify product feed. Programs that let the feed run on default titles and default images produce 40 to 70 percent higher cost per order than programs that rewrite the top 40 SKU feed titles and swap the primary feed image to the highest performing lifestyle shot. Feed hygiene is the cheapest paid social gain available on an apparel account and the one most founders never open. Meta’s catalog quality reference covers the field level rules that shape delivery.
Retention inside fashion ecommerce marketing
Retention is the layer that decides whether the P and L runs on margin or grinds through paid acquisition to break even. A DTC apparel brand with a 30 percent day 90 repeat rate runs 20 to 35 percent more contribution margin per blended dollar of spend than the same brand at 15 percent. Retention is not one channel. It is a stack of email, SMS, loyalty, and post purchase content on a monthly calendar.
Email and SMS as the core
Email drives 25 to 35 percent of DTC apparel revenue when the flow set is complete. Welcome, browse abandonment, cart abandonment, post purchase, replenishment, VIP, and win back are the seven flows every brand needs live inside the first 90 days. SMS adds another 8 to 15 percent of revenue at a 5 to 12 percent list opt in rate. Klaviyo and Attentive dominate the DTC apparel tool stack because the two platforms handle 90 percent of the flow logic without custom development. Our what is fashion marketing primer covers how the retention layer plugs into the wider channel mix.
Post purchase content that grows LTV
Post purchase content covers the four weeks after delivery on a first order. Styling emails that pair the purchased SKU with three complementary pieces. A fit review request at day seven when the buyer has worn the garment twice. A community moment at day fourteen with user photos of the same SKU. A second order incentive at day 28 with a category adjacent recommendation. Programs that publish the full post purchase sequence grow lifetime value 22 to 45 percent by month twelve on the same first order cohort, and the retention layer starts to carry the revenue growth the paid team used to carry alone.
Benchmarks inside fashion ecommerce marketing
Benchmarks make the plan honest. A DTC apparel brand reads its own numbers against the industry median every quarter and acts on the gaps that show up. Conversion rate. Blended cost per order. Return rate. Repeat purchase rate. Email revenue share. Each has an honest median for the revenue band, and the numbers change slowly year over year.
| Revenue band | Conversion rate | Blended CPO | Return rate (womenswear) | Day 90 repeat rate | Email revenue share |
|---|---|---|---|---|---|
| Under $80K monthly | 1.2% to 1.8% | $38 to $54 | 26% to 34% | 10% to 18% | 18% to 26% |
| $80K to $250K monthly | 1.6% to 2.4% | $28 to $46 | 24% to 32% | 16% to 24% | 22% to 30% |
| $250K to $600K monthly | 2.0% to 2.8% | $22 to $38 | 22% to 30% | 22% to 32% | 26% to 34% |
| $600K to $1.5M monthly | 2.4% to 3.4% | $18 to $32 | 20% to 28% | 28% to 38% | 28% to 36% |
| Above $1.5M monthly | 2.8% to 4.0% | $16 to $28 | 18% to 26% | 32% to 45% | 30% to 38% |
A founder who reads a monthly dashboard against these benchmarks catches the drift inside 30 days and adjusts the plan before the quarter closes. A founder who reads only the paid social dashboard catches the drift 90 days late, which usually means the correction shows up in the next quarter revenue instead of the current one. That single reporting habit is the difference between an apparel plan that grows and an apparel plan that runs in place while the founder wonders what actually changed under the surface. Founders scoping the wider paid team should read our fashion marketing agency guide for the retainer scope that sits above these benchmark reads.
How do you measure fashion ecommerce marketing honestly
Honest measurement of fashion ecommerce marketing runs on four data streams reconciled inside one weekly dashboard. Shopify revenue by UTM and discount code. Google Analytics 4 sessions and assisted conversion. Meta and TikTok ads platform attribution. A post purchase survey on every order that asks where the buyer first saw the brand. Each stream lies on its own.
The single biggest reporting mistake is trusting Meta own return on ad spend number as the campaign result. Meta over reports by 30 to 90 percent on apparel accounts because the pixel double counts view through and click through revenue that would have converted anyway. Google Analytics 4 under reports because the model discounts paid social influence on longer consideration windows. Shopify tells the truth on first order revenue but nothing on assisted revenue. Post purchase surveys catch the audience that saw the campaign on TikTok, searched a week later, and bought through direct traffic. The four streams together reconcile inside a 5 to 8 percent margin on a well tagged apparel account. Google’s attribution model documentation is the source every founder should read before arguing about which number is correct.
Every plan reports campaign level revenue against the campaign level budget with a 7 day and 30 day view. Anything shorter than 7 days is noise on an apparel buying cycle. Anything longer than 30 days is too late to change the current campaign trajectory. The founder reads the dashboard once a week on Monday morning before the review meeting, not once at the end of the quarter when the numbers are already locked into a bad direction.
Fashion ecommerce marketing in production
Boogie Board came to our team with a DTC ecommerce program running the same problem most apparel brands run at $340,000 monthly. Product pages with four images per SKU, no fit content on the size selector, a checkout that pushed size to step two on mobile, cost per acquisition at $150.92 and climbing, and a founder who read the paid social dashboard at face value every Monday. The plan looked busy on paper. The margin math looked thin on the P and L.
Our team rebuilt the ecommerce path around the five node stack. Rewrote the product page template with 8 to 12 images per SKU, garment measurements at the SKU level, and fit review pull quotes below the size selector. Moved size selection to first field at the top of the mobile checkout. Rebuilt the top 40 SKU catalog feed with lifestyle imagery and hand written titles. Turned on the seven core Klaviyo flows and a Attentive SMS list at week three. Server side tracking went in through Elevar in week two. Weekly Monday review meetings replaced the end of month post mortem, with the founder in the room and empowered to kill a campaign at week two.
Twelve months in, blended cost per acquisition dropped to $31. Conversion rate on the paid landing pages climbed 11 percent. Return rate on womenswear dropped from 38 percent to 26 percent. Day 90 repeat purchase rate grew from 22 percent to 41 percent. Managed ad budget grew to $650,000 monthly on the same margin profile. The result did not come from a magic new channel. It came from applying the five node stack, the checkout discipline, and the review cadence the plan required from day one.
The weekly review that keeps the plan honest
The Monday review meeting is where an apparel plan earns the right to keep spending. Forty five minutes, three agenda items, one decision. Read the reconciled dashboard. Review the top and bottom three ad creatives by cost per order. Decide whether the current campaign continues into next week, gets a creative pivot, or gets killed. The founder is invited and expected to make the kill decision when the numbers warrant it.
Every Monday review meeting eventually reaches the moment where somebody points at the flat performing creative and asks if the founder wants to give it one more week. The founder always says yes. The creative always underperforms for a second week. Nobody remembers who first suggested the extra week. Somewhere in the archive of every apparel brand shared drive, a flat creative is quietly generating more Monday meetings about itself than actual orders about anything on the site.
The kill rule is simple and it holds across every campaign archetype. Day 3 return on ad spend below 40 percent of target and day 7 return below 60 percent of target triggers a 24 hour creative pivot or a full kill. Programs that hold underperforming campaigns for the full run out of hope produce the flat quarters founders learn to fear. Programs that kill fast and reallocate to the winners produce the compounding quarters that make the retainer worth its rate. Founders new to structured plans assume the kill decision hurts the numbers. In practice, killing a flat creative at week two frees the budget to double down on the winner and grows the campaign result 20 to 45 percent inside the next 21 days on an apparel account.
Where fashion ecommerce marketing fits the wider stack
Fashion ecommerce marketing sits above the tactical channel work and below the annual brand strategy inside the growth stack. Every retainer allocation, every creative brief, and every founder decision on inventory rolls up to the five node plan the pod is running against. Programs that budget for tactics without the plan produce busy months with soft revenue. Programs that build the plan first produce quarters where every product page, every ad, and every email adds up to a single growth arc the founder can defend at a board meeting.
The retainer that runs the plan starts at $599 monthly on a 6 month contract and scales with revenue. The retainer covers merchandising audits, fit content templates, product page image direction, checkout audits, retention flow builds, weekly review meetings, and quarterly server side tracking audits. Founders scoping the wider agency side should also read our apparel fashion marketing hub for the broader deliverable list and pricing tiers by revenue band.
The retainer scales with revenue band, deliverable scope, and the number of active campaigns per quarter. A brand at $80,000 monthly runs a lean retainer with the founder in the review meeting. A brand at $600,000 monthly runs a fuller retainer with a dedicated pod and monthly media mix modeling reads. Every retainer tier ties back to the five node stack the plan requires, and every quarterly review closes the loop between the tactical channel work and the strategic growth arc the founder is defending on the P and L. Two outside reads worth an hour before the first plan cycle kicks off. Meta catalog quality reference above for feed hygiene. The Business of Fashion opinions section for the macro context that shapes which trends deserve budget in a given quarter on the merchandising side.
Return rate is the single margin killer on DTC apparel. Womenswear runs 22 to 30 percent, menswear 12 to 18 percent, accessories 6 to 10 percent. Two thirds of apparel returns cite fit or size as the reason. Fashion ecommerce marketing that ignores fit content spends the paid social budget twice on every return that goes back into inventory.
The plan builds a fit content stack on every SKU. Model height and size worn in the product description. Garment measurements at the SKU level, not the style level. Fit review notes pulled from customer reviews on a dedicated Fit tab. Size guides at the collection level with the actual measurement method photographed. Programs that publish the full fit stack on every SKU cut return rate 4 to 9 percentage points inside two quarters, which is the biggest margin move available in apparel without a supply chain change.
Where the fit content lives on the page
Fit content lives above the fold on desktop and inside the third scroll on mobile. The size chart lives one tap deep from the size selector, not three clicks deep behind a footer link. Fit review pull quotes live directly below the size selector so the buyer reads what the size chart says and what other buyers actually experienced in the same tap. That single change grows conversion rate 6 to 14 percent on apparel accounts we have tested inside 30 days, and it costs nothing in creative production because the copy already exists in the review corpus.
Fit tech worth funding
True Fit, Fit Analytics, and Bold Metrics carry the automated fit recommendation layer on scaled apparel programs. Each pulls buyer inputs (height, weight, common size in another brand) and recommends a size at add to cart. Return rate drops 3 to 7 percentage points on the SKUs where the tool is live and the buyer engages with the input flow. Below $250,000 monthly, the tool license outruns the return savings. Above $600,000 monthly, the math flips and the tool pays for itself inside a quarter.
Product page imagery inside fashion ecommerce marketing
Product page imagery is where a paid social click either converts or bounces inside eight seconds. The industry median product page ships four images per SKU. The winners ship eight to twelve, and every image answers a specific buyer question the paid ad already primed.
The imagery stack per SKU
A working stack per SKU carries model shot on size medium, model shot on size extra large or size fourteen so the buyer sees the fit at range, flat lay on a neutral ground for the utility view, detail shot on the fabric texture, detail shot on the hardware and stitching, back view on the model, side view on the model, movement clip of 4 to 8 seconds, and a scale shot next to a familiar object for accessories. Programs that publish all twelve image slots grow conversion rate 8 to 22 percent against the four image baseline, and Meta gets richer feed asset variants to test in the ad set.
Video that earns its production cost
Product page video works when it stays under 10 seconds, loops on autoplay, mutes by default, and shows movement the still shot cannot. Longer videos hurt page load and buyer patience without a conversion gain. A DTC apparel brand doing $340,000 monthly should budget $60,000 to $140,000 annually on product page video across the top 40 SKUs by contribution margin. Below that budget, the video shoot day math does not work and the founder ships either thin coverage on all SKUs or full coverage on the wrong ones. Shopify’s product photography guide is a useful outside read for founders scoping a first shoot.
Checkout inside fashion ecommerce marketing
Checkout on apparel carries a size selector as the first field, not the last. Programs that push size selection to a second step lose 4 to 9 percent conversion rate on the same traffic because the mobile buyer scrolls twice for a decision the desktop pattern buries. The mobile buyer decides in under six seconds whether the flow feels safe. Every friction point in that window costs margin.
The checkout structure that respects sizing
The size selector sits directly under the price, above the add to cart button. Sold out sizes stay visible with a strikethrough, not hidden, so the buyer reads the size chart against the availability without a filter reset. A restock notification input replaces the add to cart button on the sold out size. On mobile, the size selector expands into a tap sheet that shows the size chart and fit review pull quotes on the same swipe. That single pattern grows completed checkout rate 6 to 12 percent on apparel accounts we have measured inside 21 days of the deploy.
Shipping and returns copy at the payment step
Shipping thresholds, return windows, and exchange policy live inline at the payment step, not on a footer page. Apparel buyers who read the return policy at cart complete checkout 18 to 30 percent more often than buyers who never see it, and the return rate on those orders drops 2 to 5 percentage points because the buyer bought with the exchange window in mind. Founders who bury return policy on a footer link are trading the transparency dividend for a false conversion gain that costs margin on the back end.
Paid social inside fashion ecommerce marketing
Paid social carries 45 to 60 percent of first order revenue on DTC apparel between $80,000 and $600,000 monthly. Meta and TikTok are the two platforms that fund. Every other platform enters through a 90 day pilot with a hard kill date, not a slow bleed into the always on budget.
Creative velocity as the real budget
Paid social on apparel wins on creative velocity, not media budget. A brand shipping 6 to 12 fresh creative variants weekly across static, Reel, and TikTok formats produces 30 to 60 percent lower cost per order than the same brand shipping 2 to 3 variants weekly on the same media budget. Fashion audiences fatigue creative inside 5 to 9 days on the same face and product angle. The retainer needs to feed that fatigue rate, not fight it, and the creative production line has to run on a weekly cadence with a named producer.
The catalog feed that carries Shopping
Meta Advantage Plus Shopping and TikTok Shop pull directly from the Shopify product feed. Programs that let the feed run on default titles and default images produce 40 to 70 percent higher cost per order than programs that rewrite the top 40 SKU feed titles and swap the primary feed image to the highest performing lifestyle shot. Feed hygiene is the cheapest paid social gain available on an apparel account and the one most founders never open. Meta’s catalog quality reference covers the field level rules that shape delivery.
Retention inside fashion ecommerce marketing
Retention is the layer that decides whether the P and L runs on margin or grinds through paid acquisition to break even. A DTC apparel brand with a 30 percent day 90 repeat rate runs 20 to 35 percent more contribution margin per blended dollar of spend than the same brand at 15 percent. Retention is not one channel. It is a stack of email, SMS, loyalty, and post purchase content on a monthly calendar.
Email and SMS as the core
Email drives 25 to 35 percent of DTC apparel revenue when the flow set is complete. Welcome, browse abandonment, cart abandonment, post purchase, replenishment, VIP, and win back are the seven flows every brand needs live inside the first 90 days. SMS adds another 8 to 15 percent of revenue at a 5 to 12 percent list opt in rate. Klaviyo and Attentive dominate the DTC apparel tool stack because the two platforms handle 90 percent of the flow logic without custom development. Our what is fashion marketing primer covers how the retention layer plugs into the wider channel mix.
Post purchase content that grows LTV
Post purchase content covers the four weeks after delivery on a first order. Styling emails that pair the purchased SKU with three complementary pieces. A fit review request at day seven when the buyer has worn the garment twice. A community moment at day fourteen with user photos of the same SKU. A second order incentive at day 28 with a category adjacent recommendation. Programs that publish the full post purchase sequence grow lifetime value 22 to 45 percent by month twelve on the same first order cohort, and the retention layer starts to carry the revenue growth the paid team used to carry alone.
Benchmarks inside fashion ecommerce marketing
Benchmarks make the plan honest. A DTC apparel brand reads its own numbers against the industry median every quarter and acts on the gaps that show up. Conversion rate. Blended cost per order. Return rate. Repeat purchase rate. Email revenue share. Each has an honest median for the revenue band, and the numbers change slowly year over year.
| Revenue band | Conversion rate | Blended CPO | Return rate (womenswear) | Day 90 repeat rate | Email revenue share |
|---|---|---|---|---|---|
| Under $80K monthly | 1.2% to 1.8% | $38 to $54 | 26% to 34% | 10% to 18% | 18% to 26% |
| $80K to $250K monthly | 1.6% to 2.4% | $28 to $46 | 24% to 32% | 16% to 24% | 22% to 30% |
| $250K to $600K monthly | 2.0% to 2.8% | $22 to $38 | 22% to 30% | 22% to 32% | 26% to 34% |
| $600K to $1.5M monthly | 2.4% to 3.4% | $18 to $32 | 20% to 28% | 28% to 38% | 28% to 36% |
| Above $1.5M monthly | 2.8% to 4.0% | $16 to $28 | 18% to 26% | 32% to 45% | 30% to 38% |
A founder who reads a monthly dashboard against these benchmarks catches the drift inside 30 days and adjusts the plan before the quarter closes. A founder who reads only the paid social dashboard catches the drift 90 days late, which usually means the correction shows up in the next quarter revenue instead of the current one. That single reporting habit is the difference between an apparel plan that grows and an apparel plan that runs in place while the founder wonders what actually changed under the surface. Founders scoping the wider paid team should read our fashion marketing agency guide for the retainer scope that sits above these benchmark reads.
How do you measure fashion ecommerce marketing honestly
Honest measurement of fashion ecommerce marketing runs on four data streams reconciled inside one weekly dashboard. Shopify revenue by UTM and discount code. Google Analytics 4 sessions and assisted conversion. Meta and TikTok ads platform attribution. A post purchase survey on every order that asks where the buyer first saw the brand. Each stream lies on its own.
The single biggest reporting mistake is trusting Meta own return on ad spend number as the campaign result. Meta over reports by 30 to 90 percent on apparel accounts because the pixel double counts view through and click through revenue that would have converted anyway. Google Analytics 4 under reports because the model discounts paid social influence on longer consideration windows. Shopify tells the truth on first order revenue but nothing on assisted revenue. Post purchase surveys catch the audience that saw the campaign on TikTok, searched a week later, and bought through direct traffic. The four streams together reconcile inside a 5 to 8 percent margin on a well tagged apparel account. Google’s attribution model documentation is the source every founder should read before arguing about which number is correct.
Every plan reports campaign level revenue against the campaign level budget with a 7 day and 30 day view. Anything shorter than 7 days is noise on an apparel buying cycle. Anything longer than 30 days is too late to change the current campaign trajectory. The founder reads the dashboard once a week on Monday morning before the review meeting, not once at the end of the quarter when the numbers are already locked into a bad direction.
Fashion ecommerce marketing in production
Boogie Board came to our team with a DTC ecommerce program running the same problem most apparel brands run at $340,000 monthly. Product pages with four images per SKU, no fit content on the size selector, a checkout that pushed size to step two on mobile, cost per acquisition at $150.92 and climbing, and a founder who read the paid social dashboard at face value every Monday. The plan looked busy on paper. The margin math looked thin on the P and L.
Our team rebuilt the ecommerce path around the five node stack. Rewrote the product page template with 8 to 12 images per SKU, garment measurements at the SKU level, and fit review pull quotes below the size selector. Moved size selection to first field at the top of the mobile checkout. Rebuilt the top 40 SKU catalog feed with lifestyle imagery and hand written titles. Turned on the seven core Klaviyo flows and a Attentive SMS list at week three. Server side tracking went in through Elevar in week two. Weekly Monday review meetings replaced the end of month post mortem, with the founder in the room and empowered to kill a campaign at week two.
Twelve months in, blended cost per acquisition dropped to $31. Conversion rate on the paid landing pages climbed 11 percent. Return rate on womenswear dropped from 38 percent to 26 percent. Day 90 repeat purchase rate grew from 22 percent to 41 percent. Managed ad budget grew to $650,000 monthly on the same margin profile. The result did not come from a magic new channel. It came from applying the five node stack, the checkout discipline, and the review cadence the plan required from day one.
The weekly review that keeps the plan honest
The Monday review meeting is where an apparel plan earns the right to keep spending. Forty five minutes, three agenda items, one decision. Read the reconciled dashboard. Review the top and bottom three ad creatives by cost per order. Decide whether the current campaign continues into next week, gets a creative pivot, or gets killed. The founder is invited and expected to make the kill decision when the numbers warrant it.
Every Monday review meeting eventually reaches the moment where somebody points at the flat performing creative and asks if the founder wants to give it one more week. The founder always says yes. The creative always underperforms for a second week. Nobody remembers who first suggested the extra week. Somewhere in the archive of every apparel brand shared drive, a flat creative is quietly generating more Monday meetings about itself than actual orders about anything on the site.
The kill rule is simple and it holds across every campaign archetype. Day 3 return on ad spend below 40 percent of target and day 7 return below 60 percent of target triggers a 24 hour creative pivot or a full kill. Programs that hold underperforming campaigns for the full run out of hope produce the flat quarters founders learn to fear. Programs that kill fast and reallocate to the winners produce the compounding quarters that make the retainer worth its rate. Founders new to structured plans assume the kill decision hurts the numbers. In practice, killing a flat creative at week two frees the budget to double down on the winner and grows the campaign result 20 to 45 percent inside the next 21 days on an apparel account.
Where fashion ecommerce marketing fits the wider stack
Fashion ecommerce marketing sits above the tactical channel work and below the annual brand strategy inside the growth stack. Every retainer allocation, every creative brief, and every founder decision on inventory rolls up to the five node plan the pod is running against. Programs that budget for tactics without the plan produce busy months with soft revenue. Programs that build the plan first produce quarters where every product page, every ad, and every email adds up to a single growth arc the founder can defend at a board meeting.
The retainer that runs the plan starts at $599 monthly on a 6 month contract and scales with revenue. The retainer covers merchandising audits, fit content templates, product page image direction, checkout audits, retention flow builds, weekly review meetings, and quarterly server side tracking audits. Founders scoping the wider agency side should also read our apparel fashion marketing hub for the broader deliverable list and pricing tiers by revenue band.
The retainer scales with revenue band, deliverable scope, and the number of active campaigns per quarter. A brand at $80,000 monthly runs a lean retainer with the founder in the review meeting. A brand at $600,000 monthly runs a fuller retainer with a dedicated pod and monthly media mix modeling reads. Every retainer tier ties back to the five node stack the plan requires, and every quarterly review closes the loop between the tactical channel work and the strategic growth arc the founder is defending on the P and L. Two outside reads worth an hour before the first plan cycle kicks off. Meta catalog quality reference above for feed hygiene. The Business of Fashion opinions section for the macro context that shapes which trends deserve budget in a given quarter on the merchandising side.
A DTC apparel founder we onboarded in March pulled up her Shopify dashboard and asked why her return rate on womenswear had climbed from 24 percent to 41 percent inside two quarters while paid traffic grew 60 percent. The answer was not a discount problem or a shipping problem. The answer was a product page that shipped with a single hero photo and no fit content, a size chart three clicks deep, and a checkout that hid size selection until step two. Fashion ecommerce marketing is not a paid social problem or an email problem. It is the whole path from first ad impression to delivered order, and every weak node in that path costs margin the paid team never gets to recover.
This guide covers the working version of fashion ecommerce marketing our team runs for DTC apparel labels between $80,000 and $2 million monthly. You will see the merchandising rules, the size and fit content that cuts returns, the product page imagery stack, the checkout structure that respects sizing, the retention math that decides margin, and the reporting layer that keeps the founder honest on a Monday morning.
Size and fit inside fashion ecommerce marketing
Honest measurement of fashion ecommerce marketing runs on four data streams reconciled inside one weekly dashboard. Shopify revenue by UTM and discount code. Google Analytics 4 sessions and assisted conversion. Meta and TikTok ads platform attribution. A post purchase survey on every order that asks where the buyer first saw the brand. Each stream lies on its own.
The single biggest reporting mistake is trusting Meta own return on ad spend number as the campaign result. Meta over reports by 30 to 90 percent on apparel accounts because the pixel double counts view through and click through revenue that would have converted anyway. Google Analytics 4 under reports because the model discounts paid social influence on longer consideration windows. Shopify tells the truth on first order revenue but nothing on assisted revenue. Post purchase surveys catch the audience that saw the campaign on TikTok, searched a week later, and bought through direct traffic. The four streams together reconcile inside a 5 to 8 percent margin on a well tagged apparel account. Google’s attribution model documentation is the source every founder should read before arguing about which number is correct.
Every plan reports campaign level revenue against the campaign level budget with a 7 day and 30 day view. Anything shorter than 7 days is noise on an apparel buying cycle. Anything longer than 30 days is too late to change the current campaign trajectory. The founder reads the dashboard once a week on Monday morning before the review meeting, not once at the end of the quarter when the numbers are already locked into a bad direction.
Fashion ecommerce marketing in production
Boogie Board came to our team with a DTC ecommerce program running the same problem most apparel brands run at $340,000 monthly. Product pages with four images per SKU, no fit content on the size selector, a checkout that pushed size to step two on mobile, cost per acquisition at $150.92 and climbing, and a founder who read the paid social dashboard at face value every Monday. The plan looked busy on paper. The margin math looked thin on the P and L.
Our team rebuilt the ecommerce path around the five node stack. Rewrote the product page template with 8 to 12 images per SKU, garment measurements at the SKU level, and fit review pull quotes below the size selector. Moved size selection to first field at the top of the mobile checkout. Rebuilt the top 40 SKU catalog feed with lifestyle imagery and hand written titles. Turned on the seven core Klaviyo flows and a Attentive SMS list at week three. Server side tracking went in through Elevar in week two. Weekly Monday review meetings replaced the end of month post mortem, with the founder in the room and empowered to kill a campaign at week two.
Twelve months in, blended cost per acquisition dropped to $31. Conversion rate on the paid landing pages climbed 11 percent. Return rate on womenswear dropped from 38 percent to 26 percent. Day 90 repeat purchase rate grew from 22 percent to 41 percent. Managed ad budget grew to $650,000 monthly on the same margin profile. The result did not come from a magic new channel. It came from applying the five node stack, the checkout discipline, and the review cadence the plan required from day one.
The weekly review that keeps the plan honest
The Monday review meeting is where an apparel plan earns the right to keep spending. Forty five minutes, three agenda items, one decision. Read the reconciled dashboard. Review the top and bottom three ad creatives by cost per order. Decide whether the current campaign continues into next week, gets a creative pivot, or gets killed. The founder is invited and expected to make the kill decision when the numbers warrant it.
Every Monday review meeting eventually reaches the moment where somebody points at the flat performing creative and asks if the founder wants to give it one more week. The founder always says yes. The creative always underperforms for a second week. Nobody remembers who first suggested the extra week. Somewhere in the archive of every apparel brand shared drive, a flat creative is quietly generating more Monday meetings about itself than actual orders about anything on the site.
The kill rule is simple and it holds across every campaign archetype. Day 3 return on ad spend below 40 percent of target and day 7 return below 60 percent of target triggers a 24 hour creative pivot or a full kill. Programs that hold underperforming campaigns for the full run out of hope produce the flat quarters founders learn to fear. Programs that kill fast and reallocate to the winners produce the compounding quarters that make the retainer worth its rate. Founders new to structured plans assume the kill decision hurts the numbers. In practice, killing a flat creative at week two frees the budget to double down on the winner and grows the campaign result 20 to 45 percent inside the next 21 days on an apparel account.
Where fashion ecommerce marketing fits the wider stack
Fashion ecommerce marketing sits above the tactical channel work and below the annual brand strategy inside the growth stack. Every retainer allocation, every creative brief, and every founder decision on inventory rolls up to the five node plan the pod is running against. Programs that budget for tactics without the plan produce busy months with soft revenue. Programs that build the plan first produce quarters where every product page, every ad, and every email adds up to a single growth arc the founder can defend at a board meeting.
The retainer that runs the plan starts at $599 monthly on a 6 month contract and scales with revenue. The retainer covers merchandising audits, fit content templates, product page image direction, checkout audits, retention flow builds, weekly review meetings, and quarterly server side tracking audits. Founders scoping the wider agency side should also read our apparel fashion marketing hub for the broader deliverable list and pricing tiers by revenue band.
The retainer scales with revenue band, deliverable scope, and the number of active campaigns per quarter. A brand at $80,000 monthly runs a lean retainer with the founder in the review meeting. A brand at $600,000 monthly runs a fuller retainer with a dedicated pod and monthly media mix modeling reads. Every retainer tier ties back to the five node stack the plan requires, and every quarterly review closes the loop between the tactical channel work and the strategic growth arc the founder is defending on the P and L. Two outside reads worth an hour before the first plan cycle kicks off. Meta catalog quality reference above for feed hygiene. The Business of Fashion opinions section for the macro context that shapes which trends deserve budget in a given quarter on the merchandising side.
Benchmarks make the plan honest. A DTC apparel brand reads its own numbers against the industry median every quarter and acts on the gaps that show up. Conversion rate. Blended cost per order. Return rate. Repeat purchase rate. Email revenue share. Each has an honest median for the revenue band, and the numbers change slowly year over year.
| Revenue band | Conversion rate | Blended CPO | Return rate (womenswear) | Day 90 repeat rate | Email revenue share |
|---|---|---|---|---|---|
| Under $80K monthly | 1.2% to 1.8% | $38 to $54 | 26% to 34% | 10% to 18% | 18% to 26% |
| $80K to $250K monthly | 1.6% to 2.4% | $28 to $46 | 24% to 32% | 16% to 24% | 22% to 30% |
| $250K to $600K monthly | 2.0% to 2.8% | $22 to $38 | 22% to 30% | 22% to 32% | 26% to 34% |
| $600K to $1.5M monthly | 2.4% to 3.4% | $18 to $32 | 20% to 28% | 28% to 38% | 28% to 36% |
| Above $1.5M monthly | 2.8% to 4.0% | $16 to $28 | 18% to 26% | 32% to 45% | 30% to 38% |
A founder who reads a monthly dashboard against these benchmarks catches the drift inside 30 days and adjusts the plan before the quarter closes. A founder who reads only the paid social dashboard catches the drift 90 days late, which usually means the correction shows up in the next quarter revenue instead of the current one. That single reporting habit is the difference between an apparel plan that grows and an apparel plan that runs in place while the founder wonders what actually changed under the surface. Founders scoping the wider paid team should read our fashion marketing agency guide for the retainer scope that sits above these benchmark reads.
How do you measure fashion ecommerce marketing honestly
Honest measurement of fashion ecommerce marketing runs on four data streams reconciled inside one weekly dashboard. Shopify revenue by UTM and discount code. Google Analytics 4 sessions and assisted conversion. Meta and TikTok ads platform attribution. A post purchase survey on every order that asks where the buyer first saw the brand. Each stream lies on its own.
The single biggest reporting mistake is trusting Meta own return on ad spend number as the campaign result. Meta over reports by 30 to 90 percent on apparel accounts because the pixel double counts view through and click through revenue that would have converted anyway. Google Analytics 4 under reports because the model discounts paid social influence on longer consideration windows. Shopify tells the truth on first order revenue but nothing on assisted revenue. Post purchase surveys catch the audience that saw the campaign on TikTok, searched a week later, and bought through direct traffic. The four streams together reconcile inside a 5 to 8 percent margin on a well tagged apparel account. Google’s attribution model documentation is the source every founder should read before arguing about which number is correct.
Every plan reports campaign level revenue against the campaign level budget with a 7 day and 30 day view. Anything shorter than 7 days is noise on an apparel buying cycle. Anything longer than 30 days is too late to change the current campaign trajectory. The founder reads the dashboard once a week on Monday morning before the review meeting, not once at the end of the quarter when the numbers are already locked into a bad direction.
Fashion ecommerce marketing in production
Boogie Board came to our team with a DTC ecommerce program running the same problem most apparel brands run at $340,000 monthly. Product pages with four images per SKU, no fit content on the size selector, a checkout that pushed size to step two on mobile, cost per acquisition at $150.92 and climbing, and a founder who read the paid social dashboard at face value every Monday. The plan looked busy on paper. The margin math looked thin on the P and L.
Our team rebuilt the ecommerce path around the five node stack. Rewrote the product page template with 8 to 12 images per SKU, garment measurements at the SKU level, and fit review pull quotes below the size selector. Moved size selection to first field at the top of the mobile checkout. Rebuilt the top 40 SKU catalog feed with lifestyle imagery and hand written titles. Turned on the seven core Klaviyo flows and a Attentive SMS list at week three. Server side tracking went in through Elevar in week two. Weekly Monday review meetings replaced the end of month post mortem, with the founder in the room and empowered to kill a campaign at week two.
Twelve months in, blended cost per acquisition dropped to $31. Conversion rate on the paid landing pages climbed 11 percent. Return rate on womenswear dropped from 38 percent to 26 percent. Day 90 repeat purchase rate grew from 22 percent to 41 percent. Managed ad budget grew to $650,000 monthly on the same margin profile. The result did not come from a magic new channel. It came from applying the five node stack, the checkout discipline, and the review cadence the plan required from day one.
The weekly review that keeps the plan honest
The Monday review meeting is where an apparel plan earns the right to keep spending. Forty five minutes, three agenda items, one decision. Read the reconciled dashboard. Review the top and bottom three ad creatives by cost per order. Decide whether the current campaign continues into next week, gets a creative pivot, or gets killed. The founder is invited and expected to make the kill decision when the numbers warrant it.
Every Monday review meeting eventually reaches the moment where somebody points at the flat performing creative and asks if the founder wants to give it one more week. The founder always says yes. The creative always underperforms for a second week. Nobody remembers who first suggested the extra week. Somewhere in the archive of every apparel brand shared drive, a flat creative is quietly generating more Monday meetings about itself than actual orders about anything on the site.
The kill rule is simple and it holds across every campaign archetype. Day 3 return on ad spend below 40 percent of target and day 7 return below 60 percent of target triggers a 24 hour creative pivot or a full kill. Programs that hold underperforming campaigns for the full run out of hope produce the flat quarters founders learn to fear. Programs that kill fast and reallocate to the winners produce the compounding quarters that make the retainer worth its rate. Founders new to structured plans assume the kill decision hurts the numbers. In practice, killing a flat creative at week two frees the budget to double down on the winner and grows the campaign result 20 to 45 percent inside the next 21 days on an apparel account.
Where fashion ecommerce marketing fits the wider stack
Fashion ecommerce marketing sits above the tactical channel work and below the annual brand strategy inside the growth stack. Every retainer allocation, every creative brief, and every founder decision on inventory rolls up to the five node plan the pod is running against. Programs that budget for tactics without the plan produce busy months with soft revenue. Programs that build the plan first produce quarters where every product page, every ad, and every email adds up to a single growth arc the founder can defend at a board meeting.
The retainer that runs the plan starts at $599 monthly on a 6 month contract and scales with revenue. The retainer covers merchandising audits, fit content templates, product page image direction, checkout audits, retention flow builds, weekly review meetings, and quarterly server side tracking audits. Founders scoping the wider agency side should also read our apparel fashion marketing hub for the broader deliverable list and pricing tiers by revenue band.
The retainer scales with revenue band, deliverable scope, and the number of active campaigns per quarter. A brand at $80,000 monthly runs a lean retainer with the founder in the review meeting. A brand at $600,000 monthly runs a fuller retainer with a dedicated pod and monthly media mix modeling reads. Every retainer tier ties back to the five node stack the plan requires, and every quarterly review closes the loop between the tactical channel work and the strategic growth arc the founder is defending on the P and L. Two outside reads worth an hour before the first plan cycle kicks off. Meta catalog quality reference above for feed hygiene. The Business of Fashion opinions section for the macro context that shapes which trends deserve budget in a given quarter on the merchandising side.
Retention is the layer that decides whether the P and L runs on margin or grinds through paid acquisition to break even. A DTC apparel brand with a 30 percent day 90 repeat rate runs 20 to 35 percent more contribution margin per blended dollar of spend than the same brand at 15 percent. Retention is not one channel. It is a stack of email, SMS, loyalty, and post purchase content on a monthly calendar.
Email and SMS as the core
Email drives 25 to 35 percent of DTC apparel revenue when the flow set is complete. Welcome, browse abandonment, cart abandonment, post purchase, replenishment, VIP, and win back are the seven flows every brand needs live inside the first 90 days. SMS adds another 8 to 15 percent of revenue at a 5 to 12 percent list opt in rate. Klaviyo and Attentive dominate the DTC apparel tool stack because the two platforms handle 90 percent of the flow logic without custom development. Our what is fashion marketing primer covers how the retention layer plugs into the wider channel mix.
Post purchase content that grows LTV
Post purchase content covers the four weeks after delivery on a first order. Styling emails that pair the purchased SKU with three complementary pieces. A fit review request at day seven when the buyer has worn the garment twice. A community moment at day fourteen with user photos of the same SKU. A second order incentive at day 28 with a category adjacent recommendation. Programs that publish the full post purchase sequence grow lifetime value 22 to 45 percent by month twelve on the same first order cohort, and the retention layer starts to carry the revenue growth the paid team used to carry alone.
Benchmarks inside fashion ecommerce marketing
Benchmarks make the plan honest. A DTC apparel brand reads its own numbers against the industry median every quarter and acts on the gaps that show up. Conversion rate. Blended cost per order. Return rate. Repeat purchase rate. Email revenue share. Each has an honest median for the revenue band, and the numbers change slowly year over year.
| Revenue band | Conversion rate | Blended CPO | Return rate (womenswear) | Day 90 repeat rate | Email revenue share |
|---|---|---|---|---|---|
| Under $80K monthly | 1.2% to 1.8% | $38 to $54 | 26% to 34% | 10% to 18% | 18% to 26% |
| $80K to $250K monthly | 1.6% to 2.4% | $28 to $46 | 24% to 32% | 16% to 24% | 22% to 30% |
| $250K to $600K monthly | 2.0% to 2.8% | $22 to $38 | 22% to 30% | 22% to 32% | 26% to 34% |
| $600K to $1.5M monthly | 2.4% to 3.4% | $18 to $32 | 20% to 28% | 28% to 38% | 28% to 36% |
| Above $1.5M monthly | 2.8% to 4.0% | $16 to $28 | 18% to 26% | 32% to 45% | 30% to 38% |
A founder who reads a monthly dashboard against these benchmarks catches the drift inside 30 days and adjusts the plan before the quarter closes. A founder who reads only the paid social dashboard catches the drift 90 days late, which usually means the correction shows up in the next quarter revenue instead of the current one. That single reporting habit is the difference between an apparel plan that grows and an apparel plan that runs in place while the founder wonders what actually changed under the surface. Founders scoping the wider paid team should read our fashion marketing agency guide for the retainer scope that sits above these benchmark reads.
How do you measure fashion ecommerce marketing honestly
Honest measurement of fashion ecommerce marketing runs on four data streams reconciled inside one weekly dashboard. Shopify revenue by UTM and discount code. Google Analytics 4 sessions and assisted conversion. Meta and TikTok ads platform attribution. A post purchase survey on every order that asks where the buyer first saw the brand. Each stream lies on its own.
The single biggest reporting mistake is trusting Meta own return on ad spend number as the campaign result. Meta over reports by 30 to 90 percent on apparel accounts because the pixel double counts view through and click through revenue that would have converted anyway. Google Analytics 4 under reports because the model discounts paid social influence on longer consideration windows. Shopify tells the truth on first order revenue but nothing on assisted revenue. Post purchase surveys catch the audience that saw the campaign on TikTok, searched a week later, and bought through direct traffic. The four streams together reconcile inside a 5 to 8 percent margin on a well tagged apparel account. Google’s attribution model documentation is the source every founder should read before arguing about which number is correct.
Every plan reports campaign level revenue against the campaign level budget with a 7 day and 30 day view. Anything shorter than 7 days is noise on an apparel buying cycle. Anything longer than 30 days is too late to change the current campaign trajectory. The founder reads the dashboard once a week on Monday morning before the review meeting, not once at the end of the quarter when the numbers are already locked into a bad direction.
Fashion ecommerce marketing in production
Boogie Board came to our team with a DTC ecommerce program running the same problem most apparel brands run at $340,000 monthly. Product pages with four images per SKU, no fit content on the size selector, a checkout that pushed size to step two on mobile, cost per acquisition at $150.92 and climbing, and a founder who read the paid social dashboard at face value every Monday. The plan looked busy on paper. The margin math looked thin on the P and L.
Our team rebuilt the ecommerce path around the five node stack. Rewrote the product page template with 8 to 12 images per SKU, garment measurements at the SKU level, and fit review pull quotes below the size selector. Moved size selection to first field at the top of the mobile checkout. Rebuilt the top 40 SKU catalog feed with lifestyle imagery and hand written titles. Turned on the seven core Klaviyo flows and a Attentive SMS list at week three. Server side tracking went in through Elevar in week two. Weekly Monday review meetings replaced the end of month post mortem, with the founder in the room and empowered to kill a campaign at week two.
Twelve months in, blended cost per acquisition dropped to $31. Conversion rate on the paid landing pages climbed 11 percent. Return rate on womenswear dropped from 38 percent to 26 percent. Day 90 repeat purchase rate grew from 22 percent to 41 percent. Managed ad budget grew to $650,000 monthly on the same margin profile. The result did not come from a magic new channel. It came from applying the five node stack, the checkout discipline, and the review cadence the plan required from day one.
The weekly review that keeps the plan honest
The Monday review meeting is where an apparel plan earns the right to keep spending. Forty five minutes, three agenda items, one decision. Read the reconciled dashboard. Review the top and bottom three ad creatives by cost per order. Decide whether the current campaign continues into next week, gets a creative pivot, or gets killed. The founder is invited and expected to make the kill decision when the numbers warrant it.
Every Monday review meeting eventually reaches the moment where somebody points at the flat performing creative and asks if the founder wants to give it one more week. The founder always says yes. The creative always underperforms for a second week. Nobody remembers who first suggested the extra week. Somewhere in the archive of every apparel brand shared drive, a flat creative is quietly generating more Monday meetings about itself than actual orders about anything on the site.
The kill rule is simple and it holds across every campaign archetype. Day 3 return on ad spend below 40 percent of target and day 7 return below 60 percent of target triggers a 24 hour creative pivot or a full kill. Programs that hold underperforming campaigns for the full run out of hope produce the flat quarters founders learn to fear. Programs that kill fast and reallocate to the winners produce the compounding quarters that make the retainer worth its rate. Founders new to structured plans assume the kill decision hurts the numbers. In practice, killing a flat creative at week two frees the budget to double down on the winner and grows the campaign result 20 to 45 percent inside the next 21 days on an apparel account.
Where fashion ecommerce marketing fits the wider stack
Fashion ecommerce marketing sits above the tactical channel work and below the annual brand strategy inside the growth stack. Every retainer allocation, every creative brief, and every founder decision on inventory rolls up to the five node plan the pod is running against. Programs that budget for tactics without the plan produce busy months with soft revenue. Programs that build the plan first produce quarters where every product page, every ad, and every email adds up to a single growth arc the founder can defend at a board meeting.
The retainer that runs the plan starts at $599 monthly on a 6 month contract and scales with revenue. The retainer covers merchandising audits, fit content templates, product page image direction, checkout audits, retention flow builds, weekly review meetings, and quarterly server side tracking audits. Founders scoping the wider agency side should also read our apparel fashion marketing hub for the broader deliverable list and pricing tiers by revenue band.
The retainer scales with revenue band, deliverable scope, and the number of active campaigns per quarter. A brand at $80,000 monthly runs a lean retainer with the founder in the review meeting. A brand at $600,000 monthly runs a fuller retainer with a dedicated pod and monthly media mix modeling reads. Every retainer tier ties back to the five node stack the plan requires, and every quarterly review closes the loop between the tactical channel work and the strategic growth arc the founder is defending on the P and L. Two outside reads worth an hour before the first plan cycle kicks off. Meta catalog quality reference above for feed hygiene. The Business of Fashion opinions section for the macro context that shapes which trends deserve budget in a given quarter on the merchandising side.
Paid social carries 45 to 60 percent of first order revenue on DTC apparel between $80,000 and $600,000 monthly. Meta and TikTok are the two platforms that fund. Every other platform enters through a 90 day pilot with a hard kill date, not a slow bleed into the always on budget.
Creative velocity as the real budget
Paid social on apparel wins on creative velocity, not media budget. A brand shipping 6 to 12 fresh creative variants weekly across static, Reel, and TikTok formats produces 30 to 60 percent lower cost per order than the same brand shipping 2 to 3 variants weekly on the same media budget. Fashion audiences fatigue creative inside 5 to 9 days on the same face and product angle. The retainer needs to feed that fatigue rate, not fight it, and the creative production line has to run on a weekly cadence with a named producer.
The catalog feed that carries Shopping
Meta Advantage Plus Shopping and TikTok Shop pull directly from the Shopify product feed. Programs that let the feed run on default titles and default images produce 40 to 70 percent higher cost per order than programs that rewrite the top 40 SKU feed titles and swap the primary feed image to the highest performing lifestyle shot. Feed hygiene is the cheapest paid social gain available on an apparel account and the one most founders never open. Meta’s catalog quality reference covers the field level rules that shape delivery.
Retention inside fashion ecommerce marketing
Retention is the layer that decides whether the P and L runs on margin or grinds through paid acquisition to break even. A DTC apparel brand with a 30 percent day 90 repeat rate runs 20 to 35 percent more contribution margin per blended dollar of spend than the same brand at 15 percent. Retention is not one channel. It is a stack of email, SMS, loyalty, and post purchase content on a monthly calendar.
Email and SMS as the core
Email drives 25 to 35 percent of DTC apparel revenue when the flow set is complete. Welcome, browse abandonment, cart abandonment, post purchase, replenishment, VIP, and win back are the seven flows every brand needs live inside the first 90 days. SMS adds another 8 to 15 percent of revenue at a 5 to 12 percent list opt in rate. Klaviyo and Attentive dominate the DTC apparel tool stack because the two platforms handle 90 percent of the flow logic without custom development. Our what is fashion marketing primer covers how the retention layer plugs into the wider channel mix.
Post purchase content that grows LTV
Post purchase content covers the four weeks after delivery on a first order. Styling emails that pair the purchased SKU with three complementary pieces. A fit review request at day seven when the buyer has worn the garment twice. A community moment at day fourteen with user photos of the same SKU. A second order incentive at day 28 with a category adjacent recommendation. Programs that publish the full post purchase sequence grow lifetime value 22 to 45 percent by month twelve on the same first order cohort, and the retention layer starts to carry the revenue growth the paid team used to carry alone.
Benchmarks inside fashion ecommerce marketing
Benchmarks make the plan honest. A DTC apparel brand reads its own numbers against the industry median every quarter and acts on the gaps that show up. Conversion rate. Blended cost per order. Return rate. Repeat purchase rate. Email revenue share. Each has an honest median for the revenue band, and the numbers change slowly year over year.
| Revenue band | Conversion rate | Blended CPO | Return rate (womenswear) | Day 90 repeat rate | Email revenue share |
|---|---|---|---|---|---|
| Under $80K monthly | 1.2% to 1.8% | $38 to $54 | 26% to 34% | 10% to 18% | 18% to 26% |
| $80K to $250K monthly | 1.6% to 2.4% | $28 to $46 | 24% to 32% | 16% to 24% | 22% to 30% |
| $250K to $600K monthly | 2.0% to 2.8% | $22 to $38 | 22% to 30% | 22% to 32% | 26% to 34% |
| $600K to $1.5M monthly | 2.4% to 3.4% | $18 to $32 | 20% to 28% | 28% to 38% | 28% to 36% |
| Above $1.5M monthly | 2.8% to 4.0% | $16 to $28 | 18% to 26% | 32% to 45% | 30% to 38% |
A founder who reads a monthly dashboard against these benchmarks catches the drift inside 30 days and adjusts the plan before the quarter closes. A founder who reads only the paid social dashboard catches the drift 90 days late, which usually means the correction shows up in the next quarter revenue instead of the current one. That single reporting habit is the difference between an apparel plan that grows and an apparel plan that runs in place while the founder wonders what actually changed under the surface. Founders scoping the wider paid team should read our fashion marketing agency guide for the retainer scope that sits above these benchmark reads.
How do you measure fashion ecommerce marketing honestly
Honest measurement of fashion ecommerce marketing runs on four data streams reconciled inside one weekly dashboard. Shopify revenue by UTM and discount code. Google Analytics 4 sessions and assisted conversion. Meta and TikTok ads platform attribution. A post purchase survey on every order that asks where the buyer first saw the brand. Each stream lies on its own.
The single biggest reporting mistake is trusting Meta own return on ad spend number as the campaign result. Meta over reports by 30 to 90 percent on apparel accounts because the pixel double counts view through and click through revenue that would have converted anyway. Google Analytics 4 under reports because the model discounts paid social influence on longer consideration windows. Shopify tells the truth on first order revenue but nothing on assisted revenue. Post purchase surveys catch the audience that saw the campaign on TikTok, searched a week later, and bought through direct traffic. The four streams together reconcile inside a 5 to 8 percent margin on a well tagged apparel account. Google’s attribution model documentation is the source every founder should read before arguing about which number is correct.
Every plan reports campaign level revenue against the campaign level budget with a 7 day and 30 day view. Anything shorter than 7 days is noise on an apparel buying cycle. Anything longer than 30 days is too late to change the current campaign trajectory. The founder reads the dashboard once a week on Monday morning before the review meeting, not once at the end of the quarter when the numbers are already locked into a bad direction.
Fashion ecommerce marketing in production
Boogie Board came to our team with a DTC ecommerce program running the same problem most apparel brands run at $340,000 monthly. Product pages with four images per SKU, no fit content on the size selector, a checkout that pushed size to step two on mobile, cost per acquisition at $150.92 and climbing, and a founder who read the paid social dashboard at face value every Monday. The plan looked busy on paper. The margin math looked thin on the P and L.
Our team rebuilt the ecommerce path around the five node stack. Rewrote the product page template with 8 to 12 images per SKU, garment measurements at the SKU level, and fit review pull quotes below the size selector. Moved size selection to first field at the top of the mobile checkout. Rebuilt the top 40 SKU catalog feed with lifestyle imagery and hand written titles. Turned on the seven core Klaviyo flows and a Attentive SMS list at week three. Server side tracking went in through Elevar in week two. Weekly Monday review meetings replaced the end of month post mortem, with the founder in the room and empowered to kill a campaign at week two.
Twelve months in, blended cost per acquisition dropped to $31. Conversion rate on the paid landing pages climbed 11 percent. Return rate on womenswear dropped from 38 percent to 26 percent. Day 90 repeat purchase rate grew from 22 percent to 41 percent. Managed ad budget grew to $650,000 monthly on the same margin profile. The result did not come from a magic new channel. It came from applying the five node stack, the checkout discipline, and the review cadence the plan required from day one.
The weekly review that keeps the plan honest
The Monday review meeting is where an apparel plan earns the right to keep spending. Forty five minutes, three agenda items, one decision. Read the reconciled dashboard. Review the top and bottom three ad creatives by cost per order. Decide whether the current campaign continues into next week, gets a creative pivot, or gets killed. The founder is invited and expected to make the kill decision when the numbers warrant it.
Every Monday review meeting eventually reaches the moment where somebody points at the flat performing creative and asks if the founder wants to give it one more week. The founder always says yes. The creative always underperforms for a second week. Nobody remembers who first suggested the extra week. Somewhere in the archive of every apparel brand shared drive, a flat creative is quietly generating more Monday meetings about itself than actual orders about anything on the site.
The kill rule is simple and it holds across every campaign archetype. Day 3 return on ad spend below 40 percent of target and day 7 return below 60 percent of target triggers a 24 hour creative pivot or a full kill. Programs that hold underperforming campaigns for the full run out of hope produce the flat quarters founders learn to fear. Programs that kill fast and reallocate to the winners produce the compounding quarters that make the retainer worth its rate. Founders new to structured plans assume the kill decision hurts the numbers. In practice, killing a flat creative at week two frees the budget to double down on the winner and grows the campaign result 20 to 45 percent inside the next 21 days on an apparel account.
Where fashion ecommerce marketing fits the wider stack
Fashion ecommerce marketing sits above the tactical channel work and below the annual brand strategy inside the growth stack. Every retainer allocation, every creative brief, and every founder decision on inventory rolls up to the five node plan the pod is running against. Programs that budget for tactics without the plan produce busy months with soft revenue. Programs that build the plan first produce quarters where every product page, every ad, and every email adds up to a single growth arc the founder can defend at a board meeting.
The retainer that runs the plan starts at $599 monthly on a 6 month contract and scales with revenue. The retainer covers merchandising audits, fit content templates, product page image direction, checkout audits, retention flow builds, weekly review meetings, and quarterly server side tracking audits. Founders scoping the wider agency side should also read our apparel fashion marketing hub for the broader deliverable list and pricing tiers by revenue band.
The retainer scales with revenue band, deliverable scope, and the number of active campaigns per quarter. A brand at $80,000 monthly runs a lean retainer with the founder in the review meeting. A brand at $600,000 monthly runs a fuller retainer with a dedicated pod and monthly media mix modeling reads. Every retainer tier ties back to the five node stack the plan requires, and every quarterly review closes the loop between the tactical channel work and the strategic growth arc the founder is defending on the P and L. Two outside reads worth an hour before the first plan cycle kicks off. Meta catalog quality reference above for feed hygiene. The Business of Fashion opinions section for the macro context that shapes which trends deserve budget in a given quarter on the merchandising side.
Checkout on apparel carries a size selector as the first field, not the last. Programs that push size selection to a second step lose 4 to 9 percent conversion rate on the same traffic because the mobile buyer scrolls twice for a decision the desktop pattern buries. The mobile buyer decides in under six seconds whether the flow feels safe. Every friction point in that window costs margin.
The checkout structure that respects sizing
The size selector sits directly under the price, above the add to cart button. Sold out sizes stay visible with a strikethrough, not hidden, so the buyer reads the size chart against the availability without a filter reset. A restock notification input replaces the add to cart button on the sold out size. On mobile, the size selector expands into a tap sheet that shows the size chart and fit review pull quotes on the same swipe. That single pattern grows completed checkout rate 6 to 12 percent on apparel accounts we have measured inside 21 days of the deploy.
Shipping and returns copy at the payment step
Shipping thresholds, return windows, and exchange policy live inline at the payment step, not on a footer page. Apparel buyers who read the return policy at cart complete checkout 18 to 30 percent more often than buyers who never see it, and the return rate on those orders drops 2 to 5 percentage points because the buyer bought with the exchange window in mind. Founders who bury return policy on a footer link are trading the transparency dividend for a false conversion gain that costs margin on the back end.
Paid social inside fashion ecommerce marketing
Paid social carries 45 to 60 percent of first order revenue on DTC apparel between $80,000 and $600,000 monthly. Meta and TikTok are the two platforms that fund. Every other platform enters through a 90 day pilot with a hard kill date, not a slow bleed into the always on budget.
Creative velocity as the real budget
Paid social on apparel wins on creative velocity, not media budget. A brand shipping 6 to 12 fresh creative variants weekly across static, Reel, and TikTok formats produces 30 to 60 percent lower cost per order than the same brand shipping 2 to 3 variants weekly on the same media budget. Fashion audiences fatigue creative inside 5 to 9 days on the same face and product angle. The retainer needs to feed that fatigue rate, not fight it, and the creative production line has to run on a weekly cadence with a named producer.
The catalog feed that carries Shopping
Meta Advantage Plus Shopping and TikTok Shop pull directly from the Shopify product feed. Programs that let the feed run on default titles and default images produce 40 to 70 percent higher cost per order than programs that rewrite the top 40 SKU feed titles and swap the primary feed image to the highest performing lifestyle shot. Feed hygiene is the cheapest paid social gain available on an apparel account and the one most founders never open. Meta’s catalog quality reference covers the field level rules that shape delivery.
Retention inside fashion ecommerce marketing
Retention is the layer that decides whether the P and L runs on margin or grinds through paid acquisition to break even. A DTC apparel brand with a 30 percent day 90 repeat rate runs 20 to 35 percent more contribution margin per blended dollar of spend than the same brand at 15 percent. Retention is not one channel. It is a stack of email, SMS, loyalty, and post purchase content on a monthly calendar.
Email and SMS as the core
Email drives 25 to 35 percent of DTC apparel revenue when the flow set is complete. Welcome, browse abandonment, cart abandonment, post purchase, replenishment, VIP, and win back are the seven flows every brand needs live inside the first 90 days. SMS adds another 8 to 15 percent of revenue at a 5 to 12 percent list opt in rate. Klaviyo and Attentive dominate the DTC apparel tool stack because the two platforms handle 90 percent of the flow logic without custom development. Our what is fashion marketing primer covers how the retention layer plugs into the wider channel mix.
Post purchase content that grows LTV
Post purchase content covers the four weeks after delivery on a first order. Styling emails that pair the purchased SKU with three complementary pieces. A fit review request at day seven when the buyer has worn the garment twice. A community moment at day fourteen with user photos of the same SKU. A second order incentive at day 28 with a category adjacent recommendation. Programs that publish the full post purchase sequence grow lifetime value 22 to 45 percent by month twelve on the same first order cohort, and the retention layer starts to carry the revenue growth the paid team used to carry alone.
Benchmarks inside fashion ecommerce marketing
Benchmarks make the plan honest. A DTC apparel brand reads its own numbers against the industry median every quarter and acts on the gaps that show up. Conversion rate. Blended cost per order. Return rate. Repeat purchase rate. Email revenue share. Each has an honest median for the revenue band, and the numbers change slowly year over year.
| Revenue band | Conversion rate | Blended CPO | Return rate (womenswear) | Day 90 repeat rate | Email revenue share |
|---|---|---|---|---|---|
| Under $80K monthly | 1.2% to 1.8% | $38 to $54 | 26% to 34% | 10% to 18% | 18% to 26% |
| $80K to $250K monthly | 1.6% to 2.4% | $28 to $46 | 24% to 32% | 16% to 24% | 22% to 30% |
| $250K to $600K monthly | 2.0% to 2.8% | $22 to $38 | 22% to 30% | 22% to 32% | 26% to 34% |
| $600K to $1.5M monthly | 2.4% to 3.4% | $18 to $32 | 20% to 28% | 28% to 38% | 28% to 36% |
| Above $1.5M monthly | 2.8% to 4.0% | $16 to $28 | 18% to 26% | 32% to 45% | 30% to 38% |
A founder who reads a monthly dashboard against these benchmarks catches the drift inside 30 days and adjusts the plan before the quarter closes. A founder who reads only the paid social dashboard catches the drift 90 days late, which usually means the correction shows up in the next quarter revenue instead of the current one. That single reporting habit is the difference between an apparel plan that grows and an apparel plan that runs in place while the founder wonders what actually changed under the surface. Founders scoping the wider paid team should read our fashion marketing agency guide for the retainer scope that sits above these benchmark reads.
How do you measure fashion ecommerce marketing honestly
Honest measurement of fashion ecommerce marketing runs on four data streams reconciled inside one weekly dashboard. Shopify revenue by UTM and discount code. Google Analytics 4 sessions and assisted conversion. Meta and TikTok ads platform attribution. A post purchase survey on every order that asks where the buyer first saw the brand. Each stream lies on its own.
The single biggest reporting mistake is trusting Meta own return on ad spend number as the campaign result. Meta over reports by 30 to 90 percent on apparel accounts because the pixel double counts view through and click through revenue that would have converted anyway. Google Analytics 4 under reports because the model discounts paid social influence on longer consideration windows. Shopify tells the truth on first order revenue but nothing on assisted revenue. Post purchase surveys catch the audience that saw the campaign on TikTok, searched a week later, and bought through direct traffic. The four streams together reconcile inside a 5 to 8 percent margin on a well tagged apparel account. Google’s attribution model documentation is the source every founder should read before arguing about which number is correct.
Every plan reports campaign level revenue against the campaign level budget with a 7 day and 30 day view. Anything shorter than 7 days is noise on an apparel buying cycle. Anything longer than 30 days is too late to change the current campaign trajectory. The founder reads the dashboard once a week on Monday morning before the review meeting, not once at the end of the quarter when the numbers are already locked into a bad direction.
Fashion ecommerce marketing in production
Boogie Board came to our team with a DTC ecommerce program running the same problem most apparel brands run at $340,000 monthly. Product pages with four images per SKU, no fit content on the size selector, a checkout that pushed size to step two on mobile, cost per acquisition at $150.92 and climbing, and a founder who read the paid social dashboard at face value every Monday. The plan looked busy on paper. The margin math looked thin on the P and L.
Our team rebuilt the ecommerce path around the five node stack. Rewrote the product page template with 8 to 12 images per SKU, garment measurements at the SKU level, and fit review pull quotes below the size selector. Moved size selection to first field at the top of the mobile checkout. Rebuilt the top 40 SKU catalog feed with lifestyle imagery and hand written titles. Turned on the seven core Klaviyo flows and a Attentive SMS list at week three. Server side tracking went in through Elevar in week two. Weekly Monday review meetings replaced the end of month post mortem, with the founder in the room and empowered to kill a campaign at week two.
Twelve months in, blended cost per acquisition dropped to $31. Conversion rate on the paid landing pages climbed 11 percent. Return rate on womenswear dropped from 38 percent to 26 percent. Day 90 repeat purchase rate grew from 22 percent to 41 percent. Managed ad budget grew to $650,000 monthly on the same margin profile. The result did not come from a magic new channel. It came from applying the five node stack, the checkout discipline, and the review cadence the plan required from day one.
The weekly review that keeps the plan honest
The Monday review meeting is where an apparel plan earns the right to keep spending. Forty five minutes, three agenda items, one decision. Read the reconciled dashboard. Review the top and bottom three ad creatives by cost per order. Decide whether the current campaign continues into next week, gets a creative pivot, or gets killed. The founder is invited and expected to make the kill decision when the numbers warrant it.
Every Monday review meeting eventually reaches the moment where somebody points at the flat performing creative and asks if the founder wants to give it one more week. The founder always says yes. The creative always underperforms for a second week. Nobody remembers who first suggested the extra week. Somewhere in the archive of every apparel brand shared drive, a flat creative is quietly generating more Monday meetings about itself than actual orders about anything on the site.
The kill rule is simple and it holds across every campaign archetype. Day 3 return on ad spend below 40 percent of target and day 7 return below 60 percent of target triggers a 24 hour creative pivot or a full kill. Programs that hold underperforming campaigns for the full run out of hope produce the flat quarters founders learn to fear. Programs that kill fast and reallocate to the winners produce the compounding quarters that make the retainer worth its rate. Founders new to structured plans assume the kill decision hurts the numbers. In practice, killing a flat creative at week two frees the budget to double down on the winner and grows the campaign result 20 to 45 percent inside the next 21 days on an apparel account.
Where fashion ecommerce marketing fits the wider stack
Fashion ecommerce marketing sits above the tactical channel work and below the annual brand strategy inside the growth stack. Every retainer allocation, every creative brief, and every founder decision on inventory rolls up to the five node plan the pod is running against. Programs that budget for tactics without the plan produce busy months with soft revenue. Programs that build the plan first produce quarters where every product page, every ad, and every email adds up to a single growth arc the founder can defend at a board meeting.
The retainer that runs the plan starts at $599 monthly on a 6 month contract and scales with revenue. The retainer covers merchandising audits, fit content templates, product page image direction, checkout audits, retention flow builds, weekly review meetings, and quarterly server side tracking audits. Founders scoping the wider agency side should also read our apparel fashion marketing hub for the broader deliverable list and pricing tiers by revenue band.
The retainer scales with revenue band, deliverable scope, and the number of active campaigns per quarter. A brand at $80,000 monthly runs a lean retainer with the founder in the review meeting. A brand at $600,000 monthly runs a fuller retainer with a dedicated pod and monthly media mix modeling reads. Every retainer tier ties back to the five node stack the plan requires, and every quarterly review closes the loop between the tactical channel work and the strategic growth arc the founder is defending on the P and L. Two outside reads worth an hour before the first plan cycle kicks off. Meta catalog quality reference above for feed hygiene. The Business of Fashion opinions section for the macro context that shapes which trends deserve budget in a given quarter on the merchandising side.
Product page imagery is where a paid social click either converts or bounces inside eight seconds. The industry median product page ships four images per SKU. The winners ship eight to twelve, and every image answers a specific buyer question the paid ad already primed.
The imagery stack per SKU
A working stack per SKU carries model shot on size medium, model shot on size extra large or size fourteen so the buyer sees the fit at range, flat lay on a neutral ground for the utility view, detail shot on the fabric texture, detail shot on the hardware and stitching, back view on the model, side view on the model, movement clip of 4 to 8 seconds, and a scale shot next to a familiar object for accessories. Programs that publish all twelve image slots grow conversion rate 8 to 22 percent against the four image baseline, and Meta gets richer feed asset variants to test in the ad set.
Video that earns its production cost
Product page video works when it stays under 10 seconds, loops on autoplay, mutes by default, and shows movement the still shot cannot. Longer videos hurt page load and buyer patience without a conversion gain. A DTC apparel brand doing $340,000 monthly should budget $60,000 to $140,000 annually on product page video across the top 40 SKUs by contribution margin. Below that budget, the video shoot day math does not work and the founder ships either thin coverage on all SKUs or full coverage on the wrong ones. Shopify’s product photography guide is a useful outside read for founders scoping a first shoot.
Checkout inside fashion ecommerce marketing
Checkout on apparel carries a size selector as the first field, not the last. Programs that push size selection to a second step lose 4 to 9 percent conversion rate on the same traffic because the mobile buyer scrolls twice for a decision the desktop pattern buries. The mobile buyer decides in under six seconds whether the flow feels safe. Every friction point in that window costs margin.
The checkout structure that respects sizing
The size selector sits directly under the price, above the add to cart button. Sold out sizes stay visible with a strikethrough, not hidden, so the buyer reads the size chart against the availability without a filter reset. A restock notification input replaces the add to cart button on the sold out size. On mobile, the size selector expands into a tap sheet that shows the size chart and fit review pull quotes on the same swipe. That single pattern grows completed checkout rate 6 to 12 percent on apparel accounts we have measured inside 21 days of the deploy.
Shipping and returns copy at the payment step
Shipping thresholds, return windows, and exchange policy live inline at the payment step, not on a footer page. Apparel buyers who read the return policy at cart complete checkout 18 to 30 percent more often than buyers who never see it, and the return rate on those orders drops 2 to 5 percentage points because the buyer bought with the exchange window in mind. Founders who bury return policy on a footer link are trading the transparency dividend for a false conversion gain that costs margin on the back end.
Paid social inside fashion ecommerce marketing
Paid social carries 45 to 60 percent of first order revenue on DTC apparel between $80,000 and $600,000 monthly. Meta and TikTok are the two platforms that fund. Every other platform enters through a 90 day pilot with a hard kill date, not a slow bleed into the always on budget.
Creative velocity as the real budget
Paid social on apparel wins on creative velocity, not media budget. A brand shipping 6 to 12 fresh creative variants weekly across static, Reel, and TikTok formats produces 30 to 60 percent lower cost per order than the same brand shipping 2 to 3 variants weekly on the same media budget. Fashion audiences fatigue creative inside 5 to 9 days on the same face and product angle. The retainer needs to feed that fatigue rate, not fight it, and the creative production line has to run on a weekly cadence with a named producer.
The catalog feed that carries Shopping
Meta Advantage Plus Shopping and TikTok Shop pull directly from the Shopify product feed. Programs that let the feed run on default titles and default images produce 40 to 70 percent higher cost per order than programs that rewrite the top 40 SKU feed titles and swap the primary feed image to the highest performing lifestyle shot. Feed hygiene is the cheapest paid social gain available on an apparel account and the one most founders never open. Meta’s catalog quality reference covers the field level rules that shape delivery.
Retention inside fashion ecommerce marketing
Retention is the layer that decides whether the P and L runs on margin or grinds through paid acquisition to break even. A DTC apparel brand with a 30 percent day 90 repeat rate runs 20 to 35 percent more contribution margin per blended dollar of spend than the same brand at 15 percent. Retention is not one channel. It is a stack of email, SMS, loyalty, and post purchase content on a monthly calendar.
Email and SMS as the core
Email drives 25 to 35 percent of DTC apparel revenue when the flow set is complete. Welcome, browse abandonment, cart abandonment, post purchase, replenishment, VIP, and win back are the seven flows every brand needs live inside the first 90 days. SMS adds another 8 to 15 percent of revenue at a 5 to 12 percent list opt in rate. Klaviyo and Attentive dominate the DTC apparel tool stack because the two platforms handle 90 percent of the flow logic without custom development. Our what is fashion marketing primer covers how the retention layer plugs into the wider channel mix.
Post purchase content that grows LTV
Post purchase content covers the four weeks after delivery on a first order. Styling emails that pair the purchased SKU with three complementary pieces. A fit review request at day seven when the buyer has worn the garment twice. A community moment at day fourteen with user photos of the same SKU. A second order incentive at day 28 with a category adjacent recommendation. Programs that publish the full post purchase sequence grow lifetime value 22 to 45 percent by month twelve on the same first order cohort, and the retention layer starts to carry the revenue growth the paid team used to carry alone.
Benchmarks inside fashion ecommerce marketing
Benchmarks make the plan honest. A DTC apparel brand reads its own numbers against the industry median every quarter and acts on the gaps that show up. Conversion rate. Blended cost per order. Return rate. Repeat purchase rate. Email revenue share. Each has an honest median for the revenue band, and the numbers change slowly year over year.
| Revenue band | Conversion rate | Blended CPO | Return rate (womenswear) | Day 90 repeat rate | Email revenue share |
|---|---|---|---|---|---|
| Under $80K monthly | 1.2% to 1.8% | $38 to $54 | 26% to 34% | 10% to 18% | 18% to 26% |
| $80K to $250K monthly | 1.6% to 2.4% | $28 to $46 | 24% to 32% | 16% to 24% | 22% to 30% |
| $250K to $600K monthly | 2.0% to 2.8% | $22 to $38 | 22% to 30% | 22% to 32% | 26% to 34% |
| $600K to $1.5M monthly | 2.4% to 3.4% | $18 to $32 | 20% to 28% | 28% to 38% | 28% to 36% |
| Above $1.5M monthly | 2.8% to 4.0% | $16 to $28 | 18% to 26% | 32% to 45% | 30% to 38% |
A founder who reads a monthly dashboard against these benchmarks catches the drift inside 30 days and adjusts the plan before the quarter closes. A founder who reads only the paid social dashboard catches the drift 90 days late, which usually means the correction shows up in the next quarter revenue instead of the current one. That single reporting habit is the difference between an apparel plan that grows and an apparel plan that runs in place while the founder wonders what actually changed under the surface. Founders scoping the wider paid team should read our fashion marketing agency guide for the retainer scope that sits above these benchmark reads.
How do you measure fashion ecommerce marketing honestly
Honest measurement of fashion ecommerce marketing runs on four data streams reconciled inside one weekly dashboard. Shopify revenue by UTM and discount code. Google Analytics 4 sessions and assisted conversion. Meta and TikTok ads platform attribution. A post purchase survey on every order that asks where the buyer first saw the brand. Each stream lies on its own.
The single biggest reporting mistake is trusting Meta own return on ad spend number as the campaign result. Meta over reports by 30 to 90 percent on apparel accounts because the pixel double counts view through and click through revenue that would have converted anyway. Google Analytics 4 under reports because the model discounts paid social influence on longer consideration windows. Shopify tells the truth on first order revenue but nothing on assisted revenue. Post purchase surveys catch the audience that saw the campaign on TikTok, searched a week later, and bought through direct traffic. The four streams together reconcile inside a 5 to 8 percent margin on a well tagged apparel account. Google’s attribution model documentation is the source every founder should read before arguing about which number is correct.
Every plan reports campaign level revenue against the campaign level budget with a 7 day and 30 day view. Anything shorter than 7 days is noise on an apparel buying cycle. Anything longer than 30 days is too late to change the current campaign trajectory. The founder reads the dashboard once a week on Monday morning before the review meeting, not once at the end of the quarter when the numbers are already locked into a bad direction.
Fashion ecommerce marketing in production
Boogie Board came to our team with a DTC ecommerce program running the same problem most apparel brands run at $340,000 monthly. Product pages with four images per SKU, no fit content on the size selector, a checkout that pushed size to step two on mobile, cost per acquisition at $150.92 and climbing, and a founder who read the paid social dashboard at face value every Monday. The plan looked busy on paper. The margin math looked thin on the P and L.
Our team rebuilt the ecommerce path around the five node stack. Rewrote the product page template with 8 to 12 images per SKU, garment measurements at the SKU level, and fit review pull quotes below the size selector. Moved size selection to first field at the top of the mobile checkout. Rebuilt the top 40 SKU catalog feed with lifestyle imagery and hand written titles. Turned on the seven core Klaviyo flows and a Attentive SMS list at week three. Server side tracking went in through Elevar in week two. Weekly Monday review meetings replaced the end of month post mortem, with the founder in the room and empowered to kill a campaign at week two.
Twelve months in, blended cost per acquisition dropped to $31. Conversion rate on the paid landing pages climbed 11 percent. Return rate on womenswear dropped from 38 percent to 26 percent. Day 90 repeat purchase rate grew from 22 percent to 41 percent. Managed ad budget grew to $650,000 monthly on the same margin profile. The result did not come from a magic new channel. It came from applying the five node stack, the checkout discipline, and the review cadence the plan required from day one.
The weekly review that keeps the plan honest
The Monday review meeting is where an apparel plan earns the right to keep spending. Forty five minutes, three agenda items, one decision. Read the reconciled dashboard. Review the top and bottom three ad creatives by cost per order. Decide whether the current campaign continues into next week, gets a creative pivot, or gets killed. The founder is invited and expected to make the kill decision when the numbers warrant it.
Every Monday review meeting eventually reaches the moment where somebody points at the flat performing creative and asks if the founder wants to give it one more week. The founder always says yes. The creative always underperforms for a second week. Nobody remembers who first suggested the extra week. Somewhere in the archive of every apparel brand shared drive, a flat creative is quietly generating more Monday meetings about itself than actual orders about anything on the site.
The kill rule is simple and it holds across every campaign archetype. Day 3 return on ad spend below 40 percent of target and day 7 return below 60 percent of target triggers a 24 hour creative pivot or a full kill. Programs that hold underperforming campaigns for the full run out of hope produce the flat quarters founders learn to fear. Programs that kill fast and reallocate to the winners produce the compounding quarters that make the retainer worth its rate. Founders new to structured plans assume the kill decision hurts the numbers. In practice, killing a flat creative at week two frees the budget to double down on the winner and grows the campaign result 20 to 45 percent inside the next 21 days on an apparel account.
Where fashion ecommerce marketing fits the wider stack
Fashion ecommerce marketing sits above the tactical channel work and below the annual brand strategy inside the growth stack. Every retainer allocation, every creative brief, and every founder decision on inventory rolls up to the five node plan the pod is running against. Programs that budget for tactics without the plan produce busy months with soft revenue. Programs that build the plan first produce quarters where every product page, every ad, and every email adds up to a single growth arc the founder can defend at a board meeting.
The retainer that runs the plan starts at $599 monthly on a 6 month contract and scales with revenue. The retainer covers merchandising audits, fit content templates, product page image direction, checkout audits, retention flow builds, weekly review meetings, and quarterly server side tracking audits. Founders scoping the wider agency side should also read our apparel fashion marketing hub for the broader deliverable list and pricing tiers by revenue band.
The retainer scales with revenue band, deliverable scope, and the number of active campaigns per quarter. A brand at $80,000 monthly runs a lean retainer with the founder in the review meeting. A brand at $600,000 monthly runs a fuller retainer with a dedicated pod and monthly media mix modeling reads. Every retainer tier ties back to the five node stack the plan requires, and every quarterly review closes the loop between the tactical channel work and the strategic growth arc the founder is defending on the P and L. Two outside reads worth an hour before the first plan cycle kicks off. Meta catalog quality reference above for feed hygiene. The Business of Fashion opinions section for the macro context that shapes which trends deserve budget in a given quarter on the merchandising side.
Return rate is the single margin killer on DTC apparel. Womenswear runs 22 to 30 percent, menswear 12 to 18 percent, accessories 6 to 10 percent. Two thirds of apparel returns cite fit or size as the reason. Fashion ecommerce marketing that ignores fit content spends the paid social budget twice on every return that goes back into inventory.
The plan builds a fit content stack on every SKU. Model height and size worn in the product description. Garment measurements at the SKU level, not the style level. Fit review notes pulled from customer reviews on a dedicated Fit tab. Size guides at the collection level with the actual measurement method photographed. Programs that publish the full fit stack on every SKU cut return rate 4 to 9 percentage points inside two quarters, which is the biggest margin move available in apparel without a supply chain change.
Where the fit content lives on the page
Fit content lives above the fold on desktop and inside the third scroll on mobile. The size chart lives one tap deep from the size selector, not three clicks deep behind a footer link. Fit review pull quotes live directly below the size selector so the buyer reads what the size chart says and what other buyers actually experienced in the same tap. That single change grows conversion rate 6 to 14 percent on apparel accounts we have tested inside 30 days, and it costs nothing in creative production because the copy already exists in the review corpus.
Fit tech worth funding
True Fit, Fit Analytics, and Bold Metrics carry the automated fit recommendation layer on scaled apparel programs. Each pulls buyer inputs (height, weight, common size in another brand) and recommends a size at add to cart. Return rate drops 3 to 7 percentage points on the SKUs where the tool is live and the buyer engages with the input flow. Below $250,000 monthly, the tool license outruns the return savings. Above $600,000 monthly, the math flips and the tool pays for itself inside a quarter.
Product page imagery inside fashion ecommerce marketing
Product page imagery is where a paid social click either converts or bounces inside eight seconds. The industry median product page ships four images per SKU. The winners ship eight to twelve, and every image answers a specific buyer question the paid ad already primed.
The imagery stack per SKU
A working stack per SKU carries model shot on size medium, model shot on size extra large or size fourteen so the buyer sees the fit at range, flat lay on a neutral ground for the utility view, detail shot on the fabric texture, detail shot on the hardware and stitching, back view on the model, side view on the model, movement clip of 4 to 8 seconds, and a scale shot next to a familiar object for accessories. Programs that publish all twelve image slots grow conversion rate 8 to 22 percent against the four image baseline, and Meta gets richer feed asset variants to test in the ad set.
Video that earns its production cost
Product page video works when it stays under 10 seconds, loops on autoplay, mutes by default, and shows movement the still shot cannot. Longer videos hurt page load and buyer patience without a conversion gain. A DTC apparel brand doing $340,000 monthly should budget $60,000 to $140,000 annually on product page video across the top 40 SKUs by contribution margin. Below that budget, the video shoot day math does not work and the founder ships either thin coverage on all SKUs or full coverage on the wrong ones. Shopify’s product photography guide is a useful outside read for founders scoping a first shoot.
Checkout inside fashion ecommerce marketing
Checkout on apparel carries a size selector as the first field, not the last. Programs that push size selection to a second step lose 4 to 9 percent conversion rate on the same traffic because the mobile buyer scrolls twice for a decision the desktop pattern buries. The mobile buyer decides in under six seconds whether the flow feels safe. Every friction point in that window costs margin.
The checkout structure that respects sizing
The size selector sits directly under the price, above the add to cart button. Sold out sizes stay visible with a strikethrough, not hidden, so the buyer reads the size chart against the availability without a filter reset. A restock notification input replaces the add to cart button on the sold out size. On mobile, the size selector expands into a tap sheet that shows the size chart and fit review pull quotes on the same swipe. That single pattern grows completed checkout rate 6 to 12 percent on apparel accounts we have measured inside 21 days of the deploy.
Shipping and returns copy at the payment step
Shipping thresholds, return windows, and exchange policy live inline at the payment step, not on a footer page. Apparel buyers who read the return policy at cart complete checkout 18 to 30 percent more often than buyers who never see it, and the return rate on those orders drops 2 to 5 percentage points because the buyer bought with the exchange window in mind. Founders who bury return policy on a footer link are trading the transparency dividend for a false conversion gain that costs margin on the back end.
Paid social inside fashion ecommerce marketing
Paid social carries 45 to 60 percent of first order revenue on DTC apparel between $80,000 and $600,000 monthly. Meta and TikTok are the two platforms that fund. Every other platform enters through a 90 day pilot with a hard kill date, not a slow bleed into the always on budget.
Creative velocity as the real budget
Paid social on apparel wins on creative velocity, not media budget. A brand shipping 6 to 12 fresh creative variants weekly across static, Reel, and TikTok formats produces 30 to 60 percent lower cost per order than the same brand shipping 2 to 3 variants weekly on the same media budget. Fashion audiences fatigue creative inside 5 to 9 days on the same face and product angle. The retainer needs to feed that fatigue rate, not fight it, and the creative production line has to run on a weekly cadence with a named producer.
The catalog feed that carries Shopping
Meta Advantage Plus Shopping and TikTok Shop pull directly from the Shopify product feed. Programs that let the feed run on default titles and default images produce 40 to 70 percent higher cost per order than programs that rewrite the top 40 SKU feed titles and swap the primary feed image to the highest performing lifestyle shot. Feed hygiene is the cheapest paid social gain available on an apparel account and the one most founders never open. Meta’s catalog quality reference covers the field level rules that shape delivery.
Retention inside fashion ecommerce marketing
Retention is the layer that decides whether the P and L runs on margin or grinds through paid acquisition to break even. A DTC apparel brand with a 30 percent day 90 repeat rate runs 20 to 35 percent more contribution margin per blended dollar of spend than the same brand at 15 percent. Retention is not one channel. It is a stack of email, SMS, loyalty, and post purchase content on a monthly calendar.
Email and SMS as the core
Email drives 25 to 35 percent of DTC apparel revenue when the flow set is complete. Welcome, browse abandonment, cart abandonment, post purchase, replenishment, VIP, and win back are the seven flows every brand needs live inside the first 90 days. SMS adds another 8 to 15 percent of revenue at a 5 to 12 percent list opt in rate. Klaviyo and Attentive dominate the DTC apparel tool stack because the two platforms handle 90 percent of the flow logic without custom development. Our what is fashion marketing primer covers how the retention layer plugs into the wider channel mix.
Post purchase content that grows LTV
Post purchase content covers the four weeks after delivery on a first order. Styling emails that pair the purchased SKU with three complementary pieces. A fit review request at day seven when the buyer has worn the garment twice. A community moment at day fourteen with user photos of the same SKU. A second order incentive at day 28 with a category adjacent recommendation. Programs that publish the full post purchase sequence grow lifetime value 22 to 45 percent by month twelve on the same first order cohort, and the retention layer starts to carry the revenue growth the paid team used to carry alone.
Benchmarks inside fashion ecommerce marketing
Benchmarks make the plan honest. A DTC apparel brand reads its own numbers against the industry median every quarter and acts on the gaps that show up. Conversion rate. Blended cost per order. Return rate. Repeat purchase rate. Email revenue share. Each has an honest median for the revenue band, and the numbers change slowly year over year.
| Revenue band | Conversion rate | Blended CPO | Return rate (womenswear) | Day 90 repeat rate | Email revenue share |
|---|---|---|---|---|---|
| Under $80K monthly | 1.2% to 1.8% | $38 to $54 | 26% to 34% | 10% to 18% | 18% to 26% |
| $80K to $250K monthly | 1.6% to 2.4% | $28 to $46 | 24% to 32% | 16% to 24% | 22% to 30% |
| $250K to $600K monthly | 2.0% to 2.8% | $22 to $38 | 22% to 30% | 22% to 32% | 26% to 34% |
| $600K to $1.5M monthly | 2.4% to 3.4% | $18 to $32 | 20% to 28% | 28% to 38% | 28% to 36% |
| Above $1.5M monthly | 2.8% to 4.0% | $16 to $28 | 18% to 26% | 32% to 45% | 30% to 38% |
A founder who reads a monthly dashboard against these benchmarks catches the drift inside 30 days and adjusts the plan before the quarter closes. A founder who reads only the paid social dashboard catches the drift 90 days late, which usually means the correction shows up in the next quarter revenue instead of the current one. That single reporting habit is the difference between an apparel plan that grows and an apparel plan that runs in place while the founder wonders what actually changed under the surface. Founders scoping the wider paid team should read our fashion marketing agency guide for the retainer scope that sits above these benchmark reads.
How do you measure fashion ecommerce marketing honestly
Honest measurement of fashion ecommerce marketing runs on four data streams reconciled inside one weekly dashboard. Shopify revenue by UTM and discount code. Google Analytics 4 sessions and assisted conversion. Meta and TikTok ads platform attribution. A post purchase survey on every order that asks where the buyer first saw the brand. Each stream lies on its own.
The single biggest reporting mistake is trusting Meta own return on ad spend number as the campaign result. Meta over reports by 30 to 90 percent on apparel accounts because the pixel double counts view through and click through revenue that would have converted anyway. Google Analytics 4 under reports because the model discounts paid social influence on longer consideration windows. Shopify tells the truth on first order revenue but nothing on assisted revenue. Post purchase surveys catch the audience that saw the campaign on TikTok, searched a week later, and bought through direct traffic. The four streams together reconcile inside a 5 to 8 percent margin on a well tagged apparel account. Google’s attribution model documentation is the source every founder should read before arguing about which number is correct.
Every plan reports campaign level revenue against the campaign level budget with a 7 day and 30 day view. Anything shorter than 7 days is noise on an apparel buying cycle. Anything longer than 30 days is too late to change the current campaign trajectory. The founder reads the dashboard once a week on Monday morning before the review meeting, not once at the end of the quarter when the numbers are already locked into a bad direction.
Fashion ecommerce marketing in production
Boogie Board came to our team with a DTC ecommerce program running the same problem most apparel brands run at $340,000 monthly. Product pages with four images per SKU, no fit content on the size selector, a checkout that pushed size to step two on mobile, cost per acquisition at $150.92 and climbing, and a founder who read the paid social dashboard at face value every Monday. The plan looked busy on paper. The margin math looked thin on the P and L.
Our team rebuilt the ecommerce path around the five node stack. Rewrote the product page template with 8 to 12 images per SKU, garment measurements at the SKU level, and fit review pull quotes below the size selector. Moved size selection to first field at the top of the mobile checkout. Rebuilt the top 40 SKU catalog feed with lifestyle imagery and hand written titles. Turned on the seven core Klaviyo flows and a Attentive SMS list at week three. Server side tracking went in through Elevar in week two. Weekly Monday review meetings replaced the end of month post mortem, with the founder in the room and empowered to kill a campaign at week two.
Twelve months in, blended cost per acquisition dropped to $31. Conversion rate on the paid landing pages climbed 11 percent. Return rate on womenswear dropped from 38 percent to 26 percent. Day 90 repeat purchase rate grew from 22 percent to 41 percent. Managed ad budget grew to $650,000 monthly on the same margin profile. The result did not come from a magic new channel. It came from applying the five node stack, the checkout discipline, and the review cadence the plan required from day one.
The weekly review that keeps the plan honest
The Monday review meeting is where an apparel plan earns the right to keep spending. Forty five minutes, three agenda items, one decision. Read the reconciled dashboard. Review the top and bottom three ad creatives by cost per order. Decide whether the current campaign continues into next week, gets a creative pivot, or gets killed. The founder is invited and expected to make the kill decision when the numbers warrant it.
Every Monday review meeting eventually reaches the moment where somebody points at the flat performing creative and asks if the founder wants to give it one more week. The founder always says yes. The creative always underperforms for a second week. Nobody remembers who first suggested the extra week. Somewhere in the archive of every apparel brand shared drive, a flat creative is quietly generating more Monday meetings about itself than actual orders about anything on the site.
The kill rule is simple and it holds across every campaign archetype. Day 3 return on ad spend below 40 percent of target and day 7 return below 60 percent of target triggers a 24 hour creative pivot or a full kill. Programs that hold underperforming campaigns for the full run out of hope produce the flat quarters founders learn to fear. Programs that kill fast and reallocate to the winners produce the compounding quarters that make the retainer worth its rate. Founders new to structured plans assume the kill decision hurts the numbers. In practice, killing a flat creative at week two frees the budget to double down on the winner and grows the campaign result 20 to 45 percent inside the next 21 days on an apparel account.
Where fashion ecommerce marketing fits the wider stack
Fashion ecommerce marketing sits above the tactical channel work and below the annual brand strategy inside the growth stack. Every retainer allocation, every creative brief, and every founder decision on inventory rolls up to the five node plan the pod is running against. Programs that budget for tactics without the plan produce busy months with soft revenue. Programs that build the plan first produce quarters where every product page, every ad, and every email adds up to a single growth arc the founder can defend at a board meeting.
The retainer that runs the plan starts at $599 monthly on a 6 month contract and scales with revenue. The retainer covers merchandising audits, fit content templates, product page image direction, checkout audits, retention flow builds, weekly review meetings, and quarterly server side tracking audits. Founders scoping the wider agency side should also read our apparel fashion marketing hub for the broader deliverable list and pricing tiers by revenue band.
The retainer scales with revenue band, deliverable scope, and the number of active campaigns per quarter. A brand at $80,000 monthly runs a lean retainer with the founder in the review meeting. A brand at $600,000 monthly runs a fuller retainer with a dedicated pod and monthly media mix modeling reads. Every retainer tier ties back to the five node stack the plan requires, and every quarterly review closes the loop between the tactical channel work and the strategic growth arc the founder is defending on the P and L. Two outside reads worth an hour before the first plan cycle kicks off. Meta catalog quality reference above for feed hygiene. The Business of Fashion opinions section for the macro context that shapes which trends deserve budget in a given quarter on the merchandising side.
Frequently asked questions
What does fashion ecommerce marketing cover in 2026?
Fashion ecommerce marketing covers the whole apparel path from first ad impression to delivered, kept, and second order. The stack runs on five nodes. Merchandising and product page structure. Size and fit content that cuts return rate. Product page imagery and short form video that answer buyer questions. Checkout structure that puts size selection first on mobile. Post purchase retention through email, SMS, and loyalty. Each node ties to a single growth number the pod defends at the Monday review. Programs that skip any node cap at their current revenue band inside twelve months because the compounding customer base never forms and paid acquisition has to carry margin the retention layer should be earning.
How does fashion ecommerce marketing cut return rate on apparel?
Return rate on womenswear runs 22 to 30 percent and two thirds of returns cite fit or size. The plan cuts return rate by building a fit content stack on every SKU. Model height and size worn in the product description. Garment measurements at the SKU level, not the style level. Fit review pull quotes below the size selector. Size guides with the actual measurement method photographed. Programs that publish the full fit stack cut return rate 4 to 9 percentage points inside two quarters, which is the biggest margin move available in DTC apparel without a supply chain change or a price increase, and it costs nothing in creative production because the copy already lives in the review corpus.
How much does fashion ecommerce marketing cost per month?
Fashion ecommerce marketing costs $8,000 to $22,000 monthly in blended ad spend and retainer for a launch year brand under $80,000 in revenue. Mid market brands between $80,000 and $250,000 monthly spend $22,000 to $80,000 on the same blended line. Scaled brands between $250,000 and $600,000 monthly spend $80,000 to $250,000. The retainer for the pod running the plan starts at $599 monthly on a 6 month contract and scales with revenue band and deliverable scope. Founders track ad spend and pod retainer on separate P and L lines so the campaign to campaign comparison stays honest across the year without rebuilding the spreadsheet every quarter.
Which KPIs should fashion ecommerce marketing report against?
Fashion ecommerce marketing reports against a KPI stack that maps to first order revenue, kept revenue, and repeat revenue. First order side reports conversion rate, blended cost per order, and day 7 return on ad spend. Kept revenue side reports return rate by category and average order value net of returns. Repeat revenue side reports day 30 and day 90 repeat purchase rate, email revenue share, and lifetime value at day 180. All three reconcile inside one weekly dashboard that pulls from Shopify, Google Analytics 4, Meta and TikTok, and a post purchase survey. Programs that report only cost per order run a plan that reads the top of the funnel and misses the margin story.
How do you know when a fashion ecommerce marketing channel is not working?
A fashion ecommerce marketing channel is not working when it fails to hit 60 percent of a documented revenue target inside a 90 day pilot. New channels enter through a hard kill date and a revenue target the founder signs on day one. Below 40 percent of target at day 90, the channel gets killed and the budget goes back to the winning channels. Between 40 and 60 percent, the channel gets a 30 day extension with a focused creative test. Above 60 percent, the channel gets a full budget line for the next quarter. Programs that let pilots run past the kill date produce cluttered stacks that eat 20 to 30 percent of the marketing budget on channels that never earn their line, which is the failure mode we see most often at the $150,000 to $600,000 monthly stage on DTC apparel accounts.
Book your free 30-minute strategy call.
No spam, no sales rep. We use your email to schedule your call with a senior strategist. That is it.
More from the blog
View all articles → Digital Marketing
 Dental Marketing Tips That Compound Into New Patients
Read article Digital Marketing
 Ecommerce Marketing Strategies That Drive Real DTC Revenue
Read article Digital Marketing