
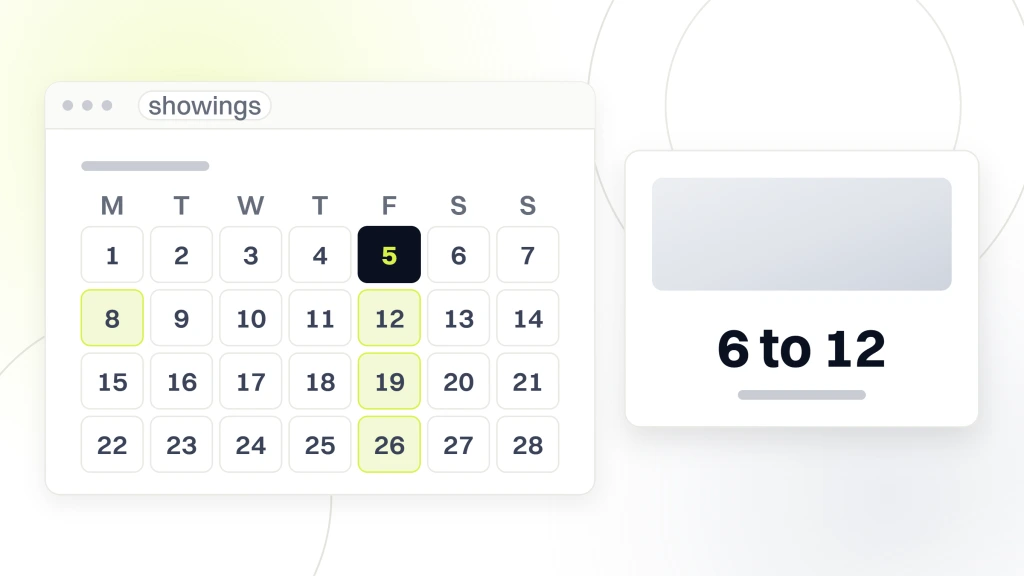
A real estate marketing calendar decides whether production stays flat between February and October or lands a steady 6 to 12 booked showings per week. Same market, same commission rate, same MLS. What moves the schedule is a written calendar the agent, ISA, and marketing coordinator all work from. This guide is the schedule we build into agent teams and brokerages, month by month. Themes, email cadences, ad angles, open house scripts. Read it in 12 minutes and hand it to the ISA on Monday morning.
You’ll get the 12 monthly themes that anchor the plan and the seasonal real estate marketing ideas that map to buyer and seller intent. You’ll get the paid ad angles that pull the most tour requests each month, the open house and event cadence that fills a Sunday tour tape, and the metrics from a Los Angeles luxury team engagement where a year of themed marketing doubled site users and pageviews against the prior baseline.
April and May real estate marketing schedule plays
April and May run peak spring market on the annual plan. Every open house every Sunday. Every paid ad on aggressive buyer angles. Every email carrying fresh listings. April 15 through May 15 typically produces 40 to 55% of the annual buyer tour volume for most agent teams. The calendar work is not about volume during these 2 months. It is about capacity management so the team does not drop showings.
April also carries the tax season content angle. Homeowners refinancing tax filings often move on a home purchase or sale decision between April 20 and May 20. A single email covering the tax implications of selling and buying in the same calendar year captures those decisions. See IRS Publication 523 on selling your home for the primary residence exclusion rules that shape most seller decisions.
April open house cadence
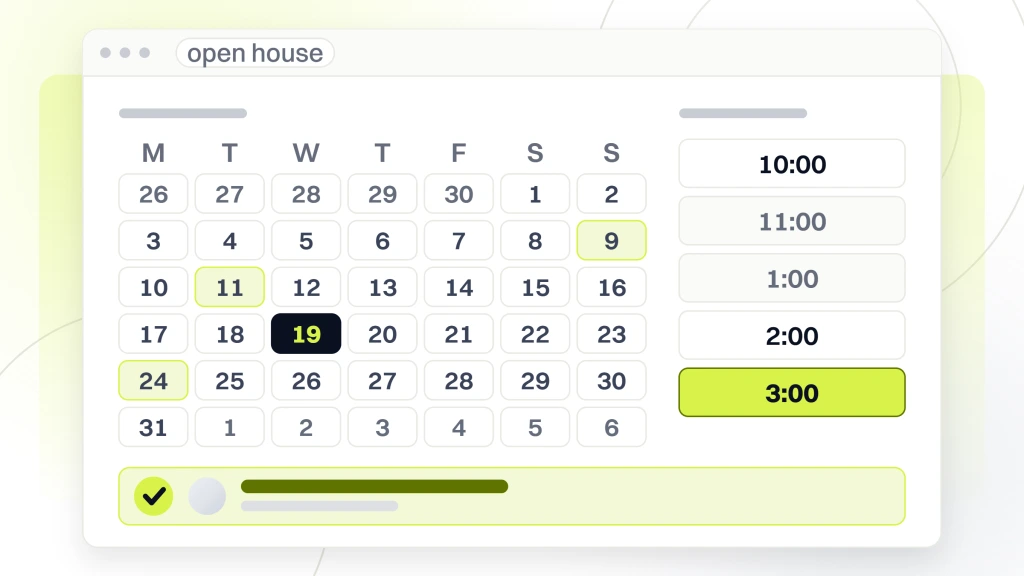
April open houses run every Sunday between 1 and 4 PM at every listing on the tape. Email the geo farm Thursday. Boost the Facebook post Friday. Post printed open house signs Saturday. Sunday tour tape averages 8 to 16 tours per agent per open house in a busy suburban market. Send the follow-up email to every sign-in name that same Sunday evening. Same-day follow-up produces 1 to 3 buyer consultation bookings per open house from cold sign-ins.
May listing acceleration push
May is the month to push sellers off the fence. The paid ad angle shifts from buyer keywords to seller keywords. Every seller email pulls the local sold comps from the prior 60 days. Every open house handout carries a QR code to a home-value landing page. The May listing push adds 2 to 4 new listings per agent to the team tape by the end of the month. Those listings anchor the June and July tour volume when new buyer traffic starts to slow.
June and July seasonal real estate marketing ideas
June and July shift the plan from peak volume to family and lifestyle content. School district guides, community events, and summer neighborhood tours carry the content mix. Buyer volume drops 15 to 25% off the April peak. Seller volume stays strong. The calendar work is about content depth so the buyer list stays warm and the seller list keeps producing new listings. This is also the ideal seasonal marketing window for a school district content push.
Batch produce the summer content assets in mid-May. Every school district guide, every community event roundup, every summer neighborhood spotlight lives in the content queue before June 1. That single production choice frees the coordinator to run the daily send cadence without scrambling on assets.
June school district guide asset
The June school district guide is one of the highest-value assets on the annual calendar. Every school district in the market gets a 1,500 to 2,500 word landing page. Test scores, boundary maps, attendance zones, notable programs. Every family buyer running a search on a district name lands on the agent site. That single asset produces 30 to 80 organic leads per month across the summer if it ranks on the first page for the district-name searches.
July community content angle
July community content covers neighborhood profiles, restaurant roundups, and community event coverage. Every content piece links back to active listings in that neighborhood. Every content piece carries a form asking for the reader’s home search preferences. July community content produces 20 to 40 buyer inquiries per month for a solo agent team and 60 to 140 for a mid-size brokerage.
August and September real estate marketing schedule plays
August and September pivot the calendar toward the fall listing surge. Every buyer email covers the “close before year end” tax angle. Every seller email covers the “list now to close by December 31” timeline. The paid ad mix shifts back toward seller keywords. Volume climbs back toward spring levels by the end of September. The calendar work is about hitting the seller side hard before the October rate news cycle changes buyer psychology.
August transition messaging
August transition messaging pulls the buyer list toward September action. The paid ad angle covers “start your fall home search now” with a clear 90-day timeline. The email cadence adds a weekly market update covering inventory, days on market, and sold prices. That data-heavy weekly update produces 3 to 6 buyer consultation bookings per 1,000 subscribers each month across August and September.
September close by year end angle
September opens the “close by year end” content window. Every buyer email covers the tax angle. Every seller email covers the December 31 closing timeline. The open house cadence returns to every Sunday at every listing. Paid ad spend climbs 20 to 40% off the summer baseline. September closes typically drive 15 to 25% of the annual transaction volume across most agent teams.
October, November, and December seasonal real estate marketing ideas
October, November, and December carry the fall and holiday content mix. Halloween community coverage in October. Thanksgiving neighborhood spotlight in November. Year-in-review market analysis in December. Buyer volume drops 30 to 50% off the September peak. Seller volume stays strong through November then drops sharply in December. The calendar work is about brand touch across the holiday months so the January pipeline restarts strong.
October Halloween community content
October Halloween community content covers neighborhood Halloween event coverage, best trick-or-treat streets, and family-friendly holiday activities. Every content piece links to active listings in the covered neighborhoods. Every piece carries a soft home-search CTA. October Halloween content produces 15 to 30 buyer inquiries per month for a solo agent team and pulls strong social engagement across Facebook and Instagram community groups.
December year-end wrap
December year-end wrap covers the annual market analysis. Median sold price. Days on market. Inventory levels. Year-over-year change. That single content piece produces 50 to 120 direct email replies from the agent list and anchors the January content restart. Send the year-end wrap the second week of December. Follow with the January outlook the first week of January. Together those 2 assets restart the calendar with high engagement.
Real estate marketing calendar at a glance
The 12-month table below anchors the entire schedule. Print it. Assign an owner to each monthly theme. Batch produce each quarter in a single work session 30 days before the quarter starts. That production model turns the calendar from a stress point into a rhythm the whole team works from.
| Month | Theme | Primary asset |
|---|---|---|
| January | Fresh-start buyer plans | First-time buyer guide |
| February | Romance and lifestyle | Couples home buyer email |
| March | Spring prep for sellers | Home-value landing page push |
| April | Peak spring buyers | Every-Sunday open house cadence |
| May | Listing acceleration | Seller comps email + QR codes |
| June | School district content | District guide landing pages |
| July | Community lifestyle | Neighborhood profile posts |
| August | Fall search transition | Weekly market update email |
| September | Close-by-year-end push | Tax-angle buyer email |
| October | Halloween community | Neighborhood event roundup |
| November | Thanksgiving spotlight | Local giving guide |
| December | Year-end market wrap | Annual market analysis |
Quarterly review keeps the calendar honest
Quarterly reviews run 90 minutes on the first Monday after each quarter closes. Pull the results for every asset. Rank by inquiry volume. Flag the bottom 20% for retirement or rework. Rebuild the coming quarter around what actually produced. That single review keeps the calendar sharp and stops the team from running weak assets on inertia. Every agent team that runs quarterly reviews sees calendar performance climb 15 to 30% each year.
Annual refresh on data-driven assets
The annual refresh runs in early December for the next calendar year. Update every school district guide with the current test scores. Refresh every neighborhood profile with current inventory and median sold data. Refresh every landing page with the current market metrics. That annual refresh keeps the evergreen assets ranking on Google and pulling organic traffic every month.
Tracking the real estate marketing schedule month by month
Tracking a real estate marketing schedule needs one dashboard, four data sources, and a weekly check-in. GA4 for the site side. CallRail for phone tracking. The email tool for open, click, and reply data. Facebook Business Manager for paid ad results. Every asset carries a UTM parameter so the source of every inquiry maps back to the calendar asset that produced it.
Every email records the open rate, the click rate, the reply count, and the booking count. Every paid ad records the impression volume, the click count, the cost per click, and the booking count. Every open house records the sign-in count and the follow-up booking count. Every content post records the reach, the save count, and the buyer inquiry count.
That data lives on a single dashboard the agent, ISA, and marketing coordinator all check weekly. GA4 handles the site-side tracking. CallRail handles the phone tracking. Mailchimp campaign reports or Constant Contact handle the email tracking. Facebook Business Manager handles the paid ad tracking. Every one of these tools integrates into a Google Sheet the coordinator maintains for the whole calendar. See GA4 conversion tracking setup for the base configuration.
Monthly marketing standup structure
The monthly marketing standup runs 45 minutes on the first Monday of the month. Review the prior month’s results by asset. Confirm the current month’s plan. Assign owners to any late assets. That single meeting keeps the calendar on track and catches any asset that will not make its scheduled send. Teams that skip this meeting see 20 to 30% of the calendar assets slip out of the intended week.
Attribution across the calendar
Attribution across a 12-month plan needs a 180-day lookback window. A buyer who downloads the January first-time buyer guide might not book a consultation until April. Any attribution model with a 30-day window misses that connection and the January content looks like it did nothing. Configure GA4 with the extended lookback. That single setting change shows the team which calendar assets produce the closed transactions.
Case study on a Los Angeles luxury team and a year of themed marketing
Real Estate · Luxury Team · Los Angeles, CA ran a themed marketing calendar with the Redefine Web team. The structure covered monthly themes tied to the LA luxury cycle. February romance. April spring listings. June architect open houses. September before-year-end acquisition timing. December year-in-review. Each theme carried its own email cadence, paid ad angle, and video content asset.
Results across the most recent cycle. Site users up 100% against the prior baseline. New visitors up 100.1%. Pageviews up 102.6%. The calendar rhythm let the marketing coordinator batch 4 quarterly production sessions rather than 12 monthly panics. Content quality stayed consistent. Send dates hit their windows. The compounding effect over the year produced the pageview growth with the same coordinator hour count as the prior year. See our commercial real estate marketing strategies guide for the CRE-side application of the same calendar workflow.
Los Angeles luxury team calendar growth
+100% users. +100.1% new visitors. +102.6% pageviews. Those 3 metrics landed with the calendar workflow supporting the rest of the marketing engagement. The calendar itself did not create all of the growth. The custom site build, brand refresh, and IDX integration carried most of it. The calendar contributed the consistent monthly touch that kept the buyer and seller list warm across quarterly cycles.
Why batching produced the coordinator time savings
The 4 quarterly production sessions each ran 3 to 4 hours. Twelve monthly panic sessions each ran 3 to 5 hours. The batch model saved 20 to 30 hours of coordinator time per year and produced higher-quality assets. The writer saw the whole quarter arc during production of the first asset. That workflow transfer applies to any agent team running the calendar year over year.
More proof from the real estate portfolio
Two other real estate wins from the same playbook show how a written calendar and a conversion-ready site work together. Abels Residential, a boutique London letting agency, hit 20+ qualified rental leads per month, ranked 300+ keywords on Google’s first page, and held page load under 2 seconds. The calendar there ran month-by-month on rental-cycle content, seasonal renter guides, and neighborhood landing pages.
McCarthy Court, a 7-unit luxury Sidcup development, sold out 100% in 3 months pre-completion through an immersive virtual showcase site. That launch pulled 60+ qualified pre-sale leads and 10K campaign visits inside the pre-construction window. A tight calendar of weekly reporting, phased content drops, and eco-conscious lifestyle storytelling drove buyers through the funnel before the physical building even opened.
Budget on a full real estate marketing calendar
A full annual plan runs $1,200 to $2,800 per month for a solo agent team. Mid-size brokerages with 8 to 20 agents run $3,600 to $6,400 per month. The budget covers content production for 12 monthly themes, email tool subscription, paid ad management, and reporting. Every agent team we run this program for pays back the annual budget inside 4 to 6 months on booked consultations from the calendar-driven pipeline.
The retainer starts at $1,499 per month for the smallest programs and scales with content depth and paid ad management scope. Larger brokerages layer on IDX-integrated listing feeds, per-agent branded email domains, and per-listing paid ad micro-budgets. Every one of these adds cost but produces measurable pipeline. The base calendar workflow described above works at every budget tier from solo to enterprise.
Solo agent calendar budget
Solo agent teams run the calendar for $1,200 to $1,800 monthly if the agent writes some of the content. If a marketing coordinator writes everything, the budget lands at $2,200 to $2,800 monthly. Paid ad spend sits on top at $600 to $1,200 monthly. Total annual investment lands between $22,000 and $48,000 depending on production model and paid budget. Return typically runs 3 to 6 closed transactions attributable to the calendar per year.
Team brokerage calendar budget
Mid-size brokerages with 8 to 20 agents run the calendar for $3,600 to $6,400 monthly. Paid ad spend sits on top at $2,400 to $6,800 monthly. The brokerage-level calendar produces enough volume to feed all agents on the team and typically closes 24 to 60 transactions per year attributable to the calendar pipeline. Every mid-size brokerage we run this at treats the calendar as core operational infrastructure. For the email side of the same program, see our real estate email marketing guide.
Where your real estate marketing calendar rollout starts
Start with the 12-month table above. Print it. Assign an owner to each monthly theme. Batch produce Q1 (January, February, March) in a single 4-hour work session in early December. Batch produce Q2 in March. Batch produce Q3 in June. Batch produce Q4 in September. That single production model turns the calendar from a stress point into a rhythm the whole team works from.
Second, wire up the tracking dashboard so every asset records its own metrics. Third, book the monthly marketing standup on the first Monday of every month. Fourth, run the first quarterly review 90 days in and adjust the remaining 9 months based on what worked. Every one of these actions produces a measurable outcome inside the first quarter. See our real estate marketing ideas guide for tactical angles you can plug into any monthly theme.