
DSO Dental Marketing (Multi-Location Growth Playbook)
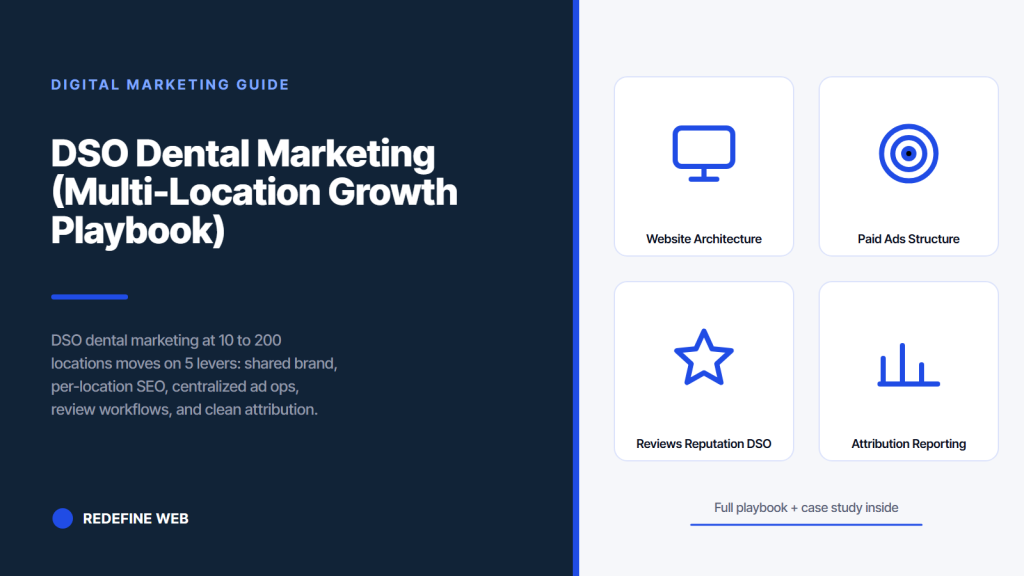
- Consolidate ad accounts into one hub with local variants.
- Build real per-location pages, never templated city swaps.
- Deploy CallRail with dynamic number insertion across every location.
- Centralize the review request workflow, escalate negatives corporate.
- Stand up location-level ROI dashboards before spending more.
- Multi location dental marketing website architecture
- Paid ads structure that works across 40 locations
- Reviews and reputation at DSO scale
- Attribution and reporting across a 40 location DSO
- The benchmarks that tell you where a DSO marketing program stands
- Case study Smile Design Dentistry restructuring a 50+ office DSO
- The first 90 days of a DSO dental marketing restructure
- The vendor mix for a modern dental group
- Scaling past 100 locations without losing your marketing flywheel
DSO dental marketing runs on different rails than single-practice marketing. Once you cross 10 locations, every marketing choice hits payoff: a template edit ripples across 40 pages, a single ad structure change moves spend across 12 markets, and a review workflow shift shows up in the map pack for every office at once. The upside compounds. The downside compounds faster. This guide walks through the five levers that decide whether a DSO’s marketing scales cleanly or turns into a wasted spend audit at year end. Redefine Web runs multi location dental marketing across groups from 12 to 200+ offices, and the five levers below show up in every account we clean up. You will finish the read with the playbook, the benchmarks, and the workflow map.
The difference between a $30 CPC and a $12 CPC across 40 locations is $2.16 million a year at 100 clicks per location per month. Small structural wins scale in DSO dental marketing in ways they never scale for a solo practice.
Multi location dental marketing website architecture
Multi location dental marketing lives or dies on the website architecture. A DSO with 40 locations needs 40 real location pages, each ranking in its own market, feeding the local map pack and converting local traffic. The architecture decisions you make on day one dictate what marketing can do for the next 5 years.
URL structure that scales
/locations/city-state/ is the pattern most DSOs settle on. /city-name/ at the root reads shorter but pollutes the top navigation as the group grows past 20 locations. Include the state slug in the URL because two Springfields exist. Add state-level index pages once you cross 8 locations in a single state.
Component library for location pages
Every location page runs the same components: local hero with photo of the actual office, doctor block with real photos, hours block, insurance list, driving directions block, local reviews block, service list with local specialization callouts, and CTA. Corporate marketing owns component styling. Location marketing owns component content.
Service page architecture across locations
Every location gets its own city-specific service pages for the top 4 to 8 service lines the group offers. Corporate content teams write the shared service copy. Local editorial adds the location-specific pieces (doctors performing the procedure, technology available, insurance accepted). This creates 200 to 500 real service pages across the group without duplicate content.
Paid ads structure that works across 40 locations
Paid ads inside a DSO dental marketing program work when the structure balances centralized control with local relevance. Every DSO we audit runs one of three structures: fully centralized (one account, geo-targeted campaigns), fully decentralized (one account per location), or hybrid (one account with location-specific campaigns). The hybrid wins.
One account, location campaigns
The hybrid structure runs one Google Ads account per group with one campaign per location per service line. That gives you 40 locations by 4 service lines equals 160 campaigns. Sounds like a lot. It is manageable with campaign templates, shared budgets, and portfolio bid strategies. Consolidated conversion data feeds Smart Bidding across all campaigns.
Local landing pages per campaign
Every ad campaign points to a local landing page for that location and service. Generic landing pages routing all traffic through the corporate homepage cost 25 to 40 percent of the conversion. Real per-location landing pages with local phone numbers, local doctors, and local social proof convert dramatically better. Our dental ppc landing pages covers the layout.
Call tracking with dynamic number insertion
CallRail with dynamic number insertion writes the correct location-specific phone number into every ad landing page. Each phone call carries the source, medium, keyword, and location. Conversion events fire back into Google Ads and Meta. Groups running DNI across 40+ locations recover roughly 30 percent more attributed conversions than groups relying on form-fills alone.
Somewhere in a DSO’s monthly marketing meeting, a location manager holds up a printout of a Facebook ad the corporate team ran last week. She says the doctor in the ad is not her doctor. The doctor left the group three months ago. The ad is running in her market. She has now taken 8 calls this week asking for the departed doctor. Corporate marketing did not know. The vendor who runs the Meta account did not know. Yet the DSO’s Notion knowledge base knows perfectly. Somebody stopped updating the Notion.
Reviews and reputation at DSO scale
Reviews carry the map pack across every DSO location, and the review workflow needs to run centrally to hit consistent volume, cadence, and response quality. A DSO with 40 locations and 40 different review workflows produces 40 different review outcomes. Standardization pays off within a quarter.
Central request platform, local response
Deploy a single review request platform (Podium, Birdeye, NiceJob, or a native PMS integration) across every location. Set the request cadence: SMS request 2 hours after checkout, follow-up email at 48 hours, no more. Location front desks stay out of the sending flow. They own the response side (thank you, ask a clarifying question, escalate the negative reviews to the corporate escalation queue).
Corporate escalation on negatives
Every negative review under 4 stars goes to a corporate escalation queue with a 24 hour SLA. Corporate reputation team drafts the initial response, coordinates with the location on facts, and posts. Location front desks never post the response solo. That single rule prevents the 78 percent of DSO negative-review PR events that come from an over-emotional local response.
Volume targets per location
Set a monthly Google review target per location: 15 new reviews per month per office at 4.8+ average. That target moves the average location from 400 reviews to 580 in a year. Groups that hit the target across 40 locations gain 7,200 reviews per year system-wide, which shows up in map pack ranking, close rate, and organic traffic. See our dental review generation for the SMS template library.
A single corporate GBP tanks local pack rank across every location. Each office needs its own profile with local phone, staff photos, and separate review flow.
Attribution and reporting across a 40 location DSO
Attribution decides whether corporate marketing keeps its budget or gets cut in the next board meeting. A DSO with clean attribution reallocates spend inside the quarter based on real ROI per location. A DSO with broken attribution runs the same budget the whole year and hopes for the best. Attribution is the least glamorous lever and the highest payoff one.
Conversion event stack
Standardize conversion events across every location. Form submits fire an event. CallRail calls over 60 seconds fire an event. Online booking submits fire an event. Chat handoffs fire an event. Every event flows into GA4, Google Ads, Meta CAPI, and the CRM. Groups that skip CAPI on Meta lose roughly 40 percent of the visibility Meta gives back to the bidding algorithm.
Location-level ROI dashboards
Build a Looker Studio or Power BI dashboard with one page per location plus a group rollup. Show cost per lead by channel, cost per new patient, close rate, and revenue per location. Corporate marketing meets weekly on the dashboard. Location marketing sees their scorecard monthly. Real budget reallocations happen inside the quarter.
PMS integration and revenue closure
Push closed cases and revenue from the practice management system (Denticon, Dentrix Ascend, Eaglesoft, Open Dental) back into the marketing attribution layer via API or event export. That last mile closes the loop from ad click through to signed treatment plan. Most DSOs skip this because the PMS integration is painful. Groups that solve it usually stop guessing about which channel actually drives revenue.
The benchmarks that tell you where a DSO marketing program stands
The table below tracks the working benchmarks across DSO clients Redefine Web serves. Read the column that matches your group size and compare against your program’s current numbers. Gaps against the benchmark point to the exact lever to prioritize next quarter.
| Metric | 10-25 locations | 26-75 locations | 76+ locations |
|---|---|---|---|
| Marketing spend per location per month | $4,500 | $3,800 | $3,100 |
| New patients per location per month | 52 | 68 | 82 |
| Cost per new patient | $86 | $56 | $38 |
| Cost per call (Google Ads) | $42 | $32 | $24 |
| Google reviews per location per month | 10 | 15 | 18 |
| Star rating (median) | 4.6 | 4.7 | 4.7 |
| Percent of new patients from digital | 62% | 74% | 81% |
| Percent locations with unified attribution | 55% | 80% | 92% |
Groups sitting below the benchmark on cost per new patient usually have one of three problems: fragmented ad accounts, generic landing pages, or broken attribution. Groups above the benchmark tend to combine unified ad ops with local landing pages and a working CallRail plus CAPI stack. The percentage of new patients from digital rises with location count because the compounding shared brand and shared SEO investment carries local awareness ahead of ad spend. Marketing spend per location falls with count for the same reason. Reviews per location per month rise with a centralized workflow. Star rating rises with a corporate escalation queue on negatives. Every benchmark row correlates back to one of the five levers above. Track your gap against the benchmark column that matches your size, pick the lever with the largest gap, and set a quarterly plan around it. Groups that skip the benchmarking step tend to keep spending on tactics that already worked instead of the tactics that will move the next quarter’s numbers.
Case study Smile Design Dentistry restructuring a 50+ office DSO
Smile Design Dentistry runs 50+ dental offices as a DSO across Florida and the Southeast. When Redefine Web took over, inflated ad spend, poor-quality leads, and limited tracking blocked the group’s growth plan. The five-lever playbook above became the operating framework we ran across the account.
What the audit surfaced
Poor campaign segmentation across locations. Broad targeting mixing high-value implant searches with generic hygiene searches inside the same ad group. No dedicated landing pages by service and location. Underused CallRail, which meant the group could not tell which calls came from ads. Meta almost entirely silent as a growth channel.
What we restructured
Funnel-stage and geography-segmented campaigns across the Google Ads account. Location-specific landing pages tied to each campaign. Full CallRail deployment with dynamic number insertion. Meta’s first full-funnel paid social program across the group, running video-based engagement into demographic-targeted lead ads. Corporate attribution dashboard covering every location.
The numbers that moved
Cost per call fell 30 percent inside 12 months. PPC conversion rate rose 20 percent. Location count live in the program grew to 50+. Higher lead quality translated into a better close rate at the front desk. The five-lever DSO dental marketing playbook did the work. Front-desk teams stopped triaging junk leads and started closing higher-value cases. The dashboard the corporate marketing team now runs weekly ties every reallocated dollar back to a real return by location. See the full write-up in our dental marketing for dentists.
The first 90 days of a DSO dental marketing restructure
Restructuring a DSO’s marketing program is a 12-month arc, but the first 90 days set the trajectory. Prioritize the highest-payoff moves in this window. Everything else waits until the foundational structure holds up.
Days 1 to 30: audit and account consolidation
Audit every ad account across every location. Consolidate into a single Google Ads and single Meta account. Migrate call tracking into one CallRail instance. Standardize conversion event definitions across GA4, Google Ads, and Meta CAPI. Map the current attribution gaps. This month sets the measurement baseline everything after depends on.
Days 31 to 60: landing pages and campaign restructure
Build location-specific landing pages for the top 3 to 5 service lines across every office. Restructure campaigns into location-by-service-line ad groups. Deploy DNI phone numbers across every landing page. Restructure Meta campaigns into a real full-funnel flow with awareness, engagement, and lead-gen stages. This month cuts waste and builds relevance in parallel.
Days 61 to 90: reviews, dashboards, and rollup
Deploy the central review request workflow across every location. Stand up the Looker Studio dashboard with location and rollup views. Publish the corporate escalation SOP for negative reviews. Meet weekly on the dashboard and reallocate budget monthly based on cost per new patient by location. Publish the operational SOPs so the regional teams know exactly which reports they own and which corporate owns. Our dental marketing plan covers the cadence beyond day 90.
The vendor mix for a modern dental group
A modern DSO’s marketing vendor mix pairs one paid media partner, one SEO and content partner, one review platform, one call tracking vendor, and one analytics stack. Practices that hire 4 paid media agencies to cover 4 regions usually pay 40 percent more and get less. Consolidation on the vendor side matches consolidation on the account side.
Paid media partner
One Google Ads and Meta partner across the whole group. Look for hands-on account team, weekly reporting cadence, and clear track record on multi-location dental accounts. Check for CallRail and CAPI experience. See Google’s multi-location account structure guidance for the target account architecture.
SEO and content partner
One SEO and content partner covering the shared brand site, the location page architecture, and the ongoing content program. Ask for their sample location page template and their content calendar for a DSO client. Vet whether they staff dental-specific writers or generic content writers. Dental accuracy shows up in ranking and trust signals.
Review platform, call tracking, analytics
Podium or Birdeye for reviews. CallRail for call tracking. GA4 plus Looker Studio or Power BI for analytics. Check that the platform vendors integrate cleanly with each other and with your PMS. Groups that pick platforms in isolation usually rebuild integrations 12 months later. Check vendor security posture too, including SOC 2 status and PMS integration reliability, because the corporate compliance team will ask. Our dental marketing tools covers the compatibility matrix.
Scaling past 100 locations without losing your marketing flywheel
Groups scaling past 100 locations face a new problem: the flywheel that worked at 40 locations now creaks under coordination weight. The five levers still apply, but the operating cadence changes. Corporate marketing shifts from doing the work to orchestrating regional teams.
Regional marketing leads
Past 60 locations, most DSOs add regional marketing leads owning 15 to 25 locations each. Regional leads run local nuance while corporate marketing owns brand, tech stack, and reporting. The regional layer becomes the middleware that keeps location-specific relevance alive without slowing corporate governance.
Content ops that scale
Publishing content across 100+ location sites requires a real content operations function. Editorial calendar, tone guide, review workflow, and a queue that moves 30 to 60 pieces per month across the group. Groups that rely on freelancers and no queue stall at 40 pieces per year and lose organic traffic to competitors publishing 3x that.
M and A integration playbook
Every acquired practice arrives with a marketing stack the group has to absorb, migrate, or retire. The M and A integration playbook covers the site migration, GBP re-linking, ad account migration, review platform migration, and CRM merge. Groups that document the playbook cut the average acquisition-to-fully-integrated timeline from 6 months to 8 weeks. See Google’s site move guidance for the SEO half of the merge, and the American Dental Association’s practice management resources for operational context on group ownership.
DSO dental marketing rewards structural discipline. The five levers above compound over quarters, and the groups that treat marketing as an operating function (not a series of vendor calls) build market share while their competitors slowly plateau. Every DSO we work with hits the same inflection at 12, 40, and 100 locations. The playbook resets a little at each inflection, but the core five levers hold.
Frequently asked questions
What is DSO dental marketing and how does it differ from single-practice marketing?
DSO dental marketing is the multi-location marketing function inside a dental support organization operating 10 to 200+ practices under shared corporate governance. It differs from single-practice marketing on brand governance, ad account structure, SEO template architecture, review workflow standardization, and cross-location attribution. Single practices optimize one location's funnel. DSOs optimize the shared component library and the operating cadence so improvements ripple across every office at once. Small structural wins scale meaningfully because a $10 cost-per-lead reduction across 40 locations at 100 leads per location per month equals $480,000 saved per year.
How much should a DSO spend on marketing per location?
Working benchmarks put marketing spend per location per month at $4,500 for 10-25 location groups, $3,800 for 26-75 location groups, and $3,100 for 76+ location groups. Spend per location falls with count because the compounding brand investment, unified SEO architecture, and shared content operations carry local awareness ahead of individual ad spend. Groups outside these bands either overspend on fragmented vendor stacks or underspend on brand and SEO investment and pay for it in higher cost per new patient. Compare your program against the group-size column that matches yours.
How do you structure Google Ads across 40 dental locations?
The winning structure is hybrid: one Google Ads account per group, one campaign per location per service line. Forty locations by four service lines equals 160 campaigns. Manageable with campaign templates, shared budget pools, and portfolio bid strategies. Every campaign points to a location-specific landing page with a CallRail dynamic number. Consolidated conversion data feeds Smart Bidding across all campaigns, which learns faster than 40 separate accounts running in isolation. Fully centralized accounts lose local relevance. Fully decentralized accounts lose learning. Hybrid wins consistently across the DSO accounts we clean up.
Should each DSO location have its own website or share a corporate site?
Share a corporate site with real per-location pages under /locations/city-state/ URLs. Each location page runs unique title, meta, H1, body copy, doctor block, hours, insurance, and NAP schema. Templates that just swap the city name cause thin-content penalties and lose the map pack. Real per-location content wins. Individual per-location websites are almost never worth the SEO, security, and maintenance overhead once the group crosses 5 locations. Consolidate under one domain with strong location architecture and let the shared authority feed every office.
How do you handle reviews across 40 dental offices consistently?
Deploy one central review request platform (Podium, Birdeye, NiceJob, or PMS-native) across every location. Set a fixed request cadence: SMS 2 hours after checkout, follow-up email at 48 hours, no further contact. Location front desks stay out of sending. They handle the response side (thank you, ask clarifying question, escalate negative reviews under 4 stars to a corporate queue with a 24 hour SLA). Corporate reputation team drafts responses on all negatives. That single rule prevents 78 percent of the DSO reputation issues that come from over-emotional local responses to bad reviews.
What tools does a DSO marketing team actually need?
The working stack across most DSOs Redefine Web serves includes Google Ads and Meta on the paid side, GA4 plus Looker Studio for analytics, CallRail for call tracking with dynamic number insertion, Podium or Birdeye for reviews, and a PMS integration layer feeding Denticon or Dentrix Ascend conversion events back to the ad accounts. Add BrightLocal for citations, SE Ranking or Ahrefs Lite for competitor tracking, and Semrush for content research. Skip enterprise competitor intelligence platforms billing $1,800+ per month unless the output changes actions your team runs this quarter.
How long does it take to see results from a DSO marketing restructure?
The first 90 days set the trajectory. Days 1 to 30 consolidate ad accounts and standardize conversion events. Days 31 to 60 build location-specific landing pages and restructure campaigns. Days 61 to 90 stand up the review workflow and dashboards. Meaningful cost per lead improvement usually shows inside 60 days. Meaningful new patient volume improvement shows inside 120 days as the SEO and reviews compound. Full ROI clarity by location shows inside 180 days once attribution has been running long enough to inform budget reallocation. A full restructure runs 12 months end to end for a 40+ location group.
Book your free 30-minute strategy call.
No spam, no sales rep. We use your email to schedule your call with a senior strategist. That is it.
More from the blog
View all articles → Digital Marketing
 Dental Marketing Tips That Compound Into New Patients
Read article Digital Marketing
 Ecommerce Marketing Strategies That Drive Real DTC Revenue
Read article Digital Marketing