An enterprise SEO case study is one engagement written up by the side that got paid for it, which makes it evidence rather than proof. Read it as a claim to be tested. Most published case studies fail two or three of the tests below, usually because nobody ever asked them to pass, not because anybody lied.
You are reading these during a selection, which is the worst possible moment to be persuaded by anything. A library of wins tells you what an agency chose to show you. On its own it cannot tell you whether the work caused the number, whether the number would survive on a site your size, or how many engagements from the same year sit in a folder that never became a page.
Here is where we stand, before any of the argument. We sell enterprise SEO programs, and we publish 118 of these in our case study library. An article about how to read agency case studies, written by an agency that publishes them, turns into a sales page the moment it starts using its own as the good example. So every test below gets run on ours, in public, with what we found when we read all 118 on 18 September 2026. That includes the one we fail outright. We are not asking for credit for saying so. A disclosure that earns applause is just another marketing asset, which is the thing this article is warning you about.
What an enterprise SEO case study is actually claiming
Every one of them makes three claims at once, and they are not equally strong.
The measurement claim says the number is real. Traffic went from this figure to that figure, inside this window, in a system somebody could open and check. It is the easiest of the three to support and the one most libraries document worst.
The causal claim says the work produced the number. This one is much harder, because an enterprise program never runs alone. A release shipped. A season turned. A competitor stopped bidding on their own brand terms. A core update landed in the middle of the window.
The transfer claim is the one you actually care about, and it is never written down. It is the implied promise that because this happened to a business described in three paragraphs, something like it could happen to yours. Nothing on the page supports that. Your site has a different template count, a different release cycle, a different starting authority and a different legal review queue.
Read with those three separated and the page changes shape. It can be scrupulously honest about the first, silent on the second, and still leave you believing the third. That is not deception. That is what the format does, and it is why you need a method rather than an impression.
Test one, can you identify the business and check it yourself
An anonymous write-up is not worthless, but it is unfalsifiable, and you should price it accordingly. When the subject is “a Fortune 1000 cybersecurity enterprise”, as one of the pages ranking for this search puts it, there is no third party left for you to call.
Anonymity is often the client’s condition rather than the agency’s choice, and enterprise legal teams refusing to appear in a vendor’s marketing is a real constraint. What matters is whether the page admits it is anonymous, and whether anything else on it is specific enough to argue with. One ranking page describes its subject only as “Over $16B Annual Revenue” and names the stack as Sitecore, which at least gives a technical buyer something to interrogate. Another says simply “The client (an online car retailer)”.
Run it on ours. Eleven of our 118 do not print the client’s name. Nine of those label the business by category and location instead, which is a choice we made and can defend. The other two describe the business in words while the address bar gives it away, because the page at /case-studies/details/hemmersbach/ renders without the company name anywhere in its text while the URL carries the company name, and the same is true of /case-studies/details/wilentz-goldman-spitzer/. If we meant to protect those two clients, we did not.
Test two, is there a starting number or only a percentage
A percentage with no baseline is a rhetorical device, not a measurement. It is also the most common thing you will see in an enterprise SEO case study, and the bigger the number, the smaller the starting point usually was.
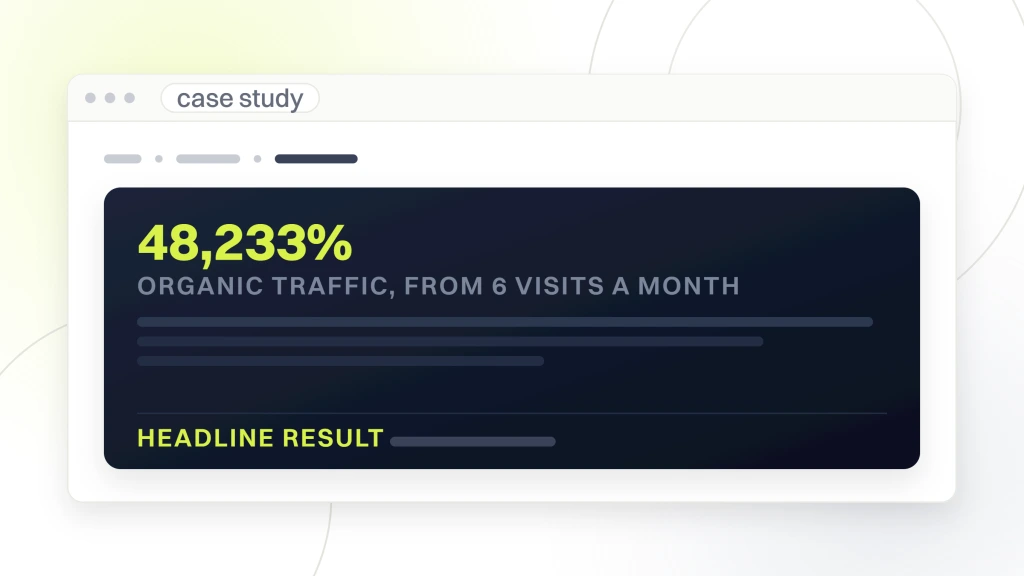
Ours carries a clean illustration of that, which is not a boast. Our page for a Colorado law firm leads with a 48,233% increase, and it states the baseline in the same sentence. The page reads, “Organic traffic grew from just 6 visits a month to nearly 2,900, a 48,233% increase.” Six visits a month. The heading above that figure on the same page reads, “Six visits a month is not a marketing channel.”
So the percentage is arithmetically correct and close to useless as a forecast for you. The mechanism behind it, publishing content where none existed, is not available to a site with 400,000 URLs already collecting millions of organic sessions. The number is not a lie. It is an answer to a question you were not asking.
Six of our 118 lead with a figure of 1,000% or more, and every one of them needs that same reading. Whenever you see a four-figure percentage anywhere, ask what the first number was. If the page will not say, treat the claim as absent rather than as large.
Test three, does the window match the claim
Two dates matter and most pages give you only one. The first is how long the engagement ran. The second is the window the headline figure was measured over. When those differ, and they usually do, the page is quietly letting you assume the shorter one.
Ours gets this half right. All 118 carry a timeline, which is more than several pages on this search manage at all. But the timeline is a calendar year pair rather than a measurement window. Sixty-six of the 118 read as a pair of years and fifteen give a single year, which tells you the engagement crossed two calendars and nothing about how long the change took.
The gap shows up plainly on one of them. Our page for an enterprise automation vendor prints a cost per lead before and after, to the dollar, in one sentence. Its timeline field spans 2020 to 2024 and its metric label reads as a straight comparison. Nothing tells you whether the change took four months or four years, and those are completely different purchases. We have not repeated the two figures here. Their size is not the point. Nothing on the page dates them.
Compare it with a page ranking for this search that gives both halves in one sentence, reporting that traffic “grew from 1M daily visitors from Google organic to more than 4M daily visitors” across a period it puts at two and a half years. You do not have to believe that page. You can at least argue with it.
Test four, where did the number come from
Ask of every figure which system produced it, and who inside the client’s company could contradict it. Search Console clicks, analytics sessions, ad platform conversions and CRM revenue are four different numbers that never agree with each other, and stacking them in one results panel makes any program look better than a single source would.
Two of the nine pages on this search we could open name their sources. One lists “Google Search Console, Google Analytics, Google Data Studio, Semrush, and ahrefs” under a reporting heading, and another names “GA4 and Google Search Console integration”. The other seven hand you a figure and leave the plumbing to your imagination. For why those four sources disagree in the first place, our piece on how attribution decides what organic looks like covers the joins that break and the rows that get dropped before a number reaches a dashboard.
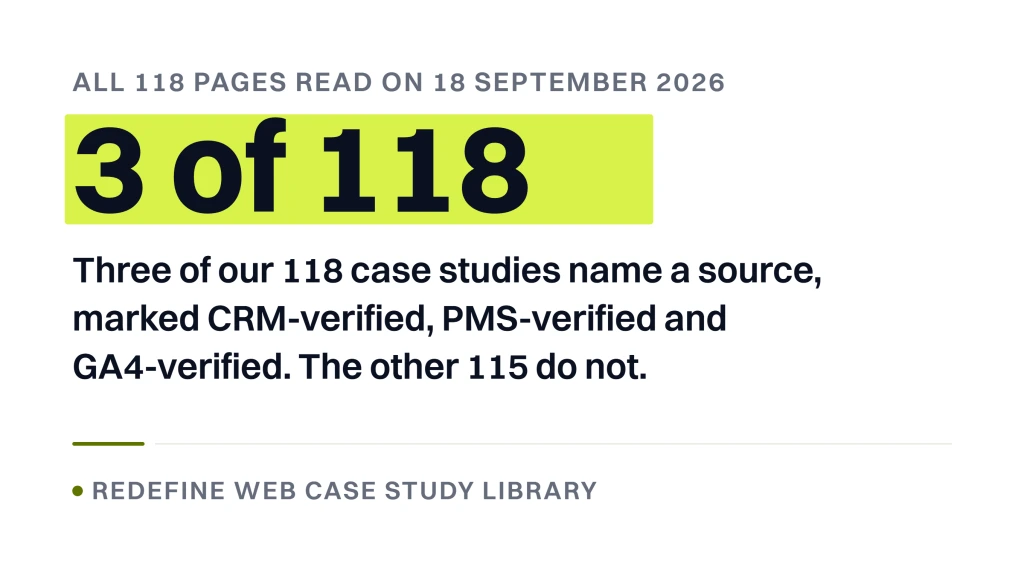
This is the test our own case studies fail, and the interesting part is what we did about it. The index page of our library promised, in the version live while this article was written, “CRM-verified numbers on 90-day timelines. Every figure pulled from the client’s own PMS, CRM, or ad account, never a dashboard screenshot.” We opened all 118 pages behind that promise. Three of them name a source, marked CRM-verified, PMS-verified and GA4-verified, and those three carry the mark on their card. The other 115 do not. The words Google Analytics, Search Console and GA4 appear on five of the 118, and in every one of those five they describe something we installed or audited rather than the source of the figure printed above them.
The timeline half of that sentence did not hold either. Two of the 118 metric labels mention 90 days. The rest run from a six-week sprint to a nine-year window. So the sentence went, and the index now claims only what the library can show, that where a figure has been checked against the client’s own system the card says so. Three out of 118 is a thin number to put in public and it is the true one. The pages themselves are unchanged and still fail this test, which is the work, not the wording. A figure whose source is unstated is not a wrong figure. It is an unverifiable one, which is a different problem and the one worth caring about while you are choosing.
Test five, what else was running while SEO ran
An organic number produced during a paid media shutdown is not the same result as an organic number produced in a steady account, and almost no case study tells you which one you are looking at.
The list of things that move organic performance without anybody doing SEO is long. A rebrand. A funding announcement. A pricing change. A core update. A rival leaving the category. Paid budget moving in or out of the same keywords. One page on this search does the honest thing, reporting a test whose conversion rates came out “consistent with the control group” and then adding that there was “some loss in ad revenue due to the consolidation of many pages”, which is a cost printed beside a gain. Most of the rest say nothing at all. One does better and still leaves the gap wide open, telling you plainly that in January 2023 it “shut down paid lead generation initiatives like Google and LinkedIn ads” and then reporting the organic climb that followed, without once asking what the first fact did to the second.
Ours pass this one for a structural reason rather than a virtuous one. All 118 list the services that ran, and every one of them lists more than a single service, between two and six. So a reader can see that organic was never the only thing moving. What ours do not do is separate the contributions, and no page on this search does either. The honest version of this test is not whether an agency isolated the cause, because nobody can. It is whether it told you what else was in the room.
If the page does not say, ask on the call. What you are really checking is whether you moved or the whole market moved, a question about share rather than traffic, and the one that decides whether a result was earned or collected.
Test six, how many engagements does the library not show you
This is the survivorship question, and none of the pages we could open for this search answers it, ours included.
A published set of wins is a filtered sample by construction. The engagements that ended in month four, the ones where the client never shipped the recommendations, the ones where the result came out flat, none of those becomes a page. That filter is not dishonest. It is what a portfolio is. It turns misleading the moment you read the collection as a success rate instead of as a set of existence proofs, and the format quietly encourages exactly that reading.
One page ranking for this search comes closest to admitting the filter while presenting it as a selling point, saying, “We keep our client list small and selective for a reason”. Read that twice. It is a statement about the denominator, offered as a reason to trust the numerator.
Ours prints the numerator in the site navigation, which describes the collection as “118 client engagements”. We publish the denominator nowhere, so you cannot compute a rate from our site, and we are not in a position to ask you to infer one. The question to put on a call is simple and nobody enjoys it. How many enterprise engagements did you start in the last three years, and how many of them produced a page like this.
Test seven, could the claim ever have been wrong
Take each sentence in a results panel and ask what observation would have made it false. If you cannot construct one, the sentence is decoration and you can delete it without losing information.
Phrases like improved visibility, positioned for growth and strengthened the brand’s search presence all fail. None of them names a number, a direction or a date, so nobody can check them next quarter. A line that names the metric, both numbers, both dates and the system the figures came out of passes, because a client with account access could open that system and say no.
The strongest version of this test is a page that limits its own claim, and exactly one page on this search does it. It is the same one that named its control group. Beside its own headline it prints that “Due to platform limitations, some significant technical issues remained”, which is an agency telling you what it never managed to fix. That sentence is checkable and unflattering, which is why it is worth more than the percentage sitting above it.
Run it on ours and one page fails outright. Our write-up for a Las Vegas med spa carries three headline cards, and not one of them holds a number. The first reads “Moved from “trusted provider” to the benchmark for discreet, expert-led aesthetics.” No observation next quarter could show that to be false, so it cannot be checked, only believed. It is the only one of our 118 whose headline panel carries no figure at all.
Run this across every line of an enterprise SEO case study, ours included, and most results panels lose half their sentences. What survives is the part worth taking to a call, and it is usually shorter than the headline suggested.
What a large enterprise SEO case study has to carry that a small one does not
Scale changes which of the seven tests bite hardest. A large enterprise SEO case study has to answer three things a local one never faces, and when it skips them the work it describes probably did not happen at your scale.
The first is governance. On a site with hundreds of templates and a dozen owning teams, the constraint is not knowing what to change, it is getting anything shipped. A write-up that lists findings and never says who approved a release is describing an audit, not a program. Ask what the release cadence was and how many tickets actually merged.
The second is the unit of change. At scale nothing gets fixed page by page. If the page does not say which template or which market a change applied to, the number could have come from one section of the site rather than the site, and a single section is not a program. Our own audit that would find it works template by template for exactly this reason.
The third is the platform. Sitecore, a headless build with a two-week release train, a legal review on every published word, each one puts a hard floor under how fast anything can move. A page that names the stack is telling you whether its timeline is reachable on yours. Settle what counts as enterprise before you compare any two of these pages, because half the libraries on this search use the word to mean expensive.
Where our own case studies fall short of these tests
Collected in one place, because scattering them through the article would have been a way of hiding them.
We fail test four completely. The library promises a verified source on its index and no page states its own source. That is the distance between a marketing line and a record, and it is ours to close.
We fail test three in substance. A calendar year pair is not a measurement window, and 66 of the 118 carry one.
We fail test one twice over. Two pages anonymize the client in the text while the URL names the firm, which is anonymization that does not work.
We fail test six, and so does every library on this search. We publish no denominator.
There is a fourth problem that belongs here because it is specific to this subject. The proof section on our own enterprise SEO landing page says, “Each one includes where the client started, what we changed and what happened”, and then offers three tabs. They are a dental spa, a multi-state mental health group and a hosting company. Not one of the three is an enterprise engagement. An enterprise buyer reading that page is being shown mid-market proof under an enterprise heading, and the fix for that is to change the page rather than to explain it in a blog post.
None of this makes the numbers on those pages wrong, and we are not claiming any of them here. It makes them unverifiable from the page, which is a different failure and the one this whole article is about.
The four questions to ask on the call instead of in the library
A published set of wins is where you build the shortlist. The call is where the tests get answered, because most of what you need was never going to fit on a marketing page in the first place.
Ask for the source and the export. Name one chart, ask which system it came from, and ask whether you can see the raw export for those dates. This is the fastest separator on the list and it takes one sentence.
Ask what else was running. Paid budget, a replatform, a rebrand, a pricing change. An agency that measured its own work knows the answer immediately and is usually glad to give it, because naming the confounders makes the surviving result more credible rather than less.
Ask for the engagement that did not work. Not the worst client story, which is a blame exercise. The one where the agency’s own plan was wrong, and what they changed afterward. Nobody puts that in a library and everybody has one.
Ask who is still a client. A four-year-old page from a relationship that ended in year two is a different fact than the same page from a live account, and nothing in the library will ever tell you which it is. Reading a strategy that survives a year next to the proof is the sanity check, because a plan you can argue with beats a result you cannot.
What we would do first with a shortlist of case studies on your desk
Pick one page from each agency, the one they lead with, and score it against the seven tests in a table. Not the whole library, one page each. A leading page is chosen, so it represents the best an agency thinks it has, and leading pages are comparable in a way that whole libraries are not.
Then do the thing almost nobody does. Send the scored table back to each agency and ask them to fill the gaps in writing. What comes back is the real evaluation. One firm sends a source and a date range. One sends a longer deck. One explains why the question is unfair, and that is an answer too.
Weigh the tests unevenly. Source and baseline decide whether the number exists at all. Confounders and the denominator decide whether it means anything. Anonymity and timeline are the two most worth forgiving, because legal teams and long engagements are real constraints rather than evasions, as long as the page says so.
The tooling question sits underneath all of it, and which platform produced the chart matters because a figure from a rank tracker and a figure from Search Console are not the same claim about the same thing. If an agency cannot say which one a chart came from, you are back at test four with a different vendor.
Score the shortlist rather than reading it. Seven tests, one leading page each, sent back in writing, and the shape of what returns tells you more about how a team works than any enterprise SEO case study ever will. Run the same seven on us, and the section above tells you where you will land.
If you would rather start with your own site than with somebody else’s numbers, our free website audit comes back as a written report with three ranked fixes, and a deeper SEO audit picks up where that one stops.