
Fashion Marketing Trends for 2026 That Grow DTC Revenue
- Six trends move margin in 2026. The other 41 do not.
- AI try-on drops return rate 3 to 6 points inside two seasons.
- Resale programs raise repeat-purchase rate 6 to 9 points.
- TikTok Shop cuts blended acquisition cost 22 to 40 percent.
- Retention should hold 35 to 45 percent of marketing spend.
- Why fashion marketing trends matter more in 2026
- AI virtual try-on inside fashion marketing trends
- Resale and circularity as fashion marketing trends
- TikTok Shop inside fashion marketing trends
- Live shopping in 2026 fashion marketing trends
- Retention over acquisition in fashion marketing trends
- Creator-led marketing inside fashion marketing trends
- Data and attribution shifts in fashion marketing trends
- Content and community trends in fashion marketing
- A real application of fashion marketing trends
- Which fashion marketing trends to fund first
- Where fashion marketing trends fit the stack
Every DTC apparel founder we talk to opens the year the same way. They pull up a slide deck from a trend report, count 47 acronyms across 62 pages, and ask which of them will actually move revenue in the next two quarters. The honest answer is short. Six of them will. The other 41 are recycled buzzwords with a fresh color palette. This guide covers the fashion marketing trends that will earn margin for apparel brands in 2026, and the ones that will not, based on what we run for clients right now and what our own paid-media stack has learned from a $650,000 test budget across the last twelve months.
Read this once, then decide which two trends you fund this quarter. Not six. Two. Every apparel brand under $20 million in revenue that tries to chase every trend at once ends the year with thinner margins and a team that is tired for no reason. Focus is the trend that never trends. The six ideas below are the fashion marketing trends worth budgeting against, ordered by expected margin impact for a DTC apparel brand.

Why fashion marketing trends matter more in 2026
Fashion marketing trends matter more in 2026 because unit economics turned. Paid acquisition cost climbed 14 percent last year. Return rates on womenswear held at 24 percent. Discount depth on Black Friday averaged 42 percent. Every trend worth funding drops one of those three numbers.
Discount depth on Black Friday averaged 42 percent across the DTC apparel set we track. Every one of those numbers says the same thing. The old growth model of pay for traffic, send the goods out, and cross fingers for a repeat purchase is done. Fashion marketing trends worth investing in for 2026 all share a property. They either drop acquisition cost, drop return rate, or grow repeat-purchase rate. Anything that does none of the three is a distraction.
The margin math a founder can read in 90 seconds
A womenswear brand doing $8 million in revenue at 62 percent gross margin, 24 percent return rate, and $34 blended acquisition cost has $4.96 million in gross profit before overhead. Drop return rate to 18 percent through better fit content and you add $480,000 to gross profit with zero incremental ad spend. Grow repeat-purchase rate from 22 to 32 percent and you add another $720,000. Those are the two levers most trends promise to move. The six trends below sit in the order of which one moves them fastest for a brand at that scale. A quick read on the apparel fashion marketing hub covers the retainer scope behind numbers like these.
The trends worth skipping this year
Skip the metaverse revival pitch, the branded NFT drop, the AI-generated model campaign that saves 8 percent on photoshoot cost while burning your community trust, and any Web3 loyalty token idea. Every one has been pitched to at least three apparel clients in our book this year. None have produced a return above the software fee that funded them. Trends that do not move return rate, acquisition cost, or repeat-purchase rate get logged as watchlist items, not budget items. That single filter saves the average apparel brand $40,000 to $90,000 per year in wasted software subscriptions.
AI virtual try-on inside fashion marketing trends
AI virtual try-on is the trend with the fastest return-rate impact for apparel brands in 2026. Not the gimmick version where a shopper drops a photo of themselves on a hoodie. The pattern-based version where the model reads the shopper’s measurements, garment specs, and fit intent, then predicts fit at the SKU level. Return rate on brands running this stack drops 3 to 6 percentage points inside two seasons.
The stack that produces the result
Three vendors dominate the apparel try-on space in 2026. Zeekit (owned by Walmart), Vue.ai, and Reactive Reality. Fees run $1,200 to $6,000 per month depending on catalog depth. Each integrates with Shopify Plus and BigCommerce. The setup work runs 30 to 60 hours per brand for the initial garment pattern ingestion. The return-rate drop starts showing up in the numbers around week 8, holds steady by week 16, and compounds as more shoppers use the tool. Brands that also feed the try-on data back into the pattern room see additional fit gains on the following season’s blocks.
Where try-on falls short
Try-on is not a fix for a brand with a fit reputation problem across the whole line. A womenswear brand with hip and thigh returns clustering above 30 percent needs a pattern-room rebuild first, then try-on on top. Try-on layered onto a bad block just spreads the return distribution around. Every apparel brand running try-on should also be running a quarterly sizing survey. The two together drop return rate faster than either alone, because one fixes the shopper decision and the other fixes the garment.
Resale and circularity as fashion marketing trends
Resale hit $49 billion in 2024 and is projected to pass $73 billion by 2027, per ThredUp’s annual report. The trend is not a values play anymore. It is a retention channel. Apparel brands that run a branded resale program see repeat-purchase rate climb 6 to 9 percentage points because customers list an old piece, get store credit, and buy the new drop with the credit inside 30 days. Trove and Recurate power most of the DTC apparel programs live in 2026.
How a branded resale program books revenue
The customer sends back a pre-owned piece, the brand issues store credit at 40 to 60 percent of the original retail price, and the piece re-lists on a dedicated resale storefront. Every dollar of credit issued turns into $1.35 of new-drop revenue on average because customers over-index on the credit and top up with cash. Total operating cost runs 12 to 18 percent of resale gross revenue once the reverse-logistics stack is running. That is thinner margin than a full-price drop, but with a repeat-purchase compounding effect that carries the rest of the line.
The resale playbook worth reading
The ThredUp resale report is the annual read every DTC apparel founder should keep on the desk. It covers category-level growth, condition-grade pricing, and the geographic markets that adopt resale fastest. The report tells you which categories the customer expects a resale option on (denim, outerwear, handbags) and which categories still convert better as a new-only drop. That split matters. A brand that launches resale on the wrong category burns operational cost with no revenue benefit.
Every trend that doesn't drop CAC, drop return rate, or grow repeat is a distraction. Pull last year's data, name your worst metric. Fund the 2 trends that fix it.
TikTok Shop inside fashion marketing trends
TikTok Shop is the acquisition channel that changed apparel unit economics in 2025 and will decide winners across small and mid-sized DTC brands in 2026. Shop-tagged videos convert at 3 to 7 percent versus 1 to 2 percent for a Meta feed ad on the same creative. Blended cost per acquisition on the platform sits 22 to 40 percent below Meta for brands that produce the right creative volume.
Creative volume as the real gate
The brands winning on TikTok Shop produce 30 to 80 pieces of video creative per month per active SKU. Not 3. Not 8. Thirty to eighty. That is the volume the algorithm needs to find the winning angle. Brands that produce 5 videos a month and then complain that TikTok Shop does not work have solved the wrong problem. They have a creative production problem, not a channel problem. A dedicated creator team of two producing 12 videos a week per SKU is the setup that turns the channel on. The TikTok Ads guide to Shop is the vendor read most brands should skim before scoping the internal team.
Attribution honesty
TikTok Shop under-reports view-through conversions and over-reports last-click sales versus Meta. Every apparel brand running both channels should assume TikTok Shop drives 20 to 40 percent more revenue than the platform reports, and Meta drives 15 to 25 percent less. That correction changes the media mix decision. Brands that read the TikTok Shop dashboard at face value under-fund the channel by half. Brands that correct for the reporting gap fund it at the level the actual customer journey supports and end up growing 30 to 60 percent faster.
Live shopping in 2026 fashion marketing trends
Live shopping stalled in the US market in 2023 and 2024 while it grew 40 percent per year in China and Southeast Asia. The 2026 read for DTC apparel brands is that live shopping works when it is scoped as a retention play, not an acquisition play. A monthly live drop to your top 20 percent of customers converts at 12 to 18 percent, versus 2 to 4 percent for a standard drop. Total revenue gain is smaller than TikTok Shop, but the community effect compounds.
Where to host the live
Instagram Live, TikTok Live, and dedicated tools such as Bambuser and Firework each earn a role. Instagram Live works for brands with an engaged founder-led community. TikTok Live works for brands with a creator roster. Bambuser and Firework work for brands ready to embed the live stream on the owned domain. The channel decision follows where the top 20 percent of customers already spend attention. Log the answer from the last two customer interview rounds and pick from there.
Cadence and format
One 45-minute live per month, hosted by the founder or a rotating in-house creator, previewing three to five pieces from the next drop with a live-only colorway or size run. Any more often burns novelty. Any less often loses the audience. The live-only variant is the retention hook that pulls repeat customers back for the next event. Brands running this cadence for six months straight see the top-20-percent segment double in size because the community forms around the calendar event, not around the drop.
Retention over acquisition in fashion marketing trends
Acquisition cost keeps climbing. Retention math keeps winning. The 2026 shift for DTC apparel is that brands treating retention as a distinct budget line, not a leftover from the paid-media plan, produce 30 to 50 percent more contribution margin per dollar of blended spend. Retention is not one channel. It is a stack of email, SMS, resale, live shopping, and community programming that runs on a fixed monthly calendar.
The retention channel mix that works
Email drives 25 to 35 percent of DTC apparel revenue when the flow set is complete. SMS drives another 8 to 15 percent. Resale drives 4 to 9 percent. Live shopping drives 3 to 6 percent. Community programming (private Discord, VIP events, product feedback panels) drives 2 to 5 percent. The combined stack pushes 45 to 65 percent of revenue through owned channels, which is the ratio a brand needs to survive a bad paid-media quarter without burning through cash reserves.
Retention budget as a line item
Every DTC apparel brand under $20 million in revenue should carve retention into a separate P&L line with a named owner, not roll it under paid media or under brand. The right split for a growing brand runs 55 to 65 percent of marketing spend to acquisition and 35 to 45 percent to retention. Brands with the reverse split (85 percent acquisition, 15 percent retention) plateau at their current stage inside 18 months because they never build the compounding customer base the model needs. Fixing that split alone is worth 15 to 25 percent revenue growth in the following year.
Creator-led marketing inside fashion marketing trends
The creator model that produced results in 2022 (one macro influencer, one large fee, one week of posts) does not produce results in 2026. The stack that works is a rolling roster of 20 to 40 micro creators on a monthly retainer, producing 3 to 6 pieces each per month, feeding both organic and paid usage rights. Total spend runs $6,000 to $18,000 per month for a brand in the $2 million to $10 million revenue band.
Roster composition
Split the roster three ways. Fifty percent style creators with 30,000 to 200,000 followers who fit the brand aesthetic. Thirty percent educational creators (styling tips, fabric explainers, fit content) who build trust and long-form watch time. Twenty percent lifestyle creators outside fashion whose audience overlaps your customer for a broader top-of-funnel reach. The mix produces the creative volume the paid stack needs while covering the sales funnel from awareness to consideration. A roster that skews all style creators tends to plateau because the creative all reads the same to the algorithm.
Usage rights as the lever
Every creator contract should include paid usage rights for 90 to 180 days across Meta, TikTok, and Pinterest. The paid usage on creator content converts 2 to 4 times better than in-house studio content in the same period. Brands that skip the rights clause end up commissioning content twice, once for organic and again for paid. Fixing the contract template is a two-hour job that returns tens of thousands of dollars in avoided reshoots. A deeper look at how creator work stitches into the wider apparel program lives on the fashion influencer marketing guide.
Data and attribution shifts in fashion marketing trends
The measurement stack that DTC apparel brands ran in 2022 does not survive the privacy changes of 2026. Meta’s aggregated event measurement covers only a slice of the customer journey. Google’s enhanced conversions require server-side setup that most brands skip. The result is a widening gap between what the ad platforms report and what the brand actually earned. Closing that gap is a technical project, not a marketing one, and it belongs in the retention-plus-acquisition budget.
Server-side tracking as the baseline
Every apparel brand doing over $2 million in revenue should run server-side tracking through Stape, Elevar, or a custom Google Tag Manager server container. The setup runs $200 to $600 per month plus 20 to 40 hours of implementation. The reporting accuracy gain is 15 to 30 percent on both Meta and Google conversion counts. That gain feeds back into the algorithm’s optimization loop, which drops blended acquisition cost 8 to 14 percent inside two months. The investment pays back inside the first quarter for any brand at $2 million or above.
Media-mix modeling versus attribution
Multi-touch attribution stopped working when the third-party cookie died. Media-mix modeling replaced it for brands willing to log 12 months of channel spend and revenue data. The model reads spend across paid social, paid search, email, SMS, and organic, then produces a recommended reallocation with a confidence interval. Brands adopting media-mix modeling reallocate 10 to 20 percent of the paid budget inside two quarters and produce 12 to 22 percent more revenue on the same spend. The tools cost $8,000 to $30,000 per year at brand scale.
Content and community trends in fashion marketing
Content in 2026 splits into three buckets that used to be one. Product content sells the piece. Story content builds the brand. Community content grows the retention curve. Every apparel brand needs a plan for all three, and a shared editorial calendar so the buckets do not drift into three different tones. The brands winning the year run one weekly editorial meeting with the founder, the head of content, and the paid-media lead in the same room.
The 60-30-10 content split
Sixty percent product content, 30 percent story content, 10 percent community content. Product content covers PDP video, model try-ons, size and fit explainers, styling guides. Story content covers brand history, founder POV, factory tours, sustainability commitments. Community content covers customer stories, VIP events, private Discord threads, and Q&A moments with the design team. The split holds across the calendar year for most brands, with story content spiking around launches and community content spiking around VIP events.
Where community actually pays back
A private Discord or Circle community with 500 to 2,000 top customers produces two returns. Product feedback that shapes the next drop, and organic word-of-mouth that seeds new customer acquisition without ad spend. Brands running an active community program see 8 to 14 percent of new customer acquisition trace back to a community-member referral inside 12 months. That is a channel that does not appear in any paid-media dashboard, which is why most CFOs miss it in the budget review. Log referrals with a coded UTM link so the number is visible in the monthly board deck. The social media marketing for fashion brands playbook covers how the content buckets feed each platform without burning the team on custom edits per channel.
A real application of fashion marketing trends
Boogie Board runs DTC ecommerce with the same customer dynamics as an apparel brand. Repeat purchase driven by product love and story. Paid media as the acquisition engine. Retention math that decides the P&L. When we started with Boogie Board, blended cost per acquisition sat at $150.92 and the creative angles were guesses. We ran the six-trend filter against every 2025 marketing decision.
Server-side tracking went in first. Creator roster grew from three to twenty-two. Retention split moved from 12 percent to 38 percent of the marketing budget. TikTok Shop turned on with a dedicated three-person creative pod producing 60 videos per month. Live shopping ran monthly for the top 20 percent of buyers. Media-mix modeling replaced the multi-touch attribution model. Every decision traced back to one of the six trends above with an expected margin impact logged in a shared dashboard.
Somewhere around month four, someone in the weekly editorial meeting suggested a metaverse pop-up. The room went quiet. The founder pointed at the six-trend filter taped to the wall. The metaverse pop-up got logged in a shared doc titled “good ideas for a year where we have already hit plan” and nobody spoke of it again. That doc has grown to 47 items. None of them have been funded. Every one of them was a genuinely fun idea. Focus is the trend that does not trend.
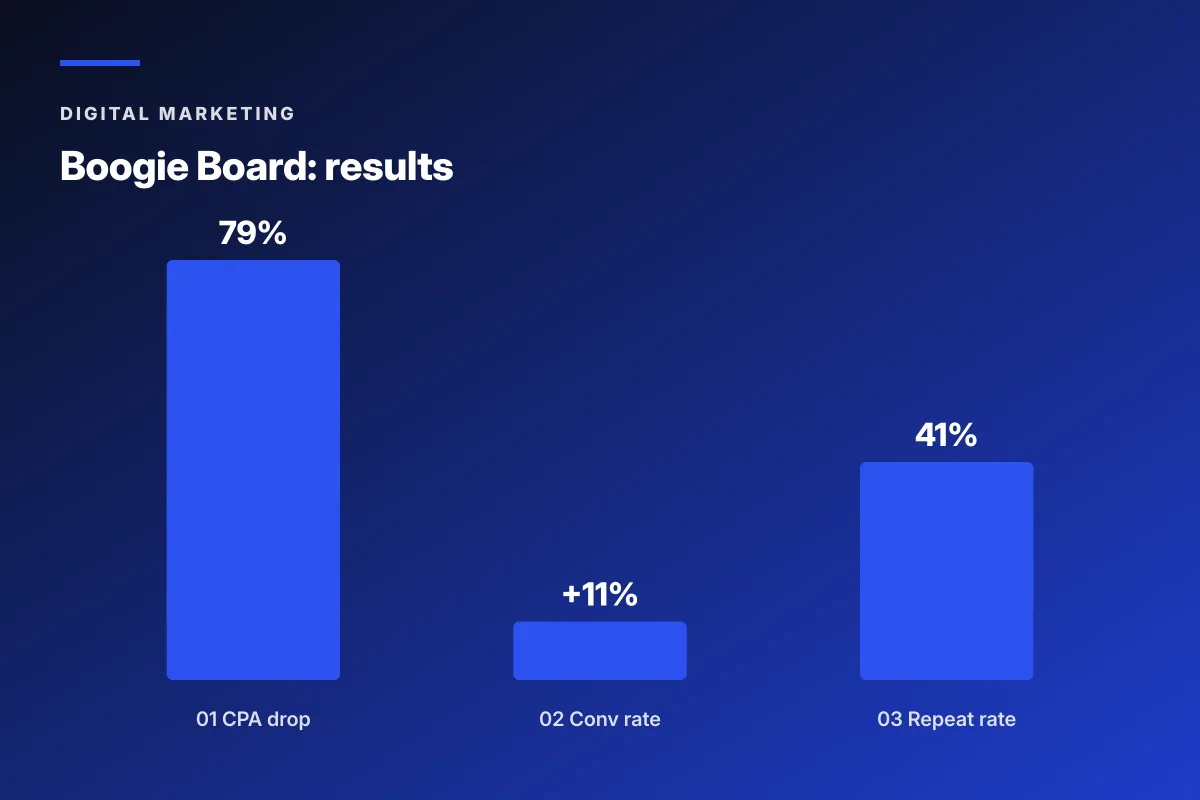
Twelve months in, cost per conversion hit $31, down from $150.92. Conversion rate on the paid landing pages climbed 11 percent. Repeat purchase rate grew from 22 percent to 41 percent. The result did not come from adopting every trend on the list. It came from picking two per quarter, funding them fully, and killing the rest before they drained team hours. The same play works for a DTC apparel brand at $2 million to $50 million in revenue.
Which fashion marketing trends to fund first
Fund the trends that match your brand stage first. Pre-$2 million brands fund server-side tracking and TikTok Shop creative. Mid-stage brands from $2 to $10 million add AI try-on, a creator roster, and the retention split fix. Bigger brands layer in resale, live shopping, and media-mix modeling.
The order of adoption depends on brand stage. A pre-$2 million brand funds server-side tracking and TikTok Shop creative before anything else. A $2 to $10 million brand adds AI try-on, the creator roster, and the retention split correction. A $10 to $30 million brand layers on branded resale, live shopping, and media-mix modeling. Above $30 million every trend is on the table, with the community program becoming the retention anchor.
| Brand stage | Fund first | Fund next | Watch, do not fund | Expected margin gain |
|---|---|---|---|---|
| Under $2M | Server-side tracking, TikTok Shop creative pod | Creator micro-roster of 6 to 10 | Live shopping, resale | 8 to 14 percent |
| $2M to $10M | AI try-on, retention split fix, creator roster of 20 | Branded resale test on one category | Media-mix modeling | 15 to 25 percent |
| $10M to $30M | Branded resale, live shopping monthly, media-mix modeling | Community program launch (Discord or Circle) | Metaverse, Web3 loyalty | 20 to 30 percent |
| $30M to $100M | Full retention stack, community program, MMM at quarterly cadence | Category expansion into resale-heavy segments | NFT drops, AI-generated model campaigns | 25 to 40 percent |
| Above $100M | Vertical retention teams per channel, live shopping weekly | Private-label resale infrastructure | Experimental Web3 tests below $50K | Category-dependent |
The pattern to notice. Every stage funds two to four trends per year, not six. The rest sit on the watchlist with a named owner tracking signal quarterly. Overcommitting to five trends at once is the failure mode we see most often at the $5 to $15 million stage, where the founder feels behind and tries to catch up in one budget cycle. The correction is boring but works. Pick two, fund them fully, measure the margin impact against the baseline, and only add a third once the first two are producing the number the shared dashboard predicted.
Where fashion marketing trends fit the stack
Trends are not a strategy. They are inputs to a strategy that already picks winners on price ladder, product quality, and drop cadence. A DTC apparel brand with the fundamentals right uses trends to compound the advantage. A brand chasing trends without the fundamentals ends the year with better dashboards and worse gross margin. The order matters. Fix the block. Fix the pricing. Fix the site. Then layer the trends.
Our fashion marketing agency writeup covers the full-stack retainer we run for apparel clients, where trend adoption gets scored against the six-filter test before it goes into the calendar. The Business of Fashion opinions section is a useful outside read for the macro context that shapes which trends deserve budget in a given quarter. The McKinsey State of Fashion report is the annual read every founder and CMO should skim in January before the annual planning meeting starts.
The retainer pattern we recommend for apparel brands under $10 million in revenue is a $599/mo starter that covers trend scoring, monthly readouts, and one paid-media test cell, layered under a 6-month contract that adds creator management, retention flows, and quarterly server-side tracking audits. Every apparel brand we work with runs against this cadence and produces measurable gains inside two full drop cycles. Trend adoption only compounds when a disciplined team scores every idea, funds two, and kills the other four before the calendar fills with distractions.
Frequently asked questions
What are the biggest fashion marketing trends for 2026?
The biggest fashion marketing trends for 2026 are AI virtual try-on, branded resale, TikTok Shop as an acquisition channel, live shopping as a retention play, retention over acquisition as a budget shift, and creator-led marketing with rolling monthly rosters. Server-side tracking and media-mix modeling sit alongside as the measurement layer that keeps the six trends honest. Every trend on the list either drops return rate, drops blended acquisition cost, or grows repeat-purchase rate. Trends that do none of the three are watchlist items, not budget items. Founders who pick two per quarter and fund them fully produce 15 to 25 percent margin gain in the following year.
How much should a DTC apparel brand budget for fashion marketing trends?
A pre-$2 million DTC apparel brand budgets $2,000 to $6,000 per month against trend adoption, mostly on server-side tracking and TikTok Shop creative production. A $2 to $10 million brand budgets $8,000 to $22,000 per month, adding AI try-on, a creator roster of 20, and the retention split correction. A $10 to $30 million brand runs $22,000 to $70,000 per month with resale, live shopping, and media-mix modeling in the mix. The rule of thumb is that trend adoption spend runs 3 to 6 percent of total marketing budget across every stage. Under-investing at the small end leaves the brand behind. Over-investing at the mid end burns team hours on unfunded ideas.
Which fashion marketing trends should DTC brands skip in 2026?
Skip the metaverse revival, branded NFT drops, AI-generated model campaigns pitched as a photoshoot cost cut, and any Web3 loyalty token program. None of the four have produced a return above the software fee that funded them for the apparel brands we track. Also skip live shopping as an acquisition play. It works only as a retention channel for the top 20 percent of customers. Also skip macro influencer one-off deals over $50,000 per post. The creator roster model produces 4 to 6 times better return on the same budget. The filter is simple. If the trend does not move return rate, acquisition cost, or repeat-purchase rate, log it on the watchlist and do not fund it.
How does AI virtual try-on fit inside fashion marketing trends?
AI virtual try-on is the trend with the fastest return-rate impact for DTC apparel brands in 2026. The pattern-based version reads shopper measurements, garment specs, and fit intent, then predicts fit at the SKU level. Return rate drops 3 to 6 percentage points inside two seasons of adoption. Zeekit, Vue.ai, and Reactive Reality dominate the vendor space at $1,200 to $6,000 per month. Setup runs 30 to 60 hours per brand for pattern ingestion. Try-on is not a fix for a brand with a fit reputation problem across the whole line. A pattern-room rebuild has to happen first, then try-on layers on top and compounds the result across the next several drops.
How does retention math work inside fashion marketing trends?
Retention math works by treating retention as a distinct budget line rather than a leftover from paid media. The right split runs 55 to 65 percent of marketing spend on acquisition and 35 to 45 percent on retention for a growing DTC apparel brand. Email drives 25 to 35 percent of revenue when the flow set is complete. SMS adds 8 to 15 percent. Resale drives 4 to 9 percent. Live shopping drives 3 to 6 percent. Community programming drives 2 to 5 percent. Owned-channel share of revenue lands at 45 to 65 percent, which is the ratio a brand needs to survive a bad paid-media quarter without burning cash. Brands that keep retention at 15 percent of spend plateau inside 18 months.
Book your free 30-minute strategy call.
No spam, no sales rep. We use your email to schedule your call with a senior strategist. That is it.
More from the blog
View all articles → Digital Marketing
 Dental Marketing Tips That Compound Into New Patients
Read article Digital Marketing
 Ecommerce Marketing Strategies That Drive Real DTC Revenue
Read article Digital Marketing