
Google Ads Budget Planning That Books Leads at a Predictable Cost
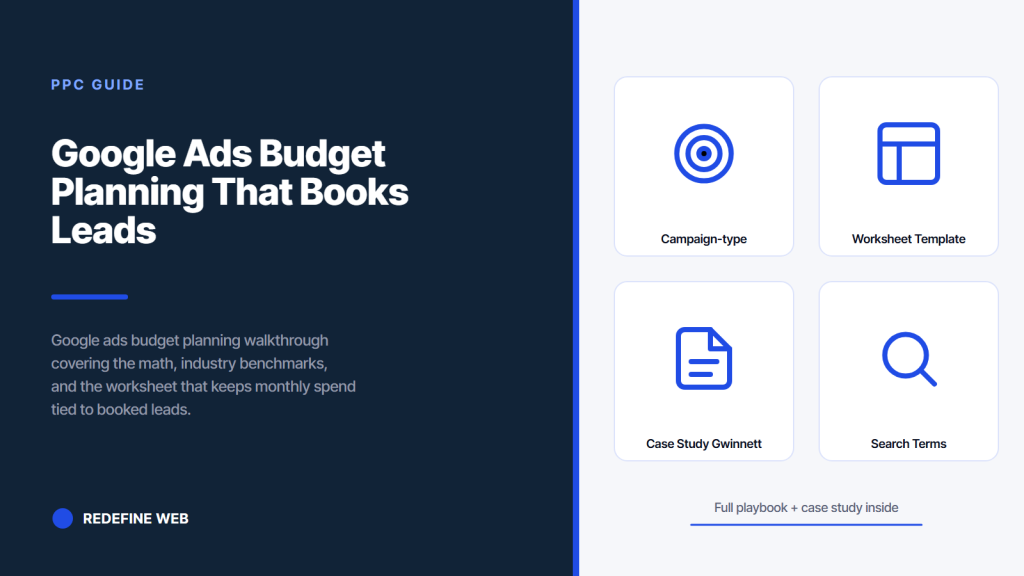
- Target lead count drives every downstream input in google ads budget planning.
- Benchmark table anchors CPC and CVR expectations by industry and metro.
- Search takes 55-65% of local service budgets; Performance Max amplifies to 20-25%.
- Weekly pacing review catches over- and under-spend before month end.
- Gwinnett Area Plumbers plan produced 141 leads at $68 CPL on $9,600 spend.
- Campaign-type allocation on the google ads budget
- Google ads budget planning worksheet template
- Pacing across the month on the google ads budget
- CFO-friendly reporting cadence on google ads budget planning
- Case study: Gwinnett Area Plumbers budget planning outcome
- Common google ads budget planning mistakes
- Where a google ads budget planning process starts
Google ads budget planning decides whether a business books 40 qualified leads a month at $85 each or 60 leads at $220 each on the same $8,500 spend. Same industry. Same offer. Same landing page. What changes the ratio is the budget math the account manager applies before the first campaign launches. Most accounts operate on a “pick a number and see what happens” model. That model burns 20 to 40 percent of the spend in the first 45 days on discovery instead of results. A proper google ads budget planning process front-loads the math and cuts the discovery burn to 5 to 10 percent. This is the walkthrough we run before every new engagement.
You’ll read the four-step budget math that maps target leads to daily campaign caps, the industry benchmark table covering local services, healthcare, ecommerce, and B2B, the campaign-type allocation model for Search, Performance Max, Display, and Video, the reporting cadence that keeps the CFO comfortable with the spend, and the real numbers from a Gwinnett Area Plumbers engagement where a rebuild produced 141 qualified leads at 14.6 percent conversion on $9,600 of PPC spend.
Campaign-type allocation on the google ads budget
Campaign-type allocation on the google ads budget breaks the monthly total across Search, Performance Max, Display remarketing, and Video. The default split for a mid-size local service account: 55 to 65 percent Search, 20 to 25 percent Performance Max, 8 to 12 percent Display remarketing, and 5 to 8 percent YouTube in-stream retargeting. Every industry has its own default split and every account calibrates from month two.
Ecommerce accounts flip the split. Search drops to 30 percent. Performance Max runs 45 to 55 percent because the shopping intent works well in the automated placement. Display remarketing runs 15 percent. YouTube runs 5 to 10 percent. B2B accounts run 70 percent Search, 15 percent LinkedIn (outside Google Ads), and 15 percent YouTube retargeting. Every allocation model gets calibrated on actual campaign performance after 45 days.
Search anchors the local service allocation
Search anchors the local service allocation because the intent is highest. A user typing “drain cleaning near me” wants a plumber now. Search captures that intent at the highest conversion rate on the account. Every dollar spent on Search books more jobs than the same dollar spent on Display for a local service business. Cap Search at 55 to 65 percent and only after Search hits budget cap should Performance Max or Display get more spend.
Performance Max role in the allocation
Performance Max plays the amplifier role in the allocation. It picks up shopping intent, display placements, YouTube, and Discover in a single campaign. Feed it good creative assets and it produces incremental leads at a slightly higher cost per lead than pure Search. Cap it at 20 to 25 percent for local service accounts. Skip Performance Max entirely if the account cannot produce 8 to 12 high-quality creative assets per month because the campaign needs the asset variety.
Google ads budget planning worksheet template
The google ads budget planning worksheet template lives in a Google Sheet with seven columns: target leads, target CVR, required clicks, target CPC, monthly budget, daily cap per campaign, and calibration variance. Every new account fills the sheet before the first campaign launches. Every month, the actual numbers get compared to the plan and any variance over 20 percent triggers a plan review.
The worksheet also carries a scenario tab. Scenario A: target of 40 booked jobs at 45 percent close rate. Scenario B: target of 60 booked jobs at 40 percent close rate. Scenario C: budget constraint of $6,000 monthly regardless of target. Every scenario gets its own daily cap and expected lead range. That structure lets the client pick a scenario at kickoff and understand what each choice produces.
Scenario modeling on the worksheet
Scenario modeling on the worksheet lets the client see three budget options and pick the one that fits the operational capacity. A plumber with 3 trucks cannot handle 89 leads per month. The scenario worksheet shows Scenario A at 40 booked jobs and $7,050 budget, Scenario B at 55 jobs and $9,700 budget, Scenario C at 25 jobs and $4,400 budget. The client picks based on truck capacity, staffing, and cash flow. See our PPC management cost guide for the fee side of the total budget.
Calibration column as the honesty check
The calibration column on the worksheet tracks actual versus planned. Actual CPC versus target CPC. Actual CVR versus target CVR. Actual cost per lead versus target cost per lead. Any variance over 20 percent gets flagged. Two consecutive months of over-variance triggers a plan rebuild. That honesty column is the reason budget plans hold up over 12 months instead of getting quietly abandoned at month three.
Pacing across the month on the google ads budget
Pacing across the month on the google ads budget prevents the daily cap from over-spending in the first 10 days and running out in the last 10. Google’s standard delivery method paces evenly across the month by default. Accelerated delivery bunches spend at the start of the day. Every account we run uses standard delivery unless there is a specific hourly-intent case. See Google Ads campaign budget documentation for the current delivery method behavior.
Within the month, watch two pacing failures: budget under-spend from a Search Impression Share drop (means the daily cap should go up or the bid should go up), and budget over-spend from a cost per click surge on a specific term (means a specific search query needs a negative or a bid adjustment). Every Friday, review the pacing across all campaigns and rebalance if any campaign is over 15 percent off pace. See our PPC management checklist for the weekly ops cadence that catches pacing drift.
Under-spend as the impression share signal
Under-spend on a campaign is usually a Search Impression Share signal. If a campaign is under budget by 20 percent and impression share is below 65 percent, the daily cap is not the constraint. Bids are too low or the auction is more expensive than the plan expected. Raise the bid or the daily cap and impression share recovers. That single diagnostic catches most under-spend before it becomes a month-end panic.
Over-spend as the query-level signal
Over-spend on a campaign is usually a query-level signal. A single high-CPC search term is eating the daily cap. Pull the search terms report. Sort by cost. Any term with cost above 30 percent of the campaign cost and conversion rate below the campaign average gets a negative or a bid adjustment. That fix restores pacing inside 48 hours.
Most accounts pick a monthly spend number and hope. Set a target lead count first, divide by realistic conversion rate, multiply by CPC. That's your real daily cap.
CFO-friendly reporting cadence on google ads budget planning
CFO-friendly reporting cadence on google ads budget planning runs weekly and monthly. Weekly report shows daily spend, weekly lead count, cost per lead, and pacing against the monthly plan. Monthly report shows total spend, total leads, cost per lead, close rate, and revenue attributable to Google Ads. Every one of these reports rolls up to the four target numbers set at the start of the plan.
The weekly report goes to the account manager and the marketing lead. The monthly report goes to the CFO or the owner. Every report includes a one-paragraph narrative on what changed, what worked, and what needs adjustment. That narrative is the difference between a report that gets read and a report that hits the CFO inbox and stays unread. See GA4 reporting overview for the site-side reporting that pairs with Google Ads data.
Weekly report format
The weekly report format runs on a single-page PDF with four sections: spend, leads, cost per lead, and pacing. Each section has this-week and month-to-date columns. Below the numbers, a two-sentence commentary. That format takes 15 minutes to produce every Friday. The account manager sends it before end of business. The marketing lead reads it Monday morning and asks questions before the standup.
Monthly report format
The monthly report format runs 2 to 3 pages and covers total spend, total leads by campaign, cost per lead trend, close rate from CRM reconciliation, revenue attribution, and a one-paragraph narrative. The CFO reads the summary and skips to the revenue attribution section. That structure keeps the report readable at the exec level without dropping the operational details the marketing lead needs.
Case study: Gwinnett Area Plumbers budget planning outcome
Gwinnett Area Plumbers came into the engagement without a written budget plan. Prior spend was $2,400 monthly with zero call tracking, zero landing pages, and no attribution back to booked jobs. The rebuild started with a four-step math worksheet. Target: 35 to 45 booked jobs per month at a 45 percent close rate. Target leads: 78 to 100. Target conversion rate: 12 percent. Required clicks: 650 to 830. Target CPC: $10.50 for plumbing in the metro. Monthly budget: $6,800 to $8,700.
Actual four-month outcome: 141 qualified leads at 14.6 percent conversion rate on 968 highly targeted ad clicks. Total ad spend for the 4-month sprint landed at $9,600 (approximately $2,400 monthly, held flat while the campaign structure produced the CPC and CVR improvements). Cost per lead worked out to about $68, well inside the target range. The budget planning gave the client the math to defend the spend and produced a repeatable model for scaling in future months.
Gwinnett Area Plumbers budget plan
The Gwinnett plan set a target of 35 to 45 jobs at $2,400 monthly spend. Every math input matched the industry benchmark: $10 CPC for plumbing in the metro, 12 percent CVR on a rebuilt landing page, 45 percent close rate on qualified leads. The plan produced the daily cap ($80) and the campaign structure (10 service-specific ad groups with dedicated landing pages). Every one of these decisions traced back to a specific input on the worksheet.
Scaling question at month five
Month five brought the scaling question. Actual conversion rate landed at 14.6 percent versus a 12 percent target. That means the same $2,400 spend produced more leads than plan. The scaling model: raise the monthly budget to $4,800 and expect roughly 280 leads over the next four months at $71 cost per lead. That scaling decision only made sense because the four-step math held up on the initial engagement.
Every google ads budget planning session, at some point, produces a moment where the client stares at the daily cap number and asks “is that actually enough?” That is why every plan we run carries a three-scenario column: conservative ($X monthly), plan ($Y monthly), aggressive ($Z monthly). The client sees the three options side by side and picks. The math still holds because each scenario carries its own set of internally consistent assumptions.
Common google ads budget planning mistakes
Common google ads budget planning mistakes include picking a round-number budget without a target lead count, budgeting based on last year’s spend without adjusting for CPC inflation, allocating all budget to Search without a Performance Max amplifier, and skipping the pacing review in week 3. Every one of these mistakes costs 15 to 30 percent of the annual budget on discovery or slippage.
The single largest mistake is skipping the calibration column. A plan built at launch and never reviewed against actuals drifts within 60 days. The account manager keeps hitting the daily cap. The client keeps getting the same monthly bill. Nobody notices that CPC drifted 25 percent higher and CVR drifted 15 percent lower. Two months later the cost per lead is 40 percent above plan and everyone is surprised. See our google ads audit checklist guide for the quarterly review structure that catches this drift.
CPC inflation year over year
CPC inflation runs 8 to 15 percent per year in most verticals. Legal and healthcare run 12 to 20 percent. Ecommerce runs 5 to 10 percent. Every year-two budget plan needs to bake in the expected inflation. Skip that step and the plan misses by the inflation rate, which cascades into missed lead targets and awkward CFO conversations at quarter three.
Skipping Performance Max
Skipping Performance Max entirely is a common local service mistake. The reasoning: “I want Search only because the intent is highest.” The problem: Search caps out at a certain impression share and the marginal dollar on Search returns diminishing leads once share hits 90 percent. Performance Max picks up the incremental impressions on YouTube, Discover, and Display at a slightly higher cost per lead. Cap it at 20 to 25 percent and it produces incremental volume the pure-Search account misses.
Where a google ads budget planning process starts
Start with the target lead count. Ask the client how many booked jobs, exams, or sales they want per month. Ask the close rate from lead to booked. Work backward through conversion rate, cost per click, and monthly budget. Land on a daily cap per campaign. Every one of these numbers gets logged on the worksheet before the first campaign launches.
Second, calibrate at week 3. Compare actual CPC to planned CPC. Compare actual CVR to planned CVR. Adjust the daily cap if either is off by more than 20 percent. Third, run the weekly and monthly reports on the plan-versus-actual variance. Fourth, review the plan at quarter and again at year end. That cadence keeps the plan alive and produces the CFO-facing confidence that lets the ad budget compound over multiple years.
Frequently asked questions
How do I decide my google ads budget planning starting number?
Start with the target lead count, not a dollar amount. Ask how many booked jobs, patients, or sales you want per month. Divide by the target close rate to get qualified leads needed. Divide by target conversion rate to get required clicks. Multiply required clicks by target CPC to get monthly budget. Divide by 30 to get daily cap per campaign. That backward math produces a defensible starting budget that matches operational capacity and pipeline goals. The alternative (picking a round dollar number) burns 20 to 40 percent of the spend on discovery in the first 45 days.
What percentage of my google ads budget should go to Search versus Performance Max?
Local service accounts run 55 to 65 percent Search and 20 to 25 percent Performance Max, with the remainder split between Display remarketing and YouTube retargeting. Ecommerce accounts flip the split with Performance Max at 45 to 55 percent because shopping intent works in automated placements. B2B accounts run 70 percent Search because the buyer journey needs specific keyword targeting. Every allocation calibrates on actual performance after 45 days. If Search hits 90 percent impression share and lead volume plateaus, more budget shifts to Performance Max.
How often should I review my google ads budget plan?
Review the plan weekly for pacing (spend versus plan) and monthly for outcomes (leads and cost per lead). The weekly review catches over-spend from a runaway search query or under-spend from a bid too low. The monthly review reconciles actual leads against target and adjusts the daily cap if the variance is over 20 percent. Full plan rebuild happens quarterly, and a full year-end review resets the benchmarks for the next planning cycle. Skip these reviews and the plan drifts 25 to 40 percent inside two quarters.
How much should a local service business spend on google ads per month?
A local service business (plumbing, HVAC, roofing, landscaping) typically spends $3,500 to $12,000 monthly on Google Ads. Small operations with 1 to 3 trucks land at $3,500 to $6,000. Mid-size operations with 5 to 12 trucks land at $6,000 to $12,000. Larger operations with 15-plus trucks and multiple service lines land at $12,000 to $28,000. Every budget produces measurable pipeline within 30 days of a proper launch. Total marketing spend across most local service businesses runs 4 to 7 percent of revenue, with Google Ads as the largest single line inside that percentage.
How do I present google ads budget planning to a CFO?
Present the plan as four numbers: target leads, target cost per lead, monthly budget, and expected revenue attribution. Show the CFO the math connecting each number to the next. Show the three-scenario column (conservative, plan, aggressive) so the CFO can see the range of outcomes. Deliver weekly reports on a single-page PDF showing pacing against the plan. Deliver monthly reports with a one-paragraph narrative on what changed. That structure keeps the CFO comfortable with the daily spend variability and prevents the reflexive budget slash when a Tuesday spends $300.
What happens if my google ads budget planning targets miss for two months?
Two consecutive months of missing the target triggers a plan rebuild. Pull the actual CPC, CVR, and cost per lead from the past 60 days. Compare to the planning benchmarks. Identify which input is off. If CPC is 25 percent higher than plan, either the metro is more expensive than the benchmark suggests or the bid strategy is losing auctions. If CVR is 20 percent lower than plan, the landing page or the ad-to-page message match is broken. Rebuild the plan around the actual numbers and set new targets for the next 90 days.
Book your free 30-minute strategy call.
No spam, no sales rep. We use your email to schedule your call with a senior strategist. That is it.
More from the blog
View all articles → PPC
PPC Healthcare PPC Advertising Channels Compliance and Targeting
Read article PPC
PPC Dental Facebook Ads Guide for Practices That Book Patients
Read article PPC
PPC