Sales funnel optimization services raise conversion at every stage from first click to closed revenue without buying more traffic. You already have visitors, leads, demos, and quotes moving through your site. The job is to find the two or three stages where drop-off runs wider than benchmark, fix those, and re-measure. That’s the entire discipline in one paragraph, and every consulting hour we bill on it comes back here. You’re reading this post since your funnel produces revenue but not enough of it, or one stage feels broken and you can’t tell which.
The process below is the exact one we run on Redefine Web accounts, benchmarks included, so you can apply it in-house or brief your team on what a serious funnel program looks like. Read straight through in about 12 minutes and you get a diagnosis pattern you can put to work this week.
Diagnosing an underperforming funnel before booking sales funnel optimization services
An underperforming sales funnel has at least one transition losing 15 to 30 points more than benchmark. Sales funnel drop-off is not a moral failure. It’s a measurement gap. Find the underperforming stage first, then fix the cause. Skip the guessing and let the numbers point the finger.
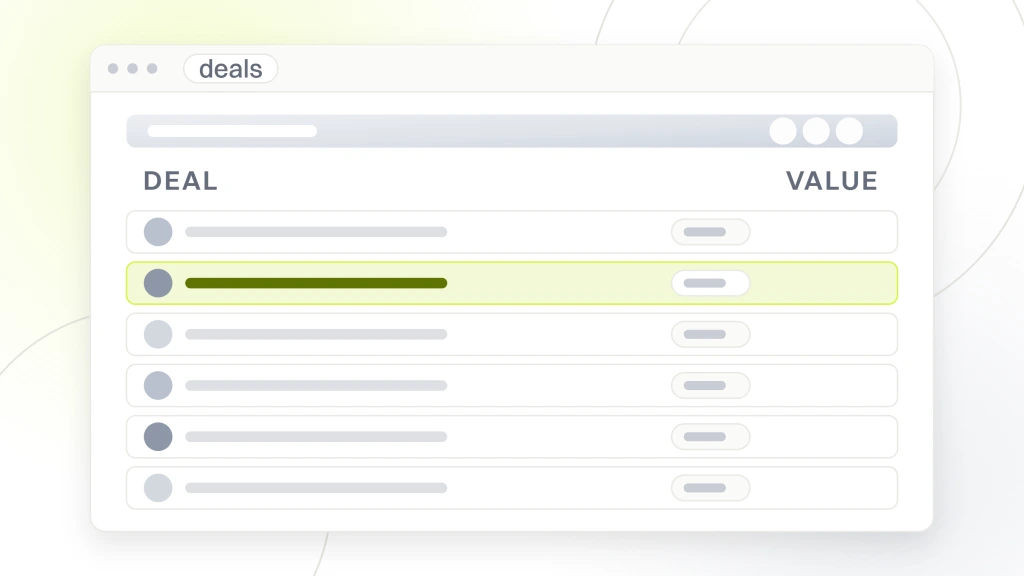
Our first two weeks on any engagement run 12 audit checks across the funnel. Half technical, half behavioral. The technical checks catch the boring things killing conversions silently. The behavioral checks catch the copy, offer, and pricing decisions made once and never revisited. Both categories matter for optimization work that actually moves the number. Neither wins alone.
- Page load time above 3 seconds on mobile
- Form has more than 6 fields for a first touch
- Primary CTA below the fold on mobile
- Contact page missing a phone number or missing a click-to-call link
- Thank-you page missing a next step
- Lead notification email routing to a shared inbox with no owner
- Follow-up cadence slower than 5 minutes on inbound demo requests
- Proposal template longer than 6 pages
- Pricing hidden behind a discovery call for a low-consideration offer
- No retargeting on cart abandonment or form abandonment
- Discovery call script that pitches instead of qualifies
- No handoff document between marketing and sales
Technical fixes that recover the most points
Mobile site speed is the biggest technical driver. A page loading in 4.2 seconds on 4G converts about 40% worse than the same page loading in 2.1 seconds. Form length ranks second. Cutting a 9-field form to 4 fields usually raises submission rate 20% to 35%. Missing click-to-call links on mobile ranks third, and adding one on a service business site often recovers 10% to 15% of hand-raisers who otherwise bounced. Any optimization program that skips mobile speed audits skips the largest single lever on the whole board.
Behavioral fixes that compound over time
Speed-to-lead is the biggest behavioral driver. Inbound demo requests followed up within 5 minutes convert to opportunity at 3 to 8 times the rate of requests followed up within 24 hours. Second is proposal quality. Six-page proposals close about 30% higher than 22-page proposals on deals under $20,000. Third is pricing transparency. Showing a starting price on the page qualifies out tire-kickers before they take an hour of your sales team’s time. That’s three behavioral levers you can pull this week without a redesign.
Sales funnel optimization strategies by stage
Run one strategy per stage, not a mixed bag applied everywhere. Top of funnel needs traffic quality control. Middle needs offer and nurture strength. Bottom needs speed and clarity. Sales funnel optimization strategies stack. They don’t blend. Pick one per stage and run it clean, then read the delta before you touch the next stage.
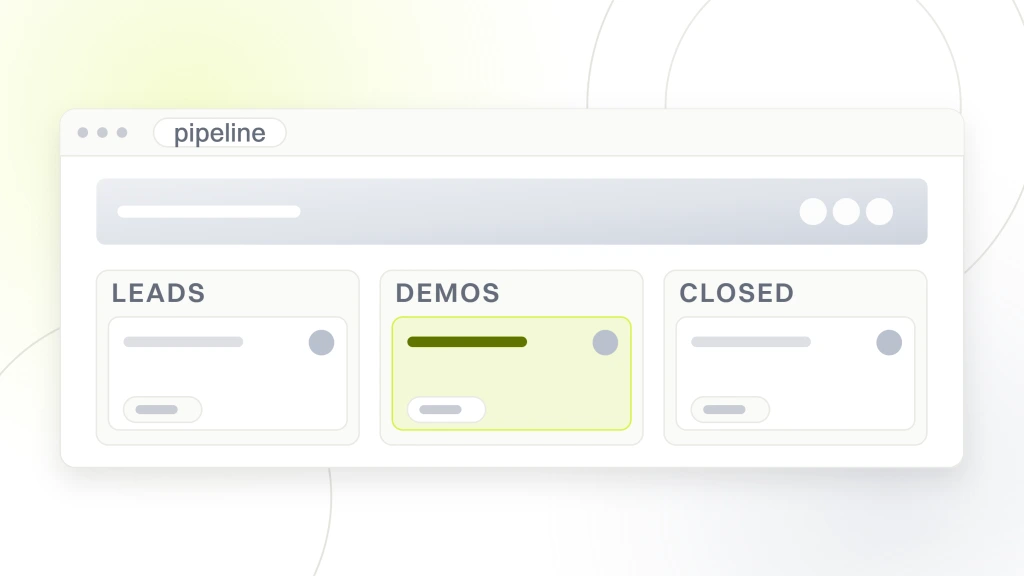
The five strategies below are the ones we reach for most often across client accounts. Each maps to a specific stage. You won’t run all five in the same 90-day window. You’ll run the one that matches the stage you diagnosed as farthest from benchmark. If two stages tie, run the earlier-stage strategy first since it feeds every stage below it. Good funnel work lives or dies by this sequencing rule.
Strategy one, traffic quality control
If visit-to-lead sits below benchmark, the problem is often traffic quality, not the page. Cut the bottom 20% of your paid keywords by intent match. Kill display placements sending sub-30-second sessions. Refocus organic content on buyer-intent queries instead of top-funnel awareness. This alone can raise visit-to-lead 40% to 70% inside 60 days without touching the site itself.
Strategy two, offer strength
If page conversion sits below benchmark and traffic quality is fine, the offer is the problem. Rewrite the primary offer to be more specific. “Book a free consultation” converts worse than “Get a $500 same-week SEO audit for $0.” Specificity beats generic every time. Test two offers over a two-week window with equal traffic, keep the winner, and roll it to the rest of the site the next sprint.
Strategy three, nurture cadence
If lead-to-opportunity is below benchmark, the nurture sequence is broken or missing. Build a 5-touch email sequence over 21 days, plus one phone call on day 3 and one on day 14. Add SMS if the lead opted in. Measure open, click, reply, and booked meeting rate at each touch. Cut touches with reply rates under 1%, double down on the ones above 3%. That’s how sales funnel optimization strategies compound month over month.
Ecommerce sales funnel optimization specifics
Ecommerce sales funnel optimization runs on different math than services. Shorter stages, higher volume, and a checkout step that alone can absorb 15% to 30% of revenue. Cart abandonment, checkout friction, and payment failure rates are your top three drivers. Fix those three before touching anything else on the store.
Ecommerce funnels carry one wildcard services funnels don’t, shipping cost surprise at checkout. Roughly 40% of checkout abandonment traces to extra costs like shipping, tax, and fees, per the Baymard Institute cart abandonment research. Show the total including shipping earlier in the flow. Product page, cart page, and checkout should all display the same total. If they diverge, users assume they’re being tricked and leave.
Cart abandonment fixes that move the number
Cart abandonment recovery emails, sent 1 hour, 24 hours, and 72 hours after abandonment, recover 8% to 12% of abandoned revenue on average. Adding SMS as a fourth touch adds another 3% to 5% recovery. On-site exit-intent overlays with a small first-purchase discount recover another 2% to 4%. Stack all three and you add 15% to 20% to closed revenue without changing a thing on the store itself.
Reducing checkout friction
Guest checkout should always exist as an option. Forcing account creation drops checkout completion 20% to 35%. Apple Pay, Google Pay, and PayPal reduce time-to-payment 40% to 60% versus manual card entry. Field count matters. A checkout with 14 form fields converts about 25% worse than a checkout with 8 fields. On Shopify or WooCommerce, most of these fixes are a settings toggle away, not a dev sprint. Our Ecommerce Marketing Agency for DTC and Shopify Brands handles this work regularly across DTC accounts.
When to bring in a sales funnel optimization agency
Bring in outside help when your team has run three cycles without moving the number, when the diagnosis crosses two or more functions, or when you need results inside 60 days. A sales funnel optimization agency earns its fees by replacing guesswork with measured improvement, not by adding another dashboard to your day.
What a good sales funnel optimization agency does in the first 30 days, audit the current instrumentation, capture 90 days of baseline transition rates, identify the two stages farthest from benchmark, propose one change per stage with predicted delta, and set up the measurement to read the delta cleanly. If the pitch skips the audit and jumps to a redesign, keep interviewing. That’s the tell of a shop selling their process instead of solving your problem.
Agency versus sales funnel optimization consultants
Sales funnel optimization consultants tend to be solo operators who diagnose fast and hand off execution to your team. An agency does diagnosis and execution end to end. Consultants cost less, move faster on strategy, and put the burden on your team to build and push changes live. Agencies cost more, take longer to onboard, but own the outcome. Pick the model that matches the internal capacity you have, not the one you wish you had. That call alone saves most teams a full quarter of wasted budget.
Pricing expectations
Fair market pricing for full-service funnel programs runs $2,500 to $8,000 per month depending on funnel complexity, traffic volume, and how much execution work sits inside scope. Standalone sales funnel optimization consultants run $200 to $400 per hour or $4,000 to $12,000 for a defined audit-plus-recommendations project. Anything under $1,500 per month is a monthly report, not real optimization work. Anything over $15,000 per month should include dedicated developer time on your codebase, not just marketing hours.
A real sales funnel optimization case study
Automation Anywhere, an RPA SaaS platform, came to Redefine Web with a cost per lead stuck at $1,936. That number made every paid channel unviable no matter how strong the platform. Their campaigns chased three goals at once, impression share, lead volume, and awareness, and each fought the others. Global campaigns ran only in English with no regional adaptation, landing pages didn’t match the keywords driving the traffic, and the primary offer was a plain contact form against competitors giving away analyst reports and free trials.
We split campaigns by objective to unblock the conflicting KPIs, ran a content audit that aligned high-value assets to the right funnel stages, rebuilt landing pages to match keyword targeting, and swapped feature-led ad copy for persona-driven problem-solution messaging. Bid strategy shifted from rank to conversion efficiency. Offers got iterated against RPA-space competitors so the ask matched the market.
Cost per lead fell from $1,936 to $63, a 97% reduction in acquisition cost. Qualified lead volume scaled 100 times over the engagement, from 150 per month to nearly 8,000 monthly. Ad impressions rose 300% and locked in visibility across the key global markets. That’s what serious optimization work looks like when the diagnosis is clean, the changes roll out one per stage, and the measurement stays honest between cycles.
What worked on the account
Three moves carried most of the gain. Splitting campaigns by objective ended the internal KPI fight and let each campaign optimize for one goal. Landing pages rebuilt around the exact keyword clusters raised quality scores and cut cost per click, plus grew conversion rate at the same time. The offer swap from a bare contact form to a set of persona-matched downloads pulled qualified leads that a plain form never got in front of. Layered fixes, one per stage, measured cleanly against the pre-engagement baseline.
What we tried that didn’t work
Not every test on the Automation Anywhere account paid off. A pricing test between two tiers moved nothing measurable. A referral loop with a $50 credit incentive returned less than the cost of the credits. A live chat widget on the pricing page raised support cost without raising booked meetings. The value of running one change per stage is that the losers are visible. They get cut before they burn time. Any engagement that reports only wins is either brand new or hiding the losses.
How to hire the right sales funnel optimization services partner
Ask four questions on the first call. What does your first 30 days look like. What baseline data do you need from me. Which stage would you look at first. What have you cut from a client account that didn’t work.
Ask for two references from clients whose engagement ended in the last 12 months, not just current clients. A good sales funnel optimization consultant or agency will have both wins and finished engagements. Talk to at least one of each. The finished-engagement reference tells you the truer story since the client is no longer being managed. Any partner who can’t answer those specific questions on the first call is selling a template rather than a diagnosis.
Scope clarity in the contract
The contract should name the funnel stages inside scope, the tools you’re running on, the reporting cadence, and the ownership of any code or copy the partner produces. Vague scope leads to vague results. If the contract says “grow revenue” without naming the stages, the partner spends time on whichever stage is easiest for them and leaves the hard ones alone.
Measurement agreement on day one
Agree on the numbers you’ll read together every two weeks before the engagement starts. Site visit to lead, lead to opportunity, opportunity to closed deal. Any metric a partner wants to add later usually softens the reporting. Any metric they want to drop from the baseline signals they’re avoiding the stage where they’re underperforming. Fix the definition on day one, then hold the line. Our Sales Funnel and Automation service runs on this exact reporting rhythm.
Running sales funnel optimization services internally versus outsourcing
You can run this program in-house if you have a revenue operations lead, a marketer who understands events and attribution, and a developer with 10 hours a week free. Without those three, outsource the first two cycles and staff up in parallel during the partner’s run. Trying to build the muscle from zero at the same time as fixing the funnel usually means neither happens.
Internal ownership pays off long term since the person who ran the fix understands why it worked. That knowledge compounds. Every subsequent cycle gets faster once the baseline is understood, the tools are wired correctly, and the team knows how to hypothesize before they build a test. Outsourcing a first cycle is a cost. Outsourcing every cycle is a permanent tax on your revenue efficiency, and the tax gets more expensive as your traffic grows since the partner’s percentage of revenue scales with the account. Our B2B SaaS Marketing Agency Tied to Pipeline engagements often start with the outsourced first-cycle model and hand day-to-day off to the client team after cycle two, keeping oversight monthly. That’s the pattern we see work best across roughly two-thirds of new engagements.
- Instrumentation audit. Two weeks, one marketer, one developer for 10 hours
- Baseline capture. One week, pull 90 days of transition rates for every stage
- Diagnosis. Three days, rank stages by gap to benchmark
- Change one at a time. Two to four weeks per stage, measure delta cleanly
- Rollup. Monthly report, share what worked and what got cut
Common mistakes that wreck sales funnel optimization services programs
Three mistakes wreck most optimization programs. Running too many changes at once. Skipping the baseline. Trusting reported numbers from platform analytics without cross-checking against the CRM. Any one blurs the read on what worked. All three together guarantee the program produces nothing measurable in six months.
A fourth mistake, quieter but expensive, is optimizing a stage that isn’t the bottleneck. Every hour spent raising a 4% stage to 5% is an hour not spent raising a 12% stage to 22%. The bigger absolute win almost always sits on the stage with the widest gap to benchmark, not the stage with the friendliest team or the easiest test to build. Good funnel work attacks the widest gap first every single cycle.
The redesign trap
Full-site redesigns get pitched as sales funnel optimization all the time. They rarely are. A redesign moves 30 variables at once and produces a number that could be up since the offer changed or down since the navigation changed and nobody can tell. If a partner suggests a full redesign in month one, ask them to name the specific stage the redesign fixes. If they can’t, the redesign is scope creep dressed up as strategy.
Vanity metrics that hide the truth
Bounce rate is a vanity metric. Time on page is a vanity metric. Session duration is a vanity metric. None move revenue on their own. The metrics that matter are the transition rates between stages and the absolute count of closed deals per week. If your reporting dashboard leads with bounce rate, the dashboard got built by someone measured on traffic, not revenue. Fix the dashboard first, then the funnel underneath it.
Wrapping up sales funnel optimization services
Serious funnel work isn’t a mystery. Map the stages, capture the numbers, benchmark each transition, and fix the widest gap first. One change per stage, two to four weeks of clean measurement, then the next stage. Anything more complicated is a services pitch not aligned with your revenue.
Want a second set of eyes on your current funnel? We run a 90-minute audit that identifies your two biggest gaps and predicts the delta of fixing each. That’s the same audit we run on day one of every engagement. Whether you keep the work in-house or bring us in, the audit output is yours to run with.