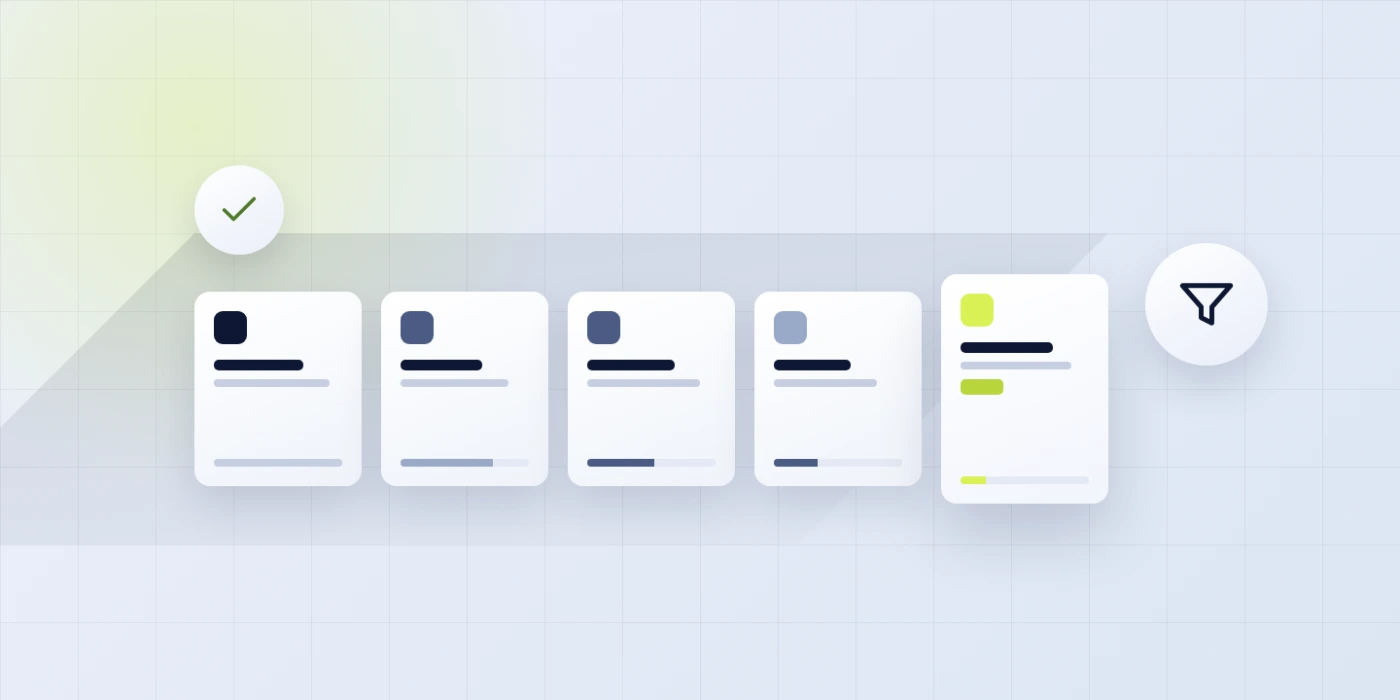
Sales funnel stages are the four to six labeled steps a stranger walks through to become a paying customer, tagged TOFU (top), MOFU (middle), and BOFU (bottom), with Lead, MQL, and SQL as the handoff labels between marketing and sales. Every stage owns one primary metric, and every transition owns one target rate, so the whole team reads the same dashboard every week.
Get the framework right and your marketing dollars stop wandering. Every paid ad, every email, every demo request lands inside a labeled stage with a known target rate.
The framework has been the working vocabulary of B2B sales teams for over a century, going back to Elias St. Elmo Lewis in 1898 and the AIDA model that still shapes how modern buyer journey guides describe the stages. In short, the framework is the shared operating system for every serious pipeline.
This guide walks each stage in plain English, maps the TOFU MOFU BOFU tags to real buyer behavior, and gives you the metric, the tool, and the target conversion rate that each stage owns. You will get the B2B and SaaS variations, the labeling mistakes we spot on almost every audit, and a copy-ready one-page diagram. Reading time is about 10 minutes.
What the sales funnel stages actually are
The four sales funnel stages are Awareness, Interest, Decision, and Action, often split into TOFU, MOFU, and BOFU for content planning. Every stranger who becomes a customer walks through each stage in order. You cannot skip any of them. Every stage has one metric attached, so you know exactly where people drop off before the deal closes.
Most teams that fail with funnel tracking mix up the stages of a sales funnel with the channels feeding those stages. A Facebook ad is not a stage. A landing page is not a stage. A sales call is not a stage. Awareness, Interest, Decision, and Action are the stages, and the channels feed each one from the outside. Every channel gets a UTM tag, every stage gets an event, and every transition gets a rate. That separation of stage from channel is the biggest single fix we recommend on client audits.
The stages in a sales funnel diagram serve as a shared vocabulary between teams. Marketing, sales, and finance often use different words for the same buyer state, and that mismatch produces friction inside every quarterly review. Locking the pipeline to one four-word set removes the friction. You get one label per state, one metric per label, and one team meeting per week instead of three.
- Awareness (TOFU). A stranger meets your brand. Metric: unique visitors and impressions.
- Interest (MOFU). The stranger becomes a known lead. Metric: form fills and email opt-ins.
- Decision (MOFU-BOFU). The lead becomes an opportunity. Metric: booked meetings and demos.
- Action (BOFU). The opportunity becomes a customer. Metric: signed deals and revenue.
- Retention. The customer becomes an advocate. Metric: renewals, referrals, and expansion revenue.
Stage labels are not channel labels
Google Ads is a channel that feeds Awareness. Google Ads is not the Awareness stage itself. That distinction sounds pedantic, and it saves months of confused reporting. When someone says “Google Ads is not working,” they mean the channel is not driving enough of the stage. The stage might be fine. The channel might be misconfigured. Separating stage from channel keeps the diagnosis honest and points the fix at the right layer of the pipeline.
Top of funnel sales stage explained
Top of funnel is where strangers meet you for the first time. Content, SEO, paid ads, PR, and organic social all feed it. You count sessions, unique visitors, and time on page. Volume matters more than quality at this layer, and a wide top feeds every stage below. Cost per visitor should sit inside the normal range for your industry and channel mix.
Every top of funnel program runs on a mix of paid and organic. Paid buys volume fast and predictably. Organic wins on cost, yet takes months to compound. Skip paid and the ramp stalls. Skip organic and you rent every visitor forever. The right split depends on budget, deal size, and time horizon. Most small businesses under $2M in revenue start at 70 paid and 30 organic, then flip the ratio as SEO compounds over 12 to 18 months.
The most common mistake at the top is confusing traffic for a business result. Ten thousand visitors from the wrong keyword do nothing for the deal count. One thousand visitors from a keyword tied to a real buyer intent produce more revenue than 10,000 tourists. Every top-of-funnel audit we run starts with keyword intent, not visitor volume. Quality of intent matters more than quantity of clicks at every scale.
Which channels feed TOFU best
SEO wins on cost per visitor over 12 months. Google Ads wins on speed and intent capture. Meta Ads wins on cheap reach and audience testing. YouTube wins on brand memory. LinkedIn wins on B2B account targeting. Every top of funnel program we run picks three or four of the five, never all five. Three well-funded channels beat six half-funded ones every quarter. Pick three, fund them fully, then run them for 90 days before you judge results.
TOFU metrics worth tracking weekly
Unique visitors, sessions, average session duration, and cost per visitor. Those four numbers cover 90% of top of funnel health. Every other TOFU metric is a supporting detail you only open when one of the four moves more than 15% off the four-week rolling average. Read the four every Monday and the top of the funnel stops surprising you.
Middle of funnel sales stage explained
The middle of the funnel is where strangers become leads. A visitor trades an email for a guide, a webinar, a discount code, or any other useful offer. Once you have the email, the visitor becomes a known contact in your CRM. Every marketing tool from that point forward can reach them directly, and every stage transition gets tracked against the same contact record.
Every serious middle of funnel program we build runs on three assets: a useful lead magnet, a five-touch email nurture sequence, and a clean CRM. The lead magnet earns the email. The nurture sequence moves the contact from Interest to Decision. The CRM tracks the transition. Miss any one of the three and the middle stalls. Most stalled funnels we audit break right here, and it is usually the nurture sequence nobody built or maintains after launch.
The middle of the funnel is where you segment. One nurture sequence for every audience produces mush. Split the sequence by audience or by lead magnet, so each contact gets content that speaks to their real problem. Every mid-sized brand we work with runs three to five nurture sequences at once, each aligned with a segment. That segmentation grows middle-stage conversion by 20 to 60% compared with a one-sequence-fits-all approach.
Nurture cadence that actually works
Five emails, spaced three to five days apart, over about two and a half weeks. Email one delivers the promised lead magnet. Email two adds a related use case. Email three tells a client story. Email four asks a diagnostic question and offers a call. Email five re-offers the call with a soft close. That cadence closes 15 to 25% of qualified middle-stage leads for most B2B accounts we run. Any tighter cadence burns the list. Any looser cadence loses the deal.
Bottom of funnel sales stage explained
The bottom of the funnel is where opportunities become customers. Booked meetings turn into demos, demos turn into proposals, proposals turn into signed contracts. Sales owns most of the bottom. Marketing supports with case studies, comparison content, and pricing pages. Every action at the bottom is worth more per unit than any action at the top, since you already paid to acquire the lead upstream.
Bottom of funnel usually converts at 20 to 40% for B2B services on qualified opportunities. Below 20%, the offer or the sales process is broken. Above 40%, the close rate is strong yet the top is probably underfed. Every pipeline diagram we hand a client marks the target rate at each transition, so the team spots drift the same week it starts.
Bottom of funnel improvements compound fast. Add 5 points to close rate on an account closing 25 deals a quarter and you gain 6 extra deals per quarter, or 24 per year. That is often the difference between funding a new AE and holding off another quarter on hiring. We prioritize bottom-stage fixes over top-stage volume on every underperforming pipeline we audit. The math wins every time.
Bottom-stage assets that close deals
Case studies with real numbers. Comparison pages against three top competitors. A pricing page that shows tiers and includes a clear anchor price. A demo request page with three fields, not 12. A proposal template that opens with an executive summary and closes with a signature line. Every bottom-of-funnel audit we run finds one or two of these assets missing or half-built, and every one is cheaper to fix than another quarter of paid ad spend.
Leads MQLs and SQLs inside the sales funnel stages
Leads, MQLs, and SQLs are the handoff tags between marketing and sales. A Lead is any contact who gave you an email. A Marketing Qualified Lead (MQL) is a lead who fits your target profile and shows real intent, like requesting a demo or visiting a pricing page. A Sales Qualified Lead (SQL) is a lead your sales team has agreed to work.
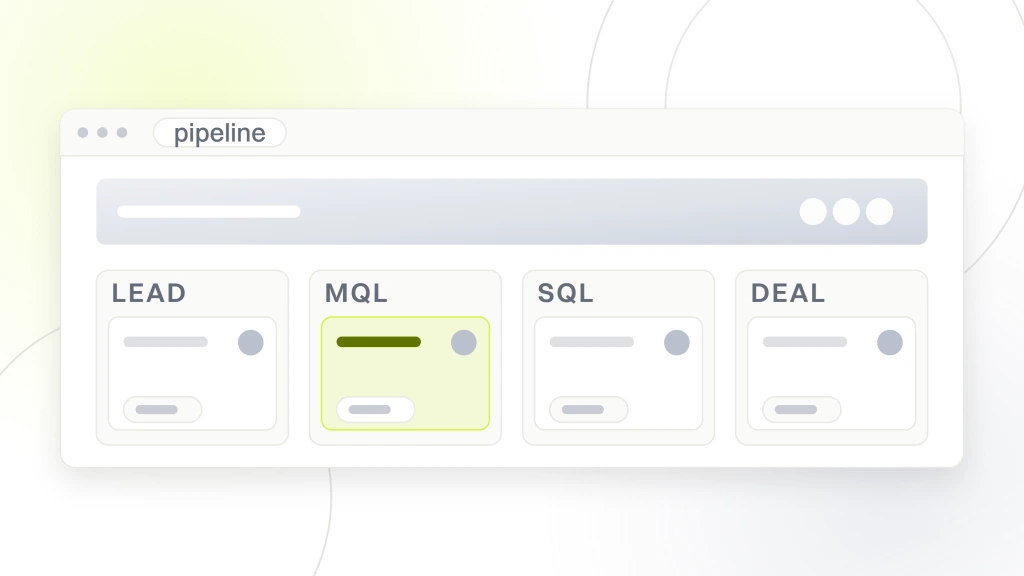
The MQL definition changes per team, and that shift is the biggest source of friction we see between marketing and sales. If marketing calls any email opt-in an MQL, sales calls MQL numbers inflated and refuses to trust them. If marketing tightens the MQL definition to fit-plus-intent, sales trusts the numbers and works the leads faster. Every serious pipeline audit we run starts with a shared MQL definition. Write it down. Publish it. Enforce it in the CRM.
SQL definitions drive capacity planning. Each AE handles a fixed number of active SQLs at once, usually 30 to 50 for a services business or 20 to 30 for higher-touch enterprise sales. Once the funnel throws off more SQLs than the team can work, you add reps or the extra leads sit unattended and cool off. That is why the MQL to SQL rate matters as much as raw lead volume, and it is why staffing plans should follow the funnel math, not the other way round.
Lead scoring model that keeps MQL definitions honest
Points for fit (company size, industry, role). Points for intent (pricing page views, demo requests, high-touch content downloads). Points for engagement (email opens, replies, chatbot conversations). A lead crosses the MQL threshold when the combined score exceeds a number your team agrees on. Every serious HubSpot or Salesforce install we run bakes this scoring model in on day one, so MQL becomes a data-backed state, not a judgment call.
B2B sales funnel stages that add extra handoffs
B2B pipelines usually add two or three extra states compared with a small-business funnel. You get Awareness, Interest, Consideration, Evaluation, Decision, and Action, sometimes with a separate Vendor Approval or Legal Review stage before the deal closes. Long enterprise cycles need those extra labels since a single “Decision” bucket hides three months of committee work behind one number.
Typical B2B benchmarks target an SQL to close rate of 15 to 25% and a sales cycle of 45 to 180 days. Cost per closed deal ranges from about $500 on a $10K contract up to $12,000 on a $250K enterprise contract. Every B2B pipeline we build tracks all three numbers by segment, so enterprise deals do not distort SMB averages on the same dashboard.
Rapyd Financial Network is a fintech SaaS company we helped scale with a unified inbound and CRM program. When we started, monthly inbound sat near 5 leads, the CRM was fragmented across three tools, and the pipeline sat untracked. After the rebuild, inbound leads tripled, inbound sales pipeline passed £1.8 million, and organic traffic grew 5× from the SEO and content work. Same team, cleaner stages, sharper B2B pipeline math.
B2B versus B2C stage differences
B2C funnels stay short since most decisions run on emotion and price. Awareness, Interest, and Action often collapse into a single 20-minute session. B2B funnels stretch, and that is by design: committees, procurement, and legal all sit inside the Decision stage. Same four-stage skeleton, different time horizons at every step. Never apply B2C benchmarks to a B2B funnel or the reports will read as broken when the team is doing perfectly fine.
SaaS sales funnel stages with activation and retention
SaaS sales funnel stages add Activation and Retention beyond the standard four. A signup is not a customer. A signup who runs the product once is not a customer either. Activation is the first meaningful action inside the product, usually defined per app. Retention is the pattern of return usage that predicts a renewal. Both matter, since SaaS revenue depends on the second and third year, not the first month.
Rocket Software is a SaaS subscriber-acquisition tool that came to us with a broken onboarding flow, weak drip campaigns, and a stalled launch plan. We rebuilt the SaaS funnel around a fresh drip sequence, activation-focused emails, and a four-channel launch plan spanning email, social, paid, and influencer. Activation grew 300% in the first month. Week one closed 3,000 customers. The funnel now pulls 400-plus new subscribers a day. Same product, cleaner stages, stronger numbers.
Every SaaS funnel template we hand a client includes Retention as a first-class stage, not an afterthought. The reason is math. A 5-point improvement in month-two retention often produces more revenue over 24 months than a 20-point improvement in signup rate. Retention compounds. Signups do not. Every serious SaaS company we advise spends more time on the Retention stage than on the Awareness stage after year one.
Defining the activation metric
Activation is the first meaningful action inside your product. For Slack, it was 2,000 messages sent by a team. For Dropbox, it was one file uploaded on two different devices. Every SaaS company defines its own activation metric, and the shape is the same: the smallest observable action that predicts long-term retention. Find yours by looking at what active users did in their first 14 days versus what churners did.
Typical sales funnel stages conversion rates
Every industry has different conversion rates at every stage, and a small set of ranges applies to most work. Use the table below as guardrails, not targets. Ecommerce funnels track different signals from services work, so pair this with our ecommerce sales funnel playbook if you sell direct to consumer. Your business will fit inside one column and drift toward the other over time as the funnel matures.
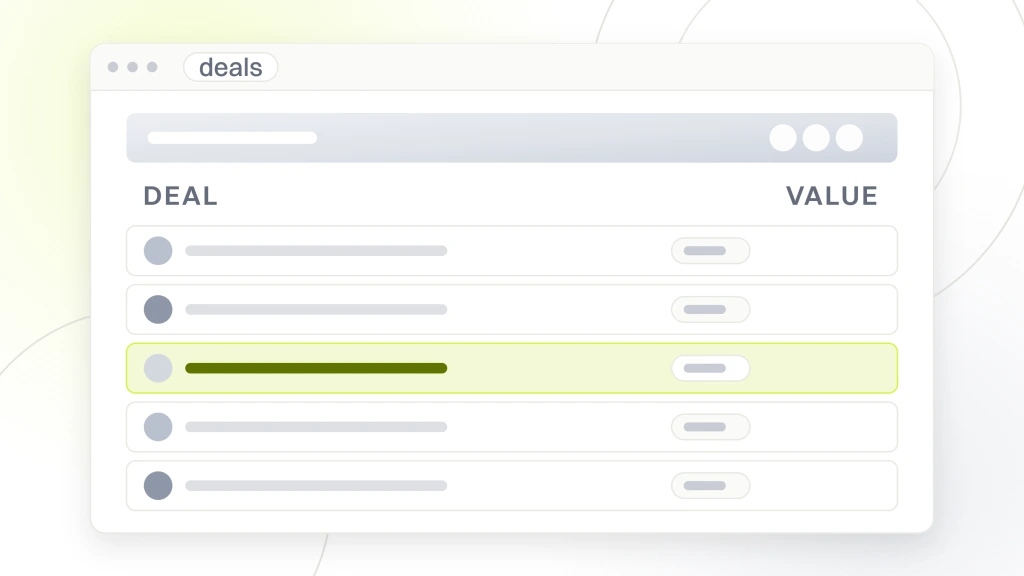
| Stage transition | B2B services | SaaS product | Ecommerce |
|---|---|---|---|
| Visitor to Lead | 2 to 8% | 3 to 10% (trial signup) | 5 to 15% (email popup) |
| Lead to MQL | 20 to 40% | 30 to 60% | n/a (short cycle) |
| MQL to SQL | 30 to 60% | 20 to 40% (activation) | n/a |
| SQL to Deal | 15 to 25% | 10 to 20% (paid conversion) | 60 to 80% (add to cart) |
| Sales cycle length | 45 to 180 days | 7 to 30 days | 1 to 3 days |
Read the ranges as diagnostic guardrails. Any transition sitting well below the range signals a broken stage that needs a targeted fix before you touch the rest of the funnel. Any transition sitting well above the range signals a stage that is over-optimized at the expense of volume, and it usually means the upstream stage needs more feed. Every serious quarterly funnel review runs this table against last quarter’s actuals and flags the biggest gap for the next quarter’s roadmap.
Where the benchmark ranges come from
The ranges above come from our own client work across roughly 50 accounts. They are not universal truths. They are starting points. Your business will build its own benchmark once the funnel has 90 days of clean stage data, and that internal benchmark matters more than any industry average printed in a report.
Common stage-labeling mistakes we see on audits
Every funnel audit turns up the same short list of labeling mistakes. Marketing calls everything an MQL to inflate the report. Sales calls nothing an SQL until the contract is nearly signed. Both are self-serving definitions that break the shared vocabulary the funnel is supposed to provide. The fix is a written definition of every stage transition, published in the CRM as a required field validation.
- MQL means any opt-in. No. MQL means fit-plus-intent, verified against a scoring model.
- SQL means sales has picked it up. No. SQL means the AE has agreed to work the lead and has an active follow-up scheduled.
- Awareness includes email subscribers. No. Email subscribers are already in the Interest stage. Do not double-count.
- Decision only counts if the deal closed. No. Decision means a real conversation happened, whether the deal closed or not.
- Retention starts at year one. No. Retention starts the day the customer’s first invoice clears.
- Stages match channels. No. Stages describe buyer state. Channels feed stages. Keep them separate.
Most VPs of Sales send this Monday email at least once a quarter. MQL count says 800 for the month, the team booked 12 meetings, what happened? The answer, every time, is that marketing and sales agreed on a definition six months ago and quietly stopped enforcing it. The fix is a 30-minute meeting and a required CRM field. The pain is the six months of arguments before anyone called the meeting.
Fixing the shared definitions
Get marketing and sales in one room. Agree on a written definition of each stage transition. Publish it in a shared Google Doc. Bake the definition into the CRM required fields, so a lead cannot move to the next stage without meeting the criteria. Review the definitions every quarter. Every serious pipeline audit we run starts with this conversation, and every audit produces a definition document as a deliverable.
Sales funnel stages diagram and template you can copy
Every funnel diagram we hand a client has the same skeleton. Four to six labeled stages, one primary metric per stage, one transition rate between each pair of stages, and a target range next to each rate. The visual sits on a single page, so a new team member can read the entire pipeline shape in 30 seconds. That single-page diagram is the operational document. Every quarterly review starts here.
The typical stage template lives inside your CRM as a deal pipeline or lifecycle stage set. HubSpot includes lifecycle stages out of the box. Salesforce has opportunity stages. Pipedrive has pipeline stages. Every one of them maps cleanly to the four-to-six-stage skeleton once you configure it. Do not reinvent the wheel by writing your own stage schema in a spreadsheet. Use the built-in stages, customize the labels once, and move on.
Every template we build for a client includes a written playbook per stage. What triggers entry. What actions the team takes during the contact’s time inside. What triggers exit to the next stage. What triggers exit to lost or nurture. Those playbooks turn the funnel into a repeatable operational document instead of a marketing metaphor pinned to a wall.
The one-page diagram every team should own
Print the diagram. Put it on the wall. Update the transition rates every Monday after the weekly review. That physical presence keeps the funnel top of mind for marketing, sales, and operations alike. Every pipeline team we coach adopts the practice, and each one reports the wall diagram cuts stage-confusion questions inside 30 days.
Tools that track each of the sales funnel stages
Every stage needs a tool that owns tracking for that stage. Google Analytics 4 for Awareness. Your CRM (HubSpot, Salesforce, Pipedrive) for Interest through Action. A call tracker like CallRail for phone-based transitions. A dashboard tool like Looker Studio or Databox to pull them into one view. Total monthly cost lands between $50 and $2,000 depending on volume.
Every mid-sized brand we serve eventually converges on a stack of four tools, roughly one per stage cluster. The details vary. Some teams pick HubSpot Marketing Hub Pro and run everything there. Others pick Salesforce plus Marketo plus a call tracker plus a BI tool. Both work. The choice depends on team preferences and existing tool investments. Every one of the stacks matches the four-stage skeleton once you configure it.
The tool stack is not the point. The point is that every stage of the sales funnel has one system of record that owns the number and gets read the same way every week. Two tools reporting different rates for the same stage is worse than no tool at all. Pick one system per stage, make it the single source, and every dashboard reads from there.
Tools that fit your team size
Solo founder: HubSpot Free plus GA4 plus MailerLite. Total: $0 a month. Small team: HubSpot Starter plus GA4 plus CallRail plus Databox. Total: $200 a month. Mid-market: HubSpot Marketing Hub Pro plus Salesforce plus CallRail plus Looker Studio. Total: $1,600 a month. All three stacks track the same four stages and match the same diagram. Pick the tier that fits current revenue, not next year’s plan.
Make the sales funnel stages work for your pipeline
Once your team agrees on the stages, the vocabulary, and the metric per stage, three things happen. Marketing and sales stop arguing about definitions. Weekly reviews drop from an hour to 15 minutes. Finance can forecast next quarter within 20% by rolling stage rates forward against expected top of funnel volume. All three compound over the next 12 months.
From here, the natural next reads are the deeper posts in this cluster. Start with what is a sales funnel if you want the foundational primer. Continue with how to create a sales funnel for the build sequence in full. If your business is B2B, the B2B sales funnel post covers the extra stages a longer cycle needs.
Ready to hire a team that runs this playbook on your account? Our sales funnel and automation services cover the full four-stage build, real tracking wiring, and a 90-day pipeline forecast on every project. For broader marketing help alongside the funnel work, our digital marketing services handle SEO, PPC, and web design inside the same retainer.
The next three cluster reads
The three deepest follow-up posts cover the sales funnel primer, the build guide, and the B2B variation. Read in that order. Total time from here to a working funnel plan is about 40 minutes of reading, three weeks of build for a small team, or eight weeks for a mid-sized brand. A modest investment for a pipeline finance can actually forecast against.