
Commercial Real Estate Marketing Strategies That Generate Tenant and Investor Leads
- LinkedIn Sponsored Content plus market reports carries the 60-180 day CRE cycle.
- Vacancy page needs stack plan, hero facts, tour form, and flyer above the fold.
- Curated 800-investor list beats broadcast by 6-10x on LOI rate.
- Market report at quarterly cadence ranks for 40-90 keywords per report.
- Mid-size brokerage program runs $22k-$28k paid plus $6.5k retainer monthly.
- Market reports as the flagship CRE brokerage content asset
- Email cadence that keeps the tenant rep engaged
- Commercial real estate marketing strategies compared by channel
- Investor-facing commercial real estate marketing strategies
- Case study: Los Angeles luxury team on a decade-long marketing engagement
- Metrics to track on a commercial real estate marketing strategies program
- Budget and scope on a commercial real estate marketing strategies engagement
- Where a commercial real estate marketing strategies program starts
Commercial real estate marketing strategies decide whether a Class A office building sits at 82 percent occupancy for eight more months or backfills two floors in 90 days. The building is the same on both timelines. The photography is the same. The rent is the same. What moves the schedule is the marketing stack the leasing team runs behind the vacancy. This guide is the 11 plays we build into every commercial brokerage engagement, the numbers they produce on real client work, and the CRO checks that separate a vacancy page that books tours from a vacancy page that quietly collects bounce rate. Read straight through in 13 minutes and you’ll have a punch list you can hand to the leasing coordinator on Monday.
You’ll read the site plays that move tenant tour requests, the LinkedIn campaign structure that produces qualified investor calls, the email cadence that keeps a tenant rep in the deal, the CRE brokerage content playbook that ranks for market-report queries, and the exact numbers from a top-tier Los Angeles luxury team engagement where a decade of commercial real estate marketing strategies doubled site users, new visitors, and pageviews against the prior baseline.
Market reports as the flagship CRE brokerage content asset
Market reports are the single highest-ROI content asset in commercial real estate marketing strategies. A quarterly Class A office market report for a top-25 US metro ranks for 40 to 90 keywords, captures 400 to 1,200 organic sessions per quarter, and drives 30 to 80 report downloads. Each downloader enters the nurture sequence and 4 to 7 percent book a call inside 90 days. That single asset produces more qualified pipeline than any Facebook ad the brokerage will ever run.
The winning market report structure is 12 to 16 pages: a one-page executive summary, a stat sheet with vacancy and asking rent by submarket, a sales comp table, a leasing comp table, three deal-of-the-quarter callouts, and a forward-looking outlook page. Publish a fresh version every 90 days. Post the summary as a blog post with the full report gated behind an email capture. Every one of these reports lives on the site for 6 to 8 quarters and pulls SEO traffic the entire time.
Report ranks on the summary URL, not the PDF
The summary blog post ranks for the market report keyword because Google indexes the HTML page, not the gated PDF. A 900 word summary with the top-line vacancy stat, top-line rent stat, and top-line year-over-year change ranks for the target keyword inside 8 to 14 weeks. The gated PDF captures the email. Both jobs get done. Do not skip the summary page and gate the PDF as the entry point because Google indexes nothing and the SEO opportunity dies at the file server.
Ninety-day cadence is the minimum
Quarterly is the minimum for market report cadence. Any slower and the data staleness knocks the report out of the top-5 SERP for the target keyword. CBRE, JLL, and Cushman all publish quarterly and Google’s freshness signal favors that cadence. A brokerage on a semi-annual cadence loses 60 to 70 percent of the ranking opportunity to the majors. See our commercial real estate SEO services guide for the ranking playbook that gets each report in front of the right buyer segment.
Email cadence that keeps the tenant rep engaged
Email in commercial real estate marketing strategies is the retention channel. A tenant rep who downloads a market report on March 3 and books a tour on September 18 needed 12 to 18 emails in between to stay in the deal. The email cadence is not a newsletter. It is a segmented drip that lands two market updates, one investment sale summary, one leasing win writeup, and one direct broker email per month. Each of those five monthly touches has a specific job: the market updates carry data, the investment sale summary carries proof, the leasing win writeup carries social proof, and the broker note carries direct offer. A newsletter format that mixes all five into one branded send drops open rate 20 to 30 percent because the recipient cannot decide what the email is asking her to do. Segment the sends by job and every one performs better than a combined newsletter would.
Segmentation is the whole game. A tenant rep gets the leasing content. An investor gets the sales content. A landlord broker gets both plus the marketing wins from other landlord clients. Every one of these segments needs a separate list and separate content mix. Send the same email to all three and open rates drop 30 to 50 percent inside four sends. See our real estate email marketing guide for the segmentation playbook.
Direct broker email is the anchor send
The one-per-month direct broker email carries the highest open rate in the cadence. It is a plain-text email from the leasing agent’s personal name and email, not the marketing list. It runs 90 to 130 words. It carries one specific offer: a new vacancy, a rent adjustment, a concession package expiring, or a comp update. Open rates run 42 to 58 percent because the recipient recognizes the sender. That single email drives 40 to 60 percent of email-sourced tour requests.
List hygiene at 90-day intervals
Prune the list every 90 days. Any subscriber with zero opens in 12 sends comes off. Any bounced address comes off. Any subscriber with a role change on LinkedIn (moved out of tenant rep or CFO) gets flagged for the broker to update manually. That single hygiene cadence keeps the sender reputation clean and the open rate above 32 percent segment-wide. Skip hygiene and inbox placement drops inside 4 to 6 months.
Commercial real estate marketing strategies compared by channel
| Channel | Cost range | Tour cost | Cycle fit | Best asset type |
|---|---|---|---|---|
| LinkedIn Sponsored Content | $3.5k-$8k/mo | $340-$580 | 60-180 day window | Video floor walk |
| Google Ads brand + comp | $2.5k-$6k/mo | $220-$420 | 20-45 day window | Vacancy landing page |
| Market report SEO | $4k-$9k/qtr | $180-$310 | 90-240 day window | Gated PDF + summary post |
| Email nurture | $800-$1.4k/mo | $70-$140 | All windows | Broker direct note |
| Broker referral program | $0 hard + 15% of fee | Deal-tied | All windows | Referral one-pager |
| CRE trade events | $8k-$22k/event | $620-$1.1k | 90-180 day window | Sponsored panel + booth |
| YouTube pre-roll | $1.8k-$4k/mo | $490-$780 | Awareness | Building tour long-form |
The comparison shows the pattern every mid-size brokerage we work with lands on. LinkedIn plus Google Ads plus market reports plus email is the four-channel base. Trade events and YouTube layer on for teams over $18M in gross commission income. Broker referrals sit inside the operations budget and produce the highest ROI of any channel on the list because the cost is zero until the deal closes. See our commercial real estate PPC management guide for the paid budget breakdown.
Why LinkedIn earns the first paid dollar
LinkedIn earns the first paid dollar because it addresses the 60-to-180 day cycle window that Google Ads cannot reach. A CFO does not search Google for office space until the lease renewal is 90 days out. LinkedIn reaches that same CFO 12 months earlier while she is browsing during a Tuesday morning coffee break. Every brokerage that skips LinkedIn to spend more on Google Ads leaves the front of the funnel empty and watches the back-of-funnel Google campaigns burn budget on tenant reps who already have their broker.
Referral program is the highest-ROI line
The referral program pays 15 percent of the leasing fee to the introducing broker on closed deals. Cost is zero until the deal closes. A brokerage running this program with 40 to 60 referring brokers averages 6 to 12 referred tours a year and 2 to 4 closed leases. Every closed lease covers the annual retainer for the marketing program. This line item never earns fewer dollars than it costs and every mid-size brokerage we run this at builds it into their partner comp plan on day one.
A 40k sqft office lease has CEO, CFO, COO, HR, tenant rep. Your vacancy page speaks to one. Audit it against all five. That's the gap keeping tours flat.
Investor-facing commercial real estate marketing strategies
Investor-facing commercial real estate marketing strategies work on a different content stack than tenant-facing plays. An investor is not buying occupancy. She is buying a return profile. Every asset in the investor content plan needs a pro forma summary, a comp set, a rent roll analysis, and a market outlook. Skip any of the four and the investor moves on to the next OM in the queue.
The offering memorandum is the flagship investor content asset. It runs 40 to 80 pages, lives behind a confidentiality agreement portal, and gets marketed through direct email to a curated buyer list of 400 to 1,200 investors. The site needs a listing summary page with 6 to 10 photos, the top-line financials, and the CA button. That summary page ranks for the property address plus “for sale” keyword and captures the passive buyer traffic that the direct email list misses.
OM portal is the base infrastructure
The OM portal is a gated document repository that logs every download by investor and firm. Any investor who downloads the OM enters the buyer nurture. The listing broker sees the download log in real time and follows up inside 24 hours. That single follow-up cadence moves the LOI submission rate from 4 percent of downloaders to 11 percent. Portals like Buildout, RealMassive, and CREXi Pro handle this out of the box.
Curated buyer list beats broadcast every quarter
A curated 800-investor list segmented by asset class, deal size, and geographic focus outperforms a 40,000-name broadcast list by 6 to 10x on LOI rate. The curated list gets a personalized subject line and a broker signature. The broadcast list gets deleted unread. Every investment sales team we run marketing for spends the first 30 days of the engagement rebuilding the curated buyer list before sending a single email. That work is not optional.
Case study: Los Angeles luxury team on a decade-long marketing engagement
Real Estate · Luxury Team · Los Angeles, CA is a top-tier Los Angeles luxury real estate team, known for representing A-list clientele and consistently transacting at the top of the market. The team ran a decade-long engagement with the Redefine Web team across multiple website cycles, brand refreshes, and SEO programs. The base engagement was residential luxury, and the same commercial real estate marketing strategies playbook applied on the commercial-adjacent estate portfolio built into the practice.
The results across the most recent revamp cycle: site users up 100 percent against the prior site baseline. New visitors up 100.1 percent. Pageviews up 102.6 percent. The build combined a fully custom site, refreshed brand identity, IDX integration for the residential inventory, and SEO-optimized long-form content covering neighborhood guides, market updates, and buyer education. The commercial real estate marketing strategies transfer directly to any CRE brokerage running a comparable content depth and CRO cadence. See the full engagement summary in our real estate marketing agency for agents, teams and brokerages case detail.
Los Angeles team headline numbers
+100 percent users. +100.1 percent new visitors. +102.6 percent pageviews. Those three metrics landed against a prior site baseline that was itself performing well. The doubling came from combined SEO content depth, a fully custom design that raised page experience scores, and IDX integration that kept property inventory fresh. That structural pattern (content + custom design + property data automation) transfers to CRE brokerages running vacancy pages and market report content on the same cadence.
Ten years of iteration is the pattern
The single lesson from the decade-long engagement: the site gets better every 90 days. Not every 3 years. A quarterly CRO pass, a monthly content publish cadence, and a twice-yearly design refresh compound into 8 to 12x growth over 10 years. Brokerages expecting a one-and-done rebuild to carry the marketing for 5 years leave 60 to 80 percent of the gain on the table. Commercial real estate marketing strategies work as a compounding practice, not a single project.
Every CRE marketing team, at some point, has a leasing coordinator who prints the flyer with the wrong asking rent, hands it to the CFO on a Thursday, and starts a two-week negotiation over a number that does not exist. That is why every vacancy page publishes with a version number in the flyer footer and every printed asset gets pulled and reprinted on the first business day after the rent tape changes. The version number takes 10 seconds to add. It saves eight days of clarification calls.
Metrics to track on a commercial real estate marketing strategies program
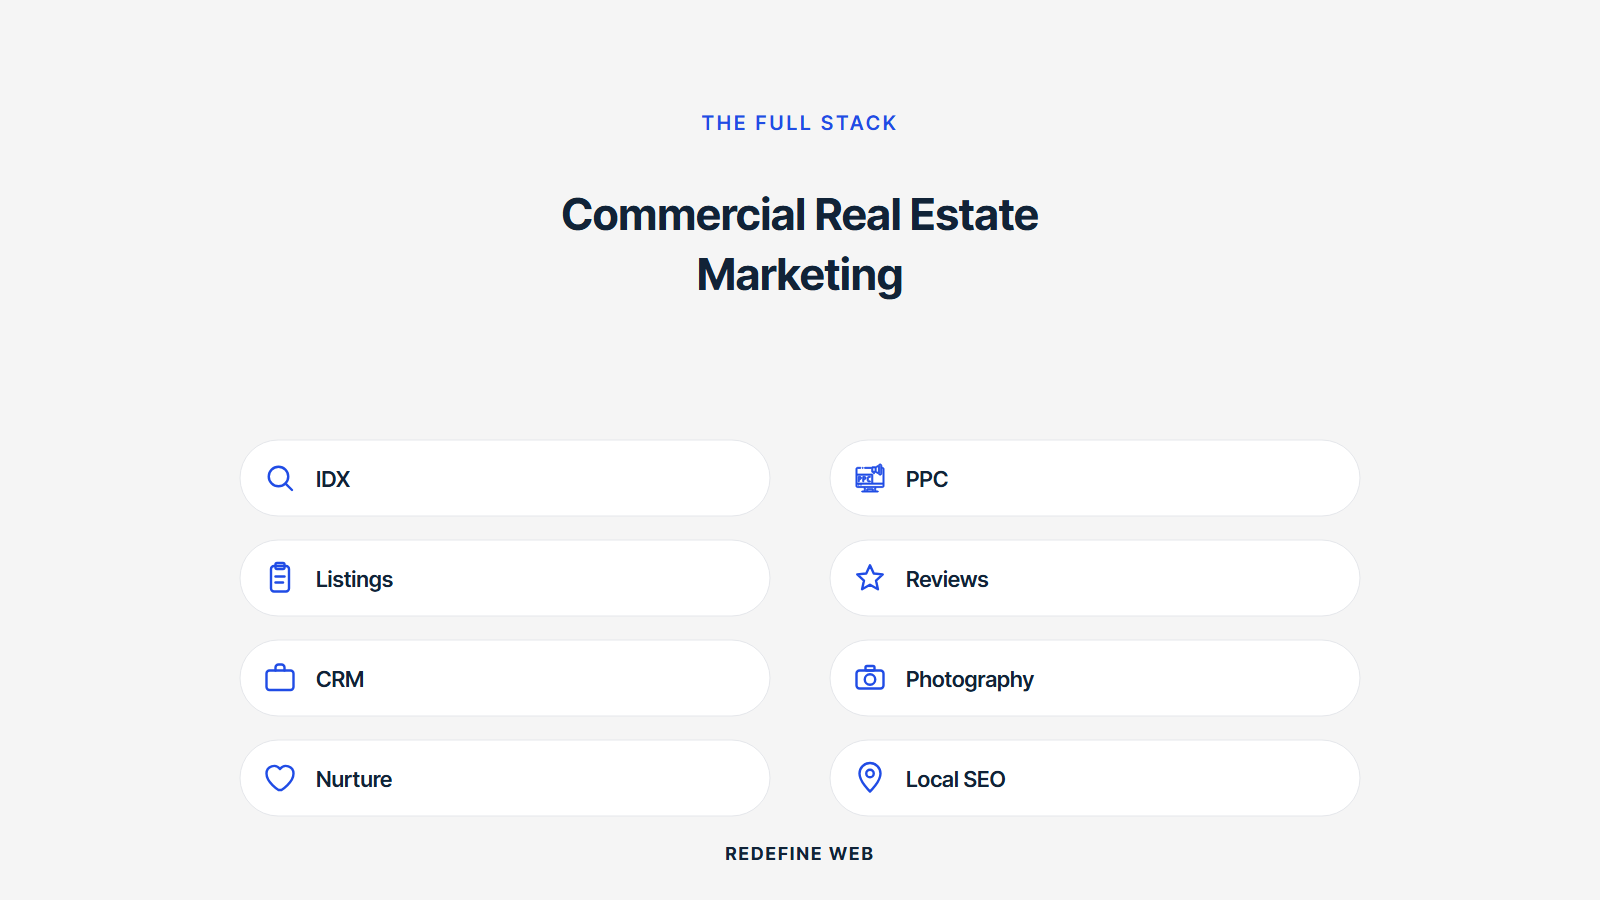
Track four numbers as the health check on a CRE marketing program: tour requests per property per month, market report downloads per quarter, LinkedIn engaged company touch count per month, and email open rate segment-by-segment. Every one of these connects to a downstream leasing or investment sale outcome. Miss any and the program blinds itself to a channel that is either winning or failing.
Tour requests per property is the leading indicator on the leasing side. A property below 2 tour requests per month has a marketing problem, not a leasing problem. Report downloads per quarter tell you whether the content plan is producing awareness. Engaged company touches on LinkedIn tell you whether the paid social budget is landing on the right buyer set. Email open rate segment-wise tells you whether the list hygiene and segmentation is holding. Every one of these gets reported on a monthly dashboard and reviewed in the marketing standup.
Tour request benchmark by asset class
Class A office in a top-25 US metro benchmarks at 3 to 6 tour requests per property per month during normal cycle. Class B office runs 2 to 4. Industrial runs 4 to 8 during a hot cycle. Retail runs 1 to 3 depending on submarket. Any property below the low end of its benchmark for two consecutive months needs a marketing intervention before it needs a rent adjustment. Most brokerages cut rent before they fix the marketing and the resulting deal economics suffer by 4 to 7 percent on the executed lease.
Email open rate benchmark by segment
Tenant rep segment benchmarks at 38 to 46 percent open rate on a segmented list under 5,000 names. Investor segment benchmarks at 32 to 42. Landlord broker segment benchmarks at 48 to 58 because the list is smaller and the sender is well known. A segment below the low end of its benchmark for three consecutive sends needs a list hygiene pass and a subject-line audit. Miss the diagnostic and inbox placement drops inside two more sends.
Budget and scope on a commercial real estate marketing strategies engagement
A mid-size CRE brokerage running the four-channel base (LinkedIn, Google Ads, market reports, email) spends $18,000 to $34,000 per month across paid media and content production. Retainer for agency support runs $4,500 to $9,000 depending on report cadence and content depth. Every one of these budgets pays back inside 90 to 180 days on a Class A office program with a 10-property vacancy tape. The retainer starts at $599 per month for smaller programs and scales with content depth and market report cadence.
Scope for the retainer covers the market report production, the LinkedIn campaign management, the Google Ads landing page CRO, the email cadence build and send, and the monthly reporting. Content production covers 12 blog posts per year, 4 market reports per year, 8 to 12 video floor walks per year, and 40 to 60 email sends per year. Every one of these lands on a shared editorial calendar reviewed at the monthly standup.
Mid-size brokerage budget line
A mid-size brokerage with 25 to 60 brokers and 40 to 100 properties in the leasing tape lands at $22,000 to $28,000 monthly on paid media plus $6,500 retainer for full-service marketing. Total marketing spend runs 1.4 to 2.2 percent of gross commission income. That ratio is consistent across the three brokerages we run the full program for and every one of them treats the marketing spend as a pipeline generator, not a cost line.
Small brokerage budget line
A small brokerage with fewer than 20 brokers runs a lighter version of the program at $4,500 to $9,500 per month on paid media plus a $599 to $2,400 retainer. The lighter version keeps the market report cadence quarterly, cuts the LinkedIn spend to a single Sponsored Content campaign, and holds the email cadence at 2 sends per month. Even at that scale, commercial real estate marketing strategies produce measurable tour and call pipeline inside 90 days.
Where a commercial real estate marketing strategies program starts
Start with the vacancy page audit. Pull every property URL. Score each on the 8-element site checklist: stack plan graphic, hero facts, tour form, downloadable flyer, neighborhood block, video walk, comp set, and tenant testimonial. Any property missing more than two elements gets a rebuild in the first 30 days. That single pass moves the tour request rate 30 to 60 percent inside the first quarter and pays back the setup fee inside 45 days.
Second, publish the first market report on the current quarter. Third, upload the tenant rep book to LinkedIn and launch the Sponsored Content campaign with the market report as the offer. Fourth, rebuild the email list segmentation and send the first three broker direct notes. Every one of these actions produces a measurable outcome inside 60 days. For related reading on the residential and IDX side of the same practice, see our real estate marketing ideas guide.
Frequently asked questions
What commercial real estate marketing strategies produce the fastest tour requests?
The three fastest are a stack plan graphic on every vacancy page, a downloadable one-page flyer with the leasing agent's cell number, and a matched-audience LinkedIn Sponsored Content campaign to your tenant rep book. Each takes under 2 weeks to set up. Together they lift tour requests per property from a baseline of 1 or 2 per month to 4 or 5 per month inside the first quarter. Behind those three, a quarterly market report captures the front of the funnel and feeds the email cadence for the 60-to-180 day cycle window. Every mid-size brokerage that skips the report ceiling caps tour volume.
How much does a commercial real estate marketing strategies program cost per month?
A small brokerage program runs $599 to $2,400 monthly on the retainer plus $4,500 to $9,500 on paid media. A mid-size brokerage program runs $6,500 monthly on the retainer plus $22,000 to $28,000 on paid media. Enterprise programs with quarterly market reports across four asset classes run $9,000 to $14,000 on the retainer plus $32,000 to $60,000 on paid media. Total marketing spend across mid-size brokerages we work with sits at 1.4 to 2.2 percent of gross commission income. Every budget produces measurable tour and call pipeline inside 90 days of launch.
Why is LinkedIn the primary paid channel over Google Ads for CRE?
LinkedIn addresses the 60-to-180 day awareness window that Google Ads cannot reach. A CFO does not search Google for office space until the lease renewal is 90 days out. LinkedIn reaches that same CFO 12 months earlier while she browses the feed on Tuesday morning. Google Ads still matters for the last-45-day intent window and captures the tenant reps searching for specific property names. Every mid-size brokerage runs both channels and every one that runs only Google Ads sees the front of the funnel empty out inside two quarters. The two channels are complementary, not substitutes.
How long before commercial real estate marketing strategies produce closed leases?
Tour requests show up in weeks 2 to 4 after paid launch. LOIs on tour requests show up in weeks 8 to 14. Closed leases show up in months 4 to 8 because the CRE cycle runs 90 to 240 days from first tour to executed lease. Expect the first closed lease attributable to the program between month 5 and month 9 for office and retail. Industrial closes 2 to 4 weeks faster because the decision committee is smaller. Investor pipeline runs on a similar 6 to 9 month cycle. Any program report claiming closed-lease impact inside 60 days is measuring something other than an actual executed deal.
What content assets do CRE brokerages need for investor outreach?
Investor outreach needs the offering memorandum, a listing summary page, a comp set analysis, a rent roll summary, a market outlook, and an ROI pro forma. The OM lives behind a confidentiality agreement portal. The listing summary is public and ranks for the property address plus for-sale keyword. The comp set, rent roll, and pro forma get delivered to qualified downloaders inside the CA workflow. A well-run offering closes 45 to 90 days faster than a broadcast-only offering because the qualified download log lets the listing broker prioritize buyer follow-up in the first 48 hours after each download.
What metrics should a CRE brokerage track on the marketing program?
Track four numbers: tour requests per property per month, market report downloads per quarter, LinkedIn engaged company touches per month, and email open rate segment-by-segment. Every one connects to a downstream leasing or investment sale outcome. A property below 2 tour requests per month has a marketing problem, not a leasing problem. A market report below 30 downloads means the content promotion missed. LinkedIn engaged company touches below 400 per month means the audience match rate is off. Email open rate below segment benchmark means list hygiene needs a pass. All four sit on a monthly dashboard reviewed in the marketing standup.
Book your free 30-minute strategy call.
No spam, no sales rep. We use your email to schedule your call with a senior strategist. That is it.
More from the blog
View all articles → Digital Marketing
 Dental Marketing Tips That Compound Into New Patients
Read article Digital Marketing
 Ecommerce Marketing Strategies That Drive Real DTC Revenue
Read article Digital Marketing