
Dental Marketing Cost. How Much Should a Practice Spend
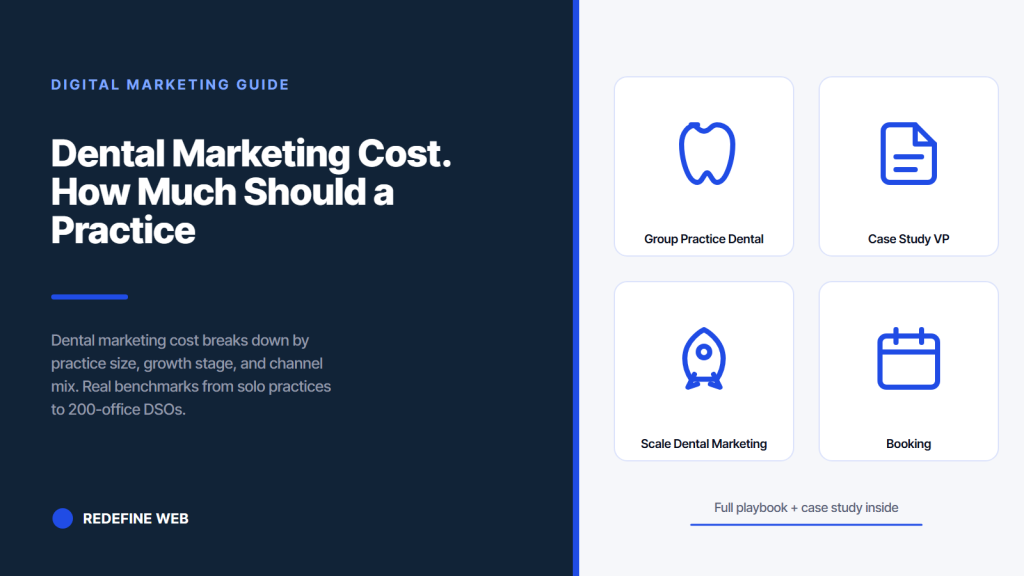
- Solo growth-mode dental marketing cost lands $4,500-$8,500 monthly.
- Match spend to your new-patient goal, not to an industry median.
- Cost per new patient should sit below 4% of lifetime value.
- Every budget carries 15-30% waste. Find it. Reallocate.
- Review channel spend quarterly, not annually.
- Group practice dental marketing price tiers
- DSO dental marketing budget benchmarks
- How to figure out your average cost of dental marketing
- Where most practices waste dental marketing budget
- Dental marketing cost benchmarks by channel
- Case study VP Dental cutting dental marketing cost per patient in half
- How to plan your dental marketing cost for the next 12 months
- When to scale dental marketing cost up versus down
Dental marketing cost is the number every practice owner wants pinned down and every marketing agency dances around. Practices growing new patient volume need to know what a real budget looks like. Practices holding steady need to know if their current spend matches the market. Practices considering expansion need to know how the numbers change across 3, 10, and 50 locations. This guide walks through the actual dental marketing cost benchmarks Redefine Web sees across accounts in 2026, the channel splits behind those numbers, and the ROI expectations that come with each spend tier. Every number below reflects real accounts, real invoices, and real revenue outcomes. You will finish the read knowing what your practice should budget, what to expect back, and where the wasted spend usually hides.
The short answer for a growing solo practice: $4,500 to $8,500 per month across all channels. The rest of this article covers the why, the how, and the mistakes that make the number wrong.
Group practice dental marketing price tiers
Dental marketing price for 2 to 5 location groups scales sub-linearly with location count. A 3 location group typically runs $12,000 to $22,000 monthly. That works out to $4,000 to $7,300 per location, meaningfully below the equivalent 3-solo-practice spend of $18,000 to $25,500. The shared infrastructure investment pays back at the group scale.
Where the shared savings come from
Website hosting, SEO retainer, review platform, and attribution tooling all cover multiple locations under one contract. Google Ads runs one account with location-specific campaigns instead of 3 separate accounts. Meta runs one Business Manager. Content production distributes across locations for city-specific pieces. Roughly 30 percent of the per-location cost falls away at 3 locations versus 3 independent solo practices.
Where new costs appear
Attribution tooling steps up because tracking new patients across locations demands unified conversion tracking, dynamic phone numbers, and PMS integrations. Dashboards move from optional to required. Content operations need an owner to manage 3 to 5 location page updates simultaneously. Groups underinvesting in attribution end up with 3 sets of ambiguous numbers instead of one clear view.
Growth curve at 3 to 5 locations
Groups running the $14,800 monthly median usually see 52 new patients per location per month at $74 cost per new patient. Groups spending under $10,000 across 3 locations usually see 32 to 38 per location at higher cost per patient. Groups spending above $22,000 for 3 locations usually cross into diminishing returns unless one location is in expansion mode. Match spend to the growth stage of each location.
DSO dental marketing budget benchmarks
DSO dental marketing budget benchmarks land at $3,100 to $4,500 per location per month depending on group size. Groups at 10 to 25 locations run around $4,500 per location. Groups at 26 to 75 locations run around $3,800 per location. Groups at 76+ locations run around $3,100 per location. The per-location cost falls with count because infrastructure investment amortizes further.
Infrastructure share of the budget
DSO budgets shift heavily toward infrastructure. Attribution stack, dashboards, PMS integrations, content operations, and vendor management often account for 20 to 25 percent of total spend. Groups skipping the infrastructure investment usually pay for it in higher cost per new patient, hidden waste in the ad accounts, and fragmented vendor management.
Paid media share at DSO scale
Google Ads still leads the paid mix at 35 to 45 percent of the total. Meta sits at 10 to 15 percent. Local Services Ads add another 5 to 8 percent for groups that have completed the license and background check process across every location. Programmatic and connected TV are usually experiments, not core allocations.
Vendor stack costs at scale
Attribution tools (CallRail, Northbeam, or custom), review platforms (Podium, Birdeye), content management, dashboards, and analytics can run $8,000 to $18,000 monthly at scale, split across the group. Groups fragmenting vendors across regions pay 30 to 40 percent more for the same coverage. Our dso dental marketing covers the DSO structural playbook.
Somewhere in Southern California, a dental practice pays $18,000 a month for a marketing retainer that produces a 40-page report full of graphs. The report shows brand impressions, share of voice, sentiment analysis, and a Sankey diagram of the customer journey. New patient volume last quarter grew by 2. The practice owner opens the report on Sunday night, reads it twice, and files it. Meanwhile a competing practice pays $6,200 for a specialist agency that answers the phone on Tuesdays and produces 47 new patients that same quarter. Neither invoice has a Sankey diagram. One of them has a full schedule.
How to figure out your average cost of dental marketing
Figuring out the average cost of dental marketing for your practice starts with three numbers: current monthly marketing spend, current new patient volume, and current average case value. Those three set the ratio the rest of the plan builds on. Practices that skip the ratio calculation usually overspend or underspend by 30 to 60 percent.
Calculate current cost per new patient
Divide monthly marketing spend by monthly net new patients seen. That is your current cost per new patient. Compare against the benchmark: $92 for solo, $74 for 3-location group, $56 for DSO at scale. A ratio 40 percent above benchmark usually points to a channel mix problem or a website conversion issue. A ratio 30 percent below benchmark usually means the practice is underspending and leaving growth on the table.
Calculate lifetime value per patient
Multiply average case value by expected patient lifetime in years. A hygiene patient at $800 case value with 8-year retention produces $6,400 lifetime value. A cosmetic case at $4,200 with 4-year retention produces $16,800 lifetime value. The lifetime value tells you what cost per new patient is acceptable. Practices routinely underestimate this and cap spend at the wrong ceiling.
Set the target ratio
Cost per new patient divided by lifetime value should sit below 4 percent for a healthy dental marketing program. A $92 cost against $2,300 lifetime value hits 4 percent. A $220 cost against $2,300 hits 9.6 percent, which is unsustainable unless the practice has structural cost problems on the operations side. Adjust the marketing plan against the ratio, not against an abstract budget dollar figure. See our ADA practice management resources for the operations context.
Every practice picks a budget first, then wonders why growth stalls. Pick new-patient target for the quarter. Budget backs into 250-400 per booked patient.
Where most practices waste dental marketing budget
Every dental marketing budget carries 15 to 30 percent waste. Practices that surface the waste and reallocate it usually gain 20 to 40 percent more new patients from the same total spend. The waste hides in the same 5 places across almost every practice we audit.
Google Ads without landing pages
Google Ads pointing to the home page convert at 2 to 4 percent. Google Ads pointing to a dedicated landing page convert at 8 to 14 percent. That gap wastes 25 to 40 percent of the ad spend. Fix it by building 3 to 6 dedicated landing pages per practice for the top service lines and top offers.
Untargeted display and video
Display and YouTube campaigns against generic dental interest audiences almost never produce measurable new patient volume for a local practice. Kill them or restrict them to retargeting warm audiences. That reallocation frees $400 to $1,200 per month for a solo practice and $2,500 to $7,000 per month for a group.
Paid directories that never track back
Yelp Business, 1-800-DENTIST, and paid directory memberships often bill $200 to $900 per month per location and rarely deliver attributable new-patient volume. Track booked appointments per source across 6 months. Kill any source at cost per booked patient over $250. Redirect to Google Ads or GBP investment. Our dental marketing tips covers the audit workflow.
Dental marketing cost benchmarks by channel
Every channel inside a dental marketing budget has its own cost benchmarks and its own ROI expectations. The table below tracks the medians we see across accounts. Read the row that matches your practice size and compare against your current channel spend.
| Channel | Solo practice | 3 location group | DSO per location |
|---|---|---|---|
| Google Ads | $2,800/mo | $5,900/mo | $1,450/mo |
| Meta ads | $930/mo | $2,200/mo | $460/mo |
| SEO and content retainer | $1,200/mo | $2,700/mo | $760/mo |
| Reviews and reputation | $310/mo | $690/mo | $180/mo |
| Website hosting and maintenance | $260/mo | $580/mo | $140/mo |
| Attribution and analytics | $240/mo | $1,100/mo | $780/mo |
| Total median | $6,200/mo | $14,800/mo | $3,800/mo |
Match your practice’s channel spend against the column that fits your size. Gaps of more than 25 percent in either direction usually reflect a specific channel decision, not a rounding error. Google Ads gaps most often mean the campaign structure has not been rebuilt in over a year. SEO and content gaps usually mean the practice has cut the retainer in an economy scare and is now paying for it in flat organic volume. Attribution and analytics gaps usually mean the practice never invested in the stack, which shows up as unclear channel ROI at the quarterly review. The one metric worth watching most closely across the table is total median monthly spend against your new-patient goal. Practices holding budget 20 percent below the median while targeting the same new-patient volume as median-spend peers usually miss their number by month 6 and blame the wrong channel. Cross-check the plan against the median first, then decide where to over-index. Google’s own guidance on budget setting for local businesses adds useful context.
Case study VP Dental cutting dental marketing cost per patient in half
VP Dental, led by Dr. Valerie Preston, runs a 20+ year general and cosmetic practice. Before Redefine Web ran the account, separate vendors managed the website and the SEO retainer. Total marketing spend hovered around $9,200 per month across the fragmented stack. New monthly patients tracked at 22. Cost per new patient sat near $418.
What we cut
Consolidated the website and SEO under one team. Cut duplicate reporting fees, redundant tool subscriptions, and a paid directory that never tracked back. That trimmed roughly $1,600 per month off the invoice without touching the growth channels. The freed budget rolled into Google Maps SEO campaigns targeting the practice’s core radius.
What we added
Targeted Google Maps SEO campaign to gain local visibility. Rebuilt the cosmetic dentistry page around real photography and specific case examples. Deployed a review request workflow. Unified attribution under one CallRail account so every call routed cleanly. Total new spend on additions ran roughly $2,100 per month.
The numbers that moved
New monthly patients doubled to 44. Search impressions grew 776 percent. Recurring monthly revenue tied to the new inflow added $8,100. Cost per new patient fell from $418 to under $220 inside the first year. The same overall spend produced dramatically better returns because the mix and the vendor stack got fixed. Read the full case in our dental marketing for dentists.
How to plan your dental marketing cost for the next 12 months
Plan next year’s dental marketing cost by starting from the new patient goal. Work backward through channel mix, monthly spend, and quarterly review triggers. Practices that pick a budget arbitrarily force tactics to fit. Practices that anchor to the goal match spend to ambition.
Set the annual patient goal
Pick an annual new-patient number the practice can operationally handle. A solo practice with 3 hygiene chairs and 1.5 hygienists can absorb 40 to 55 new patients per month before capacity issues appear. A 3-doctor practice can handle 90 to 130. Set the goal below the ceiling so the schedule stays healthy. Overshooting the ceiling produces angry patients and worse reviews. Cross-check against operational capacity guides such as AAPD practice management resources if the growth involves a pediatric expansion.
Back-calculate the monthly spend
Multiply the monthly new-patient goal by the cost per new patient benchmark. A solo practice targeting 50 new patients at $92 CPA calculates to $4,600 monthly spend across all channels. Add 15 to 20 percent for content production, creative refreshes, and one-off testing. Total lands near $5,500. That is your annual dental marketing cost floor.
Build the quarterly reallocation calendar
Set quarterly checkpoints on the 15th of March, June, September, and December. Each checkpoint reviews channel performance and reallocates budget away from underperformers. Practices that lock the budget for 12 months waste 30 to 40 percent of the year on a mix that stopped working in month 4. Our dental marketing plan covers the meeting cadence.
When to scale dental marketing cost up versus down
Scaling dental marketing cost is not one-directional. Practices scale up during growth phases and scale down during capacity constraints, staffing changes, or market shifts. Reading the signal correctly saves 20 to 40 percent on the annual invoice and prevents the panic-cut mistake that costs 6 months of pipeline recovery.
Signals to scale up
Cost per new patient trending below benchmark for two consecutive quarters. Chair capacity above 70 percent of schedule with room to grow. New hygienist or associate hire creating capacity. Successful new service line launch requiring pipeline. Any of these signals a 20 to 40 percent scale-up window. Move budget into the channels producing the lowest cost per new patient right now.
Signals to scale down
Schedule consistently full for 60+ days out. Staffing gap constraining chair capacity. Front desk missing calls and losing bookings. Rating trending down under review pressure the operations side cannot handle. Any of these signals a temporary scale-down. Cut paid media 25 to 40 percent for 60 to 90 days while the operations side catches up. Keep SEO and reviews investment intact.
How to avoid the panic cut
Panic cuts happen when a quarter of soft revenue triggers a full marketing pause. That decision typically costs 6 months of pipeline recovery because paid channels stop instantly while organic and retention take months to replace the volume. Trim, do not amputate. Never zero out paid media without a written plan to restart within 90 days.
Dental marketing cost is the least mysterious part of running a marketing program once you tie the number to a new-patient goal and a case value. Everything else is math. The practices that budget arbitrarily and hope the tactics work usually underperform by month 6. The practices that back-calculate from a goal and review quarterly usually beat their number by the end of the year.
Frequently asked questions
How much does dental marketing cost per month?
Working benchmarks put dental marketing cost at $4,500 to $8,500 per month for a solo practice actively growing new patient volume, $12,000 to $22,000 per month for a 3-location group, and $3,100 to $4,500 per location per month for DSOs at 10+ offices. Practices holding steady spend roughly half those numbers. Maintenance-mode practices without a growth plan usually spend $1,200 to $2,800 across website hosting and a small SEO retainer. Match the budget to the new-patient goal, not to an abstract dollar figure. The goal drives the number every time.
What is a good cost per new patient in dental marketing?
Median cost per new patient runs $92 for a solo practice, $74 for a 3-location group, and $56 for a DSO at scale. Cost per new patient should sit below 4 percent of the patient's lifetime value. A hygiene patient at $800 case value with 8-year retention produces $6,400 lifetime value, which tolerates $256 cost per acquisition. A cosmetic practice with higher case values tolerates higher CPA. Cost per new patient above 9 percent of lifetime value usually means the marketing program is unsustainable or the operations side has structural cost issues.
How much should a dentist spend on Google Ads?
Solo practices growing new patient volume typically spend $2,000 to $3,800 per month on Google Ads. Three-location groups run around $5,900 per month. DSOs run around $1,450 per location per month at scale. Match spend to the local market's cost per click and the practice's cost per acquisition target. Practices in high-competition urban markets often spend 30 to 50 percent above these medians. Practices in rural markets spend 30 to 40 percent below. Pair every campaign with a dedicated landing page or lose 25 to 40 percent of the spend to home-page conversion drag.
What is the average cost of dental marketing services from an agency?
Agency retainers for full-service dental marketing typically run $2,500 to $6,000 per month for a solo practice, plus paid media spend on top. Groups pay $4,500 to $12,000 per month in retainer against paid media. Agencies charging under $1,500 monthly usually deliver junior-level execution and generic templates. Agencies charging above $8,000 monthly for a solo practice usually load the retainer with reporting and account management overhead the practice does not need. The right retainer size scales with the number of channels the practice runs and the depth of the attribution stack in play.
How do I reduce my dental marketing cost without losing patients?
Start with the waste audit. Google Ads campaigns without dedicated landing pages waste 25 to 40 percent of paid spend. Untargeted display and YouTube almost never produce measurable new-patient volume for local practices. Yelp Business and paid directories rarely track back to booked appointments. Kill or restrict all three and reallocate to Google Ads with landing pages or GBP investment. Fragmented vendor stacks typically add 20 to 30 percent unnecessary cost. Consolidate to one paid media partner, one SEO partner, one review platform, one call tracker. Consolidation alone often trims 15 to 25 percent off the total invoice.
Should I spend more on marketing when growing my dental practice?
Yes. Growth-mode marketing spend usually runs 40 to 80 percent above steady-state spend. A solo practice moving from 25 new patients per month to 50 typically needs to double the monthly marketing budget for 6 to 9 months, then can trim back once organic and retention start carrying more of the volume. Growth funded from cash flow without an upshift in marketing spend usually stalls at year end because paid channels drove the initial volume and organic did not have time to build. Plan the growth spend upshift into the 12-month budget from day one.
How much do multi-location dental groups spend on marketing per location?
DSO dental marketing budget per location falls with group size. Groups at 10 to 25 locations run around $4,500 per location per month. Groups at 26 to 75 locations run around $3,800 per location. Groups at 76+ locations run around $3,100 per location. The per-location cost falls because infrastructure investment (attribution, dashboards, PMS integrations, content operations) amortizes across more offices. Groups that skip infrastructure investment usually pay for it in higher cost per new patient across every location because the ad accounts run without proper conversion feedback.
Book your free 30-minute strategy call.
No spam, no sales rep. We use your email to schedule your call with a senior strategist. That is it.
More from the blog
View all articles → Digital Marketing
 Dental Marketing Tips That Compound Into New Patients
Read article Digital Marketing
 Ecommerce Marketing Strategies That Drive Real DTC Revenue
Read article Digital Marketing