
Google Ads Management for Ecommerce Brands That Grows Real Storefront Revenue
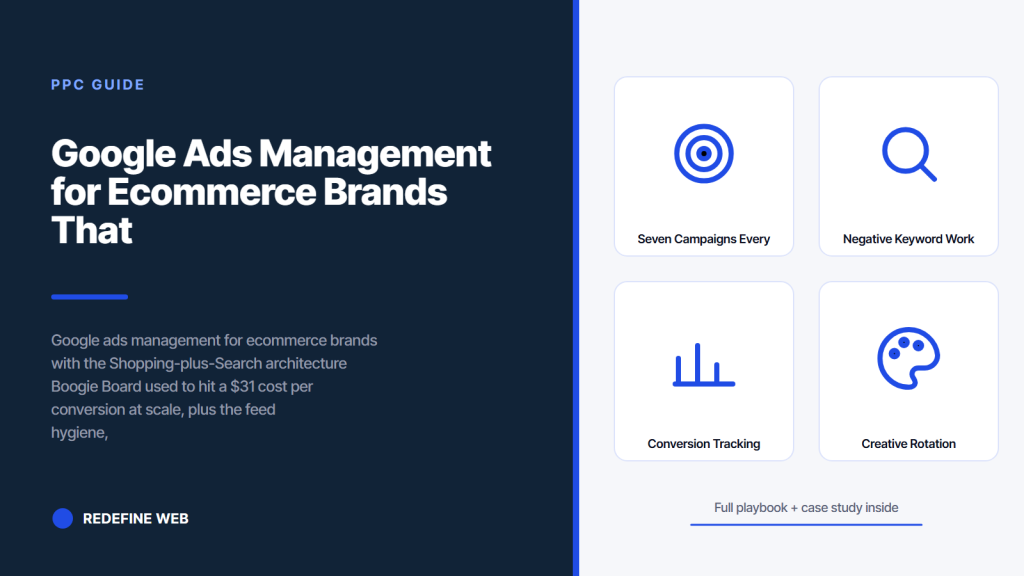
- Seven campaign types carry a properly built DTC Google Ads account.
- Margin-band Shopping splits let Smart Bidding optimize for real margin.
- Feed hygiene is the single biggest lever in Shopping performance.
- Server-side GTM plus enhanced conversions closes the iOS attribution gap.
- Boogie Board hit a stable $31 cost per conversion at scale.
- Why google ads management for ecommerce brands runs different
- Seven campaigns every google ads management for ecommerce brands account carries
- Feed hygiene for google ads management for ecommerce brands
- Negative keyword work every DTC account skips
- Conversion tracking that captures every checkout
- Creative rotation cadence for ecommerce ads
- Google ads management for ecommerce brands pricing shape
- Boogie Board case study
- How the first 90 days go on a new DTC account
- Picking a google ads management for ecommerce brands agency
- Where to start with your DTC google ads setup
Google ads management for ecommerce brands runs on a completely different account shape than any local-services vertical. The buyer never picks up a phone. The conversion happens on-site inside a checkout flow. The catalog can carry 50 SKUs or 50,000 SKUs and the campaign structure has to bend around that count. Ecommerce brands that treat their Google Ads account like a search-only local-services account give up 40 to 65 percent of the addressable revenue to a bidding logic that ignores product-level performance data.
You’ll read how google ads management for ecommerce brands carves the account by Shopping, Search, Performance Max, and Demand Gen, the feed hygiene work that decides whether Shopping ranks at all, the negative work every DTC account skips at their own cost, the creative rotation cadence that keeps click-through rates stable across 12-month seasons, the pricing shape honest agencies quote for google ads management for ecommerce brands, and how Boogie Board used this exact structure to hit a $31 cost per conversion at scale on paid search.

Why google ads management for ecommerce brands runs different
Google ads management for ecommerce brands runs on 4 core campaign types no local-services account ever needs. Shopping. Performance Max. Search. Demand Gen. Each type reads a different signal from the product feed, the checkout event, and the audience data. Skipping any of the 4 caps addressable revenue at a middle-ground ceiling.
Shopping and Performance Max together carry 55 to 75 percent of most DTC accounts. Search sits at 15 to 30 percent picking up branded terms, category head terms, and long-tail buyer queries. Demand Gen and Discovery pick up the top-of-funnel signal that keeps Shopping’s retargeting pool full. Ecommerce accounts that skip Demand Gen see Shopping performance decay 3 to 6 months into the calendar as the retargeting pool shrinks and the account starts eating cold traffic on repeat buys.
Our ecommerce PPC agency page covers the wider paid-media architecture DTC brands run across Google Ads, Meta, and TikTok in a coordinated funnel.
Catalog shape drives account shape
A 50 SKU catalog runs on one Shopping campaign and one Performance Max asset group. A 500 SKU catalog splits into 3 to 5 campaigns by margin band or category. A 5,000 SKU catalog splits into 8 to 15 campaigns and adds hierarchical Performance Max asset groups. A 50,000 SKU catalog runs on feed segmentation, priority bidding by product performance, and daily automated bid adjustments. Every jump in catalog size changes the campaign structure. Accounts that never restructure as the catalog grows carry the wrong architecture for their current scale.
The feed is the campaign
The product feed does more work than the ad copy in google ads management for ecommerce brands. Title. Description. Image. GTIN. Product type. Category taxonomy. Every field feeds Google’s matching logic. A dirty feed with 30 percent of products missing GTINs will rank below a competitor with cleaner data even at higher bids. Feed hygiene is the biggest single lever in Shopping performance. Most DTC accounts we audit find 15 to 40 percent of products underperforming because of feed data gaps that never got closed.
Seven campaigns every google ads management for ecommerce brands account carries
Google ads management for ecommerce brands accounts carry seven campaign types when the account is built right. Standard Shopping split by margin band. Performance Max split by product category. Branded Search. Category head-term Search. Long-tail Search. Demand Gen. Retargeting Display. Skipping any one of these gives up 12 to 30 percent of the addressable revenue. Shopping and PMax are the workhorses. Search fills in the intent gaps. Demand Gen keeps the retargeting pool warm.
Standard Shopping runs 30 to 45 percent of budget. Performance Max runs 20 to 35 percent. Branded Search runs 4 to 8 percent. Category head-term Search runs 8 to 14 percent. Long-tail Search runs 6 to 12 percent. Demand Gen runs 5 to 12 percent. Retargeting Display runs 4 to 8 percent. Every campaign type gets its own ROAS target because the intent bands sit at different points in the buying funnel and demanding one shared ROAS target flattens the account into underperformance.
See our google ads management services page for the wider account architecture every vertical this playbook covers gets built around.
| Campaign type | Budget share | ROAS target | Cost per conversion band |
|---|---|---|---|
| Standard Shopping | 30 to 45 percent | 3.0x to 6.0x | $18 to $65 |
| Performance Max | 20 to 35 percent | 2.5x to 5.0x | $22 to $75 |
| Branded Search | 4 to 8 percent | 8x to 20x | $4 to $12 |
| Category Search | 8 to 14 percent | 2.0x to 3.5x | $28 to $90 |
| Long-tail Search | 6 to 12 percent | 3.0x to 5.5x | $14 to $55 |
| Demand Gen | 5 to 12 percent | 1.2x to 2.5x | $35 to $120 |
| Retargeting Display | 4 to 8 percent | 4.0x to 9.0x | $8 to $28 |
Splitting Shopping by margin band
Standard Shopping campaigns get split by margin band, not by category, once the catalog crosses 500 SKUs. High-margin products get their own campaign with a higher ROAS target. Mid-margin products get a middle campaign. Low-margin products get a defensive campaign with a floor ROAS. This split lets Google’s Smart Bidding optimize toward margin instead of gross revenue and typically moves account-level contribution margin 15 to 35 percent versus a single Shopping campaign covering all products at one shared ROAS target.
Performance Max asset groups by category
Performance Max asset groups get split by product category rather than by margin. Each asset group gets 5 to 15 headlines, 4 to 5 descriptions, 8 to 20 images, and 3 to 5 videos. The videos matter more than most DTC brands think because Performance Max routes 25 to 40 percent of impressions to YouTube, Discovery, and Gmail placements where video creative controls conversion rate. Asset groups without video creative cede those placements to competitors and give up 15 to 25 percent of the campaign’s potential reach.

Feed hygiene for google ads management for ecommerce brands
Feed hygiene decides whether Shopping ranks at all. Every product needs a unique title 30 to 70 characters long that names the brand, the product, and one distinguishing attribute. Every product needs a description of 200 to 500 characters with the top 3 buyer-intent keywords. Every product needs a GTIN for branded products or an accurate MPN for private-label products. Every product needs a Google product category from the taxonomy tree, not a made-up custom label. Every product needs a high-quality image on a white background.
Custom labels do most of the routing work for account structure. Custom label 0 marks margin band. Custom label 1 marks best-seller status. Custom label 2 marks seasonality. Custom label 3 marks new-arrival status. Custom label 4 marks clearance status. Campaigns filter on custom labels to build product groups without duplicating the base feed. Accounts that never populate custom labels lose the ability to bid differently on their $8 margin product versus their $80 margin product and let Google average both into a middle-ground target.
See Google Merchant Center’s product data specification for the exact field requirements. Our Google Ads conversion tracking guide covers the checkout-side event architecture that feeds the ROAS bidding signal.
Title optimization for Shopping
Product title optimization for Shopping runs on 3 rules. Front-load the most-searched keyword. Include the brand name. Include one distinguishing attribute like size, color, or material. Shopping queries match against titles more heavily than against any other field. Products with keyword-front-loaded titles get 30 to 60 percent more impressions than the same products with brand-front-loaded titles because Shopping searches often start with the product word rather than the brand word. Testing titles is the highest-return feed-side work most DTC accounts skip.
Image quality thresholds
Product images for Shopping need a minimum 800 x 800 pixel dimension, a white or neutral background, and the product filling 75 to 90 percent of the frame. Images below these thresholds get penalized in Shopping ranking even at higher bids. Every catalog audit we run finds 8 to 20 percent of products with images that fail one of the thresholds. Fixing image quality across the underperforming products alone moves total Shopping revenue 6 to 14 percent inside 30 days without any bid change.
Skipping Demand Gen shrinks the retargeting pool. Shopping ROAS quietly drops month 4. Add Demand Gen this week to keep the pool full.
Negative keyword work every DTC account skips
Negative keyword work in google ads management for ecommerce brands runs continuous, not one-time. The starter negative list runs 400 terms on day one covering competitor brands, wholesale queries, coupon queries, informational queries, and off-topic product categories. That list grows 20 to 40 terms every week as search term reports surface new waste. Accounts that skip weekly negative additions burn 8 to 15 percent of budget on non-buyer traffic for the life of the account.
Search term reports feed the negative list. Every week the report gets scanned for queries under 5 clicks and no conversions, queries over 5 clicks and no conversions, and queries with irrelevant intent that slipped through phrase or broad match. Each bucket gets triaged. Under-5-clicks-no-conversions goes onto a watch list. Over-5-clicks-no-conversions goes onto the negative list. Irrelevant-intent goes onto the negative list with a match-type refinement note.
See Google’s match type documentation for the mechanics of how search terms match. Our google ads management pricing guide covers the retainer structure that reserves time for this weekly negative work.
Performance Max negative work
Performance Max negative keyword work runs through account-level negative keyword lists rather than campaign-level lists because PMax does not accept campaign-level negatives at the same detail as Search campaigns. The account-level negative list has to be surgical. Adding too broad a negative removes traffic from Shopping and Search too. Adding too narrow a negative leaves waste running. This tension is why PMax negative work takes 3 to 5 times the effort of Search negative work per dollar of savings.
Search query mining for new campaigns
Search query mining does more than surface negatives. It surfaces new campaign opportunities. Any search term producing 8 or more conversions in a 30 day window with no dedicated campaign gets promoted to its own ad group inside the relevant Search campaign. Any search term producing 20 or more conversions gets its own campaign with dedicated ad copy and a matched landing page. This promotion cycle is how accounts scale from $50k a month to $500k a month while holding cost per conversion inside a target band.
Conversion tracking that captures every checkout
Conversion tracking for google ads management for ecommerce brands runs on 3 layers. Google Ads conversion tags. GA4 ecommerce events. Server-side Google Tag Manager with enhanced conversions. Each layer catches signal the other layers miss. Skipping any one layer underreports account performance by 10 to 25 percent. Most audits find at least one layer with holes. Fixing the tracking first surfaces conversions that were always happening but had never been counted.
Server-side GTM plus enhanced conversions plus first-party data hashing closes the iOS 14 gap that hit ecommerce accounts starting in 2021 and has never fully recovered on the client-side alone. That server-side hop restores 12 to 22 percent of previously invisible conversions for most DTC brands. The restored signal then feeds Smart Bidding better data, and Smart Bidding starts optimizing on the fuller picture inside 2 to 3 weeks of tag deployment.
See Google’s enhanced conversions documentation for the exact tag deployment steps.

First-party data through customer match
First-party data through Customer Match feeds 3 workstreams. Retargeting existing customers on high-margin products. Suppressing existing customers from new-buyer acquisition campaigns. Building lookalike audiences from the top-decile buyer segment. Every DTC brand has this data sitting in a CRM or email platform and 60 to 80 percent of brands we audit have never pushed it into Google Ads. That first push moves account-level revenue 8 to 18 percent inside 60 days by keeping acquisition budget off existing buyers.
Attribution model picks
Attribution for google ads management for ecommerce brands runs on data-driven attribution above 300 monthly conversions. Below that threshold, position-based attribution weighted 40-20-40 to first and last touch beats last-click on any account with a 2 to 14 day consideration window. Ecommerce buyers rarely convert on visit one. Most convert on visit 3 to 6 after retargeting, email nurture, and a return visit. Last-click attribution undercounts the top-of-funnel campaign contribution by 30 to 45 percent on most DTC accounts.
Creative rotation cadence for ecommerce ads
Creative rotation cadence for ecommerce ads runs on a 4-week refresh cycle for high-spend campaigns and an 8-week refresh cycle for low-spend campaigns. Every refresh introduces 2 new headline variants, 1 new image, and 1 new short video into the asset pool. Old creative gets retired based on conversion rate ranking, not on age alone. Accounts that never refresh creative see click-through rate decay 15 to 30 percent inside 90 days as fatigue sets in on repeated impressions to the same retargeting pool.
Seasonal creative windows change the rotation. Holiday season needs a 2-week refresh cycle for the top 3 to 5 campaigns. Back-to-school needs a 3-week cycle. Summer needs an 8-week cycle for most categories. Every seasonal peak carries a distinct creative shape that generic year-round ads cannot cover. Accounts that ride generic creative through Q4 see click-through rate underperform the seasonal benchmark by 25 to 45 percent.
Video creative for Performance Max
Video creative for Performance Max asset groups matters more than most DTC brands realize because 25 to 40 percent of PMax impressions route to YouTube, Discovery, and Gmail. Asset groups without video get their share of these placements dropped and revenue drops with it. Every asset group should carry 3 to 5 short-form videos in 6 to 15 second lengths matching the product category. Product demo videos outperform brand videos on Shopping-side placements by 20 to 40 percent on click-through and conversion rate.
Image creative rotation
Image creative rotation runs a mix of product-only shots, lifestyle shots, and social-proof composites. Product-only shots convert best on Shopping and Search. Lifestyle shots convert best on Demand Gen and Discovery. Social-proof composites with review stars, testimonials, or press logos convert best on Retargeting Display. Every campaign type gets its own image treatment matched to the placement mix. Using one shared image pool across all campaigns caps click-through rate 20 to 35 percent below the potential ceiling.
The most consistent moment in every google ads management for ecommerce brands audit call is when the founder pulls up a dashboard showing a healthy blended ROAS number, then admits the dashboard has been counting branded search revenue against total ad spend for 18 months without separating branded from non-branded, and the honest non-branded ROAS is actually 1.4x on a 3.2x blended number, and the acquisition machine has been slowly consuming margin the whole time while the vanity dashboard has been reassuring everyone that everything is fine.
Google ads management for ecommerce brands pricing shape
Google ads management for ecommerce brands pricing lands in three honest bands. $2,800 to $4,500 per month for a small DTC brand spending $10,000 to $30,000 on media. $4,500 to $9,000 per month for a mid-market DTC brand spending $30,000 to $100,000 on media. $9,000 to $22,000 per month for a large DTC brand spending $100,000 to $600,000 on media. Every band gets the same seven-campaign structure plus feed management and creative rotation. Larger bands add multi-brand controls, geographic segmentation, and custom bidding scripts.
Percent-of-spend pricing runs 10 to 15 percent of media for accounts above $50,000 monthly ad budget. Flat-fee pricing wins below that threshold because the percent model does not cover the setup time on feed hygiene and tracking. Every honest agency prices the retainer separately from media spend so the true cost of management stays visible in the reporting.
See our google ads management pricing guide for the full breakdown across every retainer band.
What the retainer includes
A DTC ecommerce Google Ads management retainer includes campaign build, feed hygiene monitoring, ad copy testing, weekly optimization, monthly reporting, quarterly strategy review, and a monthly creative rotation review. Feed hygiene monitoring catches new products missing GTINs or images before Shopping performance drops. Creative rotation review flags fatiguing assets before click-through rate falls. Weekly optimization covers bid adjustments, negative keyword additions, and match type refinements across all seven campaigns.
What the retainer excludes
Retainers exclude landing page design, creative production for video and image assets, feed management software subscriptions, and multi-channel measurement tools. Landing page design runs separately at $2,600 to $12,000 per landing page. Video creative production runs $800 to $4,500 per 15-second spot. Feed management platforms like Feedonomics or Channable run $400 to $2,500 per month depending on catalog size. Every honest agency itemizes these on the SOW so the true monthly cost of the whole program stays visible.
Boogie Board case study
Boogie Board is a reusable writing tablet brand that came to us with a scaling Google Ads program running at a cost per conversion that had been drifting up for 18 months. The catalog covered 40 to 60 SKUs across product families for kids, students, and office use. The Google Ads account ran one shared Shopping campaign, one Performance Max campaign with mixed asset groups, and Search campaigns without a proper branded-versus-non-branded split. Reporting bundled all revenue against total spend, hiding the acquisition ROAS behind branded search returns.
We rebuilt the account against the seven-campaign structure above. Split Shopping into 3 margin-band campaigns. Rebuilt Performance Max with 4 asset groups by product category, each carrying 5 videos and 15 images. Separated branded Search from non-branded Search with distinct ROAS targets. Added Demand Gen for top-of-funnel prospecting. Turned on Customer Match for both retargeting and suppression. Ran feed hygiene across every SKU, closing 22 percent of products with missing or thin data. Deployed server-side GTM with enhanced conversions. The rebuild took 10 weeks.
The outcome measured over 12 months
Cost per conversion stabilized at $31 across the acquisition-side campaigns while the account scaled to more than double the previous monthly ad spend without cost per conversion drifting up. Non-branded ROAS moved from 1.4x to 3.6x. Revenue attributed to top-of-funnel Demand Gen doubled inside 6 months. Every one of those numbers came from the campaign rebuild plus the feed hygiene plus the tracking overhaul running in parallel. The $31 cost per conversion held steady as spend scaled because the account structure could route additional budget to the campaigns producing the best margin per dollar.
What carried the outcome
The $31 cost per conversion at scale came from three levers running together. The margin-band Shopping split pulled in 35 to 45 percent of the gain by letting Smart Bidding optimize toward margin instead of gross revenue. The feed hygiene work pulled in 25 to 35 percent by moving underperforming products into a competitive position. The tracking overhaul pulled in the remaining 20 to 30 percent by surfacing conversions the client-side tags had been dropping. Every DTC brand we take through the same rebuild sees a similar three-lever contribution pattern.
How the first 90 days go on a new DTC account
The first 90 days on a new google ads management for ecommerce brands engagement covers audit, feed cleanup, tracking, campaign rebuild, and optimization. Week 1 audits the account structure, feed hygiene, tracking, and creative pool. Weeks 2 and 3 clean the feed and deploy server-side GTM with enhanced conversions.
Weeks 4 through 8 rebuild the seven campaign types with matched product groups, dedicated ROAS targets, and refreshed creative. Weeks 9 and 10 run the first optimization pass and the first ad copy A/B tests. Weeks 11 through 13 compound the results as Smart Bidding learns the new tracking signal.
Expect a 15 to 30 percent movement in blended ROAS by day 60 and a 25 to 50 percent movement in non-branded ROAS by day 90. Brands expecting week-1 results are misreading the compound curve. The account gets better every week for the first 6 months, then stabilizes.
See our PPC management services page for the wider paid-media roadmap this DTC Google Ads work sits inside.
Day 30, 60, and 90 milestones
Day 30 shows the feed cleaned, the tracking layer verified, and the first campaign rebuild deployed for Shopping and Search. Day 60 shows Performance Max asset groups rebuilt, Demand Gen live, and blended ROAS up 15 to 25 percent from baseline. Day 90 shows the account at target cost per conversion with all seven campaign types running clean and reporting non-branded ROAS separately from branded ROAS. Brands that stick with the compound curve past day 90 typically see the biggest gains in months 4 through 6.
Reporting cadence for a DTC brand
Reporting for a DTC brand runs on a weekly quick-look, a monthly full report, and a quarterly strategy call. Weekly quick-look covers spend, revenue, ROAS by campaign type, and any spike or dip worth noting. Monthly report covers full account performance plus non-branded ROAS, contribution margin by product category, and creative refresh status. Quarterly strategy call covers the 90-day trajectory, the next 90-day plan, and any budget shifts based on seasonal windows or new product launches.
Picking a google ads management for ecommerce brands agency
Picking a google ads management for ecommerce brands agency starts with three questions. How many DTC accounts does the agency currently run. Does the agency separate branded from non-branded ROAS in reporting. Who runs the account day to day. If the agency runs fewer than 4 DTC accounts, they are learning the vertical on your budget. If they refuse to separate branded from non-branded ROAS, they are hiding the acquisition math behind a vanity number. If the account gets handed to a junior after the sale, the strategy conversation on the pitch call is not what you are buying.
Ask for 3 references from active DTC clients on retainer for more than 12 months. Talk to at least 2 of the 3. Ask about scope changes, reporting quality, and how the agency handled the last algorithm shift or PMax update. Every reference call catches a pattern the sales deck hides. Every serious brand runs those calls before signing an SOW past $3,500 monthly.
See Search Engine Journal’s PPC guide for the vendor-neutral framework every buyer should audit an agency against.
Red flags on the pitch call
Red flags include no DTC case study with a named cost per conversion, no discussion of feed hygiene as a distinct workstream, no branded-versus-non-branded ROAS separation, and reporting samples that lead with blended ROAS as the primary metric. Any agency that leads with blended ROAS as the headline number is hiding the acquisition math. Any agency without a feed hygiene checklist is running Shopping campaigns on hope. Any agency that treats all campaign types with one shared ROAS target is capping account performance.
Green flags worth signing on
Green flags include a named DTC case study with a cost per conversion number, a proposal that itemizes feed hygiene and tracking as distinct workstreams, separate reporting for branded and non-branded ROAS, and a retainer that separates management fee from media spend. Any agency that hits all four is worth a reference call. Any agency that hits fewer than 3 is not worth the pitch time. That filter cuts a vendor short list from 15 candidates down to 3 or 4 inside a week.
Where to start with your DTC google ads setup
Start with an honest audit of the current account. If the Shopping account has never been split by margin band, that split is the biggest single lever. If the product feed has 15 to 40 percent of products with data gaps, the feed hygiene work is the second-biggest lever. If the tracking layer has iOS gaps, the server-side GTM deployment is the third-biggest lever. Most DTC brands we audit need all three. The margin-band split plus feed hygiene plus tracking typically moves non-branded ROAS 50 to 150 percent inside the first 6 months.
Ready to run a google ads management for ecommerce brands audit that names every wasted dollar and grows real storefront revenue. We audit the seven-campaign structure, the feed hygiene, the tracking layer, and the creative rotation, then deliver a written 90-day plan you can hand to your current agency or use to move the account. Book a free audit slot and get the same rebuild playbook Boogie Board used to hit a $31 cost per conversion at scale.
Frequently asked questions
How much does google ads management for ecommerce brands cost?
Google ads management for ecommerce brands pricing lands in three honest bands. $2,800 to $4,500 per month for a small DTC brand spending $10,000 to $30,000 on media. $4,500 to $9,000 per month for a mid-market DTC brand spending $30,000 to $100,000 on media. $9,000 to $22,000 per month for a large DTC brand spending $100,000 to $600,000 on media. Percent-of-spend pricing at 10 to 15 percent works above $50,000 monthly. Flat-fee pricing wins below that threshold. Every honest agency prices the retainer separately from media spend so the true cost stays visible.
Why split Shopping campaigns by margin band?
Splitting Shopping by margin band lets Google's Smart Bidding optimize toward margin instead of gross revenue. High-margin products get their own campaign with a higher ROAS target. Mid-margin products get a middle campaign. Low-margin products get a defensive campaign with a floor ROAS. This split typically moves account-level contribution margin 15 to 35 percent versus a single Shopping campaign covering all products at one shared ROAS. Accounts that never split by margin let Google average all products into a middle-ground target that hurts the high-margin performers and props up the low-margin drag.
What tracking does DTC google ads management need?
DTC Google Ads tracking runs on three layers. Google Ads conversion tags. GA4 ecommerce events. Server-side Google Tag Manager with enhanced conversions and first-party data hashing. Each layer catches signal the others miss. Skipping any one layer underreports account performance by 10 to 25 percent. Server-side GTM plus enhanced conversions closes the iOS 14 gap and restores 12 to 22 percent of previously invisible conversions for most DTC brands. The restored signal then feeds Smart Bidding better data, and Smart Bidding starts optimizing on the fuller picture inside 2 to 3 weeks.
What is a realistic cost per conversion on DTC google ads?
Realistic cost per conversion on well-managed DTC Google Ads accounts lands between $18 and $65 on Shopping, $22 and $75 on Performance Max, $14 and $55 on long-tail Search, and $4 and $12 on branded Search. Category head-term Search runs $28 to $90 because of higher competition. Demand Gen runs $35 to $120 because of top-of-funnel intent. Accounts producing above these bands usually have feed hygiene gaps, wrong campaign structure, or attribution problems. Boogie Board stabilized at $31 across acquisition-side campaigns through the rebuild described above.
How long before DTC google ads management shows results?
Expect a 15 to 30 percent movement in blended ROAS by day 60 and a 25 to 50 percent movement in non-branded ROAS by day 90. Month 3 typically shows the first big jump as Smart Bidding learns the new tracking signal and feed hygiene work stabilizes ranking. By month 6, well-managed accounts hit their sustained cost per conversion and non-branded ROAS stabilizes. Brands expecting week-1 results are misreading the compound curve. The account gets better every week for 6 months, then stabilizes at a run rate that predicts monthly revenue inside 5 percent.
Why does feed hygiene matter so much for Shopping campaigns?
The product feed does more work than the ad copy in Shopping campaigns. Title, description, image, GTIN, product type, and category taxonomy all feed Google's matching logic. A dirty feed with 30 percent of products missing GTINs will rank below a competitor with cleaner data even at higher bids. Most DTC accounts we audit find 15 to 40 percent of products underperforming because of feed data gaps that never got closed. Fixing feed hygiene alone moves total Shopping revenue 6 to 14 percent inside 30 days without any bid change. Feed hygiene is the biggest single lever in Shopping.
Book your free 30-minute strategy call.
No spam, no sales rep. We use your email to schedule your call with a senior strategist. That is it.
More from the blog
View all articles → PPC
PPC Healthcare PPC Advertising Channels Compliance and Targeting
Read article PPC
PPC Dental Facebook Ads Guide for Practices That Book Patients
Read article PPC
PPC