
Google Shopping Ads Management Services That Grow Ecommerce Revenue
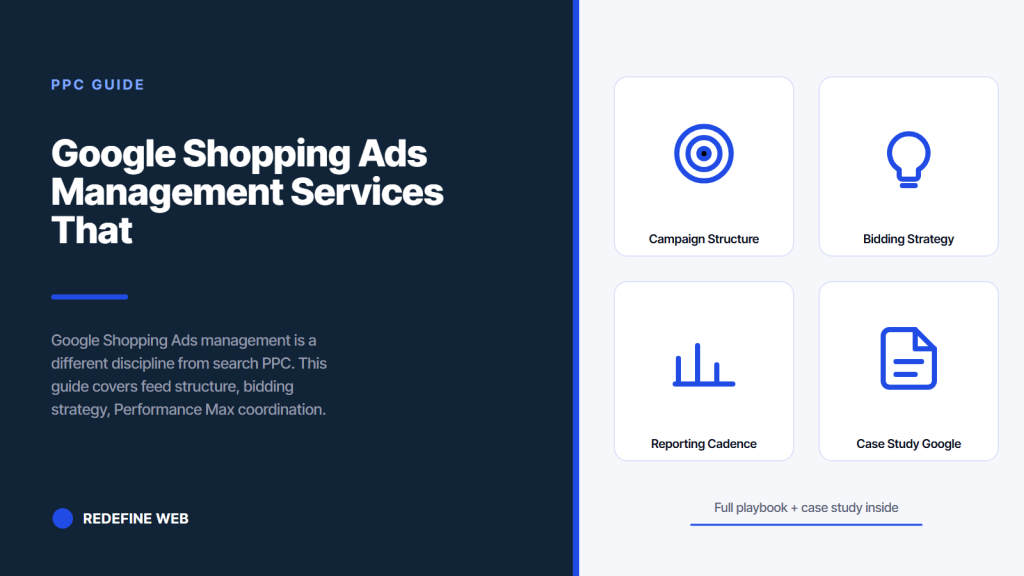
- Feed quality drives Shopping outcomes.
- Run Performance Max plus Standard Shopping together.
- Optimize on contribution margin ROAS.
- Fix disapprovals inside 48 hours.
- Segment Performance Max by margin band.
- Feed quality drives google shopping ads management outcomes
- Campaign structure for google shopping ads management services
- Bidding strategy inside google shopping ads management
- Merchant Center hygiene for google shopping ads management
- ROAS math that keeps google shopping ads management honest
- Reporting cadence for google shopping ads management services
- Shopify google ads management specifics
- Case study on google shopping ads management
- Seasonality inside google shopping ads management
- Google shopping ads management services prices 2025 to 2026
Google Shopping Ads management is a different discipline from search PPC. Product feed quality replaces keyword strategy. Feed titles, images, and structured data control which auctions you enter. Bidding runs at the product level. Performance Max wraps it all in a black box unless you build the campaign structure to force transparency. This guide walks the exact google shopping ads management playbook we run on live ecommerce accounts, from feed rebuild to Performance Max control to ROAS-driven budget allocation.
You will finish this in nine minutes with feed rules, campaign structure, bidding strategy, and the reporting cadence that keeps Shopping honest. Same playbook works for a Shopify store spending $1,800 per month and a WooCommerce brand spending $28,000 per month. What changes is the depth of feed segmentation and the number of Performance Max asset groups you run in parallel, not the underlying discipline. Print the framework and mark it up while auditing your own account so the fixes you spot land back inside the same week.
Feed quality drives google shopping ads management outcomes
Feed quality is the single largest lever in Shopping. A well-optimized feed beats a poorly-optimized feed by 30 to 60 percent on impression share at the same bid. Titles carry the most weight. Product titles that lead with brand plus product type plus key attribute (color, size, material) rank higher and convert better than generic titles. Images carry the second-most weight because low-quality images depress click-through rate no matter how well the title matches.
Every product needs eight feed attributes at minimum. Title. Description. Price. Availability. Image. Brand. GTIN. Product category taxonomy. Missing any of the eight either blocks the product from Shopping (Availability, Image, Price) or drops it lower in the auction (Title, GTIN, Category). Ecommerce brands that fix feed attributes before increasing bids typically see impression share climb 25 to 45 percent with zero extra spend inside 30 days.
| Feed attribute | Weight | Common miss |
|---|---|---|
| Title | High | Brand missing from front of title |
| Image | High | Lifestyle instead of product-on-white |
| GTIN | High | Missing or invalid GTIN |
| Product category | Medium | Wrong Google taxonomy branch |
| Description | Medium | Copy-pasted from PDP with HTML |
| Custom labels | Medium | Not used at all |
| Product highlights | Low | Missing or generic |
Title structure formula
Apparel titles follow “Brand + Gender + Product Type + Color + Size + Material.” Electronics titles follow “Brand + Product Type + Model + Key Spec + Color.” Home goods follow “Brand + Product Type + Style + Color + Material.” Rewriting titles to the vertical formula typically grows CTR 15 to 30 percent inside 14 days because the title matches more search queries and reads as more specific in the SERP.
Campaign structure for google shopping ads management services
Modern Shopping runs on Performance Max plus Standard Shopping in coordination. Performance Max covers the black-box scale case. Standard Shopping covers the transparent control case. Running both together captures Performance Max efficiency without losing visibility into which products, queries, and audiences drive revenue. Ecommerce brands that run Performance Max alone often hit good ROAS but cannot explain why or diagnose when it drifts.
Segment Performance Max by margin band or product priority. High-margin bestsellers go into one asset group with aggressive ROAS targets. New product launches go into a second asset group with volume targets. Legacy or clearance products go into a third asset group with a floor bid. Segmenting Performance Max stops the algorithm from over-serving low-margin products because it produced easy conversions and starving high-margin products because they took longer to close.
- Performance Max for bestsellers with target ROAS
- Performance Max for new launches with volume targets
- Performance Max for clearance with floor bids
- Standard Shopping for query-level transparency
- Branded Shopping campaign to defend brand queries
- Remarketing Shopping for cart abandoners
- Feed-only campaign for long-tail SKUs
Performance Max transparency workarounds
Performance Max hides query-level data by default. Force transparency by using audience signals only for guidance rather than replacement, keeping a parallel Standard Shopping campaign for the same products, and pulling the search terms report weekly to feed negatives back into both campaigns. Ecommerce brands that treat Performance Max as fully autonomous typically leave 20 to 35 percent of possible ROAS on the table because they cannot diagnose which segments are underperforming.
Bidding strategy inside google shopping ads management
Shopping bidding runs on Target ROAS once the account has 30 plus conversions per month. Below that threshold Maximize Conversions produces cleaner learning data. Target ROAS goals should sit at 60 to 80 percent of the actual last-90-day ROAS during ramp-up. Google will overshoot slightly during learning, then settle. Practices that set aggressive targets in the first 14 days usually watch the algorithm undershoot volume and stall the account.
Calibrate Target ROAS every 30 days based on account contribution margin. If the account produces 3.2x ROAS at 40 percent gross margin, breakeven ROAS is 2.5x and target should sit at 3.0x or higher. If contribution margin drops during a promo cycle, drop target ROAS proportionally to keep volume flowing. Ecommerce brands that hold Target ROAS constant during promos usually see the algorithm cut delivery during the exact window they need volume.
Portfolio bidding across products
Group products into portfolios with shared ROAS targets. Best sellers portfolio at 4.5x. New arrivals portfolio at 2.5x during launch phase. Clearance portfolio at 1.8x to move inventory. Portfolio bidding stops the algorithm from optimizing against the average and hiding the winners inside a mediocre group average. Google’s portfolio bidding documentation covers the setup. Rebalance the portfolios monthly. New arrivals graduate to the bestseller portfolio after they hit 30 conversions in a month. Bestsellers drop back to the general portfolio if their ROAS slides two months in a row. Clearance items retire from Shopping once inventory drops below the safety threshold. Portfolio rotation on a 30-day cadence keeps the algorithm training on the right signals per group.
Open Merchant Center diagnostics. If titles are missing brand plus attribute or GTINs are blank, no bid strategy will save the account.
Merchant Center hygiene for google shopping ads management
Merchant Center errors and warnings degrade Shopping performance directly. Products with disapproved status do not serve at all. Products with warnings serve at lower impression share until the warning clears. Practices that let 10 to 15 percent of the feed sit in warning state usually cost themselves 15 to 25 percent of possible impression share until the diagnostic queue clears.
Check Merchant Center diagnostics weekly. Fix disapprovals inside 48 hours. Fix warnings inside a week. Common warning triggers include missing GTIN, image mismatch between feed and landing page, price mismatch between feed and PDP, and structured data absent on the PDP. Automating feed generation via Merchant Center’s automated improvements or a third-party feed manager reduces manual QA time by 60 to 80 percent on catalogs over 500 SKUs. The QA time saved compounds. A single 20-minute weekly QA pass on a clean feed prevents 4 to 6 disapprovals per month that would otherwise cost 15 to 25 percent of the affected products’ impression share. Manual QA scales linearly with catalog size. Automated QA scales flat. That gap opens fast on larger catalogs.
Feed manager tools
Feed manager tools like DataFeedWatch, GoDataFeed, and Channable rewrite product feeds against custom rules and push clean data to Merchant Center. Cost ranges from $65 to $499 per month depending on catalog size. Pay back is usually 30 to 45 days on catalogs above 500 SKUs. Below 500 SKUs the manual QA time in a spreadsheet often costs less than the tool subscription, so the tool math changes.
ROAS math that keeps google shopping ads management honest
Compare on contribution margin ROAS, not gross revenue ROAS. Gross revenue ROAS of 4.5x sounds strong until you subtract product cost, shipping, returns, and fulfillment. Contribution margin ROAS after those subtractions might land at 1.4x, which means every dollar of ad spend nets 40 cents of margin. That is the number that matters. Ecommerce brands that optimize toward gross revenue ROAS usually grow topline while margin contracts.
Set target ROAS at 1.5x contribution margin ROAS at minimum for a healthy scaling account. A 40 percent gross margin business needs 2.5x break-even and should target 3.5x to grow profit alongside revenue. A 25 percent gross margin business needs 4.0x break-even and should target 5.5x to fund reinvestment. Ecommerce brands that skip the contribution margin math usually chase gross ROAS numbers that flatter the vendor and starve the business of profit.
Return rate is the hidden variable in contribution margin ROAS. Apparel brands routinely see 20 to 35 percent return rates. Home decor sits at 8 to 15 percent. Electronics sits at 6 to 12 percent. Return rate has to feed into the ROAS calculation because a 4.5x gross ROAS on a 30 percent return category actually delivers a 3.15x net ROAS after refunds. Ecommerce brands that price against gross ROAS on high-return categories usually run the account 20 to 30 percent hotter than they can sustain and see profit contract even as revenue grows.
Bake return-adjusted ROAS into the monthly report. Show gross ROAS, net ROAS after returns, and contribution margin ROAS after cost of goods. All three numbers on one line. The gap between them tells the story of whether the account is scaling profit or just scaling revenue. Practices that only report gross ROAS invariably discover the profit gap in a quarterly review with the finance team, by which point they have burned two months of budget on the wrong target.
Reporting cadence for google shopping ads management services
Weekly report covers pacing, disapprovals, and top movers. Monthly report adds product-level ROAS, category-level ROAS, campaign-level performance, and next-month plan. Quarterly business review ties Shopping revenue to overall ecommerce revenue and calculates the true cost per acquired customer including retention. Ecommerce brands that only see monthly reports miss the daily anomaly window that catches broken feeds and disapproved bestsellers before they cost the week.
Track five metrics weekly. Impression share versus last week. Click-through rate versus last week. Conversion rate versus last week. ROAS versus target. Cost per acquired customer versus target. Any metric moving 10 percent or more week-over-week needs a diagnostic before it becomes a monthly trend. Waiting a month to catch a 10 percent slide usually turns it into a 25 to 40 percent slide by the time the monthly report lands.
Weekly report contents
Weekly report is a five-line email. Spend to date versus monthly pace. Revenue to date versus target. ROAS versus target. Top 3 disapprovals fixed. One line of commentary on what changed. Ecommerce owners read those in 90 seconds and know whether to sleep well or ask a follow-up question. Anything longer than five lines gets skipped, which defeats the purpose of weekly reporting.
The best Merchant Center account we ever inherited had 4,200 SKUs. Of those, 3,800 were disapproved. The previous agency had reported “strong ROAS on active products” for six months without mentioning that 90 percent of the catalog was not serving. The client was reading month-over-month growth reports and assumed the business was scaling. We fixed the disapprovals in three weeks. Revenue tripled. The agency’s monthly report never changed a word. Reporting that hides disapprovals is not reporting. It is decoration.
Shopify google ads management specifics
Shopify stores plug into Merchant Center via the Google & YouTube app in most cases. The default feed is fine as a starting point but needs custom titles, custom labels for margin banding, and custom product highlights for premium SKUs. Stores that never customize the feed usually cap out at 60 to 70 percent of the Shopping performance a well-tuned feed produces.
Shopify’s automatic feed sync updates prices and availability within 30 minutes. Use that speed to protect margin. Set up rules that pause products when inventory drops below a safety threshold. Set up rules that boost bids on products with margin above the account average. Shopify’s flexibility on custom fields makes both rules straightforward. WooCommerce and BigCommerce need extra plugins to hit the same coverage. Shopify Plus adds custom pixel and Flow rules that let the account trigger bid changes on real-time inventory or revenue events. That combination pushes Shopify further ahead of the other platforms for Shopping performance at scale.
WooCommerce feed notes
WooCommerce feeds usually run through the Google Listings & Ads plugin or a paid feed manager. The default plugin covers basics. Serious ecommerce accounts on WooCommerce move to DataFeedWatch or Channable inside the first quarter because the default lacks custom rules, margin banding, and multi-market support. Any WooCommerce brand doing $50,000 per month in Shopping revenue should not be on the default plugin at month 12.
Case study on google shopping ads management
Abigail Ahern, a luxury home decor brand, worked with us on ecommerce revenue growth across paid search, paid social, and SEO. Shopping was a core channel. We rebuilt the product feed, segmented Performance Max by margin band, and calibrated Target ROAS to contribution margin math instead of gross revenue. Ecommerce revenue grew 179 percent over the engagement. Paid search ROAS reached 1,588 percent. Paid social ROAS reached 3,000 percent.
The Shopping wins compounded across three quarters. Feed cleanup delivered 45 percent higher impression share in the first month. Performance Max segmentation delivered 30 percent higher blended ROAS in the second quarter. Contribution margin calibration protected profit as we scaled spend by 60 percent through the third quarter. The playbook is the same one we run on ecommerce brands scaling paid search from Shopify feeds today. Accounts wanting a full baseline before signing a retainer can start with our free Google Ads audit.
The lesson for ecommerce brands. Shopping is a feed game, not a bid game. Fix the feed first. Segment Performance Max second. Calibrate Target ROAS on contribution margin third. Those three moves usually cover 70 to 80 percent of the possible outcome delta. Everything else is refinement layered on top of a clean foundation. Ecommerce brands that skip the foundation and chase advanced tactics like custom audience signals, cross-platform bidding, and dynamic remarketing usually spend three quarters building on sand before returning to the feed work first. The order matters. Feed then structure then bidding. Every other sequence produces a slower ramp.
Seasonality inside google shopping ads management
Ecommerce Shopping demand is not flat across the year. Q4 carries a 40 to 70 percent spike in most categories. Back to school grows apparel and home goods 15 to 25 percent. Spring grows outdoor and home decor 20 to 35 percent. Summer grows travel and beach categories 25 to 45 percent. Shopping management has to bake in the shape of the demand curve per category.
Adjust budgets by month using a seasonality index. Baseline months at 100. Q4 at 140 to 170. Back to school at 115 to 125 in August. Spring at 120 to 135 in March through May. Summer at 125 to 145 depending on category. Products with strong seasonal demand can carry campaign-level bid modifiers up 25 to 40 percent during the peak weeks. Flat-budget accounts miss the peak revenue and overspend during lulls, which shows up as lower blended ROAS across the year.
Q4 planning starts in August. Feed cleanup by end of August. New product launches loaded by early September. Bid target calibration in mid-September. Budget scale-up in late September to warm the algorithm before the Black Friday wave. Ecommerce brands that start Q4 planning in November usually spend the peak weeks fighting technical debt instead of harvesting demand. The prep work in August compounds through November.
Q4 planning cadence
Week one of August covers feed cleanup and Merchant Center diagnostic. Week two loads new product launches with clean feeds. Week three sets seasonal bid modifiers. Week four warms budgets by 15 to 25 percent to give Performance Max learning data before the peak. Black Friday, Cyber Monday, and the pre-Christmas window carry the highest revenue density of the year and reward the accounts that entered the window with a clean setup.
Google shopping ads management services prices 2025 to 2026
Agency pricing for Shopping management typically follows one of three models. Flat monthly fee at $800 to $3,500 for small ecommerce brands. Percentage of media spend at 12 to 18 percent for accounts above $10,000 monthly spend. Hybrid retainer with a base fee plus performance bonus tied to ROAS or revenue targets. Each model works if the incentives align, but the hybrid model with a bonus tied to contribution margin ROAS aligns the tightest.
Redefine Web’s smallest ecommerce PPC retainer starts at $599 per month bundled with SEO and content. Larger ecommerce brands run on the standard PPC management services retainer with Shopping included alongside search and paid social. Our Google Ads management services page covers the full operating model. For a comparative operating model view, our B2B PPC agency page details how the same discipline maps to B2B pipeline attribution. Search Engine Land’s PPC library and WordStream’s PPC blog track industry-wide pricing benchmarks that shift year over year.
Agency selection criteria
Evaluate agencies on seven rows. Reporting depth. Merchant Center access model. Contract length. Strategist assignment. Pricing model. Past ecommerce results with numbers. Written onboarding plan. Ask for two references in your vertical and one Shopify or WooCommerce reference. Reference calls beat case study PDFs every time. Ecommerce-specific agencies typically outperform general PPC agencies on Shopping because feed work is a specialty that general PPC teams often outsource or skip.
Onboarding timeline
Week one covers Merchant Center audit and feed diagnostic. Week two rebuilds the feed with new titles and custom labels. Week three restructures Performance Max by margin band. Week four calibrates Target ROAS to contribution margin math. Day 30 the account is running on a clean foundation with tracking and segmentation live. The first real review lands at day 90 after the algorithm has trained on the new structure.
Frequently asked questions
What is google shopping ads management
Google Shopping Ads management is the ongoing work of maintaining the product feed, tuning Performance Max and Standard Shopping campaigns, calibrating Target ROAS bidding, monitoring Merchant Center diagnostics, and reporting on contribution margin ROAS. It differs from search PPC in that feed quality replaces keyword strategy. Feed titles, images, and structured data control which auctions the products enter. Bidding runs at the product level rather than the keyword level. Performance Max wraps segmentation and audience signals in a partial black box unless the campaign structure is built to force transparency.
How much do google shopping ads management services cost in 2026
Agency pricing for Shopping management typically follows three models. Flat monthly fee at $800 to $3,500 for small ecommerce brands. Percentage of media spend at 12 to 18 percent for accounts above $10,000 monthly spend. Hybrid retainer with base fee plus a performance bonus tied to ROAS or revenue targets. Each model works if the incentives align, but the hybrid with a bonus tied to contribution margin ROAS aligns the tightest. Redefine Web's smallest ecommerce PPC retainer starts at $599 per month bundled with SEO and content.
What is the best Shopping campaign structure
Run Performance Max and Standard Shopping in coordination. Performance Max covers the black-box scale case. Standard Shopping covers the transparent control case. Segment Performance Max by margin band or product priority. High-margin bestsellers in one asset group with aggressive ROAS targets. New product launches in a second asset group with volume targets. Legacy or clearance products in a third asset group with a floor bid. Segmenting Performance Max stops the algorithm from over-serving low-margin products because they produced easy conversions and starving high-margin products.
How do I improve Google Shopping feed quality
Fix eight feed attributes at minimum. Title, description, price, availability, image, brand, GTIN, and Google product category taxonomy. Rewrite titles to a vertical formula. Apparel follows Brand plus Gender plus Product Type plus Color plus Size plus Material. Electronics follows Brand plus Product Type plus Model plus Key Spec plus Color. Use product-on-white images rather than lifestyle for the primary image. Add custom labels for margin banding so Performance Max can segment. Check Merchant Center diagnostics weekly and fix disapprovals inside 48 hours.
What Target ROAS should I set on Google Shopping
Set Target ROAS at 1.5x contribution margin ROAS minimum for a healthy scaling account. A 40 percent gross margin business needs 2.5x break-even and should target 3.5x to grow profit alongside revenue. A 25 percent gross margin business needs 4.0x break-even and should target 5.5x to fund reinvestment. Compare on contribution margin ROAS rather than gross revenue ROAS because gross revenue optimization grows topline while margin contracts. Recalibrate every 30 days based on actual last-90-day contribution margin and adjust when running promo cycles.
Should I use Performance Max alone or with Standard Shopping
Run both together. Performance Max covers the black-box scale case with strong efficiency. Standard Shopping covers the transparent control case with query-level visibility. Running Performance Max alone often hits good ROAS but cannot explain why or diagnose when it drifts. Running Standard Shopping alone caps volume because it does not use the audience signals Performance Max leverages. The combination captures Performance Max efficiency without losing diagnostic visibility. Feed the search terms report weekly into both campaigns to keep negatives current.
Book your free 30-minute strategy call.
No spam, no sales rep. We use your email to schedule your call with a senior strategist. That is it.
More from the blog
View all articles → PPC
PPC Healthcare PPC Advertising Channels Compliance and Targeting
Read article PPC
PPC Dental Facebook Ads Guide for Practices That Book Patients
Read article PPC
PPC