B2B SaaS marketing benchmarks matter most when your board asks why your CAC payback is 18 months and the industry median is 12. You want one page of defensible ranges by revenue stage so the conversation shifts from anecdote to data. Every number below reflects the current growth-stage SaaS median, not the aspirational figure from a vendor sales deck. Use it to defend the program that’s working, or to retire the metric that just fell out of band.
This guide covers spend as a share of revenue by stage, MQL to SQL to closed-won ranges, cost per demo and opportunity, CAC payback, net revenue retention, and the leading KPIs a real B2B enterprise SaaS marketing organization tracks weekly. You get a table per category, a channel-level scoreboard, and a named case walkthrough of a growth-stage client whose funnel we rebuilt into a repeatable acquisition engine.
Marketing spend as a share of revenue by stage
Median marketing spend for private B2B SaaS in 2026 sits at roughly 8% of annual recurring revenue, per SaaS Capital’s spending study. Seed and pre-Series-A teams run higher at 12 to 18% since category education carries the burden. Series B through late growth stabilizes at 6 to 10%. Public SaaS lands at 4 to 8% once demand generation compounds and brand does more of the work.
Spend ranges by ARR band
Under $2M ARR, plan on 15 to 25% of ARR for marketing, weighted toward founder-led content and one paid experiment. From $2M to $10M ARR, 10 to 18% is healthy, split across paid, content, and one outbound test. From $10M to $50M ARR, 8 to 14% is normal, with the mix shifting toward brand, category, and partner programs. Above $50M ARR, 6 to 10% supports category defense, expansion, and the customer marketing engine that drives net revenue retention.
Cost per demo, opportunity, and closed-won ranges
Cost benchmarks by channel and stage split cleanly once you index them against ACV. Paid search delivers demos at $180 to $640 depending on category maturity. LinkedIn paid delivers demos at $340 to $780 for a $50k ACV target. Content delivers demos at $60 to $220 once the program compounds past month twelve. Review sites deliver demos at $220 to $520. Outbound SDR delivers demos at $420 to $1,100 depending on target account quality. These are median 2026 numbers, not aspirational floors from a vendor deck.
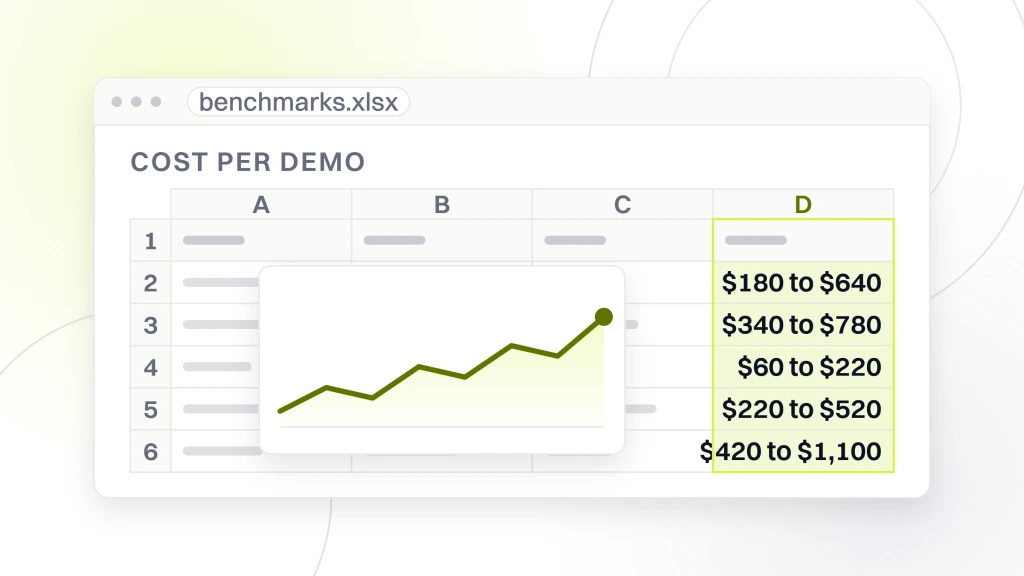
Cost per opportunity (SQL that reached qualification) sits at 3 to 5 times cost per demo. Cost per closed-won lands at 4 to 8 times cost per opportunity depending on close rate. A growth-stage SaaS at $18k ACV that converts SQL to closed-won at 20% will see cost per closed-won between $2,800 and $9,400 across channels. That range should defend a 12 to 18 month CAC payback. Ranges outside this band require investigation, not a channel change. See HubSpot’s CAC framework for the calculation methodology.
If leading indicators drop 20% week over week, pipeline drops 20% inside 6 weeks. Act on the leading signal now.
| Channel | Cost per demo | Demo to closed-won | Time to first demo |
|---|---|---|---|
| Paid search | $180 to $640 | 10 to 18% | Days |
| LinkedIn paid | $340 to $780 | 12 to 22% | Weeks |
| Content and SEO | $60 to $220 (after month 12) | 14 to 24% | Months |
| Review sites | $220 to $520 | 18 to 28% | Weeks |
| Outbound SDR | $420 to $1,100 | 8 to 18% | Weeks |
| Integration partner | $140 to $380 | 18 to 30% | Months |
Cost benchmarks scale with ACV
Cost per closed-won scales roughly linearly with ACV. A $6k ACV product produces closed-won at $1,200 to $2,800. A $30k ACV product at $5,600 to $9,400. A $120k ACV product at $22,000 to $48,000. Rule of thumb: 10 to 20% of first-year contract value is the healthy CAC band. Above 25% CAC to ACV, payback stretches past 18 months and the unit economics get shaky at even modest churn. Fix CAC or fix ACV.
Channel-level payback ranges
Paid search pays back inside 6 to 10 months at $18k-plus ACV. LinkedIn paid pays back at 8 to 14 months. Content compounds and pays back at 12 to 18 months, as covered in our B2B SaaS Content and Inbound Marketing Strategy guide. Review site sponsorship at 4 to 8 months once the category takes off. Outbound SDR at 9 to 16 months depending on target quality. Integration partner at 6 to 12 months for the partner’s actual customer base. Below $12k ACV, paid search and outbound SDR both stop working and channel mix shifts hard toward content and community.
KPIs and leading indicators worth tracking weekly
The B2B SaaS metrics worth tracking weekly split into two categories: leading and lagging. Leading signals include qualified traffic to pricing and demo pages, demo requests, SQL creation, opportunity creation, and stage-two opportunity progression. Lagging signals include pipeline created, revenue closed, CAC, payback period, and net revenue retention. Watch leading weekly and by channel. Watch lagging monthly and by segment. Confusing the two is the reason marketing ops teams drown in dashboards that answer questions nobody asked.
B2B SaaS leading KPIs predict pipeline 6 to 12 weeks out. If demo requests drop 20% week over week, pipeline drops 20% 4 to 6 weeks later, and revenue drops 20% 12 to 16 weeks later. Catching decay 4 weeks early is worth the entire cost of a marketing ops function. Full strategy context lives in our B2B SaaS Marketing Strategy post.
Weekly scorecard for the head of marketing
The five leading indicators to watch weekly: qualified traffic to pricing and demo pages, demo requests by channel, SQL creation by channel, opportunity creation, and stage-two progression. Each metric gets a week-over-week trend and a channel breakout. If demo requests drop 15% in any single channel week over week, the head of marketing has a specific channel owner to call. If they drop 15% across all channels, the strategy needs a refresh.
Monthly scorecard for the board deck
The board deck runs on lagging indicators: pipeline created versus target, revenue closed, CAC by channel, blended CAC, payback period, and net revenue retention. Present ranges, not point estimates. Present trends over four quarters, not month over month. Marketing teams that present six-metric board decks with cohort trends get their next budget approved 80% of the time.
Retention and expansion ranges that decide valuation
Net revenue retention (NRR) at 115%-plus is the venture-backed growth SaaS target. Below 100% and you’re losing revenue faster than expansion adds it, which sits on the wrong end of the churn curve. Between 100% and 115% is acceptable at seed and early growth. Between 115% and 130% is healthy at growth. Above 130% typically signals a platform-play SaaS with strong land-and-expand mechanics. Gross revenue retention (GRR) sits at 88% to 95% for SMB SaaS and 92% to 98% for mid-market and enterprise.
Retention numbers matter to marketing since CAC payback depends on them. A SaaS with 110% NRR pays back CAC in 12 months and generates 3 to 4x LTV to CAC over 5 years. A SaaS with 95% NRR pays back CAC in 20 months and struggles to hit 2x LTV to CAC. The marketing team’s channel investment gets valued differently by the board depending on retention. See OpenView’s NRR primer for the calculation edge cases.
If NRR sits below 100%, fix retention before you touch the acquisition budget. Every acquisition dollar drains out the churn hole first.
Expansion drivers that marketing owns
Marketing owns three expansion drivers: customer marketing programs that surface additional use cases, product marketing that packages new features into upsell opportunities, and lifecycle email that nudges usage against feature adoption thresholds. Companies with named customer marketing owners see NRR 8 to 15 points higher than companies without. Customer marketing is the highest-ROI marketing investment most SaaS teams underfund by 60 to 80% versus its actual contribution.
Early churn signals that predict the miss
Three early churn signals catch problems 60 to 120 days before the churn shows up in revenue. Feature adoption stalling on any account that reaches 90% of contract value. Support ticket volume climbing 30%-plus quarter over quarter on the account. Executive sponsor changing on the buyer side without a proactive handoff. Any two of the three within a 60-day window predicts churn at 60 to 75% probability. Customer marketing and CS work the intervention playbook off these signals.
B2B enterprise SaaS marketing benchmarks that decide the board deck
The most important metrics for a B2B enterprise SaaS marketing organization group into four buckets: pipeline sourced (share from marketing versus outbound versus partner), pipeline velocity (average days from opportunity created to closed-won), win rate on sourced pipeline (by segment and by named competitor), and net revenue retention. Those four decide whether enterprise marketing is contributing or coasting.
Enterprise SaaS marketing typically sources 25 to 45% of pipeline, with outbound sales sourcing another 30 to 50% and partners sourcing 10 to 25%. Pipeline velocity sits at 90 to 180 days for growth-stage mid-market SaaS and 180 to 360 days for enterprise SaaS at $100k-plus ACV. Win rates on marketing-sourced pipeline run 22 to 34% for enterprise mid-market and 15 to 24% for enterprise SaaS at $250k-plus ACV where buying committees include 6 to 12 stakeholders.
Enterprise marketing that sources under 25% of pipeline is under-funding demand generation and paying for it in outbound CAC.
Velocity and win rate ranges
Pipeline velocity at 90 to 180 days is healthy for growth-stage mid-market SaaS. Velocity above 240 days at that stage typically means qualification is too loose and pipeline is padded with deals that won’t close. Win rate on marketing-sourced pipeline at 22 to 34% is healthy. Below 15%, either the ICP is wrong or product-market fit is weaker than the demo experience suggests. Above 40% win rate, sales is only pursuing pre-qualified deals and marketing is being credited for pipeline outbound would have closed anyway.
Case walkthrough of Rocket Software hitting the medians
Rocket Software, Inc., a growth-stage SaaS providing a subscription-acquisition tool for website owners, came to us with a broken funnel and short runway. Their scoreboard 6 months before the engagement started was underwater: weak drip campaigns, funnel gaps, unoptimized pricing, and a flat activation curve. Every metric that mattered sat in the bottom quartile of the peer band.
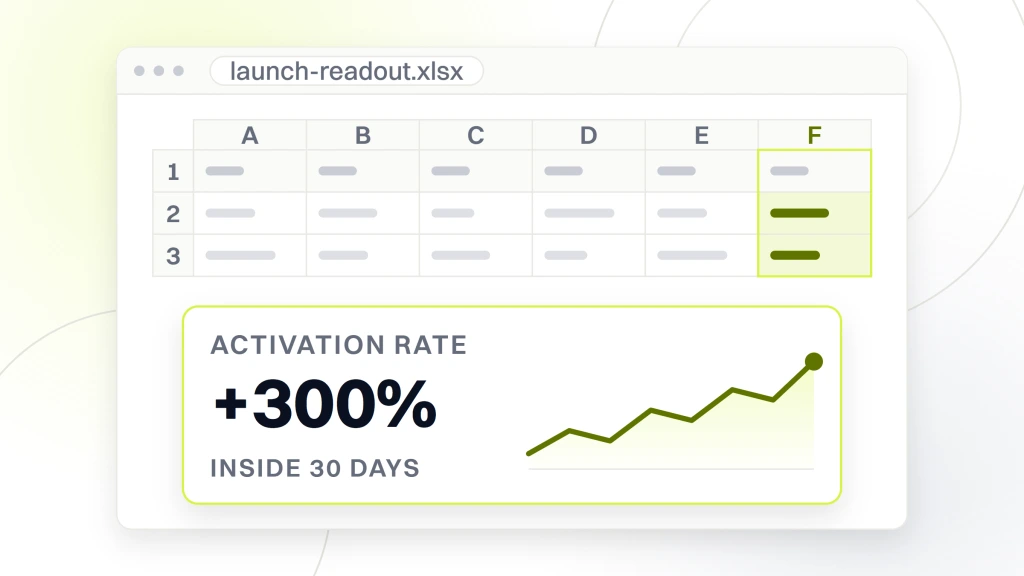
We rebuilt four things: the onboarding flow with a first-value moment inside 90 seconds, the drip campaign as a behavioral lifecycle program in ConvertKit, a four-channel launch across email, social, paid, and influencer, and a tiered free-plus-premium pricing model. Inside the launch window, Rocket Software’s activation rate grew 300%, the company signed its first 3,000 customers in week one, and daily new subscribers stabilized at 400-plus. Every metric moved through the median inside two quarters.
| Metric | Before | After |
|---|---|---|
| Activation rate | Flat (bottom quartile) | +300% inside 30 days |
| Week-one customers | Handful pre-launch | 3,000 customers |
| Daily new subscribers | Sporadic | 400+ per day |
| Drip campaign state | Time-based, weak | Behavioral, product-tied |
Recovery timeline by metric
Rocket Software’s four metrics recovered on different clocks. Activation improved in 30 days since the fix was product plus onboarding. MQL to SQL improved in 60 days once the tighter definition kicked in. Cost per demo improved in 90 days as the four-channel launch cross-primed retargeting. NRR improved in 120 to 180 days as behavioral drip retention hit the churn cohort. Expect 30 to 180 days per metric depending on where the problem sits in the funnel.
Industry medians versus your actual company
Industry medians are useful for board conversations and directional planning. Your own company numbers matter for the weekly decisions. Median MQL to SQL at 24% is a range to check against, not a target to hit. Your healthy MQL to SQL depends on your ACV, your ICP tightness, your sales cycle length, and your average close rate. Optimize on your own 90-day trailing baseline first, then compare against the published medians second.
Bench-marking against medians without accounting for stage, ACV, or category maturity produces false alarms. A $6k ACV horizontal SaaS should not benchmark against a $180k ACV vertical enterprise SaaS. A category-creating SaaS should not benchmark against a mature-category challenger. Pick 5 to 8 truly comparable public companies in the same ACV band and category maturity, and benchmark against them. See our B2B SaaS Marketing Team Structure for the org-chart medians that match these numbers.
Peer selection that produces useful ranges
Pick peer companies that match on four dimensions: ACV band within 30%, category maturity (leader, challenger, or new entrant), buyer role (individual contributor, manager, executive), and B2B SaaS go-to-market strategy (product-led, sales-led, hybrid). Public S-1 filings and 10-K reports include enough marketing spend, CAC, and payback data to build a five-company peer benchmark inside 8 hours. Every board meeting benefits from that peer benchmark on one slide.
How ranges shift by category maturity
New-category SaaS carries a 30 to 50% marketing spend premium versus mature-category SaaS, since category creation requires education, evangelism, and thought leadership. Category leader SaaS spends at the medians or slightly above to fund category defense. Challenger SaaS spends 10 to 20% below the medians and free-rides on incumbent category education.
Conversion ranges shift by maturity too. New-category SaaS sees homepage-to-interested conversion at 0.8 to 1.6%. Mature-category SaaS sees the same conversion at 2.5 to 4% since visitors arrive already sold on the category. New-category SaaS should benchmark spend at 130 to 150% of the mature-category median, conversion at 40 to 60% of the mature-category median, and CAC payback at 130 to 160% of the mature-category median. Adjust every comparison for maturity.
How to use these ranges without wrecking your team
Benchmarks are a diagnostic tool, not a performance review criterion. Using them as individual targets guarantees the team optimizes on the metric instead of the customer outcome. Cost per lead optimized against a benchmark produces cheap leads sales rejects. Use these ranges to catch drift early, not to grade the team quarterly.
The right use of these ranges: monthly comparison against your own 90-day trailing baseline, quarterly comparison against a peer benchmark, and annual comparison against public industry medians. Anything more frequent than monthly produces noise. Anything less frequent than annually misses category shifts. Full context on how to integrate these numbers into a working strategy lives in our B2B SaaS Marketing Strategy post. A benchmark that’s 24 months old is worse than no benchmark. Refresh from published industry reports annually and from public S-1 and 10-K filings quarterly. Public S-1s on the SEC EDGAR database hold the freshest peer marketing spend disclosures.
Turn these ranges into a working scoreboard
Every metric in this guide only matters when it sits on a scoreboard your team reads every Monday. Pick five leading indicators, wire them to a channel breakout, and set a 15% drop threshold that triggers an investigation the same week. Pair it with a monthly board view running four lagging indicators against four-quarter cohorts. That’s the whole system.
If you want a partner who has rebuilt this scoreboard for growth-stage SaaS clients like Rocket Software (300% activation growth, 3,000 launch-week customers, 400-plus daily subscribers post-launch), our SEO and PPC retainers run at $999, $1,499, $2,499, and from $4,500 per month. Every tier includes the benchmark scoreboard, a channel-level payback model, and a weekly leading-indicator review. Book a fit call and we’ll walk your numbers against the medians.