A b2b saas go to market strategy is the written seam between marketing and sales, and most SaaS teams find out that seam is loose only after two quarters of flat pipeline. Marketing hands over leads sales rejects. Sales grinds out cold outbound with no air cover from marketing. Both sides burn cycles, closed-won stays flat, and the board asks harder questions on the next call. This guide walks the four-phase framework that ties ICP, positioning, demand generation, and sales motion into one running system a growth-stage SaaS team can execute inside a single quarter, without a two-week offsite.
A working plan needs seven parts. You get the real ICP refresh cadence, the sales-marketing alignment mechanics, the four-phase b2b saas go to market framework, the copy-ready b2b saas go to market checklist, the platform features that matter and the ones that do not, the sales motion by ACV band, and a case study of a SaaS client we rebuilt from broken drip to a 3,000-customer launch. Read straight through in about thirteen minutes, then hand the b2b saas go to market plan to your team on Monday morning and start the first phase this week.
ICP refinement as a quarterly discipline
The ideal customer profile drifts every 90 days as the product releases new features, sales closes new segments, and churn reveals bad-fit accounts. Refresh the ICP every quarter based on which accounts closed, which retained, and which expanded. The tightest ICPs win, and the discipline of narrowing feels risky the first time you do it but produces the fastest pipeline gains inside a single quarter. Every SaaS founder can name three verticals where they wish the product was better fit. Delete those from targeting and pipeline climbs 20% to 40% inside two quarters.
Quarterly ICP refresh sits inside every serious GTM plan, and the alternative is drift. A SaaS that targets ‘mid-market companies with 200 to 2,000 employees’ at seed learns by growth stage that its real sweet spot is 400 to 800 employees in three specific verticals. Continuing to target the broader ICP burns 40% to 60% of paid budget on segments that never close. Tightening the ICP is the cheapest pipeline gain any go to market team ever makes.
Customer cohort analysis that reveals real ICP
Pull the last 200 closed-won accounts. Group them by industry, employee count, and annual revenue. Overlay net revenue retention at 12 months. The intersection with the highest close rate and highest NRR is your real ICP. Not the ICP in the pitch deck. The one the data shows. Most SaaS teams discover their real ICP is 30% to 50% narrower than the ICP marketing has been targeting for the last six quarters. Narrowing to the data-shown ICP typically doubles pipeline efficiency inside a quarter.
The disqualifier list matters as much as the target
Every ICP document names the disqualifiers. Company sizes you refuse to sell to, verticals you cannot service well, tech stacks you cannot integrate with, buying processes that consistently kill deals. Sales teams without a disqualifier list burn 25% to 40% of their time on deals that should never have entered pipeline. Marketing teams without a disqualifier list fill top of funnel with contacts sales will reject on sight. The disqualifier list saves both teams from the same waste, and it takes 30 minutes to write once you have the data.
Sales marketing alignment that holds under pressure
The alignment mechanism inside the plan is a monthly go to market review. Marketing, sales, and product each bring one number that moved and one that did not. The three teams debate cause and effect for 45 minutes and pick one thing to change next month. That is it. No RACI matrix, no new tool, just three leaders in a room disagreeing productively about attribution and product fit. Teams that run this meeting for four quarters straight see closed-won climb 30% to 60% versus teams that skip it.
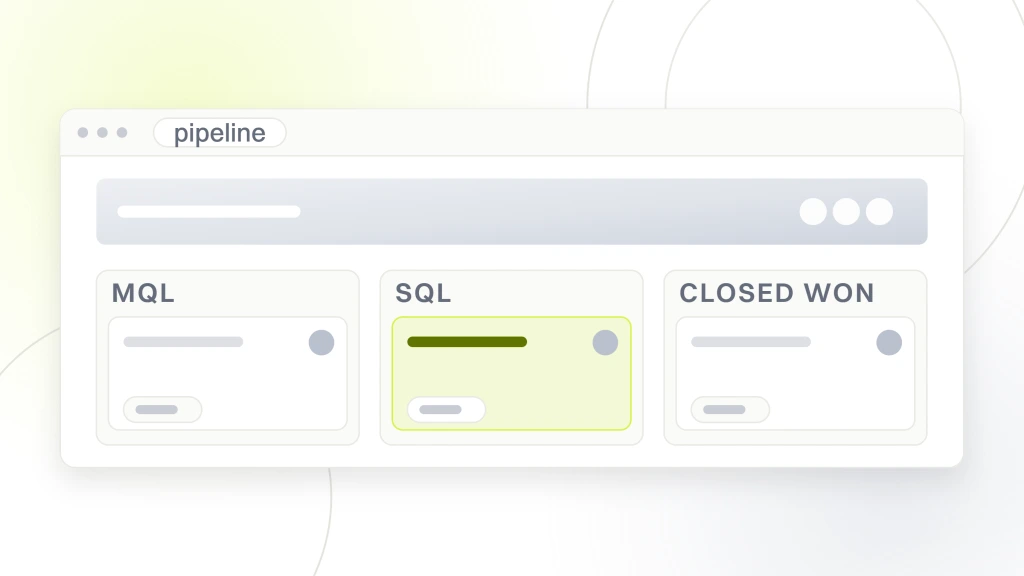
The written SLA is the second alignment mechanism. Marketing commits to a monthly MQL number with a specific definition. Sales commits to a response time on every SQL, usually 30 to 90 minutes for a demo request. Both teams commit to a shared dashboard signed off by both leaders at the start of each quarter. Teams that skip the SLA fight over lead quality every month. Teams with a written SLA fight over the real constraint, which is usually product fit in a specific segment.
Callout. If your MQL to SQL rate sits below 15% for two straight quarters, the MQL definition is broken. Tighten it before you spend one more dollar on top-of-funnel volume.
MQL definition that sales trusts
MQL is where most GTM plans stall. If your MQL is any contact who downloaded a whitepaper, your MQL to SQL rate sits at 3% and sales stops trusting the queue. If your MQL requires a demo request or a pricing page visit plus a form fill, your rate climbs to 25% and sales fights over the queue. You want the tighter definition once the volume drops. Pipeline follows quality, not quantity, and the playbook proves it every quarter.
SLA response time that changes close rate
A demo request contacted inside 5 minutes closes at roughly 3 times the rate of the same demo request contacted after 60 minutes. Contact after 24 hours and close rate drops to a fraction of the initial rate. Sales teams that treat SLA response as a nice-to-have burn 40% to 60% of top-of-funnel investment on cooling leads. Sales teams with a 30-minute SLA on demo requests capture the pipeline marketing paid to generate. This one metric is the single largest go to market gain most teams overlook.
B2b saas go to market checklist you can copy today
A b2b saas go to market checklist is one Google Doc, two pages, four sections. Buyer, offer, demand engine, handoff. Every plan you have seen with 60 tabs and a color-coded RACI matrix is a plan nobody executes. Two pages fits on one screen. One screen gets read every Monday, and that is the difference between a strategy that runs and a strategy that sits in a folder.
The template below is the one we hand every new SaaS client on day one. Copy it into your own doc, spend 4 hours filling it in with your CRO or founder plus the head of marketing plus the head of sales, and you have a working b2b saas go to market framework. Update it once per quarter, not once per week. The strategy changes when the market or the product changes, and those changes are rare in a well-run growth-stage SaaS.
- Buyer paragraph with role, company size, pain, current alternative, buying trigger
- Positioning sentence ending in ‘and we are the only vendor who does X’
- Three named competitors with one gap you exploit against each
- Pricing page with three tiers and a published starting price
- Six-channel demand plan with named owners and monthly budget
- MQL definition, SLA response time, weekly leading indicator
- Monthly go to market review with agenda and named attendees
- Quarterly ICP refresh cadence with the data source for the refresh
- Disqualifier list with named verticals, tech stacks, and company sizes
- Exit-plan handoff between marketing, sales, and customer success
The b2b saas go to market checklist that fills in one afternoon
Four hours with three leaders in a room. First hour: buyer paragraph and positioning sentence. Second hour: pricing tiers and competitor gaps. Third hour: six-channel demand plan with named owners and monthly budget. Fourth hour: MQL definition, SLA, and monthly review agenda. You leave the room with a working b2b saas go to market plan. You spend the next quarter executing it, not writing it. That single afternoon beats six weeks of solo strategy work every time.
B2b saas go to market strategy template reuse across quarters
The template stays the same shape every quarter. The contents inside evolve. Buyer paragraph might tighten in Q2 as data comes in. Channel mix might shift 10% from paid search to review sites as the category matures. MQL definition might tighten as the sales team gets pickier. The template is the skeleton. The quarterly review adds and subtracts flesh. Teams that rewrite the template every quarter waste 20 hours of leadership time on process instead of execution.
B2b saas go-to-market platform features that matter
The GTM stack is boring on purpose. CRM (HubSpot or Salesforce). Marketing automation (HubSpot or Marketo). Sales engagement (Outreach or Salesloft). Ad managers (Google Ads, LinkedIn Ads). Analytics layer (GA4 plus a warehouse-based BI tool once you clear $10M ARR). Lifecycle email (Customer.io or Braze). Demo booking (Chili Piper or Calendly). Total stack cost lands at $8k per month at seed, $24k at growth, $85k at enterprise. Tools do not fail projects. People without owners do.
Skip the b2b saas go to market platforms that promise ‘all-in-one revenue orchestration’ or ‘AI-driven pipeline generation.’ Every one of those we have seen in a client stack produces one impressive-looking dashboard and no pipeline. The boring stack of six tools with real data pipes between them runs circles around the shiny consolidated platform. Google’s GA4 property setup guide is worth reading before you decide on the analytics layer.
Callout. Trust the boring stack. Six best-of-breed tools with clean write-back to your CRM beats any ‘all-in-one revenue platform’ at any ARR band.
Integration quality decides the stack’s real value
Every tool in the stack has to write data back to your CRM or your warehouse. Tools that only write to their own dashboards produce reporting silos that marketing ops teams spend 20% of their week reconciling. Before adding any new tool, verify the API supports write-back to your source of truth. Tools without that capability are dead ends. The stack you inherit at $10M ARR needs to survive to $100M ARR without a rip and replace. Choose accordingly, and put the integration test in the vendor scorecard.
Data warehouse as the go to market source of truth
Once you clear $10M ARR, a data warehouse (Snowflake or BigQuery) becomes the source of truth for every GTM metric. Every tool writes to the warehouse. Every dashboard reads from the warehouse. Marketing ops stops reconciling five different definitions of MQL, and the warehouse now holds one canonical definition. Below $10M ARR, GA4 plus HubSpot is enough. Above $10M, the warehouse investment pays back inside 6 months on reduced reconciliation time and better cross-team trust in the numbers.
The b2b saas go to market playbook by revenue stage
A b2b saas go to market strategy at seed stage is a founder plus one fractional operator, and the playbook at each later stage builds on that base. Go to market at growth stage is a CRO plus a team of 12 to 24 across marketing, sales, and customer success. Go to market at enterprise is a CRO plus a team of 80 to 200 with specialized functions. Trying to run the enterprise playbook at seed burns cash. Trying to run the seed playbook at enterprise caps pipeline. Match stage to playbook.
The seed-stage b2b saas go to market plan concentrates on three plays a two-person team can run without dropping quality. Founder-led LinkedIn, SEO content on 8 to 12 bottom-funnel keywords, and paid search on those same keywords. Everything else waits until the next round. The growth-stage plan opens up six channels plus a monthly go to market review. Enterprise adds field marketing, analyst relations, and account-based marketing on the top 200 target accounts.
Seed-stage go to market plan on $14k per month
Seed-stage burn: $6k on SEO content with a fractional writer, $8k on paid search. Founder time: 12 hours per week on LinkedIn and sales calls. Total monthly cash burn: $14k. Total revenue you need to sustain that burn: $2M ARR minimum. Below that revenue floor and you are lengthening your runway by cutting GTM spend instead of protecting product. Above that floor and the three-play plan pays back inside 8 to 12 months.
Growth-stage go to market plan at $30M ARR
Growth stage adds three channels. LinkedIn paid at $22k per month, G2 and Capterra category sponsorship at $6k to $18k per month, lifecycle email at $4k per month in tooling plus a full-time owner. Marketing team grows to 6 people. Sales team grows to 12 AEs plus 6 SDRs. Customer success grows to 8 to 10 CSMs. Monthly go to market spend hits $340k to $560k. Total go to market cost as percentage of ARR sits at 14% to 22%. Efficient growth-stage SaaS runs at the low end of that band.
Case study of a SaaS go to market rebuild that produced a 3,000-customer launch
Rocket Software, Inc. came to us with a 7% activation rate, broken onboarding, and weak drip campaigns. The product worked. The go to market plan around it did not. Traffic converted at a fraction of what the pricing model needed to sustain a growth-stage burn. Every dollar of paid acquisition was a dollar lost to underperforming retention. The founder called us before running another quarter of the same channel mix and hoping the numbers would move on their own.
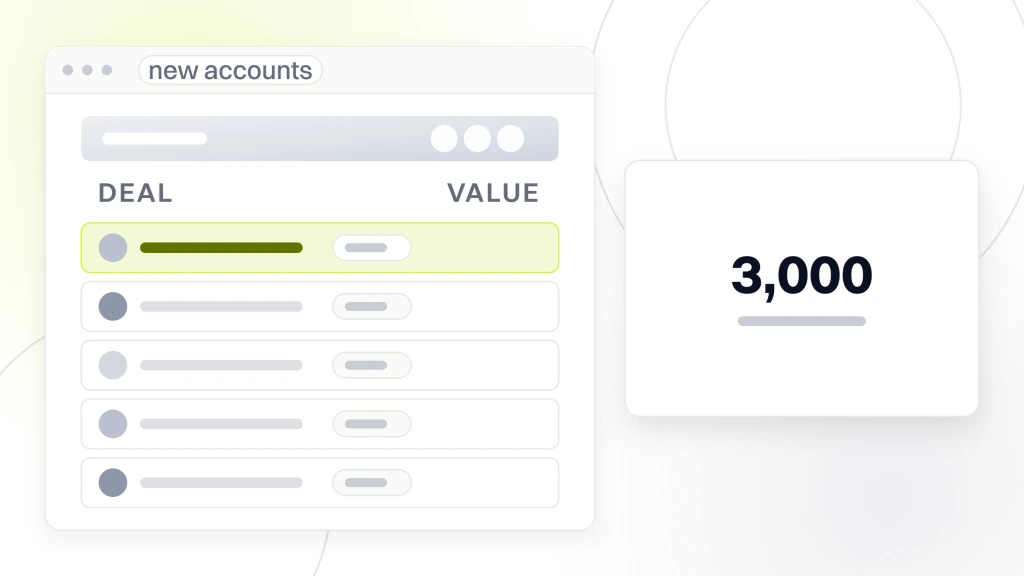
We rebuilt four things for Rocket Software, Inc. The onboarding flow with a clearer first-value moment, the drip campaign as a lifecycle program tied to product usage events, a four-channel launch sequence for a specific target subscriber, and a weekly retention scoreboard the founder read every Monday. Activation rate climbed 300% in the first month. The launch acquired 3,000 customers in week one. Post-launch daily new subscribers stabilized at 400+. The plan got rebuilt from the buyer definition through the handoff to customer success.
Callout. Fix activation before the launch. Every $1 of paid acquisition against a 7% activation rate is $0.93 lit on fire the moment the user signs up.
| SaaS client metric | Baseline | After program |
|---|---|---|
| Activation rate | 7% | 28% (300% gain) |
| Week-one customers | Below target | 3,000 |
| Daily new subscribers | Sporadic | 400+ |
| Drip campaign state | Weak, time-based | Behavioral, product-tied |
The four-channel launch sequence
The launch that drove 3,000 first-week customers ran on four channels sequenced across seven days. Day one: founder LinkedIn thread with product screenshots. Day two: paid search on eight bottom-funnel keywords with a limited-time trial. Day three: lifecycle email to the existing waitlist. Days four through seven: integration partner co-marketing to their audience. Each channel primed the next, so cost per acquisition dropped 40% by day five as retargeting from earlier channels amplified reach.
Handoff mechanics from marketing to sales to CS
The rebuild included a written handoff from marketing to sales (demo request under 30 minutes to first AE contact) and from sales to CS (signed customer to CSM introduction within 24 hours). Handoffs got tracked on a weekly scoreboard the founder reviewed. Missed handoffs got resolved the same week, not the next quarter. Companies that skip written handoffs lose 15% to 30% of customer lifetime value to the seams between teams. Written handoffs close that loss. Full benchmark ranges for retention and expansion metrics live in our B2B SaaS Marketing Budget, Benchmarks and KPIs post.
B2b saas go to market playbook variants by sales motion
Three sales motions dominate SaaS. Product-led growth (self-serve trial to paid), sales-led (SDR outbound plus AE demo), and hybrid (self-serve trial plus AE-assisted for enterprise deals over $50k ACV). The playbook differs meaningfully across the three motions. PLG optimizes for time-to-value and product signup rate. Sales-led optimizes for pipeline creation and quota attainment. Hybrid balances both and requires a stronger data warehouse to route trial signups to sales at the right threshold.
The motion picks itself based on ACV. Below $8k ACV, product-led wins, and sales-assisted cost per closed-won exceeds the deal value. Between $8k and $60k ACV, hybrid wins. Above $60k ACV, sales-led wins, and the buying process now requires 4 to 12 stakeholders. No free trial can carry that much organizational complexity. Trying to run PLG on a $150k ACV product produces beautiful signup metrics and empty revenue. Trying to run sales-led on a $2k ACV product burns unit economics.
Product-led growth motion mechanics
PLG requires an activation moment inside the first 90 seconds of trial signup. Users who hit activation convert to paid at 25% to 40%. Users who do not hit activation convert at under 3%. Every PLG go to market plan optimizes on the activation event as the primary metric, with a scoreboard the founder and product lead review every Monday. Content, lifecycle email, and demo booking flows all serve activation, not demo requests.
Sales-led motion for enterprise ACV
Sales-led SaaS at $150k-plus ACV runs an outbound-heavy motion where SDRs book meetings with named accounts on a target list of 400 to 2,000 companies. Marketing supports outbound with account-based content, ad targeting on the same list, and warm-up emails to the specific buyer committee. Close rate on outbound-sourced pipeline sits at 12% to 22% for enterprise SaaS with mature ABM programs. Below 12% close rate, either the ICP is wrong or the SDR playbook needs a rewrite.
Choosing an agency to run go to market
An agency worth hiring shows you a portfolio of SaaS clients in your ACV band, names the operators who will work on your account, and quotes off a discovery that includes ICP validation and pricing page review. Agencies that quote off a one-hour scoping call and promise a specific pipeline number are guessing. The screening rubric lives in our How to Choose a B2B SaaS Marketing Agency post.
Fees at Redefine Web run $1,499/mo for Foundation retainers, $2,499/mo for Growth work, $3,999/mo for Scale-tier programs, and from $6,000/mo for Enterprise SaaS engagements. Retainer beats project-based for GTM work, and the plan is a living document, not a one-time deliverable. Agencies that sell you a $40k ‘go to market strategy project’ and disappear after the readout are selling you a slide deck. The plan needs weekly execution and quarterly refinement. See our Best B2B SaaS Marketing Agencies comparison for the vendor field.
Agency scope that fits go to market
The right agency scope inside the GTM plan covers the demand engine and the handoff, not the ICP work or the pricing decision. ICP and pricing require product knowledge and commercial authority the agency does not have. Demand engine and handoff instrumentation are pure execution the agency runs well. Agencies that pitch a full go to market rebuild including ICP and pricing are over-scoping. Reject that pitch. Keep ICP and pricing in-house.
Red flags that predict a bad go to market engagement
Fixed-price engagements with no discovery. Promises of a specific pipeline number before seeing your funnel data. No named operators in the proposal. Case studies from adjacent industries with numbers rounded to the nearest thousand. A pitch that leans on ‘AI-driven revenue orchestration’ instead of your actual product and buyer. Any two of those red flags and you keep looking. All five and you have paid for a research project someone else will benefit from.