
A DTC founder that reads platform ROAS as the only signal ends up scaling a channel that quietly kills blended margin two quarters later. The ecommerce marketing metrics that predict scale sit above the platform view. Marketing Efficiency Ratio, blended customer acquisition cost against lifetime value, contribution margin per order, retention rate against second-order timing, and a marketing budget tied to revenue share that shifts by stage. This guide walks each number the way our team reads them on live client accounts from $250,000 yearly revenue up through $30M scale brands across Shopify, Klaviyo, Meta Ads Manager, and Google Ads. Read straight through and finish with the four numbers your Monday plan review should track from now on.
Contribution Margin Inside Ecommerce Marketing Metrics
Contribution margin per order is the number every operator reads before deciding whether a marketing test scaled cleanly. Revenue minus cost of goods sold minus fulfillment minus payment processing minus blended marketing cost per new order. A brand doing $80 average order value at 65% gross margin with $9 fulfillment, $2.50 processing, and $19 in blended marketing cost runs contribution margin at $21 or 26% of revenue. That’s the number that pays payroll and funds reinvestment, not the top-line revenue number the founder posts on LinkedIn.
Contribution margin math drives every real return on investment call, so it captures the trade-off between offer design and channel cost. A $10 off welcome offer that improves prospecting conversion by 18% but pushes average order value down 12% might improve contribution margin or destroy it, based on the input numbers. A retention flow rebuild that improves second-order rate from 22 to 31% shifts the payback window from 6 months to 4, which changes the customer acquisition cost the brand can afford. Founders that skip contribution margin math end up running channels that look profitable on the platform view yet the whole account bleeds slowly.
Payback windows sit inside contribution margin discipline. A payback window under 90 days means a new customer pays back acquisition cost inside 3 months of retention revenue. That’s the bar for consumable and beauty categories with fast reorder cycles. Apparel and home goods run payback windows of 120 to 210 days based on category cadence. Founders that shorten payback windows through retention flow improvements usually free up 15 to 25% of budget for reinvestment inside 2 quarters. Read the operational side inside the ecommerce marketing plan template that walks the plan-and-forecast rhythm.
One more layer sits under contribution margin. Blended Marketing Efficiency Ratio (MER) reads total ecommerce revenue divided by total marketing spend across every channel, ad platform, and creative budget line. A brand at 3.0 MER earns $3 of revenue for every $1 of marketing spend and keeps a healthy contribution margin at most category price points. Below 2.0 MER, the paid mix is likely subsidizing warm audiences that would have bought without any ads. Above 5.0 MER, the brand is usually underspending on prospecting and leaving growth on the table. Reading MER against contribution margin per order pins the truth of paid contribution inside your ecommerce marketing metrics stack.
Retention Rate and Second-Order Timing in Ecommerce Marketing Metrics
Retention rate at 30, 60, and 90 days is the leading indicator for lifetime value long before the 12-month window closes. A skincare brand at 18% day-30, 28% day-60, and 34% day-90 signals a healthy retention flow that earns back acquisition cost inside 120 days. A brand at 8%, 12%, and 15% across the same windows will struggle to hold Marketing Efficiency Ratio above 2.5 no matter how well the paid side runs. Retention numbers move slowly, so founders that check them monthly, not weekly, avoid over-reacting to noise.
| Category | 30-day retention | 60-day retention | 90-day retention | Payback window |
|---|---|---|---|---|
| Coffee and consumable food | 22 to 32% | 35 to 45% | 42 to 55% | 60 to 90 days |
| Supplements | 18 to 28% | 30 to 42% | 38 to 52% | 75 to 120 days |
| Skincare and beauty | 15 to 25% | 26 to 38% | 34 to 48% | 90 to 150 days |
| Apparel | 8 to 14% | 14 to 22% | 20 to 30% | 150 to 240 days |
| Home goods and decor | 6 to 12% | 12 to 20% | 18 to 28% | 180 to 300 days |
The table pins realistic retention benchmarks across 5 common DTC categories against the payback window each category runs. Founders should read their own numbers against the category range rather than a generic DTC benchmark. A coffee brand at 15% 30-day retention is quietly underperforming even inside a generic DTC target, since coffee should run higher. An apparel brand at 15% 30-day retention sits at the top of its category and can invest more aggressively into acquisition. Category-specific benchmarks stop the trap of judging every brand against the same number.
Second-order timing is the retention number most operators miss inside their ecommerce marketing metrics stack. Second-order rate at day 60 predicts lifetime value curves more accurately than any 12-month cohort math. A supplements brand at 22% second-order rate by day 60 will hit a $180 lifetime value floor inside 18 months. A supplements brand at 8% second-order rate by day 60 will struggle to earn back CAC even with strong prospecting ROAS. Read the second-order number every month and rebuild the day-30 to day-60 lifecycle emails first when the number lags.
Typical Marketing Budget for Ecommerce by Stage
Typical marketing budget for ecommerce brands runs 7 to 15% of yearly revenue by stage. Starter brands under $500,000 yearly revenue spend 12 to 18%, since customer acquisition cost runs heavier before retention flows compound. Growth brands between $500,000 and $2M yearly revenue spend 10 to 14% as second-order rate climbs. Mid-market brands between $2M and $10M yearly revenue spend 8 to 12% with a mix that shifts toward retention plus organic. Scale brands past $10M yearly revenue spend 7 to 10%, so brand demand and repeat cohorts carry the load without paid support.
Why Starter Brands Spend More
Starter brands spend a higher percentage of revenue on marketing, so every incremental dollar of revenue costs more before retention math kicks in. A $250,000 yearly revenue brand testing paid social for the first time might spend 20% of revenue on marketing for a quarter to establish creative that works. Once creative wins, spend as a percentage of revenue drops, and the same channels convert at higher rates against maturing audiences. Founders that skip the higher-spend testing phase try to hit an 8% marketing-to-revenue ratio too early and end up starving demand generation before the brand matures.
Why Scale Brands Spend Less
Scale brands spend a lower percentage of revenue on marketing, so organic search, direct traffic, and retention revenue carry a larger share of monthly revenue without paid support. A brand at $20M yearly revenue with 45% of revenue coming from repeat customers only needs paid marketing to hit the other 55%. That math lets scale brands run 7 to 10% marketing spend against revenue and still grow 20 to 40% year over year. Brands that fail to build the organic and retention side stay stuck at 12 to 15% marketing spend even at $20M revenue.
Ecommerce Marketing Budget Allocation Across Channels
Ecommerce marketing budget allocation shows up on every ecommerce marketing metrics dashboard, so channels shift by stage in a predictable rhythm. Starter brands weight paid social heavier, since it’s the fastest path to first-customer acquisition. Growth brands add paid search and lifecycle email plus SMS. Mid-market brands add organic search, affiliate, and creator content. Scale brands add brand campaigns and international storefront expansion. The channel mix rarely stays static across a fiscal year, since customer acquisition cost drifts on every platform every quarter.
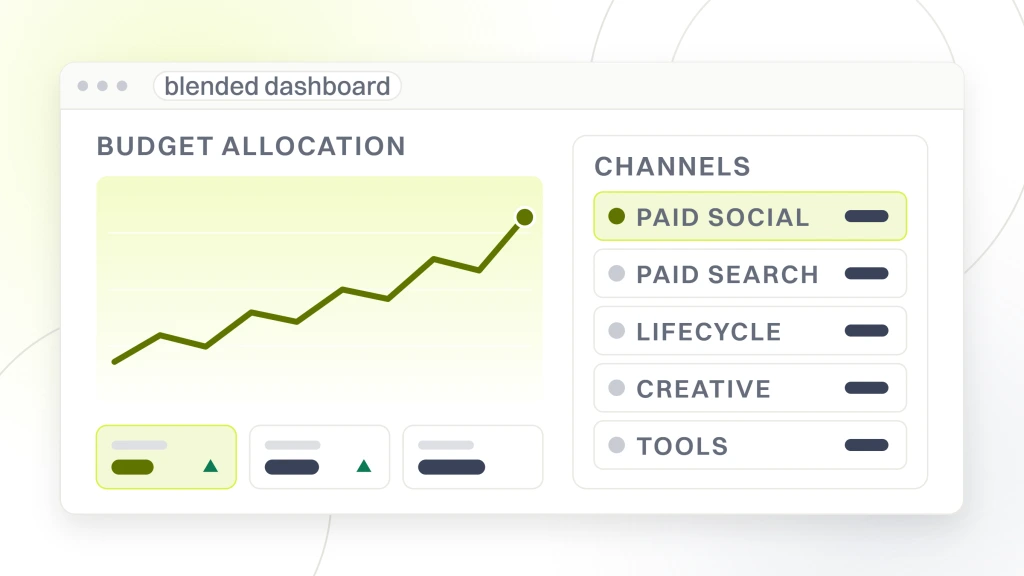
- Starter, under $500K yearly revenue. 55% paid social, 15% paid search, 15% lifecycle, 10% creative, 5% tools.
- Growth, $500K to $2M yearly revenue. 40% paid social, 22% paid search, 18% lifecycle, 12% creative, 8% tools and organic.
- Mid-market, $2M to $10M yearly revenue. 32% paid social, 22% paid search, 18% lifecycle, 12% organic search, 8% affiliate, 8% creative and tools.
- Scale, $10M to $30M yearly revenue. 28% paid social, 20% paid search, 15% lifecycle, 15% organic search, 10% affiliate, 12% brand and tools.
- Enterprise, $30M plus yearly revenue. 25% paid social, 18% paid search, 14% lifecycle, 16% organic search, 12% affiliate, 15% brand and international.
Retainer floors hold across every stage. Redefine Web ecommerce retainers price at $1,499, $2,499, $3,999, and from $6,000 per month based on scope, with ad spend billed separately. Starter brands typically slot into the $1,499 or $2,499 tier with $3,000 to $8,000 in ad spend under a 6-month contract. Growth and mid-market brands slot into the $3,999 or from $6,000 per month tier with $10,000 to $150,000 ad spend. Scale brands run the from $6,000 per month tier with $150,000 to $400,000 ad spend. Retainer covers strategy, creative direction, reporting rhythm, and cross-channel coordination that in-house teams almost never staff. Read the retainer scope inside the ecommerce digital marketing services deep read.
Ecommerce Marketing ROI Strategies That Compound
Ecommerce marketing roi strategies that compound share 3 traits across the DTC accounts we operate. They stack against each other rather than compete for the same budget line. They pay back inside 90 days on a small test and scale over 12 months once the math holds. They anchor on blended Marketing Efficiency Ratio, not platform ROAS. Founders that pick strategies matching those 3 traits stop cycling through trend pieces every quarter and start compounding growth against a repeatable rhythm.
Retention Flow Rebuild First
Retention flow rebuild inside Klaviyo or Attentive is the highest ROI work most DTC brands can run in the first 90 days of a new engagement. Welcome flow, cart abandonment, browse abandonment, post-purchase, day-90 winback, and replenishment for consumable categories together drive 25 to 45% of revenue on healthy brands. Rebuilding a stale flow set usually drops customer acquisition cost 15 to 25% within one quarter, since retention picks up more revenue per acquired customer without any new paid spend. The math is close to guaranteed if the flows have not been touched in 12 months.
Creative Testing Cadence
Creative testing cadence on paid social drives the second largest ROI gain across most accounts. 6 new ad variants weekly, 3 winners rotated into evergreen, and 1 full-funnel creative refresh per quarter keeps prospecting ROAS stable and pulls customer acquisition cost down 8 to 15% quarter over quarter. Brands producing 2 ad variants monthly fall behind competitors producing 6 weekly at similar production cost, since the platform algorithm needs volume to find winners. Creator-generated content licensed at $150 to $400 per asset earns its keep here.
Landing Page Speed and Conversion
Landing page speed sits under every paid channel’s ROAS number. A Shopify storefront that loads in 4 seconds instead of 2 loses roughly 20 to 30% of paid social visitors before they see the offer. Rebuilding the product detail page around a single hero, one clear offer, above-the-fold reviews, and a sticky add-to-cart bar usually pulls conversion rate up 15 to 25% within a month. That gain compounds against every paid dollar for the rest of the year, so the payback window on a $6,000 landing page rebuild sits under 30 days on most accounts.
Cohort-Based Budget Reallocation
Cohort-based budget reallocation is the third ROI move that stacks against retention and creative. Read each acquisition cohort by month, and shift budget toward the channels that produce cohorts with the strongest 90-day retention rate, not just the lowest day-1 CAC. A Meta prospecting cohort at $32 CAC with 12% 90-day retention loses to a Google Search cohort at $48 CAC with 34% 90-day retention on any real ecommerce marketing metrics dashboard. Founders that rebalance quarterly against cohort quality usually pull blended MER up 20 to 40% inside 2 quarters without any new spend.
How Boogie Board Used Ecommerce Marketing Metrics to Scale
Boogie Board, the pioneering reusable writing tablet brand founded in 2009, partnered with Redefine Web to fix a Google Ads account that was burning spend on broad targeting and unoptimized landing pages. Conversion rates suffered, wasted spend piled up, and there was no follow-up path to earn repeat purchases. The account needed a full ecommerce marketing metrics rebuild before any channel tuning made sense.
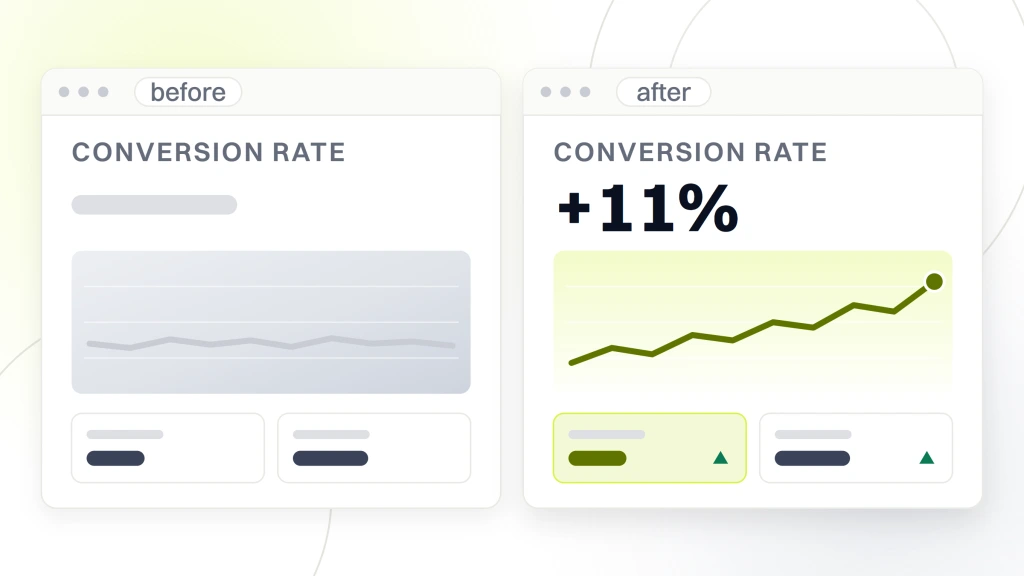
Our team rebuilt the metrics dashboard around blended Marketing Efficiency Ratio, non-branded return on ad spend, contribution margin per order, and retention rate at 30, 60, and 90 days. Paid budget shifted toward tighter keyword targeting on Google and a new LinkedIn Ads test to open a fresh audience. Creative direction pulled toward product-focused lead magnets that captured sustainability and creativity buyer intent. Landing pages got rebuilt around a simpler shopping flow. Retention email got layered with automated follow-ups and retargeting to raise second-order rate.
The results across an annual curve on the rebuilt rhythm. Cost per sale landed at $31 at scale across $650,000 in managed ad spend. Conversion rate climbed 11% on the new landing pages plus refined targeting. ROI stayed positive through the full spend curve, and long-term customer engagement kicked in from the automated follow-up work. Every one of those numbers came out of a metrics rebuild that started with reading Marketing Efficiency Ratio against contribution margin instead of platform ROAS against a benchmark that did not fit the brand. Read the full cross-channel scope inside the ecommerce marketing agency hub.
The Boogie Board rebuild sequence maps to any DTC brand running the same broken pattern. Rebuild the ecommerce marketing metrics dashboard first, so paid, retention, and creative teams all read the same set of numbers. Cut broad match keywords and shift budget toward tighter intent-based targeting. Rebuild product detail pages around a single clear offer. Layer automated post-purchase and winback email against the new traffic. That sequence works on a $250K starter brand and on a $30M scale brand, and the payback window on the full rebuild sits under 90 days on most Shopify and Klaviyo accounts.
Attribution and Ecommerce Marketing Metrics That Hold Up
Attribution sits at the messiest part of ecommerce marketing metrics work. Platform ROAS credits every conversion inside its own view, so a paid social platform and a paid search platform will each claim the same buyer on the same day. That’s how a brand ends up with $180 in reported revenue on a $40 order. Blended MER cuts through the double-counting, since it reads total revenue against total spend without caring which channel got the last click. Layer in a simple post-purchase survey (heard about us from where) as ground-truth marketing mix modeling on a $250K to $10M brand and the attribution picture cleans up fast.
Non-branded ROAS is the second attribution number worth pulling into your ecommerce marketing metrics stack. Split every paid search account into branded and non-branded campaigns. Branded ROAS looks great on every account, so it counts warm-audience buyers searching for the brand name. Non-branded ROAS is the number that measures whether the paid mix is finding real new demand. A brand at 8.0 branded ROAS and 1.6 non-branded ROAS is coasting on brand demand rather than growing the account. Pull non-branded ROAS onto the monthly dashboard next to blended MER.
Where Ecommerce Marketing Metrics Fit Your Stack
Ecommerce marketing metrics fit your stack as the layer that decides every budget conversation, every channel scale call, and every quarterly plan review. A brand without a shared metrics rhythm across paid, retention, and organic ends up running 3 channel teams against 3 different definitions of success, and the founder gets pulled into every debate. A brand with a shared rhythm runs a monthly plan review off one dashboard everyone reads the same way, and the debate becomes which lever to pull rather than which number to trust.
The reporting cadence that works. A weekly channel scorecard covering paid social, paid search, and lifecycle. A monthly blended dashboard covering Marketing Efficiency Ratio, blended customer acquisition cost, contribution margin per order, and retention rate at 30, 60, and 90 days. A quarterly cohort review covering lifetime value curves and category-specific benchmarks. Brands that run all three cadences with a named owner per report stop the Friday-afternoon-question-from-the-founder cycle that eats 4 to 8 hours of the marketing team every week. The Shopify ecommerce analytics guide is a useful outside read for the reporting side.
Book Your Ecommerce Marketing Metrics Audit
Founders ready to rebuild ecommerce marketing metrics against real numbers can start with a free audit of the current dashboard, channel mix, and reporting cadence. That audit produces a written priority order before any retainer conversation opens. Whether the brand runs a Shopify starter at $250,000 yearly revenue or a scale account past $30M, anchoring on Marketing Efficiency Ratio, contribution margin per order, and retention rate beats chasing platform ROAS every quarter of 2026. Book a free audit to walk your metrics dashboard against category benchmarks and get a written priority list in your inbox before any retainer conversation opens.