Every ecommerce founder reading a trends piece this quarter wants the two moves that pay back inside 90 days, not the ten shiny bets that drain the marketing budget without earning. This guide covers ecommerce marketing trends 2026 the way we run them for DTC clients from $500K yearly revenue up through $30M scale brands. Five real shifts sit under the noise. AI in commerce as a retention and product-data play, the retention economy replacing prospecting-only scaling, social commerce as a checkout inside TikTok Shop, Instagram, and YouTube, headless plus composable stacks past $8M yearly revenue, and first-party data collection through quiz flows and loyalty tiers. Everything else the trend pieces list this year sits inside one of those five buckets or dies quietly by Q3. Read straight through in twelve minutes and finish with the two trend bets that fit your brand stage plus the six picks worth skipping so you don’t burn a fiscal quarter chasing publications rather than customers.
What Drives Ecommerce Marketing Trends 2026
Three forces drive ecommerce marketing trends 2026 for DTC brands. Rising customer acquisition cost on Meta and Google. Consumer buying moving inside social apps rather than search-then-visit journeys. Privacy rules that keep chipping away at third-party data. The trend list every publication runs is downstream of those three forces.
A founder that starts with the forces picks trend bets that hold for two to three years rather than the six-month hype cycle a competitor spent $80,000 chasing without a plan review to check the math against real account numbers monthly.
Customer acquisition cost on Meta rose 12% to 18% through 2025 across our client accounts serving apparel, beauty, and home goods. Google Shopping cost per click on brand-adjacent commercial terms rose 8% to 14% in the same window. The math forces two adjustments. Either the average order value climbs to hold contribution margin, or the retention flywheel picks up the difference through second and third orders. Founders that pretend the acquisition cost trend is temporary keep funding a spend line that never earns back on the first order.
Consumer buying shifting into social apps is the second driver. A TikTok user watching a creator review does not click out to a Chrome tab and search the brand name. The user taps the shopping surface inside the app and buys in the same session. Instagram Shopping runs the same pattern for beauty and apparel buyers under 40. YouTube Shopping picks up mid-funnel consideration for higher-ticket goods past $200 average order value. Brands that pretend social commerce is a small add-on channel miss where the revenue goes. Our take on channel play sequencing lives inside the ecommerce marketing strategies deep read.
AI in Commerce Inside Ecommerce Marketing Trends 2026
Where AI Earns Its Keep
AI in commerce earns its keep in three concrete jobs, not the vague future every LinkedIn post promises. Retention flow copywriting inside Klaviyo where welcome, cart, browse, and winback flows get rewritten monthly against real open, click, and revenue data. Product data enrichment where the hero copy, alt text, and structured Product schema get generated from a spec sheet and reviewed by a merchandising human. Creative variation for paid social where one brief produces six on-brand ad variants for the buyer to rank. Any founder buying an AI tool that promises to run the whole marketing team is buying a demo, not a product.
Fund only two trend bets a year, at 15% to 20% of marketing spend each. More than two fractures team focus and starves core channels.
What the Team Still Owns
The team still owns brand voice, offer design, media mix decisions, creative direction, and merchandising judgment. AI shortens the drafting step inside each of those jobs by 40% to 70% based on the work we run on live client accounts. A copywriter that drafted five product pages in a week now drafts fifteen and reviews the AI first pass. A media buyer that wrote six ad variants weekly now reviews twenty and picks the top five. The output goes up. The judgment stays with the human. Founders that skip the review step push AI slop live and erode brand trust inside 90 days.
The Retention Economy Reshapes Ecommerce Marketing
The retention economy is the second real driver behind ecommerce marketing trends 2026. Buying math shifts from cost per acquired customer alone to lifetime value divided by cost per acquired customer. That ratio drives every channel budget past $2M yearly revenue. Brands running the ratio below 3.0 break unit economics inside six months on most category profiles we audit. Brands running the ratio above 4.5 hold the room to fund creative testing and channel exploration without starving the core channels that carry monthly revenue.
Winback and Replenishment Carry the Line
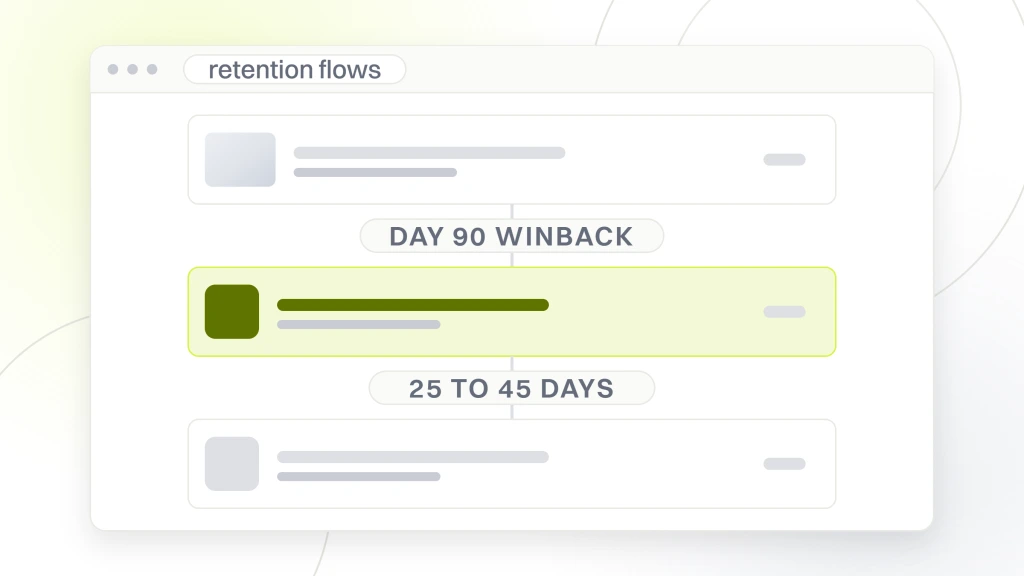
Winback flows triggered at day 90 without a purchase recover 4% to 12% of lapsed buyers across the DTC accounts we run. Replenishment flows triggered at the expected reorder window for consumable products, usually 25 to 45 days after purchase, drive 15% to 30% of second-order revenue. Loyalty tier flows for the top 5% value customers carry monthly touchpoints that keep the highest-margin buyers active. Brands that skip these three retention flows are the same brands that spend the first six months of 2026 wondering why blended return on ad spend keeps sliding down the chart.
Subscription Mechanics Where They Fit
Subscription mechanics fit some categories and break others. Coffee, supplements, pet food, and skincare with a real reorder cadence make subscriptions a natural fit that drives 25% to 40% of revenue at healthy brands. Apparel, home goods, and one-time purchase categories force subscriptions into a shape that does not match buyer behavior and produces high churn inside 90 days. Founders adding subscriptions to a category that does not support them waste three months of engineering and marketing scope. Our best practices for ecommerce marketing deep read walks the retention side across paid, organic, and CRM together.
Social Commerce and the Latest Ecommerce Marketing Trends
Social commerce inside TikTok Shop, Instagram Shopping, and YouTube Shopping is the third real shift on the latest ecommerce marketing trends list. The framing that helps founders decide budget is plain. Social commerce is a checkout, not a channel. Discovery still runs through creator content, paid social, and search. The buy step moves inside the app. Brands that structure the split correctly capture 5% to 15% of social-attributed revenue on smaller accounts and 20% to 35% on beauty and apparel brands past $3M yearly revenue.
| Surface | Best category fit | Feed setup | Priority KPI | Share of DTC revenue |
|---|---|---|---|---|
| TikTok Shop | Beauty, apparel, viral home goods | Shop tab plus creator affiliate | Cost per acquired customer under $18 | 5% to 20% at eligible brands |
| Instagram Shopping | Beauty, apparel, jewelry | Product tags in Reels and posts | Return on ad spend 3.0 plus | 3% to 12% |
| YouTube Shopping | Higher-ticket goods, tech, tools | Shopping shelf plus creator tags | Assisted conversions | 2% to 8% |
| Pinterest Shopping | Home goods, wedding, decor | Product-rich pin catalog | Save-to-purchase rate | 2% to 6% |
| Meta Shops | General DTC | Catalog sync with Shopify feed | Blended ROAS | 1% to 4% (weak on iOS) |
The table lines up each surface against the category fit, feed setup work, priority number, and the realistic share of revenue we see on live client accounts. Founders picking a surface should start with the category fit column before anything else. A hardware store owner testing TikTok Shop against home tools burns three months on a surface built for viral beauty and apparel. A candle brand starting with YouTube Shopping misses the discovery-to-buy pattern that runs on Instagram Reels far better for the price point.
Headless and Composable Stacks in 2026
Where Headless Earns Out
Headless plus composable stacks earn out past $8M yearly revenue on most DTC brands we audit. Under that threshold, a monolith Shopify or a well-tuned Shopify Plus setup wins on speed to change and total cost of ownership. Past $8M yearly revenue, the pain of monolith trade-offs starts showing up as slow product data pipelines, weak international storefront support, and CMS choices that limit content team velocity. A headless swap adds the flexibility without giving up the checkout maturity that Shopify already runs at scale.
If your brand sits under $8M yearly revenue, skip the headless replatform. Shopify Plus wins on speed and total cost of ownership.
What the Composable Stack Includes
The composable stack a growth-stage brand runs usually includes Shopify Plus or Commercetools on the commerce layer, Contentful or Sanity on the content layer, Algolia on search, Segment or RudderStack on the customer data platform side, and Klaviyo on lifecycle. Adding Optimizely or VWO for experimentation rounds out the setup. A team of two engineers plus a technical marketer can operate the stack once the pipeline runs. Founders shopping headless below $5M yearly revenue burn engineering budget on a scope that does not pay back for another two years. The migration itself runs six to nine months across product data cleanup, storefront rebuild, and staging QA. Rushing that window produces bugs the customer support inbox gets to catch every morning for a quarter. Read our take inside the ecommerce digital marketing strategy deep read.
First-Party Data Inside Ecommerce Market Trends
First-party data is the fourth real shift on the ecommerce market trends list. Third-party cookies keep degrading, Apple keeps tightening tracking on the iOS side, and platforms keep raising the cost of the audience data brands once got for free. The response that works is to build owned data collection into every buyer touchpoint. Quiz funnels on top of category pages. Loyalty programs that trade points for zero-party preference data. Post-purchase surveys that feed back into segmentation. Email plus SMS marketing for ecommerce lists that grow every week rather than sit at last quarter’s total.
Zero-Party Data Through Quiz Flows
Quiz flows on category pages collect zero-party data buyers hand over in exchange for a product recommendation. A skincare brand asks skin type, primary concern, and routine cadence. A supplement brand asks health goal, current stack, and dietary preference. A pet food brand asks pet type, breed, and life stage. The quiz output feeds Klaviyo segmentation, drives personalized welcome flow content, and improves paid ad targeting through lookalike seeds off the quiz-completer segment. Brands running quiz flows at scale grow email list capture rates from 2% to 5% baseline up to 12% to 18% inside 60 days. That data compounds every quarter.
Loyalty Programs That Trade Points for Data
Loyalty programs run on Smile, Yotpo, LoyaltyLion, or a Shopify Plus custom setup. The programs work when the point-earn mechanics match buyer behavior. Points for purchases, referrals, product reviews, and account updates like skin type or shoe size. The account update earn mechanic is the zero-party data play a founder should copy fast. A buyer trades a data point for 50 loyalty points. That data point drives a year of better segmentation on the retention side. Loyalty programs that only reward purchases waste half their strategic value.
Video Content Inside 2026 Ecommerce Marketing
Video content sits inside the ecommerce marketing trends worth funding this year as the format that dominates both discovery and paid social. Static ads still work on the retargeting side and inside display placements. Prospecting spend on Meta and TikTok performs 30% to 60% better on video marketing for ecommerce versus static across the accounts we run. The math forces founders to fund video production at a rate they usually did not budget for two years ago. A brand producing four static ad variants weekly and one video quarterly falls behind the brand producing six video variants weekly at similar production cost.
Any product with a use-in-motion demo earns video on its page. Static-only product pages leave 8% to 22% of conversion rate on the floor.
Short-form video production cost has dropped through 2025 through two shifts. Creator-generated content licensed at $200 to $800 per asset covers the bulk of prospecting creative for beauty and apparel brands. In-house iPhone-shot production runs weekly for founders willing to appear on camera or hire a $600-a-day producer. AI-generated video variants layer on top for testing hooks at scale before committing to a full-cost creator brief. The blend covers a full creative pipeline at 40% to 60% of the cost a brand paid in 2023 for the same output volume.
Video content also drives landing page and product page conversion when embedded above the fold or inside the gallery. Conversion rate on product pages with autoplay video demos runs 8% to 22% higher versus static-only pages across the brands we test. The rule of thumb. Any product with a use-in-motion demo (skincare, apparel, tech, home goods) earns video on the page. Any product a buyer already understands from a photo alone (basic apparel, staple food) does not. Our marketing ideas for ecommerce brands read walks the creative side per category.
Personalization Across the Future of Ecommerce Marketing
Personalization has been a trend piece talking point for a decade, but the 2026 version means something concrete for DTC brands. Personalization now means dynamic product recommendations on the homepage, category pages, and post-purchase page keyed to buyer segment, past purchase history, and quiz output. Static homepage carousels get retired. Category page filter defaults get set per segment. Post-purchase upsells match the segment’s next likely purchase rather than a static bestseller.
The technology stack for personalization at growth-stage brands runs on Shopify Sections plus a personalization app like Rebuy, Nosto, or Dynamic Yield. Klaviyo drives email plus SMS segment personalization off the same customer data. Meta and Google use custom audience uploads keyed to the segments the brand already runs on the site. A unified segment definition across the whole stack is what makes personalization work rather than every tool running its own segment logic that never lines up.
Founders that personalize badly hurt conversion rather than help it. Product recommendations pulled from a stale customer data feed produce awkward mismatches between the buyer and the offer. Homepage variants tuned to segments too small to reach statistical significance introduce noise the merchandising team cannot read. The rule of thumb. Personalize where the segment has more than 500 monthly sessions and the offer difference matters. Below that threshold, run a single strong page.
What Should You Skip From Ecommerce Marketing Trends 2026
Skip Web3 wallet checkouts, NFT loyalty programs, metaverse storefronts, live streaming for most Western DTC categories, voice commerce past search intent, and any AI tool that promises to run the whole marketing team without review. None of these six earn revenue inside 90 days for the DTC brands we serve today.
Founders that fund experiments across all six lose a quarter of budget chasing publications rather than customers. Trend picks worth funding return revenue in the first 90 days or the second one at the latest. The six above rarely clear either window.
Live streaming worked in China through a distinct social buying culture that did not translate cleanly to Western markets past the pandemic push. TikTok Live commerce shows a small tail of results in beauty and apparel, but the labor cost of running live production every day rarely pays back for brands under $5M yearly revenue. NFT loyalty programs quietly died through 2024 as the underlying token markets collapsed. Voice commerce settled around Alexa reorders for specific consumable categories and never became the general shopping surface the trend pieces promised.
The trend that reads exciting on a founder’s LinkedIn feed at 11 PM is rarely the trend that pays the sales team’s commission the following quarter. The trend that pays runs quietly in the corner of the account, moves a real number like return on ad spend or blended contribution margin, and shows up in the monthly plan review as a line item with a name next to it. Founders that learn the difference save $50,000 to $200,000 in trend-experiment spend across a fiscal year.
How Boogie Board Ran Ecommerce Marketing Trends Early
Boogie Board, an ecommerce brand in the reusable writing tablet category, partnered with Redefine Web to fix a Google Ads program that was burning spend on low-intent traffic and losing repeat buyers to weak nurturing. The account matched several of the trend bets sitting at the top of the 2026 list before those trends had names attached.
The plan ran three parts in parallel. Rebuilt keyword targeting and landing page copy on the paid search side so shoppers hit pages that showed the product benefit clearly. LinkedIn Ads added on top to reach an education buyer segment the Google account was missing. Automated email follow-ups plus retargeting built on the lifecycle side to pick up the second-purchase revenue that had been leaving on day 45.
The results on a $650,000 managed ad budget. Cost per sale landed at $31, holding through the annual curve. Conversion rate climbed 11% over the pre-partnership baseline. Return on ad spend held positive across the full spend, and long-term customer engagement grew as the retention side finally caught the repeat buyers the paid side was earning. Every one of those numbers came out of trend bets that sit near the top of the 2026 list a founder is reading today. Read the full case study on the Boogie Board case study page.
What made the Boogie Board account work under trend-driven scope was scope alignment. Paid and lifecycle ran under one plan with one account team that pulled organic keyword data into paid targeting and paid audience learnings into email flow planning. That cross-channel loop rarely happens when a brand runs three specialist agencies against three separate scopes. That’s why our ecommerce marketing agency hub sells full-stack scope over deep-single-channel work at the growth and mid-market tiers.
How to Pick Trend Bets From Latest Ecommerce Marketing Trends
Pick two trend bets per year, fund each at 10% to 20% of total marketing spend, and run a 90-day measurement window on each. Two bets is the ceiling that keeps the team focused. More than two fractures attention across too many surface areas and starves the core channels that carry the revenue number today.
Stage-Fit Rules the Pick
Stage-fit rules the pick, so the trends behave differently at different revenue tiers. A starter brand at $500K yearly revenue picks quiz flow first-party data plus creator-content social commerce. A growth brand at $2M yearly revenue picks retention economy investment plus zero-party loyalty data. A mid-market brand at $8M yearly revenue picks headless replatform plus AI in commerce for retention flow personalization. Every brand skips at least three trends that sound exciting but do not fit the current stage.
- Starter, under $500K yearly revenue. Quiz flows for first-party data plus creator content for TikTok Shop discovery.
- Growth, $500K to $2M yearly revenue. Retention flow rebuild plus loyalty program with zero-party data collection.
- Mid-market, $2M to $10M yearly revenue. AI in commerce for retention personalization plus social commerce checkout expansion.
- Scale, $10M to $30M yearly revenue. Headless plus composable replatform plus first-party data warehouse investment.
- Enterprise, $30M plus yearly revenue. Full-funnel personalization plus international storefront expansion under composable stack.
The 90-Day Measurement Window
Every trend bet gets a 90-day measurement window with a named owner, a primary KPI, and a kill decision. A quiz flow bet measures against email list capture rate growth plus quiz-completer segment ROAS growth. A social commerce checkout bet measures against social-attributed revenue share plus cost per acquired customer inside the surface. A retention economy bet measures against second-order rate growth plus lifetime value to customer acquisition cost ratio growth. Any bet that does not move its primary KPI inside 90 days gets killed and the budget goes back to the core channels.
Budget Math Under Ecommerce Marketing Trends 2026
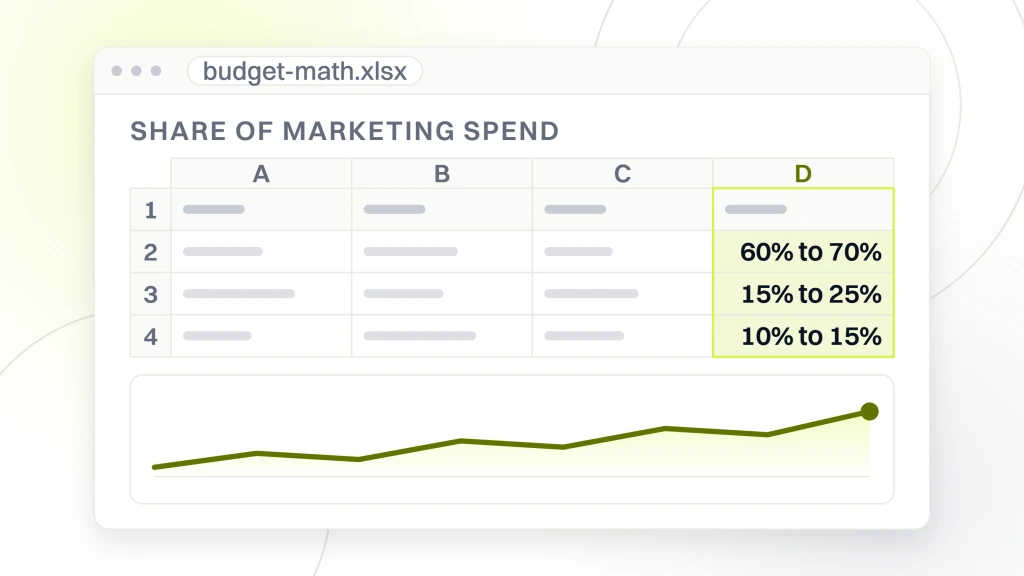
Trend spend usually gets fought over inside a marketing budget that already has commitments across paid media, retainer, software, and creative production. The rule of thumb we run with clients. 60% to 70% of total marketing spend goes to core channels (Meta, Google, email, SMS, ecommerce SEO). 15% to 25% goes to two trend bets running against the 90-day measurement rule. The remaining 10% to 15% covers software stack, creative production, and reserve. Budget that does not split cleanly across those buckets almost always overspends on a trend that does not pay back and underspends on the retention flows that quietly carry revenue every month.
Retainer floors hold across the trend picks. Starter and growth brands pair a $999 or $1,499 monthly SEO or PPC retainer with $3,000 to $30,000 in ad spend. Mid-market brands run a $2,499 monthly retainer with $30,000 to $150,000 ad spend. Scale brands run from $4,500 per month upward on the retainer with $150,000 to $400,000 ad spend. Trend bets sit inside those totals. A starter brand adding a $2,000 monthly trend bet needs to defend the trade-off against the same $2,000 that could fund extra Meta creative testing.
Software stack under trend spend usually gets ignored until the invoice hits. AI copywriting tools run $200 to $800 monthly. Personalization apps run $500 to $3,000 monthly at scale. Loyalty program apps run $200 to $1,000 monthly plus percentage fees. Customer data platform setups run $2,000 to $12,000 monthly at growth and mid-market tiers. Founders that add three new software lines in a quarter without pruning legacy tools double stack cost inside 18 months. Read our take inside the ecommerce digital marketing services retainer scope.
Where Ecommerce Marketing Trends 2026 Fit Your Stack
Ecommerce marketing trends 2026 fit your stack on top of a foundation of paid media, lifecycle email plus SMS, and ecommerce SEO that already runs to plan. Trend bets on top of a broken foundation waste the trend money and the foundation money together. Founders that fix the retention flows, the reporting rhythm, and the creative pipeline first end up with trend bets that pay back cleanly, since the underlying account structure supports the test.
The plan-first pattern beats the trend-first pattern every quarter. Founders that run a monthly plan review against real client numbers know which trend to add and which to skip, since the plan tells them which channel is behind. Founders that skip the plan review chase trend pieces for lack of any other signal to pick from. The Shopify commerce trends report is an outside read worth keeping on hand alongside the trend picks in this guide.
Founders ready to run trend bets against real brand numbers can start with a free audit of the current channel mix, spend, and reporting rhythm. That audit produces a written trend-pick priority order before any retainer conversation opens. Read our ecommerce marketing plan template for the operational sibling to this trend read. Whether the brand runs a Shopify starter at $200,000 yearly revenue or a scale account past $20M, the two-trend-bet rule under a plan-first foundation wins over the shiny-object pattern every quarter of 2026. Book the audit through the form on the sidebar and get the priority order back inside a week.