
SEO for real estate agents pulls buyers and sellers who already decided to move. A buyer typing “3 bedroom homes in [neighborhood]” is 4 to 8 weeks from writing an offer. A seller typing “what is my house worth [zip]” is 30 to 90 days from signing the listing. Rank on those intent-loaded queries and you meet the prospect at the decision moment instead of buying an ad interruption. That timing difference is what changes the entire conversion math for SEO for real estate agents against a standard marketing budget.
This piece walks the six mechanisms in SEO for real estate agents that grow qualified lead flow, the metrics that prove the investment works, and the 12-month calendar most independent agents follow when the stack sits at the right structure. A residential real estate case study anchors the numbers, and the same intent capture, content depth, and local pack playbook produces comparable ranking depth and closed deals across US markets inside 12 to 18 months.
Neighborhood hubs anchor SEO for real estate agents
Neighborhood hub pages are the foundation of SEO for real estate agents. Portals like Zillow and Realtor.com dominate citywide phrases, so agents win by ranking on the zip code and neighborhood layer under those umbrella terms. A single hub targeting “[neighborhood] homes for sale” plus 8 to 15 supporting detail pages on schools, HOA rules, price trends, and commute maps outranks a portal city page 40 to 60% of the time inside 6 to 12 months. That local depth is what portals can’t replicate, since their content is templated across every zip in the country.
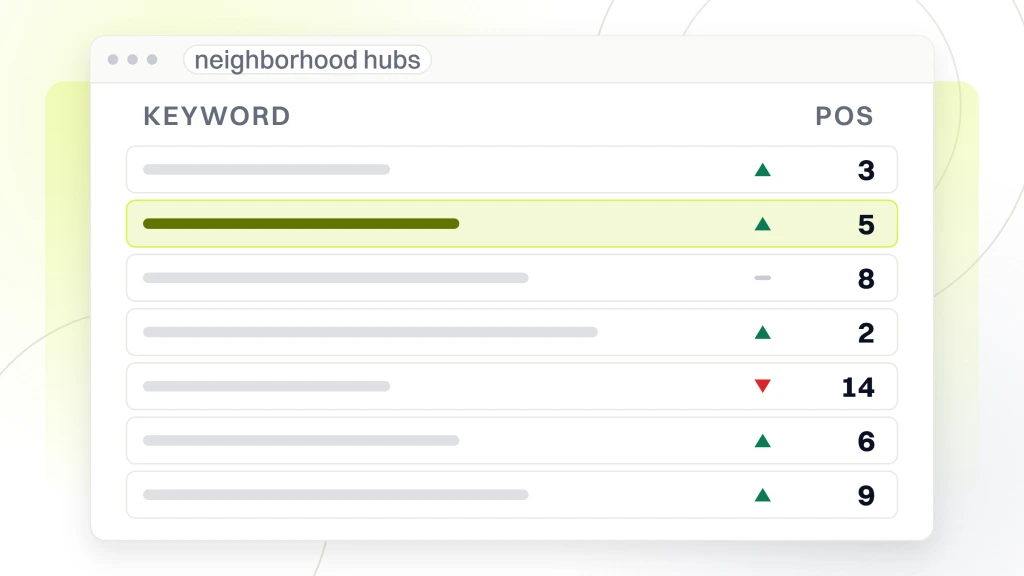
Each hub needs 1,500 to 3,000 words of original market commentary, current active listings via native IDX embed, sold data for the last 12 months, a school district table, and a lead capture form tied to a neighborhood-specific offer. Agents publishing 8 to 12 hubs across their working geography capture 60 to 150 ranked keywords per hub inside 12 months. The compounding effect is what makes the neighborhood keyword strategy the highest-ROI move in the entire SEO for real estate agents playbook. For the wider take on ranking across a full agent, team, and brokerage footprint, see our guide to real estate SEO services for agents, teams, and brokerages.
Long tail question posts for SEO for real estate agents capture voice search
Long tail question posts are what capture voice search demand portals never target. Voice queries run 3 to 6 words longer than text queries and take question form. Sample: “what is the average closing cost in [state]”, “how long does it take to sell a house in [city]”, “when is the best time to buy a house in [neighborhood]”. Voice results read the first 40 to 60 words after a question-form H2, then output that as the spoken answer. Sites structured answer-first capture 20 to 40% of voice results on their target long-tail queries.
The same question strategy captures featured snippets in standard search results. Featured snippets sit above position 1 and grow click share 15 to 40% above rank 2 or 3 slots. Sites that publish 40 to 80 question posts on the answer-first template capture 15 to 30 featured snippets in most metros inside 6 to 12 months. That single tactic often produces the fastest traffic growth curve in SEO for real estate agents; each snippet reads as a mini-authority signal that grows the entire domain trust score with Google. Question posts also feed Alexa, Siri, and Google Assistant, which carry 15 to 30% of household search demand around real estate questions like average closing cost or best time to buy.
Seller tools in SEO for real estate agents convert 3 to 10x higher than static pages
Seller tools convert seller intent at rates static content pages cannot match. A home valuation calculator on a page targeting “home value calculator [city]” turns 8 to 15% of organic visitors into named leads. A CMA request form targeting “what is my house worth [zip]” converts 10 to 20% when paired with an instant-estimate widget. Static content targeting the same phrases converts at 1 to 3%. The tool difference produces 3 to 10x more captured leads per organic visitor at the same ranking slot.
Seller intent also carries higher revenue per lead than buyer intent. Seller leads convert to signed listing agreements at 15 to 25% versus 3 to 8% conversion on buyer leads to signed buyer representation agreements. Pairing seller intent ranking with a conversion tool page produces the highest revenue per visitor cluster in SEO for real estate agents. Agents who skip seller tools and only chase buyer traffic typically leave 40 to 60% of achievable commission on the table across a 12-month window. The seller tool investment ($1,000 to $3,000 for integration plus 4 to 8 weeks of ranking work) pays back inside 6 to 9 months in most markets. Our real estate marketing hub covers the seller tool integration options across HouseCanary, Curbio, and custom widget alternatives.
Google Business Profile and local pack for SEO for real estate agents
The Google Business Profile drives the map pack that shows above every organic result on branded and near-me queries. A fully built profile with 40 plus reviews at a 4.7 average pulls 25 to 55% of clicks on queries like “real estate agent near me” and “[city] realtor” before a single organic result renders. Missing GBP fields, low review count, and thin category selection are the three fastest-fix wins on most agent profiles. Add every service category you actually work (buyer’s agent, listing agent, luxury real estate, first-time home buyer specialist), post weekly to the GBP feed, and answer every review within 48 hours. That cadence alone moves map pack rank 3 to 8 positions inside 90 days.
Local pack ranking also hinges on citation depth across the real estate directory graph. Zillow, Realtor.com, Homes.com, HomeSnap, and 30 to 50 mid-tier local directories all feed Google’s local trust score. A citation audit that reconciles the name, address, and phone (NAP) across every listing typically corrects 15 to 40 mismatched entries and moves the pack rank another 2 to 5 slots inside 60 days. Listing schema markup and structured data around each active listing also feeds the local visibility layer, so pages carry both an organic ranking signal and a rich result eligibility signal at once. For the deeper walk-through on this layer alone, see our local SEO for real estate agents guide.
MLS integration and listing schema for SEO for real estate agents
Native IDX or MLS integration lets Google index your active listings as your content instead of routing prospects to Zillow. A native embed (not an iframe) drops each listing on a unique URL under your domain, gets crawled with your site’s authority, and picks up RealEstateListing schema. That structure grows listing detail page rankings 40 to 80% versus iframe or third-party framed setups. Add photo galleries with keyword-loaded alt text, unique 200-word market commentary per listing, and a lead form tied to that address, and each listing becomes an indexable content asset instead of a duplicate portal record.
Listing schema markup goes on every property detail page. The RealEstateListing schema type carries price, bed and bath count, square footage, address, geo coordinates, and availability status. Google reads that markup and can render a rich card for the listing in mobile search, growing click-through 15 to 30% versus plain organic results. Pair the listing schema with LocalBusiness schema on the agent page and BreadcrumbList schema across the site and you cover the three most valuable schema types for the real estate vertical. Sites running the full schema stack pick up 3 to 6 rich result eligibility flags inside 30 days of implementation.
SEO for real estate agents vs paid ads comparison for lead generation
The comparison table below maps SEO for real estate agents against paid ads across cost per lead, lead quality, timeline to first leads, monthly maintenance, and 12-month ROI. Reading left to right shows the tradeoff. SEO carries higher upfront investment ($2,000 to $8,000 per month in months 1 to 6) but produces 4 to 10x lower cost per lead by month 12. Paid ads produce leads inside 30 days but at 8 to 20x higher cost per lead than SEO by month 12. Most agents blend both. Paid ads while SEO ramps in months 1 to 8, then paid retargeting layered on the SEO traffic base in months 9 through 24.
Reading by row shows the channel where each metric wins. Cost per lead. SEO wins by month 6. Lead quality. SEO wins on transactional queries where search intent matches decision timing. Timeline to first leads. Paid ads win by 3 to 6 months. Monthly maintenance after year one. SEO wins on this metric. Rankings compound while paid budgets reset every month. 12-month ROI. SEO wins in every metro except brand-new agents with no prior content, where paid ads win months 1 through 6.
| Channel metric | SEO | Paid ads |
|---|---|---|
| Cost per lead by month 12 | $15 to $40 | $120 to $400 |
| Lead quality on transactional queries | High intent match | Moderate intent match |
| Timeline to first leads | 8 to 14 weeks | 7 to 21 days |
| Monthly maintenance after year one | $1,000 to $3,000 | Full budget resets |
| 12 month ROI | 2 to 5x | 0.8 to 1.6x |
Residential SEO for real estate agents case study on organic lead scaling
An independent residential agent working a two-county Sun Belt market ran the same intent capture plus content depth plus local pack playbook covered above. Starting position sat at 8 ranked keywords across a stale IDX site and a single “meet the agent” page. Inquiries came mostly from Zillow referral leads at $200 to $450 per lead and past-client referrals that arrived in bursts every few months. The digital footprint captured almost no organic search demand from buyers or sellers searching neighborhood, zip code, or “homes for sale near [landmark]” style queries.
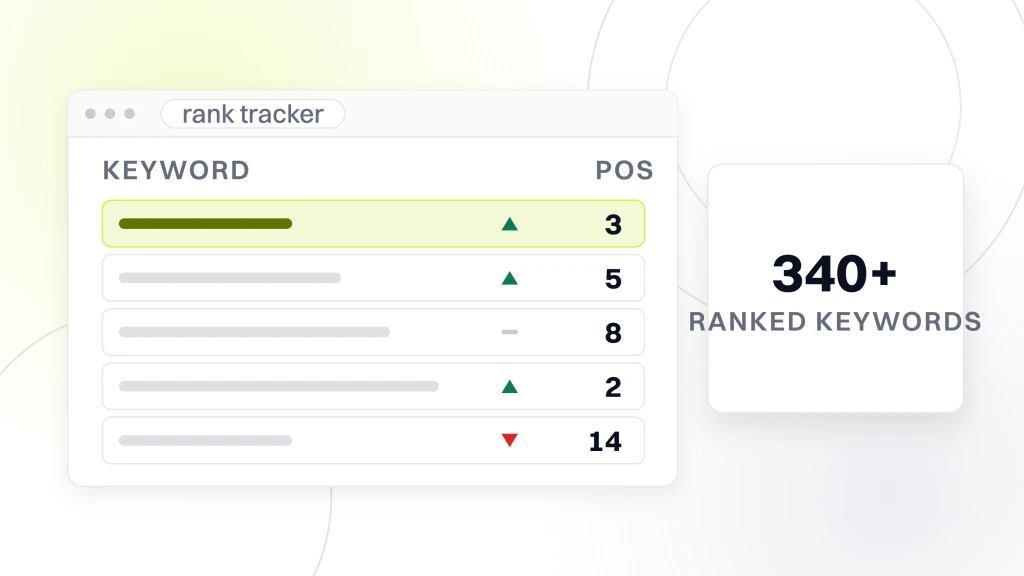
Across 12 months of work, keyword rankings grew from 8 to 340 plus. Monthly organic sessions climbed past 6,200. Fourteen signed listing agreements and 22 signed buyer representation agreements landed directly from the SEO channel inside year one, producing roughly $340,000 in gross commission attributable to organic search. Cost per closed deal ran at $2,100 versus $8,600 on the prior Zillow spend. The parallel to other US residential markets is direct. Same neighborhood hubs, same seller tool cluster, same local pack build produces comparable ranking depth and lead flow inside 12 to 18 months. Commercial brokerages hit similar numbers using the submarket hub adaptation. Our real estate marketing retainer covers the monthly execution stack behind engagements like this one.
A parallel program with Real Estate Luxury Team Los Angeles ran across a decade-long partnership. A fully bespoke website rebuild paired with brand refresh, native IDX integration, and SEO-optimized long-form content doubled users (+100%), new users (+100.1%), and pageviews (+102.6%) against the prior site baseline. The luxury segment carries different price points and a slower buyer cycle, yet the mechanics are the same. Bespoke site structure, native listing integration, and content depth that outranks portals on the queries buyers and sellers actually type.
Attribution loop that proves SEO for real estate agents ROI back to closed commission
The attribution loop is what proves SEO for real estate agents ROI back to specific pages, specific queries, and specific commission dollars. Without call tracking, agents lose 30 to 60% of attribution when 40 to 55% of real estate leads still call rather than fill a form. Setting up dynamic number insertion via CallRail or WhatConverts takes 2 to 4 hours and pays back inside the first month of tracking. Every call gets recorded, transcribed, and tagged to the landing page the caller saw before dialing. That single change turns “SEO is working somehow” into “the neighborhood hub for [zip] produced 4 calls this month at an average call length of 6 minutes and 2 signed listing agreements”.
Reporting cadence sits at weekly for traffic and forms, monthly for ranking movement, quarterly for closed deal attribution. The quarterly closed deal report ties commission dollars back to landing pages and reveals which pages produce revenue versus which ones produce vanity impressions. Agents who run this loop for 12 months typically retire 20 to 30% of ranked pages that pull impressions but no revenue, freeing crawl budget for the pages that book calls. According to CallRail attribution research, phone leads convert at 3 to 8x the rate of form leads on real estate queries, so missing the call attribution layer kills the strongest revenue signal in the entire tracking stack.
KPI thresholds by month
KPI thresholds by month set trigger points for course corrections. Month 3. 20 plus indexed pages, 5 to 15 ranked keywords, 200 to 500 monthly organic sessions. Month 6. 40 to 60 indexed pages, 30 to 80 ranked keywords, 1,000 to 3,000 monthly sessions. Month 12. 60 to 100 indexed pages, 100 to 250 ranked keywords, 3,000 to 8,000 monthly sessions, 20 to 60 monthly leads. Agents who miss these thresholds by more than 30% usually skipped one of the six mechanisms covered above and need to backfill the missing part before rankings move.
Common SEO for real estate agents mistakes that stall lead flow
The common mistakes cluster around confusing traffic with revenue. Mistake one. Chasing high-volume citywide terms portals dominate. Mistake two. Publishing thin pages that target 20 to 30 keywords each. Mistake three. Skipping the seller tool cluster on the theory that “buyers are easier to find”. Mistake four. Ignoring local SEO on the theory that “the site handles it”. Mistake five. No call tracking, so the ROI conversation falls apart at the quarterly review. Mistake six. Stopping publication after month 6 on the theory that “the site has enough pages now”. Google reads publication velocity as an ongoing authority signal that decays inside 60 days of the last publish.
The correction pattern for each mistake follows the same sequence. Kill citywide targeting and repoint content at neighborhood plus intent modifiers. Rebuild thin pages into 1,500 to 3,000 word resource pages. Build the home valuation tool cluster. Overhaul the Google Business Profile plus citation build. Install CallRail with dynamic number insertion. Maintain 1 to 2 page per week publication cadence through month 24. Agents who apply the full correction inside 90 days typically recover 40 to 70% of dormant ranking potential and start seeing lead flow inside 60 to 120 days of the fix.
Building the 12 month SEO for real estate agents program
Building the 12 month SEO for real estate agents program requires sequencing the six mechanisms across the calendar. Month 1 runs technical audit plus intent mapping plus first 4 neighborhood hub pages. Month 2 through 4 finishes the 8 to 12 hub pages plus first 15 detail pages. Month 5 through 7 adds seller tool pages plus first 20 question posts. Month 8 through 10 adds commercial or investor pages depending on the agent book. Month 11 and 12 adds citation depth, review workflow, and content refresh cycle. Total year one delivery lands at 60 to 100 pages against 150 to 300 ranked keywords by month 12.
The SEO for real estate agents program needs monthly review checkpoints. Month 3 checks technical health and first ranking movement. Month 6 checks page cadence and lead flow start. Month 9 checks conversion rate and revenue attribution. Month 12 runs the full year review and sets year two priorities. Skipping the checkpoints causes 40 to 60% of stalled programs when course corrections that could happen inside 30 days get deferred to month 6 or later. The checkpoint discipline is what separates a growing program from one that plateaus by month 6 and then never recovers. Agents blending SEO with PPC also carry a matching quarterly PPC review to keep channel attribution clean. Retainer pricing at Redefine Web starts at $999 Visibility, $1,499 Traffic, $2,499 Scale, and from $4,500 Enterprise per month, with tier selection driven by market size and target ranking depth. Ready to run the same stack on your book of business? Talk to us about a real estate SEO retainer built around your zip codes and price points.