
You already run too many channels and get too few honest answers about which one paid for last month’s inventory. Every Meta rep pitches a new placement, every Klaviyo email produces a report you can’t reconcile against Shopify, and every agency deck opens with a channel breakdown that ducks the 2 questions that decide next quarter. What tests should we run this week to compound revenue, and which customers stayed long enough for the second and third order to fund the first? Growth marketing for ecommerce answers both. It replaces the channel-first pitch with a framework of testing velocity, a marketing efficiency ratio read across every dollar spent, and a retention layer that measures whether the paid work built a business or just rented traffic. Boogie Board ran that math to a $31 cost per sale at scale on $650,000 in managed ad spend. Our ecommerce marketing agency hub covers the wider retention plus paid stack this framework sits inside.
Testing velocity inside a DTC growth team
Testing velocity counts the independent, hypothesis-driven experiments a team runs and reads inside a single week. It’s the strongest predictor of compounding growth across the DTC accounts our team runs. One test per week beats zero. 4 to 6 tests per week beats the one-per-week team by 8 to 12 times on 12-month revenue growth. The winners stack, and the losers get retired quickly instead of running for months as dead weight.
The weekly test cadence that works
- Monday hypothesis review. The team picks 4 to 8 hypotheses from the backlog, ranks by expected impact and confidence, and pushes the top 4 live.
- Tuesday launch. Every test goes live with a written hypothesis, a single primary metric, a minimum detectable effect, and a stop date.
- Wednesday and Thursday monitoring. The team watches for statistical anomalies, guardrail metric breaches, and any tests that need a mid-flight pause.
- Friday read. The team reads every test that reached significance or stop date against the primary metric plus 2 guardrail metrics. Winners promote to production, losers move to the graveyard doc.
- Weekend rest. The team doesn’t run new tests over the weekend. Attribution windows and buyer patterns run differently and pollute the read.
- Monday next week. Winners promote and the next 4 hypotheses go live. Cadence repeats.
The cadence above is a small operational commitment that pays outsized returns. Teams that hold it for 6 months compound. The winners stack across acquisition, activation, retention, revenue, and referral, and the graveyard doc becomes the honest memory of what didn’t work so the team stops relitigating dead ideas quarterly. Teams that run tests ad hoc or without written hypotheses churn on the same failed ideas every few quarters and burn team morale watching the same debates rerun. Our sibling read on best practices for ecommerce marketing across paid organic and CRM covers the wider operating cadence.
Marketing efficiency ratio as the north star metric
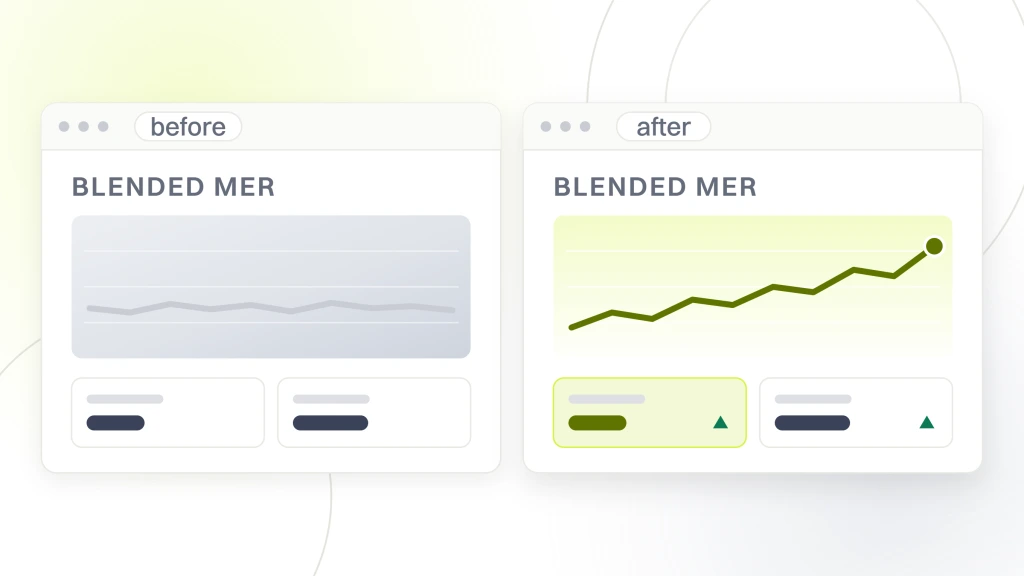
Marketing efficiency ratio (MER) equals total revenue divided by total marketing spend across every channel. MER replaces return on ad spend for growth decisions. It captures the whole picture instead of one channel’s attribution report. A brand reading only Meta ROAS at 2.4 will feel great about a scaled campaign that’s quietly eating into a Google Ads brand-term budget the same buyer already touched. A brand reading MER catches the overlap. Both the numerator (revenue) and denominator (total spend) include every channel.
What healthy MER looks like by stage
Early-stage DTC brands under $1 million annual revenue often run MER between 1.5 and 2.4, which reflects heavy testing spend and a low retention flywheel contribution. Growth-stage brands between $2 million and $10 million run 2.6 to 3.8, which reflects a maturing retention layer and lower brand-term cannibalization. Mature brands over $20 million with a real retention engine run 4.2 to 6.5. The returning customer base carries a meaningful share of monthly revenue at near-zero incremental marketing cost. Reading MER against those bands tells the founder whether the paid stack is scaling healthily or running hot. Blended MER pulled monthly from Shopify plus every ad platform is the honest read our team keeps as the single dashboard headline number on every DTC account. Our ecommerce marketing dashboard attribution and reporting cadence covers the wider reporting stack.
Contribution margin under MER
MER alone won’t settle a scaling decision. Contribution margin does. Pushing MER from 3.4 to 4.1 by shifting spend into retention email flows can improve the marketing report and hurt the P&L if the incremental revenue came at a lower average order value or a heavier discount rate. Growth marketers for ecommerce carry a second line under MER, which is contribution margin per order, and read the 2 together every week. Pushing MER without watching contribution margin trains the retention list to expect 20% off every touch and burns margin over 12 months. Reading the pair forces the team to promote tests that raise both, retire tests that raise one at the cost of the other, and hold the discount ratchet at the level the founder can defend at year-end audit.
Performance marketing for ecommerce inside the growth stack
Performance marketing for ecommerce is the paid layer a growth marketer operates against. Meta ads, Google ads, TikTok ads, YouTube pre-roll, connected TV, and the paid programmatic layer. The performance marketer buys the impression or click. The growth marketer decides whether to buy, what to buy against, and how the buy connects to the retention flywheel that funds the next month of buying. Drawing that line protects the growth stack from the common failure pattern where paid becomes the whole strategy and retention starves.
Creative velocity as the real paid lever
Ad platforms in 2026 lean on machine learning that surfaces the best-performing creative from a pool. Creative velocity is the lever that moves paid outcomes. Launching 15 to 40 new ad creatives per week feeds the algorithm the fresh material it needs to test. Brands still bid-tuning campaigns weekly in 2026 are optimizing the wrong variable. Brands running a weekly creative sprint of 20 to 40 fresh hooks, angles, and formats compound paid performance at a rate the bid-tuners never touch. Our sibling read on video marketing for ecommerce formats platforms and examples covers the creative production side.
Bid strategy inside a growth frame
Bid strategy is a smaller lever than creative in 2026, but it still matters for structural decisions. Meta advantage-plus shopping campaigns work at the audience level, not the ad-set level, so the growth marketer decides which product feeds go into ASC and which stay in structured campaigns. Google Ads performance max campaigns need real conversion signal, which pushes the growth marketer to feed back purchase and high-value events through server-side tracking. TikTok spark ads perform best when the creative is authentic-looking user-generated content, which pushes the growth marketer toward creator seeding programs rather than polished brand studios. Every bid decision serves the creative decision, and the creative decision serves the audience decision. That order runs backward in most performance marketing shops.
Retention economy and cohort lifetime value
Scaled DTC brands adopt the retention economy frame around year 2, once acquisition cost is climbing and the P&L only works when repeat customers carry a growing share of revenue. Cohort lifetime value replaces average order value as the growth team’s optimization metric. Average order value is a single-order snapshot. Cohort lifetime value is the compounding read that funds the next quarter’s acquisition budget.
Reading cohort LTV honestly
The growth team calculates cohort lifetime value per acquisition month across the following 12, 24, and 36 months. Cohort A acquired in January books revenue in January plus every subsequent month through retention flows, subscription orders, and re-engagement campaigns. Teams tracking cohort LTV by acquisition source find Meta prospecting cohorts often produce lower 12-month LTV than Google branded cohorts. The branded searcher already carried purchase intent. The Meta buyer was a cold interrupt. Reading LTV by source lets the team price its acquisition budget honestly and skip the trap of scaling a channel that looks great at day-one attribution and worse at 90-day contribution. Our sibling read on email marketing for ecommerce flows campaigns and examples covers the retention flow side that carries cohort LTV.
Subscription and product-tier retention
Subscription is the strongest retention layer any DTC brand can build if the product category supports it. Consumables like coffee, supplements, pet food, and skincare produce 30% to 60% subscription attach rates when the offer is priced right, which multiplies 12-month cohort LTV by 2.4 to 3.8 times over one-off buyers. Product-tier retention is the second-strongest layer, where a first purchase of a lower-priced product sets the cohort up for an eventual bundle or premium upgrade. Beauty brands running the tier ladder from mini to full-size to premium bundle produce cohort LTV that funds 40% to 60% higher acquisition budgets than flat-catalog brands. Retention economy math forces the founder to build the ladder before scaling the paid stack. Scaling a paid stack that feeds a flat catalog produces a business that peaks and dies at $5 million annual revenue.
Growth loops that compound marketing for ecommerce business
Growth loops are self-reinforcing acquisition mechanisms. The output of one loop feeds the input of the same loop or a neighbor loop. Marketing for ecommerce business through growth loops beats marketing through channels. Loops compound. Channels linearly consume budget. Serious DTC brands build 2 to 4 loops the founder can name, describe, and connect. Every loop feeds the next.
Referral loops that carry weight
A referral loop is not a Refersion widget on the account page. It’s a post-purchase experience where the first-order buyer receives a prompt, a code, and a friction-free share path that converts 6% to 14% of first-order buyers into a second-order referrer within 30 days. Brands running the loop with a real incentive on both sides (referrer gets $15 credit, referee gets 15% off first order) produce a compounding acquisition line that lowers blended CAC by 8% to 22% over 12 months. Skipping the incentive on either side kills the loop. Our sibling read on affiliate marketing ecommerce programs and networks covers the adjacent partner-driven loop.
Content and creator loops
Content loops feed organic search rankings, which feed direct traffic, which feeds paid retargeting audience quality, which feeds paid conversion rates, which fund more content production. Creator loops feed short-form video that feeds paid social creative libraries, which produce lower cost per click, which fund more creator seeding budget. Both loops take 6 to 18 months to compound. That’s why brands run out of patience and defund them at month 4. Brands that hold the investment for the full compounding window produce marketing outputs that lower blended CAC by 12% to 28% by month 18. The content pillar plus the creator pillar are the 2 loops every mature DTC brand builds after the retention layer proves out.
How an ecommerce growth marketing agency runs a DTC account
An ecommerce growth marketing agency worth the retainer runs a DTC account the way a chief growth officer would run it from inside. Weekly test cadence, monthly MER read, quarterly cohort LTV review, and a founder-facing report that ties every dollar of spend back to contribution margin.
Agencies that report only on paid channel metrics without touching the retention layer, the product-page conversion rate, or the subscription attach rate are half-agencies. They can only optimize half the DTC system. Real growth work needs the whole engine.
The right team roles under retainer
- Growth lead. Owns the weekly test cadence, monthly MER read, quarterly cohort review. Reports to the founder.
- Paid media operator. Runs Meta, Google, TikTok, and any secondary paid channel. Launches 15 to 40 creatives per week.
- Lifecycle marketer. Runs Klaviyo or Attentive flows, campaign calendar, subscription program, and post-purchase experience.
- Conversion rate designer. Owns product-page tests, cart tests, checkout tests, landing-page tests for paid traffic.
- Creative producer. Produces static, video, and user-generated content assets against the weekly paid brief and the weekly organic brief.
- Analyst. Maintains the dashboard, runs cohort math, reads test results, and catches attribution anomalies before they reach the founder.
Every one of those roles matters. Agencies that staff a $6,000 retainer with a paid media operator only and call it a growth engagement will produce a paid report every month and a stalled retention layer every quarter. Real growth work needs the full team, so the honest retainer floor for a DTC brand between $2 million and $10 million annual revenue runs $3,999 to $6,000-plus monthly for the 6 roles above at appropriate seniority. Our sibling read on marketing automation ecommerce platforms and flows covers the automation stack these roles operate against.
Pricing and scope for growth marketing for ecommerce work
Founders comparing agency retainers see quotes from $499 to $45,000 monthly and no clean map for the spread. The pricing bands read clearly once the scope is written honestly, and the scope reads clearly once the brand stage is named. A $2 million annual revenue brand hiring a $30,000 retainer is overspending relative to the incremental revenue it can absorb. A $12 million annual revenue brand hiring a $4,000 retainer is underspending relative to the coverage it needs.
| Brand stage | Monthly retainer band | Roles covered | Test cadence | Best-fit engagement |
|---|---|---|---|---|
| Pre-launch to $500K | $1,499 to $2,499 | Lead plus one operator | 1 to 2 tests per week | Fractional advisory plus paid operator |
| $500K to $2M | $2,499 to $3,999 | Lead plus paid plus lifecycle | 2 to 4 tests per week | Growing brand needing full loops |
| $2M to $10M | $3,999 to $6,000 per month | Full 6-role team, part-time | 4 to 6 tests per week | Scaling brand with retention layer |
| $10M to $25M | from $6,000 per month plus scope add-ons | Full team dedicated, senior | 6 to 10 tests per week | Mature brand with founder time constrained |
| $25M plus | Custom scope | Multi-team, custom scope | 10 to 20 tests per week | Enterprise DTC or brand portfolio |
The bands above are honest ranges. Redefine Web engagements start at $1,499 monthly for pre-launch brands wanting a fractional lead and scale up through the bands as brand revenue and scope grow. Contracts run 6 months minimum. A working growth engagement needs a full quarter to build the test cadence and another quarter to prove the compounding. Faster than that produces noise the founder can’t act on. Slower than that lets the loops decay before the flywheel spins.
A DTC brand running growth marketing for ecommerce at scale
Boogie Board came to our team as a paperless writing tablet brand with strong retail distribution, a real product story, and a paid stack stalled at a cost per sale the founder couldn’t defend against gross margin. The brand had spent 18 months layering Meta prospecting on top of a shrinking retention layer, and the P&L had turned from a scaling story into survival math. Blended MER read at 1.9 against a 3.2 target that year. The pattern was familiar. Paid running hot, retention running cold.
Our team rebuilt the growth stack on the AARRR frame. Weekly creative sprint of 20 to 35 fresh Meta assets against 4 audience clusters. Klaviyo lifecycle flow rework with a post-purchase education sequence tuned for parents buying the tablet for young children plus an educator segment buying for classroom use. Product-page rebuild on the top 4 SKUs with a 3-second in-hand video showing the write-and-erase action. Subscription-to-refill program on the accessory line to catch the repeat purchase behavior that had been drifting to third-party retailers. Referral loop with $10 credit both sides and a friction-free share path from the order confirmation email.
Attribution overlap was the second failure the rebuild had to fix. The paid report showed a 3.4 return on ad spend. The Klaviyo report, the affiliate report, and the influencer report each claimed a share of the same revenue. Server-side conversion events, a single-source-of-truth revenue query in Shopify, and a monthly reconciliation pass caught the overlap. The founder stopped budgeting against triple-counted contribution.
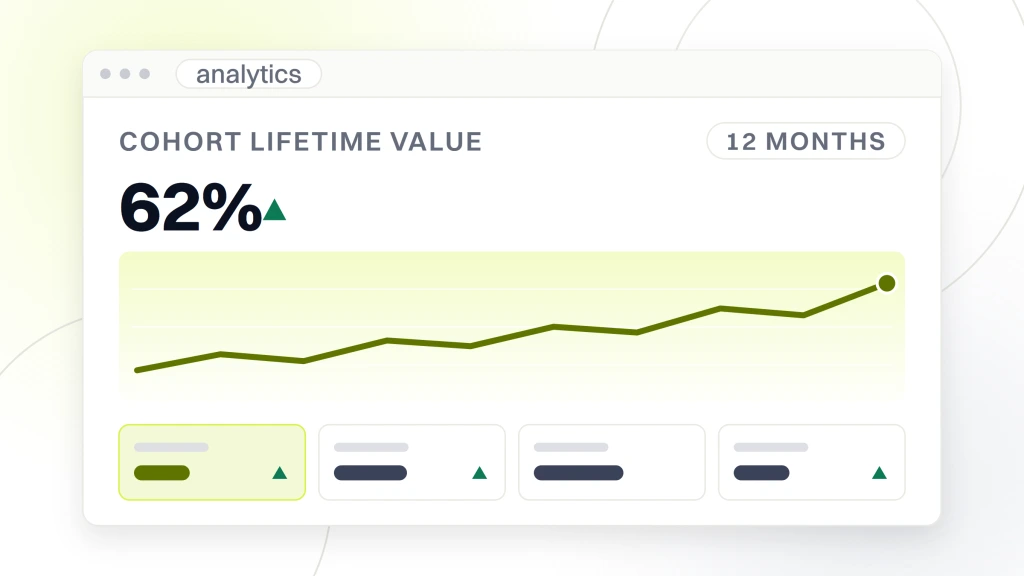
Across the following year the program ran, cost per sale held at $31 as managed ad spend climbed to $650,000. Conversion rates on the top-4 SKUs climbed over 11% through the product-page rebuild. Blended MER moved from 1.9 to 3.4, which cleared the founder’s gross margin threshold and funded a second product line launch. Cohort LTV on the January acquisition cohort ran 62% above the prior-year cohort at 12 months, which reflected the retention flywheel finally carrying weight. Boogie Board became a case study in what growth marketing for ecommerce produces when the retention layer is built alongside the paid layer rather than after it.
Common mistakes across growth marketing ecommerce programs
Growth marketing ecommerce programs fail in predictable ways. The failure modes repeat across brand size, category, and team seniority. The mistakes are structural rather than personal. Naming them lets a founder catch the pattern early and avoid the 18 months of stalled revenue that comes from chasing the wrong variable.
- Scaling paid before retention. Building acquisition volume against a broken retention bucket produces a business that peaks and dies at $5 million annual revenue.
- Reading channel ROAS instead of blended MER. Channel-level reports hide overlap and produce budget decisions that shift spend without shifting revenue.
- Zero written hypotheses on tests. Tests without a written hypothesis and stop date turn into permanent variants nobody remembers approving.
- Confusing creative volume with audience testing. Ad platforms in 2026 want creative variance, not audience variance. Building 12 audience segments and 2 creatives per week is the wrong balance.
- Missing subscription program on consumables. Consumable-category brands without a subscription program leave 30% to 45% of cohort LTV on the table.
- Treating email as a discount channel. Retention lists trained to expect 20% off every touch lose margin and stop converting on non-discount campaigns within 6 months.
- Reading LTV as one number. LTV by acquisition source is the honest read. The single-number LTV averages across cohorts and hides the source-level pattern that matters for budget allocation.
Each pattern has a written fix, and each fix is a test that goes into the weekly cadence. Growth marketing for ecommerce is the discipline that catches these mistakes systematically rather than heroically. Founders trying to catch them alone burn out at month 18. Teams running the discipline together catch them weekly and compound the wins across the flywheel. The Shopify ecommerce marketing collection covers many of the same failure patterns from the platform side.
Where growth marketing for ecommerce fits the DTC stack
Growth marketing sits at the top of the DTC operating stack. Every paid channel, every retention flow, every product-page change, and every subscription program either compounds through the growth frame or drifts against it. Brands that operate without the frame produce reports every month and questions every quarter about why the reports don’t match the P&L. Brands that operate with the frame produce reports that match the P&L, tests that stack into compounding revenue, and a founder who spends less time reconciling attribution and more time deciding which loop to fund next.
Run the AARRR frame weekly. Read MER against contribution margin monthly. Track cohort LTV by acquisition source quarterly. Run 4 tests per week with written hypotheses and stop dates. Build the retention layer before scaling the paid layer. Build the loops before scaling the channels. Do those 6 things across the first 12 months and the growth marketing engagement produces the compounding revenue the founder hired the agency to deliver. Skip any of the 6 and the engagement drifts back into the channel-first pattern that stalls DTC brands at the $2 million ceiling.
The ecommerce marketing retainer starts at $1,499 per month and runs 6 months. A working growth engagement needs a full quarter to build the test cadence and another quarter to prove the compounding against blended MER. Faster than that and the numbers are noise. Slower than that and the loops decay before the flywheel spins. Teams weighing international launch should read our ecommerce market expansion strategies for the 6-decision frame.