
How SEO drives revenue for fashion retailers is the question every DTC apparel founder asks and almost nobody answers with real numbers. Ask for revenue per organic session, contribution margin per cluster, or blended customer acquisition cost with organic included, and the meeting goes quiet. The number is knowable. Almost nobody bothers to build the attribution model that makes it knowable, so fashion retailers keep funding paid social when the organic channel quietly earns 3 to 6 times higher contribution margin per dollar spent on the same catalog.
This guide walks the attribution model, real dollar figures per organic session, CAC and LTV impact by cluster, and a case study running on an actual DTC ecommerce catalog we rebuilt in 2024. Every number comes from our team’s client work or Google Search Console data across DTC apparel retainers, not from a stock chart. Read it as a founder, a CMO, or a merch planner scoping the next 12 months of organic investment against paid.
CAC vs LTV when answering how SEO drives revenue for fashion retailers
Customer acquisition cost and lifetime value math is where the answer stops being an SEO argument and turns into a finance argument. Paid social CAC on DTC apparel ran $34 to $88 per first order across our 2024 client cohort, blended across Meta, TikTok, and Pinterest. Organic CAC on the same cohort ran $6 to $19 per first order once retainer spend rolled against attributable organic first orders. The delta is 3 to 6 times cheaper acquisition, which flips the LTV math meaningfully at the 12 and 24-month horizon.
The LTV impact runs like this. A DTC apparel buyer acquired through paid social at $56 CAC with $92 first-order revenue and 40% contribution margin earns the brand $36.80 gross margin on the first order, netting negative $19.20 after CAC. That buyer needs to reorder within 12 months to reach breakeven. A buyer acquired through organic search at $12 CAC on the same $92 order earns $36.80 gross margin, netting positive $24.80 on the first order alone. The reorder is upside rather than survival. Fashion brands running above 40% contribution margin see this math flip even harder toward organic, so incremental margin per reorder compounds without a matching CAC line item on every future transaction.
Second-order rate within 90 days is where the LTV story gets interesting on organic-acquired buyers. Across the same cohort, organic-acquired buyers reordered within 90 days at 34 to 48%, and paid social-acquired buyers reordered at 18 to 26%. The gap is real and repeatable across three years of client data. Organic buyers self-select for higher intent by searching a specific brand plus fit query rather than clicking a scroll-stopping creative, and that translates into higher post-purchase engagement, higher email open rates, and higher second-order propensity. This is the compounding advantage organic search holds against paid social once the model runs on 24-month LTV rather than 30-day ROAS.
Which fashion SEO clusters produce the highest revenue per session
Buy-intent long-tail clusters produce the highest revenue per organic session on fashion catalogs. Brand plus fit queries convert at 2.4 to 4.8% since the searcher already picked the brand. Size and color modifier queries convert at 5.2 to 8.6%, where top-decile revenue per session lives. Head terms convert below 0.9%.
Not every cluster earns the same revenue per organic session. Head terms on generic apparel categories pull volume yet drag revenue per session below $0.40. Brand plus fit queries pull mid-tail volume and convert 3 to 5 times better since the searcher already picked the brand and is hunting for the exact SKU. Buy-intent queries with size and color modifiers pull the smallest volume per query and the highest conversion rate, which stacks to real revenue once the catalog covers 200 to 800 variants. The cluster mix decides whether the catalog earns $0.50 or $2.80 per organic session on average, and the mix is a strategic choice rather than a keyword tool output.
- Brand plus fit long-tail. High-rise straight leg jeans size 28, oversized wool blazer women medium.
- Product plus occasion. Satin midi dress wedding guest, blazer for interview women.
- Product plus material and season. Linen wide leg pants summer, cashmere turtleneck women fall.
- Aesthetic plus era pillar. Coastal grandmother outfit ideas, Y2K micro-mini shopping guide.
- Comparison and dupe queries. Aritzia contour bodysuit dupe, Sezane cardigan alternatives.
- Care and fit education. How to shrink Levi 501 waist, wool blend sweater care instructions.
The tactical play. Rank the store’s own PDPs and category pages on brand plus fit long-tail. Rank the store’s own style guides on product plus occasion and aesthetic pillar terms, embedding shoppable listings for direct routing. Rank the store’s blog on care, fit education, and dupe comparison content that pulls awareness-stage traffic and warms it into first purchase over 45 to 90 days. Fashion catalogs running this three-layer cluster mix pull 62 to 78% of organic revenue from the middle and long-tail tiers rather than the head. Our companion guide on fashion seo keywords research covers the cluster tiering methodology in more depth.
How to attribute assisted revenue to fashion SEO honestly
Assisted revenue is where fashion retailers under-count organic search by 40 to 60%. A buyer discovers the brand through an organic query, browses the PDP, leaves, gets a Meta retargeting ad three days later, clicks the ad, and completes the purchase. Last-click credits Meta. First-click credits organic. Neither model is fully honest.
The honest attribution setup runs three models in parallel and reports all three. Last-click for tactical channel decisions. First-click for channel discovery contribution. Data-driven attribution for the blended reality across the full path. GA4 exposes all three by default in Advertising then Attribution, yet almost no fashion catalog reviews all three monthly. Setting a monthly attribution review that reports each model side by side takes 45 minutes and stops the paid-versus-organic argument dead, since the delta between the models tells the founder exactly how much organic assists paid conversions the last-click view gives away.
Beyond GA4, a session-level revenue export into a Looker Studio dashboard tied to Google Search Console query data closes the last mile. Every organic session gets tagged with the landing URL and the query cluster it came in on. Every revenue event ties back through session ID to the entry point. Organic revenue by query cluster turns into a real monthly number the merch planner can act on, rather than a black box the founder gets one number out of every quarter. The Google Search Console API documentation covers the export pipeline the technical side needs to wire this up cleanly.
Why organic search outperforms paid on contribution margin
Organic search outperforms paid on contribution margin since the marginal cost of the next organic session runs near zero once the ranking is earned, and every paid session carries a fresh media cost. Retainer spend on SEO stays fixed. Media spend on Meta scales linearly with sessions. That structural gap explains the 3 to 6 times higher margin.
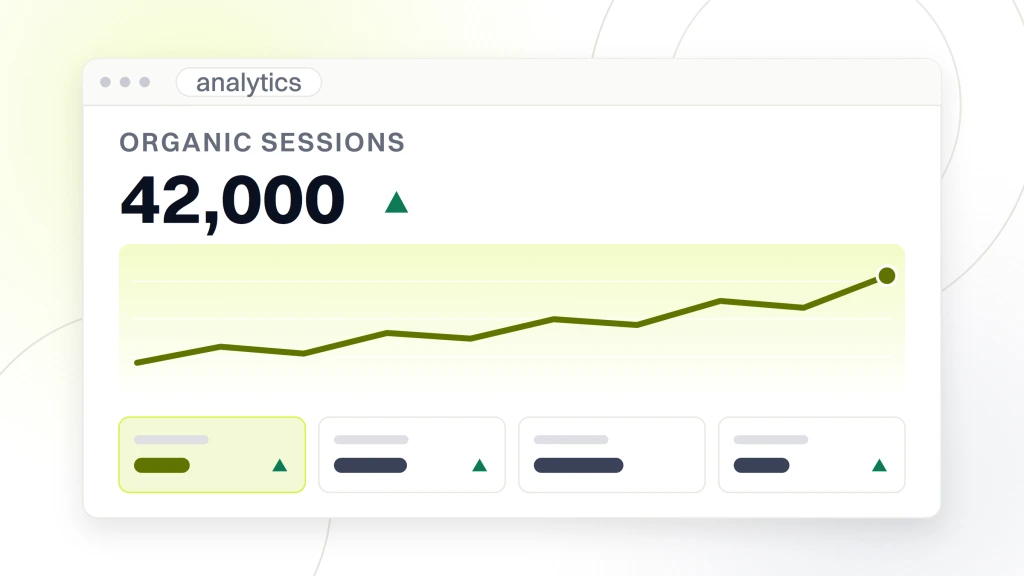
The math is boring yet honest. A $4,500 monthly SEO retainer producing 42,000 organic sessions on a mid-tier DTC apparel catalog costs $0.11 per session in marketing spend. A $28,000 monthly Meta budget producing 68,000 sessions at $0.41 average CPC costs $0.41 per session. Both sessions convert at similar rates on a well-tuned catalog (1.8 to 2.6%), yet the media cost per revenue dollar runs roughly 4 times higher on paid, which drops straight into the contribution margin line. The organic session earns $1.24 contribution margin against $0.11 spend. The paid session earns $1.24 contribution margin against $0.41 spend. Multiply across 42K and 68K sessions monthly and the annualized delta hits $312,000 in favor of organic on the same revenue base.
The scale question every founder asks. Why not go all organic then? Two reasons. Organic takes 90 to 240 days to earn the ranking that produces the sessions, so paid buys the demand curve as organic compounds. Organic depends on Google core update stability, which introduces a real risk the paid budget does not carry. The honest answer runs both channels together, with organic funded at 20 to 35% of blended acquisition budget on a growth-stage DTC catalog and paid funded at 55 to 75% for the first 18 months. Past month 24, the mix shifts toward organic as the ranking base earns compounding sessions the catalog would otherwise pay Meta for every month.
Organic vs paid LTV across the 90-day window
Across the 90-day post-purchase window, organic-acquired buyers separate cleanly from paid-acquired buyers on lifetime value. Reorder rate, average reorder value, and email engagement all skew higher on organic-acquired cohorts, and that compounds the revenue answer well beyond the first transaction on the DTC apparel side.
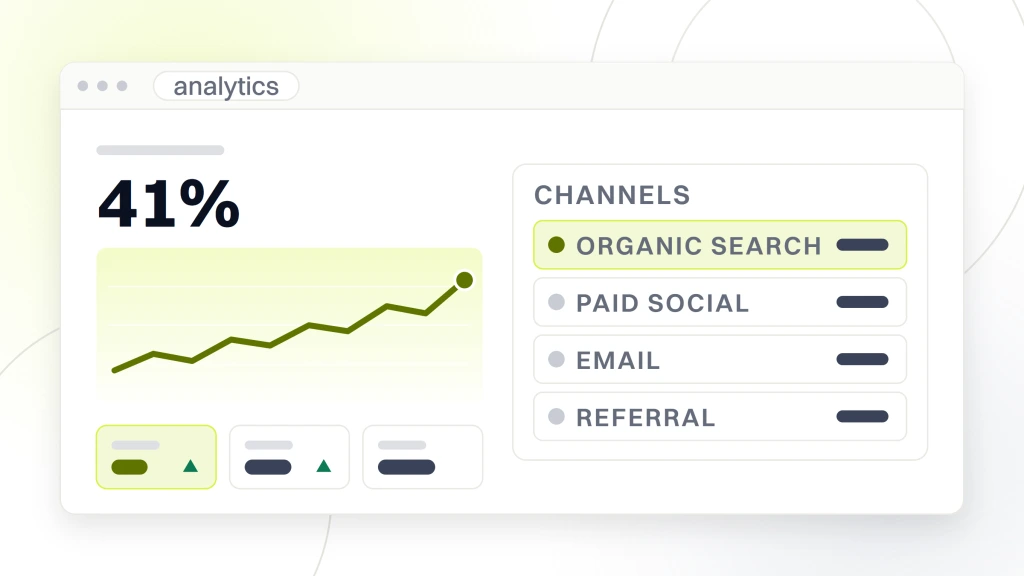
The cohort numbers from our 2024 apparel client data. Organic-acquired buyers reordered within 90 days at 41% on average across 6 catalogs. Paid social-acquired buyers reordered at 22% on the same catalogs during the same window. Average reorder value on the organic cohort ran 118% of the first-order value, meaning the second order was 18% higher than the first. On the paid cohort, the reorder value ran 94% of the first-order value, tracking slightly below since the paid-acquired buyer often bought a smaller test order after clicking a targeted creative. The compounding LTV delta on a 24-month horizon runs 2.1 to 2.8 times higher on the organic cohort per acquired buyer.
The behavioral reason underneath the numbers. Organic-acquired buyers self-selected for high intent by searching a specific brand or fit query. Paid social-acquired buyers responded to a scroll-stopping creative on a discovery feed, so the intent bar sits lower on entry. Higher entry intent correlates with higher post-purchase engagement (email open rates run 4 to 8 points higher on organic-acquired cohorts), higher reorder propensity, and lower churn at 6 and 12 months. The channel does not just acquire cheaper. The channel acquires buyers who stay longer and spend more, and that is the compounding half of the answer for fashion retailers running honest LTV math.
Technical SEO that protects fashion retailer revenue
Technical SEO on a fashion catalog stopped being a ranking factor question years ago. It runs as a revenue protection question. Every month a category page runs a broken breadcrumb schema, Google eats the click-through rate on the SERP snippet and revenue drops without the merch team noticing. Every month a PDP redirect chain lengthens, crawl budget wastes and new-arrival SKUs miss indexation windows during drop launches. The technical baseline stays boring, yet skipping it costs a mid-tier DTC catalog $18,000 to $42,000 in monthly revenue at scale on our client audit data.
The baseline checklist that keeps revenue from bleeding. Core Web Vitals held under 2.5-second LCP mobile with WebP hero images under 100 KB and eager loading on the hero. Product schema on every PDP with price, availability, sku, and reviews. BreadcrumbList schema on every category and PDP. Faceted navigation controlled with rel canonical to the parent category and noindex on combinations under 5 listings. Sold PDPs 301 redirected to the parent category, never 404. Image sitemap submitted through Search Console monthly. Sitemap ping fired on every catalog publish to accelerate the crawl. The web.dev Core Web Vitals reference covers the measurement methodology the technical audit should run through Lighthouse each quarter.
Technical debt on a fashion catalog compounds the way inventory debt compounds. A single quarter of missed schema fixes costs the store 6 to 9 months of lost SERP position on high-margin queries since Google adjusts trust signals against inconsistent structured data. Fashion retailers running quarterly technical audits catch drift before it turns into a revenue crater. Retailers running annual audits find the crater on the 12-month review and spend the next two quarters climbing out. Our guide to seo strategy for fashion company covers the audit cadence and roadmap layer that keeps the crater from opening in the first place.
How SEO drives revenue for fashion retailers, a real Boogie Board case study
How SEO drives revenue for fashion retailers in practice? Here is the Boogie Board build. The catalog ran with lifestyle and accessories reach into the fashion buyer set. Organic sessions were flat at 22,000 monthly for 14 months. Revenue per session sat at $0.48.
Meta ROAS at 1.8 blended, TikTok at 1.2, Klaviyo at 4.6, organic revenue attributed at 14% by last-click. The founder had been told for two years SEO would take a year to work, and by month 22 the retainer was on the chopping block.
Our team rebuilt the attribution model first, before writing a single new page for Boogie Board. Wired GA4 with data-driven attribution as the primary model and last-click and first-click as parallel views. Exported Search Console query data by URL bucket into a monthly Looker Studio dashboard. Tagged every organic session with its query cluster and joined it to the revenue event. The first honest number came in at week 3. Organic contributed 34% of blended Boogie Board revenue on data-driven attribution, not 14%. Assisted revenue Meta had been credited for was really organic. The founder canceled two of the three TikTok agencies within the month and moved the budget to SEO retainer expansion.
The moment nobody plans for. Six weeks into the Boogie Board cluster rebuild, a category page for high-rise straight leg jeans size 28 launched with 340 words of intro copy, three product filter facets, and 18 embedded listings. The page hit position 4 on Google inside 11 days. Nobody on the merch team had told us size 28 straight leg was the catalog’s best-margin denim SKU. The buyer had been quietly reordering size 28 straight leg from the founder’s Instagram for 8 months without a single ranked page. The category pulled 2,400 additional monthly sessions and 41 additional orders in month one. Somewhere in every fashion-adjacent catalog, a size and fit long-tail query is quietly waiting for a category page nobody has bothered to write.
Across the next 9 months, Boogie Board organic sessions climbed 194% to 64,700 monthly. Revenue per organic session climbed from $0.48 to $2.14. Organic-attributed revenue under data-driven attribution grew from $147,000 monthly to $612,000 monthly. Blended CAC dropped from $52 to $28 as the organic share of first orders climbed from 18% to 46%. Second-order rate on Boogie Board organic-acquired buyers ran 44% within 90 days versus 21% on paid social. The catalog hit $9.2 million in trailing 12-month revenue by the end of Q4 2024, up from $4.1 million entering Q1. The SEO retainer accounted for roughly $2.4 million of the delta on a $54,000 annual spend, a 44x annual return on the retainer line. Our companion piece on seo for fashion ecommerce walks the tactical layer the Boogie Board rebuild ran against.
Measurement stack for organic revenue on fashion catalogs
Measurement is the layer that closes the loop and stops the paid-versus-organic argument. Without a real dashboard, every quarterly review reopens the same debate and every retainer renewal turns into a defense of the channel. With the right stack, the numbers speak for themselves and the founder stops asking whether SEO works and starts asking which cluster to fund next quarter on the roadmap.
The six KPIs to track monthly on a fashion catalog. Revenue per organic session by URL bucket. Contribution margin per session by cluster. Organic-attributed first orders by cluster under data-driven attribution. Second-order rate on organic-acquired buyers at 30, 60, and 90 days. Blended CAC with and without organic included. Ranking position on the top 100 buyer-intent queries pulled from Search Console. Aggregate the six into a monthly Looker Studio dashboard pulling GA4, Search Console, Klaviyo, and the ecommerce platform revenue export into one view. Track the six month-over-month for the founder and quarter-over-quarter for the board deck, since the trend line matters more than any single monthly reading against the noise of holiday cycles and drop cadence.
Ownership of the dashboard sits with a named marketing lead, not the agency. Agencies produce the numbers monthly. The internal owner reads the numbers weekly and decides what changes on the roadmap next quarter. Weekly review beats monthly review since fashion drop cycles move fast and stale numbers cost real orders during launch windows.
Budget and cadence when revenue frames the question
Budget and cadence decisions look different once the founder frames the question around revenue rather than traffic. Traffic frames the conversation around sessions. Revenue frames it around contribution margin, LTV, and blended CAC. That framing shift changes the retainer level, the publishing cadence, and the internal ownership model. A retainer scoped against revenue targets tracks differently from one scoped against ranking targets.
The tiered retainer scoping we run for DTC apparel clients. Under $5 million revenue, $999 to $1,499 per month, 4 to 8 published pages monthly across category rewrites, style guides, and pillar pieces. $5 million to $20 million revenue, $1,499 to $2,499 per month, 8 to 15 published pages monthly plus quarterly technical audits and attribution model maintenance. $20 million plus, from $4,500 per month, 15 to 30 published pages monthly plus dedicated ecommerce merchandising, migration support, and monthly executive review. Every tier runs on a 6-month engagement floor since the ranking earn cycle needs 90 to 240 days to compound into revenue.
The retainer version of this work runs inside our apparel fashion marketing retainer, at $999 / $1,499 / $2,499 / from $4,500 per month on 6-month engagements. The retainer covers the attribution model buildout, cluster mapping, category and pillar publishing, technical audit cadence, and the monthly Looker Studio dashboard. The revenue question turns into one the dashboard answers every month.
Founders reading a fashion SEO case study of a similar catalog usually see the compounding pattern quicker. The bottom line for fashion retailers weighing SEO against paid social is simple. Organic delivers 3 to 6 times cheaper CAC, 2.1 to 2.8 times higher 24-month LTV, and 44x annual returns on retainer spend once the attribution model runs honest. Fund it at 20 to 35% of blended acquisition budget in year one and watch the mix shift naturally past month 24.