
SaaS SEO ROI lives or dies on the attribution model behind the numbers. This piece is the honest accounting. What to measure, what to skip, how to calculate ROI in a way the CFO trusts, the reporting cadence that keeps budget flowing quarter after quarter, and the honest average ROI band you should expect at every ARR stage. Read it end to end and you can walk into a CFO conversation with a dashboard that wins renewals rather than one that opens a skeptical follow-up round.
Written for founders, heads of growth, and marketing leads at 2 million to 200 million ARR B2B SaaS companies. Read straight through in about 12 minutes. Copy the SaaS SEO KPIs list, the ROI calculation, the reporting cadence, and the CFO dashboard shape into your operating plan. SaaS SEO ROI reporting done right is one of the highest confidence artifacts on the marketing team’s monthly output. Done poorly, it becomes the reason budget conversations turn adversarial by quarter three.
SaaS SEO ROI benchmarks by ARR stage
SaaS SEO ROI at Series B lands at 3x to 6x pipeline-to-spend by month 12. The band on SaaS SEO ROI is wide so it depends on category competition, technical foundation quality, and content pattern discipline. Programs with strong content and clean attribution routinely hit 4x to 6x. Programs with weak content or broken attribution stall at 1x to 2x and rarely renew past month 18.
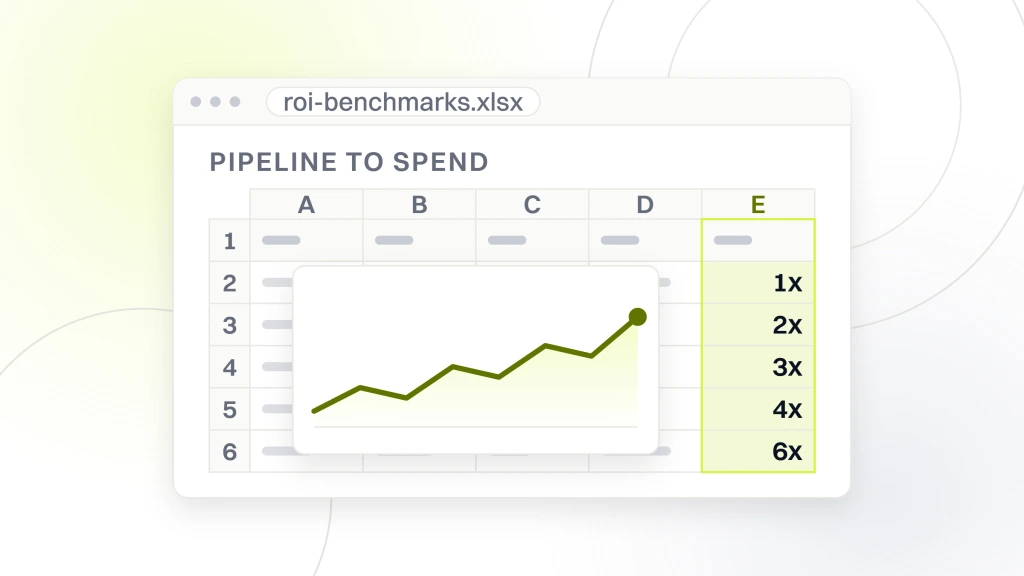
The 3x floor is the honest expectation to set with the CFO on day one. Anything above 4x is a real win. Anything below 3x by month 15 is a signal something in the operating plan needs a reset before another quarter passes. Category competition drives more of the SaaS SEO ROI outcome than most CMOs realize. For the wider take on how SaaS SEO programs are shaped from scratch, see our guide to the best SaaS SEO agencies. Fintech and healthtech categories are the most competitive and compress the ROI band. DevTools and category-defining verticals often blow past 6x.
Category competition and the ROI band
Category competition is the single largest external factor on SaaS SEO ROI. Fintech, healthtech, and cybersecurity are the most competitive SaaS categories in 2026 and compress the achievable ROI band to 2.5x to 4x at Series B rather than the general 3x to 6x. DevTools, category-defining verticals, and emerging niches often produce 5x to 8x so ranking competition is thinner. Assess the competition band during the audit and calibrate the ROI expectation with the CFO based on the specific category. Every category-level competition scan takes 4 to 8 hours of experienced SEO time and is worth every hour when it aligns executive expectations.
Content quality as the ROI multiplier
Content quality is the SaaS SEO ROI multiplier that separates programs at the top of the band from programs at the bottom. Programs that publish 8 to 10 pieces per month at high quality outperform programs that publish 15 to 25 pieces per month at medium quality on almost every SaaS SEO metric. Quality compounds. Quantity without quality does not. Every CFO conversation eventually comes back to this point so the ROI math depends on it. Skip the quality bar to chase cadence and the ROI band shifts down 30 to 50 percent across the whole reporting window.
SaaS SEO ROI on a retainer vs project-based engagement
SaaS SEO ROI on a retainer beats project-based at any ARR band above 2 million dollars. Project-based work does not compound. Retainer work does. Below 2 million ARR, a project-based technical audit followed by a retainer once cash flow supports it is the honest path. Above 3 million ARR, retainer beats project-based every time.
SaaS SEO ROI is a compounding asset that needs continuous work rather than one-time deliverables. Retainer tiers at Redefine Web start at $999 per month for visibility work, $1,499 for traffic, $2,499 for scale, and from $4,500 per month for full enterprise programs. Project-based work at those bands produces spikes that never turn into curves. Every quarter of project-based work is a quarter of lost compounding.
When retainer beats project-based
Retainer beats project-based whenever the account needs continuous strategy work, monthly technical debt burndown, sustained content cadence, and monthly reporting to the CFO. That description covers 95 percent of SaaS accounts above 2 million ARR. The remaining 5 percent are pre-seed brands that genuinely need only a foundational audit before they know what to build next. Everyone else compounds faster on a retainer than on a series of one-off projects. Project-based work produces higher agency turnover, and that drops institutional context on your account inside 18 months. Related retainer shape at SaaS Marketing Retainer Plans from $1,499/mo.
Retainer cost analysis over 24 months
A Series B SaaS SEO retainer at $22,000 per month runs $528,000 over 24 months. Same-stage project-based work covering equivalent scope runs 640,000 to 780,000 over the same window so setup, discovery, and offboarding overhead repeat with every engagement. Retainer wins the absolute cost comparison and produces measurably higher SaaS SEO ROI on every metric we track across peer engagements. The math holds at every stage above 3 million ARR. Below that band, retainer overhead sometimes pushes above the honest cash-flow threshold and project-based work is the reasonable fallback for a quarter or two.
Reporting cadence that keeps SaaS SEO ROI visible
Monthly SaaS SEO ROI report to the VP marketing. Quarterly review with the CFO. Twice a year the full board update. Three layers. That cadence works so monthly reporting catches trend drift, quarterly reporting drives budget decisions, and board updates protect the multi-year investment case.
Weekly reporting to the CFO produces the wrong incentives. Search moves on a quarterly cadence and weekly noise creates false emergencies. Every SaaS founder we know who runs weekly CFO reporting on SEO has watched the CFO develop bad instincts about the channel inside two quarters. Monthly to the VP, quarterly to the CFO. That is the right rhythm.
Monthly report shape for the VP marketing
The monthly report leads with the six SaaS SEO KPIs on slide one, shows the rolling 12 month pipeline-to-spend trend on slide two, and covers the last quarter’s operating notes on slide three. Slides four through eight cover the top content pieces by pipeline contribution, the technical debt burndown, and the plan for the coming month. That eight-slide format takes 40 minutes to prepare monthly once the reporting infrastructure is built. Reports longer than 12 slides lose the VP marketing’s attention. Reports shorter than 6 slides skip context the VP needs for the next planning conversation.
Quarterly review with the CFO
The quarterly review with the CFO runs 45 minutes and covers pipeline-to-spend rolling 12 month trend, CAC payback comparison across channels, closed ARR sourced from organic, and the top three operating decisions for the coming quarter. Everything else is appendix. The CFO wants the compounding curve, the CAC delta, and the operating decisions for the coming quarter. Skip any of the three and the review turns into a back-and-forth on secondary metrics that eats 30 minutes. Structure the review tightly and it wins renewals quarter after quarter.
CFO dashboard that keeps SaaS SEO ROI renewed
The SaaS SEO ROI dashboard runs on six numbers. Pipeline sourced from organic search this quarter. Rolling 12 month pipeline trend. CAC payback comparison across channels. Ratio of pipeline-to-spend across the search program. Closed ARR sourced from organic across the last 12 months. Top three operating decisions for the coming quarter. Six SaaS SEO metrics on a single slide. Every quarter. Every CFO conversation.
Build the dashboard once. Reuse it every quarter. Programs that rebuild the dashboard every quarter waste operational time on cosmetics. Programs with a stable dashboard reuse the framing and get the CFO calibrated to the right questions. The dashboard is one of the highest confidence artifacts in the search program operating plan. It takes 6 to 10 hours to design well and 90 minutes to update every quarter after that.
Dashboard design principles that survive an executive review
Numbers first. Charts second. Narrative third. Six numbers on the slide with no visual clutter. Two trend charts underneath. One paragraph of narrative context at the bottom. Nothing else. Executives read numbers in the first five seconds, charts in the next ten, and narrative only if the numbers demand explanation. Designs that lead with charts or narrative underperform so they lose the first five second attention window.
Narrative paragraph that lands the ask
The narrative paragraph names what changed this quarter, what changed since last quarter, and what the operating plan says about the coming quarter. Three sentences. No hedging. No qualifications. The narrative earns the ask for the coming quarter’s budget by tying the numbers to concrete operating decisions. Programs that hedge the narrative get renegotiated on budget every quarter. Programs with a crisp narrative get renewed automatically until the numbers change materially. The confidence in the narrative is a compounding operating advantage.
Real SaaS SEO ROI from a 24 month engagement
Rapyd Financial Network worked a specialist retainer across a 24 month engagement in fintech SaaS payments. Inbound sales pipeline crossed 1.8 million pounds across the engagement. Inbound leads tripled from roughly 5 per month at start to over 15 per month by month 18. Organic traffic grew roughly 3x from baseline. Program spend across the engagement ran roughly 480,000 pounds all-in. Peer SaaS clients that followed the same playbook include Rocket Software, Automation Anywhere, Simply.Coach, and Custimy, and each closed year one with a stable ROI story on the CFO dashboard.
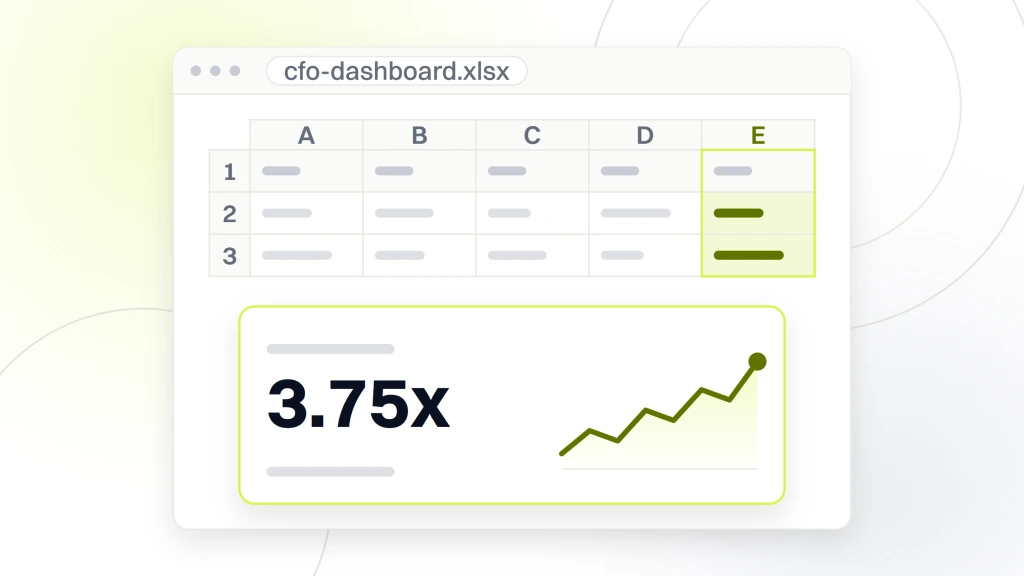
Pipeline-to-spend ratio hit 3.75x by end of the engagement. Applied to the fintech average close rate of 22 percent, ARR-to-spend ratio landed at roughly 0.82x closed ARR to program spend by month 24. That number continues compounding beyond the engagement window so the content assets keep ranking. The 24 month ARR-to-spend number understates the true long-term ROI. SaaS SEO assets produce pipeline for 3 to 5 years after publish.
What produced the Rapyd ROI
Two moves produced most of the SaaS SEO ROI. First, rebuilding the marketing automation stack so organic-sourced pipeline could be attributed cleanly through Salesforce back to the first-touch keyword. Without that reporting, the CFO would never have signed off on the retainer expansion in year two. Second, a category-level content sprint that positioned Rapyd against comparison keywords its fintech buyers were searching. That combination is the pattern the strongest SaaS SEO retainers deliver as table stakes. Related silo work at Search Engine Optimization Services.
What drove the year two renewal
Year two renewal came down to the CFO dashboard. Six numbers. One trend chart. One narrative paragraph. Delivered quarterly. That dashboard is the entire reason the CFO signed off on retainer expansion in year two rather than cutting the program during the mid-year budget review. Programs without a stable CFO dashboard get cut in the first downturn. Programs with one survive multiple downturns so the compounding math is legible on a single slide. Related roadmap at SaaS SEO Checklist.
Common mistakes that break SaaS SEO ROI reporting
Six patterns break SaaS SEO ROI reporting fastest. Reporting rankings and traffic instead of pipeline. Skipping the rolling 12 month window. Reporting to the CFO weekly rather than quarterly. Using only first-touch attribution. Not calculating CAC payback per channel. Not building a reusable CFO dashboard. Six mistakes we watch programs make repeatedly. Any two of them together and the CFO relationship gets adversarial by quarter three.
Every one of these mistakes is fixable inside 30 days once identified. The fix is process change rather than tool investment. That framing matters so most CMOs assume a broken reporting model needs new tooling. It rarely does. Fix the process. Reuse the tooling. The dashboard shape does more work than the tool investment.
Reporting rankings first is the loudest mistake
Rankings are inputs. Pipeline is the output. Every CFO conversation that opens with rankings drifts into skepticism inside 10 minutes so the CFO cannot connect rankings to revenue without a translation step. Every conversation that opens with pipeline-to-spend and ARR-to-spend stays on track through renewal. Move rankings to the appendix. Lead every executive report with the ROI ratios. The reordering itself changes the executive conversation shape completely and it takes 30 seconds to implement in the report template.
First-touch attribution only undersells the program
First-touch attribution captures the acquisition moment but understates the pipeline contribution by 30 to 50 percent. SaaS buyers touch 4 to 12 pieces of content across a 6 to 12 month buying cycle. Multi-touch smooths the noise and shows the assist contribution. Report both. Programs that report only first-touch consistently get budget cuts so the CFO sees a smaller number than the program actually produces. Programs that report first-touch and multi-touch together show the honest picture and defend the budget with real numbers rather than optimistic hedging. Related read at SEO for SaaS strategy.
Building the SaaS SEO ROI dashboard this quarter
Days 1 to 15 is data source verification across UTM discipline, CRM attribution model, and marketing automation reconciliation. Days 16 to 30 is drafting the six-number dashboard shape and validating each number against a peer’s baseline. Days 31 to 45 is the first full monthly report using the new dashboard. Days 46 to 90 is the first quarterly CFO review using the polished dashboard.
Skip any milestone and the dashboard drifts. Hit every milestone and the CFO gets calibrated to the right questions inside 90 days. The dashboard shape is one of the most durable operating artifacts in a SaaS SEO program so it protects the budget conversation through multiple quarters, multiple CMOs, and multiple market cycles.
Tooling that makes the dashboard sustainable
The dashboard runs on marketing automation attribution data plus CRM revenue data plus a small manual reconciliation layer. Marketing automation captures the touchpoints. CRM captures the closed ARR. Manual reconciliation catches the edge cases the automated systems miss. That three-layer approach produces a defensible number the CFO trusts. Tooling investment beyond marketing automation and CRM is rarely justified for the dashboard itself. Save the tooling budget for keyword research, competitor analysis, and technical monitoring. The dashboard is a process artifact rather than a tool output.
Monthly reconciliation with revenue operations
Monthly reconciliation with revenue operations takes 2 to 4 hours per month once the process is stable. Pull the automated attribution numbers. Pull the CRM closed ARR by source. Reconcile the deltas. Fix the systemic issues that surface repeatedly. That reconciliation pass is what turns automated numbers into defensible executive reporting. Programs that skip reconciliation watch attribution numbers drift over 12 months and lose CFO trust when the CFO’s finance team spots the discrepancy independently. The 2 to 4 hours per month is one of the strongest returns on time in the entire operating plan.
Final signals the SaaS SEO ROI reporting is working
The CFO stops asking about rankings in the quarterly review. The board renews the marketing budget without a fight. The VP of finance asks smart questions about pipeline attribution rather than pushing back on the numbers. The CMO uses the dashboard in the board update rather than rebuilding a custom slide. All four signals in the same quarter and the SaaS SEO ROI reporting is working as designed.
Programs that hit those four signals rarely have budget conversations turn adversarial. Programs that hit none of the signals watch every quarterly review drift into skepticism. The reporting model is the difference between a program that renews automatically and a program that fights for budget every quarter. Fix the reporting first. Everything else compounds from there. Related read at Technical SEO for SaaS.
Anti-patterns to catch before they become habits
Reporting weekly to the CFO. Rebuilding the dashboard every quarter. Reporting rankings on slide one. Skipping the rolling 12 month window. Not calculating CAC payback per channel. Not reconciling with revenue operations monthly. Six anti-patterns that turn a working reporting model into an adversarial one over 6 to 12 months. Every one of them is fixable inside 30 days once identified. Catch them before they become team habits and the ROI reporting stays clean through year one and beyond.
Signals to raise in the next quarterly review
Rolling 12 month pipeline-to-spend below 3x by month 15. CAC payback for organic-sourced customers slower than paid-sourced. Rank position declining on the top 20 pipeline-contributing keywords. Content pattern mix drifting away from the six proven patterns. Technical debt items closed dropping below 10 per quarter. Any of these signals in the next quarterly review is worth raising with the VP marketing and the CMO. Fix the operating plan before the numbers slide further. Silence on these signals is how quarter three becomes a difficult budget conversation. Google’s own guidance on measuring value at Google Search Console guidance is worth a re-read every quarter.