
Enterprise SEO ROI is the gross profit an organic program returns against everything it costs you, modeled month by month rather than summed once at the end of a year. The arithmetic is ordinary. What makes it hard at this size is that most of the inputs belong to other departments, and the only one search people are qualified to supply on their own is the traffic forecast.
Get the model wrong and you do not just lose one meeting. You lose the next two budget cycles. A number nobody can re-derive in front of finance gets marked down to zero the moment somebody asks how you built it, and a program that was working can be cut on the strength of a spreadsheet no one could audit. So everything below is built to be handed over and picked apart.
One disclosure before the arithmetic starts. We are paid to run enterprise search programs, the work set out on our own enterprise SEO page, so this article models a purchase we would like to sell you. That is a reason to check the model rather than to trust it. Every input below is a number you pull from your own systems, and the same model returns a negative answer when your numbers say it should.
What an enterprise SEO ROI model has to do that a formula cannot
The formula everyone quotes is return minus investment, divided by investment. Nothing is wrong with it. It is the same arithmetic your finance team applies to a warehouse or a hire, which is exactly why it is the right frame to bring to a CFO. Siteimprove’s page on proving search value reduces it to the same two quantities, saying “All you need are two numbers” and then conceding that getting those two numbers for search is “a little more challenging” than getting them for paid media.
Five things break that simplicity once the organization is large.
- The cost sits in several budgets. The retainer or the headcount is visible. Engineering sprints, content production, translation, legal review and the platform license are booked somewhere else, often to teams with no reason to tell you what they spent.
- Spend and return land in different quarters. As Blu Mint’s article for C-suite readers puts it, “Investment and return happen on different timelines.” That breaks any calculation that matches a month of cost to the same month of revenue.
- Nobody will switch it off to test it. The same page says the quiet part out loud, that “no sane business turns off SEO entirely to see what happens”. So you never get the clean holdout that makes a paid channel easy to prove.
- The revenue is contested. Two or three teams can each claim the same closed deal, and all of them can be right under their own attribution model.
- The program is not one thing. A technical fix, a template rewrite and a content build have different lags, different costs and different failure modes, so one blended number hides which part is earning.
So the deliverable is not a percentage. It is a small model with named inputs, a stated horizon and a range, which anyone in the room can re-run against their own assumptions. If you are not yet sure whether you belong in the enterprise category at all, settle that first, because it changes which costs belong in the file.
The inputs the model runs on, and whose numbers they are
Every input an enterprise SEO ROI model runs on is yours. None of them is a figure we can supply, and any article that hands you a conversion rate is handing you somebody else’s business. Write the owning department beside each one in the file, so that when a number is challenged in review the answer is a name rather than an argument.
| Input | What it is | Who owns the number |
|---|---|---|
| Baseline non-branded clicks, C | Organic clicks you earn today from queries that are not your brand | You, from Search Console with a brand filter you write down |
| Incremental clicks, G in month t | Extra non-branded clicks the program is forecast to add that month | You, from the tracked keyword set and your own Search Console click rate by position |
| Action rate, R | Share of non-branded organic visits that become a lead or an order | Analytics owner, organic segment only |
| Close rate, Q | Share of those actions that become paying customers | Sales operations, from the CRM |
| Value per customer, V | Contract value, or lifetime value if you can defend the retention period | Finance |
| Gross margin, M | What survives the cost of delivering what you sold | Finance |
| Program cost, S in month t | Everything the program consumes that month, not just the invoice | You and finance together |
| Lag, L | Months between a change shipping and its traffic maturing | Your own release and indexing history |
| Discount rate, d | Monthly form of the hurdle rate your company already uses | Finance |
Two of the nine are genuinely yours to forecast, C and G. The rest already exist inside the business, which is good news, because a model assembled from numbers finance recognizes is far harder to dismiss than one built from industry averages. It also means your first week of work is a series of requests to other teams, not a spreadsheet.
Why an enterprise SEO calculator prints somebody else’s answer
Search for an enterprise SEO calculator and most of what comes back is a tool rather than an article. Several of them are honest about their own limits. Angleout’s calculator labels its output “Estimates only.” and explains the chain plainly, that “Lead rate and close rate turn incremental clicks into deals and annual contract value.” Digital Snowstorm’s page tells you to “Override any default with your own data.” and adds the sentence this whole discipline turns on, that “A model that admits its assumptions is the one a finance team trusts.”
The danger is not the arithmetic. It is the defaults that stay in the box when you are in a hurry. Directive’s forecasting article recommends your own historical rate, then offers a fallback, saying that in its absence “you can either use your overall historical conversion rate or use the B2B Enterprise industry standard of 1.5 – 3%.” That is a fair fallback for a blog post and an indefensible input for a budget request. The top of that band is exactly twice the bottom, and revenue in this model moves in direct proportion to the rate, so picking the wrong end of it doubles or halves your answer before a single other assumption is touched.
Percepture’s calculator page frames the underlying idea well, that “It is a probability model.” A probability model built on your rates is a forecast. The same model built on a stranger’s rates is a brochure. Use a calculator to check the shape of your thinking, then rebuild it as an enterprise SEO ROI model in a file you own, where every cell traces back to a system somebody in your company administers.
Count non-branded clicks, not organic sessions
The single fastest way to lose credibility is to open with total organic sessions. That number includes everyone who typed your company name, everyone returning from an email, and every customer looking for the login page. Your brand team, your paid team and your product created most of that demand, and finance knows it.
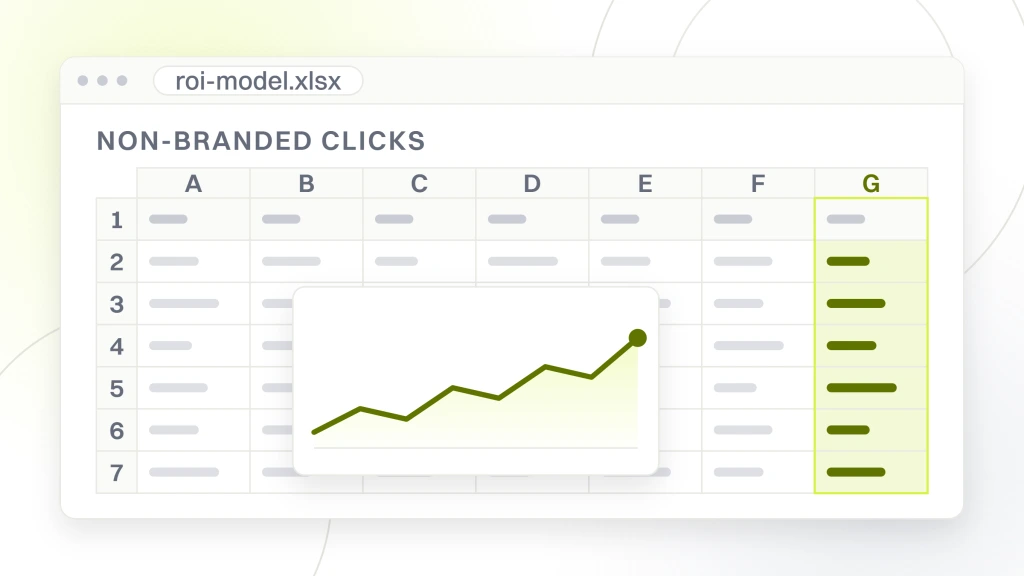
Build the baseline from Search Console clicks on queries that do not contain your brand, then reconcile that to the organic landing pages in your analytics platform. The two will not agree, because one counts clicks and the other counts sessions, and the gap is a real quantity you should state rather than hide. Pick clicks as the model’s currency and use sessions only as a sanity check.
The keyword set you track is what makes G forecastable, and it needs the same discipline as the baseline. That is a job of its own, and how a tracked keyword set gets designed covers the layers and the sampling rules. For the model, what matters is that every keyword in the forecast is one you can name, group by template, and hand to whoever has to publish against it.
Forecasting G itself is one step further, and it is the step most models skip. A position is not a click, so you need a rate that turns one into the other, and that rate has to be yours. Export a year of Search Console query data with clicks, impressions and average position on the same row, bucket the rows by position, and divide clicks by impressions inside each bucket. That gives you the click rate your own pages earn at each position, on your queries, in your market. Apply it to the positions your forecast moves the tracked set to, multiply by the impressions those queries already draw, and subtract what you earn today. Borrowing a published click curve instead puts a stranger’s number at the top of the chain, which is the same mistake as borrowing their conversion rate, and it is worse here because every figure below it inherits the error.
Turn clicks into money with your own funnel rates
The chain is short enough to write on a whiteboard. Incremental non-branded clicks, times the rate at which those visits take the action you care about, times the rate at which the action becomes a customer, times what a customer is worth. In the notation above, revenue added in month t is G times R times Q times V.
If you sell online rather than through a sales team, drop Q and set V to average order value, then decide explicitly whether you are modeling the first order or the orders a customer places across the horizon. Both are legitimate. Only one of them is what your finance team means by customer value, so ask before you choose.
Three rules keep the chain honest. Pull R from the organic segment alone, never from the site average, because paid and email traffic arrive with different intent. Pull Q by source as well, since leads from a comparison page rarely close at the rate of leads from a demo request. And use one period for every rate, so a quarterly close rate is not quietly multiplied by a monthly action rate.
Model gross profit, because finance will apply the margin anyway
Revenue is a marketing number. Gross profit is a finance number, and it is the one the budget is actually compared against. Multiply the revenue line by M and present that as the return. You will show a smaller figure than the vendors pitching alongside you, and a figure that survives the first question.
Margin also changes what the program should target. If two template families sell at different margins, a click on the lower-margin one is worth less to the model even when it converts better, and your content priorities should move accordingly. That single adjustment often reorders a roadmap that was built on search volume.
For subscription revenue, use the margin on the contract and state the retention period you assumed, because lifetime value is where optimistic models do their damage. A retention period chosen because it made the total look better is the one assumption a CFO will find, and finding it discredits every other number on the page. Write it as an input with an owner, not as a constant.
The cost side is bigger than the invoice
Most models understate S, and they understate it in the same places. Directive’s list of commonly overlooked costs names two that decide the answer on their own, “Internal team salaries allocated to SEO or Content” and “Developer resources used for technical SEO and other on-page implementation”. Neither appears on any invoice, and at enterprise scale the second one is often the largest line in the whole program.
- Agency fees or the loaded cost of internal heads, using the fully loaded rate finance uses, not salary.
- Platform licenses, at the share your program consumes rather than the whole contract, since what the platforms charge is usually spread across several teams.
- Engineering and QA time, priced in sprint capacity taken from something else.
- Content production, design and translation, per unit and multiplied by the volume the forecast assumes.
- Review and approval time from legal, brand, compliance and regional teams, which is a real cost even though nobody bills it.
We sit on the receiving end of one of those lines, so apply the same rule to us. Ask any provider you are considering for a written scope and a single monthly figure before you build the cost side, and refuse to model a number somebody gave you on a call. A verbal range becomes a fixed input the moment it reaches a spreadsheet, and then nobody remembers it was verbal. What tends to sit inside that figure is its own subject, covered in what an enterprise program costs.
Model the ramp, or your first year reads as a failure
A flat model pays for twelve months of work and books twelve months of return, which no search program has ever done. Add a lag, L, before a shipped change produces traffic, then a ramp that brings it to full value over several more months. The honest version has a different lag per work type, because they behave differently.
Our own page states the split we would defend, that “Technical fixes can move indexing within weeks. Content and authority take longer, because your release cycle and sign-off set the pace.” Read the second half of that sentence carefully, because it is the part you control. If your release train ships monthly and your legal review takes three weeks, your lag is a property of your organization rather than of search.
Get L from your own history. Take the last set of template changes you shipped, find the date they were indexed, and measure how long the click curve took to flatten. That is a defensible number with a date behind it. The sequence that produces those changes in the first place is set out in the audit that produces the fix list, and what the following year looks like is covered in the twelve months after sign-off.
Payback month and present value beat a single ROI percentage
Run the model month by month and keep a running total of gross profit minus cost. Two outputs come out of that column, and both mean more to a CFO than a percentage. The payback month is the first month where the running total turns positive. The present value is the same stream discounted at the rate finance already uses for everything else it approves.
The reason to prefer them is that a percentage hides the shape. Two programs can return the same figure over three years while one pays back in month nine and the other in month twenty-two, and only one of those survives a hiring freeze. The horizon matters just as much, so state it in the same sentence as the result and use the horizon finance uses for other investments rather than the one that flatters yours.
If you do report a percentage, report it as gross profit minus total program cost, divided by total program cost, over a named number of months. Label it. An unlabeled return figure is the fastest way to be asked a question you cannot answer in the room.
Incrementality, or what your organic would have earned anyway
This is the question that decides whether the model is analysis or advocacy. Your site already earns non-branded clicks. Some of next year’s organic revenue arrives whether or not the program is funded, and counting all of it as a return is the error a sharp CFO looks for first.
You cannot settle it experimentally at the whole-site level, which is exactly the point made above about nobody turning search off to see what happens. What you can do is state a counterfactual and defend it. Pick one of three, and say which you picked. A flat baseline holds today’s non-branded clicks steady. A declining baseline applies the trend your own last twelve months show. A market baseline moves your baseline with total impressions for your category, so a rising tide is not booked as your work.
Where you can run a real test, run it. Hold back a set of comparable templates or a region for a defined period, ship the work everywhere else, and compare. It is imperfect and it is far better than an assumption, and a single honest holdout will buy you more credibility in a budget review than a decimal place anywhere else in the file.
Publish a range and the assumptions behind it, never one number
Run the model three times. A conservative case takes the low end of your forecast click gain and your measured action rate. A base case takes the midpoint. An aggressive case takes the high end, and exists mostly so the room can see how much of the answer depends on optimism. Present all three with the payback month for each.
Then find out which input the answer actually rests on. Move one input at a time by the same proportion and record how far the output moves. The input that swings it the most is where your research time belongs, and it is usually the click forecast rather than anything downstream. Digital Snowstorm’s page puts the general rule in one line, that “Accurate ROI measurement needs your real GA4, CRM, and finance data.”
Four assumptions belong on that first tab by name, because they are the four a finance reader will test.
- The attribution rule that decided which revenue counted as organic, named rather than implied.
- The counterfactual your baseline assumes, whether flat, declining, or moving with your category.
- Revenue or gross profit on the return line, and the margin you applied to get there.
- The lag and the ramp, with the shipped changes you measured them from and the dates.
Send the file with the assumptions visible on the first tab. An enterprise SEO ROI model a skeptical reader can re-run with their own numbers gets argued with, which is the point. A model that arrives as a rendered chart gets believed for one meeting and ignored afterward.
What to do when the model says no
Sometimes the honest answer is that the program does not clear the hurdle. Low margins, a small addressable click pool, or a release cycle so slow that L swallows the horizon can each produce a negative present value with no bad faith anywhere in the file. A model you would never act on is decoration, so be ready to act on this one.
Before abandoning it, test three narrower versions. Restrict the program to the two or three templates with the best margin and the most addressable demand. Spend on conversion rate instead, since improving R lifts every future click you already earn rather than buying new ones. Or fund the technical work alone, which usually carries the shortest lag and the smallest content bill.
If none of those clears it, say so in writing and spend the money elsewhere. An SEO lead who has recommended against their own program once is believed the next time they recommend for it, and that credit is worth more than a year of budget you could not defend.
What we would do first with an enterprise SEO ROI model on your desk
We would read the cost line before the revenue line. Most models are generous about the return and silent about engineering time, and the second habit is the one that makes the first one matter. Then we would look for the counterfactual, because a model without one is a growth forecast wearing a business case as a costume.
Third, we would check that the model’s outputs can actually be measured once the program starts, which is a reporting question rather than a modeling one. If the inputs cannot be refreshed monthly from the same systems, the model dies at the first review. Our own enterprise page sets the bar we hold ourselves to, that “Rankings go in the appendix.” The plumbing that makes that possible is in the reporting layer underneath those numbers, and the short list of figures worth putting in front of directors is in the metrics an enterprise board reads.
Build the file, name every assumption, and take it to finance before you take it to your CMO. If you want an outside read on the click side of it first, our free growth audit comes back as a written report inside 24 hours, with the findings sorted by what to fix first and what not to fund yet. Whether you run the program in house or hire anyone at all, an enterprise SEO ROI model earns its place by being checkable, and a number that cannot be checked is worth nothing in the room where the budget is decided.