A sales funnel is the mapped path a stranger walks from first click to signed deal, split into 4 measurable stages you can count on. Those stages are Awareness, Interest, Decision, and Action. Every stage carries a conversion number, so you can spot where 60 to 90 percent of visitors drop off. You fix the biggest gap first. That single discipline turns a random content-and-ads program into a pipeline you can forecast.
This guide gives you the plain-English breakdown. You get the 4 stages, the 1898 origin story, real numbers from our client work, the tracking stack we install on every account, and the 7 mistakes that kill more funnels than any competitor ever will. Read straight through in about 9 minutes. Save the template. Apply it on the next campaign you build for your own account.
What is a sales funnel in plain English
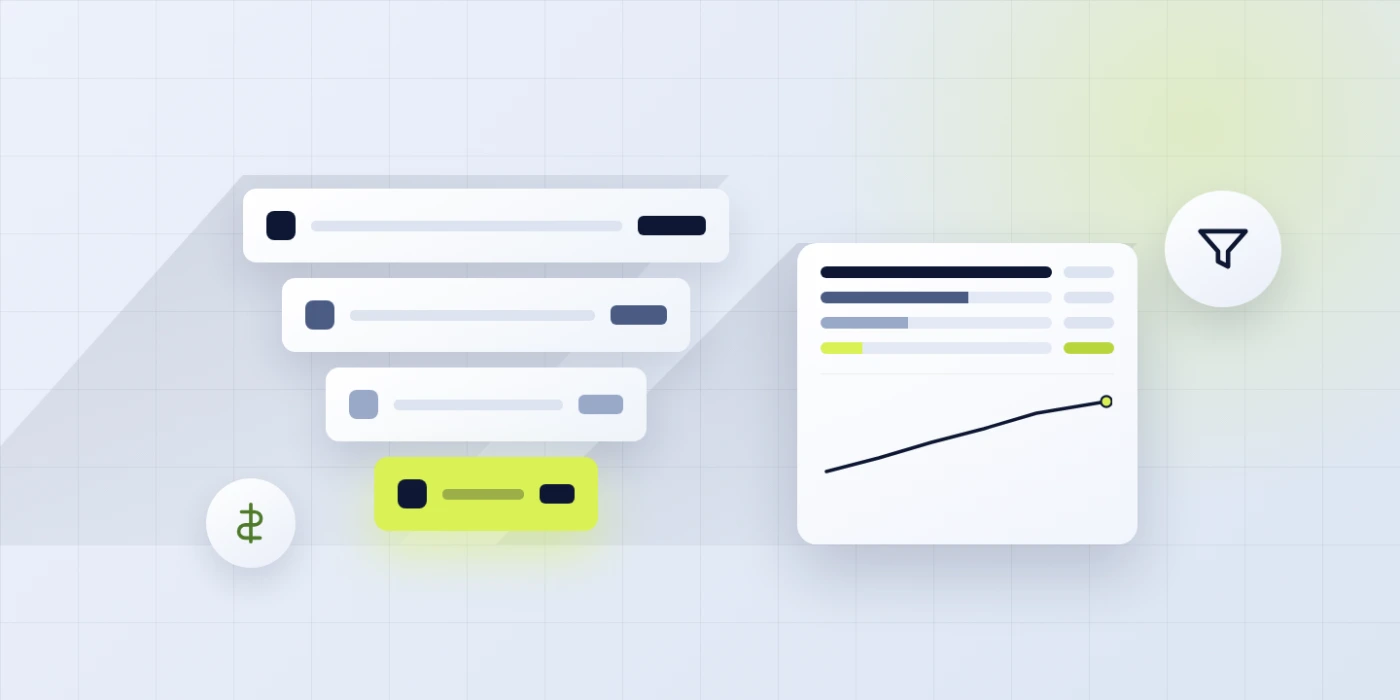
A funnel is the path a stranger walks from first click to signed deal, split into 4 measurable stages. Awareness pulls a stranger in. Interest gets them to trade an email. Decision moves them into a conversation. Action closes the deal. Every stage carries a number, so you know exactly where people drop off.
Every funnel drops off at every stage. The shape is a funnel for a reason. 100 percent of visitors do not turn into 100 percent of customers. 10,000 visitors might become 1,200 email subscribers, 180 sales conversations, and 24 signed deals. Those numbers tell you the conversion rate at every step. You get 12 percent visitor to lead, 15 percent lead to conversation, and 13 percent conversation to deal. You can’t fix what you can’t count, so the numbers matter more than the diagram.
The point of running a funnel instead of running random marketing is diagnostic clarity. You spend $8,000 on Google Ads and get zero deals. Without a funnel, you blame Google Ads. With a funnel, you see Google Ads brought 3,200 clicks and 420 email subscribers, but only 6 booked calls. The problem sits in the middle, not at the top. Doubling ad spend fixes nothing. Fixing the middle turns the same 420 subscribers into 40 conversations and 8 deals. Same top, 4 times the revenue.
Funnel thinking versus channel thinking
Most small businesses think in channels. They spend $2,000 on Facebook Ads, $1,500 on Google Ads, and $800 on email. When results disappoint, they cut the worst channel. Funnel thinking flips that. You spend the same $4,300 and track every dollar to a stage. You find out Facebook drives cheap top-of-funnel awareness, Google catches decision-stage buyers, and email closes them. Cutting any one of the 3 cuts the deals you’re already closing. Funnel visibility saves the account from a bad cut.
Funnel thinking protects your team from the cheapest trap in digital marketing. That trap is blaming a channel for a middle-stage problem. When leads come in and never close, the reflex is to cut the channel and try a new one. That move usually hides the real bug, which sits in your follow-up flow or your offer. A real funnel forces the diagnosis before the reaction.
Sales funnel definition and where the model comes from
The definition traces back to Elias St. Elmo Lewis in 1898. Lewis wrote about advertising for the National Cash Register Company and mapped the buyer path as Attention, Interest, Desire, Action. That AIDA model still shows up in every marketing textbook. The modern digital version adjusts the labels and adds analytics, but the core logic is the same. You can’t skip stages. You can’t close a deal with a stranger who has never heard of you.
The modern version renamed the stages to fit digital tracking. Attention became Awareness so you can count impressions. Interest and Desire compressed into a single Consideration stage since both show up as content views and email opens in analytics. Action stayed Action but split into Decision and Close for teams with a real sales cycle. You get a 4-stage model that maps cleanly to Google Analytics 4 events, HubSpot lifecycle stages, and Salesforce opportunity stages.
The meaning of the model shifted once tracking got good. Before analytics, the funnel was a mental model for sales reps. After analytics, it became a data structure your marketing team, sales team, and finance team all read from the same dashboard. Every stage transition is a database event. Every drop-off is a percentage. Every dollar of ad spend traces to a stage. That’s why this definition matters more today than it did in 1898.
AIDA meets modern analytics
Google Analytics 4 lets you build funnel reports out of any 4 events. HubSpot ships lifecycle stages that map to a 5-stage funnel out of the box. Salesforce opportunity stages give you the sales-side cut. Pick one system as your source of truth. Don’t run 4 dashboards showing 4 different conversion rates. Sales, marketing, and finance need to read the same numbers from the same tool, or the funnel meetings turn into arguments about whose data is right.
The 4 stages of a sales funnel explained
4 stages cover almost every funnel we build. Awareness pulls strangers to your site. Interest gets them to raise a hand with an email or a form fill. Decision moves them into a booked meeting or an active shopping cart. Action closes the deal. Every stage has a hand-off metric and a next-best-action rule. When someone hits the trigger, they move stages. When they stall, a nurture sequence tries to move them along.
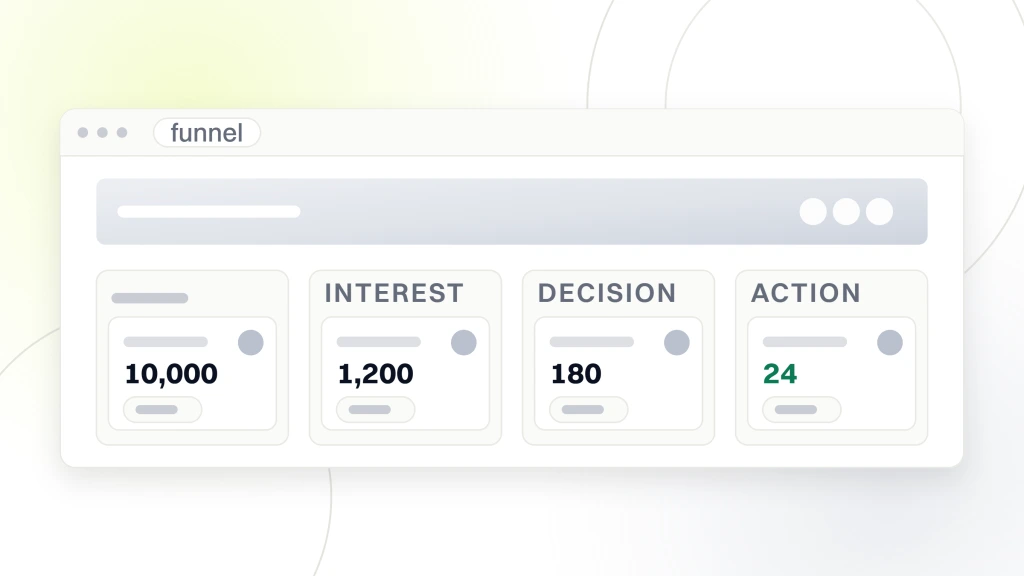
- Awareness. Ad impressions, blog pageviews, YouTube plays. Stranger meets brand.
- Interest. Email opt-in, guide download, webinar signup. Stranger becomes a known contact.
- Decision. Booked call, product demo, quote request. Contact becomes an opportunity.
- Action. Signed contract, purchase, subscription start. Opportunity becomes a customer.
- Retention. Renewals, upsells, referrals. Customer becomes an advocate. Optional stage for subscription work.
Awareness stage, how strangers find you
The Awareness stage runs on SEO, paid ads, PR, and organic social. You count impressions, sessions, and unique visitors. The right number here depends on your average deal size. A $500 product needs 20,000 visitors a month. A $50,000 service contract needs 800. Both funnels work. Both need the top loaded before anything else matters. If nobody shows up, no stage below matters. Load the top before you optimize the middle.
Interest stage, first exchange of value
The Interest stage runs on lead magnets, email opt-ins, and guide downloads. A stranger trades an email address for something useful. You now have a contact in the CRM. Typical conversion from visitor to lead sits at 2 to 5 percent for cold traffic and 8 to 15 percent for warm traffic like retargeted visitors. If your visitor-to-lead conversion sits under 2 percent, the offer is wrong or the page is broken. Both are cheaper to fix than more ad spend.
Decision and Action stages, closing the deal
Decision stage runs on demos, discovery calls, and proposals. Action stage runs on contracts, checkout pages, and payment forms. Together they own the last 10 to 20 percent of the deal. Decision-to-Action conversion depends heavily on offer quality and sales process. B2B services usually see 20 to 40 percent close rates on qualified opportunities. Ecommerce sees 60 to 80 percent checkout completion rates on added-to-cart sessions. Both are trainable and both should climb every quarter if the process is working.
Why sales funnels beat random marketing every time
Funnels beat random marketing since they give you diagnostic clarity that channel thinking never can. You see which stage drops off, not just which channel underperformed. You fix the biggest gap first. You spend the next dollar where the math says it works. Random marketing spends on gut feel. Funnel marketing spends on stage numbers.
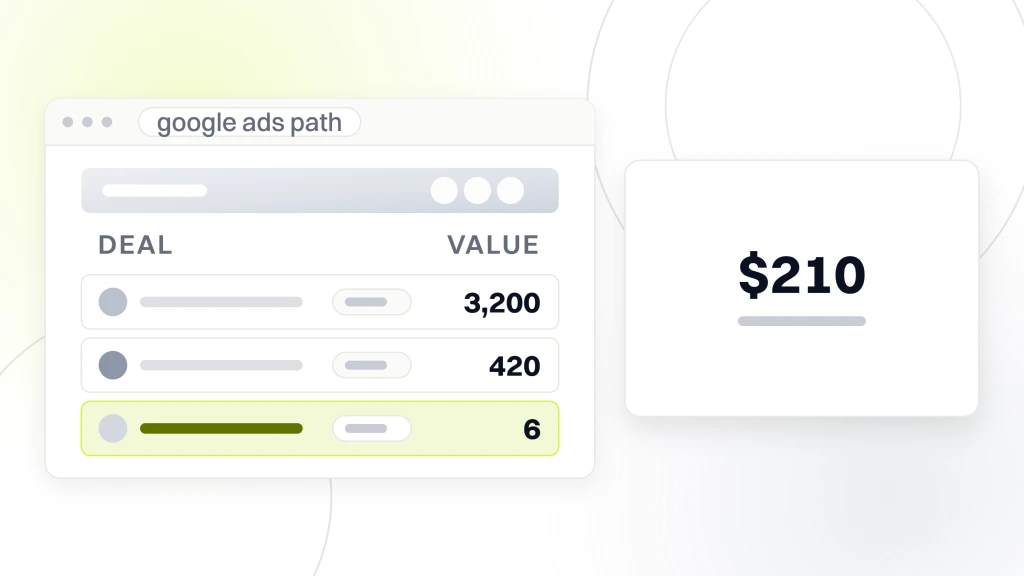
A funnel is how you defend a marketing budget. Finance doesn’t care that your Google Ads clicks doubled. Finance cares that cost per opportunity dropped from $340 to $210 and closed deals climbed 22 percent. Those numbers only exist if you run a real funnel. Without one, you argue about “brand” and “attribution” and lose the argument to the salesperson who booked 6 meetings from cold calls. Numbers win budget fights. Random marketing loses them.
Every serious agency runs a funnel across every client account, not since it looks good in a slide deck, but since it’s the only way to tell an underperforming stage from a broken channel. You save clients thousands of dollars a quarter just by pointing to the right stage. That’s the practical value of funnel thinking over channel thinking. You get diagnostic clarity, and diagnostic clarity is worth more than any single channel tactic ever printed on a blog.
Forecasting value of a real funnel
Once your funnel has 90 days of stage data, you can forecast. Same visitor count next month equals the same leads within 15 percent, the same conversations within 20 percent, and the same closed deals within 25 percent. That forecast lets sales hire ahead of demand, operations plan capacity, and finance model cash flow. Companies without a funnel forecast on gut. Companies with a funnel forecast on rolling 4-week averages. Guess which one plans a next quarter better.
What a sales funnel looks like in digital marketing practice
In digital marketing practice, this model is a live data structure inside your analytics and CRM that tracks every visitor from first touch to purchase. You define the events. You wire the tracking. You watch the dashboard. Every channel gets a UTM tag. The funnel is not a diagram on a slide. It’s a working pipeline.
Every mid-sized brand we work with runs their pipeline across at least 4 tools. Google Analytics 4 tracks visitor behavior. HubSpot or Salesforce holds the CRM. A call tracker like CallRail attributes phone calls. A dashboard tool like Looker Studio pulls it into one view. If any one of those 4 is missing, the funnel has a blind spot. Blind spots hide the biggest drop-offs. Every serious funnel we’ve audited started with a blind spot in the middle stage, and every one paid off within 60 days once we closed it.
Running the model in digital marketing changes what marketing does day to day. Instead of writing more content or running more ads, you spend most of the week reading numbers, testing a single stage, and copying what wins. You publish less. You test more. You get more deals from the same team size. Every quarter, funnel maturity climbs a step. Every year, the total cost per acquired customer drops. That compounding is why digital marketing pays back.
The tracking stack a modern funnel needs
The minimum tracking stack has 4 pieces. Google Analytics 4 with GA4 events wired for every stage transition. A CRM like HubSpot Free or Pipedrive Starter. A call tracker like CallRail or WhatConverts for phone leads. A dashboard like Looker Studio, Databox, or an in-house BI tool for the weekly review. Total monthly cost sits between $50 and $500 for a small business. That’s cheap for the diagnostic clarity a real funnel gives you.
Real sales funnel examples from client work
PCO Bookkeepers is a specialty accounting firm serving pest control and lawn care operators. When we started the engagement, their funnel had no CRM, no lead source attribution, and a growth rate that had been flat for 2 years. We rebuilt the funnel around Salesforce, added video-led nurture at the Interest stage, and split the Decision stage into a 2-touch discovery process. 3 years running, the account posted 100 percent year-over-year revenue growth for 3 straight years. The pipeline now delivers 300+ marketing-qualified leads per month, and market share doubled.
Rocket Software runs a SaaS subscriber-acquisition product. Their funnel had a broken onboarding flow that lost most trial signups before activation. We rebuilt the 4-stage funnel with a fresh drip sequence, activation-focused emails, and a 4-channel launch plan. Within the first month, the activation rate climbed 300 percent. The first week of the new launch delivered 3,000 customers. Post-launch, the funnel now brings in 400+ new subscribers daily. Same product, working funnel, different growth curve.
Both accounts share the same lesson. The channel mix was fine. The offer was fine. The middle of the funnel was underperforming, and losing revenue at the middle stage silently costs more than any Awareness-stage problem ever will. Once we fixed the middle, the same top-of-funnel spend produced multiples of the previous month’s deals. Every serious funnel audit we run finds this pattern. The biggest wins hide in the middle stage nobody is watching.
PCO Bookkeepers funnel numbers
Baseline. No CRM, flat growth, and an inconsistent pipeline. Impact after 3 years. 100 percent YoY revenue growth for 3 straight years, 300+ MQLs per month, and doubled market share over a 3-year window. Every one of those numbers traces back to a rebuilt funnel with real stage tracking and a real nurture sequence in the middle. The Awareness spend stayed roughly the same. The Interest and Decision stages did all the heavy work.
Rocket Software funnel numbers
Baseline. Broken onboarding and weak drip campaigns. Impact within the first month of the rebuild. 300 percent activation rate growth, 3,000 customers acquired in the first week, and a steady 400+ new subscribers daily post-launch. The Rocket account is proof that a fixed pipeline outperforms a bigger ad budget every time. Same team, same product, working funnel, 4-times better growth curve inside 30 days.
How to build a sales funnel from scratch
Building a working pipeline takes about 3 weeks for a small business and 8 weeks for a mid-sized brand. Define the 4 stages. Pick a metric per stage. Wire the tracking. Build the assets that move people through. Run for 60 days. Fix the biggest drop-off. Rerun. Repeat every quarter.
- Define your 4 stages and write one-sentence descriptions each team member can quote.
- Pick one primary metric per stage. Awareness is unique visitors. Interest is new leads. Decision is booked meetings. Action is signed deals.
- Wire Google Analytics 4 events for every stage transition and every CRM contact create.
- Install a call tracker if any part of your funnel involves phone calls. CallRail or WhatConverts both work.
- Build one lead magnet per audience segment at the Interest stage. Keep it useful in 10 minutes.
- Build a 5-touch email nurture sequence between Interest and Decision. Don’t over-engineer.
- Run the funnel for 60 days without changing the offer. Read the stage-to-stage conversion rates.
- Find the biggest drop-off. Fix that stage. Don’t touch the others yet.
- Rerun for 30 days. Read the new numbers. Move to the next biggest drop-off.
Every step above assumes you have someone who can run the analytics wiring, the CRM setup, and the email nurture. If you don’t, our Sales funnel and automation services covers the full build. The retainer starts at $1,499 a month for a small-business funnel and scales up for larger stacks with more channels and more automation.
What the first 30 days look like
Days 1 to 7 go to definition. Days 8 to 14 go to tracking wiring. Days 15 to 21 go to asset builds. Days 22 to 30 go to a soft launch on your existing traffic. You won’t see meaningful conversion data on day 30 if your traffic is still low. The point of the first 30 days is the plumbing, not the pipeline. The pipeline shows up in the next 60. Every serious build we run follows this order.
Sales funnel metrics that actually matter
Every funnel needs a small set of metrics you actually watch every week. Vanity metrics like total pageviews and total impressions belong on a monthly summary, not a weekly review. The weekly review reads 5 numbers. Unique visitors. New leads. Booked meetings. Signed deals. Cost per signed deal. Those 5 tell you everything about funnel health. Every other metric is a supporting detail you dig into only when one of the 5 moves.
| Stage | Metric | Benchmark (B2B services) | Benchmark (ecommerce) |
|---|---|---|---|
| Awareness | Unique visitors / mo | 800 to 5,000 | 20,000 to 250,000 |
| Interest | Visitor to lead rate | 2 to 8 percent | 5 to 15 percent (email popup) |
| Decision | Lead to opportunity rate | 10 to 30 percent | 60 to 80 percent (add to cart) |
| Action | Opportunity to deal rate | 20 to 40 percent | 60 to 80 percent (checkout) |
| Cost | Cost per signed deal | $150 to $2,500 | $18 to $180 |
The right benchmark for your funnel sits inside those ranges but depends on your niche and average deal size. A $50,000 legal contract can absorb a $2,500 cost per signed deal. A $80 pet-food subscription cannot. Read the ranges as guardrails, not targets. If your numbers sit inside the guardrails, focus on hardening the funnel and adding channels. If they sit outside, find the stage with the biggest gap to benchmark and fix that stage first.
Weekly funnel review pattern
Every Monday at 9 a.m., pull last week’s 5 numbers from your dashboard. Compare against the 4-week rolling average. Any number more than 15 percent off average gets a diagnostic dig-in. Any number more than 25 percent off average gets a same-day action plan. That 15-minute review keeps the funnel honest and catches problems before they turn expensive. Every marketing team we coach runs a version of this review, and every one that stopped running it eventually rebuilt the funnel from scratch.
B2B vs B2C sales funnel differences that matter
A B2B funnel and a B2C funnel share the same 4-stage skeleton but run on different clocks and different signals. B2B cycles stretch across weeks or months, with 4 to 7 stakeholders reading the same content. B2C cycles close in days or minutes, with a single buyer clicking through cart and checkout. Both funnels work. Neither template fits the other cleanly.
- Cycle length. B2B closes in 30 to 180 days for mid-market and 6 to 18 months for enterprise. B2C closes in minutes for impulse buys and 3 to 30 days for considered purchases.
- Decision unit. B2B pulls in 4 to 7 stakeholders per deal in a mid-market account. B2C usually has 1 buyer, sometimes 2 for household purchases.
- Content shape. B2B needs case studies, ROI calculators, and vendor comparisons. B2C needs product photos, reviews, and short video demos.
- Metric focus. B2B tracks cost per opportunity and deal size. B2C tracks conversion rate and average order value.
- Sales overlay. B2B funnels almost always end with a human closer. B2C funnels almost always self-serve at checkout.
Run the same dashboard shape for both, but read the numbers differently. A B2B funnel with a 3 percent visitor-to-lead rate can still be healthy since one lead is worth $50,000. A B2C funnel with the same 3 percent visitor-to-lead rate is bleeding since one lead is worth $80. Context sets the target, not the template.
Sales funnel vs marketing funnel
A marketing funnel and a sales funnel overlap in the middle but own different ends. Marketing owns Awareness and Interest, where the work is brand and lead generation. Sales owns Decision and Action, where the work is qualification and close. The hand-off happens at the marketing-qualified lead line, when marketing passes a contact who fits the ideal customer profile to a sales rep. Broken hand-offs are the single biggest cause of a “leads don’t close” complaint we hear.
Common mistakes that break every sales funnel
Every broken funnel we audit shows the same short list of mistakes. You’ll recognize most of these from your own account. The fix is almost always cheaper than the ad spend that was covering for the problem. Read the list, mark the ones that apply to your funnel, and pick the top 2 to fix this quarter. Don’t try to fix all of them at once. Sequential fixes compound. Parallel fixes get confused.
- No call tracker. Half your leads come through the phone and none of them show up in Google Analytics. Every audit finds this.
- One lead magnet for every audience. A single ebook can’t serve a startup founder and an enterprise procurement lead. Segment.
- Sales team ignores marketing leads. The funnel breaks at the hand-off. Fix the SLA, not the ad spend.
- No CRM. Every stage transition lives in someone’s head. Buy a CRM before you buy more ads.
- Chasing top-of-funnel volume. More clicks with a broken middle produces zero more deals. Fix the middle first.
- Too many channels. 3 half-run channels beat 6 half-run channels. Pick 3, run them well.
- No follow-up sequence. One email after a lead download doesn’t close deals. 5 touches, spaced 3 to 5 days apart.
The middle-stage blind spot
9 out of 10 broken funnels we audit are broken in the middle. Marketing loves the Awareness stage since the reports look good. Sales loves the Action stage since the commission math is clear. The middle stages sit between 2 teams and often between 2 tools, so nobody owns them. Fixing middle-stage attribution and nurture is the highest-value action you can take this quarter. It costs nothing beyond attention. It pays back the fastest.
Tools and software for running a sales funnel
Running a modern funnel needs 4 tool categories. Analytics, CRM, marketing automation, and a dashboard. Every category has free options that scale to about $50K in monthly revenue and paid options that scale past $5M. Start with free. Upgrade only when a tool starts costing you time. Don’t buy the enterprise stack on day one. Your first funnel will change 3 times as you learn what your buyer actually does. Pay for flexibility, not vendor logos.
Every mid-sized brand we serve eventually converges on a stack similar to HubSpot Marketing Hub Professional, Google Analytics 4, CallRail, and Looker Studio. Total monthly cost lands around $800 to $1,600 depending on contact volume. That stack replaces about $12,000 a month in wasted ad spend inside the first quarter, so the math pays back inside 30 days. Cheaper stacks work too. Pipedrive plus Mailchimp plus GA4 plus Databox runs about $200 a month and covers 80 percent of the same jobs.
Every tool decision should trace back to a stage you can’t currently measure or a workflow you can’t currently automate. If a tool doesn’t close a real gap, don’t buy it. Every serious funnel audit we do finds 2 or 3 subscriptions the client can cancel today without losing any capability. Buy for gaps. Cancel for redundancy. Don’t buy for FOMO on a competitor stack.
Free stack that runs a real funnel
HubSpot Free CRM, Google Analytics 4, MailerLite Free, and Looker Studio. Total monthly cost is $0. That stack runs a real 4-stage funnel with tracking, nurture, and a dashboard. You lose call tracking, advanced automation, and multi-user permissions, but you get everything else. Every startup we work with begins with a version of this stack. Nobody has ever needed to buy a paid tool in the first 90 days.
Paid stack for a scaling funnel
HubSpot Marketing Hub Pro, CallRail, Databox, and Semrush. Total monthly cost lands at $1,200 to $2,000. That stack runs a funnel at the volume a mid-sized brand needs. Multiple audience segments, phone call attribution, real-time dashboards, and keyword tracking for the Awareness stage. Every one of our accounts past $2M annual revenue runs some version of this stack. The cost pays back inside the first quarter on a working funnel.
Sales funnel vs sales pipeline vs customer journey
3 related terms keep showing up in the same conversations, and they mean different things. The funnel is your visitor-to-customer conversion path measured in stage rates. The sales pipeline is your CRM view of open opportunities with dollar values attached. The customer journey is the mapped experience of the buyer across every touch. All 3 overlap. All 3 matter. Every serious marketing operations team runs all 3 views on the same data.
The funnel is the answer to “where do we lose people.” The sales pipeline is the answer to “what deals will close this month.” The customer journey is the answer to “what does the buyer feel at each step.” Marketing owns the funnel view. Sales owns the pipeline view. UX and product own the journey view. When all 3 teams read the same underlying data, decisions get faster. When they read from 3 different tools, meetings turn into arguments.
Every mid-sized brand we consult with eventually adopts a single source of truth for stage data, usually inside HubSpot or Salesforce, then builds funnel, pipeline, and journey views on top of that source. That single-source discipline is the biggest operational fix we recommend after fixing middle-stage attribution. It removes 3-fourths of the friction between marketing and sales. It’s the reason companies that run tight funnels grow faster than companies that argue about attribution every Tuesday.
Which view a manager reads and when
A marketing manager reads the funnel view every Monday. A sales manager reads the pipeline view every day. A product manager reads the journey view every quarter during the roadmap review. That cadence matches the decision cycle each role runs on. The funnel changes weekly. The pipeline changes daily. The journey changes quarterly. Reading each view at the wrong cadence produces false alarms and missed signals in equal measure.
Segmenting your sales funnel by audience and offer
A single funnel across every audience produces mush. Different buyers move through different stages at different speeds. A $200 SaaS trial closes in 3 days. A $200,000 enterprise contract closes in 7 months. Running both through the same funnel dashboard tells you nothing useful about either. Segment the funnel by audience or by product line. Read each segment separately. Compare within the segment, not across segments.
The right segmentation depends on your business model. Most B2B teams segment by industry and company size. Most ecommerce teams segment by product category and lifetime value tier. Most agencies segment by service line and average deal size. Every serious funnel we help build has 3 to 5 audience segments defined on day one, each with its own set of 5 weekly numbers. If your funnel has one segment covering every visitor, the data is telling you an averaged story that hides the real signal in every segment.
Segmentation fixes the middle-stage blind spot faster than any other single change. When you split the middle by audience, one segment usually shows a clear drop-off and one shows a clean flow. The clean flow tells you what a working middle looks like. The broken segment tells you exactly what to copy from the clean one. That side-by-side is the fastest diagnostic tool a funnel gives you. It only works if the segments are separated in the dashboard.
Starting with 3 segments
Start with 3 audience segments. New visitors from paid ads. Returning visitors from organic search. Existing contacts from email. Those 3 cover 80 percent of most funnels and give you a clean baseline. Add a fourth or fifth segment only when the first 3 show clear patterns and you need to zoom into one further. Every over-segmented funnel we audit was built by someone who tried to model 12 personas on day one. Don’t do that. Start with 3.
Make your sales funnel work this quarter
Once your funnel has 60 days of clean stage data, 3 things become possible. You can forecast next quarter within 20 percent. You can defend the marketing budget with numbers finance respects. You can hire ahead of demand instead of behind it. Every one of those gains compounds. Every one changes the way your team talks about growth. Every one is worth the 90 days of setup work the funnel takes to build.
From here, the natural next reads are the deeper posts in this cluster. Start with the sales funnel stages post to go deeper on TOFU, MOFU, and BOFU. Continue with how to create a sales funnel for the build sequence in full. If your business is B2B, the B2B sales funnel post covers the stage math for longer cycles.
Ready to hire a team that runs this exact playbook on your account. Our Sales funnel and automation services ships every project with a full 4-stage build, real tracking wiring, and a 90-day pipeline forecast. For broader marketing support alongside the funnel, our digital marketing services covers SEO, PPC, and web design in the same retainer.
The next 3 cluster reads
The 3 deepest follow-up posts in this cluster are the stages breakdown, the build guide, and the metrics dashboard. Read them in that order. The stages post takes 8 minutes. The build guide takes 12 minutes. The metrics dashboard post takes 10 minutes. Total time from here to a working funnel plan is about 45 minutes of reading and about 3 weeks of build. That’s a small investment for a pipeline you can forecast.