
Sales Funnel Management, Analytics, and Reporting Dashboards
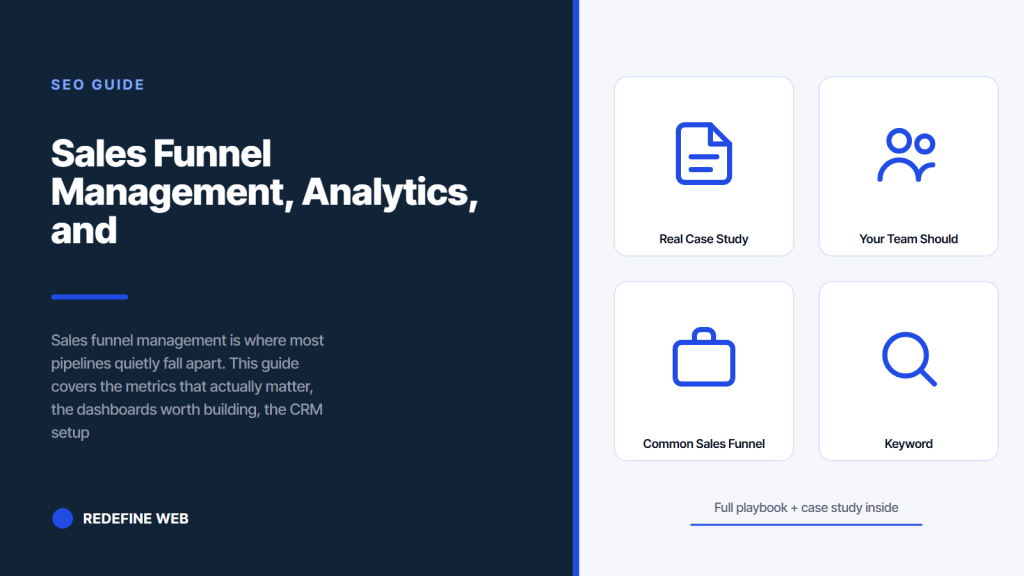
- Sales funnel management needs one owner, not shared ownership.
- Required-field automation stops garbage data at the source.
- Five to seven stages is the sweet spot for most B2B funnels.
- Weekly reporting cadence drives real diagnostic decisions.
- Forecast accuracy is the outcome that proves the process works.
- Sales funnel dashboards that get used
- Sales funnel CRM setup that stops garbage data at the source
- Sales funnel reporting cadence that keeps everyone honest
- A real case study on sales funnel management done right
- Sales funnel KPIs your team should be graded on
- Common sales funnel management mistakes we clean up
- Where to start on sales funnel management this quarter
Sales funnel management is where your pipeline either compounds or quietly falls apart. You have leads coming in, deals moving through stages, and a CRM that everyone claims is the source of truth. Then you look at last quarter’s numbers and half the fields are blank, half the stages are misused, and nobody agrees on what a qualified lead actually is. That gap between the funnel you think you have and the one your data describes is the reason most revenue targets get missed by 15 to 30 percent.
This guide is the practical read on sales funnel management. You get the metrics worth watching, the dashboards worth building, the CRM setup that stops garbage data at the source, and the reporting cadence that keeps sales and marketing honest. You also get a real case study, a comparison of the tools we see teams actually use, and the mistakes we clean up on almost every audit. Read straight through in about twelve minutes.
Sales funnel dashboards that get used
The best sales funnel dashboard is the one your team looks at every day. Most dashboards fail because they’re built for the executive team and ignored by the reps who need them most. If your reps aren’t opening the dashboard by 9 a.m., you built the wrong one. Here’s the layout that actually gets used.
Top of the dashboard: today’s activity. Meetings on the calendar, discoveries completed yesterday, proposals due this week, calls owed. This is the rep view, and it drives the day. Middle: pipeline by stage with age indicators. Any deal older than 1.5x the median stage time gets flagged red. Bottom: rolling 30-day trends on conversion, cycle length, and win rate. This is the manager view. All three views on one screen, refreshed hourly. Anything more complicated gets ignored inside two weeks.
The executive dashboard is a different animal
Your CEO doesn’t need to see individual deals. They need pipeline coverage against quota, a forecast with a confidence band, win rate trend, average deal size trend, and sales cycle trend. Five widgets, updated weekly, with a one-paragraph commentary from RevOps explaining what changed. That’s the entire executive dashboard. Anything more and you’ll spend the QBR explaining charts instead of talking about decisions.
The marketing dashboard connects to the top of funnel
Marketing needs a separate view. Leads generated by source, MQL rate by source, SQL rate by source, cost per SQL by source, and revenue attribution by source. This tells the marketing team which campaigns to double down on and which to kill. Without this cut, marketing keeps optimizing for lead volume while sales keeps complaining about lead quality, and neither team gets what it needs.
Sales funnel CRM setup that stops garbage data at the source
Every sales funnel CRM problem I’ve ever seen traces back to one root cause: nobody defined the stage entry and exit criteria at setup, so reps guess. Then the reports lie, and the whole team stops trusting the data. Fix this at the point of entry and everything downstream gets easier. Here’s the setup that works.
Define stage entry criteria as required fields on the deal record. If a deal moves to Discovery, three fields become required: budget confirmed, decision maker identified, and use case documented. The CRM enforces this. Reps cannot skip it. If a deal moves to Proposal, three more fields become required: quote sent date, procurement contact, and target close date. This kind of forced structure feels annoying for two weeks and then becomes the reason your forecasts are accurate. Make sure your CRM admin knows how to build the required-field logic per stage.
| CRM tool | Best for | Funnel management strength | Watch out for |
|---|---|---|---|
| HubSpot | Marketing-heavy teams under 100 reps | Built-in reporting, no engineer needed | Enterprise pricing gets steep fast |
| Salesforce | Enterprise with dedicated ops | Deepest customization, unlimited stages | Needs an admin and 3-month setup |
| Pipedrive | SMB sales teams under 30 reps | Visual pipeline that reps actually use | Limited reporting depth |
| Close | High-velocity outbound teams | Built-in calling plus CRM | Weaker on marketing attribution |
| Zoho CRM | Budget-conscious mid-market | Full feature set at lower price | UI feels dated, slower velocity |
Required fields at every stage
The single highest-impact change we make on client audits is turning stage progression into a required-field checkpoint. Reps hate it for a week. Sales leadership loves it forever. Forecast accuracy jumps 20 to 40 percent inside a quarter because the data behind the numbers is real for the first time. If your CRM doesn’t have deals with missing budget fields, you’re already ahead of 70 percent of teams.
Automation rules that catch bad data
Set up automation to flag deals that violate hygiene rules. Deals sitting in one stage for more than 2x the median stage time get auto-flagged for review. Deals with no activity in the last 14 days get auto-flagged. Deals missing required fields get bounced back to the prior stage until the fields are filled. These rules run 24/7, catch problems before your weekly review, and remove the need for humans to police data quality. That last part is what makes the whole system stick.
Sales funnel reporting cadence that keeps everyone honest
Sales funnel reporting fails when the cadence is wrong. Report too rarely and problems compound before you see them. Report too often and everyone starts gaming the numbers. The rhythm that works is daily leading indicators for reps, weekly funnel review for managers, monthly deep-dive for RevOps, and quarterly strategic review for the executive team. Each meeting has a distinct purpose and a distinct decision output.
The weekly meeting is the workhorse. Every Monday morning, sales managers pull up the funnel dashboard, walk through the stage-to-stage conversion rates from last week, compare to the trailing 4-week average, and flag anything more than 10 percent off. For each flag, the manager assigns a diagnostic action to a specific rep or team. Nothing gets closed until the next Monday. This is boring, repetitive work. It is also the reason some teams hit forecast quarter after quarter while others miss.
The monthly RevOps deep-dive
Once a month, RevOps runs a cohort analysis on the last 90 days of deals, compares to the trailing 12 months, and produces a one-page memo with three sections: what changed, why it changed, and what we’re testing to fix it. That memo goes to the CRO and the CMO. It never runs more than one page. If it runs longer, nobody reads it and the whole exercise stops. Constraint drives clarity.
Quarterly strategic review with the exec team
The QBR is where funnel management meets business strategy. You look at trailing quarterly trends on all core metrics, compare to plan, and decide whether the funnel needs structural changes for the next quarter. New stage added? Existing stage split? Segment focus shifted? These are decisions that belong at the exec level because they cascade to comp plans, quotas, and team structure. Run the meeting off the funnel dashboard, not off a pre-built deck. Live data beats slides every time.
Ask 3 reps to define a qualified lead in one sentence. If you get 3 answers, no new dashboard fixes the pipeline. Fix the definitions before the tool.
A real case study on sales funnel management done right
Rocket Software, Inc. came to us with a SaaS subscriber-acquisition tool that had a broken funnel. Activation rate sat at 7 percent. Onboarding was leaking users in the first 24 hours after signup. Drip campaigns were weak, and the team could not see which stage of the acquisition funnel was actually bleeding conversions. Marketing was blaming product. Product was blaming marketing. Both sides had partial data. Neither side had the full picture.
We rebuilt the funnel management stack from the top down. Stage definitions got redrawn. Signup, first login, feature activation, and paid conversion each got explicit entry criteria. Every event got instrumented. A single dashboard tracked stage-to-stage conversion, time in stage, and cohort progression. The first cohort analysis found that 60 percent of signups never reached first login inside 24 hours, which is where the whole funnel was breaking. Fix the first-login prompt with a targeted email and an in-app nudge, and activation rate went from 7 percent to 28 percent inside 30 days. That’s the 300 percent activation gain Rocket saw. Week one after relaunch, 3,000 customers signed up. Post-launch, the funnel steadied at 400+ new subscribers per day.
What worked inside the Rocket Software rebuild
Three things carried the whole engagement. First, funnel visibility. Once every stage transition was instrumented, the team could see the drop-off point in real time. Second, cohort tracking. Watching the first-24-hour cohort by acquisition source revealed that paid social users were dropping 3x faster than organic search users, which changed the paid social nurture sequence overnight. Third, weekly reporting cadence. Every Monday the growth team walked through the dashboard, flagged the worst-performing cohort, and shipped a test that week. That rhythm turned a broken funnel into a compounding one inside a quarter.
Transferable lessons for your own funnel
The Rocket playbook translates to any SaaS or B2B funnel where stage transitions are digital events you can instrument. Define stages. Instrument every transition. Cut cohorts by source. Review weekly. Test at the weakest stage every cycle. The whole loop takes about six weeks to set up and pays back within one quarter. Skip any step and you get partial gains that don’t compound. See our B2B SaaS marketing agency for the full stack we run for SaaS clients.
Every sales leader has the same conversation with their team about pipeline hygiene. “We need to update the CRM.” Silence. “Reps, please update your deals.” Silence. “Guys, seriously, the CEO is asking about forecast tomorrow.” One rep updates two deals. Another marks a deal as Won that closed three quarters ago. A third asks what the CRM is. You send an all-hands email. You add another required field. Repeat quarterly. The only permanent fix is required-field automation that won’t let a deal progress without the data. Everything else is theater.
Sales funnel KPIs your team should be graded on
Sales funnel KPIs need to roll up to individual rep scorecards, not just team dashboards. A rep who cannot see their own numbers every day cannot improve them. Here’s the KPI set we recommend for individual reps in a B2B sales role.
- Meetings booked per week against quota
- Discovery-to-opportunity conversion rate, trailing 30 days
- Opportunity-to-close rate, trailing 90 days
- Average deal size, trailing 90 days
- Sales cycle length, trailing 90 days
- Pipeline created per week
- Activity level: calls, emails, and meetings per day
Managers get a rolled-up version of the same set plus team-level metrics. Executives see the top three: pipeline coverage, win rate trend, and forecast accuracy. That layered KPI structure prevents the executive team from micromanaging deal-level detail while giving reps the visibility they need to improve their own numbers. Match the KPI to the role, not to the org chart.
Why forecast accuracy is the mother of all KPIs
If you can only track one KPI, track forecast accuracy. It measures how close your predicted quarterly revenue lands to the actual number. A team that hits within 5 percent of forecast every quarter has real sales funnel management. A team that misses by 20 percent every quarter has none, no matter what their dashboards look like. Forecast accuracy is the outcome that proves the process is working. Everything else is input.
Activity metrics are useful but limited
Activity metrics like calls per day and emails per day are useful for coaching but weak for scoring. High activity with low results points to a skill gap. Low activity with high results points to a great closer who might be underutilized. Use activity metrics to spot patterns in the coaching conversation. Do not use them as the primary comp driver, or your team gets busy instead of effective.
Common sales funnel management mistakes we clean up
We audit funnel management for clients regularly. The same five mistakes show up on 90 percent of engagements. If you can catch them in your own funnel, you’ll save yourself six months of pain.
- Stage names that mean different things to different reps
- No required-field enforcement, so half the deal records are incomplete
- Too many stages, so reps cheat by parking deals in one “safe” stage
- Dashboards built for executives that reps never open
- Reporting that celebrates volume instead of diagnosing conversion
Each of these takes a week to fix and returns a quarter of clean data. Do them in that order. Rename stages first, add required fields second, cut stages down to five to seven third, redesign the dashboard fourth, and rewrite the weekly report last. Every step compounds on the one before it. If you try to redesign the dashboard before fixing the underlying data, you get a beautiful dashboard showing garbage numbers, and nobody trusts it.
Why too many stages kills your funnel
Every stage you add is another data-quality risk. Reps have to update deals through every stage, and the more stages you have, the more transitions get skipped. Five to seven stages is the sweet spot for most B2B funnels. Under five and you lose diagnostic granularity. Over seven and you lose data reliability. Ecommerce funnels can be shorter, at three to four stages. Enterprise funnels can stretch to nine or ten if the deal cycle warrants it, but only if you have a real ops team to police the data.
Reports without decisions are noise
The final mistake is running weekly reports that never lead to decisions. If nobody assigns an action off the Monday review, the review stops mattering. Every metric flagged red needs an owner, an experiment, and a review date. If you cannot name those three things for each flagged metric, you’re producing reports, not managing a funnel. There’s a huge difference.
Where to start on sales funnel management this quarter
Start with your stage definitions. Get sales and marketing in a room, whiteboard the current stages, argue about entry and exit criteria for each one until you have a single agreed definition, and write it down. That document becomes the source of truth. Every rep gets it. Every new hire reads it in week one. This alone will improve your funnel data quality inside 30 days without touching your CRM configuration.
Then instrument the required fields at every stage transition. Then rebuild the dashboard around the rep view first, manager view second, exec view third. Then set the weekly review cadence and stick to it for a full quarter before you evaluate. Real funnel management is boring and repetitive. That’s why it works. Sexy funnel management usually means you’re chasing tools instead of fixing process. If you want a full audit of your current setup, our SaaS SEO Agency Tied to Pipeline & ARR team runs quarterly funnel diagnostics for B2B SaaS clients. For paid pipeline instrumentation, our SaaS PPC Services team connects ad spend to CRM stages. For the ecommerce side, our Ecommerce Marketing Agency for DTC and Shopify Brands covers the same stack applied to a shorter funnel. Sanity-check your stage definitions against the HubSpot sales funnel guide, Salesforce pipeline management resources, and the Harvard Business Review coaching study for the numbers side.
Frequently asked questions
What is sales funnel management and what does it cover
Sales funnel management is the day-to-day work of moving leads through defined stages, tracking what happens at each transition, and using that data to fix what's underperforming. The scope includes stage definitions everyone agrees on, entry and exit criteria per stage, CRM hygiene rules that stop bad data at the point of entry, a reporting rhythm that catches drift inside a week, and an escalation path when a stage stalls. Miss any of those pieces and the system reverts to spreadsheet chaos inside a quarter. Someone has to own the whole loop, usually reporting to the CRO or VP of Revenue Operations.
Which sales funnel metrics actually move revenue
The metrics worth watching fit on one dashboard. Stage-to-stage conversion rate for every transition, average time in stage for each stage, volume at the top of funnel split by source, lead-to-MQL and MQL-to-SQL rates, SQL-to-opportunity rate and opportunity-to-close rate, average deal size by source and segment, sales cycle length by segment, pipeline coverage ratio, win rate by rep and segment, and revenue attribution by first touch, last touch, and multi-touch. If a metric doesn't drive a decision in the next 30 days, it's noise. Cut the vanity numbers and the picture gets clearer fast.
How do you run sales funnel analysis without ending up with just another chart
Real sales funnel analysis is a diagnostic process that ends with an owner assigned to a specific fix, not with a chart. Start with stage-to-stage conversion rates over the last 90 days compared to the trailing 12 months. Any stage 15 percent below its historical average is a suspect. Then look at time in stage over the same window. Then cut by source and by rep. If a bottleneck is concentrated in one source or one rep, you have a targeted fix. If it's across the board, the process itself is broken. Data tells you what. Lost-deal interviews tell you why.
What does a sales funnel dashboard that reps actually use look like
The dashboard that gets used has three views on one screen. Top: today's activity for the rep. Meetings on the calendar, discoveries completed yesterday, proposals due this week, calls owed. Middle: pipeline by stage with age indicators flagging any deal older than 1.5x median stage time. Bottom: rolling 30-day trends on conversion, cycle length, and win rate for the manager view. Refreshed hourly. Anything more complicated gets ignored inside two weeks. Executive dashboards are separate and simpler: pipeline coverage, forecast confidence, win rate trend, deal size trend, cycle length trend.
How do you set up a sales funnel CRM to prevent garbage data
Every CRM data quality problem traces back to one root cause: nobody defined the stage entry and exit criteria at setup, so reps guess. Fix this by making stage entry criteria required fields on the deal record. If a deal moves to Discovery, budget confirmed and decision maker identified become required. If a deal moves to Proposal, quote sent date and procurement contact become required. The CRM enforces this. Reps cannot skip it. Feels annoying for two weeks. Then becomes the reason forecasts get accurate. Combine that with automation rules that flag stalled deals and missing fields.
What sales funnel reporting cadence works for most B2B teams
Daily leading indicators for reps, weekly funnel review for managers, monthly deep-dive for RevOps, and quarterly strategic review for the executive team. The weekly meeting is the workhorse. Every Monday, sales managers walk through the funnel dashboard, compare last week's stage conversion rates to the trailing 4-week average, and flag anything more than 10 percent off. For each flag, they assign a diagnostic action to a specific rep or team. Nothing gets closed until the next Monday. Boring, repetitive, and the reason some teams hit forecast quarter after quarter while others miss.
What are the sales funnel KPIs individual reps should be graded on
Individual rep KPIs should include meetings booked per week against quota, discovery-to-opportunity conversion trailing 30 days, opportunity-to-close rate trailing 90 days, average deal size trailing 90 days, sales cycle length trailing 90 days, pipeline created per week, and activity level covering calls, emails, and meetings per day. Managers get a rolled-up version plus team-level metrics. Executives see pipeline coverage, win rate trend, and forecast accuracy. Match the KPI to the role, not the org chart. And if you can only track one, track forecast accuracy. It's the outcome that proves the whole process is working.
Book your free 30-minute strategy call.
No spam, no sales rep. We use your email to schedule your call with a senior strategist. That is it.
More from the blog
View all articles → SEO
SEO Organic Search Engine Optimization Services That Grow Real Traffic
Read article SEO
SEO SEO for Pet Groomers That Fills the Appointment Book Weekly
Read article SEO
SEO