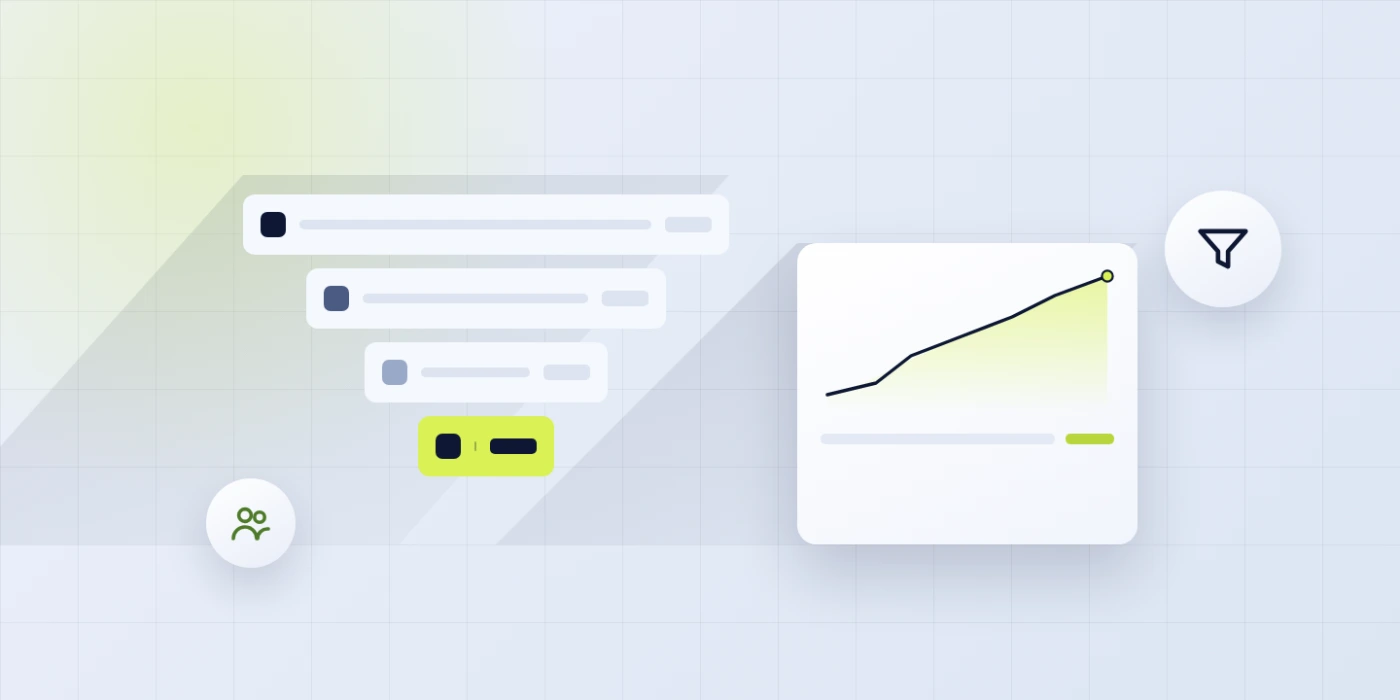
The SaaS sales funnel is the model every SaaS team draws on a whiteboard and few teams run cleanly. Most SaaS funnel diagrams come from B2B templates written for enterprise sales cycles, then get force-fit onto product-led motions where the buying behavior looks nothing like the template. The result is a set of SaaS sales funnel stages that show healthy volume at the top, mysterious drop-offs in the middle, and a revenue number that never matches what the marketing dashboard predicts. This guide walks through the SaaS sales funnel stages the way they behave in the field, the six real SaaS sales funnel stages a working model has, the metrics that matter at each of those SaaS sales funnel stages, and where teams lose the most revenue between stages. If you run marketing or growth at a SaaS company and your funnel numbers don’t tie back to closed ARR, this is the frame that usually fixes it. For a broader view of how sales funnel stages work in general, our sales funnel stages guide walks through the underlying model that the SaaS variation extends.
Why the standard four-stage funnel breaks in SaaS
The classic four-stage funnel of awareness, interest, decision, and action came out of consumer marketing in the early 1900s and got picked up by enterprise B2B in the 1980s. It assumes a linear buying process where a prospect learns about a product, decides they want it, and buys it in a single decision moment. SaaS buying rarely works that way. In product-led SaaS, prospects sign up for a free trial before they have made any real buying decision, use the product for weeks or months, and eventually convert to paid when the value clicks. In sales-led SaaS, the buying committee has six to eleven stakeholders, and the decision moment is more like a decision quarter.
The four-stage model doesn’t map cleanly onto SaaS sales funnel stages. It drops free trial users, self-serve signups, and demo requests into the same “interest” bucket even though their behavior and buying intent look completely different. It treats the moment of purchase as a single event even though SaaS deals often close over multiple touchpoints across weeks. And it has no place for product usage data, which is the single strongest predictor of SaaS conversion. Teams that try to run SaaS sales funnel stages on the four-stage model end up patching around it with side spreadsheets and product analytics dashboards that never quite reconcile.
The working answer is a six-stage set of SaaS sales funnel stages that maps to how SaaS buyers behave. Six stages sounds like more overhead on paper. In practice, it produces cleaner metrics, tighter accountability between marketing and product, and a revenue forecast that ties back to real activity. Recent industry data backs this up. Buyers now complete around 69% of their purchase process before ever speaking with sales, and 61% prefer a rep-free buying experience, per figures published by Apollo. A funnel model that assumes sales-first contact will misread most of the pipeline.
The six SaaS sales funnel stages that work in practice
A working set of SaaS sales funnel stages has six stops, each with a clear ownership boundary and a metric that predicts movement to the next stage. Below is the model the growth teams we work with tend to converge on after they’ve been through a full rebuild of their funnel definitions and their CRM stage plumbing.
Stage 1. Visitor
The visitor stage of the SaaS sales funnel stages covers anyone who lands on the SaaS website. Organic search, paid, referral, direct, and social all feed in here. The metric that matters is qualified visitor volume, filtered by whether the traffic source and landing page align to the ICP. A SaaS company selling to mid-market ops teams shouldn’t count traffic to a generic blog post about email marketing as high-quality visitor volume, because that traffic almost never converts to trial or demo. Segmenting visitor volume by ICP tier from stage one is what makes the rest of the funnel numbers useful.
Stage 2. Marketing Qualified Lead (MQL)
The MQL stage of the SaaS sales funnel stages captures a visitor who has taken an action that shows real buying intent. In sales-led SaaS, that means a demo request, contact form submission, or high-intent content download. In product-led SaaS, that includes signing up for a free trial or self-serve account. The MQL definition should be scored, not binary. A trial signup from an enterprise domain with a work email is a higher-value MQL than a signup from a gmail address with no company info, and the funnel math should treat them differently. Blended MQL numbers hide the parts of the funnel that drive real revenue.
Stage 3. Product Qualified Lead (PQL)
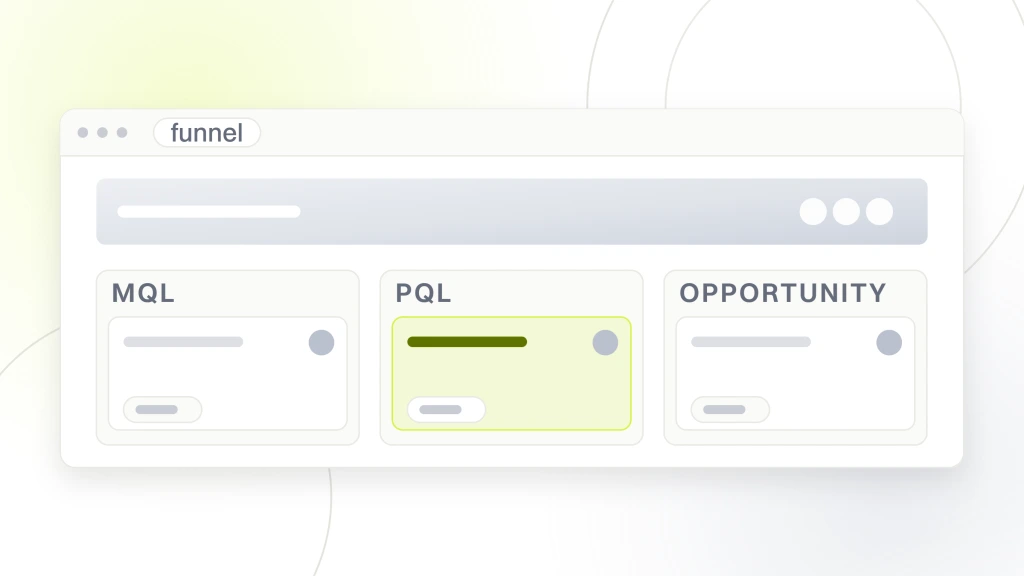
The PQL stop is the SaaS sales funnel stages step that generic templates miss. A PQL is an MQL who has hit an activation threshold inside the product. The threshold varies by product. For a project management tool, it might be creating three projects and inviting two teammates. For a data analytics tool, it might be connecting one data source and running two queries. For a marketing automation tool, it might be sending one campaign and viewing the results dashboard. The PQL threshold is the moment when the product’s value has become visible to the user, and conversion to paid becomes far more likely.
Stage 4. Sales Accepted Lead (SAL)
Inside the SaaS sales funnel stages, a SAL is a PQL or high-value MQL that a salesperson has accepted into their pipeline. In pure product-led SaaS, this stage sometimes collapses into the next one, since self-serve conversion doesn’t route through sales. In hybrid product-led and sales-assist motions, SAL is the moment the account gets assigned to an account executive and the sales cycle begins. The metric that matters here is SAL-to-opportunity conversion, plus the average time from PQL to SAL. Slow SAL routing wastes product-led momentum inside the first hour of intent, and the top decile of SaaS teams routes within 2 hours.
Stage 5. Opportunity
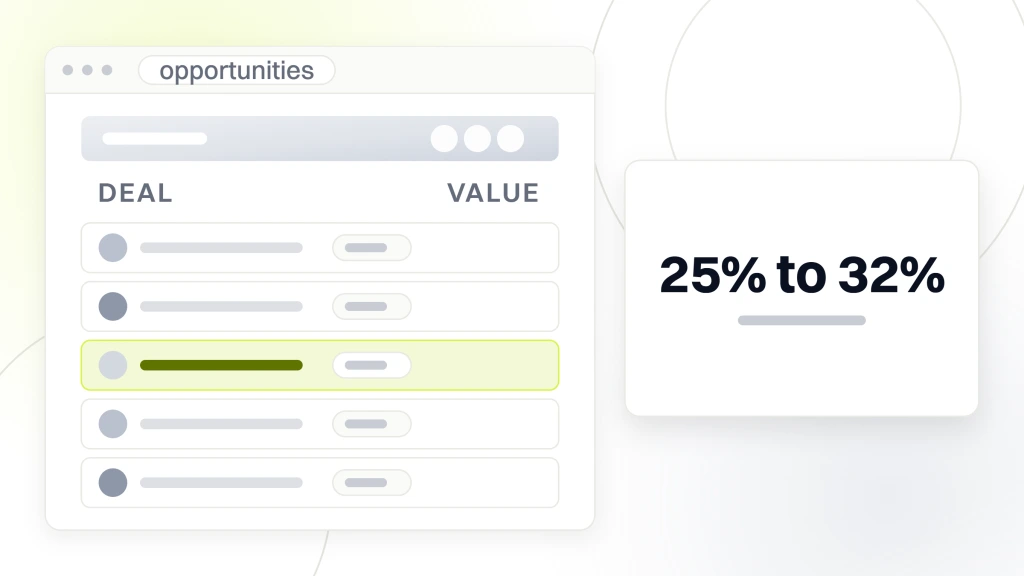
Inside the SaaS sales funnel stages, an opportunity is a SAL that has moved into an active sales cycle with a projected close date and a defined deal size. Opportunity-to-close conversion is the metric that separates a well-run SaaS sales motion from an underperforming one. The best opportunity-to-close for mid-market SaaS sits around 25% to 32%. Enterprise runs lower, 15% to 22%, with bigger deal sizes offsetting the conversion drop. SMB and self-serve run higher, 35% to 55%, with smaller deal sizes. Watching this rate as a rolling 90-day trend surfaces process problems before they compound into a missed quarter.
Stage 6. Closed Won
The final of the SaaS sales funnel stages is a closed and paid customer. The metrics that matter here are new logo ARR, average contract value, sales cycle length, and customer acquisition cost. Post-close, the funnel technically ends. In practice, SaaS teams that focus only on this stage miss the expansion revenue that often drives 30% to 50% of net new ARR. A well-instrumented SaaS funnel extends past closed won into expansion, retention, and churn stages that get tracked with the same rigor as the acquisition funnel.
The metrics that matter at each of the SaaS sales funnel stages
Every one of the SaaS sales funnel stages has a primary metric, a healthy benchmark, and a clean ownership line. If any of those three is missing, the stage falls off the exec dashboard first and gets diagnosed last. The table below is the working benchmark set for mid-market SaaS, which is where most Redefine Web clients sit.
| Stage | Primary metric | Healthy benchmark (mid-market) | Owner |
|---|---|---|---|
| Visitor | ICP-aligned traffic volume | Growth of 15% to 40% quarter over quarter | Demand generation |
| MQL | Visitor-to-MQL conversion | 2% to 5% blended, 8% to 15% on high-intent pages | Demand generation and web |
| PQL | MQL-to-PQL conversion (activation) | 30% to 55% for well-designed onboarding | Product and growth |
| SAL | PQL-to-SAL routing time and rate | 80% within 24 hours of PQL trigger | SDR and lifecycle |
| Opportunity | SAL-to-opportunity conversion | 40% to 60% | Account executives |
| Closed Won | Opportunity-to-close, ACV, cycle length | 25% to 32% mid-market, ACV $18,000+, cycle 45 to 90 days | Sales |
The benchmarks above are ranges we have seen across the mid-market SaaS teams we work with rather than published industry standards. For outside reference points, see SaaStr benchmarks and OpenView SaaS metrics reports. Individual companies land above or below these numbers depending on product category, pricing, and ICP. The point of tracking them is not to hit an industry average. It’s to catch the stage where your funnel drops below its own historical baseline before that drop shows up as a quarter of missed ARR.
Where SaaS sales funnel stages lose the most revenue
The biggest revenue loss across SaaS sales funnel stages almost never sits at the top. Traffic and MQL volume look healthy at most SaaS companies over $2M ARR. Losses happen in three specific SaaS sales funnel stages that get less attention. The first is MQL-to-PQL. Marketing hits its MQL number for the quarter, but the trial users never activate. The product team sees activation as a product responsibility owned outside marketing. Sales gets frustrated that the PQL numbers don’t match the MQL commitments. Everyone points at everyone else. The fix is joint ownership of activation, with a shared metric that marketing and product both carry.
The second of these SaaS sales funnel stages problems is PQL-to-SAL routing time. When a trial user hits the PQL threshold on a Wednesday afternoon and no salesperson reaches out until the following Monday, the momentum evaporates. Users who were within a day of converting move on to other priorities. Top-performing SaaS teams route 80% of PQL triggers to a real sales conversation within 24 hours, and the top decile does it within 2 hours. The infrastructure to do that isn’t complicated. It’s a real-time PQL alert into Slack or CRM, a rotating SDR queue, and a booking calendar the user can hit directly.
The third of the SaaS sales funnel stages losses is opportunity-to-close, mostly in the last third of the sales cycle. Deals that stall in “verbal yes waiting on procurement” for weeks are usually stalling because the salesperson stopped following up when the champion went quiet. A disciplined opportunity management cadence with defined next steps at each stage recovers 15% to 25% of deals that would otherwise stall. This is where sales operations investment pays back. For a deeper look at where these losses come from and how to close them, see our sales funnel optimization services guide.
Product-led versus sales-led SaaS funnels
Product-led SaaS and sales-led SaaS run the same six SaaS sales funnel stages but weight them differently. Product-led SaaS puts most of its optimization energy into activation (MQL-to-PQL) and expansion (post-close revenue growth). The self-serve conversion path collapses the SAL and opportunity stages into a single transaction moment, and the sales team focuses on upgrades and expansion rather than initial acquisition. Activation rate under 40% kills a product-led SaaS company. Activation rate over 55% is a growth engine.
Sales-led SaaS puts more weight on SAL-to-opportunity and opportunity-to-close conversion. Product usage still matters as a lead-scoring signal, but the deals close through a human sales cycle rather than in-product upgrade prompts. Average contract value tends to run 5 to 20 times what product-led motions produce, which changes the acceptable acquisition cost. A sales-led SaaS deal at $84,000 ACV can afford a $12,000 acquisition cost that would sink a product-led motion.
Hybrid SaaS sales funnel stages that pair product-led acquisition with sales assist for enterprise deals are the fastest-growing category in SaaS right now. They run both models in parallel and let the ICP determine the path. SMB users self-serve. Mid-market users get a sales-assist track once they hit PQL. Enterprise leads route straight to a full sales cycle from the first touch. Getting this segmentation right is what separates SaaS companies scaling efficiently from ones spending against the wrong sales motion for their ICP mix. For related context on B2B funnel design that connects to sales-led SaaS, see our B2B sales funnel strategy guide.
How to build a SaaS sales funnel from a blank sheet
Building a SaaS sales funnel from scratch is a five-part job, and skipping any part turns the funnel into a spreadsheet nobody trusts. Start with the ICP document. Write down the account size, industry, buyer role, and the three or four disqualifying signals. Every downstream stage inherits that filter. Second, define each of the six SaaS sales funnel stages in event terms your CRM can score, not narrative terms your marketing team can debate. MQL should be a triggered event, not an opinion.
- ICP definition. Written, one page, with disqualifiers.
- Event-based stage definitions. Every stage is a CRM-triggered signal, not a rep judgment call.
- Product activation events wired in. Reverse ETL from the product database into the CRM so PQLs flag automatically.
- SDR rotation and booking calendar. Live, real-time, with SLA of under 24 hours from PQL to first outreach.
- Lifecycle email tracks per stage. Onboarding, activation nudge, sales handoff, expansion.
- Segmented dashboards. Every metric filterable by SMB, mid-market, enterprise, and channel.
Third, wire product activation events into the CRM. Reverse ETL tools like Hightouch and Census exist for this exact job. Fourth, staff and train the SDR rotation with a documented service-level agreement of under 24 hours from PQL alert to first outreach. Fifth, layer lifecycle emails against each stage. Onboarding at MQL, activation nudge at trial start, sales handoff at PQL, expansion at 60 days post-close. This whole build is what our sales funnel and marketing automation service retainer takes on, and pricing runs $1,499 to $6,000 per month depending on scope and stack complexity.
Segmenting the funnel by ICP tier
SaaS sales funnel stages measured in blended numbers hide the parts of the model that drive net revenue retention. Segmenting the funnel by ICP tier from day one is what turns fuzzy dashboards into decisions the exec team can act on. The three tiers most SaaS companies use are SMB (under $2M revenue or under 50 employees), mid-market ($2M to $200M revenue), and enterprise ($200M+ revenue). The tiers behave differently at every one of the SaaS sales funnel stages.
SMB traffic converts fast, at low contract value, with high volume. The funnel looks like a wide top and a narrow but quick bottom. Mid-market runs a slower cycle with better retention and higher expansion. Enterprise runs the slowest cycle with the highest ACV and the most complex buying committee, now averaging 11 stakeholders per deal. A blended MQL-to-close number that averages these tiers together produces a number that describes no actual customer type. Segmenting the SaaS sales funnel stages by tier lets marketing shift spend toward the tiers that produce net retention above 110%, which is the number that compounds.
Segmenting cleanly takes real reporting infrastructure. It requires enrichment on inbound leads (company revenue, headcount, industry), consistent ICP tags in the CRM, and dashboards that filter by tier at every stage of the funnel. The investment pays back the first quarter it surfaces a mispricing pattern or a mis-targeted channel. Most SaaS teams we work with under-invest here and rely on gut feel for segment performance until a quarterly board meeting forces the question.
How Automation Anywhere structured their SaaS funnel for growth
Enterprise SaaS sales funnel stages work at scale looks different from mid-market. Our engagement with Automation Anywhere is a useful reference point. The company runs a hybrid product-led and enterprise sales motion, with self-serve trials feeding an activation funnel and a parallel enterprise sales team working named accounts. The challenge before the engagement was that inbound activity looked healthy but stage-to-stage conversion was unclear, and the sales cycle for enterprise deals was drifting past 180 days without clear diagnostics on where the time was going. Cost per lead sat at $1,936, which made global acquisition economics unworkable.
The work involved rebuilding the SaaS sales funnel stages definitions to the six-stage model above, segmenting every metric by ICP tier, splitting the campaign architecture by goal so awareness, impressions, and lead-gen each had a clean optimizable target, and instrumenting a real-time PQL alert into the sales rotation for the self-serve motion. Cost per lead dropped from $1,936 to $63, a 97% improvement. Monthly customer acquisition scaled 100 times, from 150 to nearly 8,000 leads a month. Ad impressions rose 300%. The reporting rebuild was the enabling investment. The funnel behavior changes followed from being able to see the funnel accurately for the first time.
The pattern shows up across other SaaS engagements too. Rocket Software, a SaaS subscriber-acquisition tool, had strong product-market fit but weak drip campaigns and gaps at activation. A funnel rebuild with automated drip sequences, onboarding tutorial polish, and a coordinated 4-channel launch drove activation rate up 300%, 3,000 customers in week one, and 400+ new daily subscribers post-launch. Simply.Coach, a coaching SaaS platform with a new domain and no authority, used a combined SEO plus paid restructure to grow organic leads 80% and paid leads 120% in 48 days. Custimy, a customer data platform, reached 500+ first-page keywords and 25,000 monthly organic visits with a custom isometric design plus scalable API backend plus niche-targeted SEO.
Two more references cement the pattern. Rapyd Financial Network, a fintech SaaS on cloud-based payments and compliance, replaced fragmented tools with a unified inbound plus HubSpot CRM plus paid restructure and tripled inbound leads while adding £1.8 million in pipeline and 5 times organic traffic. Apex Fintech Solutions, a fintech serving broker-dealers, advisors, and institutional investors, shifted budget from fragmented sponsorships to inbound channels and gained 65% media spend efficiency, 120% institutional engagement, and 86% qualified lead growth. Forward Networks, a network-twin platform for enterprise IT, government, and education, tripled organic traffic and drove 300% year-over-year revenue growth with long-form thought-leadership content plus a PPC restructure that cut cost per click. The lesson across SaaS sales funnel stages work is not that every SaaS company should build the same reporting infrastructure. It’s that stage-to-stage conversion is knowable if you build the plumbing to measure it, and most funnel problems become obvious once the measurement is clean.
Common SaaS funnel mistakes to avoid
The mistakes we see most often across SaaS sales funnel stages cluster around four patterns. First, defining MQL too broadly. When any newsletter signup counts as an MQL, the number looks big and the downstream conversion looks catastrophic. Tighter MQL definitions (demo request, high-intent content, trial signup) produce smaller MQL numbers with far better conversion, and the marketing team can reason about them clearly. This one change often improves the exec dashboard picture inside a single quarter.
- Defining MQL too broadly (newsletter signups counted the same as demo requests).
- Ignoring the PQL stage and qualifying purely on demographics.
- Holding sales accountable to funnel-wide numbers instead of stage-specific ones.
- Running the funnel without a post-close retention view.
- Reporting blended MQL-to-close numbers that hide segment-level truth.
- Under-investing in the reverse ETL layer that connects product events to the CRM.
Second, ignoring the PQL stage. Sales teams that never see product usage data end up qualifying leads on demographics alone, which produces qualified-on-paper leads that are nowhere near ready to buy. Bringing PQL data into the qualification process changes the SAL-to-opportunity conversion rate in a real way. Third, holding sales accountable to funnel-wide numbers instead of stage-specific numbers. A sales team hitting its opportunity-to-close target says nothing about whether MQLs are getting routed at earlier SaaS sales funnel stages. Assigning stage-specific ownership fixes finger-pointing between marketing and sales. Fourth, running the SaaS sales funnel stages without a retention view. Post-close metrics (activation of paid users, expansion revenue, net revenue retention) matter as much as acquisition metrics for a SaaS company past product-market fit. A funnel that hits its new-ARR target but bleeds churn runs a treadmill, not growth.
How the SaaS sales funnel connects to lifecycle marketing
Lifecycle marketing is what makes the SaaS sales funnel stages work across a real customer journey rather than a single-transaction event. Trial users need onboarding emails timed to their activation moment, not to a generic day-3, day-7, day-14 cadence. PQLs need in-product prompts that move them toward the value moment. New paid users need product education that drives feature adoption. Existing customers need expansion signals and retention nudges before they churn. Every one of these lifecycle touches maps to a specific one of the SaaS sales funnel stages or post-close stage, and the marketing automation stack has to support them all.
SaaS teams that skip lifecycle marketing and rely only on top-of-funnel demand generation run out of runway. Acquiring new logos gets more expensive as the ICP saturates, and the churn built up on under-served existing customers compounds. The teams that build lifecycle marketing infrastructure as part of the funnel design (not as a separate initiative) grow faster and more efficiently once they scale past $5M ARR. This is where the marketing automation professional services investment pays back, and the paired marketing automation service retainer runs the build out end to end. Building the automation infrastructure once and running it consistently is the compounding asset. Additional external references that inform this guide include the OpenView Product-Led Growth report, the Klipfolio SaaS KPI reference, and the David Skok SaaS metrics framework. Read a couple of those in full and the six-stage model here will click into place.