A food market research agency runs consumer surveys, category studies, shopper research, and taste-test panels that pull insight a Google search cannot. Work spans quantitative surveys of 400-plus panelists on category adoption, qualitative focus groups on purchase drivers, in-store shopper intercepts at the shelf, and sensory panels that validate formulation before launch. Every workstream produces primary data that beats secondary sources on precision, and every retainer pays back on the bad decisions the data prevents. If you’re running research for a DTC food brand, a CPG food line, or a natural-channel launch, the methods below map straight to the decisions on your desk.
This guide covers when to hire a category shop versus when to run it yourself, the 3 research types every packaged food brand needs, retainer bands per project type, the screening questions that separate specialists from repurposed generalists, and a named client teardown with real numbers. 12 minutes end to end.
Focus groups a category shop moderates
Focus groups pull qualitative insight surveys miss. Why customers switch brands, what emotions attach to a category, how packaging language lands versus how it was intended. A well-run food focus group runs 90 to 120 minutes with 6 to 8 participants from the target buyer profile and a discussion guide covering 4 to 6 topic areas. Good moderators listen more than they lead.
Groups fail when the moderator talks too much, when the room agrees on everything, or when participants know each other and self-censor. Category shops recruit strangers who share the demographic but not the network, brief the moderator on active listening, and record everything for transcription. Generalists cut corners on recruit, run 30-minute groups, and file reports built on surface-level quotes. That is the tell that saves you $18,000 on a wasted project.
The strongest programs mix 2 sessions per city across 3 metros, then triangulate quotes against the survey and shopper data. That 3-city footprint smooths regional bias and shows the brand where the copy resonates and where it flops. Skip the multi-city design and you get an insight rolled up from a single ZIP code.
Moderator skill as the hidden variable
The moderator decides whether a focus group produces real insight or wasted budget. Skilled moderators ask open questions, follow the group’s real interest instead of the script, and probe surface answers until they hit the driver. Weak moderators read questions off a page, accept the first answer, and move on. Category shops staff experienced moderators on food projects since packaged food buying carries emotional layers most surveys miss. Generalists use junior moderators to keep costs down.
Ask for the lead moderator’s CV before you sign. 5-plus years on food and beverage work is the honest minimum. Anything under 3 years and the sessions will feel scripted, the probes will land in the wrong places, and the report will read like a survey summary with quotes bolted on.
Analysis depth after fielding
Focus group analysis takes 3 to 5 times longer than the group itself when done right. Analysts code transcripts for themes, tag quotes by participant and topic, and triangulate patterns against survey and shopper data. The analysis phase surfaces insights the moderator missed in the room. Category shops budget 20 to 30 hours of analysis per group. Generalists file a bullet-point summary from the moderator’s notes and call it a report. The insight-quality gap shows up when the brand tries to act on the findings.
Shopper research your category shop should execute
Shopper research covers in-store intercept interviews, shelf observation, purchase pathway mapping, and retail audits. A category shop running shopper work places researchers at 8 to 15 stores in the target chain, observes behavior for 3 to 5 hours per store, intercepts 30 to 50 shoppers each for a 3-minute interview, and reports on decision drivers at the shelf.
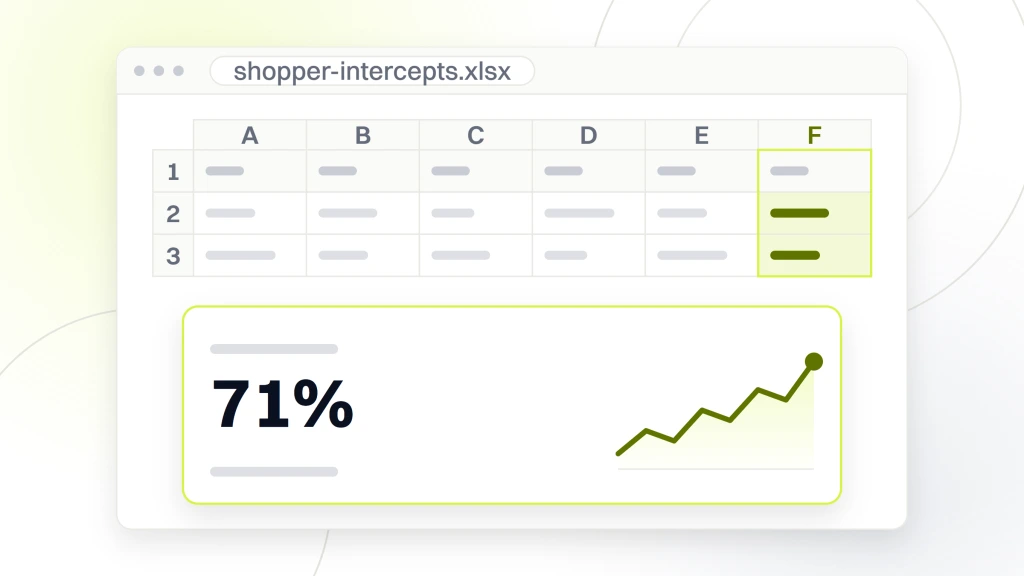
Shopper research matters most before a new retail channel or SKU launch. Watching real behavior at Whole Foods, Sprouts, Wegmans, or Kroger reveals what shoppers do versus what they say they’d do on a survey. The gap between stated and observed behavior in food runs 20 to 40 percent by category. Category shops treat shopper research as the first-choice method for retail decisions. Generalists lean on surveys alone and miss the gap. See our food service marketing agencies breakdown for the adjacent scope on foodservice research.
Take a natural-channel yogurt line prepping for a Sprouts rollout. Survey data said 62% of buyers ranked plain yogurt above flavored. Shopper intercepts at 12 Sprouts stores showed 71% of actual pickups skewed toward mixed berry. The brand shifted the launch SKU mix from 3 plain and 2 flavored to 2 plain and 3 flavored, and 90-day sell-through beat the plan by 34%. That is the gap shopper research pays for.
Intercept methodology at the shelf
Intercepts at the shelf work when they’re short (2 to 4 minutes), incentivized ($5 to $10), and built on a 5-question script covering what the shopper is buying, why, what they considered, and what would change the decision. Longer interviews get refused. Unincentivized ones skew toward people who like talking. Structured scripts produce comparable data across stores. Category shops train interviewers on retail-store approach and hit 40 to 60 percent response on cold intercepts.
Retail audit scope
Retail audits cover shelf position, facings, price versus competitors, out-of-stock frequency, and secondary-display presence. Category shops build a photo-plus-data log at every store, track changes over time, and report patterns quarterly. Brands use audit data to negotiate with the category buyer, adjust wholesale pricing, or push trade-marketing dollars into underperforming stores. See the Nielsen category insights library for the wider retail data ecosystem.
Retainer bands for a food market research agency
Food market research work runs on project fees more than retainers. A quantitative survey with 400 respondents plus decision-ready analysis runs $8,000 to $18,000. A three-group focus program runs $14,000 to $28,000. Shopper research at 10 stores runs $22,000 to $48,000. A 40-participant sensory panel runs $6,000 to $14,000. Category shops price transparently on the first call. Generalists bury pricing in the proposal and negotiate down when the founder pushes back.
Retainers make sense for brands running 4-plus research projects per year. A $2M-plus annual research budget consolidated with one shop moves to a monthly retainer at $4,800 to $9,600 per month covering 12 to 18 project-hours weekly plus dedicated researcher time. Our own food and beverage marketing retainer starts at $1,499 per month for smaller brands running lighter research inside the wider marketing scope, then scales through $2,499, $3,999, and from $6,000 per month as the research load grows. Past 4 projects per year, retainer math beats project-by-project pricing on total cost. See our food and beverage marketing retainer detail for the scope-to-price mapping.
| Research type | Project fee band | Timeline |
|---|---|---|
| Quantitative survey, 400 respondents | $8,000 to $18,000 | 21 to 28 days |
| Focus group program, 3 groups | $14,000 to $28,000 | 28 to 42 days |
| Shopper research, 10 stores | $22,000 to $48,000 | 42 to 60 days |
| Sensory panel, 40 participants | $6,000 to $14,000 | 21 to 35 days |
| Full research retainer | $4,800 to $9,600 / mo | Rolling scope |
Food and beverage market research budgets per revenue band
Brands under $2M rarely justify a full research project until a specific decision hits the 3-to-8-percent-of-decision-cost threshold. Brands at $2M to $10M run 2 to 4 projects a year keyed to major SKU launches or channel moves. Brands above $10M run continuous programs across category, brand, and product tracks. Category shops scope research budgets to match revenue band. Generalists sell whatever project the founder asks for, regardless of fit.
Contract milestones and deliverables
Every project needs 4 to 5 named milestones. Research design signoff, panel recruit complete, fielding start, fielding end, and final deliverable. Each milestone gets a date and a named output. Category shops share the milestone calendar on kickoff and update weekly. Generalists commit to a final delivery date, go dark, and hand over a late, thin report on day 30. Ask for the milestone calendar on the sales call and watch how fast the answer comes back.
CPG food market research on shelf-ready categories
This work narrows the wider scope to shelf-ready categories that move through mass grocery, club, and mass-merch channels. Study design differs from direct-to-consumer research on 3 fronts. Sample skews to grocery-primary buyers pulled from a food-specific panel, not general-population panels. Focus groups mix loyalists with lapsed users to catch the reason for the drop, not the current-user love. Shopper intercepts land at Kroger, Publix, HEB, and Walmart, since that is where 78% of the CPG category sits.
The named client that keeps showing up in CPG conversations is BSH Hausgeräte, a global home-appliance CPG parent that grew lead generation 15% post-launch after tightening its category positioning through primary research. Same discipline works for packaged food. Category research shows you which shelf claim resonates, which price tier converts, and which pack size hits basket 2 months faster than the alternative.
The screening question that separates a CPG-fluent shop from a general research shop is simple. Ask them to walk you through the last 3 shelf tests they ran and the retailers involved. Real CPG researchers name Kroger, Publix, or HEB. Generalists dodge with “national chain” or “top-3 grocer.” That single 90-second exchange saves you the wrong hire.
Screening questions for the sales call
Category agencies answer methodology questions with specifics. Repurposed generalists answer with vague reassurances about “our approach.” The screening happens on the first 45-minute call, and 6 questions do the sorting. Ask them and you’ll know before the proposal arrives whether the shop runs real food category research.
- Name 3 food or beverage brand research projects you’ve completed in the last 18 months and the decisions they informed.
- What sample size do you recommend for a category adoption survey, and what’s the plus-or-minus margin of error at that sample?
- How do you screen panel respondents for actual category buying behavior versus stated preference?
- Which stores would you place shopper intercept researchers at for a natural-channel SKU launch, and why?
- Show a sanitized executive summary from a past food research project so I can see the analysis quality.
- What’s your research design pilot process before fielding a survey, and how many pilot respondents do you use?
Executive summary quality as a signal
Ask for a sanitized executive summary from a past food research project. Category shops produce 2-to-4-page summaries that lead with the recommended decision, back it with 2 to 3 data points, and point to the full deck for methodology. Generalists produce 15-page summaries that read like a data dump with no recommendation. The executive-summary format signals whether the shop can communicate findings to a founder who has to act on them.
Pilot process before fielding
Pilot testing catches question-design flaws before they contaminate the sample. A pilot with 15 to 25 respondents surfaces comprehension gaps, ambiguous wording, and order effects. Category shops always pilot before fielding. Generalists field cold and hope the data comes back clean. When a survey has to be re-fielded since a question was confusing, extra recruit cost and delay eats 20 to 40 percent of the project budget. Ask about the pilot process on the sales call.
Sensory panels a food brand research agency runs
Sensory panels validate formulation before launch. A trained panel of 40 to 60 participants rates taste, texture, aroma, appearance, and aftertaste on a 9-point hedonic scale plus open-response comments. The panel runs blind against benchmark competitors and produces a decision-ready attribute comparison. Sensory data catches formulation problems consumer taste tests miss since trained panelists carry vocabulary consumers don’t have.
Panels matter most before reformulation, before entering a new subcategory, or before a private-label negotiation where the buyer will demand taste scores comparable to the brand leader. A $6,000 to $14,000 panel prevents the $180k SKU launch that failed on taste. Category shops keep trained panels running across 12 months and reuse them across projects. Generalists recruit fresh panels every project and lose the vocabulary consistency trained panels produce.
Trained versus consumer taste test
Trained sensory panels are not consumer taste tests. Trained panels use standardized vocabulary and calibrated scales, so results reproduce across sessions and products. Consumer taste tests measure preference but lack the descriptive precision to tell a food scientist what to change in the formula. Category shops run both. Trained panels for formulation decisions, consumer taste tests for launch confidence. Generalists offer consumer taste tests only and pretend they answer formulation questions.
Panel training time investment
Trained panels take 40 to 80 hours of training per panelist before they produce reliable data. That’s why category shops maintain panels across 12 months and reuse them. A brand hiring a shop that recruits fresh every project pays training cost inside every project fee. A brand hiring a shop with a maintained panel pays training once, spread across projects. Ask whether the shop keeps a food panel running or recruits fresh each time. The answer changes total cost.
DTC food market research for direct-to-consumer brands
Direct-to-consumer research swaps in-store intercepts for on-site behavior studies, cart-recovery surveys, and post-purchase panels. A DTC food brand running research at $500k to $5M annual revenue lands 3 to 5 projects a year. Survey the email list quarterly with a 12-question adoption and repeat-rate study. Run 2 focus groups a year with lapsed subscribers to catch the churn driver. Add 1 sensory panel a year before every major SKU refresh.
Boogie Board, an ecommerce brand we worked with, drove cost per sale down to $31 across the annual curve after tightening its research-to-ad-creative loop. Same discipline works for DTC food. Feed the survey verbatims into the ad copy. Feed the focus-group emotional drivers into the landing-page hero. Feed the sensory panel vocabulary into the product-detail-page copy. Every research dollar shows up in the CAC curve inside 60 days.
The retainer band for DTC food research runs $2,400 to $6,000 per month for brands under $5M in revenue. That folds neatly into a wider growth retainer with paid media, email, and CRO from a CPG food marketing agencies shortlist, so the research feeds every downstream lever and pays back twice.
Measuring the engagement over 12 months
2 measurements matter for a research engagement. Research quality and decision impact. Quality covers sample size versus recommended, response rate versus benchmark, screening effectiveness, and analysis depth. Decision impact covers whether the founder used the findings to change a decision. A project that arrives too late to influence the decision is wasted money, no matter how clean the data.
Category shops track decision-impact metrics across the client relationship. Which projects informed which decisions, which findings the founder ignored, and which findings changed the outcome. Over 12 months, that data reveals whether the research spend is paying back. Generalists deliver reports and don’t track downstream use. Ask on the sales call how the shop tracks decision impact across their book of business.
Abigail Ahern, a home ecommerce brand we worked with, drove ecommerce revenue up 179% over a 12-month curve after tying every research deliverable to a downstream P&L outcome. Same discipline applies to food. Report cadence, decision log, and a quarterly review of which findings moved margin. That is what a research relationship should feel like at month 6.
Timeline discipline as a deliverable
Projects miss deadlines when scope creeps or panel recruit slows. Category shops build 15 to 20 percent buffer into every quote and hit deadlines 85 to 90 percent of the time. Generalists quote aggressive timelines to win the pitch, miss by 2 to 4 weeks, and blame panel availability. The launch date slips, the marketing campaign starts without research signal, and the project underdelivers. See our food and beverage marketing services page for how research fits into wider retainer scope.
Data portability at project end
Own your data. The contract should state that raw survey responses, transcripts, and analysis files belong to the brand at project end, not the research shop. Category shops share raw data willingly since the value sits in the analysis and the ongoing relationship. Generalists hold data hostage and charge extra for re-analysis 12 months later. Read the contract before signing and confirm data ownership sits with the brand.
Making the pick that lands your category shop
Pick a category shop when a decision costs more than $50k and the outcome is uncertain enough that primary data changes the answer. Match research spend to 3 to 8 percent of decision cost. Surveys for adoption and preference calls, focus groups for perception and driver calls, shopper research for retail expansion, and sensory panels for reformulation. Skip the agency and go DIY for decisions under $50k where sampling bias doesn’t move the answer much.
The last piece of advice is simpler than the rest of this guide. Take the sales call, ask the 6 methodology questions, review the sanitized executive summary, and trust the answers. Category shops answer with specific numbers and defensible methodology. Generalists answer with vague reassurances. The vague answer is the tell. See our marketing agency for food products breakdown for how research fits inside the wider packaged food marketing scope, alongside a food influencer marketing agency program for creator-led awareness.
Category benchmarks help too. The USDA food and nutrition research library gives a sanity check on category demand and per-capita consumption trends before you commit to a research scope with any market research agency food specialist.