
Enterprise SaaS SEO Strategy for Multi-Region Software Brands
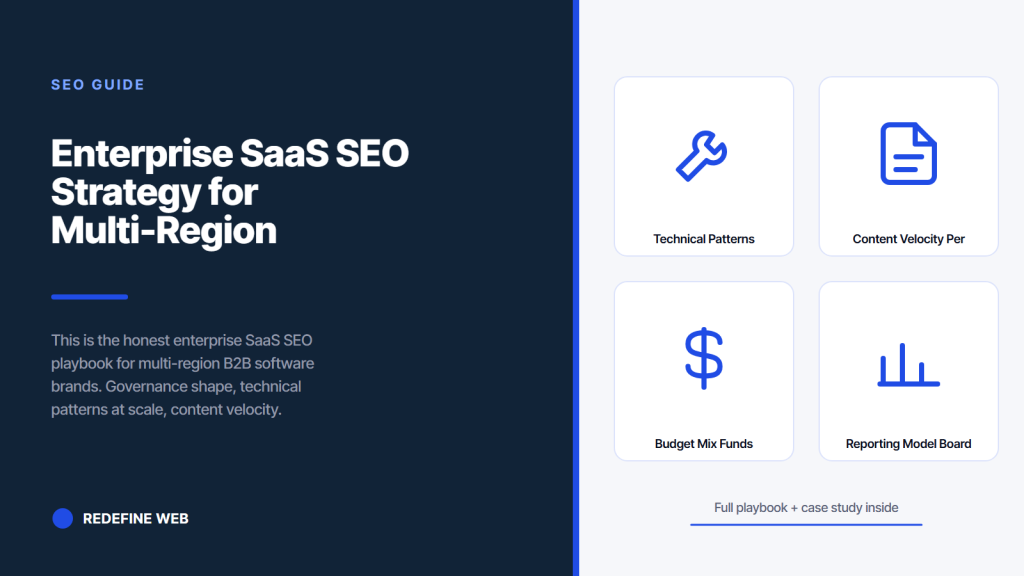
- Enterprise SaaS SEO wins on governance and velocity, not on tactics.
- Expect a 12 to 18 month runway before pipeline attribution stabilizes.
- Regional pods with a central strategy team scale cleanly past $200M ARR.
- Technical debt is the number one blocker at enterprise scale.
- Budget mix: 30% strategy, 40% content, 15% technical, 15% link work.
- Technical patterns that scale at enterprise saas seo
- Content velocity per region
- Budget mix that funds enterprise saas seo
- Reporting model the board actually reads
- A real enterprise saas engagement and the pipeline it produced
- Regional considerations across enterprise saas seo
- Technical debt burndown as an operating metric
- Link building at enterprise scale
- Vendor mix that funds the program
- Launching enterprise saas seo this quarter
Enterprise saas seo is the search work that starts once your ARR crosses 200 million dollars, spans three or more regions, and passes every deliverable through legal, brand, and executive review. This piece is the honest playbook. Governance shape, technical patterns at scale, content velocity by region, pipeline reporting the board actually reads, and the budget bands that keep a program funded through a 24 month compounding curve.
Read straight through in about thirteen minutes. Written for heads of growth, VPs of marketing, and CMOs at 200 million to 5 billion ARR B2B SaaS companies. Copy the governance model, the team shape, the budget mix, and the board reporting dashboard into your operating plan. Enterprise saas seo compounds differently than Series B work and this piece names every pattern that changes when the ARR crosses the enterprise threshold. The tactics look similar on paper. The execution is a different sport. Governance, review cadence, regional pods, embedded growth engineers, board-level reporting. Every one of those five items becomes a first-class citizen in the operating plan.
| Pod | Headcount | Reports into | Primary output |
|---|---|---|---|
| Central strategy | 4 to 6 | VP Marketing | Keyword architecture, playbook, CFO reporting |
| Regional content | 3 to 5 per region | Central strategy | Regional publish calendar, localized content |
| Growth engineering | 2 to 4 | VP Engineering | Technical foundations, schema governance |
| Link building | 2 to 3 | Central strategy | Editorial link outreach, PR-driven placements |
| Legal & brand review | Retainer | Legal / Brand | Review turnaround inside 48 hours |
Central strategy pod skills profile
The central strategy pod is where enterprise saas seo lives or dies. Every seat needs 6 plus years of SaaS-specific experience. One seat owns keyword architecture and pattern library. Two seats own regional coordination. One seat owns growth engineering interface. One seat owns board and CFO reporting. Add a sixth seat as a chief of staff once you scale past three regions. Skip the chief of staff role and coordination overhead falls on the strategist owning reporting, which crashes the reporting quality by quarter three.
Growth engineering pod inside product
Growth engineers embedded in the product engineering org share the same code review discipline as feature engineers. They ship to production through the same CI/CD pipeline and follow the same on-call rotation. That embedding is critical because a growth engineering pod outside product engineering ends up being seen as marketing overhead and gets deprioritized at every conflict. Inside product, they carry the same weight. Web.dev on the underlying performance patterns at Core Web Vitals is the reference every embedded growth engineer should be reading quarterly.
Technical patterns that scale at enterprise saas seo
Server-side rendering with client hydration. Canonical logic centralized in a single service. Schema governance managed as code with automated validation. Internal linking automation driven by an embedding-based similarity model. Core Web Vitals monitoring with automated alerting. A staging environment mirror for schema validation before every release. Six patterns carry the technical foundation at scale.
Enterprise seo strategy for saas fails technically in one of three ways. Rendering strategy that only works on the home region and breaks in every other. Canonical logic sprinkled across templates rather than centralized. Schema that no one owns and validates. Fix all three structurally in the first two quarters and the ranking curve compounds cleanly for two years. Skip the structural fix and you rebuild these three every 18 months forever.
Rendering strategy that survives every region
Server-side rendering with client hydration is the pattern that scales. Static site generation works for landing pages but breaks on dashboard views. Client-side rendering breaks on Googlebot at scale even in 2026, especially in emerging markets where Google’s rendering budget is tighter. Universal SSR with hydration is the pattern that survives every region and every crawler behavior we watch. Ship anything else at enterprise scale and you will spend two years discovering the ranking cost, which will be somewhere between 20 percent and 60 percent of pre-migration organic.
Schema governance managed as code
Schema governance at enterprise scale means every Article schema, every Organization schema, every Product schema, every BreadcrumbList schema is defined in code, validated on every pull request, and versioned as a release artifact. Manual schema editing at scale is the number one silent failure mode we watch enterprise SaaS teams hit. A single misconfigured schema block ships to 3,000 pages, breaks rich results across the surface, and gets discovered by a partner three months later. Governance as code prevents the entire pattern.
Content velocity per region
A working enterprise saas seo program publishes 40 to 80 pieces per month across regions. Home region carries 15 to 25 pieces. Each secondary region carries 8 to 15 pieces. That mix delivers the compounding curve without overloading review pipelines. Anything above 100 pieces per month across regions and quality drops. Anything below 25 pieces per month and pipeline attribution stalls by month 15.
Enterprise content is not translated. It is localized. A category primer that ranks in the US market gets rewritten from scratch for the EMEA market with local competitors, local pricing conventions, local regulatory context, and local buyer language. Translation shortcuts what looks like a cost saving in year one and costs 40 percent of regional organic in year two. Every regional pod we work with learns this lesson once, usually at the 12 month mark.
Six content patterns that carry every region
Category primer. Comparison page. Alternative-to page. Use-case guide. Integration pattern. Docs-adjacent tutorial. Every published URL across every region should fit one of these six. Anything outside these patterns rarely produces pipeline at enterprise scale. Thought leadership content belongs on executive personal blogs. News content belongs in a customer newsletter. The six patterns are the compounding surface.
Review cadence that keeps velocity high
Legal review inside 48 hours. Brand review inside 24 hours. Regional strategy review inside 72 hours. Central strategy review by exception rather than by default. Miss any of these SLAs and content queues stack silently for weeks. The strongest enterprise programs enforce review SLAs on the reviewers rather than on the writers. That inversion is unusual and it is exactly what keeps velocity above 40 pieces per month across regions. HubSpot on content operations at HubSpot content ops covers the peer-level review cadence patterns worth benchmarking against.
Budget mix that funds enterprise saas seo
Strategy 30 percent. Content production 40 percent. Technical fixes and growth engineering 15 percent. Link building 15 percent. That mix carries most enterprise programs through a 24 month cycle without a re-plan. Skew any single line above 55 percent and something else stalls. Under-fund content production at enterprise scale and the compounding curve delays by two quarters.
Absolute dollars matter as much as the mix at enterprise scale. A 300 million ARR three-region program at 1.5 million per year covers the shape but leaves link building thin. A 500 million ARR four-region program at 3 million per year covers everything well. A billion-plus ARR five-region program at 6 million per year is the floor for a competitive enterprise saas seo strategy in fintech or healthtech. Anything below those bands and the pipeline curve stalls or reverses somewhere in year two.
In-house versus agency budget allocation
At enterprise scale, 65 to 75 percent of the budget is in-house salaries. 20 to 30 percent is agency partner retainer for specialist coverage. 5 to 10 percent is tooling. That split scales cleanly because in-house owns strategy and brand voice while the agency owns execution surge, cross-vertical pattern library, and independent audit capability. Enterprise programs that push agency spend above 40 percent watch strategy drift toward the agency’s opinion of what works. Programs that push agency spend below 15 percent watch execution stall during any in-house transition. The 20 to 30 percent band is the honest sweet spot.
Quarterly budget review with the CFO
Every quarter the budget review with the CFO covers pipeline sourced from organic this quarter, CAC payback trend by region, ratio of pipeline-to-spend, and any budget shift requests for the coming quarter. Ten minutes on the numbers, ten minutes on the shift requests, ten minutes on the risks. Skip the CFO review and budget conversations get renegotiated annually rather than continuously, which is when programs get cut in a downturn. Related retainer shape at SaaS Marketing Retainer Plans from $599/mo.
Every enterprise CMO we know has forwarded us the same LinkedIn post at some point in the last year. Usually posted by a thought leader who has never worked inside a 500-person marketing org. The post claims a scrappy team of three shipped 5,000 pages of programmatic content in a week and grew traffic 12x. The CMO wants to know why we are not doing that at their company. We usually reply with the same message. Sure we can build that. It requires 12 weeks of engineering, a real integration catalog with 400 plus entries, legal sign-off on every template variant, and a growth engineer who understands the difference between doorway pages and honest programmatic. The CMO either laughs and agrees the LinkedIn take was oversimplified, or they hire a different agency that says yes to the plan and quietly rebuilds it 18 months later after the ranking curve flatlines.
A great plan with weak governance ships 2 pages/mo. Draw the review chart on a napkin before writing another brief. Brand, legal, region owners named.
Reporting model the board actually reads
Pipeline sourced from organic this quarter. Prior four quarters trend. CAC payback for organic-sourced ARR versus paid-sourced ARR. Ratio of pipeline-to-spend across regions. High-priority technical debt items closed per quarter. Content publish velocity per region against plan. Six numbers on a single dashboard reviewed quarterly with the board. Everything else is appendix.
Enterprise b2b saas seo reporting fails when it leads with rankings and traffic. The board does not care. The board cares about pipeline, CAC delta, and operational velocity. Show those three first and the search program looks like the compounding asset it is. Show rankings first and the search program looks like an optimization hobby, which is when it gets cut in the next downturn. Ahrefs on enterprise reporting at Ahrefs on SEO reporting is a peer-level walk through of the reporting shift.
Quarterly board slide that wins budget
The one-slide board update carries the six numbers plus a one line narrative from the VP of marketing on what changed and why. Nothing else. Board members read the slide in 90 seconds and either ask a follow up question or move on. That structure protects the program from renegotiation every quarter because the board can see the compounding curve and the operational health at a glance. The slide takes 20 minutes to build every quarter and it is the single highest-signal artifact in enterprise saas seo governance.
Attribution model that maps to real ARR
Pipeline attribution at enterprise scale runs first-touch, last-touch, and multi-touch models in parallel and reconciles monthly. First-touch shows the acquisition contribution. Last-touch shows the closing contribution. Multi-touch smooths the noise. All three are needed because enterprise buying cycles run 6 to 18 months and single-touch models misrepresent the reality. Programs that report only first-touch understate the pipeline contribution by 30 to 50 percent. Programs that report only last-touch flatter every paid channel at organic’s expense. Report all three and the board sees the honest picture.
A real enterprise saas engagement and the pipeline it produced
Rapyd Financial Network worked a specialist retainer across a 24 month engagement in fintech SaaS payments. Enterprise scale. Multi-region. Regulated compliance. Inbound sales pipeline crossed 1.8 million pounds across the engagement. Inbound leads tripled from roughly 5 per month at start to over 15 per month by month 18. Organic traffic grew roughly 3x from baseline across three regions.
The pattern that moved most of the pipeline was disciplined attribution work in the CRM followed by category-level content sprints that positioned Rapyd against the specific comparison keywords its fintech buyers were actually searching in each region. Six category pages, four alternative-to pages, and eight use-case guides per quarter across three regions. That combination is the pattern the strongest enterprise saas seo pods deliver as table stakes.
What worked inside the Rapyd engagement
Two moves produced most of the pipeline growth. First, rebuilding the marketing automation stack so organic-sourced pipeline could be attributed cleanly through Salesforce back to first-touch keyword across regions. Second, a category-level content sprint that positioned Rapyd against comparison keywords in each region simultaneously. That combination is what enterprise seo saas at Series C plus should deliver as baseline. Related silo work at Search Engine Optimization Services.
What broke and how the pod handled it
A site redesign in month 8 broke URL structures across two regions. The engineering team wanted to skip building a proper redirect map to save time. Skipping it would have cost roughly 30 percent of the existing organic base per region. The pod walked the CTO through the traffic risk with peer examples across three fintech accounts. The redirect map got built. The ranking hold survived. That pushback shape is exactly what an enterprise saas seo pod earns its retainer on. Related: SEO for SaaS strategy.
Regional considerations across enterprise saas seo
US market patterns differ from EMEA patterns differ from APAC patterns differ from LATAM patterns. Search intent shape, competitor set, regulatory context, and buyer language all differ. Every regional pod must own the regional playbook rather than execute a US-first playbook translated locally. Programs that ignore this rebuild every regional playbook once, usually at the 15 month mark, at significant cost.
Regional pipeline attribution also differs. US pipeline attribution runs primarily through Salesforce. EMEA pipeline attribution often runs through Marketo. APAC pipeline often runs through region-specific tools plus WhatsApp. LATAM pipeline attribution runs through a mix that depends on the country. Every regional pod configures its own attribution model that maps back to the central dashboard, and the central strategy pod owns the reconciliation.
EMEA patterns worth calling out
EMEA search is more fragmented than the US and the ranking curve tends to be slower. Buyer intent in DACH countries splits between local language search and English search on the same keywords. The UK market sits closer to US patterns but with tighter regulatory context on fintech and healthtech. Nordic markets prefer English content for B2B SaaS keywords. Southern European markets require local language content or the ranking curve stalls. Every regional pod maps its language mix on the strategy document rather than assuming English works everywhere. The mistake we watch programs make is assuming EMEA is one market. It is at least four.
APAC patterns worth calling out
APAC search patterns differ market by market. Japan buyer intent runs primarily through Yahoo search plus Google. Korea buyer intent runs through Naver and Kakao alongside Google. Singapore and Australia patterns sit closer to US. India patterns run through Google with heavy mobile-first ranking behavior. China is a separate program entirely on Baidu that we usually do not touch inside enterprise saas seo scope. Every regional pod names the search engine mix on day one. Programs that assume Google covers everything in APAC watch conversion rates crater in Japan and Korea inside two quarters.
Technical debt burndown as an operating metric
Enterprise saas seo carries technical debt across templates, canonical logic, schema, internal linking, and Core Web Vitals. That debt compounds silently for a quarter and then explodes in a ranking drop. The healthiest programs treat technical debt burndown as an operating metric with a target of 15 to 25 items closed per quarter and a running visibility dashboard shared across engineering and marketing.
Technical debt burndown is not a project. It is a rhythm. Every quarter starts with a fresh audit, a prioritized list of the top 30 items, and a commitment to close 15 to 25 of them. Items that keep rolling forward across three quarters become escalation risks. Ownership of every debt item stays with a named growth engineer inside product engineering, not with the marketing team. That embedding is what keeps burndown moving.
Audit cadence that catches debt before it costs traffic
Full technical audit every quarter. Full crawl every month. Automated Core Web Vitals monitoring every day. Schema validation every deploy. Search Console coverage review every week. That five-layer cadence catches most technical debt before it costs traffic. Programs that audit annually watch technical debt cost 20 to 40 percent of organic once per year, then reactively fix it, then repeat the pattern. Programs that audit quarterly with the layered cadence keep the debt burndown flat over multi-year windows. The difference is 30 percent of organic revenue.
Escalation pattern when debt is not moving
Any technical debt item that rolls forward across three consecutive quarters gets escalated to the VP of engineering with a written impact analysis. The impact analysis names the traffic at risk, the CAC delta if the debt lands as a ranking drop, and the engineering time required to close. That written analysis is what turns a debt item into a priority. Debt items without written impact analysis stay in Jira forever. Debt items with a written analysis get closed inside the next sprint. The escalation pattern is simple and it is one of the most useful habits at enterprise scale.
Link building at enterprise scale
Enterprise saas seo link building runs through PR-driven placements, original data reports, integration partnership pushes, and executive commentary. Never through guest posts on generic marketing blogs. Never through link exchanges. Never through paid link networks. The 15 percent of budget allocated to link work funds 25 to 60 editorial placements per year at enterprise scale.
Link quality matters more than link quantity at enterprise scale. One placement in the Wall Street Journal or the Financial Times moves domain authority more than 200 mid-tier placements combined. Original data reports are the strongest link building pattern we see. A single well-executed report produces 15 to 40 editorial placements over 18 months. That ROI is what makes original data the strongest link building line item in an enterprise SaaS SEO budget.
Original data reports as the link engine
The pattern is one flagship report per year at 20 to 40 pages with proprietary data pulled from your product usage. Add three shorter data updates per quarter using the same dataset. Total investment is 300 to 600 hours of analyst time plus editorial and design production. Return is 15 to 40 high-authority editorial placements per report plus 300 to 800 mid-tier citations. That ROI at enterprise scale beats every other link building line item by a wide margin. Search Engine Journal on link building patterns at Search Engine Journal on link building covers the peer view of what works and what does not in 2026.
Executive commentary as a link source
Ghost-written executive commentary in industry trade publications produces 8 to 15 editorial placements per year with light overhead. Pattern is one flagship op-ed per quarter from the CEO plus quarterly commentary from the CTO or CPO in relevant trade press. Ghost writing is 15 to 25 hours per piece. Placement effort is 20 to 40 hours per piece. Return is 2 to 4 high-authority placements per quarter plus the executive brand halo. Enterprise programs that skip executive commentary as a link source miss 20 to 30 percent of the addressable authority signal.
Vendor mix that funds the program
Enterprise saas seo runs on a mix of in-house salaries, one specialist agency retainer, tooling subscriptions, and freelance surge coverage. The mix is 65 to 75 percent in-house, 20 to 30 percent agency, 5 to 10 percent tooling and freelance. Never more than one specialist agency at a time. Never more than three tooling vendors. Never freelance for anything strategic. Those three vendor rules keep vendor management overhead below 5 percent of the total program budget.
The one-agency rule is the most contested one. CMOs push for two or three agencies to keep pricing honest and to hedge against agency turnover. That hedge produces 3x the coordination overhead and drops content quality across every agency inside two quarters. Pick one agency, negotiate the fee hard on renewal, and rebuild the shortlist annually. That pattern beats the multi-agency hedge every time we have watched a CMO run the comparison in practice.
Agency selection process at enterprise scale
Enterprise agency selection runs a 6 to 8 week process with a written RFP, three finalist pitches, two peer reference calls per finalist, and a 90 day pilot on a single region before signing the full retainer. Anything faster and you sign the wrong agency 40 percent of the time. Anything slower and you lose two quarters of compounding while the process drags. The 90 day pilot is the highest signal artifact in enterprise agency selection because it reveals the actual working relationship rather than the pitch relationship.
Tooling vendors that survive an enterprise procurement review
Ahrefs or Semrush for keyword and rank data. Screaming Frog or Sitebulb for crawling. DebugBear or Calibre for Core Web Vitals monitoring. A tag management platform integrated with your CRM. A schema testing pipeline built as code. Three or four total vendors is the honest ceiling that survives procurement without ballooning the vendor management overhead. Enterprise procurement teams reject any tooling stack with more than five active SaaS vendors touching search work. That constraint is real and it is worth respecting because it forces you to consolidate where consolidation is possible.
Launching enterprise saas seo this quarter
Draft the operating charter this month. Hire the central strategy lead next month. Stand up the growth engineering pod the month after. Push the first cross-region publish calendar live within 90 days. Deliver the first CFO reporting dashboard within 120 days. That launch cadence puts the compounding curve on track by month 12 and pipeline attribution stable by month 18.
The strongest programs launch with a written 24 month operating plan signed by the CMO, the CFO, and the VP of engineering. The plan names the team shape, the budget mix, the reporting model, and the quarterly milestones. That written plan is what protects the program during the inevitable Q3 budget review. Programs without a written 24 month plan get cut in the first downturn. Programs with one survive multiple downturns because the plan carries the compounding math the CFO already signed off on.
First 90 days of launching the program
Days 1 to 30 is charter, org chart, and hiring plan for central strategy. Days 31 to 60 is central strategy pod onboarding, technical audit, and content pattern library draft. Days 61 to 90 is regional pod onboarding, first publish calendar, and first monthly report to the CMO. Skip any milestone and the launch drags by a full quarter. Hit every milestone and the compounding curve arrives on the two year timeline the CFO signed off on. Related roadmap at SaaS SEO Checklist.
Signals the program is on track
Central strategy pod hired inside 90 days. Growth engineering pod embedded in product inside 120 days. First cross-region publish calendar shipped inside 150 days. First page one rankings on long tail keywords by month 8. First measurable pipeline attribution by month 12. Full compounding curve with 4x pipeline-to-spend by month 24. Miss any two of these signals in the same quarter and the operating plan needs a reset. Hit them all and the CFO renews the budget quarter after quarter without a fight. Related: Technical SEO for SaaS.
Frequently asked questions
What is enterprise SaaS SEO and how does it differ from Series B work?
Enterprise SaaS SEO is search work at 200 million ARR and above where multi-region compliance, legal review, brand governance, and executive reporting all shape the playbook as much as ranking mechanics do. The tactics are similar to Series B: keyword architecture, technical foundations, content patterns, pipeline attribution. The execution is different because every deliverable passes through legal, brand, and regional stakeholders before it publishes. The velocity ceiling is lower per page, but the total published surface is larger. A working enterprise program publishes 40 to 80 pieces of content per month across regions, keeps a technical debt burndown moving quarterly, and reports pipeline sourced from organic to the board every quarter.
What team shape works for enterprise SaaS SEO?
A working enterprise team runs a central strategy pod of 4 to 6 senior operators, regional content pods of 3 to 5 people per major market, and a growth engineering pod of 2 to 4 embedded in the product engineering org. Central strategy owns the keyword architecture, the pattern library, the governance model, and the CFO reporting. Regional pods own execution against localized keywords, cultural relevance, and regional pipeline attribution. Growth engineering owns rendering, canonical logic at scale, schema governance, internal linking automation, and Core Web Vitals monitoring. Add legal and brand review liaisons on retainer. That shape scales cleanly from 200 million ARR through 2 billion ARR.
How much does enterprise SaaS SEO cost per year?
All-in enterprise SaaS SEO budgets run 1.2 million to 6.5 million dollars per year depending on region count, regulatory footprint, and integration surface area. A three-region program at 250 million ARR without heavy compliance overhead lands at 1.5 million to 2.8 million per year. A five-region program at 800 million ARR with fintech or healthtech compliance lands at 3.8 million to 6.5 million per year. That covers agency retainers, in-house salaries, tooling, content production, link investment, and executive reporting. Companies below 1.2 million per year at enterprise scale are underfunded and see the pipeline curve stall by month 18.
How long before enterprise SaaS SEO produces meaningful pipeline?
Twelve to eighteen months before pipeline attribution stabilizes at enterprise scale. First page one rankings on long tail keywords appear in months 6 to 9 which is later than Series B because the technical debt burndown eats the first two quarters. First measurable pipeline attribution shows in months 10 to 14. Full compounding curve with a 4x to 6x pipeline-to-spend ratio hits by month 24. Enterprise search is a two year investment, not a two quarter one. Anyone selling enterprise SaaS SEO as a fast fix is either running a tactical program on a rebrand budget or misrepresenting the timeline.
What technical patterns scale at enterprise SaaS SEO?
Server-side rendering with client hydration for every page. Canonical logic centralized in a single service rather than sprinkled across templates. Schema governance managed as code with automated validation on every pull request. Internal linking automation driven by an embedding-based similarity model rather than manual editorial passes. Core Web Vitals monitoring with automated alerting to the on-call rotation. A staging environment mirror for schema validation before every release. Skip any of these and technical debt piles up at scale and the ranking curve either stalls or reverses inside 18 months. Google's Search Central documentation is the peer-level reference for the underlying rules.
How do you report enterprise SaaS SEO to the board?
Pipeline sourced from organic search this quarter. Prior four quarters trend. CAC payback for organic-sourced ARR versus paid-sourced ARR. Ratio of pipeline-to-spend for the search program across regions. Number of high-priority technical debt items closed per quarter. Content publish velocity per region against plan. All six numbers on a single dashboard reviewed quarterly. Rankings and traffic go in the appendix. The board wants to see the pipeline curve, the CAC delta, and the operational velocity. Everything else is context. Build the dashboard once and every quarter gets easier.
Book your free 30-minute strategy call.
No spam, no sales rep. We use your email to schedule your call with a senior strategist. That is it.
More from the blog
View all articles → SEO
SEO Organic Search Engine Optimization Services That Grow Real Traffic
Read article SEO
SEO SEO for Pet Groomers That Fills the Appointment Book Weekly
Read article SEO
SEO