
Your Shopify admin says one revenue figure. Meta Ads Manager claims a bigger one. Google Ads reports something in between. GA4 tells a fourth story. Every Monday you spend an hour reconciling four tools before you can answer one question about last week. An ecommerce marketing dashboard fixes that, not by inventing new data but by forcing every channel into one revenue definition, one attribution window, and one refresh schedule you can defend on a partner call.
This guide is the setup we run on DTC accounts before we touch a single campaign. GA4 configured for ecommerce. Shopify tiles wired to the same purchase event. Meta and Google Ads pinned to attribution windows you actually chose. A Looker Studio template that refreshes overnight and pings you if something breaks. A weekly and monthly reporting cadence that keeps the executive team looking at growth instead of arguing about tools. Read straight through, then copy the parts you need.
Shopify tiles inside and outside the ecommerce marketing dashboard
Shopify’s built-in analytics is fine as a receipt. It tells you what happened. It’s not fine as a decision surface, since it does not sit next to your Meta spend, your Google Ads spend, or your email revenue. You need Shopify data pulled into the same canvas as everything else.
What the native Shopify reports do well
The Shopify admin under Analytics gives you total sales, online store sessions, conversion rate, average order value, and returning customer rate at a glance. That view is the source of truth for revenue since it comes from the transactions table itself. Any external dashboard number that disagrees with Shopify admin by more than 2% is either wrong or measuring something different. Sanity-check every external tile against the admin once a week.
Where the native view falls short
Shopify doesn’t know what you spent on Meta or Google Ads, so it cannot show blended return on ad spend, first-touch versus last-touch channel revenue, or marketing efficiency ratio (total revenue divided by total marketing spend across all channels combined). Those are the questions a founder asks every Monday, and none of them get answered inside Shopify admin. You need a stitched ecommerce marketing dashboard for that, and stitching is what a Looker Studio or Klipfolio setup does for you. If you haven’t yet mapped which channels belong on the stitched view, read our ecommerce digital marketing strategy guide first, then come back to this piece for the reporting layer that sits on top.
Looker Studio templates for an ecommerce marketing dashboard
Looker Studio is free, connects natively to GA4, Google Ads, and Search Console, and reads Meta Ads through a paid connector like Supermetrics or Windsor.ai. It is the tool we build every client ecommerce marketing dashboard in unless the account demands something heavier. Free plus native connectors is a hard combination to beat for DTC brands at the sub-$5M revenue tier.
The five pages we build every time
Page one is the Monday-morning summary. Total revenue, total ad spend, blended return on ad spend, marketing efficiency ratio, new customer count, and repeat customer count for the last 7 days versus the prior 7. Page two breaks channels. Meta paid, Google paid, Google organic, direct, email, referral, other, each with sessions, transactions, revenue, and spend where spend applies. Page three is paid detail: campaign-level performance for Meta and Google Ads with cost per acquisition and target versus actual. Page four is site quality: landing page performance, product page conversion rate, cart abandonment, and site speed pulled from PageSpeed Insights. Page five is a customer lens: new versus returning revenue split, customer lifetime value trend, and cohort retention.
Refresh cadence and email pushes
Set the report to refresh every 12 hours. Overnight is enough. Schedule an email delivery of page one to the founder and CMO every Monday at 7am local time. That single automation removes about 90% of the Monday-morning Slack asking where the numbers are.
Attribution windows inside an ecommerce marketing dashboard
Attribution windows are the invisible switch that changes every number in your ecommerce marketing dashboard. You don’t notice the switch exists until Meta claims $80,000 in revenue for a week that Shopify records as $110,000 and Google Ads reports as $22,000. The gap is not fraud and not a bug. It’s three tools reporting against three different windows without anyone choosing which one wins.
| Platform | Default window | What it counts | Best use |
|---|---|---|---|
| Meta Ads Manager | 7-day click, 1-day view | Any purchase within 7 days of clicking an ad, or 1 day of seeing one | Prospecting campaigns and awareness |
| Google Ads | Data-driven, 30-day click | Modeled contribution across touchpoints in 30 days | Search and Performance Max |
| GA4 | Data-driven, 90-day click | Cross-channel modeled attribution in 90 days | Blended channel comparison |
| Shopify | Last-touch, session-based | Whatever source cookie was set on the buying session | Bottom-of-funnel truth check |
| Klaviyo | 5-day click on email | Purchases within 5 days of an email click | Email and SMS revenue |
Our recommendation for a small DTC brand: standardize on GA4 as the reporting layer, use its data-driven attribution with a 90-day lookback for weekly reports, and pin Meta and Google Ads to 7-day click and 30-day click respectively when comparing platform-native numbers side by side. Never mix a Meta 7-day click number with a Google 30-day click number in the same tile and treat them as equivalent. They are not. Label every tile in the ecommerce marketing dashboard with its attribution window in small type so no reader ever loses track of which lens they are looking through.
How to choose an ecommerce marketing dashboard tool
Pick the tool that matches your data volume, your team’s technical bench, and the number of data sources you need to stitch. A four-source Shopify plus Meta plus Google Ads plus Klaviyo brand doing $2M a year does not need Domo or Tableau. A 12-source enterprise DTC doing $50M does not survive on free Looker Studio.
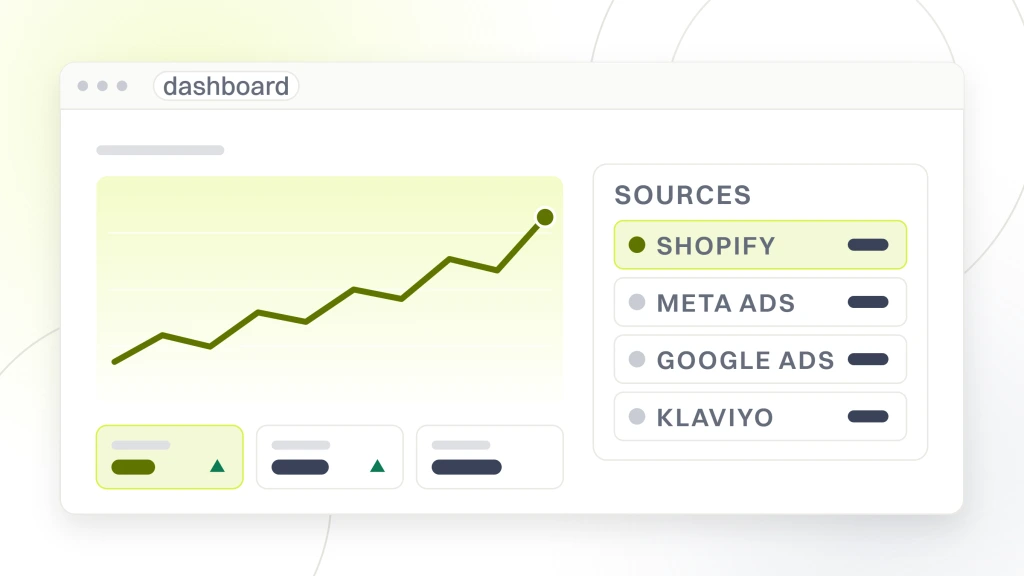
- Looker Studio (free). Native GA4, Google Ads, Search Console. Add Meta and Shopify via Supermetrics ($99 to $299 per month). Best for brands under $5M annual revenue.
- Klipfolio ($90 to $300 per month). Better native Shopify and Klaviyo connectors, more polished chart library, still affordable. Good middle tier.
- Triple Whale ($129 to $499 per month). Ecommerce-specific. Bakes in pixel-based attribution, cohorts, and creative reporting. Best for DTC brands running heavy paid social.
- Northbeam ($1,000 to $3,000 per month). Enterprise multi-touch attribution. Overkill under $10M revenue, needed above.
- Custom BigQuery plus Looker or Metabase. Full control, needs a data engineer. Only for brands that already have technical staff.
The mistake we watch DTC brands make: paying $499 a month for Triple Whale since a competitor uses it, then never wiring the pixel correctly and running against the free Meta-in-platform number anyway. The tool does not fix the setup. Fix the setup first, then decide if a paid ecommerce marketing dashboard adds anything the free stack does not. Half the brands we audit end up staying on Looker Studio after seeing what a clean setup produces, and the savings go straight into ad budget instead of tooling.
Weekly reports from your ecommerce marketing dashboard
The weekly report is the operating rhythm for a DTC marketing team. Every Monday at 9am, the CMO or account lead runs the same 30-minute review against the same tiles, in the same order, with the same commentary template. Nothing new gets invented per week. Cadence is a routine, not an event. Brands on a full-service ecommerce marketing retainer get the same weekly email built and delivered without touching a spreadsheet, so the founder spends Monday reviewing decisions instead of reconciling data.
Every DTC weekly review meeting eventually reaches the moment where somebody points at Meta showing $40,000 and Shopify showing $28,000 and asks which one is real. Nobody wins the debate. Twenty minutes later everyone agrees to standardize on GA4, then next Monday somebody opens Meta first out of habit and the same question happens again. The dashboard exists to end that meeting. Nine weeks in a row and the muscle memory finally sticks.
What the weekly review covers
Total revenue week over week. Total ad spend week over week. Blended return on ad spend week over week. New customer count and average order value on new customers. Repeat customer revenue and average order value on repeats. Top 3 growing channels and top 3 declining. One anomaly noted per report. One decision made per report. If there is no decision, the meeting was pointless and the dashboard is telling you nothing changed.
Weekly report length and format
Two paragraphs of commentary on top. One page of tiles below. Sent as an email with the Looker Studio link and the two paragraphs pasted directly in the body. Don’t send a PDF. Don’t send a Slack thread. Email with paste-in commentary is the only format busy founders read. The Content Marketing Institute guide to measuring content marketing makes the same point about writing for the executive reader, not the analyst.
Monthly metrics and review inside the ecommerce marketing dashboard
Monthly review does what weekly cannot. It looks at cohorts, contribution margin, and channel mix over a stable window long enough to smooth the noise. Weekly reports catch anomalies. Monthly reports drive strategy. The two work together. Neither replaces the other.
The monthly ecommerce marketing metrics that matter
Customer acquisition cost by channel and blended. Contribution margin per new customer after cost of goods, shipping, and payment fees. Customer lifetime value at 30, 60, and 180 days. Marketing efficiency ratio across all spend and all revenue. Repeat purchase rate. Email revenue as a share of total. Organic revenue as a share of total. These are the ecommerce marketing metrics the leadership team looks at on the first Monday of every month, and the ones that decide next month’s budget. Our sibling post on ecommerce marketing metrics covers the benchmark ranges by revenue tier.
The monthly review meeting
60 minutes. Founder, CMO, head of paid, head of retention, agency partner if applicable. Review last month against target. Confirm the channel mix for next month. Approve any budget shift larger than 20% on a single channel. Set one growth experiment for the month. Sign off the reporting document. That is the whole meeting. Anything longer than 60 minutes means the ecommerce marketing dashboard isn’t doing its job, since you are debating what happened instead of what to do about it.
Marketing analytics for ecommerce across channels
Marketing analytics for ecommerce is not one report. It is a stack: platform-native numbers on the bottom, GA4 blended attribution in the middle, and the executive ecommerce marketing dashboard on top. Each layer answers a different question. Confuse the layers and you lose the ability to explain any single number.
Platform-native (Meta in Meta, Google Ads in Google) shows performance the way the ad platform wants you to see it. Good for campaign optimization inside that platform. Wrong tool for cross-channel comparison. GA4 blended attribution compares channels against each other using the same window and definitions. Good for budget allocation between channels. Wrong tool for campaign-level bid decisions. The executive dashboard on top shows the whole business at a glance. Good for founder decisions. Wrong tool for anything else.
The channel work that feeds this stack lives in our guide to ecommerce marketing strategies that drive DTC revenue. Marketing analytics is downstream of channel work. Fix the channels first, measure them second. Dashboards that measure nothing usable were built before the channels were doing anything usable.
The other pattern we see: brands buy a fancy attribution tool before the channels have data worth attributing. A brand doing $30,000 a month in revenue with a $6,000 ad budget across Meta and Google Ads has small-sample-size problems, not attribution problems. Any tool that promises to solve small-sample attribution is selling comfort, not accuracy. Once the channels grow past $50,000 a month in spend, the noise smooths out and attribution starts to matter. That is the moment to add multi-touch tooling on top of the ecommerce marketing dashboard.
The reader test for whether your marketing analytics for ecommerce is working: can the CMO answer, in 30 seconds, which channel produced the highest new-customer contribution margin last week? If the answer takes longer than 30 seconds, the stack is not doing its job. The whole point of a stack is that the answer is one glance away. Anything else is chart-building for its own sake.
An ecommerce marketing dashboard in production
Abigail Ahern, a luxury home decor brand running on Shopify, came to us with the classic DTC measurement mess. Meta claimed one revenue figure, Google Ads claimed another, Shopify a third, and the founder had stopped believing any of them. The dashboard problem was upstream of a bigger issue. Campaign optimization was happening against numbers nobody trusted, so nobody was willing to shift budget between channels.
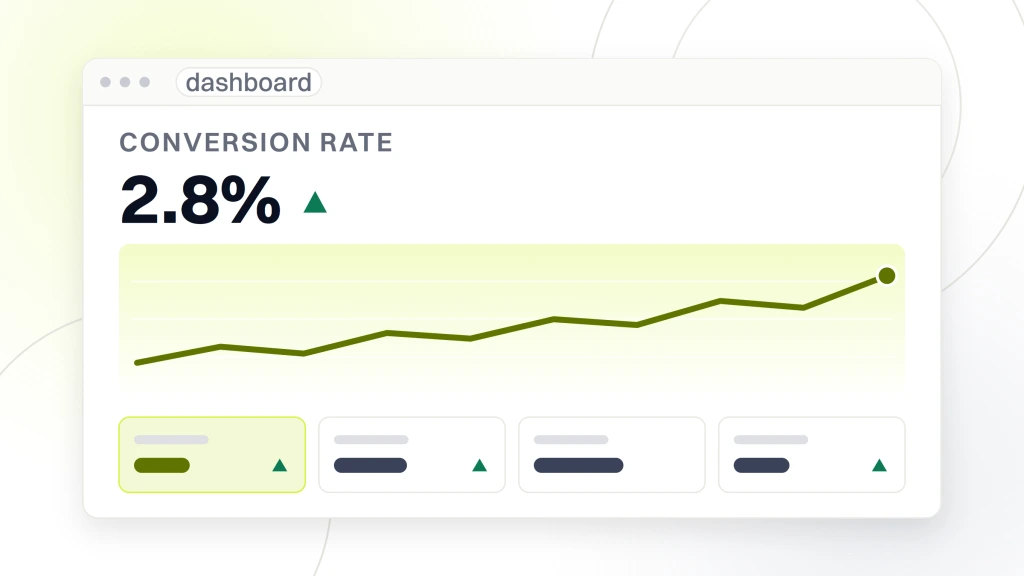
Our team started by rebuilding GA4 from the ecommerce event layer up. Purchase, add_to_cart, begin_checkout, view_item all firing with items array populated. Data retention set to 14 months. Google Ads and Search Console linked. Then a Looker Studio ecommerce marketing dashboard on top with the five-page structure covered above, refreshing overnight and pushing a Monday email to the founder. Attribution windows pinned: GA4 data-driven with 90-day lookback as the reporting layer, Meta 7-day click for platform decisions, Google 30-day click for search decisions. Nothing changed about the actual campaigns for the first two weeks. Only the reporting stabilized.
Once the reporting stabilized, the campaign work could begin. Premium-aligned creative replaced discount-heavy messaging, shopping campaigns got segmented by category depth, and organic category-page work went in behind the paid layer. Conversion rate doubled from around 1.4% to over 2.8%, revenue grew 179% year over year, paid social hit 3,000% ROAS on retargeting and prospecting, and the founder stopped asking which number was real. That last part is the outcome that matters. A reliable ecommerce marketing dashboard is what let every other improvement compound. The same operating rhythm shows up across our sibling read on ecommerce marketing trends 2026. The brands moving fastest in 2026 are the ones running the tightest reporting cadence, not the ones chasing the newest channel.
Where your ecommerce marketing dashboard fits the stack
A dashboard is a decision surface, not a deliverable. It sits on top of the marketing work the way a speedometer sits on top of an engine. It reads what the engine is doing. It does not make the engine faster. Brands that treat the dashboard as the goal end up polishing tiles as the campaigns underneath drift. Brands that treat it as a decision surface make one budget shift a week and one strategy shift a month against numbers they trust.
The DTC brands we work with run the ecommerce marketing dashboard alongside a full-service program: paid social, paid search, email, SMS marketing for ecommerce, organic, and creative production, all reporting into the same measurement stack. Every channel reports into the same GA4 configuration, the same attribution windows, and the same Looker Studio template. Retainer tiers run $1,499, $2,499, $3,999, or from $6,000 per month, and typical engagements run six months, which is the window most channel work needs to actually compound.
Measurement without channels is chart-building. Channel work without measurement is guessing. You need both, running against the same definitions, on the same cadence, every week. Pick your GA4 configuration, pick your attribution windows, pick your Looker Studio template, pick your weekly and monthly meeting rhythm, and hold them for at least six months before you change anything. Every change to the reporting layer resets the comparison baseline and buys nothing back in signal. The DTC brands that grow the fastest through 2026 are the ones that made those five picks a year ago and never touched them again.
If your reporting stack is not delivering a decision every week, the fix is not another tool. The fix is trimming what you already have down to the six tiles a founder actually reads. Every extra chart is a place the eye stops before reaching a decision. An ecommerce marketing dashboard done well is boring on purpose, since the interesting part is the campaign work the dashboard makes possible. Redefine Web operates as a full-service ecommerce marketing agency for DTC brands ready to run this operating rhythm without hiring in-house data staff, and the ecommerce marketing dashboard is the first artifact we build.