
Dental marketing ROI is where most agency reports quietly fall apart. The dashboard shows 42% more sessions and a small bounce-rate win, the practice owner nods, and nobody in the room can answer whether the $6,400 monthly retainer produced booked patients. The honest answer needs a real tracking stack behind it, with numbers on new patients per channel, first-year production per patient, and blended cost per acquisition.
This guide is the math. You get the tracking stack, the attribution model that separates PPC calls from organic form fills, the monthly cadence, and the benchmark ranges we see across dental clients spending $1,600 to $38,000 a month. Read it once, apply half of it this week, and the dental marketing ROI question stops being a monthly argument.
Key Takeaways
- The ratio answers 3 numbers, spend, new patients, first-year production.
- Cost per new patient under $150 is healthy for most single-location practices.
- Local SEO compounds after month 6 and cuts blended cost per patient in half.
- Monthly reports track inputs, quarterly reports lock the ratio.
- Hidden costs shave 15 to 30% off reported ROI.
Table of contents
- What goes into reporting
- Channel benchmarks by paid, local, and Meta
- North County Dental Care and 500% ROI
- Hidden costs that drag the ratio down
- How often to recalculate
- Where the number lives inside a retainer
- Tooling that supports analytics
- Common reporting mistakes
- Smile Design and 30% lower cost per call
- Frequently asked questions
- Where to start this Monday
What goes into dental marketing reporting
Reporting has one job. Answer the ratio in under 90 seconds, then support with the input metrics an owner asks about next. Most reports invert that priority and lead with traffic charts before the booked patient number on page 6. Put the number on page one and the meeting gets shorter. Strong dental marketing analytics puts spend, new patients, and first-year production side by side on the same page. That single design change trims 20 minutes off every monthly retainer meeting we sit in.
The monthly report starts with a one-page scorecard. Total spend. New patients attributed via GA4, call tracker, and PMS reconciliation. Blended cost per new patient. First-year production estimate. ROI ratio. Change versus prior month and prior quarter. Everything else is supporting detail.
Quarterly business review
Once a quarter, expand the scorecard into a 30-minute review. Trailing 12-month ratio. Channel share of new patients. Case mix trends, more implants, more hygiene recall, more emergency cases. Competitive movement. Roadmap for the next quarter. That review is where retainer scope gets adjusted, not the monthly meeting. Owners who skip it lose a full quarter of course-correction each year.
When the report should raise a flag
Any month where cost per new patient rises 25% or more, the ratio drops below 2.5x, or direct traffic expands past 45% of total sessions gets a written explanation in the same report. Owners lose confidence when bad months arrive unexplained. Naming the cause inside the same report keeps trust intact.
Channel benchmarks by paid, local, and Meta
Blended results hide channel performance. Cutting the paid budget since organic is producing more new patients is how practices starve the top of the funnel. Every channel needs a dedicated line, its own cost per patient, and a payback window.

Google Ads and Local Services Ads
Paid search produces the fastest signal since calls land inside week one. Track cost per booked appointment, not just cost per call, since 20 to 35% of ad calls are wrong numbers, price shoppers, or existing patients. Our dental google ads management post covers the monthly waste audit that keeps cost per lead from drifting up. Healthy paid cost per new patient sits between $110 and $260 depending on market and case mix.
Local SEO and Google Business Profile
Local SEO takes 4 to 9 months to produce material return, then compounds. Track pack ranking movement, direction requests, phone calls from the Business Profile, and website visits from the pack. Once pack ranking stabilizes in the top 3 for the main service keywords, patient acquisition cost drops below $100 and stays there. That compounding effect is why local SEO usually beats paid on a 24-month view, and it is the number that quietly rescues dental practice ROI.
Meta ads and website work
Meta ads produce a slower signal since most patients see the ad, sit on it, then search on Google 2 to 5 weeks later. Attribution windows need at least 28 days. Website work shows up as a rising conversion rate across every other channel. A good rebuild produces 8x to 30x once you spread the build cost across a full year of improved conversion.
If blended cost per new patient is under $150 and rising less than 8% per quarter, hold the mix and pour into local SEO. If it is over $300, rebuild the tracking first.
Case study, North County Dental Care and 500% return
North County Dental Care, a 20-year practice in Vista, California, is a clean case study since tracking was rebuilt from zero. The practice had 1 to 2 new patients a month, zero page-one keywords, and no HTTPS on the site. We rebuilt on a secure, mobile-first stack, wired local SEO through the Google Business Profile, and layered Google Business Profile ads on top, with Google Analytics tracking every campaign.
The result
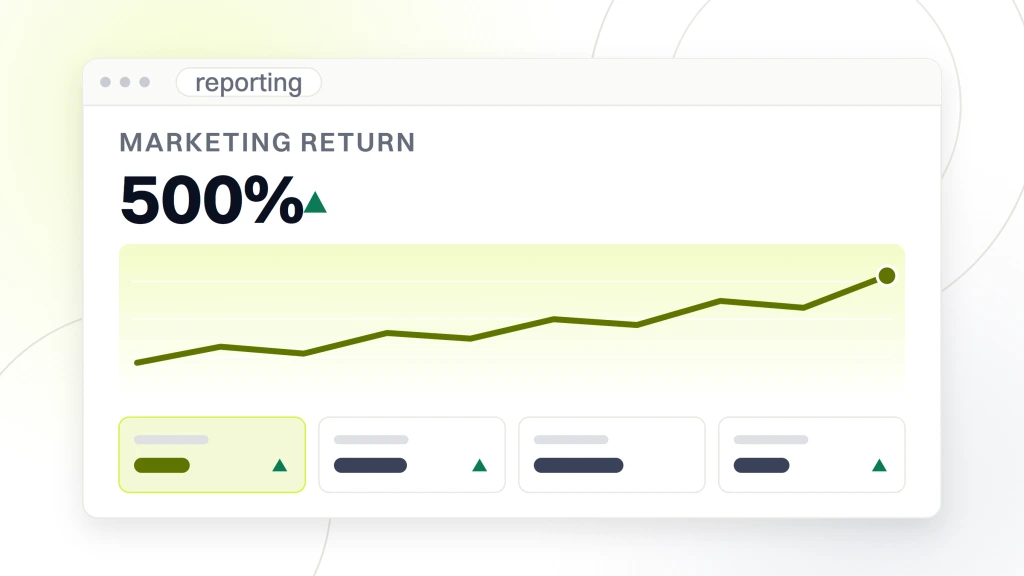
Monthly new patients moved from 1 to 2 to 12 to 16. Organic traffic grew 385%, and patient volume grew 1,000% from 2021 to 2024. Marketing return landed at 500%.
Hidden costs that drag the ratio down
Every ratio calculation is dragged down by costs practices forget to include. The retainer number on the invoice is the visible cost. The invisible costs kill the ratio, unclaimed vendor upsells, tools nobody uses anymore, and front-desk time spent on marketing calls the website should handle before staff picks up. Add all of it and the ratio drops 15 to 30% from what the agency reports.
Zombie SaaS, card fees, and junk-call front-desk time shave 15 to 30% off reported ROI. Add them to the denominator every quarter, not once a year.
Zombie tools bill
You could keep paying $89 a month for the review platform nobody has logged into since 2023. Or audit the tool stack quarterly and cancel the 4 services with zero user activity. Most practices we audit find $200 to $600 a month of zombie SaaS on the credit card. Cancel first, calculate second. A quick audit against Content Marketing Institute budget benchmarks gives a defensible starting point.
Ad platform fees and card interest
Ad spend runs on cards, so total cost includes card processing (or interest if balances roll). A $6,000 monthly ad budget on a 1.8% processing card adds $108 a month in fees. Real when it compounds across 24 months. Roll balances at 24% APR and the number triples inside a year.
Front-desk time on bad leads
Every bad lead the front desk handles is 4 to 7 minutes of billable staff time. At $22 an hour loaded, that is $1.50 to $2.60 per junk call. 40 junk calls a month is $60 to $104 in absorbed staff cost the report never shows. Fix quality upstream. Our improve lead quality dental marketing post walks through the negative keyword and audience refinements that cut junk volume in half inside 30 days. That single fix moves cost per new patient down 12 to 20% inside a full quarter.
How often to recalculate the ratio
Monthly is too noisy. Annual is too late. The right cadence is monthly for input metrics, quarterly for the ratio, annually for the trailing 12-month view. That rhythm gives the owner a real answer at the pace the practice can act on it, without panic over a bad month that was seasonality.
Monthly is for inputs
Every month, track spend, new patient count, patient acquisition cost, and channel breakdown. Do not recalculate the ratio monthly. First-year production is a trailing number that needs at least 90 days of hygiene visits to be honest. Monthly reports oversell January and undersell July since seasonal case mix distorts the number.
Quarterly is for the ratio
Every quarter, use the last 90 days of PMS data to calculate real first-year production for the cohort acquired 90 or more days ago. Multiply by the current cohort. Divide by the spend. Compare to the prior quarter and prior year to see the trend without seasonal noise. Above 3x is healthy. Above 5x is compounding.
Annually is for the retainer decision
Once a year, calculate the trailing 12-month number across every channel. That decides the next year of retainer scope. Below 3x for 4 quarters gets cut or restructured. Above 6x for 4 quarters gets more budget.
Where the ratio lives inside a retainer
Every retainer we run has an expectations conversation on day 1, day 30, and day 90. The purpose is to align on what the number will look like at each checkpoint so owner and account team read the same report the same way. Miss that conversation and every future report becomes a negotiation.
The day 90 number sets the trajectory for the whole year. Rebuild the tracking in the first 30 days or the day 90 conversation turns into an argument.
Day 1 baseline
Pull the trailing 12 months of PMS data, calculate blended patient acquisition cost across every channel, calculate first-year production per new patient, and lock those numbers as the anchor. Every future report references that baseline.
Day 30 inflection
Day 30 is when input metrics start moving. Paid campaigns are live, call tracking is stable, GA4 events are firing correctly, and the first cohort of tracked calls is coming through. Day 30 is the tracking checkpoint, not the ratio checkpoint. If tracking is not working at day 30, the day 90 conversation will be a disaster.
Day 90 proof
Day 90 is when the first real number lands. 90 days is enough for paid to hit steady-state, local SEO to start moving, and the first cohort of new patients to complete a hygiene visit. Retainer starts at $1,499 a month for a single-location practice. Our dental marketing plan post covers the scope decisions that pair with the 90-day review.
Tooling that supports dental marketing analytics
The right tool stack is small. GA4, a call tracker, Google Search Console, Google Ads Editor, Meta Ads Manager, and a reporting layer that pulls all of them into one dashboard. Everything else is optional. Practices that add tools without a tracking reason usually end up with 14 subscriptions and worse dental marketing reporting than a practice with 5 tools wired correctly. The 5-tool floor is the honest baseline for a single-location practice, and it survives audits from any incoming account team.
Reporting layer options
Looker Studio is free and pulls from GA4, Google Ads, Search Console, and CallRail natively. It handles 80% of what a dental practice needs. Paid options like AgencyAnalytics or Whatagraph add polish but cost $99 to $249 monthly. Start with Looker Studio and upgrade only if the reporting layer becomes a real bottleneck.
Call tracker choice
CallRail is the default for small-to-mid dental practices. CallTrackingMetrics is the alternate for practices needing HIPAA-compliant recording. Both integrate directly with GA4 and Google Ads. Fancy call trackers with limited GA4 integration are the fastest way to break the report.
DIY versus done-for-you
10 to 15 hours a month is realistic for a solo practice to keep tracking honest, doubling for multi-location. Most owners bundle the tracking work with the marketing retainer. Prefer in-house, our dental marketing tools post lists the toolchain and training curve.
Common dental marketing reporting mistakes
Every mistake we see falls into 3 buckets, mis-attributing existing patients as new, double-counting channels, and treating vanity metrics as ROI. Each one is fixable inside 30 days.
If your report leads with sessions, bounce rate, or impressions, patient acquisition cost is buried. Put spend, new patients, and cost per new patient on page 1.
Existing patients counted as new
A call from an existing patient who clicked an ad is not a new patient acquisition. Yet Google Ads counts it as a conversion and the retainer report flows it through as new. Reconcile against the PMS every month. Any patient with a chart older than the campaign start date is returning. Skip reconciliation and new-patient counts inflate 10 to 25%.
Double-counting across channels
A patient who sees a Meta ad, searches on Google, clicks a Local Services Ad, and then calls will show up in 3 channel reports. Blended reporting counts them once. Channel reports summed together often count them 3 times, which inflates total new patients by 20 to 40%. Always cross-check the sum of channel counts against the blended count.
Vanity metrics dressed as ROI
Impressions, sessions, engagement rate, and average session duration are input metrics. Treating any of them as ROI is how practices pay for traffic without producing patients. Every input metric should trace to a booked appointment in fewer than 3 steps. If not, it is decoration.
Case study, Smile Design cuts cost per call 30% across 50+ offices
Smile Design Dentistry, a 50+ location dental support organization across Central Florida and Tampa Bay, came to us with a broad-target PPC program that produced low-quality leads and a broken cost-per-call number. Spend was up and patient quality was down. We restructured every campaign by funnel stage and geography, built brand-consistent landing pages, wired CallRail across every phone line, and added a full-funnel paid social program.
The result across the first 12 months. PPC conversion rate up 20% since every campaign spoke to a specific funnel stage. Cost per call down 30% since low-intent traffic stopped hitting the phones. Full coverage across every 50+ office, with per-location bid logic that sent high-intent leads to offices with capacity. Every gain traced back to segmenting by funnel and geography, and to patient-quality scoring on every call.
Where to start on the tracking audit this Monday
Start Monday morning with the tracking audit. Log into GA4 and confirm phone-call and form-fill events are firing. Log into your call tracker and confirm dynamic number insertion is live on every landing page. Log into the PMS and pull the trailing 12 months of new patient counts. Reconcile the 3 sources. Fix any gaps this week before you calculate a single ratio.
Then set the reporting cadence. Monthly scorecard on the first Friday. Quarterly ratio on the last Friday of each quarter. Annual retainer review the second week of January. That rhythm produces defensible numbers inside 90 days and compounding growth inside 12 months. For scope that pairs with this cadence, our dental marketing plan post covers the package. Our dental marketing tools post covers the toolchain.