Most DTC founders treat ecommerce social media marketing like a checklist bolted onto whatever the team ran last quarter. Instagram, since everyone posts on Instagram. A boosted reel that got 12 organic likes. A rushed brief to the TikTok shop that promised viral for $4,000 a month. Six months in, the founder stares at a spreadsheet showing five channels, three creator contracts, and attribution that reads like guesswork. The plan was missing before the channels started, and posting harder won’t fix that.
This guide walks the four platforms DTC brands should actively plan around. Instagram, TikTok, Pinterest, and YouTube, split by product category. It maps the organic and paid budget split that pays back. It covers creator and UGC programs that scale without burning the retainer, plus shopping features on each platform and the measurement stack that closes the loop. Our ecommerce marketing agency hub covers the wider retention plus paid model this social plan feeds into.
Ecommerce social media marketing that moves DTC revenue
A social plan is not a posting schedule. It’s a decision about which platforms carry the brand, which product categories get which formats, how organic and paid split the budget, and which numbers the team reads to figure out whether the retainer produces revenue. Written that way, ecommerce social media marketing turns into a compounding acquisition engine over 6 to 12 months. Written as a monthly posting quota, it turns into a cost line the founder wants to kill by the third quarter.
The three inputs that decide the plan
Every social plan runs on three inputs. Product category, since a candle brand won’t need the same channel mix as a running-shoe brand. Buyer research stage, so a first-time discovery buyer gets different content than a repeat customer three orders in. Budget tier, since the same channels behave differently at $3,000, $15,000, and $80,000 monthly. Reading the three together produces a channel mix that fits the brand and a budget split that stays honest against the revenue numbers reported at quarter-end.
Skip any single input and the plan gets built around founder assumptions rather than audience behavior. That’s the pattern behind most of the failing social programs we audit on DTC accounts.
Why the channel mix matters more than the calendar
Picking the wrong two channels and posting daily earns less revenue than picking the right two and posting twice a week. DTC brands routinely spread thin across five platforms since the founder read a case study on each one, and that spread produces mediocre content on every channel. The healthiest social programs pick two lead channels plus one supporting channel, then run those three at high quality for two quarters before adding anything else. That discipline is the single biggest gain most brands miss inside their social plan.
Picking channels inside an ecommerce social media marketing plan
Channel selection is the first real decision after the founder writes the plan. Every platform rewards a different content shape, sells a different buyer, and attributes revenue differently. Getting the channel mix right in the first quarter beats trying to fix it in the fifth. The map below is the shortcut our accounts use to pick the two lead channels for any DTC brand within a 30-minute strategy call.
| Product category | Lead channel | Second channel | Support channel | Rationale |
|---|---|---|---|---|
| Beauty, skincare, cosmetics | TikTok | Discovery plus tutorial demand | ||
| Apparel, footwear, accessories | TikTok | Visual identity plus try-on content | ||
| Home decor, furniture, lifestyle | YouTube | Long buying cycle plus inspiration search | ||
| Fitness gear, athletic apparel | YouTube | TikTok | Demonstration plus community proof | |
| Food, beverage, CPG | TikTok | Recipe plus tasting reactions | ||
| Tech, gadgets, considered purchases | YouTube | TikTok | Long-form review demand | |
| Baby, kids, family products | TikTok | Trust plus gift-planning search |
The table above is the starting point. Real brands adjust based on audience data pulled from Shopify order profiles, Meta and Google audience insights, and post-purchase surveys. A skincare brand skewing 45 plus in checkout data leans harder on Instagram than TikTok even when the default map says otherwise. A tech brand selling under $80 average order value runs TikTok harder than YouTube, since the buying cycle is shorter than the map assumes. Reading the audience data alongside the category default turns the map into a plan.
Budget also shifts the map. A brand with $3,000 monthly for social can’t run three lead channels reliably and should collapse to a single lead plus one support. A brand with $30,000 monthly can afford the full three-channel spread plus a dedicated paid layer on the top two channels. The right map is the one that matches actual bandwidth and revenue expectations for the coming two quarters, revisited every 90 days.
Instagram plays for DTC apparel and beauty brands
Instagram is the workhorse for apparel and beauty DTC brands, since the platform still favors curated visual identity and Instagram Shopping tags close the loop from feed to ecommerce website product page inside two clicks. Brands that run Instagram well treat it as a portfolio, an editorial channel, and a shop at once. The content mix has to reflect all three jobs, or the account drifts into one shape and starves the other two.
The content mix that produces revenue
Reels carry the discovery load and the algorithmic reach. Feed posts carry the brand identity and the curated visual proof. Stories carry the direct-to-buyer nudge, the sale reminder, and the founder voice. Creator collabs carry the third-party trust and the audience expansion. A healthy Instagram mix runs three reels weekly, two feed posts, daily stories, and one creator collab every two weeks.
Reels get boosted with a modest $50 to $150 daily spend once they beat a save-rate benchmark of 3%. That’s the operational routine that produces compounding organic reach for beauty and apparel DTC brands on a budget between $3,000 and $10,000 monthly, and it holds up across categories once the cadence is set. Instagram Shopping tags run on every eligible feed post and every reel that features a product, which turns organic reach into last-click revenue.
Creator collaborations that scale
Instagram creator collabs work best when the brand runs 6 to 10 micro-influencers per quarter rather than one macro-influencer per year. Micro creators in the 10,000 to 100,000 follower range carry engagement rates of 3 to 6%, versus 0.5 to 1% for macros. The budget goes further, the content stays authentic, and the brand collects a library of creator-owned reels the paid team can license. Our sibling read on content marketing for ecommerce pillars and distribution covers the pillar side that feeds creator briefs. Assign one internal owner to the creator program, hold the roster steady for two quarters, and the compounding kicks in around month four.
TikTok for DTC discovery and product education
TikTok is the discovery engine for DTC brands under $150 average order value, and the education engine for anything with a demonstration story worth telling. Beauty, food, home cleaning, gadgets, and apparel all pay back on TikTok once the content stays raw, useful, and shot in real environments rather than studio-styled. Brands that struggle on TikTok are the ones treating it as a video Instagram. That framing doesn’t work, and the algorithm punishes it inside two weeks of posting.
The three video shapes that convert
- Founder or team-shot demonstration videos. 30 to 60 seconds, product used in a real scenario, no music beyond the trending sound.
- Creator-shot review videos. 45 to 90 seconds, honest reaction plus product context, filmed on phone in daylight.
- Educational or myth-busting content. 60 to 90 seconds, expert answers a common category question and ties back to the product without pitching.
- Behind-the-scenes brand content. 20 to 40 seconds, warehouse or founder moments, warms the audience without asking for a sale.
- Trend-native content with product hook. 15 to 30 seconds, current sound plus product placement, low-effort volume play.
Brands running TikTok well post four to seven times per week across those five shapes, run TikTok Shop for the categories eligible, and boost the top 10% of organic videos with Spark Ads. TikTok’s audience carries a stronger discovery bias than any other platform, and the platform rewards volume plus creator variety over polished production. Budget between $5,000 and $12,000 monthly is enough for a mid-market DTC brand to run both organic and Spark Ads reliably, with the content team producing four to six pieces weekly. Attribution runs looser on TikTok than on Meta, and the account has to accept an assisted-conversion window rather than last-click precision.
Pinterest for home decor and lifestyle DTC brands
Pinterest is the most underused platform in ecommerce social, and the highest-ROI channel for home decor, wedding, kitchen, garden, and craft categories. Pinterest users search for inspiration with buying intent that runs 60 to 180 days ahead of purchase, which fits a long-consideration DTC catalog beautifully. Brands that ignore Pinterest for those categories give away steady last-click revenue every quarter.
Pin formats and posting cadence
Idea Pins and Video Pins carry the discovery reach on Pinterest, and Static Product Pins carry the last-click revenue. A healthy Pinterest program mixes 40% Idea Pins, 30% Static Product Pins, 20% Video Pins, and 10% Rich Article Pins for the blog. Cadence sits at 8 to 15 pins weekly across those formats, with new pins created rather than reused, since Pinterest rewards fresh content over recycled uploads.
Idea Pins get built around inspiration themes tied to seasonal search demand. Room-by-room decor inspiration for home brands. Recipe inspiration for kitchen brands. Wedding board planning for wedding brands. The seasonal calendar drives the Idea Pin themes 60 days ahead of buying season, since Pinterest search behavior runs earlier than any other social platform.
Pinterest Shopping and the tag stack
Pinterest Shopping tags run on every product pin, and the merchant catalog feed pulls directly from Shopify or WooCommerce with the Pinterest tag installed. Brands running the full tag stack see 15 to 30% lower cost per checkout on Pinterest ads than on Meta for the same product line in home and craft categories. Our sibling read on email marketing for ecommerce flows campaigns and examples covers the retention layer that catches Pinterest-sourced first-time buyers after checkout. Pinterest’s audience skews slightly older and higher intent than Instagram, and the platform rewards consistency more than volume.
YouTube for high-consideration DTC categories
YouTube pays back on DTC categories where the buyer researches for weeks before purchase. Tech gadgets, running shoes, specialty coffee, high-ticket kitchen equipment, and any product with a demonstration story that runs longer than 90 seconds all work on YouTube. Brands that skip YouTube on those categories give up the most searched-for buying research channel in the DTC world.
Long-form plus Shorts plays
YouTube runs two content shapes together for DTC brands. Long-form videos of 8 to 20 minutes cover deep product education, category comparison, and founder or expert explainers. Shorts of 30 to 60 seconds carry the discovery load and the cross-platform reuse from TikTok and Reels. Publishing one long-form per week plus three Shorts per week is the realistic cadence for a DTC brand with a small in-house content team.
Long-form videos benefit from real SEO on the title, description, and chapter markers, and they compound over 12 to 24 months in a way no other social channel matches. A single long-form review video ranking for a category buying keyword produces steady traffic and revenue for years, which is the compounding math that makes YouTube worth the production cost. Brands with budget under $8,000 monthly should partner with an existing YouTube creator rather than building a channel from cold, since the payback window for a cold channel is 18 to 36 months.
YouTube ads for high-ticket DTC
YouTube Ads work well for DTC brands with average order value above $150, since the video ad format supports the longer explanation that a considered purchase needs. In-stream skippable ads of 45 to 90 seconds produce the strongest paid results for high-ticket DTC. Bumper ads of 6 seconds work for retargeting warm audiences already familiar with the brand. Video action campaigns from Google Ads run cost per checkout that beats Meta for high-ticket categories by 20 to 40% in the accounts we run, once the creative library is deep enough. That paid layer sits alongside the organic channel and reinforces the compounding behavior.
Organic versus paid split across ecommerce channels
The organic versus paid split is the second real decision after channel selection. Most DTC brands lean too heavily on paid, since paid produces attributable revenue faster, but paid alone produces a cost curve that only goes up. Organic compounds, paid amplifies, and the mix has to hold both layers accountable to different windows.
Budget split by brand stage
Launch-stage brands run 70% paid and 30% organic content investment, since paid drives the first thousand customers and organic builds the library. Growth-stage brands running $500,000 to $2 million monthly revenue shift to a 55% paid, 45% organic split as the organic library starts compounding. Mature brands over $5 million monthly revenue often sit at 40% paid, 60% organic, since the organic library carries traffic on its own and paid becomes the amplification layer for the strongest organic pieces.
Cost per acquired customer on paid alone runs 30 to 90% higher than the blended organic-plus-paid mix inside your ecommerce sales funnel on mature brands, which is the math that pushes the split toward organic over 24 months. Founders that push all budget into paid for two straight years end up with a customer acquisition line that eats every retention dollar. The blended mix protects the retainer against that outcome.
Boosting organic content as the bridge
The cleanest way to bridge organic and paid is to boost the top 10% of organic content with a small daily spend. A reel that beats a save-rate benchmark on Instagram gets $75 daily for seven days. A TikTok that hits a completion-rate benchmark gets $100 daily on Spark Ads for five days. That boost routine turns proven organic pieces into paid winners with 40 to 70% lower cost per checkout than cold paid ads, and it feeds the paid team a steady creative library. Sibling reads on best practices for ecommerce marketing across paid organic and CRM cover the paid-media discipline in more depth.
UGC and creator programs that scale reliably
User-generated content and creator partnerships are the single largest source of scalable, high-performing paid creative for DTC brands. Studio-shot brand content wears out inside three weeks on Meta. Creator-shot and UGC content lasts 8 to 12 weeks before performance decays. That difference makes creator programs the operational backbone of the paid ad account.
Building a creator roster that produces monthly
A functional creator program runs 8 to 15 active creators at any time, split across two tiers. Tier one covers micro-influencers in the 10,000 to 100,000 follower range who post branded content on their own feeds. Tier two covers UGC-only creators who deliver raw footage the brand edits and posts on brand-owned channels. Paying tier one $500 to $2,000 per post plus product, and tier two $200 to $600 per delivery plus product, is the realistic budget structure for a mid-market DTC brand.
Rotate roughly a third of the roster every quarter to keep the content voice fresh, and lock the top performers on multi-quarter retainers to protect content pipeline. That structure produces 20 to 40 usable pieces of creator content every month, which fills the paid ad rotation and refreshes the organic feed without exhausting the internal team.
UGC as the paid ad workhorse
UGC-style ads on Meta and TikTok outperform brand studio ads by 25 to 60% on cost per checkout across the DTC brand marketing accounts our team runs. The mechanism is that the audience doesn’t feel the sales angle on a raw phone-shot video, so the click and conversion rates stay higher. Feed the top-performing UGC into Meta Advantage Plus and TikTok Smart Performance campaigns, refresh the creative every two weeks to beat ad fatigue, and the paid team stops fighting rising cost per acquisition. Sibling reads on marketing automation ecommerce platforms and flows cover the retention side that catches those UGC-sourced buyers after checkout.
Social commerce and shopping features across platforms
Social commerce features shortened the click path from social feed to checkout by two or three steps, and the platforms that support in-app checkout carry higher conversion rates than the off-platform equivalent. Not every category benefits equally from every shopping feature, and the operational cost of maintaining catalogs across four platforms is real. Picking the right one or two features to run properly beats spreading across all of them.
Feature-by-feature payback
Instagram Shopping tags on feed posts and reels are the highest-ROI feature to install first, since setup is trivial and the tag closes the loop from creative to product page inside the feed. TikTok Shop pays back for beauty, food, apparel, and small home goods under $80, and the platform’s live shopping features add a real revenue channel for brands willing to host regular streams. Pinterest Shopping tags on product pins carry steady last-click revenue for home, wedding, and craft categories. YouTube Shopping is still developing and works best for creator partnerships rather than direct brand catalogs today. Facebook Shops carries meaningful revenue only for brands with an established Facebook community, and most DTC brands running under $1 million monthly can skip Facebook Shops entirely.
The order of installation should follow the channel priority. If Instagram is a lead channel, Instagram Shopping installs first, and TikTok Shop follows once the TikTok content routine is running consistently. That prioritization keeps the ops team from drowning in catalog maintenance across four platforms at once.
Catalog hygiene and product feed setup
Product feeds should route through a single source of truth, usually the Shopify or WooCommerce store, and every platform integration should pull from that feed rather than a manually maintained duplicate. Feed hygiene items to audit weekly include product titles, primary images, price accuracy, stock status, and category taxonomy. Feeds with under 90% accuracy on those fields get rejected by platform ad reviewers, which stops paid spend and blocks catalog shopping features. Feed hygiene is unglamorous and it’s the single largest operational gain for social commerce success.
Measurement stack for ecommerce social media marketing
Measurement decides whether the social plan gets renewed the next quarter. Content that doesn’t get measured against revenue drifts into a vanity project. Stacks that stop at follower count and engagement rate fail every founder who has to defend the retainer to the CFO. The right stack ties social to real revenue on a monthly and quarterly cadence, and the numbers get pulled from GA4, Shopify UTM, and the platform pixels together rather than any single source.
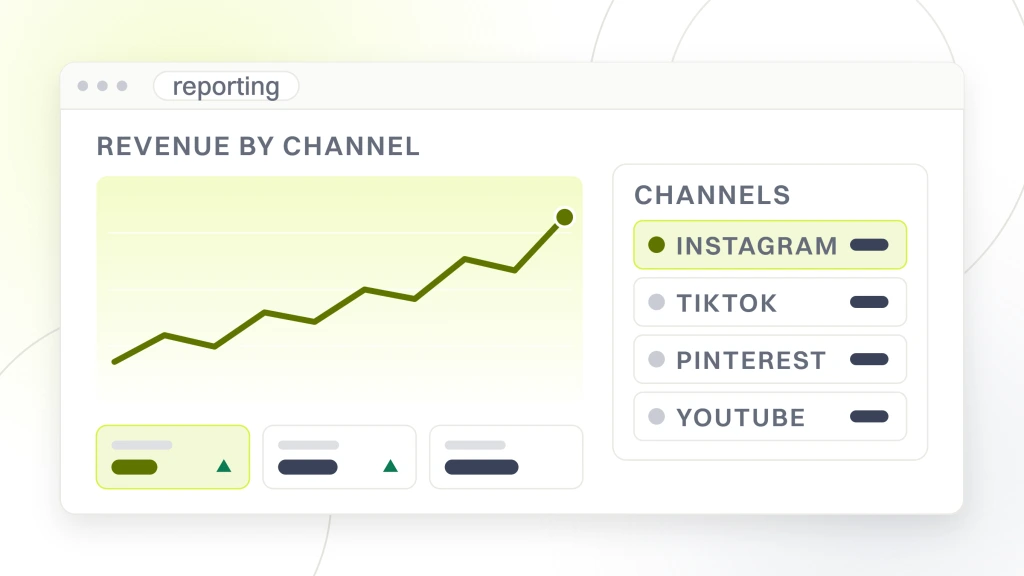
The Hootsuite guide to social media metrics covers the platform-level KPIs in more depth for teams building the measurement stack in-house.
The six numbers every social program should track
Reach and impressions per platform give the top-of-funnel volume number, but they sit at the top of the pyramid rather than the bottom. Engagement rate per post, which is likes plus comments plus shares plus saves divided by impressions, shows creative quality. Click-through rate from social to the store shows the bridge is working. First-touch attributed revenue from GA4 plus Shopify UTM overlay shows the discovery contribution. Last-touch attributed revenue from platform pixel reporting shows the closing contribution. Cost per acquired customer blended across paid and organic ties the whole plan back to the retainer math.
Reading the six together on a monthly Looker Studio dashboard gives the founder an honest view, and the quarterly review looks at platform-level trends rather than single-post performance. Sibling reads on ecommerce marketing dashboard attribution and reporting cadence cover the dashboard side in more depth.
A DTC brand running the plan in production
Boogie Board came to our team as an established ecommerce brand with Google Ads that lacked precise targeting, wasted spend, and landing pages that didn’t showcase product benefits clearly. Attribution ran mostly last-click, the paid mix leaned on branded search, and the creator roster was thin. Repeat purchase and loyalty were missed. The organic side had no consistent reel cadence, and the TikTok account had no volume.
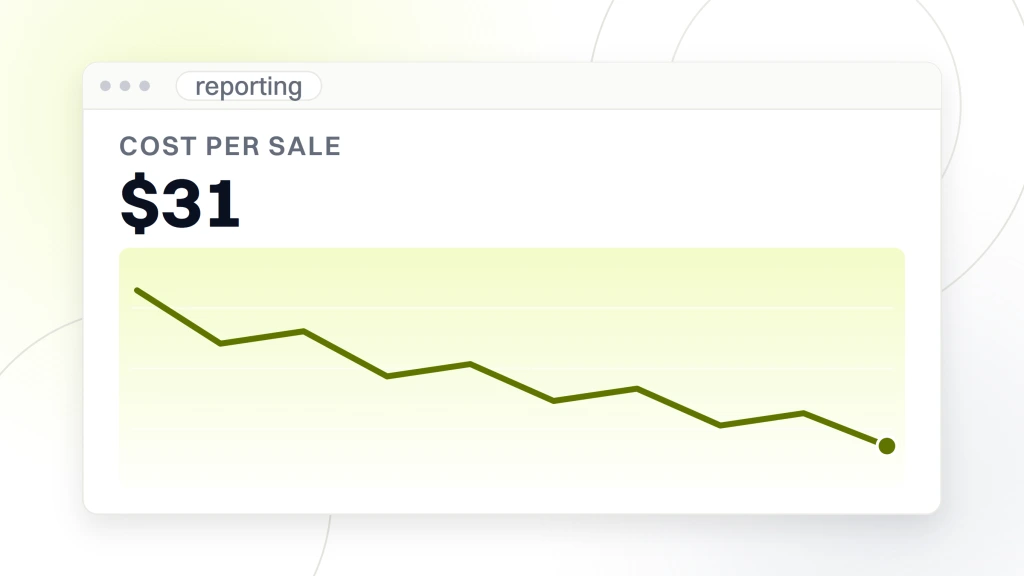
Our team rebuilt the channel mix around Instagram as the lead channel with heavier reels investment, TikTok as the second channel for demonstration content, and a Pinterest layer for the craft-adjacent audience. The creator roster ran 10 micro-influencers on Instagram plus 6 UGC-only creators feeding reels and TikTok content. Instagram Shopping tags installed on the full product catalog. The pin cadence held at 10 pins weekly across Idea Pins, Static Product Pins, and Video Pins. The organic-to-paid boost routine ran on any reel that beat a 4% save rate, and the paid team layered in a proper A/B testing cadence.
Across the year the account ran with our team, Boogie Board managed a $650K+ ad budget with positive ROI and drove cost per sale down to $31 on the annual curve. Higher-quality traffic, better landing page conversion, less wasted spend, and long-term customer engagement all followed. That’s the shape of an ecommerce social media marketing program that pays back the retainer without eating the brand’s positioning. See the full Boogie Board case study for the paid-side numbers.
Where ecommerce social media marketing fits the retention stack
Ecommerce social media marketing sits alongside email, SMS, paid search, and organic search inside the wider revenue stack. It’s not a standalone lever. Social produces first-touch discovery and last-touch closing revenue, feeds the retention channels with new subscribers, and gives the paid team creative library depth that the brand studio alone can’t produce. Brands that treat social as isolated from the rest of the marketing stack burn budget on posting activity that reads well and moves nothing.
Pick two lead channels based on product category. Split the budget between organic and paid based on brand stage. Build a creator roster that produces 20 to 40 monthly pieces of content. Install shopping features in priority order rather than everywhere at once. Measure against the six KPIs monthly, and refresh the channel mix quarterly based on the numbers. Run those five steps for 12 months on a stable retainer and social grows into a revenue line the founder can point at inside the board deck.
Redefine Web’s SEO and PPC retainers run at $999, $1,499, $2,499, and from $4,500 per month, so the social program plugs into a paid, organic, and retention stack that’s already sized to the brand’s stage. The ecommerce marketing retainer runs six months at the minimum, since a social program needs a full quarter to build the creator roster and another quarter to prove the revenue math. Faster than that and the numbers are noise. Slower than that and the content team loses momentum before the channel mix compounds. Outside reads on Sprout Social’s social media marketing strategy guide are useful for teams building the plan in-house.
For the platform-specific breakdown across Instagram, TikTok, Pinterest, and YouTube, our social media marketing for fashion brands playbook covers the cadence, shoppable setup, and paid overlay.