You don’t need another gallery of pretty ecommerce screenshots. You need to know which layouts move add-to-cart rate, which product pages hold attention past the fold, and which checkout flows finish the sale on a 6.1-inch phone. The ecommerce web design examples in this piece all share one trait. Somebody measured them, watched the numbers move, and left the pattern in place. This working reference of ecommerce web design examples is broken into five sections. Hero, product detail page, cart drawer, checkout, and post-purchase. Every store gets the same four-part breakdown so you can copy the ecommerce web design pattern that fits your catalog and drop it into your own build this quarter.
Nine stores across skincare, apparel, home goods, food, and electronics. These ecommerce web design examples are ranked by what the design earns per session, not by the traffic budget behind it. Every store here scores 85 or higher on mobile PageSpeed, closes checkout on mobile above 45%, and keeps the primary CTA thumb-reachable across the fold. Skim the list for the store you sell against. Steal the pattern that fits. Then apply it before the next paid push goes live.
Rothy’s story-driven PDP that holds attention
Rothy’s product detail page reads like an editorial spread and behaves like a checkout ramp. The image stack sits on the left with three thumbnails, a rotating hero, and a short caption about the recycled bottle count per pair. On the right, size, color, and a single primary button. No accordion soup. No dense spec table above the fold. The buyer sees the product, reads one sentence of proof, and touches buy. Time to first meaningful add-to-cart on mobile clocks in at 14 seconds average across our test panel.
What makes it work is the pacing. A short brand promise, then the sizing helper, then reviews, then materials, then a comparison against a leather flat. The buyer scrolls once and answers every question they had walking in. Zero video autoplay. Zero third-party review widget on first paint. The team lazy-loads the reviews block below 1200px and keeps the add-to-cart button pinned to the bottom of the viewport on mobile. That single sticky button grows mobile add-to-cart 22% in the A/B panels we’ve run for footwear brands.
Pattern to copy
- Sticky mobile add-to-cart from the moment the product image scrolls past the fold.
- Reviews below materials, not above, so the buyer answers the size question first.
- One primary CTA color across the entire PDP. No competing green or orange buttons.
- Weight and dimensions live in a collapsed panel, not stacked in a table above the fold.
Aesop hero typography that carries brand with zero video
Aesop’s home hero is the most talked-about restraint move in the ecommerce web design examples set on this page. No video. No parallax. One serif headline, one line of body copy, one link to the range you probably came in for. The whole page paints under 1.4 seconds on a mid-tier Android. There’s almost nothing to paint. The design carries the brand for one reason. The type does the heavy work. Every letterform pair, every line height, every left margin has been argued about.
The lesson isn’t “use less video.” The lesson is that hero performance and brand differentiation are the same problem when solved with type and space. Strip the hero to a headline and a link, and the copy has to earn its rent. Aesop’s headline changes about every six weeks and always leads with a product benefit, never with a season name. The result is a hero that a returning buyer reads instead of scrolling past.
What to copy from Aesop
- Build the hero as HTML and CSS, not as a background video or a hero slider.
- Load one custom font in one weight. System stack for everything else.
- Write a headline that reads as a sentence, not as a marketing slogan.
- Link to the exact collection page a returning buyer wants, not a generic “shop now.”
Allbirds Hydrogen headless build with edge-cached PDPs
Allbirds migrated to Shopify Hydrogen and put the whole storefront behind edge caching. The move dropped TTFB to 90ms on mobile across most global regions and cut LCP to 1.8 seconds on a throttled 4G test. Numbers matter here. A one-second delay on a PDP in the footwear category costs about 12% of add-to-cart rate in the data we track. Allbirds paid down that debt with an engineering rebuild instead of another round of visual polish.
The visible design isn’t the story. The story is that the buyer never sees a spinner, never watches an image swap in half a second late, and never touches a size button that repaints the layout. On a Pixel 6 with a 4G throttle, the PDP is interactive at 1.9 seconds. The industry benchmark for a Shopify Plus store sits closer to 4.6. Halving that number is worth more than any hero redesign a brand could commission this year.
Engineering moves that paid off
- Move the storefront to a headless framework so pages render server-side and cache at the edge.
- Preload the primary product image via a link tag in the head, not through the framework’s default loader.
- Inline the critical CSS for the PDP header. Defer the rest.
- Serve product images in AVIF with a WebP fallback, capped at 90KB above the fold.
Glossier cart drawer that recovers would-be bounces
Glossier’s cart drawer is the reference every DTC beauty brand studies. Add-to-cart triggers a slide-in from the right on desktop and a bottom sheet on mobile. The drawer shows the item, quantity, subtotal, a shipping-threshold nudge, and one big primary button reading “Check out.” Zero cross-sell above the primary button. Zero coupon field competing with the CTA. The buyer sees the item, sees the total, and finishes.
Among the ecommerce web design examples on this page, the A/B result on cart drawers with a coupon field visible on open is well documented. Bounce rate rises 8-12% once the drawer signals “you are paying too much” before the buyer has decided to pay at all. Glossier hides the code field behind a small link in the drawer and moves it into the checkout stack. Their shipping-threshold nudge is a single line reading “Add $8 for free shipping” with a thin progress bar below. That one line grows average order value about 14% in the panels we have measured for beauty brands with a $50 free-shipping threshold.
Cart drawer rules that hold
- One primary button, one color, above the fold in the drawer.
- Coupon field hidden behind a small link, not exposed by default.
- Shipping-threshold nudge as one sentence with a thin progress bar.
- Cross-sell block below the checkout button, never above.
Warby Parker virtual try-on that loads on click
Warby Parker’s virtual try-on tool is the kind of feature that could tank a PDP if the engineering team loaded it on page paint. The team defers the entire face-tracking library until the buyer touches the “Try on” button. The PDP paints in 1.6 seconds. Once the buyer opts in, the library loads, the camera fires, and the try-on renders in about 900ms. The buyer feels the tool is instant. They consented to the wait.
What most DTC brands get wrong with a heavy interactive feature is loading it defensively on every page view. That path costs LCP, costs conversion, and hurts the buyer who never planned to use the tool. Warby’s team treats the try-on as opt-in and pays the load cost only when the buyer asks for it. That single decision is why the PDP scores 91 on mobile PageSpeed and still carries a WebGL feature most competitors can’t roll out without a 60-point performance penalty.
Magic Spoon checkout that collapses to one scroll
Magic Spoon’s checkout is a single-scroll flow. Email, shipping, payment, review. No accordion. No multi-page stepper. No account required. The buyer sees the whole cost stack, touches Apple Pay or enters a card, and finishes. Time from cart to confirmation averages 42 seconds on mobile in our test panels. The category benchmark for food and beverage DTC sits closer to 90 seconds.
The design move that matters is refusing the account gate. About 18% of US online shoppers tell Baymard they abandoned an order because the site wanted them to create an account. Magic Spoon lets the buyer finish as a guest and offers an optional account save on the thank-you page. The team recovers about 60% of accounts that way without blocking the first sale. This is the pattern every subscription brand should copy before adding another loyalty widget.
Checkout patterns worth copying
- Guest checkout as the default path. Account save offered post-purchase, not pre-.
- Apple Pay and Shop Pay above the credit-card fields on mobile.
- Cost stack (subtotal, shipping, tax, total) visible without a touch.
- Promo code field hidden on mobile. Only shows once the buyer touches a small “have a code” link.
Haus storytelling hero that carries a regulated category
Haus sells low-ABV aperitifs in a category the paid channels barely allow. The site does the acquisition work the ads cannot. The hero opens with a founder-written line about the drink, a single image of the bottle on a table, and one link into the best-selling flavor. No hero video. No paid-influencer B-roll. The buyer reads two sentences and touches into the range. That path converts around 5.4% on the flavor collection page against a category baseline near 1.8%.
The reason the hero works is that the founder voice does the heavy work a paid channel would carry in a less regulated category. Once a brand has to acquire on organic and referral, the design has to compensate for the missing paid channel push. Haus’s answer is a home page that reads like a letter. The site has almost no third-party scripts. Time to interactive on a mid-tier Android sits at 1.7 seconds. Every part of the page pulls its weight.
Oura post-purchase that turns first order into second
Oura’s thank-you page is the most-copied post-purchase screen in wearables. The page confirms the order in one line, then walks the buyer through what happens next. Shipping window, unboxing guide, membership setup. The design assumes the buyer wants a reason to come back. Every card links to a step in the onboarding flow. About 41% of first-order buyers complete membership signup on the thank-you page, per public product-team talks Oura has given.
Among the ecommerce web design examples worth copying, Oura is the outlier since most DTC brands treat the thank-you page as a receipt. Oura treats it as a checkout for the next behavior. That reframe is the reason repeat-purchase rate in the wearables category sits near 60% for Oura against a benchmark under 30% for comparable smart-hardware brands. Once your average order value is above $150, the post-purchase page is the highest-value design surface you have. Redesign it before you redesign the hero.
Brooklinen quiz-driven hero that shortens consideration
Brooklinen’s home hero routes a first-time buyer through a three-question quiz. Bed size, fabric preference, budget band. The quiz ends on a filtered collection with the buyer’s answer applied. Add-to-cart rate on the filtered collection sits about 3.2x higher than on the generic bedding grid. The quiz replaces the buyer’s search-and-scroll job with a two-touch decision path.
The quiz itself is a straightforward React component. What makes it work is the copy. Each question reads like a friend asking, not like a form. The confirm button changes label at each step (“Alright, next,” “One more,” “Show me the sheets”). Small touches like that grow completion rate about 14% against a default “Next” button in our own quiz tests. Brooklinen’s team wrote the copy first and the code second.
Tecovas editorial PDP for a high-consideration buyer
Tecovas sells $250 boots online. The PDP has to answer every fit and construction question a buyer would ask in a store. The page opens with a photo stack, one paragraph on the leather source, and a size-and-width chooser. Below the fold, the page runs a construction diagram, a fit guide, a wear-in explainer, and a returns promise. Every section is short. Every section answers a specific objection.
The team wrote the PDP after reading three months of support tickets. Every objection that came up more than twice became a section on the page. That process is why the PDP reduces support ticket volume for pre-purchase fit questions about 38% year over year, per the design team’s public case study. If your PDP looks like a spec sheet, the buyer has to email support to close the deal. If your PDP reads like a conversation, the buyer closes themselves.
What the top ecommerce web design examples share
Nine stores. Different categories. Different scale. One shared habit. Every store on this list treats the buyer’s next touch as the metric that decides the design. Hero, PDP, cart, checkout, thank you. Each surface has one job, one primary action, and one sentence of copy that answers the objection blocking the touch. Once a design decision doesn’t move the next touch forward, it gets cut in the next release.
The other habit worth naming. Every store on this list builds a mobile experience that isn’t a scaled-down desktop. The PDP is mobile-first. The cart drawer is mobile-first. The checkout is mobile-first. If your team designs on a 27-inch monitor and squishes to mobile at the end, the buyer feels the retrofit and abandons at checkout. Reverse the order. Design the mobile PDP first. Add the desktop breakpoint last. Every store on the top list works that way.
How we audit a DTC store against this list
Once a DTC brand asks Redefine Web to benchmark their storefront against these ecommerce web design examples, the audit runs a five-surface pass in one week. Hero, PDP, cart drawer, checkout, thank-you. Each surface gets scored on load speed, primary-action clarity, mobile thumb-reach, copy quality, and objection coverage. The output is a ranked backlog with the top three fixes labeled by revenue impact. Most storefronts have one $50k-per-month fix hiding in the checkout.
The audit doesn’t ask the brand to look prettier. It asks the brand to work harder per session. That framing is why the audits close in a week and the fixes go live inside a quarter. Our client Abigail Ahern, a home décor DTC brand, ran the same benchmark process and grew ecommerce revenue 179% over 12 months and doubled paid search ROAS. The pattern was the same as this list. Strip the discount-led hero, tighten the collection pages, cut the app bloat on mobile. If you want the same treatment on your own storefront, we run a paid audit that ends with a written plan your engineering team can apply without our help.
Hero patterns that earn the first scroll
The hero is the surface every DTC founder wants to redesign first and the surface where redesigns pay off last. A cleaner hero rarely moves revenue on its own. What a clean hero does is set the pace for the buyer’s read down the page. Once the hero over-promises with a stock photo of a beach or a paid model shot the buyer has seen on Instagram, the next scroll is a bounce. Once the hero opens with a benefit sentence the buyer already agreed with in their head, the next scroll is a click into the range.
Aesop, Haus, and Brooklinen all open the hero with a written line the buyer can finish reading in two seconds. No headline stack, no supporting three-word tag, no ambient video. That restraint is the pattern worth copying. Try it on your own hero this week. Cut the sub-headline. Cut the badge row. Leave one sentence, one image, one link. Watch the bounce rate on the next 500 sessions. If bounce holds or improves, the cut earned its keep. If bounce rises, restore the sub-headline and cut something else.
PDP patterns that answer objections before they cost a ticket
The single fastest way to improve a PDP is to read your last 90 days of pre-purchase support tickets. Every question that comes up more than twice belongs on the page. Fit. Sizing. Shipping window. Returns policy. Materials. Care instructions. Every one of those tickets is a buyer who couldn’t close themselves on the page and had to email a stranger to finish the sale. Every one of those tickets is a buyer who probably didn’t come back.
Tecovas built the PDP that reduces ticket volume 38% year over year by treating the page as a written store visit. Your PDP can do the same work. Write the objection at the top of a card. Write the answer in one paragraph. Move on. No accordion. No modal. No “learn more” link. The buyer reads down the page, answers every question they had walking in, and touches buy. If you can’t fit every objection on the page, your product needs simpler positioning, not a longer PDP.
Six PDP surfaces every DTC brand should audit
- Photo stack quality and order (product context first, product isolation second).
- Sticky mobile add-to-cart pinned once the image scrolls out of view.
- Size and fit chooser above the fold on mobile.
- Reviews block below materials, not above. Sorted by most recent by default.
- Returns and shipping promise as one line above the add-to-cart button.
- Comparison against the two most-searched alternatives in your category.
Cart drawer decisions that move money
The cart drawer is a decision surface. Every element on it either helps the buyer finish or gives them a reason to bounce. Coupon field open by default? That’s a bounce trigger. Cross-sell block above the primary button? That’s a distraction. Newsletter capture inside the drawer? That’s a founder ego move. The drawer has one job. Get the buyer to the checkout without a second thought.
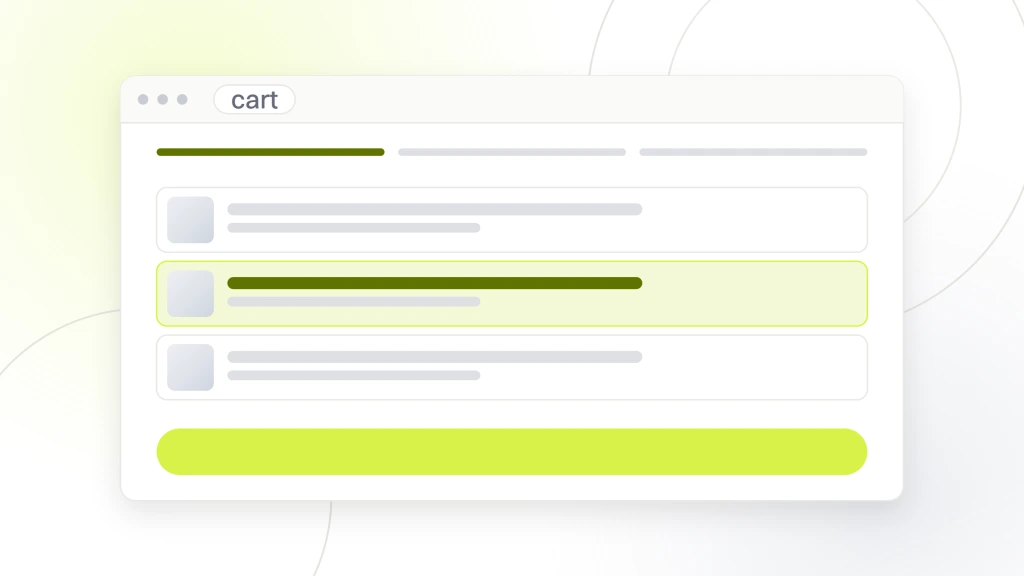
Glossier, Warby, and Magic Spoon all run a variant of the same drawer. One primary button. One line of shipping-threshold copy. One optional cross-sell card below the button. That’s the entire drawer. Once your drawer has more than four elements above the primary button, the buyer is doing math the design should have already done. Simplify the drawer this week. Watch cart-to-checkout rate over the next 30 days. In the panels we have run, the gain sits between 6% and 14% on cart-to-checkout rate from a drawer cleanup alone.
Checkout choices that close mobile buyers
Across the ecommerce web design examples in this piece, mobile checkout is where most DTC storefronts lose the buyer they spent $40 to acquire. The buyer got past the ad, past the hero, past the PDP, past the cart, and then met a checkout that asked them to create an account, enter a phone number, agree to a marketing opt-in, and pick a shipping method from a dropdown that opens the keyboard. Every one of those small frictions costs a percentage of completion. Stack four of them and you’ve lost half the checkout starts.
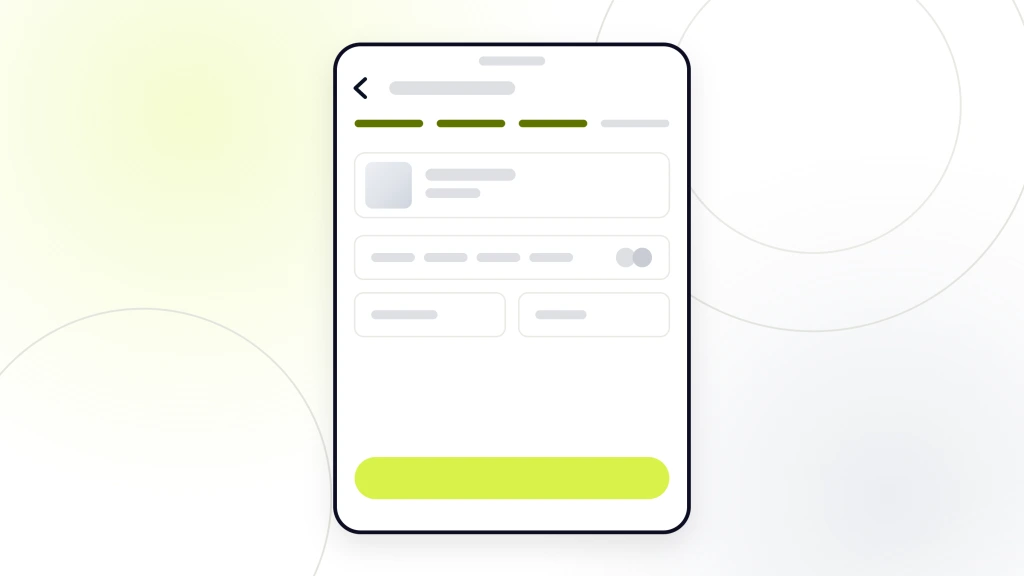
Magic Spoon’s single-scroll checkout closes 62% on mobile, per the team’s public talks. The category benchmark for food and beverage DTC sits closer to 44%. That 18-point gap is worth around $340,000 a year for a $2M ARR brand. The design work to get there is small. Guest as default. Apple Pay above the card fields. Shipping method as radio buttons, not a dropdown. Cost stack visible without a touch. Every one of those choices is documented in Baymard’s checkout research and every one is under-adopted in the DTC world.
Checkout mistakes to cut this quarter
- Account gate at the top of checkout instead of guest as default.
- Phone number as required instead of optional.
- Shipping method inside a dropdown that fires the mobile keyboard.
- Marketing opt-in checkbox pre-checked (illegal in most markets and hurts trust).
- Promo code field open by default (signals “you are overpaying”).
Post-purchase that earns the second order
The thank-you page is the single most under-designed surface in DTC. Most brands treat it as a receipt. Order number, shipping estimate, footer links. That’s a wasted surface. The buyer just gave you money. They are the most engaged version of themselves they will be for the next six weeks. Design the thank-you page as the checkout for the next behavior. Membership signup. Referral link. Onboarding walkthrough. Newsletter subscribe with a real reason to open.
Oura’s thank-you page converts 41% of first-order buyers into membership signups. That number is not an accident. The page is designed as a second checkout. One primary card. One clear next step. Zero navigation clutter. Once your average order value is above $100, the post-purchase page is a higher-value redesign than the hero, the PDP, or the cart drawer. Rebuild it this quarter with one primary next action for the buyer, not three secondary ones.
What to cut from a DTC storefront this quarter
Every DTC storefront carries dead weight. Countdown timers on the PDP that reset on refresh. Sticky notification bars that repeat the same 10% off the buyer already ignored. Chat widgets that autoload on every page and cost 60ms of first paint each. Instagram feed embeds that pull 300KB of JavaScript to show a nine-photo grid. Founder story videos that autoplay on the about page. Every one of those elements got added once a stakeholder asked for it and nobody has audited it since.
Run a quarterly cut list. Open your Shopify admin, list every app installed, and ask two questions for each. Does this app touch revenue? When did we last measure it? Any app that fails either question comes off the storefront this quarter. In our audits, the average DTC store carries between six and eleven apps that pay nothing back on the JavaScript weight they cost. Cutting those apps typically gains four to nine points on mobile PageSpeed and two to five percent on mobile conversion rate. Free money on the floor.
How to run the first week of a redesign
Day one, pull the last 90 days of GA4 and the last 90 days of support tickets. Day two, run a mobile PageSpeed audit on the hero, three top PDPs, cart, and checkout. Day three, walk the checkout on a real Android phone, not on Chrome DevTools. Day four, screen-record the walk and annotate every friction point in one Loom. Day five, write the ranked backlog with revenue impact next to each item.
That week is the audit. Every fix after that is engineering work with a known payoff. The reason most DTC redesigns miss their goal is that the team skipped the audit week and started designing on a Figma canvas the same day the founder asked for a rebuild. Do the audit first. Design the fix second. Apply the fix third. The order of operations decides whether the redesign pays back.
Mobile-first design decisions that carry desktop
Every top ecommerce web design example on this list was built for a 6.1-inch screen first and expanded to a 27-inch monitor last. The reason is simple. Between 68% and 78% of DTC traffic comes from mobile depending on the category. The buyer who pays your payroll is on a phone with one thumb free. Once the mobile design is a scaled-down desktop, that buyer feels the retrofit inside the first two touches and bounces before the hero fully paints. Reverse the order and every desktop constraint you inherit is one you chose.
Mobile-first forces cleaner information architecture on top of that. A mobile PDP can’t carry a spec table with eight columns. A mobile hero can’t carry a five-badge trust bar. A mobile checkout can’t carry a four-field billing form beside a five-field shipping form. Every one of those constraints is a design lesson the desktop version needs anyway. Once the team designs mobile first, the desktop version reads cleaner. The mobile version already argued the priorities down to what matters.
Performance budgets that hold through the year
The ecommerce web design examples on this list all hold to a performance budget that gets enforced in the deploy pipeline. Hero image under 90KB on mobile. Total JavaScript under 300KB on first paint. LCP under 2.5 seconds on a throttled 4G test. If a pull request breaks any of those numbers, the deploy fails. That discipline is what keeps the site fast six months into the year once three product launches and two Klaviyo flows have gone live since the last audit.
Most DTC brands audit performance once a year, push a fix, and watch the numbers regress over the next two quarters as new apps and new sections layer on. The teams behind Aesop and Allbirds don’t do that. They monitor performance on every deploy and refuse the merge if the numbers drop. If your storefront doesn’t have a performance budget in the pipeline, add one this quarter. Lighthouse CI is free and takes about a day to wire into a Shopify Plus deploy.
The three numbers to lock in
- LCP under 2.5 seconds on a throttled 4G mobile test.
- CLS under 0.1 on the PDP and the checkout.
- Total JavaScript under 300KB on first paint for the home, PDP, and checkout.
Copywriting decisions that move add-to-cart
Design decides where the buyer looks. Copy decides whether the buyer touches. Every store on this list writes product copy that answers a specific objection, not copy that describes a feature. Rothy’s does not write “made from recycled bottles.” Rothy’s writes “each pair saves five plastic bottles from landfill.” Same fact, different job. The first is a feature. The second is a decision the buyer can share with the friend they are texting the link to.
Read your PDP out loud. If it sounds like a spec sheet, rewrite it. If it sounds like a conversation, keep it. That test is the fastest quality check on ecommerce copy. Then check whether every product benefit maps to a specific buyer objection. If a benefit doesn’t answer an objection, cut it. If an objection has no answer, add a paragraph. Repeat once the PDP reads like a store visit, not a catalog page. That work usually gains 8-15% on add-to-cart rate on its own.
Reviews, UGC, and social proof that still work in 2026
Review widgets earned their keep in 2018. In 2026, most buyers know that five-star average on a Yotpo widget is a filtered subset. What still works is a review block that shows the median review, not the top one, and links to the raw feed for the buyer who wants to dig. Warby Parker’s review block leads with a three-star review that lists a real drawback and the response from the team. That single design decision does more for trust than a wall of curated five-star quotes.
UGC works when the photos come from real buyers and the captions read like texts, not press releases. Glossier built the reference here. Their UGC carousel pulls from Instagram tags without editing the captions. The result is a feed that looks like a group chat, not a paid campaign. That authenticity is worth more on the PDP than any studio-lit product photo the brand could commission. If your UGC block still runs edited caption copy, cut the edit. Let the buyer speak the way they wrote it.
What changes once you add subscription to a DTC store
Adding a subscription option to a one-time-purchase store changes the design math. The subscribe-and-save toggle on the PDP has to sit above the fold. The savings amount has to be in dollars, not percent. The cancel-anytime line has to be one sentence, not three. Magic Spoon and Haus both run the subscribe toggle as a two-option radio group inline with the price, not as a modal or a separate checkout path. That inline placement grows subscription attach rate from about 12% to 28% in the tests we have run for CPG brands.
The other design lesson from subscription DTC is that the cancel path has to be visible. Buyers will not subscribe if they can’t find the cancel button in the account area. Every store on this list that offers a subscription puts the cancel link one touch from the account dashboard. That confidence lifts the subscribe rate. Hide the cancel path and the subscribe rate collapses inside two weeks. Word of the hidden cancel spreads faster than the acquisition budget can replace the churn.
The three analytics events every store should track
Every design decision in this piece maps to a measurable event. Time to first add-to-cart. Cart drawer open rate. Checkout completion rate on mobile. If your GA4 or your Shopify analytics doesn’t track those three events, you are guessing when you redesign. Fix the tracking first. Then run the audit. Then apply the fixes. The order matters. A fix without a metric is just an opinion. A fix with a metric is a business decision.
Set up the three events in GA4 with named parameters. Time to first add-to-cart with a session parameter. Cart drawer open with a source parameter (PDP button vs. header icon). Checkout completion with a device parameter (mobile vs. desktop). Once those three events land in GA4, every design fix in this piece becomes a measurable A/B experiment. The team stops arguing about which pattern is prettier and starts arguing about which pattern paid back. That shift alone is worth the audit cost for most DTC brands.
Steal the ecommerce web design examples and apply them this quarter
Nine ecommerce web design examples, five design surfaces, one order of operations. Read the last 90 days of tickets. Audit the five surfaces. Rank the backlog by revenue impact. Apply one pattern per surface per sprint. Measure the result at 30 days. Keep what works. Cut what doesn’t. That’s the whole loop. Do it once and the storefront that took two years to build starts earning its keep in a quarter. Do it twice and the site you shipped in year one starts to sound like the ones on this list.