
Most DTC pet brands guess their target market from a Meta lookalike audience and a stock persona. A 33-year-old woman in Austin owns a golden retriever, spends premium, and subscribes to everything. That composite persona is real, but it hides 4 other cohorts that carry 62% of the reorder revenue in the category. A founder scoping paid social against a single millennial pet parent avatar burns through the first 9 months of creative pattern-matching Instagram, and never reaches the buyers who repeat-order every 30 to 60 days. This guide splits the pet products customer segments into the 5 cohorts our team scopes against on every mid-size DTC pet retainer.
The 5 pet products customer segments below are millennial pet parents, luxury pet owners, multi-pet households, subscription-loyal buyers, and gift buyers. Each carries its own spend pattern, reorder curve, channel behavior, and price-sensitivity floor. The pet products marketing hub covers the wider retainer picture. The segment work below is the strategic call every DTC pet founder makes before scoping a single dollar of paid spend.
Millennial pet parents inside the target market for pet products
Millennial pet parents carry the biggest single slice of the pet buyer stack, roughly 38% of category spend and about 35% of all U.S. pet owners per the APPA 2024 Pet Owner Survey. This is the cohort every founder pictures first, and it’s the one most brands over-index on to their own cost. Below is what actually moves this buyer at the register.
Who they are and how they buy
Millennial pet parents are 28 to 43 years old, household income $65,000 to $145,000, and skew urban plus first-ring suburb. They treat the pet as a family member and index heavily toward premium food, functional treats, and enrichment toys. Average annual spend runs $1,680 to $2,240 per pet. Discovery is 44% Meta plus TikTok, 22% Google search, 14% Amazon, and the rest split across word of mouth and creator content. Reorder windows sit at 28 to 42 days on food and 21 to 30 days on treats, and subscription attach rate lands at 48 to 58% when the onboarding flow is well built.
Where the cohort quietly grows
Nearly 70% of young adults now say they’re choosing pets before, or instead of, children, per recent Pew and industry reporting. That pushes lifetime value per household higher every year, and it shifts the offer stack toward long-horizon retention plays rather than one-shot promo pulls. Brands that treat this buyer like a fashion cohort burn creative fast. Brands that treat this buyer like a household head with recurring needs stack subscription revenue for 3 to 5 years off a single well-scoped launch.
Luxury buyers inside the pet products category
Luxury pet owners carry 14% of category spend but 32% of the accessory and apparel dollar pot. The cohort is smaller in headcount but 2.4x the average order value of the millennial parent segment, and that’s why fashion-forward pet brands anchor their catalog against this buyer rather than the broader mass market.
The luxury pet buyer profile
Luxury pet owners are 38 to 58 years old, household income $220,000+, and live in Manhattan, San Francisco, Los Angeles, Miami, Chicago, and Dallas. They own small breeds disproportionately (French bulldogs, cavaliers, doodles, Persians) and treat the pet as an extension of the household aesthetic. Average annual pet spend runs $3,800 to $6,200 per pet. Discovery is 62% Instagram-driven, 18% editorial (Vogue, Domino, T Magazine features), and 12% word-of-mouth inside affluent neighborhoods. Wild One, Fable, Foggy Dog, and Max-Bone built $30 to $120 million businesses inside 5 to 8 years by anchoring against this cohort.
What the cohort buys
The luxury pet buyer spends heavily on collar and leash sets (average $145), designer beds (average $280), organic treats (average $22 per bag), coordinated apparel (average $85), and travel gear (carriers, harnesses, dog strollers averaging $180). Reorder curves run long (90 to 240 days) since most items are durables rather than consumables. Retention plays run through gifting, seasonal collections, and collaboration drops rather than pure subscription flows. Web design and storefront cadence matter more here than in the mass-market cohort, so our pet business web design guide breaks down the merchandising layer that keeps this cohort returning between drops.
Multi-pet households as a buyer cohort
Multi-pet households carry 22% of pet products spend, roughly $29 billion of annual North American revenue. The cohort is under-served by most DTC brands since pack messaging, bulk pricing, and split-species catalogs demand more merchandising work than solo-pet buyers do. The brands that lean into this cohort win outsized lifetime value.
The multi-pet household profile
Multi-pet households run 2 to 4 pets, buyer age 34 to 54, household income $85,000 to $160,000, suburban skew across Texas, Ohio, North Carolina, Georgia, Pennsylvania, and Arizona. Average annual household pet spend runs $2,800 to $5,200 across all pets combined, versus $1,900 for single-pet households. Price sensitivity runs higher on food (a $92 monthly food bill for 3 dogs sets a hard ceiling) but premium sensitivity holds on treats, health, and enrichment. This cohort responds strongly to volume packaging, pack-size subscriptions, and household-level bundling that solo-pet brands rarely offer.
Buying triggers and retention plays
Multi-pet households discover brands 42% through Facebook groups (breed clubs, multi-dog communities), 24% through Google search, 18% through Amazon, and 12% through YouTube. Subscription attach rate runs 52 to 62% when the offer includes bulk sizing rather than solo-pet bags. Reorder window sits at 21 to 32 days on food and 34 to 48 days on treats since usage runs faster across multiple pets. Retention flows lean on refill nudges, low-stock reminders, and cross-species bundles (treats for both dogs and cats in one household) rather than pure discount cycles. Search visibility matters heavily since this cohort researches purchases 3 to 5x more than the millennial parent segment, and that’s where our pet industry SEO company writeup picks up the organic channel work.
Subscription-loyal pet products customer segments
Subscription-loyal buyers span every age and income bracket but share one mindset. They run 3+ active subscriptions across food, treats, supplements, toys, and grooming, with the pet grooming products market pulling the fastest refill cadence of the five. Their lifetime value runs 42% higher than one-off buyers on the same first order, and they are the retention anchor every DTC pet brand should scope against on day one.
Who subscribes and why
Subscription-loyal buyers are 26 to 62 years old, split evenly across income brackets, and share a preference for automated ops over manual reorder. They subscribe since the offer removes 3 recurring decisions from their week (do we need more food, is it time for the treat refill, when did we last reorder the joint supplement). Chewy Autoship, BarkBox, The Farmer’s Dog, and Nom Nom built their businesses on this cohort. Attach rate on subscription runs 62 to 78% on well-designed onboarding flows and drives 3 to 5x the annual revenue of a comparable one-off buyer. This cohort forgives higher price points if the ops work reliably. Stockouts and delivery misses hit this cohort harder than any other.
What kills subscription retention
Subscription churn spikes on 3 triggers. Stockouts on the primary SKU during the reorder window (churn probability jumps 34% inside 60 days of the missed shipment). Delivery misses of more than 4 business days (churn probability climbs 22% inside 45 days). And price increases without advance notice (churn probability jumps 41% when the buyer discovers the change at checkout instead of 30 days ahead via email). Brands that skip any of these ops-level fundamentals lose the subscription cohort even when the product itself is excellent. Retention math and reorder curve modeling live in our pet products market size and category growth analysis for the wider category-level view.
Segment comparison across the 5 cohorts
Segment comparison across the whole buyer stack is the deciding step before a founder writes their first channel plan. The table below is how our team frames every DTC pet retainer scope. It maps each cohort against the operating numbers that drive channel mix and creative direction.
| Cohort | Share of spend | Avg annual spend | Primary channel | Reorder window |
|---|---|---|---|---|
| Millennial pet parents | 38% | $1,680 to $2,240 | Meta plus TikTok | 28 to 42 days |
| Luxury pet owners | 14% | $3,800 to $6,200 | Instagram plus editorial | 90 to 240 days |
| Multi-pet households | 22% | $2,800 to $5,200 | Facebook groups plus Google | 21 to 32 days |
| Subscription-loyal buyers | 18% | $2,400 to $4,100 | Email plus retention flows | Locked to cadence |
| Gift buyers | 8% | $140 to $320 per gift | Google plus seasonal Meta | Q4 spike, low reorder |
The table above is the operating map. A founder in functional supplements should anchor against millennial parents plus subscription-loyal buyers and skip the luxury and gift cohorts entirely. A founder in apparel should anchor against luxury owners with a secondary line for gift buyers during Q4. A founder in food should anchor against millennial parents plus multi-pet households and build subscription attach into the first order. Brands that try to serve all 5 cohorts at once end up with a scattered catalog and a media mix that never gets past a 1.8x return on ad spend across the whole account. Our how to market pet products launch guide covers the founder-stage sequencing that stacks against each cohort in order.
Gift buyers and the Q4 spike
Gift buyers are the smallest slice of the pet buyer stack at 8% of category spend, but they distort the whole Q4 calendar for every DTC pet brand that ignores them. Roughly 63% of gift buyers don’t own the pet the gift is for. That single fact rewrites how the storefront, the packaging, and the checkout flow should be built for October through December.
Who buys pet gifts and what they spend
Gift buyers are 32 to 68 years old, income range wide, and cluster in the 6 weeks between Black Friday and Christmas plus a smaller bump around pet birthdays and adoption anniversaries. Average gift order sits between $140 and $320 with sharp spikes at $75, $150, and $250 tied to bundle pricing anchors. Discovery is 48% Google search (queries like “gift for dog lover” and “cat mom gift”), 24% seasonal Meta, and 16% referral from a friend who already owns the brand. Reorder rate in the same calendar year is under 12%, but next-year reorder for the same recipient sits near 40% if the follow-up email flow is tuned right.
What the storefront must do differently
Gift buyers need gift messaging, size-agnostic bundle options, and a checkout that hides the price from the recipient. Brands that force gift buyers through a standard pet-owner storefront lose 30 to 45% of Q4 conversions at the cart step. A dedicated “shop by gift” nav, a $75/$150/$250 bundle rack, and a gift receipt option grow Q4 conversion 22 to 34% on the same traffic. That’s an interface change, not an ad change, and it’s usually the highest-ROI Q4 project a founder can push live inside a month.
How to map cohorts against your DTC pet brand
Mapping cohorts against a real order table is a 4-week exercise our team runs at the front of every new DTC pet retainer. Founders who skip the work pay for it downstream since the segment picks decide everything (paid mix, creative rotation, subscription offer, retention flows, storefront merchandising).
Week one segment audit
Week one pulls the existing customer database, orders table, and subscription roll into a single view. Segment each buyer by first-order value, reorder count, product mix, city, income proxy (zip code median), and channel of acquisition. Most DTC pet brands find their customer base is 60 to 70% one cohort even when they thought they were serving all 5. That skew is the anchor cohort the brand should double down on rather than fight against. Picking the anchor cohort and merchandising against it hard beats trying to serve everybody.
Week two through four scoping
Week two builds cohort-specific creative rotations against the anchor. Week three writes email retention flows differentiated by cohort (welcome sequence, reorder nudge, cross-sell into adjacent SKUs, win-back at 90 days lapsed). Week four locks the storefront merchandising cadence to match the cohort’s discovery pattern (Instagram-heavy for luxury, TikTok-heavy for millennials, category filters and bulk sizing for multi-pet). Every downstream decision (paid budget allocation, subscription discount depth, price positioning, catalog breadth) flows from the cohort work in weeks one through four. Brands that skip this exercise burn 12 to 18 months of runway on unclear positioning.
Regional splits across North America
Regional splits across the 5 pet buyer cohorts shape which concentrations a founder should build against. The 5 cohorts distribute unevenly across North American geography, and a brand launching from Austin has a fundamentally different natural buyer base than one launching from Charlotte or Boise. Regional distribution should shape the geo-targeting layer of every paid campaign.
Urban millennial concentration zones
Millennial pet parents cluster heavily in Austin, Denver, Nashville, Portland, Seattle, Brooklyn, Los Angeles, Atlanta, and Miami. These 9 metros carry 42% of the millennial pet parent cohort even though they hold 18% of the North American population. Meta plus TikTok paid social geo-targeted against these metros consistently outperforms broad national targeting by 2.4 to 3.1x on return on ad spend. Founders launching a millennial-anchored brand should overweight these metros for the first 6 months of paid spend and expand geographically only after the anchor metros hit a stable customer acquisition cost.
Multi-pet suburban belt
Multi-pet households cluster in suburban Texas, Ohio, North Carolina, Georgia, Pennsylvania, and Arizona. The suburban belt across these states carries 38% of the multi-pet cohort. Facebook groups (breed clubs, rescue networks, multi-dog communities) are the primary discovery channel here rather than Instagram or TikTok. Founders anchored on the multi-pet cohort should run Facebook plus Google search geo-targeted against these states first and treat Instagram plus TikTok as secondary channels. Luxury pet owners concentrate sharply in Manhattan, San Francisco, Beverly Hills, Aspen, Miami, Chicago’s North Shore, and Dallas’s Highland Park. Fewer than 12 zip codes carry 34% of the luxury cohort’s discretionary pet spend.
Retainer scope against the target market for pet products
Our retainer scope against the target market for pet products holds a 6-month contract minimum and 4 published tiers. Tiers scale with catalog size, cohort breadth, ad spend, and channel count. The cohort work above dictates the channel mix inside each tier, and that’s what stops founders paying for scope they don’t need yet.
SEO or PPC retainer tiers
Our SEO and PPC retainers hold at $999, $1,499, $2,499, and from $4,500 per month. The $999 tier fits a founder anchoring against one cohort (usually millennial parents or subscription-loyal buyers) with monthly ad spend under $12,000. The $1,499 tier fits a 2-cohort brand running Meta plus Google plus email. The $2,499 tier holds 3 cohorts across Meta, TikTok, Google, Amazon, and email. From $4,500 covers full 5-cohort scale brands with weekly creative sprints and a dedicated account lead. Ad spend is billed separately in every tier.
How founders pick a tier honestly
Founders in the luxury cohort rarely fit the $999 tier since Instagram creative production and editorial outreach push scope past what the entry retainer can hold cleanly. Founders in the multi-pet cohort usually add a Google search layer that $1,499 can absorb but stretches the hour budget below that. Every tier commits to a 6-month contract since 2 full reorder cycles prove the operating pattern against real cohort economics. The pet products marketing retainer page carries the full tier breakdown for founders scoping the engagement.
Proof from real pet-brand cohort work
Cohort work only matters if it moves numbers. Two pet-industry case studies show what happens when the segment call is right, and what changes at the media layer once the anchor cohort is locked.
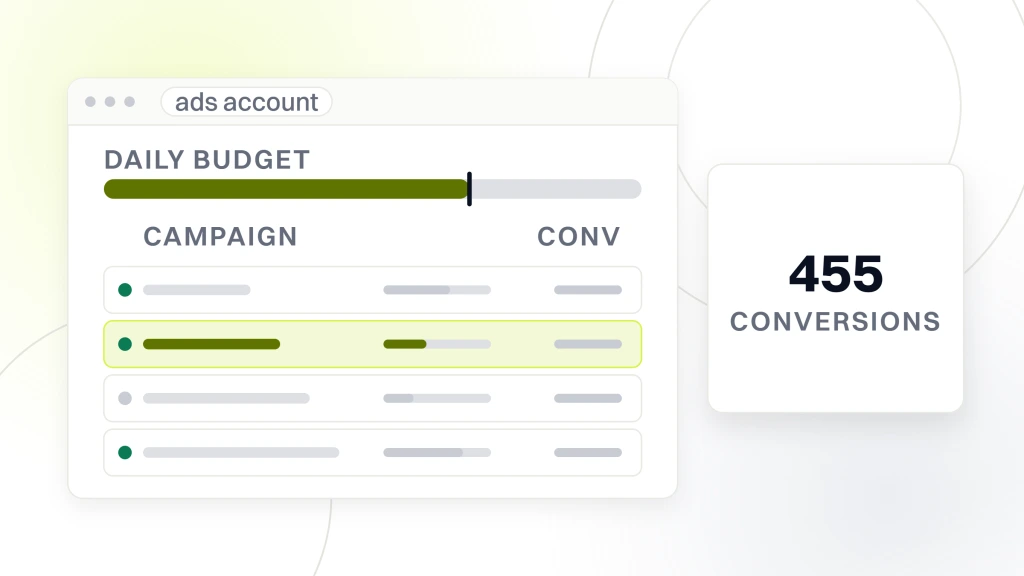
Pet Insurance Australia had a complex product in a crowded ad market and weak conversion paths. Once we locked the buyer intent, built keyword-focused Google Ads with custom landing pages, and layered remarketing against undecided visitors, the account produced 455 conversions in 5 months at an 8.87% CTR (versus the 1-3% industry benchmark), a 31.06% conversion rate, and 1132% ROI. That’s what a single-cohort media plan looks like when the buyer definition is honest instead of aspirational.
Pet Shop · Puppies + Grooming · Singapore sat on Weebly for 8 years running its own SEO, then a Google Core Update wiped a chunk of the rankings overnight. Instead of a risky platform migration, we ran a scientific on-page + off-page recovery against the existing customer cohort. Traffic grew from 480 to 2,400 monthly visitors in 4 months (a clean 5x), the main commercial keyword climbed from page 3 to mid-page 1, and the whole recovery ran inside a $500/month engagement. Cohort clarity is what keeps a small budget productive.
Where cohort work fits the growth stack
Cohort segmentation sits at the top of the DTC pet brand growth stack. Every SKU decision, every channel plan, every retainer scope either compounds through honest cohort work or fights against a vague avatar that never translates into real reorder revenue. Brands that skip the segment work end up burning paid budget against every cohort a little and none of them enough.
The cohort frame above (5 buyer segments, spend share, channel mix, reorder curves, regional distribution) is how our team scopes every DTC pet engagement before writing a media plan. Founders who run this segmentation honestly at launch save 6 to 12 months of misdirected spend against cohorts their brand can never own. The Content Marketing Institute audience personas guide pairs the segmentation view with content strategy, and MarketingProfs consumer behavior coverage tracks the underlying buying-pattern shifts across pet cohorts.
Affiliate and creator programs sit alongside paid and organic as a channel that pays back inside the same cohort-specific reorder curves the target market work identifies. Our affiliate marketing pet products deep-dive covers the partner and creator side that pairs with cohort mapping. Segmenting the market is the first strategic decision. Everything else (channel mix, retainer scope, category focus, reorder curve modeling) follows from an honest view of which cohorts a DTC pet brand can own inside 3 to 5 years of consistent execution.