
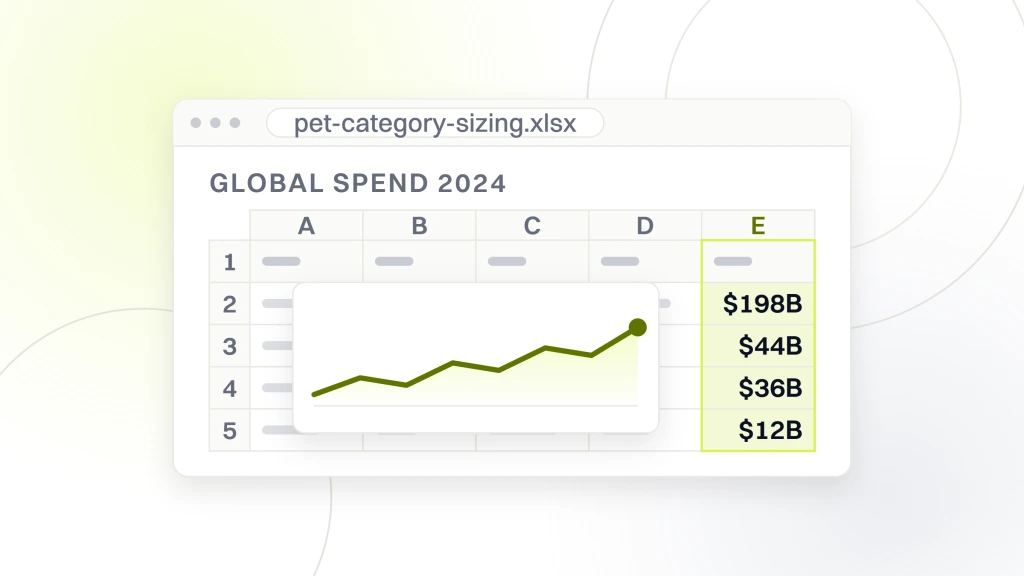
The pet products market crossed $320 billion in 2024 global spend, and that number looks like a green light on any category a founder wants to launch. It isn’t. Under the top line sits a lopsided mix. Food owns 62 percent of the pot, treats and supplements pull the fastest growth, toys and apparel run flat, and pet tech is a $12 billion sliver most brands misprice. Founders without an honest pet products market size read waste the first 12 months chasing category trends that never fit the mid-market opening a brand can actually own.
This guide sizes each category the way our team sizes it for DTC pet clients before scoping a retainer. Food. Treats. Supplements. Toys and enrichment. Apparel and accessories. Pet tech. Each carries its own growth rate, DTC versus big-box split, margin structure, and reorder curve. Retainer pricing on our pet products marketing retainer starts at $1,499 per month on 6-month contracts.
Food inside the pet products market
Food is the anchor category inside the pet products market at $198 billion global and 4.2 percent annual growth. The category rewards scale and punishes small brands fighting Purina, Mars Petcare, Nestle, and Hill’s on shelf price. A founder launching a new food SKU without a differentiated positioning story burns 18 to 24 months of runway before the category tells them no.
Where fresh and raw open a door
Fresh food, human-grade cooked meals, and raw diets grow 14 to 22 percent annual against the flat kibble base. The Ollie, Farmer’s Dog, and Nom Nom cohort proved a mid-market DTC founder can carve a $200 to $600 million business out of the fresh subcategory in 5 to 7 years. The moat isn’t the recipe. The moat is the subscription flywheel plus the cold-chain fulfillment operation. Founders picking food as the entry category should size the fresh subcategory rather than the whole food pot, so a mid-size brand can compete against the incumbents on a lane it can defend.
Prescription and life-stage food segments
Prescription diets sold through veterinary channels grow 6.8 percent annual and carry higher margin than shelf kibble. The vet directs the buyer, so price shopping drops away. Life-stage food (puppy, senior, breed-specific) grows 5.4 percent and rewards founders who can build a data-informed formulation story. Both segments demand veterinary channel relationships that take 18 to 36 months to build. Founders without a founding veterinary partner rarely crack these subcategories. Most DTC food launches skip them and go straight at the fresh direct-to-owner segment.
Treats and supplements inside the pet products market
Treats and functional supplements together carry $44 billion of global spend at a blended 9.7 percent growth rate. They’re the two categories most DTC pet founders should look at first. The margin structure, reorder window, and subscription fit all work in favor of a mid-size brand rather than an incumbent.
Functional treats as the wedge
Functional treats (dental, calming, joint, skin and coat, digestive) grow 12.4 percent annual against the flat plain-biscuit base. Bocce’s Bakery, Barkbox Treats, and Full Moon proved the functional treat wedge can build a $50 to $180 million business inside 5 years on a single-species focus. Margins run 44 to 58 percent gross versus 22 to 34 percent on food, which pays back paid social acquisition inside 6 to 9 months rather than 18 to 24. Founders picking treats as the entry category should pick one functional benefit rather than chasing every dog and cat use case. Retainer scope for a treats-focused DTC brand mirrors the paid social plus subscription flow work covered in our PPC agency for pet brands playbook.
Supplements as the highest-margin category
Supplements grow 11.4 percent annual at 52 to 68 percent gross margin. The reorder curve runs 30 to 60 days, the sweetest reorder window in the entire pet products market for building subscription revenue. Native Pet, Zesty Paws, and Finn built $60 to $220 million businesses inside 4 to 6 years on the supplement wedge. The regulatory picture is trickier than treats. The FDA has strong views on veterinary claims. Founders in supplements need real formulation science, real vet advisors, and honest label copy. The category rewards depth over breadth, and a brand with 8 to 14 SKUs across 4 clear health platforms beats a brand with 40 SKUs scattered across every use case a dog owner might search.
Only pick pet food as the entry category if you own the fresh or prescription lane. Every other food SKU loses 18 to 24 months of runway to Purina and Mars.
Toys, apparel, and accessories inside the pet products market
Toys, apparel, and accessories together carry $36 billion at a blended 3.1 percent growth rate. Big-box retail and generic import brands own both categories, which makes DTC breakout harder than in treats or supplements. Founders picking these as entry categories need a specific angle rather than a generic quality-first pitch.
Chew toys and enrichment as the DTC opening
Durable chew toys and enrichment puzzles grow 6 to 9 percent annual against the flat plush and squeaky base. West Paw, Outward Hound, and Kong built durable brands on the chew category over 15 to 30 years. The DTC opening for a new founder sits in enrichment puzzles for high-energy breeds (border collies, huskies, working dogs) or in dental chew designs backed by veterinary claims. The plush toy segment is a race to the bottom on Amazon that no DTC founder should enter unless the plush is tied to a subscription box the brand already runs.
Apparel and accessories as seasonal cash flow
Apparel and accessories run heavily seasonal (60 to 70 percent of revenue lands in Q4) and reward brands with a strong Instagram visual identity. Wild One, Foggy Dog, and Fable made accessories and apparel work by treating the category as a fashion play rather than a functional play. Margins run 42 to 56 percent, which supports a Meta plus Instagram creative-heavy retainer. Founders looking at apparel should model 4 to 5 months of low revenue against Q4 gains rather than expecting flat monthly performance. Storefront design and merchandising cadence carry the category, and our pet business web design guide covers the pattern for subscription and merchandising-heavy pet brands.
Pet tech emerging in the pet products market
Pet tech is the fastest-growing category in the pet products market at 18.6 percent annual and $12 billion global 2024 spend. The category covers GPS trackers, smart cameras, connected feeders, activity monitors, and health-data wearables. The growth is real, but the reorder window (18 to 36 months on hardware) forces founders into a hardware plus consumables or subscription model.
Hardware plus subscription as the model
Fi, Whistle, Furbo, and PetSafe built pet tech businesses on the hardware plus subscription model. Sell a $199 to $299 device, then attach a $9 to $19 monthly subscription for GPS coverage, health reporting, or cloud video storage. Attach rate on the subscription runs 62 to 78 percent on well-designed onboarding flows and drives 3 to 5x the lifetime value versus hardware-only. Founders entering pet tech without a subscription attach plan burn $8 to $18 million of runway on the hardware build before the reorder math bites. Sizing the target market for pet products by cohort is the strategic decision every DTC pet founder should make before scoping paid channels.
The health data play inside pet tech
Health data wearables (activity, sleep quality, temperature, HRV) are the sub-segment inside pet tech growing 24 to 32 percent annual. The category is early enough that no clear leader has locked in the dog owner. Whistle, Fi, and Sure Petcare are the closest to platforms, but the health data layer sits mostly unused compared to human wearables. A founder entering pet tech health today faces a 5 to 8 year build before the platform effects kick in. Most solo DTC founders lack that patience runway, so the segment usually needs venture backing rather than a bootstrap.
If a pet tech founder can’t hit 60 percent subscription attach on hardware, the unit economics won’t survive month 18. Fix the attach flow before scaling paid.
DTC versus retail inside the pet products market
DTC versus retail split inside the pet products market shifts fast by category. Big-box retail (PetSmart, Petco, Chewy, Amazon) still owns 74 percent of the total pot in 2024, but the share is bleeding 1.6 to 2.4 percentage points per year to DTC brands in the treat, supplement, and pet tech categories.
Category-by-category channel split
- Food. 82 percent retail (big-box plus grocery), 18 percent DTC. Fresh food is 68 percent DTC inside the food subcategory.
- Treats and supplements. 58 percent retail, 42 percent DTC and climbing 3.4 percent per year toward DTC.
- Toys and enrichment. 78 percent retail, 22 percent DTC. Big-box owns the plush toy race.
- Apparel and accessories. 62 percent retail, 38 percent DTC. Instagram-driven fashion brands take share year over year.
- Pet tech. 34 percent retail, 66 percent DTC. Amazon plus brand direct are the primary channels.
- Grooming. 74 percent retail, 26 percent DTC, with DTC share rising fastest inside the premium pet grooming products market. Salon-adjacent brands take DTC share slowly.
- Vet retail. 88 percent retail (veterinary offices plus big-box), 12 percent DTC. Regulatory friction caps DTC growth.
The category split is what dictates channel choice on the retainer side. A founder in supplements should size Amazon plus DTC email at 70 percent of the mix. A founder in food should decide upfront whether to fight for retail placement (a 24 to 36 month build) or run pure DTC with a heavy subscription plus fresh-food play. Search visibility across both channels matters, and our pet industry SEO company walk-through covers the organic side of the DTC funnel in more depth.
Global regions inside the pet products market size picture
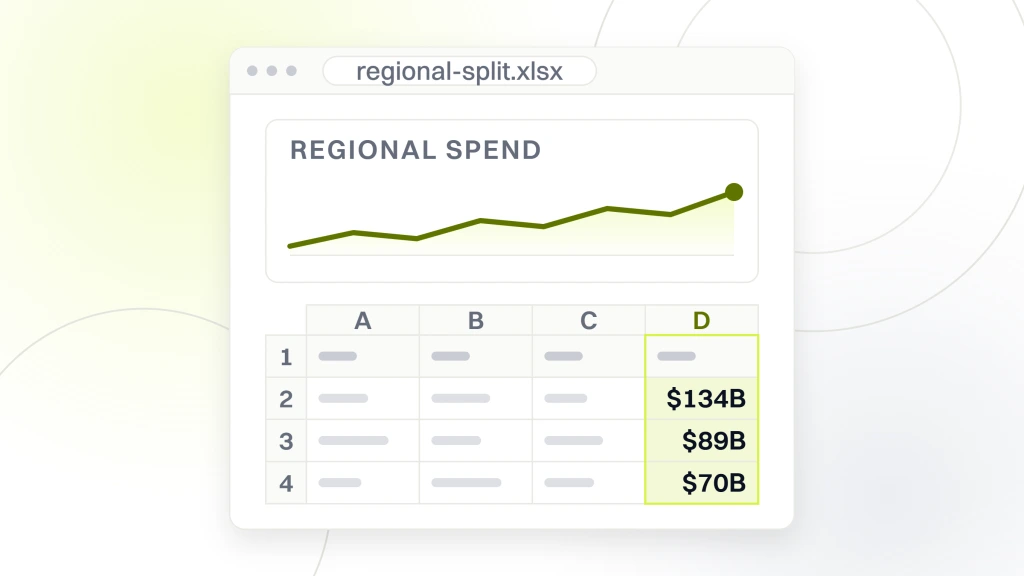
The global pet products market splits unevenly across geography. North America owns 42 percent of the $320 billion pot at $134 billion, Europe carries 28 percent at $89 billion, Asia Pacific runs 22 percent at $70 billion and grows fastest at 8.4 percent annual, and Latin America plus Middle East and Africa split the last 8 percent.
North America and Europe as the deep pockets
North American spend per pet runs $1,480 annual on dogs and $920 on cats, the highest in the world. Europe averages $780 per dog and $560 per cat. Both regions are mature markets where category growth comes from premiumization (fresh food, functional treats, supplements) rather than new pet ownership. A founder scoping into North America or Western Europe is competing on story, brand, and reorder economics rather than category creation. Growth by acquiring new pet owners has slowed to 1.4 percent annual in both regions and now sits below the birth rate of the actual pet population.
Asia Pacific and Latin America growth pockets
Asia Pacific grows 8.4 percent annual on the back of urbanization, rising middle-class spend, and dog and cat ownership expanding fastest in China, Vietnam, Thailand, and Indonesia. Latin America grows 6.2 percent annual with Brazil and Mexico as the anchor markets. Both regions favor local brands or partnerships over pure Western DTC exports. Pet buying habits, retail structure, and payment platforms differ sharply. Founders scoping global should treat Asia Pacific as a 3 to 5 year build with a local partner rather than a direct DTC launch, which almost always underperforms against local retail structure and payment platform differences. Founders sizing the wider frame that ties pet market analysis into the broader DTC growth stack should read our ecommerce marketing hub for the retainer picture across categories.
Where the openings show up inside the pet products market
Openings inside the pet products market aren’t evenly distributed. The category-level growth numbers hide a lopsided reality where the actual DTC breakout opportunities sit in three narrow slices. Founders scoping into pet should size these openings honestly before writing a single line of paid social spend against a category that looks big on paper.
The three real openings for 2026
Functional supplements for aging dogs and cats. Fresh food subscription for owners of small breeds and mixed households. Pet tech health data wearables tied to a subscription attach at 62 percent or higher. Every other subcategory either grows slowly, sits captured by an incumbent, or lacks the reorder economics a $1,499 monthly retainer can pay back inside a 6-month term. Founders picking outside those three slices should have a specific insider angle (veterinary channel access, a proven formulation, a manufacturing edge) rather than a generic quality-first pitch.
Where big-box retail still wins
Big-box retail still wins on plush toys, generic apparel, standard dry kibble, and low-price grooming SKUs where the buyer is optimizing on price rather than story. Founders trying to build DTC brands on any of those subcategories fight uphill against Chewy’s operational scale and Petco’s shelf space. The honest recommendation is to skip those subcategories entirely rather than build a slightly better version of what Amazon already sells cheaper. Sizing the openings honestly saves 12 to 24 months of misdirected runway on categories the pet market has already resolved in favor of scale players.
Three real DTC openings sit inside pet in 2026. Aging-pet supplements, fresh food subscription, and pet tech with a 60 percent-plus attach. Every other slice fights scale.
Pet Insurance Australia and the adjacent pet products market view
Pet Insurance Australia came to our team with a market-adjacent business (insurance rather than physical product) but the buyer overlap with pet product buyers is almost total. Anyone insuring a dog or cat has already spent $340 to $1,200 on food, treats, supplements, and vet care in the previous 12 months. The founder needed a Google Ads program that could reach that same buyer at the moment they were sizing lifetime pet costs against annual insurance premiums.
Our team scoped a keyword-focused Google Ads account rebuilt around policy-purchase intent rather than generic pet-owner queries. Week one restructured the ad groups into 14 tightly-themed clusters tied to search intent. Week two pushed 8 landing pages live against the top query themes, each pointed at one conversion action rather than a scattered form. Week three set the remarketing loop against the 90-day comparison-shopping window a pet insurance buyer runs before signing. Week four ran the first weekly reporting call with the founder to lock the operating baseline the retainer would hold against.
Over 5 months, the Pet Insurance Australia account closed 455 qualified conversions at a 31.06 percent conversion rate against a 2 to 5 percent industry benchmark. Click-through rate landed at 8.87 percent versus the 1 to 3 percent baseline. Return on investment settled at 1,132 percent, meaning every dollar the founder put in returned $11 back. Those numbers held for one reason. The account structure, landing pages, and remarketing loop worked as one funnel. Pet product founders sizing paid search should model the same integrated structure rather than treating Google Ads as a standalone channel.
Retainer pricing and how brands act on this pet products market view
Retainer pricing at Redefine Web starts at $1,499 per month on a 6-month contract. Growth tier lands at $2,499 per month, Scale at $3,999 per month, and enterprise scope starts at $6,000 per month. Tiers scale against catalog size, monthly ad spend, and channel count. The market sizing above dictates the channel mix inside each tier, and that’s why we run the sizing math before writing a media plan.
Foundation tier at $1,499 monthly
The $1,499 Foundation tier fits a solo or small DTC pet brand under $200,000 in annual revenue running one or two categories (usually treats or supplements) with monthly ad spend under $12,000. Scope includes Meta plus Amazon setup, basic email flow buildout, weekly reporting, and monthly strategy calls. Founders in the fresh food subcategory rarely fit the Foundation tier. Cold-chain fulfillment and subscription tooling push scope past what the entry retainer can hold cleanly. Founders in pet tech usually skip the Foundation tier entirely and start at growth. Hardware attach needs a heavier setup than the entry retainer supports.
Growth, Scale, and enterprise tiers for larger brands
Growth tier at $2,499 monthly covers brands at $200,000 to $2 million annual revenue with all six pillars active and monthly ad spend between $12,000 and $60,000. Scale tier at $3,999 monthly covers brands past $2 million with weekly creative sprints and a dedicated account lead. Enterprise scope starts at $6,000 monthly and runs multi-brand houses and category leaders with 40-plus SKUs and $150,000-plus monthly ad spend. Every tier runs on a 6-month contract. Two full reorder cycles are the minimum needed to prove the operating pattern against real reorder economics. Website maintenance and hosting sit alongside the marketing retainer for brands running heavier subscription platforms, and our pet products website maintenance guide covers the ops layer that supports the retainer scope on a subscription-heavy pet brand.
Where pet market analysis fits the growth stack
Pet products market analysis sits at the top of the DTC pet brand growth stack. Every SKU decision, every channel plan, every retainer scope either compounds through an honest sizing of the market or fights against a bloated view of category size that never translates into real reachable buyers. Brands that skip the sizing work end up chasing $320 billion TAM slides through a media plan that never pays back a single retainer month.
The sizing frame above (six categories, growth rates, margin structure, reorder windows, DTC versus retail split, regional distribution) is how our team frames every mid-size pet brand engagement before scoping the retainer. Founders who run this sizing exercise honestly at the start of their launch usually save 6 to 12 months of misdirected spend against categories their brand can never own. The Content Marketing Institute strategy guide covers the wider content strategy pattern that pairs with the category sizing frame, and MarketingProfs consumer behavior coverage tracks the underlying pet-owner buying pattern shifts across categories.
Affiliate and creator programs sit alongside the paid and organic layers as a channel that pays back inside the same reorder curve the sizing analysis identifies. Our affiliate marketing pet products deep-dive covers the partner and creator side that pairs with the market-sizing frame above. Sizing the market is the first strategic decision. Everything else (channel mix, retainer scope, category focus, reorder curve modeling) follows from an honest view of which slice of the pet category a brand can own inside 3 to 5 years of consistent execution.