
You want dental dso examples with real numbers, not sanitized pitch-deck stories. This guide walks through 5 practice profiles, the shape of each deal at close, what changed inside the first year, what changed by year three, and how the second bite tracked against the original projection. Names are anonymized where private. Numbers are not. Every profile is a composite of practices our team has watched go through affiliation between 2022 and 2025.
Every profile on this list teaches a different lesson. The GP profile shows the standard deal shape. The specialty profiles show why multiples run higher in ortho and oral surgery. The multi-location group shows the platform premium a buyer pays for scale. The regretted deal shows what happens when the MSA gets skimmed. The platform sale shows what value the DSO structure delivers when the ops team executes well. Read all 5 profiles before you take your first buyer call, then use them as benchmarks rather than templates.
What are dso dental deals in one sentence
A dso dental deal is the sale of a dental practice (or platform) to a dental service organization, structured as cash at close plus rollover equity into the parent platform, with a multi-year employment agreement and a management services agreement (MSA) attached. The DSO owns non-clinical operations. The dentist keeps clinical control. The 5 profiles below show what that structure looks like in real dollars at 5 practice sizes, from a solo GP to a 50-office platform.
Profile one, single-doctor GP at $2.4M collections
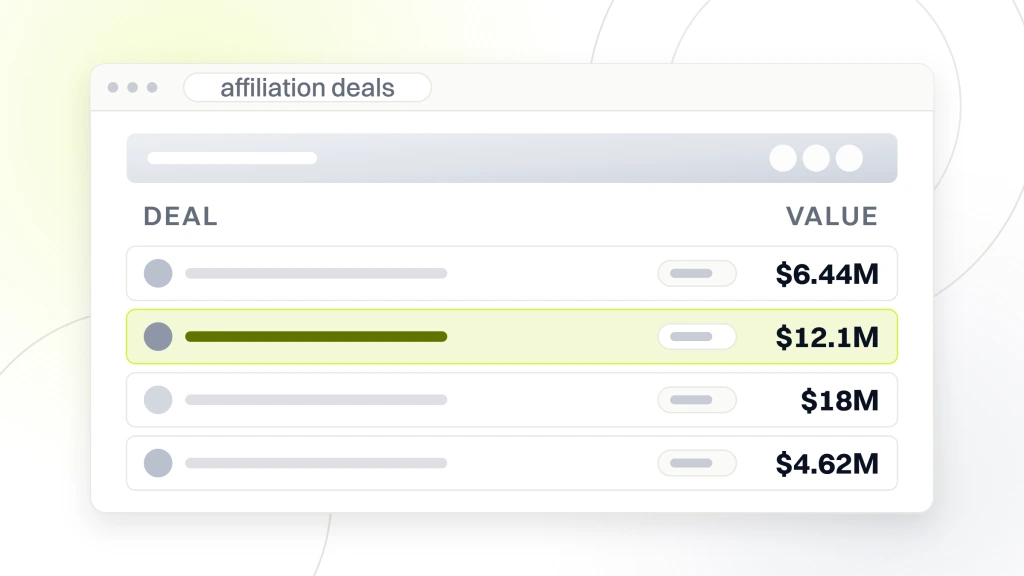
The first profile is a single-doctor general practice in a suburban Ohio metro. Collections at $2.4M, overhead at 61 percent, doctor comp at 30 percent of collections. EBITDA on paper was $748K. After add-backs (owner comp normalization, one-time equipment, family payroll), adjusted EBITDA landed at $920K. The practice sold to a top-10 platform DSO at 7x adjusted EBITDA, so $6.44M in total consideration.
Deal structure at close
Structure was $5.15M cash at close and $1.29M in rollover equity, or 20 percent of total consideration. The employment agreement ran 6 years with a 12-mile non-compete. Base pay was 25 percent of collections with a production bonus at 35 percent above a threshold. The seller expected roughly $650K in W2 income annually, down from the $920K pre-sale but with a capital event locked in and the second bite still ahead.
Year one, what actually changed
The first 30 days felt quiet. The team barely noticed. Day 45, the PMS conversion started, and the front-office manager quit 6 weeks later, blaming the new software. That’s the single most common story we hear across every deal. Payer contracts renegotiated by day 90 delivered a 2.4 percent fee schedule increase on the platform’s PPO contracts, less than the 5 percent pitched. Marketing shifted to central by day 90 and cost per new patient went up 8 percent during the transition before falling below baseline by month nine.
Year three, the operational reality
By year three, collections had grown to $2.8M on stronger central marketing and better payer contracts. Operational rhythm normalized. The seller reported spending about 4 hours a week on operational meetings, calls, and central marketing reviews. Clinical schedule ran 4 days per week, down from 5, a concession negotiated in the employment agreement. The second bite was still 2 years away at that point. The seller said he’d sign the same deal again with two changes to the MSA around fee floors.
Profile two, orthodontic practice at $3.1M
The second profile is an orthodontic practice with 2 clinical days and one satellite office in Texas. Collections at $3.1M, overhead at 52 percent, doctor comp at 26 percent. Adjusted EBITDA after add-backs was $1.15M. The practice sold to a specialty orthodontic DSO at 10.5x adjusted EBITDA. Total consideration $12.1M. Structure was $9M cash and $3.1M rollover, 26 percent of consideration.
Why the ortho multiple ran higher than GP
Ortho carries higher case values, higher patient lifetime value, and cleaner insurance economics than GP. Case revenue on full-arch treatment averages $5,500 to $7,500 versus $600 to $1,200 on a typical GP visit. Longer treatment cycles create predictable monthly recurring revenue. That combination supports higher multiples, and the specialty platforms have deeper capital to bid up. Similar numbers apply in oral surgery, where multiples reach 10 to 14 times EBITDA at scale.
Year one, what changed in the ortho practice
The specialty platform ran a lighter operational touch than a general practice DSO would. The local brand stayed. The clinical protocol did not change. What did change was marketing, which shifted entirely to central by day 60. Case starts grew 12 percent in year one on stronger digital patient acquisition. The seller reported the transition as easier than expected. Aligner mix grew from 22 percent to 34 percent of case starts on central marketing focus.
Profile three, pediatric group at $8.4M collections
The third profile is a 4-office pediatric group in the Southeast. Collections at $8.4M across the network, overhead at 55 percent, associate doctor comp at 28 percent. Adjusted EBITDA after add-backs landed at $2.0M. The group sold to a specialty pediatric platform at 9x adjusted EBITDA. Total consideration $18M. Structure was $14.4M cash and $3.6M rollover, 20 percent of consideration. The founder ran the flagship office and stayed on as clinical lead across the network.
Integration inside a pediatric platform
Pediatric integration ran cleaner than the GP case. The clinical model and referral rhythm carried over unchanged. Central marketing rolled out by day 90 with pediatric-specific creative built around parent decision-makers. New patient volume grew 18 percent in year one and 27 percent by year three. Associate recruiting improved on platform benefits. Turnover across the 4 offices dropped from 22 percent to 9 percent by month 18, a swing worth about $180K in avoided hiring and ramp costs.
Profile four, the regretted GP deal
The fourth profile is the one every seller should read twice. A single-office GP practice in a smaller metro sold at 6x adjusted EBITDA of $770K, so $4.62M total consideration. Structure was $3.7M cash and $920K rollover, 20 percent. On paper it looked like the Ohio deal above. In practice the MSA carried a fee floor that let the sponsor raise management fees 2 percent every 24 months without cap.
What broke inside the first 18 months
Central marketing never landed. Cost per new patient climbed 22 percent by month 8 and stayed high through month 18. The seller lost 2 of 3 hygienists to a competitor and could not fill the schedule. Doctor comp fell from a projected $520K to $410K in year two. Rollover equity underperformed the sponsor’s projection by roughly 40 percent. The seller admitted, in a candid reference call, that reading the MSA once was the single expensive mistake of the whole deal.
What the seller would change
Three items would have flipped this deal from regret to acceptable. A fee floor cap on MSA increases at 1 percent every 36 months. A written marketing scope with quarterly review triggers. And a hygiene retention clause on the seller’s original team through month 24. Every one of those adjustments was inside the market at signing, and the broker had proposed 2 of the 3. The seller waived them to close faster. That trade cost 40 percent of paper rollover value.
Profile five, the platform sale (Smile Design Dentistry)
The fifth profile is not a single practice but a platform. Smile Design Dentistry, founded in Dade City, Florida in 2004, grew to 50-plus offices across Central Florida and Tampa Bay by 2024. The platform operates cosmetic, emergency, preventive, and specialty care under one operational structure. When our team engaged with the group, the offline reputation was strong, but the digital marketing operation was fragmented across every location.
Campaigns were poorly segmented. Ad spend was inflated. Tracking was thin. Paid social was barely used. Our team restructured the PPC accounts by funnel stage and geography, built separate landing pages for each service line and market, and layered full-funnel paid social. Cost per call fell 30 percent across the network within 12 months. PPC conversion rate grew 20 percent year over year. Fifty-plus locations reported on a single dashboard for the first time, and campaigns rolled out to every office in the same week.
What platform-level dso in dental industry work teaches solo owners
The Smile Design story shows how a well-run platform delivers marketing scale that a solo practice cannot build alone. Fifty offices report to one dashboard. Central creative rolls out to every location the same week. Payer contracts negotiate under group buying power. That’s the value the DSO promises. When it works, EBITDA grows meaningfully in the 2 to 3 years post-affiliation, and the growth shows up in the next platform sale and the second bite for original sellers.
Single-office proof point
Platform scale is not the only way to win. North County Dental Care, a 20-year Vista, CA practice, replaced fragmented agencies with a secure, mobile-first website, advanced local SEO, GMB-driven PPC, and video. New patient volume grew 1,000 percent to 12 to 16 new patients monthly. Website traffic climbed 385 percent. Marketing ROI reached 500 percent. Single-office practices with disciplined marketing execution build the same underlying asset a platform buyer prices at the higher multiple.
Why marketing execution is the fault line
Most DSO integration failures we’ve seen come from marketing execution problems, not from clinical protocol disputes. When central marketing lands, the platform grows. When central marketing does not land, individual offices resent the loss of local vendors and the operational rhythm feels punitive. Ask any DSO in your bidder mix for specific examples of local marketing wins at 5 to 10 practices they affiliated in the last 24 months. Vague answers are a warning.
Second-bite outcomes across the 5 dental dso examples
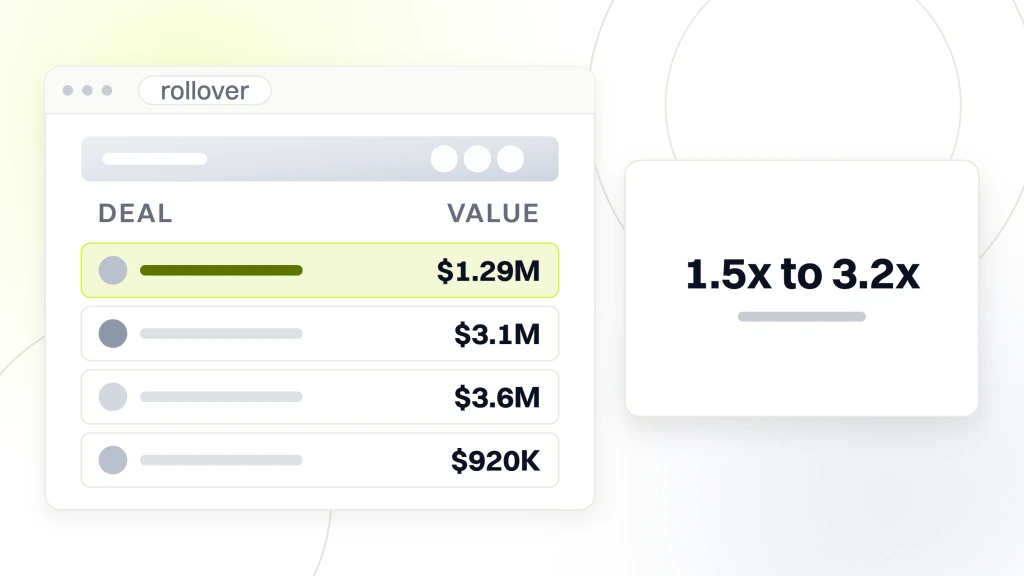
The second bite is the piece most sellers underestimate at LOI. Rollover equity looks like a paper number until the sponsor sells the platform to the next sponsor. When that happens, your rollover units get repriced at the new platform multiple. Second-bite outcomes across the 5 profiles above ranged from 1.5x to 3.2x return on rollover.
| Example | Rollover at close | Second-bite return | Value at exit |
|---|---|---|---|
| GP solo, Ohio | $1.29M | 2.4x | $3.1M |
| Ortho, Texas | $3.1M | 3.2x | $9.92M |
| Pediatric group, SE | $3.6M | 2.1x | $7.56M |
| Regretted GP, small metro | $920K | 1.5x | $1.38M |
| Platform-level sale | Varies | 2.6x avg | Varies |
What drives second-bite value up
Three drivers move second-bite value. Platform EBITDA growth over the hold period. Sponsor’s multiple expansion at exit. And your rollover slice at close. If the platform grows EBITDA 2x and multiple expands from 12x to 14x, your rollover appreciates roughly 2.3x. If EBITDA stays flat and multiple stays flat, the rollover returns 1x. If the platform contracts or delays exit, the rollover returns below 1x. Read the sponsor’s track record on prior platforms before you sign.
How to evaluate the sponsor behind a DSO
Ask three questions about the sponsor. What was the hold period on the last 2 dental platforms they exited? What was the multiple expansion between entry and exit on those platforms? And what percentage of rolled sellers on those prior platforms received returns above 2x on rollover? If the sponsor can’t answer clearly, treat that as a warning. Reputable sponsors track this data and share it in diligence conversations with sellers.
One thing every profile shares in year one
Every seller in every profile above described year one the same way. The first 30 days ran quiet. Month two through six ran noisy. Month 7 through 12 normalized. That pattern is universal enough that if you sign a DSO deal in 2026 and your first 30 days feel like a hurricane, something is unusually wrong with your specific integration. Reach out to your reference sellers and ask if they saw the same shape.
The other shared experience is the treatment coordinator script conversation. Every DSO sends someone to review your treatment coordinator script within the first 90 days. Every seller pushes back on the review at first. Every seller eventually admits the script the DSO handed over is better than the one the practice was using. This tiny interaction reveals more about how you’ll feel inside the DSO than any big-picture cultural question in the pitch deck.
Year one across every profile we’ve watched had one more shared feature. The seller under-estimated how much time the DSO would ask for outside clinical hours. Weekly regional ops calls, monthly platform updates, and quarterly all-hands add up to 4 to 6 hours a week that did not exist pre-affiliation. That time is not optional. Bake it into your schedule from day one so your clinical calendar does not slip.
How to use these dental dso examples in your diligence
Read every profile above as a benchmark, not a template. Every deal has unique tax structure, unique add-backs, unique fee schedule, and unique employment agreement terms tied to the sponsor and the specific practice profile. When you talk to reference sellers from that same platform, ask them these three questions.
- What surprised you in the first year post-close?
- What one thing would you negotiate differently if you did the deal again?
- How did the post-close first year compare to the pitch you got at LOI?
Where benchmark examples fail your practice
Benchmarks fail when your practice profile is unusual. If your patient mix skews 70 percent Medicaid, standard multiples do not apply. If your practice is heavily specialty-referred, standard employment terms do not fit. If your metro has fewer than 5 DSO-affiliated practices already, benchmark bidder counts overstate what your process will actually produce. Adjust your expectations before you go to market and you’ll avoid disappointment at LOI.
Broker versus self-directed process for a dso dental practice sale
A dental transaction broker earns 1.5 to 3 percent of transaction value and typically produces a half to a full turn of multiple growth through bidder competition. That fee usually pays for itself many times over on a $3M-plus transaction. On smaller transactions ($1.5M or under), the broker economics get tighter and some sellers self-direct. Self-directed processes take 6 to 9 months of the seller’s time. Broker-run processes close in 60 to 90 days.
Where to find more dso dental model examples in the public record
The public record on dental DSO transactions sits in three places. Group Dentistry Now at groupdentistrynow.com tracks platform-level transactions with enough detail to identify which sponsor bought which platform and at what implied multiple range. The ADA Health Policy Institute at ada.org/resources/research/health-policy-institute publishes annual industry data on ownership trends. Dental Economics at dentaleconomics.com runs regular DSO industry pieces with anonymized deal details.
Broker teaser materials
Every major dental transaction broker publishes anonymized deal summaries in their marketing materials. Those summaries read cleaner than the trade press stories and give you a specific sense of what deals close at in your practice profile. Request the summaries from 2 or 3 brokers before you engage one. The summaries help you calibrate what to expect from your own transaction and avoid the sticker shock or over-optimism that comes from reading only the trade press.
Direct conversations with reference sellers
The single most valuable insight is a 30-minute call with a dentist who signed the same platform 2 to 5 years ago. Ten of those calls give you a real map of what post-close life looks like at each of your final bidders. Every top DSO will hand over a reference list. Every seller you talk to will be honest, sometimes brutally so. Do the calls before you sign, not after.
Working with a marketing partner across a dso dental practice sale
A marketing partner earns their fee at the LOI table. A practice with 18 months of documented month-over-month new patient growth prices half a turn higher than a comparable practice without those numbers. On a $2M collections practice, that’s $300K to $600K in additional sale price at close. The math is the same whether you’re looking at any of the profiles above or your own practice.
Our team runs both sides of that work. For platforms already scaling patient acquisition across a network, our DSO Dental Marketing for Multi-Location Groups covers the whole process. For single-location owners preparing for a DSO conversation, our Dental Marketing Agency pages walk through the acquisition math practice by practice, and the Dental Marketing Retainer starts at $1,499 a month. Related reads include the dso dental model breakdown, the dso dental companies buyer map, and the largest dso dental ranking.
Pre-sale marketing checklist
Install call tracking on every marketing channel. Segment new patient reporting by source. Get 18 months of month-over-month growth documented. Clean up your fee schedule and drop legacy PPO contracts under 45 percent write-off. Move to a modern PMS so due diligence data pulls in a week, not six. Get a quality of earnings from a dental-focused accountant 6 months before you go to market. Each of these items grows multiple by a quarter to a half turn.
Marketing behavior during diligence
Do not cut marketing spend during diligence. Buyers pull historical patient acquisition data and forecast the next 12 months against it. A dip in the last 2 months signals falling demand and gets punished in escrow. Keep marketing running normally through close, and let the buyer see the acquisition machine at its full pace. That decision protects the multiple you negotiated at LOI.
A final read on the 5 dental dso examples above
Every deal shape is different. Every practice has unique economics. Every DSO runs slightly different terms. The 5 profiles above cover the standard cases you’ll see in the market. Use them to calibrate expectations, not to lock in a specific price or structure for your own practice. Your deal will be its own.
Three things to do before your first buyer call
Get your last 3 years of financials clean. Install call tracking today if you haven’t already. Talk to 2 dentist friends who sold in the last 3 years and ask what they wish they had known. Those three items take one afternoon and produce more value than any pitch deck you’ll read from a DSO business development team.
If you’re watching the market but not selling
Even if you have no plans to sell, keep an eye on the current deals in your metro. Your neighbors are being called. Your associates hear about opportunities in dental school. Your specialists get recruited to specialty platforms. Understanding the market protects your practice from surprises and gives you sharper conversations with your team and your family about long-term ownership. That awareness costs nothing and pays off in unexpected ways.