
Dental DSO trends through 2028 point to five patterns every practice owner should track before signing an LOI. Sponsors that closed platforms in 2020 to 2022 are cycling them to new capital through recapitalizations. Pediatric and oral surgery platforms are pricing ahead of general dentistry groups. Doctor-partnership deals now sit at 40% of transactions across the mid-market. Central marketing tells a well-run platform from a weak one inside 12 months of close. Federal antitrust review is starting to shape closing timelines in a handful of concentrated metros.
This guide walks each trend with data from platforms our team either watched close or worked on directly across 2024 to mid-2026. Every pattern feeds a practical seller-side playbook for the next 3 to 5 years.
Sponsor consolidation is cycling the 2020 to 2022 platform vintage
Sponsor consolidation picked up sharply in 2025 and 2026. Platforms that closed under sponsor ownership in 2020 to 2022 are hitting their 5 to 7 year hold windows and cycling to new capital through recapitalizations. 12 major recapitalizations closed in mid-2026, up from 7 in 2024. The pace holds through 2028 as more 2020-2022 platforms reach their exit windows. Live 2026 deal counts confirm the pattern.
Recapitalizations produce a specific pattern in the seller market. Original selling dentists who took rollover equity in the first deal now realize their second-bite value. Those payouts often exceed the initial cash-at-close by 50 to 100% for sellers who stayed on and grew the practice through the hold. Second-bite math is what draws practice owners to partnership models over employed structures during the first transaction.
How second-bite math plays out
Take a solo GP practice closing at $1M EBITDA for a 6x multiple. Cash-at-close on 70% equity sold to the sponsor lands at $4.2M. The seller keeps 30% rollover equity worth $1.8M at close. Over a 5-year hold the sponsor grows platform EBITDA to $18M and sells at 10x. The seller’s 30% slice of the local practice (now at $1.5M EBITDA) participates in that exit at roughly $4.5M. Total realized value lands near $8.7M vs $6M for an all-cash exit at year zero. That gap explains why 40% of dental DSO deals in mid-2026 use partnership structures. Owners weighing the decision can start with our should-I-sell framework.
Which sponsors are most active
Sponsor activity concentrates in two tiers. Growth-stage sponsors ($2B to $10B funds) target mid-market platforms at $30M to $100M EBITDA. Mega-cap sponsors ($20B and up) target platform-scale groups above $100M EBITDA. Middle-market sponsors ($500M to $2B) still fund initial platform builds at the 20 to 50 office scale where doctor-partnership pricing sits. Sponsor tier predicts management fee structure, growth capital availability, and exit timing. Our DSO Dental Marketing for Multi-Location Groups program helps sellers evaluate platform fit before the LOI stage.
Pediatric and oral surgery platforms are pricing ahead of general dentistry
Specialty platform activity accelerated across every dental DSO trends conversation in 2026. Pediatric platforms closed 30-plus transactions in mid-2026, up from 15 to 20 in 2024. Oral surgery entered as a distinct platform category with 4 active platforms and 2 to 3 new entrants expected through 2028. Orthodontics stayed steady on deal count but multiples held above general dentistry. Endodontics and periodontics saw targeted activity from a small number of specialty-focused platforms.
Specialty multiples price 1 to 2 turns above general dentistry on the same EBITDA. A pediatric practice at $2M EBITDA typically clears 9x to 11x. A GP practice at the same $2M EBITDA typically clears 7x to 9x. The gap reflects clinical scarcity, referral network defensibility, and payer mix strength. Specialty sellers should model against specialty benchmarks, not GP benchmarks, and prep advisor benches with specialty-experienced M&A attorneys.
Why pediatric leads on multiples
Pediatric dentistry sits at the top of the specialty multiple table for three reasons. First, pediatric practice supply is tight. Residency slots produce only a few hundred new specialists per year across the country. Second, pediatric offices have strong recall economics with predictable 6-month recall cycles that anchor patient lifetime value inside the model. Third, pediatric offices carry high private-pay and quality PPO mix in most markets, which protects margin better than adult GP practices exposed to Medicaid-heavy payer mixes. Platforms compete hard for pediatric supply and that competition supports the multiple premium.
Why oral surgery is entering now
Oral surgery entered as a distinct DSO platform category between 2022 and 2025 as sponsors saw the operational sophistication gap in solo oral surgery practices. Implant volume, IV sedation revenue, and referral network economics match the pediatric model on multiple expansion potential. Sellers in oral surgery should expect 2 to 3 new platform entrants through 2028 and target their bidder table on platforms with real oral surgery operating experience, not GP platforms adding specialty side arms.
Doctor-partnership models keep taking share
Doctor-partnership deals grew from roughly 25% of dental DSO transactions in 2022 to roughly 40% in mid-2026. Sellers weight clinical autonomy and continued engagement more highly than pure cash-at-close employment structures. The partnership structure keeps the treating dentist economically motivated during the sponsor hold and produces stronger EBITDA growth per office over the 5 to 7 year cycle.
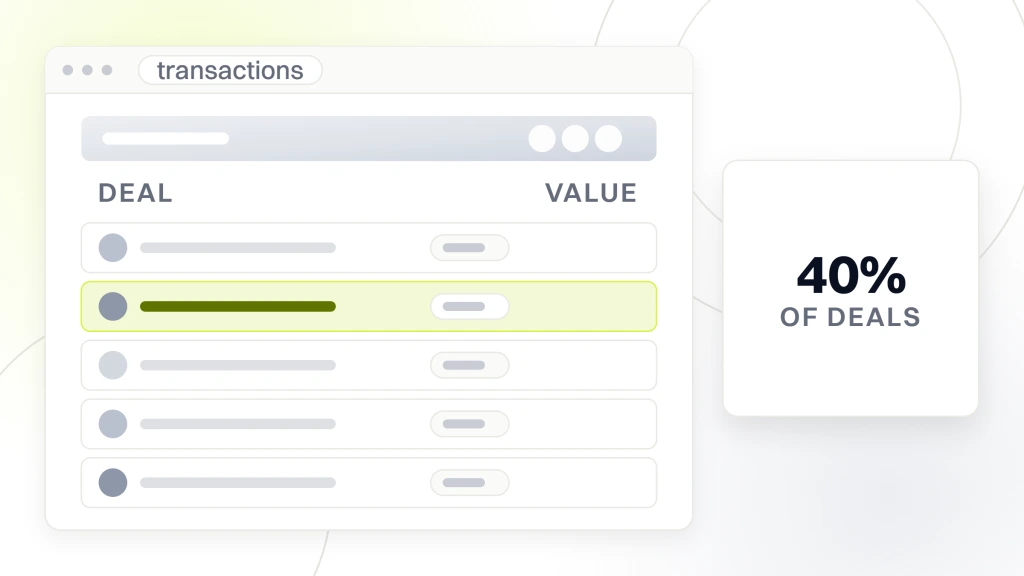
Partnership platforms give the seller a local ownership slice. Central takes the majority. The doctor keeps direct upside on local practice performance. That upside motivates continued engagement in a way employed compensation formulas rarely match. Well-run partnership platforms deliver 5 to 10% stronger EBITDA growth per office than fully employed models across comparable specialty segments and regions.
Partnership market share by specialty
Partnership market share growth accelerated across every dental specialty segment. Pediatric partnership share reached 55% of pediatric transactions in mid-2026. Ortho partnership share reached 45%. GP partnership share reached 35%. The pattern reflects seller preference for engagement over pure cash exits, especially for sellers 5 to 10 years from retirement who want continued clinical involvement alongside the transaction economics. Sellers within 3 years of retirement still prefer employed structures. The ramp-down suits the employed compensation formula better than partnership engagement expectations.
Partnership economics vs employed
Partnership economics run 5 to 10% stronger EBITDA growth per office over the sponsor hold. Comp formulas typically run a collections percentage rather than salary-plus-bonus, which aligns the doctor’s incentives with volume growth directly. Partnership models produce lower doctor turnover too. Well-run partnership platforms report 5% annual turnover. Employed-only platforms report 15 to 20%. Turnover matters at recapitalization since buyer QoE teams model doctor retention risk into the multiple.
Partnership vesting mechanics
Partnership vesting runs 5 to 7 years with straight-line or cliff vesting on the doctor’s local ownership slice. Straight-line vesting divides the ownership equally across the employment term. Cliff vesting holds the whole slice unvested for the first two years, then vests the remainder over the balance. Cliff vesting punishes doctors who leave early. Straight-line vesting protects doctors who need flexibility. Well-negotiated partnership deals include double-trigger acceleration on the sponsor exit, which fully vests the ownership if the sponsor sells before the doctor’s employment term ends. Confirm this in writing at LOI, not at definitive documents.
Central marketing separates well-run platforms from the rest
Central marketing separates well-run platforms from underperformers as clearly as any single operational category inside the dental DSO stack. Well-run platforms deploy central attribution, per-office paid media, local brand protection, and monthly reporting cadence. Underperforming platforms centralize brand aggressively, report quarterly only, and run paid media with weak attribution capture. The gap between the two shows up in practice-level P&L data inside 12 to 18 months of any affiliation close. Sponsor exit valuations reflect this gap directly at recapitalization.
Attribution stack investment
Attribution stack investment separates real marketing sophistication from surface-level marketing spend capture. Well-run platforms deploy call tracking, form fill tracking, GA4 conversion event mapping, and a data warehouse layer inside 60 days of affiliation close. The full stack costs $3,000 to $8,000 per month at 20 to 50 office scale and pays back inside 6 months through better spend allocation across offices. Underperforming platforms skip parts of the stack or delay deployment beyond 6 months, which leaves the marketing team blind to practice-level performance across the network over the sponsor hold.
Per-office paid media structure
Per-office paid media structure with separate PPC accounts for each office beats consolidated single-account structures by 25 to 40% on cost per new patient across the network. Weekly optimization cadence keeps accounts responsive to changing performance patterns. Well-run platforms deploy per-office structure by default. Underperforming platforms consolidate paid media across offices to save on management overhead, which dilutes local relevance and produces weaker cost per new patient across the network. Sellers should verify per-office paid media structure during LOI diligence by asking to see actual account structure at target platforms. Our Dental PPC Management program shows what per-office structure looks like at solo practice scale.
Local brand protection commitment
Local brand protection commitment separates seller-friendly platforms from platforms that damage local reputation through aggressive central rebranding. Well-run platforms protect the local brand in writing at LOI with specific commitments around local practice name, local Google Business Profile ownership, and local domain preservation across the seller employment term. Central rebranding inside 60 days of close typically causes patient confusion and short-term new patient volume drops that hurt EBITDA growth during the sponsor hold. Rolled sellers pay attention to this pattern since it affects second-bite math directly through EBITDA growth compounding.
The five dental DSO trends at a glance
The table below summarizes the five main dental DSO trends with 2024 baseline, mid-2026 position, and directional outlook through 2028. Read the table with your specific practice profile in mind rather than treating any trend as universal. Not every trend applies to every practice tier or specialty segment equally. Focused reading against seller-specific context produces better strategy than generic trend interpretation.
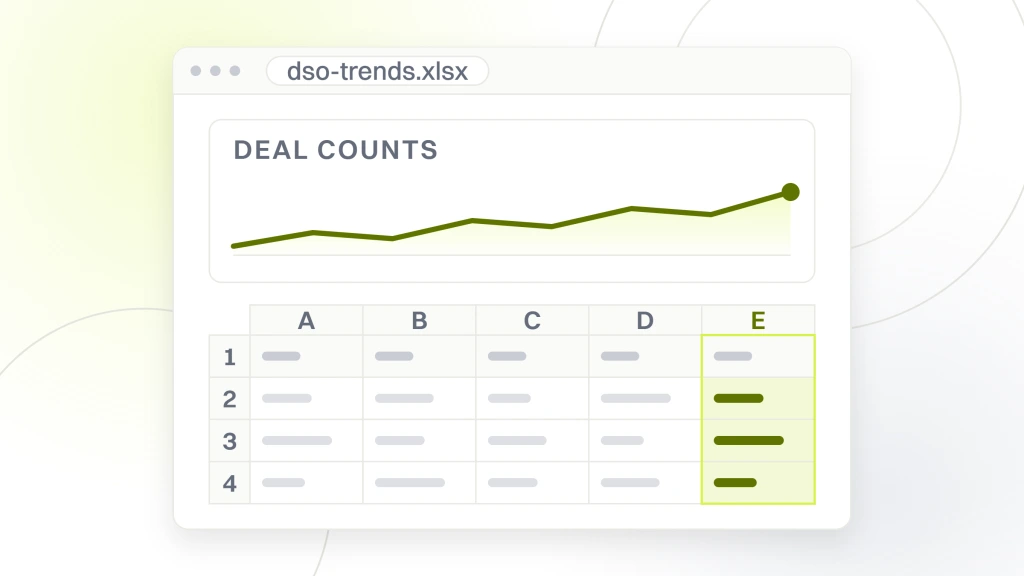
| Trend | 2024 baseline | Mid-2026 position | Through 2028 outlook |
|---|---|---|---|
| Sponsor recapitalizations | 7 major deals | 12 major deals | Sustained pace |
| Pediatric platforms | 15-20 deals per year | 30-plus deals per year | Continued acceleration |
| Oral surgery entry | 2 active platforms | 4 active platforms | 2-3 new entrants |
| Doctor-partnership share | 25% of deals | 40% of deals | 50% by 2028 |
| Central attribution | Partial deployment | Standard well-run | Table stakes |
| Regulatory review | Rare | Concentrated metros | Continued attention |
Read the doctor-partnership share row with seller preference context in mind. The trend toward partnership structures reflects a fundamental seller preference shift, not platform strategy alone. Sellers evaluating platforms should verify partnership structure availability at LOI. Employed-only platforms typically compete on cash-at-close percentage but lose the sellers who value engagement more than immediate cash.
Read the central attribution row as the operational floor by 2028, not a differentiator. Well-run platforms already treat central attribution as standard. By 2028 the floor rises to full attribution deployment inside 30 days of close, monthly reporting to office leadership, and demonstrated cost per new patient tightening inside 12 months. Marketing execution becomes table stakes.
Read the regulatory review row with metro concentration context in mind. Federal antitrust attention concentrates in metros where consolidation reached levels regulators flagged. Sellers in high-concentration metros should account for regulatory timing risk in transaction planning. Sellers in lower-concentration metros face lower risk. Local metro context matters more than a universal read on regulatory risk through 2028.
Regulatory attention shaping closing timelines
Regulatory activity through 2026 stayed quieter than 2023 and 2024, when several state licensing boards issued guidance on friendly PC nominee arrangements. The most active regulatory conversation in 2026 centered on antitrust review of large platform acquisitions in specific metros where consolidation reached levels that regulators flagged. Sellers evaluating platforms with heavy metro concentration should account for regulatory timing risk in their transaction planning. Antitrust review can add 60 to 120 days to closing timelines with uncertain outcomes on remedies.
Federal antitrust review
Federal antitrust review activity picked up in early 2026 as regulators flagged concentration levels in specific metros for review. The FTC opened a review of one platform’s acquisition of a large group in the same metro where that platform already held meaningful market share. The review resolved with a divestiture of two offices to a smaller competitor and did not block the transaction. Sellers should track antitrust news at WSJ deals coverage since platform buyer behavior in metros with regulatory attention changes noticeably during review windows.
State corporate practice rules
State corporate practice of dentistry rules held steady through 2026. No state loosened corporate practice rules meaningfully. No state added new restrictions that changed how existing platforms operate. Sellers evaluating platforms should confirm platform structure satisfies current state rules in every jurisdiction where the platform operates. Multi-state platforms with dozens of licensed dentists and PC nominee arrangements across states carry more compliance overhead than single-state platforms. Compliance overhead affects the management fee percentage the platform can sustain without eroding operating margin over the sponsor hold cycle. The ADA Health Policy Institute tracks state rules quarterly.
Payer contract rate movement
Payer contract rate movement in 2026 included rate resets across several major PPO networks. Some networks pushed rate reductions during their 2026 renewal cycle. Practices with strong local market share resisted. Practices without market pull accepted the reductions and saw margin compression. Platforms with 50-plus office scale in a metro negotiate PPO contracts on stronger footing than solo practices. Sellers should weigh this operational benefit when evaluating platform affiliation across a 5 to 7 year hold with meaningful payer mix exposure.
How Smile Design Dentistry answered the trend
Smile Design Dentistry runs 50-plus locations across Central Florida and Tampa Bay under a mature dental DSO structure. When our team engaged with the group, the digital marketing operation was fragmented across every office. Each location ran its own PPC accounts and landing pages without central coordination on messaging, budget allocation, or attribution. Roughly 30% of the marketing budget was captured by duplicate audience targeting and unoptimized landing flows.
Our team restructured PPC accounts by funnel stage and geography inside a central MSO marketing infrastructure. Dedicated landing pages went live for each core service line. Full-funnel paid social layered on top of the search program with audience data flowing from a unified attribution stack. Cost per call fell 30% across the network inside 12 months. PPC conversion rate rose 20% year over year. 50-plus offices reported on one unified dashboard for the first time with practice-level drill-downs available to office managers on demand.
What Smile Design shows about central execution
The Smile Design numbers show what central marketing sophistication looks like at platform scale. Cost per call drop of 30%. PPC conversion rate gain of 20%. Unified reporting across 50-plus offices. Our Dental SEO Services team runs comparable central-domain plus per-office SEO work at platform scale for groups responding to current dental DSO trends.
VP Dental and North County Dental Care prove the same pattern at smaller scale
The same central marketing discipline shows at practice scale before a platform enters the picture. VP Dental, a 20-plus year practice led by Dr. Valerie Preston, unified fragmented web and SEO under one integrated strategy. New monthly patients doubled (+100%). Recurring revenue grew $8,100 per month. Google Maps search impressions rose 776%. North County Dental Care in Vista, CA replaced fragmented agencies with a single mobile-first site, advanced local SEO, and GMB-driven PPC. Patient volume grew 1,000% from 2021 to 2024. Organic traffic grew 385%. Marketing ROI reached 500%. Practices with this discipline in place walk into LOI with cleaner attribution data and stronger negotiating posture than practices that hand a platform a fragmented setup to clean up post-close.
How sellers should respond over 12 months
Sellers should respond with 12 months of consistent preparation instead of trying to time the market. Clean books during quarter one. Attribution during quarter two. Referral formalization during quarter three. Buyer shortlist during quarter four. Preparation lets sellers act on favorable trends inside 30 to 60 days of a market signal.
Quarter one book cleaning
Quarter one book cleaning covers P&L cleanup, normalized owner compensation to market rate, documented add-backs with supporting evidence, and fair market rent on any owner-held real estate. Buyer QoE teams reject informal add-backs during diligence, which compresses the multiple by discounting the reported EBITDA number. Formal documentation during the preparation window means the QoE team accepts more add-backs at full value. That protects the EBITDA number and holds the multiple at the top of the range through recapitalization exit conversations later.
Quarter two attribution installation
Quarter two attribution installation covers call tracking on every channel, form fill logging, referral partner source tracking, and monthly reporting cadence. Buyers pay premium multiples for practices with 24 months of clean attribution data since they can model the acquisition economics into the platform playbook. Practices without attribution get discounted since the buyer models a marketing risk premium into the multiple. 12 months of clean attribution holds the multiple at the top of the range through diligence review. Our Dental Marketing Retainer at $1,499 per month covers attribution across the preparation window and continues after the deal closes if the seller keeps the practice under an employed or partnership structure.
Quarter three referral formalization
Quarter three referral formalization documents referring partner networks, formalizes referral tracking, and produces quarterly reports to top referring partners about the patients they sent. Sellers who complete this work earn a quarter to half turn premium on the multiple since buyers value formal referral networks. Specialty practices (pediatric, ortho, oral surgery) benefit especially from formal referral network documentation since their case volume depends heavily on referring provider relationships across the metro. Referral formalization work typically takes 60 to 90 days of front office effort with the results visible in improved referral tracking data by month three.
Preparation beats market timing
Preparation over timing is the core principle here. Owners who complete 12 months of preparation stay ready to launch a formal process inside 30 to 60 days of a favorable signal. Owners waiting for perfect timing usually miss favorable windows since the market has already shifted by the time headlines confirm it. Reasonable timing against a well-prepared practice beats optimal timing against rushed preparation across nearly every seller experience.
Ready-state posture value
Ready-state posture value from completed preparation exceeds the timing premium sellers try to capture through market speculation. A prepared practice launched during moderately favorable conditions typically closes at the top of the multiple range through stronger negotiation posture. An unprepared practice launched during peak conditions typically closes at the low end of the range since buyer QoE surprises compress the multiple. The math favors preparation heavily.
Working with specialist advisors
Specialist advisors during the preparation runway build the transaction sophistication needed to execute on favorable dental DSO trends when they appear. M&A attorneys with dozens of DSO transactions handle definitive document negotiation better than generalists. QoE providers with DSO experience anticipate buyer QoE team behavior. Wealth management pros with rollover experience model second-bite math accurately. Sellers who build this advisor bench during the preparation window typically execute cleaner transactions than sellers who assemble the bench reactively during the formal process.
Where to track the market month over month
A short rotation of industry sources produces the market context sellers need across the 12 to 18 month preparation window. Reading two to three primary sources monthly builds diligence sophistication over time. Reading occasional secondary sources fills specific gaps on specialty segments or geographic markets. The combined coverage gives sellers a complete picture of the trends shaping transaction planning across the coming 3 to 5 year horizon.
Group Dentistry Now coverage
Group Dentistry Now at groupdentistrynow.com publishes weekly coverage of platform announcements, sponsor changes, and multiple movement data. Their coverage runs deeper than industry-wide business publications since they cover exclusively the dental DSO and group practice segment. Their quarterly compensation formula benchmarks help sellers benchmark offers against the market rather than negotiating in isolation without reference points.
Dentaltown industry forums
Dentaltown at dentaltown.com hosts industry forums where practicing dentists share direct experience with specific platforms. Sellers evaluating a platform can search Dentaltown for prior seller commentary on that platform to gather qualitative context that supplements the formal reference call process. Candid post-close views on operational and cultural fit rarely surface during LOI conversations with platform business development teams.
ADA and state association updates
ADA and state association updates cover regulatory shifts, corporate practice rule changes, and antitrust review activity affecting dental DSO structures at the state and federal level. Sellers should subscribe to state association alerts as the primary source of state-level regulatory news. The ADA Health Policy Institute publishes quarterly corporate practice rule tracking covering all 50 states in one document.
The read through 2028 for dental DSO trends
The read on dental DSO trends through 2028 favors prepared sellers across every specialty segment and practice tier. Sponsor consolidation continues at sustained pace with the 2020 to 2022 vintage cycling through recapitalizations. Specialty platform activity keeps accelerating in pediatric and oral surgery. Doctor-partnership models reach 50% share of transactions by 2028 based on current preference patterns. Central marketing sophistication becomes table stakes for competitive platforms. Regulatory attention concentrates in specific metros with high consolidation.
Sellers who put in 12 months of preparation across financial hygiene, marketing attribution, referral formalization, and buyer shortlist development typically close clean transactions at favorable multiples during the 2026 to 2028 window. Sellers reacting to dental DSO trends without preparation typically lose value across every dimension the buyer team scores at LOI negotiation and diligence review. Preparation compounds across every subsequent decision the seller makes during the transaction cycle.