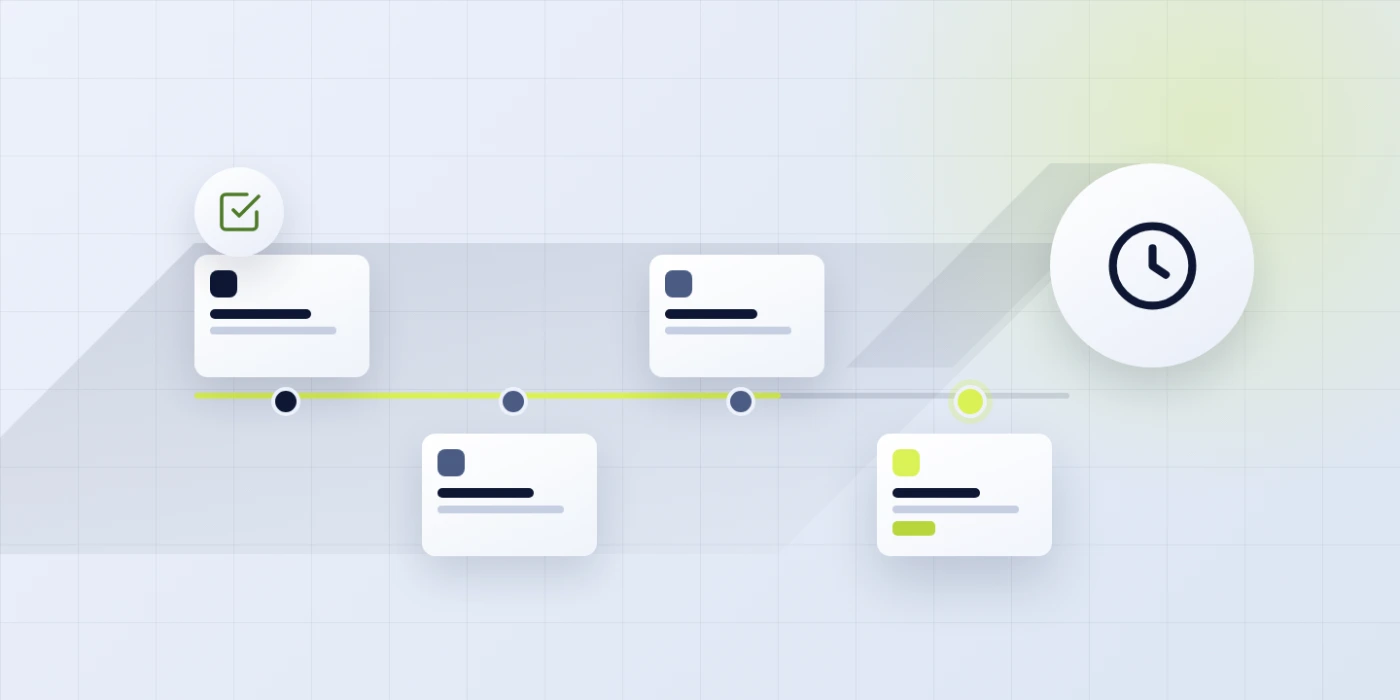
A Shopify Plus store with 4,800 SKUs opened Search Console on a Monday to a 38% traffic drop and spent 6 weeks blaming the wrong parties. The developer got the first email. The theme partner got the second. The prior agency got the third. Only in week 7 did the audit surface what actually broke the site. A Friday feed rewrite had wiped canonical tags across 1,200 collection URLs, a parallel schema migration had dropped Product markup on 62% of SKUs, and a bulk description edit had stripped the original prose off every product page in the same sprint. Ecommerce SEO services exist so 3 quiet moving parts on a store don’t undo 2 years of ranking work in a single deploy. Founders pairing this with our ecommerce seo audit checklist land on a tighter priority stack in half the time.
This guide covers the ecommerce SEO services stack Redefine Web runs for DTC brands, from 6-figure Shopify catalogs up through 9-figure Shopify Plus and headless builds. 5 working buckets carry the retainer. Product feed health. Category architecture. Product page copy. Technical foundation. Off-site authority. Each bucket ties to a revenue number the founder can name. You get the full playbook, the honest retainer math, the ranking-killer mistakes we see most often, and the 90-day rhythm we run inside our ecommerce marketing agency engagements.
Category Page Architecture That Ranks on Head Terms
Category pages carry most of the head-term rankings on any store site. A product page ranks for a long tail like Ambit walnut floor lamp warm brass. A category page ranks for the head term walnut floor lamps, which draws 15 to 40 times the search volume depending on vertical. Any retainer that skips category architecture leaves the biggest ranking prize on the table, no matter how strong the product-level work looks.
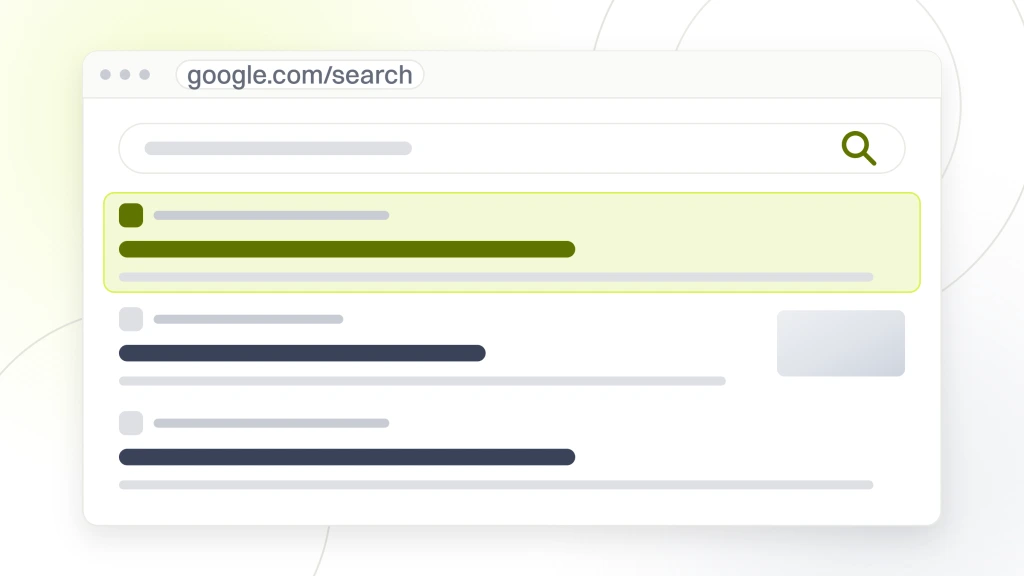
A ranking category page carries 4 assets most default Shopify or WooCommerce templates skip. A 300 to 600 word intro paragraph above the fold that explains what the category is and what shoppers use it for. A curated sort order controlled by the merchandising team rather than raw sales velocity. A related-category linking block that passes internal link equity to sibling categories. A 500 to 900 word bottom-of-page section covering buying guides, size charts, or care instructions that supports E-E-A-T signals without pushing product below the fold.
Most default store templates carry none of these. So the first job on a store older than 6 months is a category-page rebuild across the top 20 to 40 category URLs by search volume. This work runs 40 to 80 hours in the first 90 days and moves head-term rankings up 25 to 60% on the pages we touch. For the deeper walk-through of category structure, see e-commerce category page SEO best practices.
Faceted Navigation and Canonical Discipline
Faceted navigation, the filter system on a category page for size, color, brand, and price, generates thousands of URL variants per category. Left unmanaged, a store with 40 categories and 6 filters per category creates 40,000 to 200,000 crawlable URLs Google has to sort through. Crawl budget gets burned on parametered duplicates. Real category and product pages get indexed slower. A tight canonical policy that points every filter variant back to the parent category URL fixes this in a single deploy, and following Google’s canonicalization guidance keeps the rules defensible in future audits.
The rule we run. Filter combinations that produce genuinely useful landing pages (women’s black dresses, red running shoes size 10) get their own indexable URL with unique copy and canonical to self. All other filter permutations canonical to the parent category. Meta robots noindex on filter URLs is a backup, not the primary control. Get the canonicals right at the platform layer and the noindex tag rarely fires.
Product Page Copy That Ranks and Converts on Store Sites
Product pages carry the long-tail traffic that closes purchases. A single product URL rarely draws more than 100 to 500 searches a month, but a catalog of 3,000 well-optimized products drawing an average of 150 monthly searches each carries 450,000 monthly organic sessions at full ranking. That’s the math we chase across every DTC catalog we run.
A ranking product page carries 6 things. A title tag with product name, primary attribute, and brand in the first 60 characters. A meta description that reads as a buying reason, not a spec sheet. A 150 to 400 word original description above the fold, never a manufacturer copy paste. A specifications table with attribute rows Google can pull into rich results. A review block with real customer content and Review schema. A related-products block that passes link equity to the rest of the catalog.
Handling Duplicate Product Descriptions From Suppliers
DTC brands that sell wholesale-sourced product face the same problem 40 other stores do. The supplier ships every retailer the same product description and spec sheet. Google sees the duplicate content across 40 URLs and picks one to rank, rarely the smaller store. The rewrite math on wholesale catalogs is straightforward. 3,000 SKUs at 15 minutes per rewrite for a trained copywriter is 750 hours. At a $65 per hour blended rate, that’s $48,750 to solve the duplicate content problem across the full catalog.
Most stores can’t stomach that number in a single quarter. So we run rewrites in priority order. Top 300 SKUs by revenue first (usually 40 to 60% of category revenue), then top 300 by search volume, then everything else on a rolling 18-month schedule. This is the honest math no lightweight SEO vendor prints on a rate card. For a step-by-step checklist that pairs with this priority stack, see our ecommerce seo checklist.
Technical Foundation Under a DTC Storefront
Technical SEO on a store is 3 audits stacked. Crawl and index health. Site speed. Structured data. Skip any one of the 3 and 30 to 50% of the ranking gain from category and product work never lands. Google won’t reward a page it can’t crawl fast, render fully, and parse cleanly.
The crawl-and-index audit runs quarterly on any store above 500 SKUs. We pull the Search Console coverage report, cross-check against a full Screaming Frog crawl at 10 URLs per second, and reconcile the delta. Discovered-not-indexed pages get a priority stack. Crawled-not-indexed pages get a duplicate-content check. Excluded-by-canonical URLs get verified against the intent of the canonical rule. A single quarterly audit surfaces 20 to 200 correctable index errors on most stores.
Store-wide technical audits run every 90 days, never quarterly by calendar. A missed sprint on a catalog above 2,000 SKUs costs 3 to 8% of organic revenue before the next check.
Robots.txt and XML Sitemap Discipline
Robots.txt on a store gets touched 3 or 4 times a year, and every touch carries risk. A single Disallow: / line pushed in a staging config migration takes a store off the index in 4 to 10 days. Every engagement locks robots.txt behind version control and a review gate. No developer edits it without the SEO lead signing off. This one policy has saved 4 clients from full deindex incidents in the past 18 months.
XML sitemaps get split by URL type on any store above 10,000 URLs. Products, categories, blog posts, and static pages each get their own sitemap file, linked from a sitemap index. This lets Search Console flag exactly which URL type has coverage problems. A monolithic 200,000-URL sitemap tells us nothing when errors surface. 4 clean sitemaps tell us the products file has a 12% error rate we can fix in 3 hours.
Schema Markup That Wins Rich Results for Stores
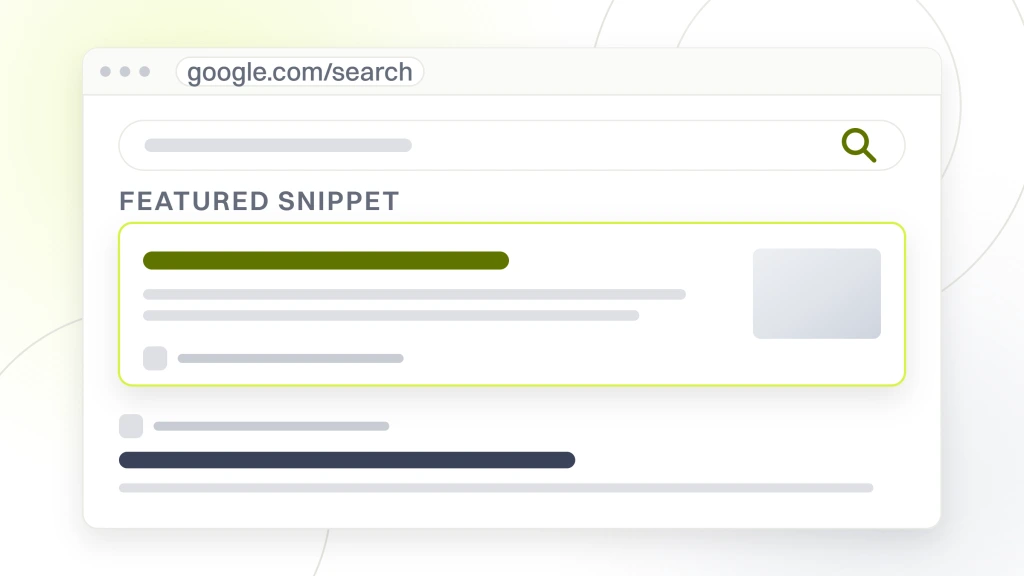
Structured data on a DTC store is worth 15 to 40% higher click-through rates on the SERP result. Product schema pulls price, availability, and star rating into the blue link. Review schema pulls the aggregate rating. BreadcrumbList replaces the URL string. Organization schema on the homepage anchors brand knowledge panel eligibility. These 4 schema types are the working list for any store engagement. Skip any and the CTR gain shows up as a gap on the quarterly report.
Schema deployment on Shopify runs through a theme edit or a schema app. On WooCommerce it runs through Yoast, Rank Math, or a custom snippet. On headless it runs through the front-end framework build. Each platform has 1 or 2 gotchas that break markup on 5 to 20% of URLs if the deploy skips a QA pass. The fix is always the same. Push to staging, validate every schema type against Google’s Rich Results Test, then push live to production.
Review Schema Without Faking It
Google’s guidance on review schema tightened in 2023. Self-serving reviews, meaning reviews the brand collected and displayed without third-party validation, no longer earn rich results. That closed a loophole a lot of stores rode. The clean fix is a review integration with Yotpo, Judge.me, Trustpilot, or Reviews.io that syndicates verified customer reviews back to product pages. Deploy the integration, wait 30 to 60 days for reviews to accumulate, and star ratings start appearing on the SERP again.
Site Speed and Core Web Vitals for Growing Stores
Google’s Core Web Vitals rolled into ranking in 2021 and hardened in 2023. A store that fails Largest Contentful Paint or Interaction to Next Paint on 30% of URLs loses 5 to 15% of organic ranking share to faster competitors. On Shopify, the biggest speed killer is app sprawl. On WooCommerce, it’s plugin sprawl. On headless, it’s third-party script pileup on the checkout page.
The measurement stack we run pulls field data from Chrome UX Report and lab data from PageSpeed Insights on a 30-day cycle. Field data is what Google actually uses for ranking. Lab data is what tells us which specific asset or script is causing the failure. Both are needed. A store that only watches lab scores misses the real-world experience Google measures.
App Sprawl on Shopify Stores
A typical Shopify Plus store above $10M in revenue runs 30 to 60 installed apps. Every app injects JavaScript, CSS, and often a third-party pixel. By the time the store hits app number 40, the LCP score on mobile has usually degraded 400 to 800ms. The fix is a quarterly app audit that maps every installed app to a revenue or operational function, and uninstalls anything without a clear owner. This audit typically removes 8 to 15 apps per quarter on a store that’s been operating for 2 years.
Content Strategy That Feeds Ecommerce Rankings
Blog content on a DTC store is not a nice-to-have. It’s the top-of-funnel traffic engine that feeds category and product pages. The math. A store with 40 category pages and 3,000 product pages ranks for 20,000 to 60,000 keywords at full optimization. The same store with 200 blog posts on buying guides, comparison pieces, and how-to content adds another 40,000 to 120,000 keywords, most of which link internally to category and product pages.
The content types that pull weight on a DTC catalog are 5. Buying guides that rank for research keywords. Comparison posts that rank for versus queries. Sizing and fit guides that rank for product-specific problems. Care and maintenance guides that rank for post-purchase queries. Lifestyle pieces that rank for aspirational search. Each type serves a different funnel stage. A content plan that skips any one leaves keyword coverage on the table.
Buying Guides That Rank and Convert
A ranking buying guide runs 2,500 to 4,500 words, covers 8 to 15 subheadings, includes 4 to 8 supporting images, and links internally to 3 to 6 category or product URLs. Anything shorter reads as thin content on Google’s E-E-A-T check. Anything longer starts losing readers before the internal links get clicked. The guide gets published once, refreshed every 12 to 18 months, and typically pulls 800 to 3,000 monthly sessions after 6 months of ranking.
The conversion path from a buying guide to a purchase is 3 hops. Reader lands on guide. Reader clicks internal link to a category page. Reader clicks a product tile and adds to cart. Attribution tools that only credit the last touch miss this journey. For the funnel-side view of how these hops map to revenue, see our ecommerce marketing definition and the pattern behind top-of-funnel search intent. Any store running Shopify with GA4 needs an assisted-conversion report pulled monthly to see the full contribution content makes. For pairing this content with a paid engine, see ecommerce PPC management for DTC brands.
Backlinks Worth Chasing for DTC Brands
Off-site authority for a DTC brand comes from 4 sources. Editorial mentions in trade press. Product roundups on lifestyle and category sites. Partnership pages with complementary brands. Podcast interviews with the founder. Every other backlink source is either paid, spammy, or low-value. Any retainer that chases directory listings, blog comment links, or PBN placements is spending hours on work Google discounts.
A DTC store above $5M in revenue needs 8 to 15 editorial backlinks per quarter to hold or grow authority against category competitors. Below 4 per quarter, rankings on head terms slip within 6 months.
The outreach math is straightforward. A trained outreach team pitches 60 to 120 relevant journalists and site owners per month. Response rate lands at 8 to 15%. Coverage conversion off responses is 30 to 50%. So a 100-pitch month typically yields 3 to 8 placed links. Anything above 8 is a strong month. Anything below 2 is a signal to review the pitch angles.
Product Roundups Without Paying to Play
Product roundups on lifestyle and category sites are the highest-converting backlink type for DTC. A Wirecutter, Bon Appétit, or GQ mention drives 200 to 2,000 direct clicks in the first week and a 15 to 40% category rankings gain over the next 90 days. Pay-to-play placements on affiliate networks have their place, but the ranking value is 60 to 80% lower than editorial coverage. The pitch angle that works is data. Send a journalist a first-party stat their audience hasn’t seen, not a product press release.
Measuring Real Revenue From Organic Search
Any SEO retainer on a store gets judged on organic revenue, not organic sessions. Sessions are a leading indicator. Revenue is the score. A store that adds 40% organic sessions but zero organic revenue has a product-fit or conversion-rate problem the SEO retainer can’t fix in isolation. So the first measurement job on any engagement is a clean baseline. Organic sessions, organic revenue, average order value, and conversion rate over the prior 90 to 180 days.
Baseline sets the target. A well-run retainer delivers 20 to 60% organic revenue growth in the first 12 months for stores above $2M in revenue. Stores below $2M often see 60 to 200% growth in the same window because the starting rankings are lower and the wins compound faster. Founders comparing agencies should ask for the growth curve on 3 clients at their revenue tier, not vanity numbers from a top-tier headline account.
The Five Metrics That Move Budget
The 5 metrics that SEO tools for ecommerce stores track on a monthly SEO report for stores. Organic revenue by category. Non-brand organic revenue split from branded. Top 10 ranking growth for head terms. Category page conversion rate. Product page click-through rate from category pages. Any report that leads with domain authority, keyword count, or backlink volume is telling a story that doesn’t match the founder’s P&L.
Comparing In-House and Agency Ecommerce SEO Services
An in-house SEO lead for a DTC store runs $85K to $140K in salary, plus $18K to $32K in benefits and tools. Total loaded cost lands at $103K to $172K per year, or $8,600 to $14,300 per month. That’s the like-for-like comparison against an agency retainer. Where in-house wins. Deep product knowledge, faster stakeholder alignment, and full-time context on the roadmap. Where agency wins. Broader pattern-matching across 20 to 60 stores, bench depth without a single-person bottleneck, and rate transparency that scales up or down by scope.
Most DTC brands run a hybrid. One in-house lead who owns roadmap and stakeholder relationships. One agency retainer that handles technical audits, content production, and outreach at scale. This model runs $12K to $22K per month all-in, delivers the pattern-matching benefit, and keeps a single accountable owner inside the company. Our SEO retainer tiers land at $999 / $1,499 / $2,499 / from $4,500 per month depending on scope, so a hybrid team can start at the entry tier and scale the retainer as the catalog grows.
A 90-Day Playbook for Growing DTC Stores
The first 30 days of any store engagement is discovery, audit, and quick wins. Week 1, kickoff and access. Week 2, full technical audit across crawl, index, speed, and schema. Week 3, category and product page inventory ranked by revenue potential. Week 4, quick-win deploys on the top 5 to 10 correctable issues found in the launch and hygiene audit. Founders who see zero traffic movement in the first 30 days should push for the audit deck, not more meetings.
Month Two and Three Execution
Months 2 and 3 shift from audit to execution. Category page rebuilds on the top 15 to 25 revenue categories. Product page copy rewrites on the top 100 to 300 SKUs. Technical fixes on any critical error the audit surfaced. Content production starts at 4 to 8 buying guides per month. First-round outreach opens at 40 to 80 pitches per month. By day 90, the store typically sees 8 to 20% organic session growth and 4 to 12% organic revenue growth. The compound math kicks in months 4 through 12. The bottom line for founders. 90 days is enough for signal. 12 months is when the retainer pays for itself.
Ecommerce SEO Services in Action: Boogie Board
Boogie Board came to Redefine Web as an established DTC brand with a stalled paid engine and a category site that was underperforming against category demand. The store was running $650K in managed budget and needed sharper attribution across organic and paid, plus category page rebuilds that carried the search intent behind the top revenue lines. We ran the same 5-bucket stack against the site over the engagement window. Category architecture rebuild first. Product page copy rewrites on the top revenue lines. Technical audit and canonical cleanup. Content plan on the top buying-guide queries. Editorial outreach for authority signals.
Boogie Board hit an 11% conversion rate, $31 cost per sale, and grew inside a $650K managed budget after we rebuilt category architecture and tightened product page copy against real search intent.
The result set on Boogie Board is the working case for the retainer math. 11% site conversion rate on the ecommerce funnel, $31 cost per sale on the paid engine, and $650K in managed budget growing at target ROAS. That’s the outcome curve a DTC store gets when category, product, and technical run in the same 90-day rhythm. Founders looking at the fuller ecommerce SEO strategies stack can see how these buckets tie into a 12-month retainer plan. Brands in apparel and accessories often layer this with dedicated fashion SEO services for apparel and accessories brands, and pet DTC stores lean on the pet industry SEO company playbook for vertical-specific angles.
Platform-Specific Notes for Shopify and WooCommerce Stores
Shopify and WooCommerce carry 80 to 90% of the DTC catalogs we run this stack against. Each platform has strengths and weak spots that shape the retainer plan. Shopify wins on speed, security, and app ecosystem depth. WooCommerce wins on customization ceiling, cost control below 500K annual revenue, and content management flexibility. The choice between them rarely drives the SEO outcome. Execution against the 5 buckets does. For the deeper comparison, see Shopify vs WooCommerce SEO.
Headless Storefronts and SEO
Headless commerce, meaning a store where the front-end is decoupled from the backend commerce engine, is where 8 to 15% of DTC stores above $10M in revenue land. The SEO complexity goes up. Server-side rendering has to be perfect on every product and category URL. Meta tags, canonicals, and structured data all get injected at build or render time. Any gap surfaces as a coverage error inside 30 days. The upside is speed. A well-built headless store beats Shopify Liquid on LCP by 400 to 900ms and holds Core Web Vitals green on 90% plus of URLs. Once the store is live, keeping this speed and coverage takes disciplined ecommerce website maintenance so a routine plugin or theme update doesn’t undo the SEO work.
How Ecommerce SEO Services Examples Look in the Wild
Founders often ask for real examples of ecommerce SEO services in action on stores like theirs. The pattern is 3 outcomes stacked in the first 6 months. Head-term category rankings up 25 to 60% on the top 20 to 40 category URLs. Long-tail product rankings up 40 to 90% on the top 300 to 600 SKUs by revenue. Content-driven top-of-funnel sessions up 3 to 5 times as the buying guides mature. That mix is what a working retainer produces on a mid-sized DTC store, and it’s why founders comparing agencies should ask for the 6-month curve, not a snapshot from month 12 on a headline account.
Where Ecommerce SEO Services Fit the DTC Marketing Stack
Ecommerce SEO services are 1 lane of a 3 or 4-lane DTC marketing stack. Paid search and paid social run the direct-response engine. Email and SMS run the retention loop. Organic search runs the compounding traffic and revenue base that lowers blended CAC over 12 to 36 months. A DTC brand that pours 100% of budget into paid channels sees CAC creep 8 to 20% year over year as auction pressure grows. A brand that carves out 15 to 25% of budget for SEO sees CAC hold or drop over the same window.
The right way to size the ecommerce SEO services investment is against your catalog size and revenue target. Catalogs under 500 SKUs at $2M to $8M in revenue land at our $999 to $1,499 tiers. Catalogs of 500 to 5,000 SKUs at $8M to $40M land at $2,499. Catalogs above 5,000 SKUs or above $40M in revenue start at from $4,500 per month depending on scope. Talk to the team about how the retainer stack maps to your 12-month revenue plan, and pair the walk-through with our ecommerce digital marketing strategy guide for the full-funnel view. If you’re shortlisting agencies, our roundup of top ecommerce marketing agencies and the dedicated ecommerce SEO services hub pull the comparison work into one place.